Article

A New Modeling Framework for Multi-Scale Simulation of Hydraulic Fracturing and Production from Unconventional Reservoirs

by
J. T. Birkholzer
1,*,
J. Morris
2,
J. R. Bargar
3,
F. Brondolo
3,
A. Cihan
1,
D. Crandall
4,
H. Deng
1,
W. Fan
3,
W. Fu
2,
P. Fu
2,
A. Hakala
5,
Y. Hao
2,
J. Huang
2,
A. D. Jew
3,
T. Kneafsey
1,
Z. Li
1,
C. Lopano
5,
J. Moore
4,
G. Moridis
1,
S. Nakagawa
1,
V. Noël
3,
M. Reagan
1,
C. S. Sherman
2,
R. Settgast
2,
C. Steefel
1,
M. Voltolini
1,
W. Xiong
5 and
J. Ciezobka
6
add Show full author list remove Hide full author list
1
Lawrence Berkeley National Laboratory, Berkeley, CA 94720, USA
2
Lawrence Livermore National Laboratory, Livermore, CA 94550, USA
3
SLAC National Accelerator Laboratory, Menlo Park, CA 94025, USA
4
National Energy Technology Laboratory, Morgantown, WV 26507, USA
5
National Energy Technology Laboratory, Pittsburgh, PA 10940, USA
6
Gas Technologies Institute (GTI), Des Plaines, IL 60018, USA
*
Author to whom correspondence should be addressed.
Energies 2021, 14(3), 641; https://doi.org/10.3390/en14030641
Submission received: 28 December 2020 / Revised: 19 January 2021 / Accepted: 21 January 2021 / Published: 27 January 2021

Abstract

:
This paper describes a new modeling framework for microscopic to reservoir-scale simulations of hydraulic fracturing and production. The approach builds upon a fusion of two existing high-performance simulators for reservoir-scale behavior: the GEOS code for hydromechanical evolution during stimulation and the TOUGH+ code for multi-phase flow during production. The reservoir-scale simulations are informed by experimental and modeling studies at the laboratory scale to incorporate important micro-scale mechanical processes and chemical reactions occurring within the fractures, the shale matrix, and at the fracture-fluid interfaces. These processes include, among others, changes in stimulated fracture permeability as a result of proppant behavior rearrangement or embedment, or mineral scale precipitation within pores and microfractures, at µm to cm scales. In our new modeling framework, such micro-scale testing and modeling provides upscaled hydromechanical parameters for the reservoir scale models. We are currently testing the new modeling framework using field data and core samples from the Hydraulic Fracturing Field Test (HFTS), a recent field-based joint research experiment with intense monitoring of hydraulic fracturing and shale production in the Wolfcamp Formation in the Permian Basin (USA). Below, we present our approach coupling the reservoir simulators GEOS and TOUGH+ informed by upscaled parameters from micro-scale experiments and modeling. We provide a brief overview of the HFTS and the available field data, and then discuss the ongoing application of our new workflow to the HFTS data set.

1. Introduction

Production of oil and gas from unconventional reservoirs largely depends upon two main features operating at different scales: (1) the reservoir-scale stimulated fracture network providing permeability and transport from the formation to the production wells, and (2) the coupled multi-phase flow, mechanical and chemical processes affecting the migration of hydrocarbons from the low-permeability shale into the fracture network. Together they represent a complex coupled system operating over a broad range of length scales.
The revolution in unconventional resource recovery is largely enabled by horizontal drilling and hydraulic stimulation; however, the impact of the operational choices to optimize the stimulated volume and maximize production (e.g., distance between adjacent wells, stages/well, perforations/stage, fluid rheology and pumping schedule) is not well understood today. Moreover, a steep decline in production within a relatively short time (compared to that for conventional reservoirs) following stimulation reflects, in part, the decreasing rate of hydrocarbon transport from the intact formation to the fractures. Processes leading to decrease in fracture aperture and loss of conductivity, such as proppant crushing, embedment and possible adverse chemical reactions within the reservoir, can also contribute to production decline. Decreasing efficiency is a primary motivation for drilling and stimulating additional wells, thus increasing the associated environmental footprint. Understanding how micro-scale processes (flow, geomechanics, geochemistry, etc.) control fluid flow in the fractures and the shale matrix is critical for predicting field-scale behavior, yet no modeling framework is available that incorporates these processes across all relevant scales. Such a framework would yield new insights into field-scale behavior and provide opportunities for model-driven scientific discovery to optimize hydrocarbon recovery from these complex shale systems.
The economics of resource exploitation and the minimization of associated environmental impacts will both benefit from increasing the efficiency of unconventional operations. Better predictive models for stimulation and production, capable of coupling various processes across multiple spatial and temporal scales, provide a path to achieving this goal. Historically, reservoir modeling tools have been limited to a subset of processes operating at a specific scale in order to reduce algorithmic complexity and increase computational performance. For example, fast-running models for hydraulic fracture design—such as ResFrac [1]—typically focus on flow and mechanics at larger scales in order to provide a rapid solution. Reservoir production models—such as Eclipse [2] or CMG-STARS/GEM [3]—solve for multiphase flow, with somewhat limited consideration of chemistry and mechanics, in order to achieve a timely solution. These approaches are suitable when engineering a system for which the upscaling of the fundamental processes is well understood; however, as we have already discussed, shale reservoirs involve couplings of poorly understood processes across a wide range of scales.
Here we describe a new integrated modeling framework for microscopic to reservoir-scale simulations of hydraulic fracturing and production, capable of representing, connecting, and quantifying the major types of reservoir responses (flow, geomechanics, and geochemistry) that extend spatially from the pore structure of the reservoir rock to the volume of the reservoir, and temporally from the initiation and propagation of hydraulically-induced fractures to hydrocarbon production (Figure 1). At the reservoir-scale, the framework is built upon integration of two existing high-performance simulators for reservoir-scale behavior: the GEOS code for hydromechanical evolution during stimulation [4] and the TOUGH+ code for multi-phase flow and chemical evolution during production [5]. At the micro-scale, we deploy sophisticated imaging and testing methods (e.g., [6,7,8]), combined with reactive transport simulations [9,10], to develop a fundamental understanding of the mechanical and chemical processes within the propped fractures and across the fracture-rock interfaces. Constitutive upscaling relationships built upon this fundamental understanding are then incorporated in the reservoir-scale simulators. This multi-scale integration allows to directly evaluate the impact of cluster spacing, fluid injection rate, proppant volume, fluid chemistry and other operational choices on the effectiveness of a hydraulic fracturing treatment and the potential for long-term production, while ensuring that micro-scale property changes are adequately accounted for.
The new workflow starts with hydraulic fracturing simulations. In contrast to earlier hydraulic fracturing predictions which were often based on empirical relationships or simplified models [11,12], the GEOS simulator used in this study is based on a rigorous numerical treatment of the hydraulic fracturing mechanics and deploys a fully coupled finite element/finite volume approach for fractures with arbitrary three-dimensional geometries [4]. Using GEOS, fracture growth and the associated seismicity are simulated in space and time and the resulting fracture geometries are handed over to the next step in the workflow. Simulation of hydrocarbon production is done with the TOUGH+ family of simulators for multi-phase flow of water, gas, and oil phases in fractured and unfractured rock [5]. Embedded in a high-performance computational framework, TOUGH+ has the option of discrete representation of major fractures in addition to the description of other fractures (induced or natural) embedded in the rock matrix as a multi-continuum domain using a double-porosity, dual permeability or Multiple Interactive Continua (MINC) approach. This approach (1) allows for explicit representation of all relevant hydraulic fractures provided by GEOS, while (2) capturing the detailed fracture-matrix flow and transport processes without the need to discretize the largely unknown individual fractures within the matrix blocks.
As mentioned above, the GEOS-TOUGH+ simulations incorporate the transient property changes induced by micro-scale mechanical and chemical processes that occur in individual fractures and near the fracture-shale interfaces. Several recent studies involving a variety of sophisticated imaging and testing methods have improved our fundamental understanding of such processes and have provided a basis for developing constitutive upscaling relationships that can be used in reservoir models. These include, for example, the permeability evolution of propped fractures in different types of shales over a range of stress conditions [13] or the fracture aperture changes and proppant embedment in shales exposed to different types of fracturing fluids [14,15]. Researchers also studied dissolution and precipitation reactions across the fracture-matrix interface [7,16,17,18,19,20,21,22] and demonstrated that properties of the shale matrix and fractures can be affected by both mineral precipitation arising from the injected fluids (fracture to rock) and chemical alterations to the shale itself (matrix to fracture). In ultra-low permeability rocks, especially those with > 20 wt.% clay, geochemical reactions can reduce overall permeability by more than 40% [23].
We are currently testing the integrated modeling framework using data and core samples from the Hydraulic Fracturing Field Test (HFTS), a recent field experiment with extensive monitoring of the hydraulic fracturing process and the associated shale oil and gas production in the Permian Basin [24,25,26]. In addition to a full set of geophysical and other observations (such as microseismic signals, tilt, downhole pressure variations, tracer transport, and production data) which can be used to test the GEOS-TOUGH+ reservoir-scale simulations, the HFTS project obtained core samples from a science observation well that was drilled through the stimulated volume after hydraulic fracturing. This core provided a rare opportunity to observe and evaluate the geometry and properties of hydraulic fractures, and to compare their characteristics with pre-existing natural fractures. We employ measurements using HFTS core samples to gain insight into the transient property changes induced by micro-scale mechanical and chemical processes that occur in individual fractures and in the vicinity of the fracture-shale interfaces.
Below we present an overview of the new modeling framework including the coupling scheme between GEOS and TOUGH+ (Section 2), followed by a short description of the HFTS Project (Section 3). We then describe the ongoing numerical and experimental application to HFTS: At the reservoir-scale (see Section 4), we apply the advanced fracture simulation tool GEOS to predict the fracture network evolution upon stimulation and the influence of geologic and engineering parameters. These simulations provide, in an automated workflow, the fracture geometries and properties for reservoir-scale production simulations using TOUGH+. Early laboratory and micro-scale simulation studies demonstrate how (1) micro-scale deformation and reaction-transport processes impact both the permeability within fractures and at the fracture-shale interface and (2) how these studies can provide upscaled flow and transport parameters for the reservoir-scale stimulation and production modeling (Section 5). The focus of this paper is on the modeling framework and workflow, and first results from the application to the HFTS project. Details on individual modeling or experimental elements will be presented in future publications.

2. High-Performance Modeling Framework with GEOS and TOUGH+

2.1. Geomechanical Simulator GEOS

GEOS was developed for high-performance simulations of complex subsurface processes involving fluid flow, mechanics and chemistry. Particular emphasis is placed on the algorithmic details that are necessary to adapt the fully coupled finite element/finite volume approach to model large-scale problems on massively parallel high-performance computing platforms. Applications of GEOS have included prediction of the performance of hydraulic fracturing strategies in shale formations [4] with forward modeling of geophysical variables for validation against field data (such as microseismic and distributed acoustic sensing, [27,28]). GEOS accommodates detailed descriptions of 3D features such as stress and modulus variability, along with a discrete, mechanically-coupled representation of numerous preexisting natural fractures. More recent development has extended GEOS to include coupled chemical processes [29], and the prediction of hydrocarbon production in fractured, unconventional reservoirs [30,31,32], although in this work we focus upon leveraging its ability to capture coupled flow and mechanics during stimulation.

2.2. Multi-Phase Multi-Component Simulator TOUGH+

The TOUGH+ reservoir simulator [5] accounts for multiphase fluid flow under pressure, viscous, and gravity forces according to Darcy’s law. It models all known processes involved in the non-isothermal, multi-component, three-phase flow of fluids and heat through porous and/or fractured geologic media. The OilGasBrine (OGB) module for TOUGH+ simulates conventional and/or unconventional (fractured tight- and shale-oil) reservoirs and accounts for heat and up to 13 mass components (H2O, oil, and a gas phase of up to 11 components) partitioned between organic (oil), gas, aqueous, and (if necessary) solid hydrate phases. TOUGH + OGB can describe all phase combinations of a H2O, oil, and non-condensing-gas-mixture system. It has a fully implicit, Newton-Raphson-based formulation that solves the Jacobian resulting from the mass and energy balance of all components involved in the system. The Jacobian-based approach, with strict mass and heat balance error criteria, can handle the phase changes, state transitions, strong nonlinearities, and steep solution surfaces found in unconventional reservoir simulations. The capabilities of TOUGH + OGB have been included in the pTOUGH+ framework [33] to allow large-scale parallel processing for simulations of large reservoirs with highly refined meshes.

2.3. Coupling Scheme between GEOS and TOUGH+

The workflow for coupled hydraulic fracturing and production simulations starts with GEOS modeling of the stimulation phase. GEOS accounts for the complex fracture networks that develop upon stimulation, including the effects of natural fractures and bedding, the impact of stress shadowing which describes the increase of stress in the direct vicinity of a stimulated fracture, and the influence of proppant mechanics and proppant transport. Before mapping the simulated fractures from the GEOS model to the TOUGH+ production simulations, the output from GEOS is carefully compared to available field data, including microseismic measurements or, in the case of the HFTS, the valuable information provided by the post-stimulation core well that was drilled through the stimulated volume.
In the second step, the fracture geometries and properties generated by GEOS are used to create a TOUGH + OGB reservoir model for the production simulations. The reservoir model incorporates the fractures, the near-fracture zones, and the surrounding shale reservoir and, depending on the purpose, may represent a single fracturing stage, multiple stages, multiple (adjacent) wells, or multiple wells with multiple stages. TOUGH + OGB explicitly models the fracture and fracture-matrix zone interactions with minimal upscaling of flow properties, and thus may require mesh elements down to the scale of millimeters to resolve the steep gradients present in an ultra-low-permeability fractured system. A fully automated process was developed for mapping from GEOS to TOUGH+, consisting of the steps listed below:
(1)
A meshing tool builds the TOUGH+ mesh representing the reservoir model and the selected well stage. The mesh incorporates major fractures explicitly and fills the space between fractures with continuum elements. Mesh design includes deciding which fractures will be explicitly represented in the TOUGH+ model (major stimulated and natural fractures) and which fractures can be represented by appropriate continuum representations (secondary and minor fractures) using a double porosity, dual permeability or a MINC matrix-fracture model.
(2)
For all stimulated major fractures, calculate the “propped aperture” with Equation (1), where b and φ are the aperture and the proppant volume fraction as simulated with GEOS, φ m a x is the maximum volume fraction in this hydraulic fracture, b c l o s e d is an empirical parameter that characterizes the closure aperture of the hydraulic fractures [34]. Use the cubic law (or other appropriate relationships) to calculate the permeability of all explicit fractures.
b p r o p = max ( φ b φ m a x , b c l o s e d )
(3)
For each fracture explicitly represented in the mesh, apply local grid refinement along the y-axis perpendicular to the fracture. The mesh elements are refined near the hydraulic fractures with a minimum y-resolution ( Δ y ) larger than the maximum propped aperture, max ( b p r o p ) . The refinement extends into the adjacent matrix to allow the resolution of steep gradients during production simulation.
(4)
Map the GEOS-derived propped aperture field of each explicit fracture to the corresponding fracture grid cells in the TOUGH+ mesh. This results in one layer of “fracture cells” sandwiched by the adjacent “matrix cells”. If GEOS and TOUGH+ use different mesh resolutions in x, z directions, 2D spatial interpolation is used to match the grid resolutions.
(5)
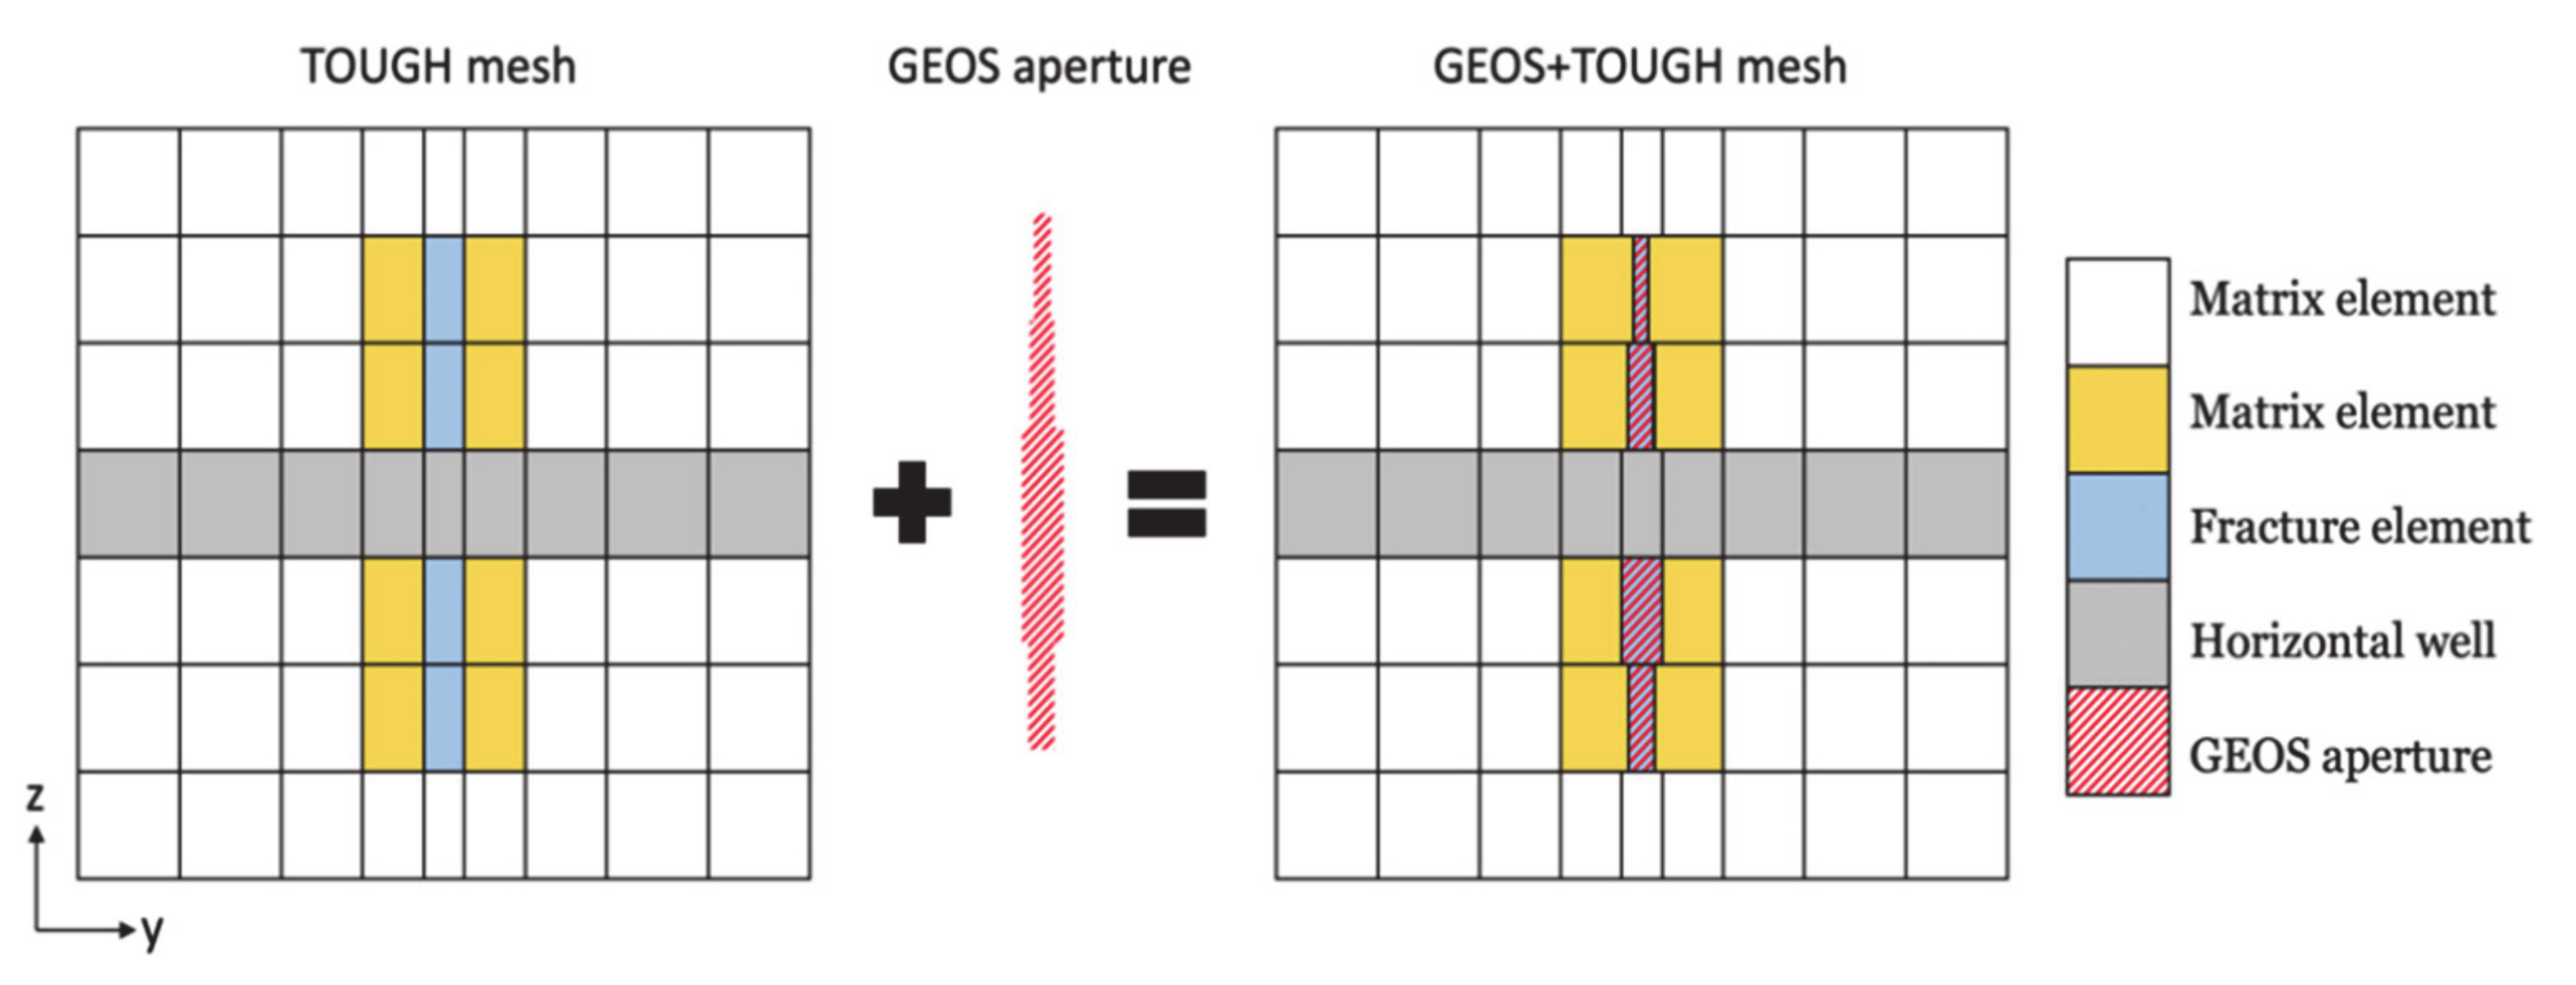
Reduce Δ y of the fracture cells to exactly match the propped aperture. Increase Δ y for adjacent matrix cells to fill up the volumes lost. We include the option of setting a lower bound for Δ y to remedy situations where an extremely small aperture may cause numerical convergence issues during flow simulation. We use Δ y m i n = max b p r o p / 8 in the present workflow. An example of the TOUGH+ mesh before and after coupling the GEOS aperture is shown in Figure 2.
(6)
As the pressures and stresses change in the course of production, the macro-scale properties of the matrix (porosity and permeability) are continuously adjusted using either the simplified of the full geomechanical capabilities built into TOUGH+ [5,35,36].
(7)
Property changes due to micro-scale processes with fractures and at the fracture-matrix interfaces are incorporated based on the imaging, testing, and modeling work described in Section 5. Specifically, impacts of proppant mechanics are accounted for with constitutive relationships, built on micro-scale imaging and meso-scale testing, that adjust the permeabilities of propped fractures as a function of simulated stress changes during production (Section 5.1). Similar adjustments are made to account for chemical reactions within fractures and at the fracture-matrix interfaces (fracture face) (Section 5.2).
(8)
We expect that this physics-based modeling framework for microscopic to reservoir-scale simulation of hydraulic fracturing and production should be capable of addressing the full range of reservoir response from propagation of fractures to hydrocarbon production, in a fully predictive sense. However, if the simulated production is not consistent with production measurements, the entire workflow starting with the GEOS stimulation model may be repeated.

3. Hydraulic Fracturing Field Test Site in the Permian Basin (USA)

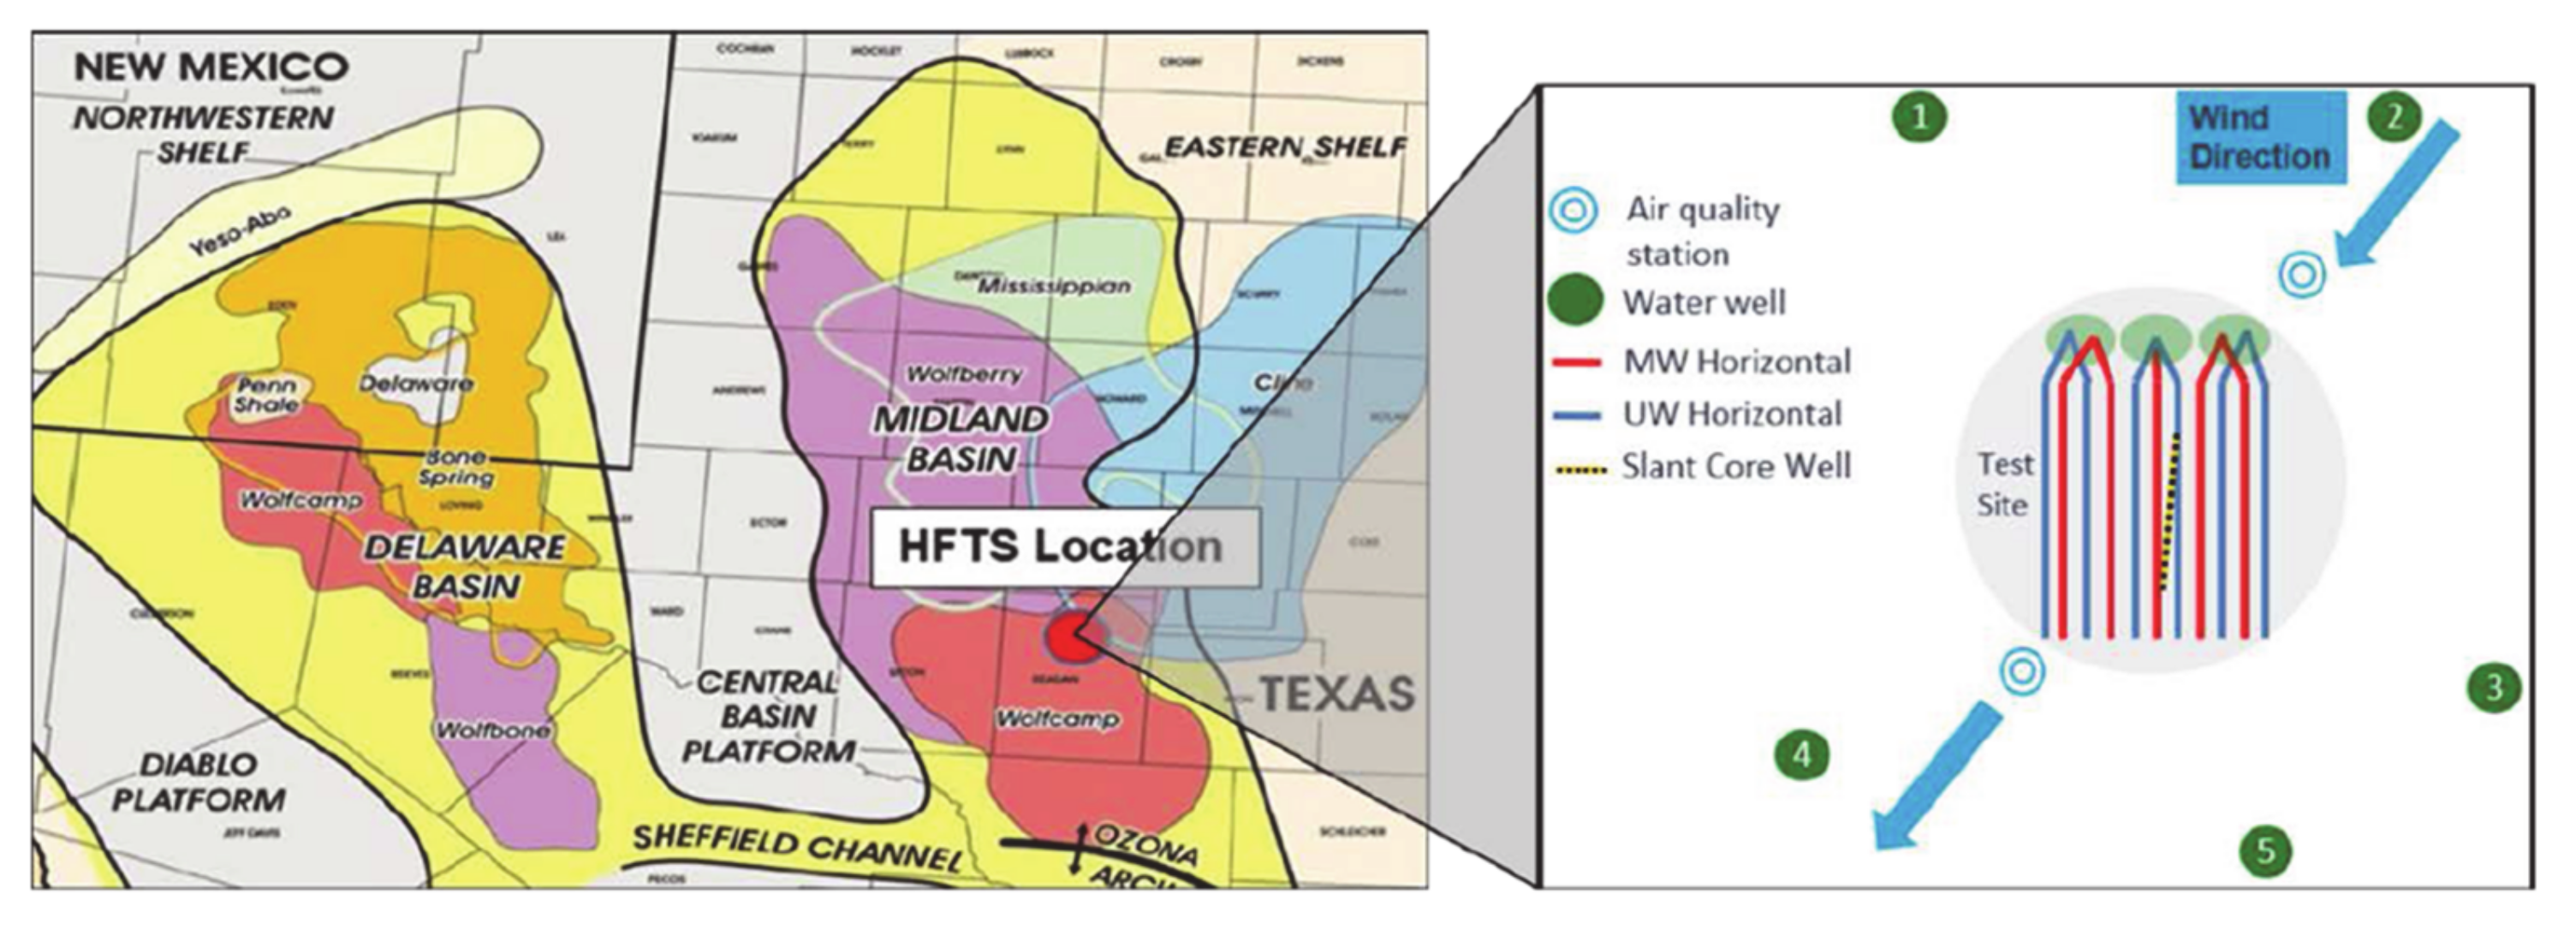
The HFTS project, fielded within the Wolfcamp Formation in the Permian Basin, provides an excellent opportunity to further develop our understanding of the hydromechanical response to hydraulic stimulation and associated fluid transport in shale lithologies. Supported by the U.S. Department of Energy and a consortium of industry sponsors, the experiment was designed to elucidate the intra- and inter-well stress interactions within a single horizon and also among vertically separated wells in different lithologic units, and their influence on hydrocarbon production [24,25,26,37]. The project involved the drilling of 11 horizontal wells within the Upper and Middle Wolfcamp Formation in the Midland basin of West Texas, at a site hosted by Laredo Petroleum, Inc. The wells were drilled approximately 200 m (660 feet) apart laterally and 137 m (450 feet) apart diagonally in what is often referred to as a “wine-rack” pattern (Figure 3) [38].
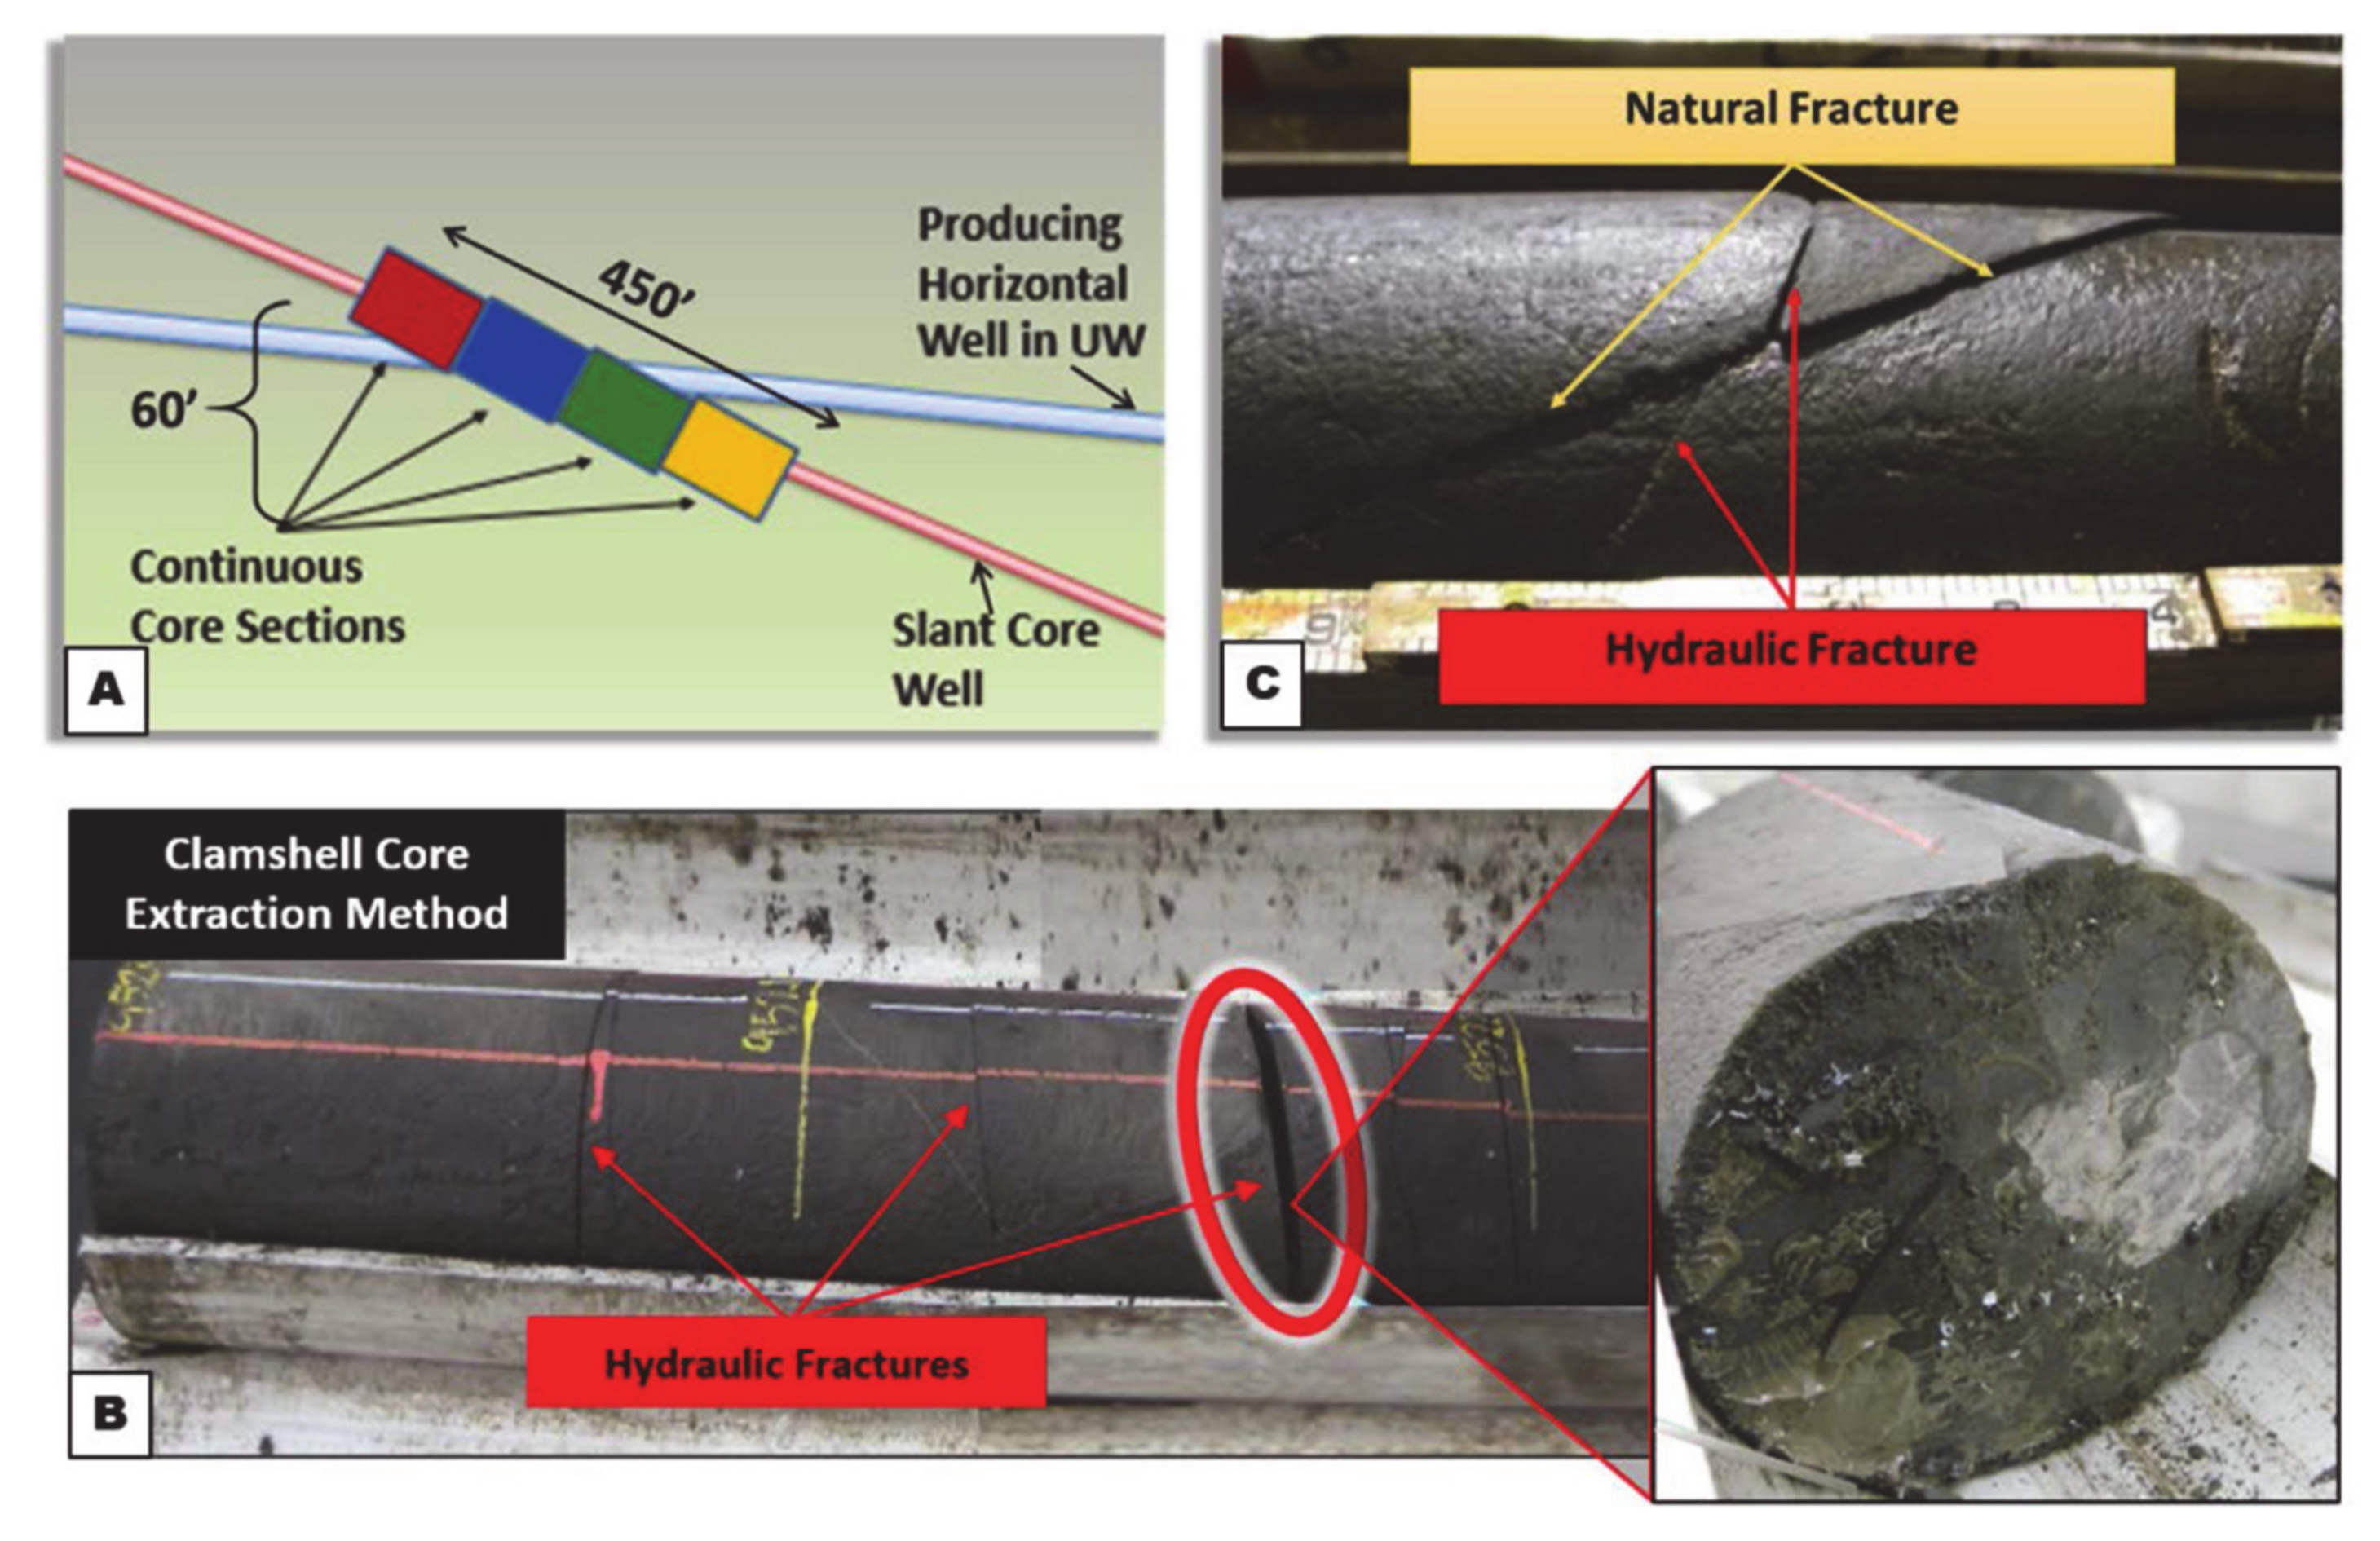
The project featured a very comprehensive characterization and monitoring effort before, during, and after the completion of about 400+ fracture stages in 2015. As mentioned above, in addition to a full set of geophysical measurements and various other observations of reservoir behavior during stimulation and production, the project featured a unique post-stimulation core well drilled through the stimulated volume. The obtained cores provide a rare opportunity for (1) direct characterization of fracture and proppant distribution, (2) determination of the potential modification of the rock matrix adjacent to hydraulic fractures, and (3) for state-of-the art micro-scale characterization and testing (Figure 4). As such, HFTS provides a unique opportunity for the testing of a modeling framework that involves reservoir-scale modeling while incorporating impact from micro-scale processes occurring in individual fractures and fracture/shale interfaces.

4. Reservoir-Scale Simulations of HFTS with GEOS and TOUGH+

In this section, we demonstrate the reservoir-scale simulation workflow, connecting GEOS’s capability of simulating fully-coupled hydraulic fracturing during reservoir stimulation, to TOUGH+’s capability of modeling multiphase flow during reservoir production. Specifically, we first apply a recently-developed upscaling approach in GEOS to model densely spaced hydraulic fractures observed at the HFTS. We use one fracturing stage in Well 4SM (one of the horizontal wells landing in the Middle Wolfcamp Formation) as an example. Subsequently, the simulated fractures from the GEOS model are mapped into the TOUGH+ framework for preliminary simulations of hydrocarbon production.

4.1. Hydraulic Fracturing Modeling Based on HFTS Observations

The HFTS test site includes 11 lateral wells, each containing a few dozen stimulation stages with each stage including multiple perforation clusters [24]. As the wells were not instrumented to track the distribution of production along the laterals, we chose to focus the simulation on a representative single stage in Well 4SM due to the optimal data coverage of this well.
Data in three aspects from HFTS were particularly illuminating for properly constructing the hydraulic fracturing model: (1) the resultant fracture spacing from stimulations, as informed by observations on cores retrieved from the slanted core well; (2) the stress profile, as deduced from various field measurements; and (3) the extent of fracture growth, as constrained by microseismic clouds.
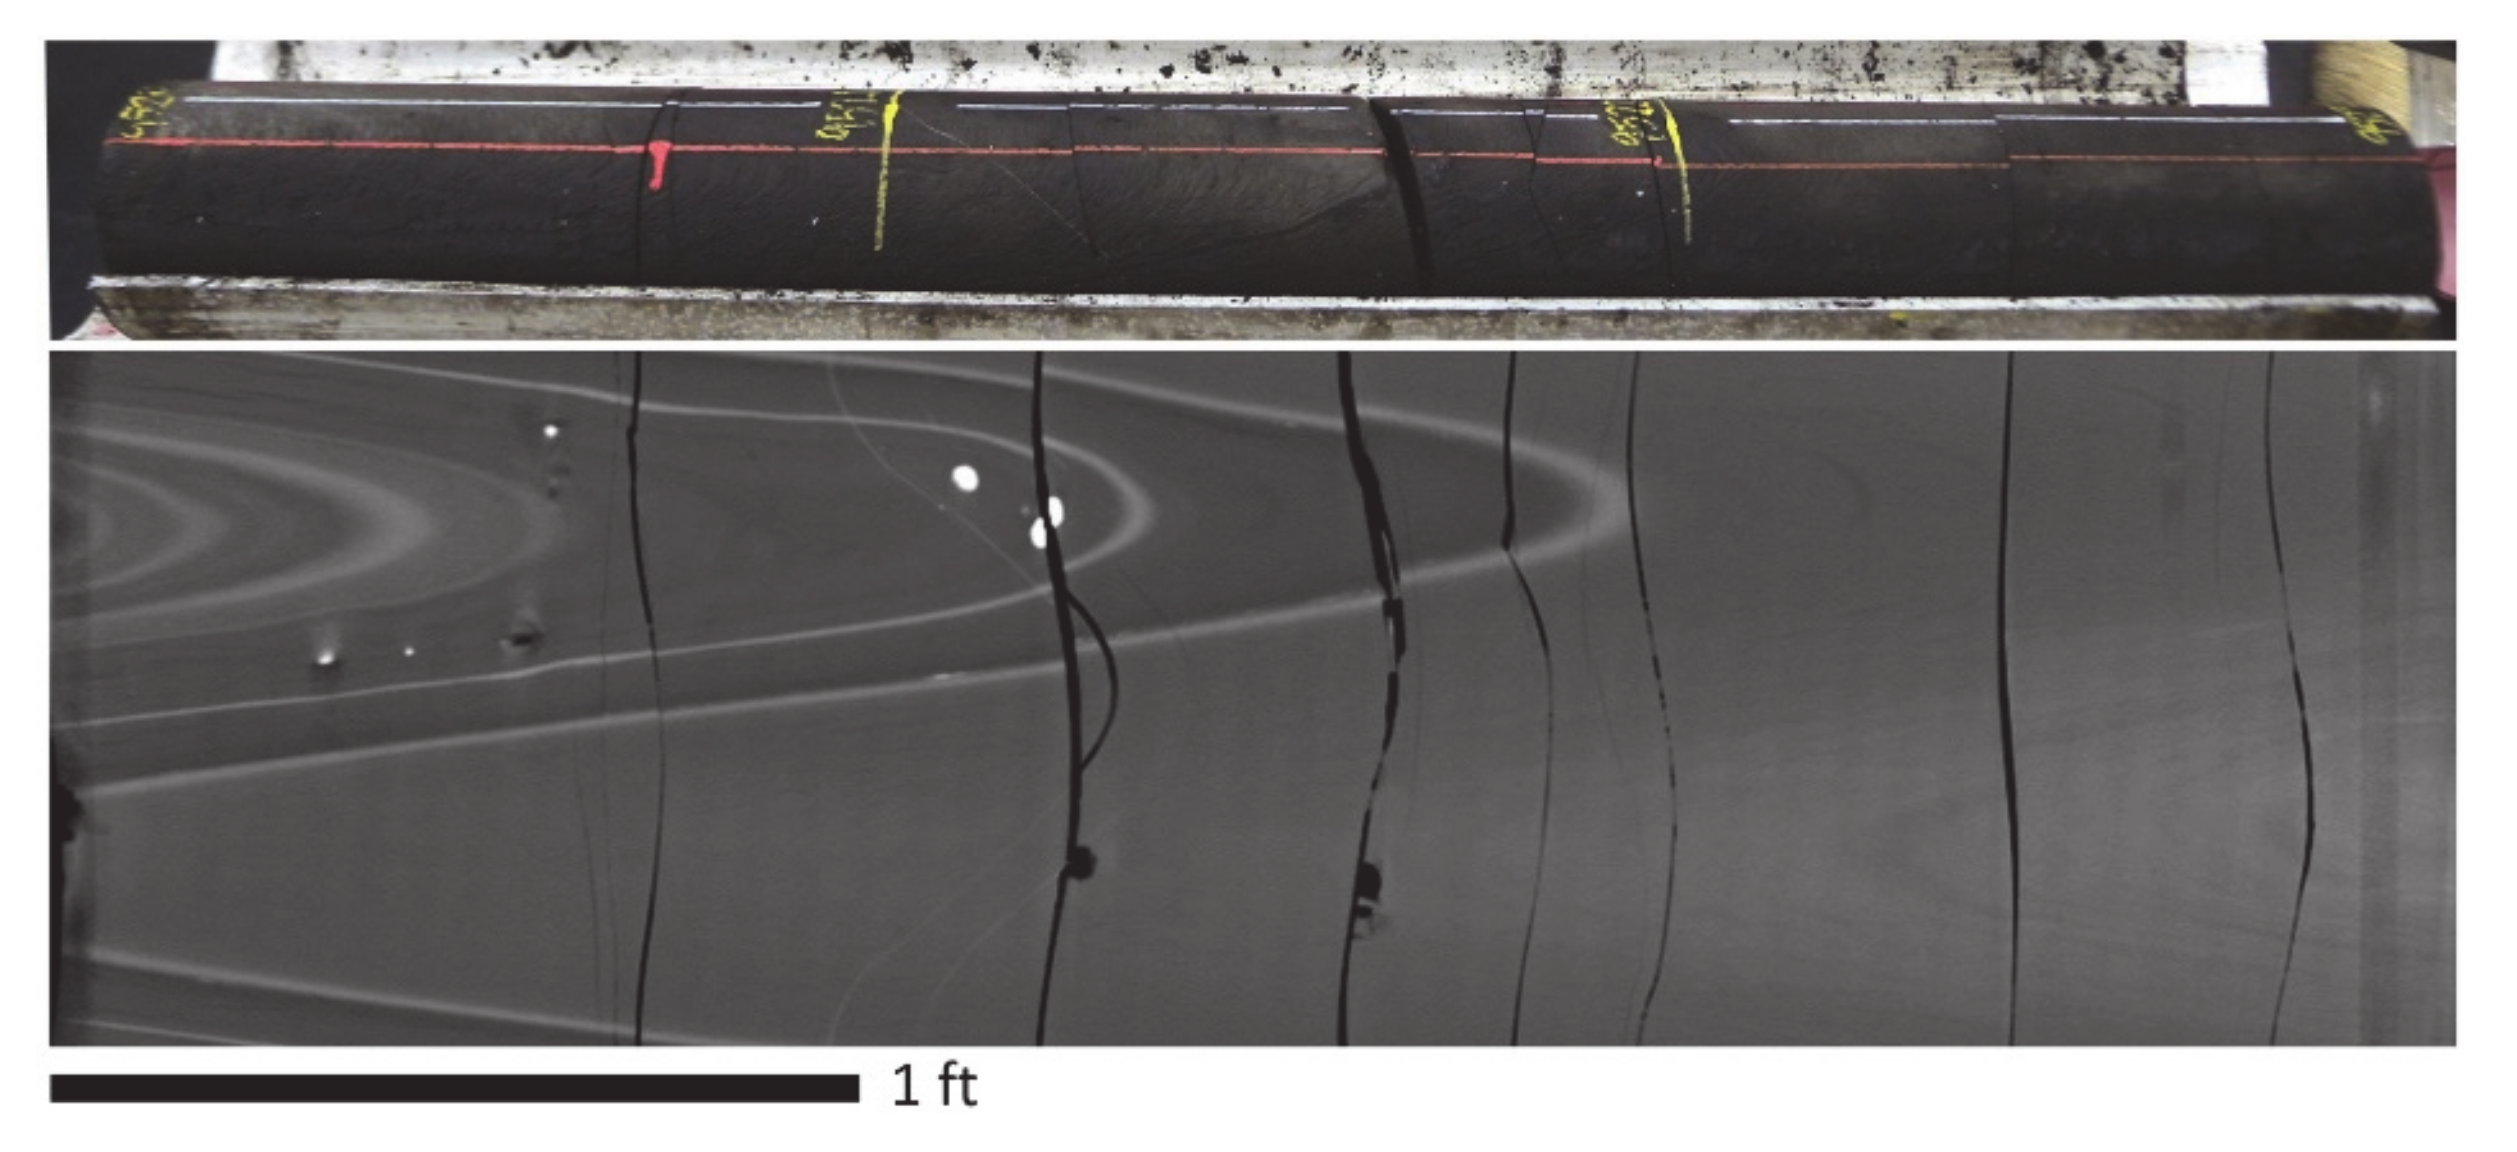
Densely-spaced fracturing, as revealed from cores, is one of the most salient observations from HFTS and agrees with observations from recent similar field experiments [39]. These hydraulic fractures have been described as “swarms” [40] and consist of multi-stranded, parallel, or sub-parallel fractures that occur within a short core length (Figure 5). Among all the identified hydraulic fractures, over 50% of the inter-fracture intervals are smaller than 0.3 m (1 ft), with the number of identified hydraulic fractures far exceeding the number of perforation clusters. These observations are at odds with the conventional concept that assumes one fracture per cluster. This discrepancy brings great challenges to existing simulation tools because explicit modeling of all of the hydraulic fractures would require prohibitively fine mesh resolutions.
Our study addressed this challenge by integrating rigorous analytical modeling and high-fidelity numerical simulations. We developed the following upscaling law from hydraulic fracturing mechanics:
K I C 0 = N K I C ;   μ 0 = N 2 μ ;   C L 0 = N C L ;   D 0 = N D
where N is the number of fractures in the swarm. For each fracture in the swarm, K I C is the rock’s fracture toughness, μ is the fluid viscosity, C L is Carter’s leak-off coefficient, D is the proppant diameter. The subscripted 0 indicates the corresponding effective properties for the upscaled fracture [41]. Note that in addition to the upscaling relationships presented in our previous work, the effective proppant diameter is upscaled to be N times the diameter of the individual fractures. This is to attain an equivalent proppant bridging criterion and the same proppant settling speed in the laminar flow regime assumed in our numerical models. Equation (2) enables existing simulation tools to accurately model the growth of a group of dense hydraulic fractures (a hydraulic fracture swarm) using an equivalent representation in the form of a single upscaled fracture, with effective fracture toughness, fluid viscosity, leak-off coefficient, and proppant diameter. The upscaling equation has been verified through a direct comparison with corresponding GEOS models that explicitly simulate individual fractures. Our results indicate that the upscaled fracture accurately captures both the average length and total aperture of the fractures in the swarm. Furthermore, we show that conventional modeling approaches yield excessively fast fracture growth. After implementing the upscaling equation, we observe that the fracture swarming effect brings the model results in line with fracture evolution implied by the microseismic data, indicating that the upscaling approach is allowing our modeling process to be more predictive, rather than a calibration effort involving the arbitrary variation of appropriate input parameters to achieve agreement between numerical predictions and field observations [41].
The minimum in-situ stress (Shmin) has a first-order impact on hydraulic fracture geometries. In this study, the stress profile is deduced by combining well logs, DFIT (diagnostic fracture injection test) analyses and ISIP (instantaneous shut-in pressure) interpretations: DFIT data were used to “anchor” the magnitude of Shmin; well logs and ISIP at different stages were used to constrain the spatial distribution of Shmin.
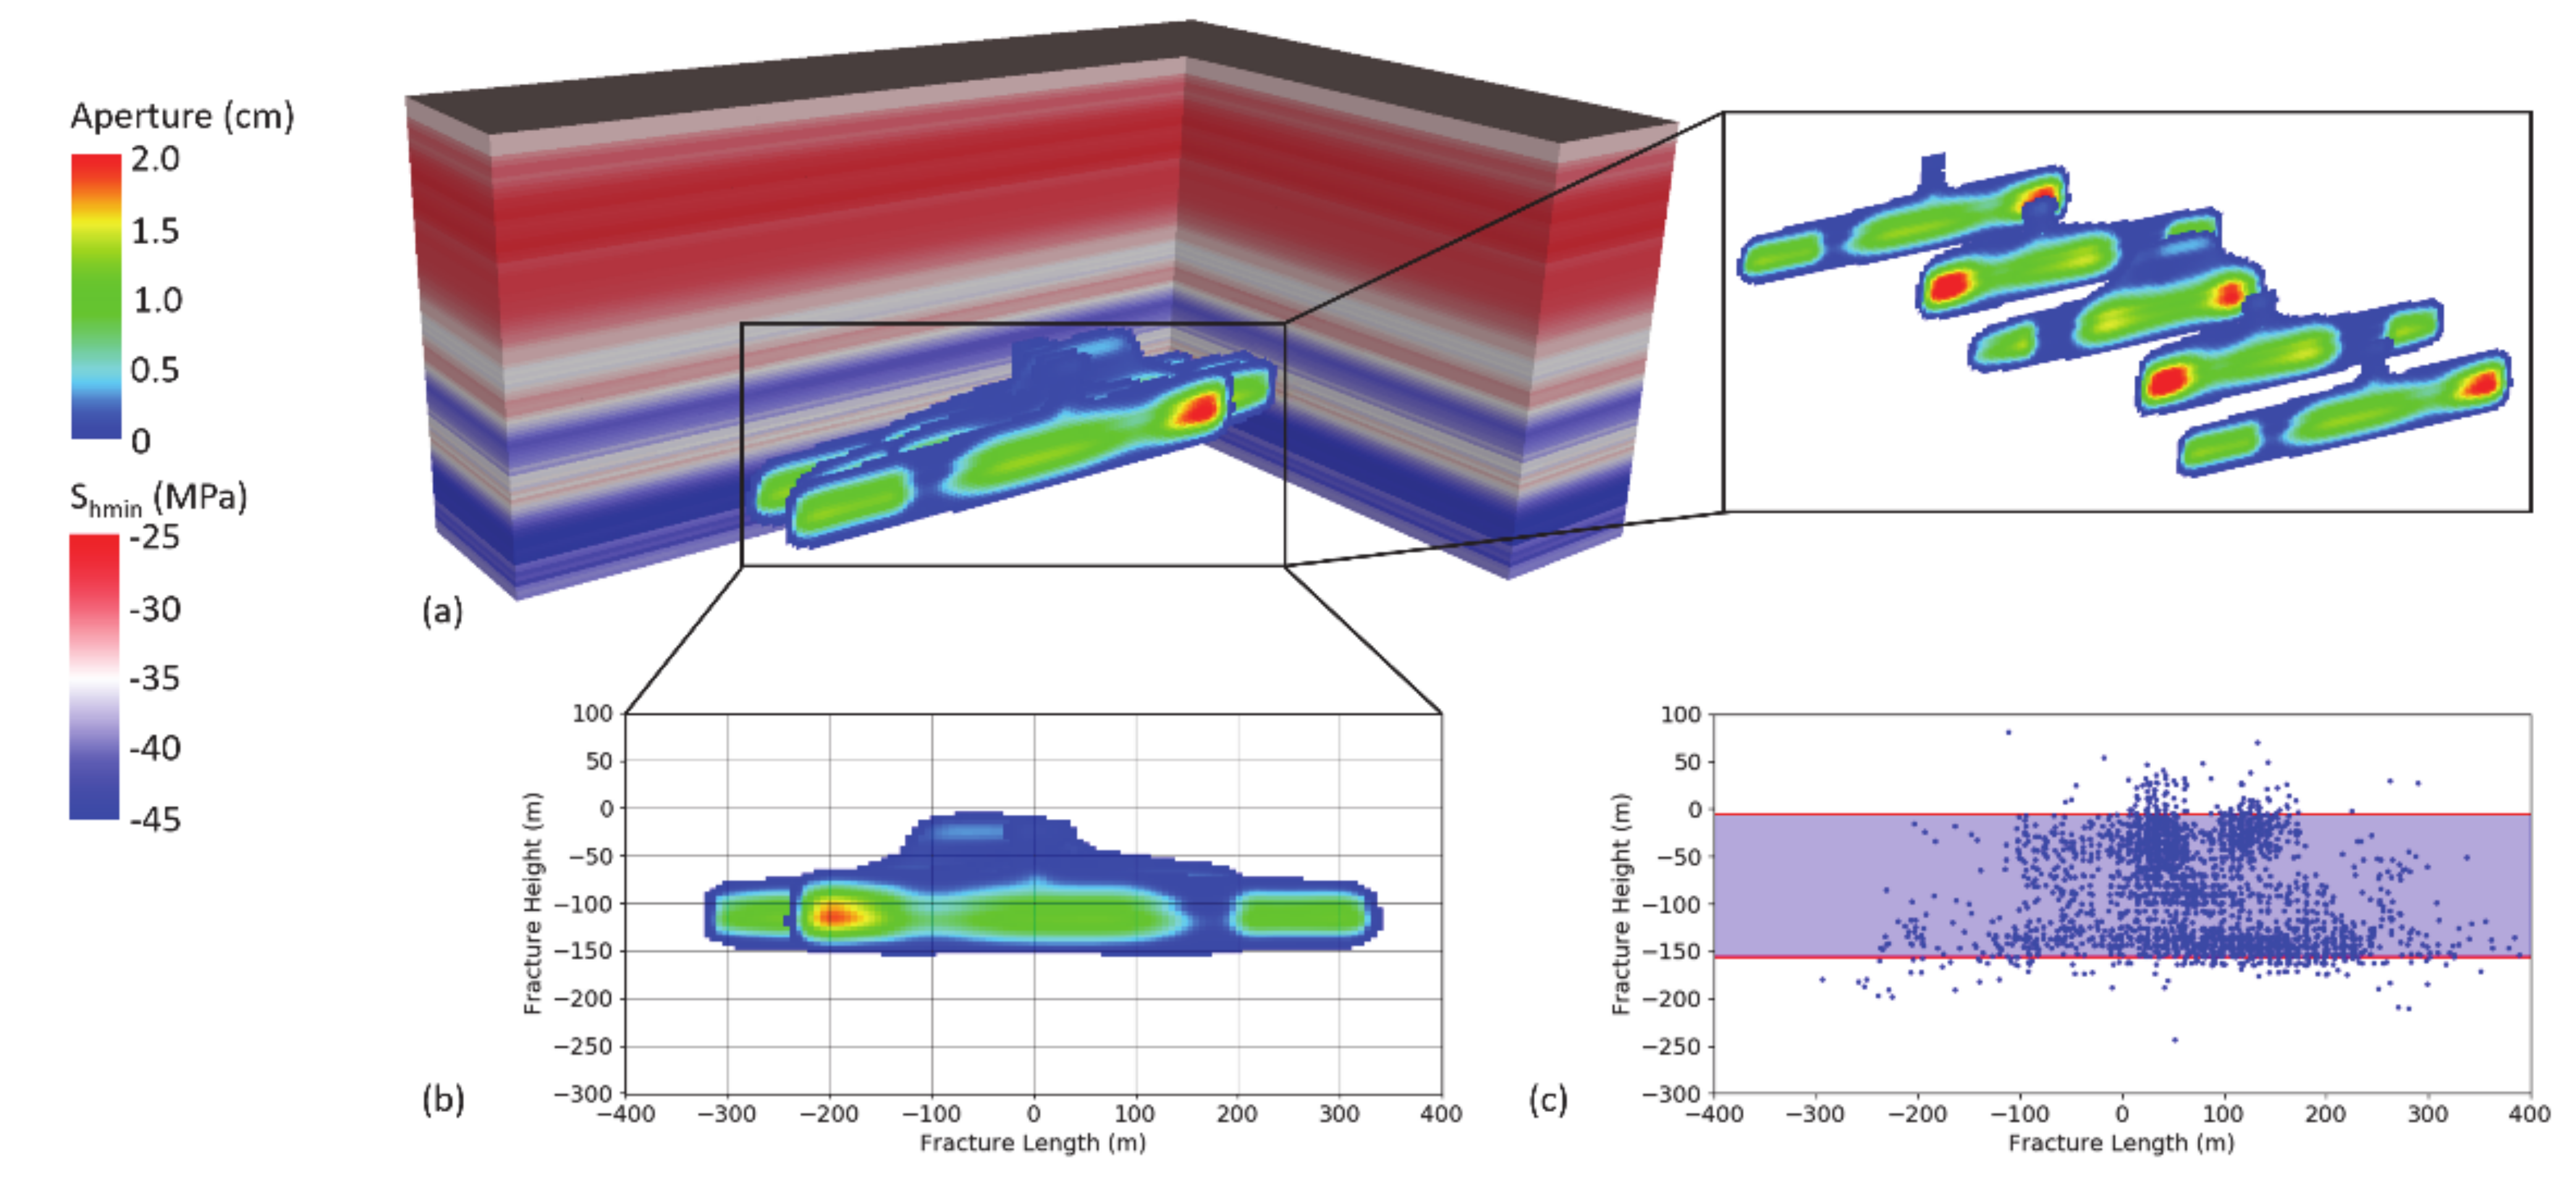
Figure 6 shows an example of a hydraulic fracturing simulation using GEOS. The simulated stage is from Well 4SM located in the Middle Wolfcamp Formation, which includes five perforation clusters with a cluster spacing of approximately 16 m. Reservoir properties and completion parameters used in the simulation are determined based on HFTS data. The fracture swarming effect is taken into account using the developed upscaling modeling approach. Here we assume that each perforation cluster is associated with eight hydraulic fractures. This ratio happens to be the same as the number of perforations at each cluster and is generally consistent with the observed density of hydraulic fracture swarms from the core. The densely-spaced hydraulic fractures at each cluster are then represented by a single fracture in the simulation, with effective properties determined from the upscaling equation.
In this example, the fractures tend to grow horizontally while developing limited vertical growth, considerably constrained by high-stress barriers (depicted in blue on the color map of minimum horizontal stress, Figure 6a) above and below the stimulation zone. Further validation of GEOS simulation results is attained by comparing the overall geometry of simulated fractures (Figure 6b) with the fracture extent indicated by the corresponding microseismic event distributions (Figure 6c), which shows satisfactory agreement. For example, both the numerical simulation and the microseismic mapping show a fracture vertical growth of approximately 150 m. The simulation results, such as aperture and proppant distributions, are mapped into TOUGH+ subsequently for further insights from production simulations.

4.2. Preliminary Producton Simulations with TOUGH+

The TOUGH+ reservoir-scale production model takes GEOS predictions of fracture geometry (number, location/shape, aperture) and remaps them into the TOUGH+ meshing framework. Specifically, we maintain both the detailed geometry of the stimulated zone (hydraulic fractures, stimulated natural fractures) and its internal state (spatial distribution of proppant, stress shadowing, etc.) in the transfer from GEOS to TOUGH+.
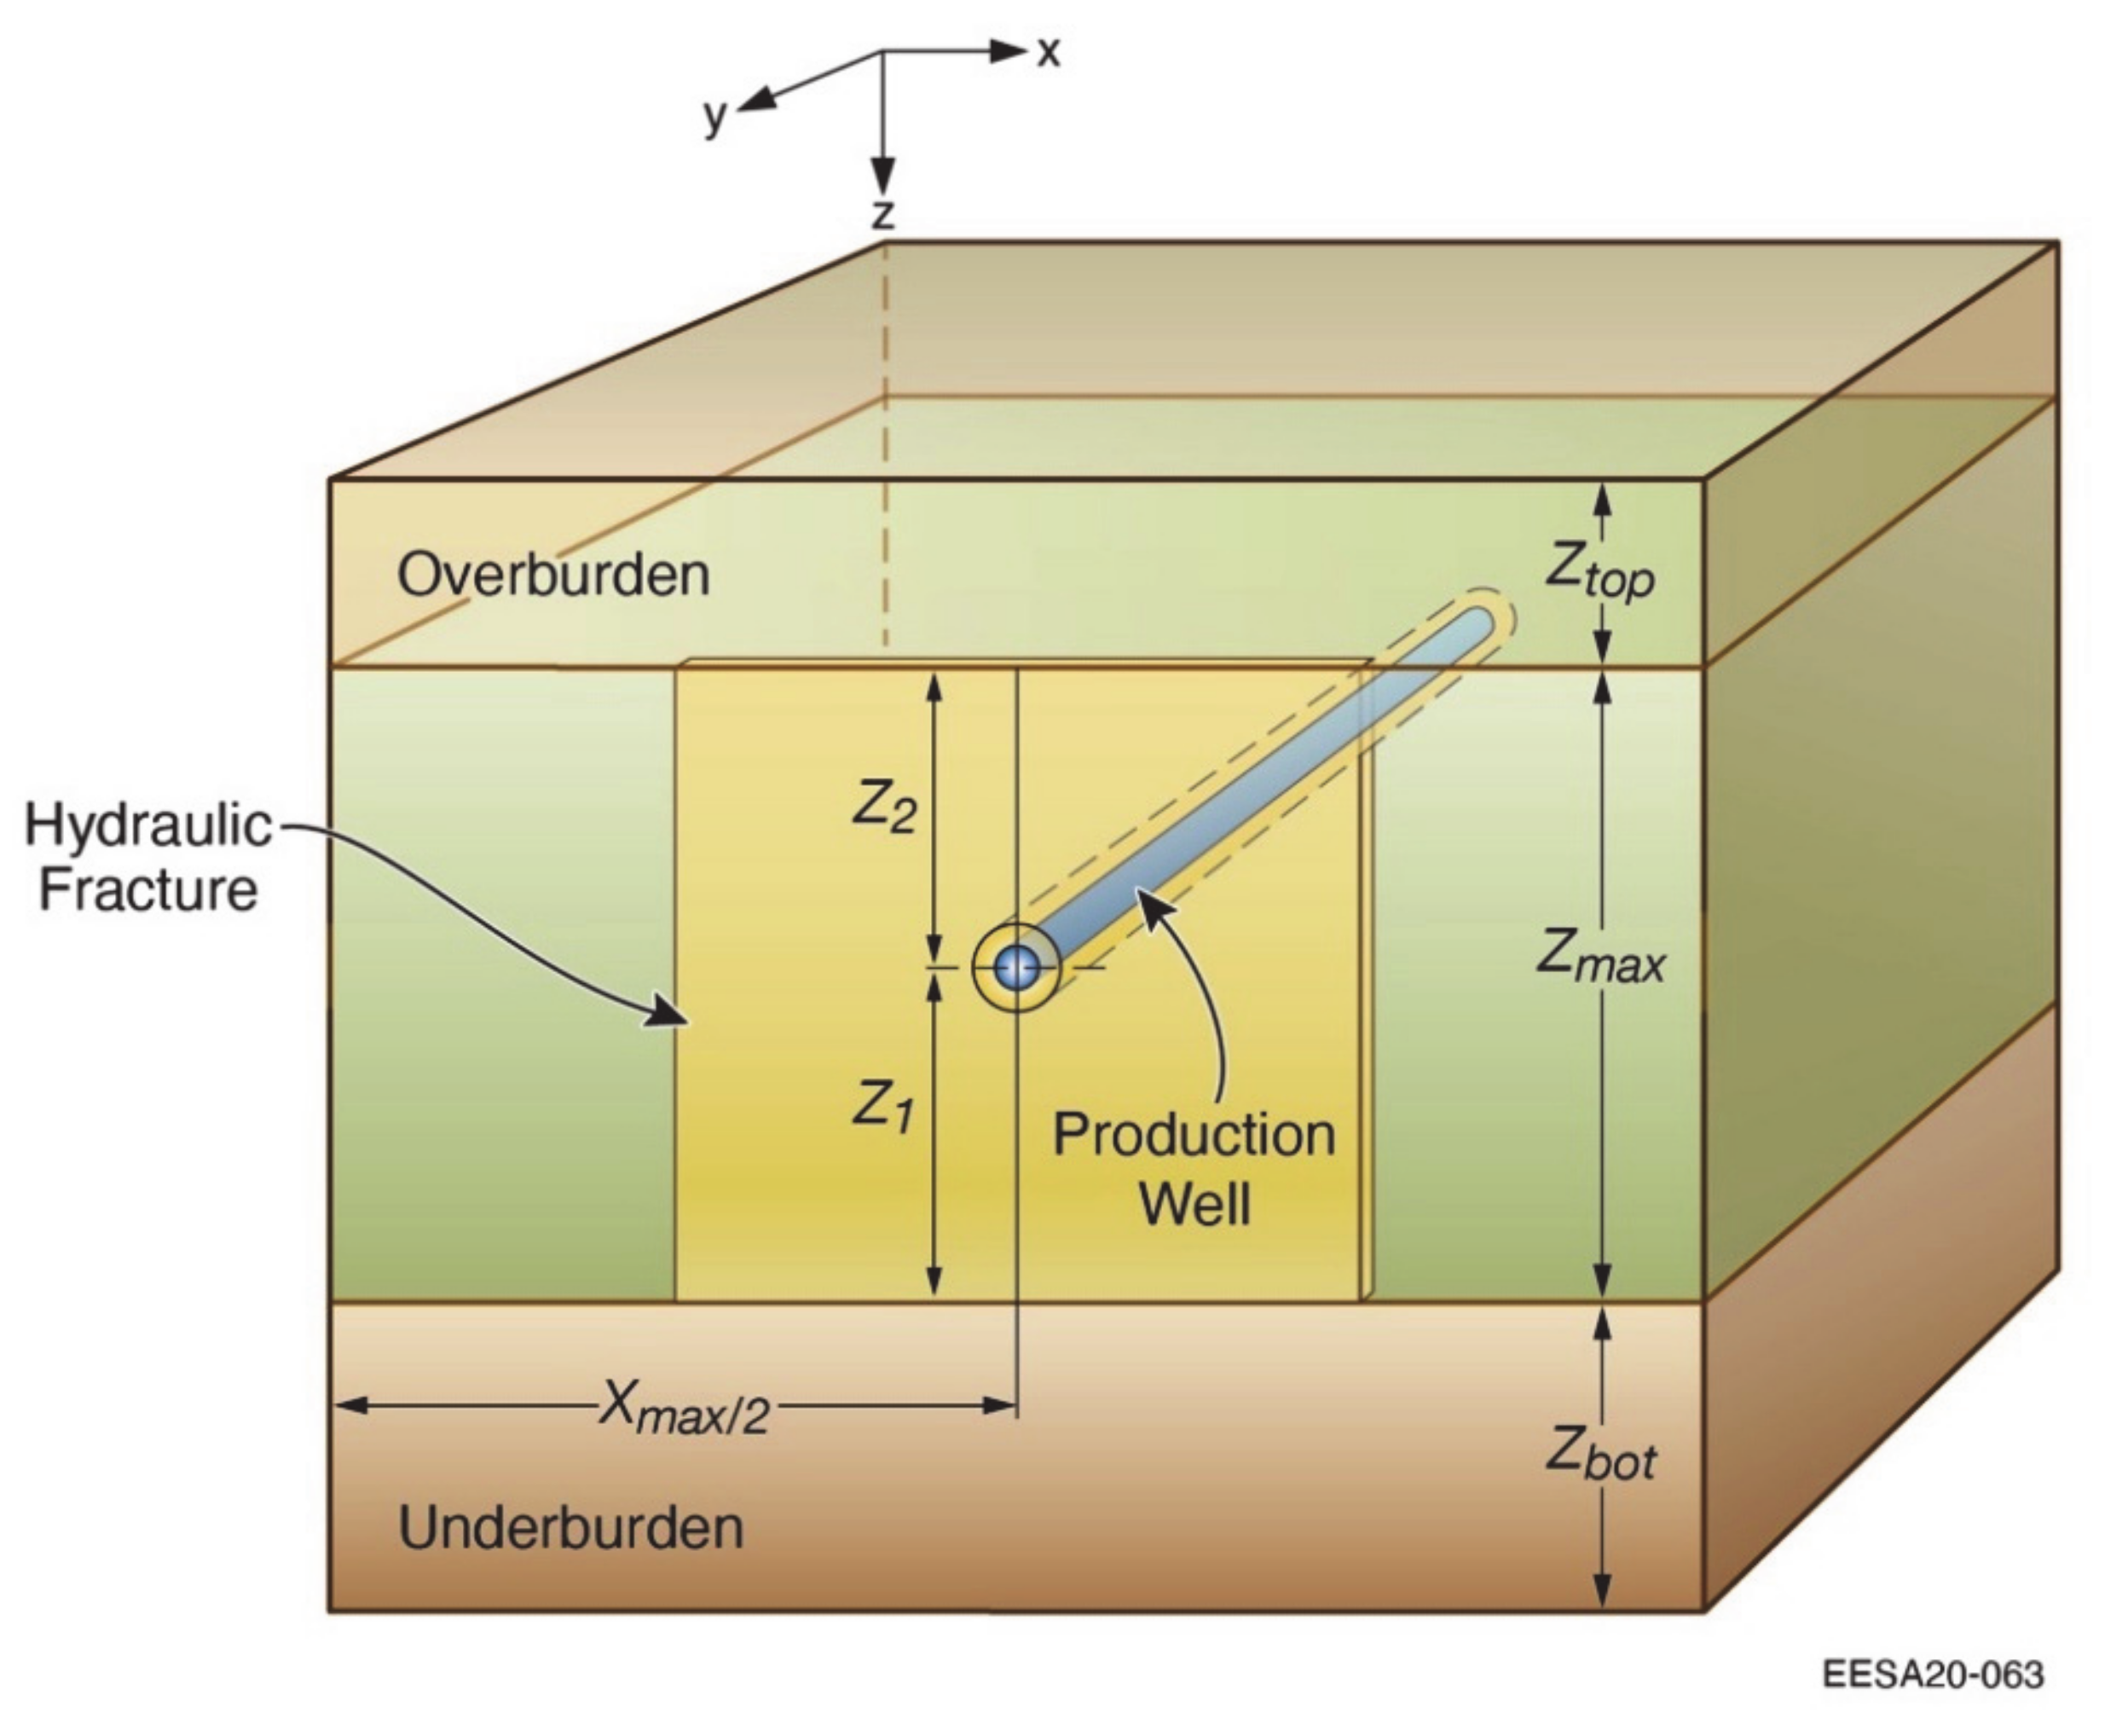
As discussed in Section 2.3, the TOUGH+ reservoir simulations typically model a stage or a small number of stages along a production well. The simulation domains in this study are thus based on the concept of a stencil, i.e., the smallest repeatable symmetric element that can be identified within a reservoir with parallel horizontal wells. This is the smallest unit that is necessary and sufficient to fully characterize the system and describe its behavior during production. A stencil-based analysis is sufficiently small to allow fine discretization to capture steep gradients and strong non-linear effects that have a significant impact on production, and can also provide accurate predictions of the behavior of an entire multi-fractured horizontal well system by adding the production results of the stencils [42]. An example of the simulation stencil used for a single-stage, single-fracture simulation is shown in Figure 7. Note that the fracture in the schematic figure is rectangular; however, in this work the 3D fracture geometry (2D extent plus variable aperture) from GEOS is used.
To demonstrate the application of the workflow, we simulate a complete stage from Well 4SM (Middle Wolfcamp Formation), which includes five perforation clusters with a 16 m cluster spacing as described in Section 4.1. Fracture swarms are included using the developed upscaling approach, and we assume that each cluster is associated with eight hydraulic fractures represented by a single fracture in the simulation with the effective properties determined from the upscaling law.
Figure 8 shows the effective propped aperture for the 3rd of the 5 fractures shown in Figure 6, as calculated by Equation 1. Compared to Figure 6, the final propped aperture is much smaller, reflecting hydraulic fracture closure after stimulation. Three simulation scenarios, using three different translations of the GEOS output, are examined to assess the GEOS-TOUGH+ coupling approach, which are:
(1)
GEOS-full: Uses the full coupling scheme described in Section 2.3, where the heterogeneous propped aperture (Figure 8) is fully mapped onto its TOUGH+ meshed representation.
(2)
GEOS-mean: Uses the shape of the hydraulic fractures modeled by GEOS, but the mean propped aperture is assigned to all fracture cells, which results in a homogeneous fracture aperture, but a fracture shape/extent determined by GEOS simulation.
(3)
Rectangular: Uses a rectangular fracture, and the mean aperture for the hydraulic fractures. This method has been previously used in other HF simulation studies where the details of fracture geometry were unknown [42]. The fracture area of the Rectangular case is chosen to match the area predicted by GEOS (with <0.2% difference), to ensure the correct fracture volume.
Other parameters used for the Well 4SM model can be found in Table 1. In this work, we focus on the performance of the GEOS-TOUGH+ coupling scheme; thus, the matrix is treated as a single continuum where secondary and natural fractures are limited and/or discontinuous, and their effects are sufficiently small to allow their incorporation into the matrix porosity and permeability, thus allowing matrix representation as a single continuum. The matrix porosity, permeability, and the initial state of the reservoir are all assumed homogeneous. Constant bottom hole pressure (BHP) is applied to the well. Initially we assume only water and oil, with pure methane in solution in the oil phase, exist in the reservoir. As production commences, gas is released from oil due to depressurization and produced at the well. Note that the potential impact of micro-scale processes, such as proppant behavior and geochemical reactions, are not yet incorporated in the production simulations.
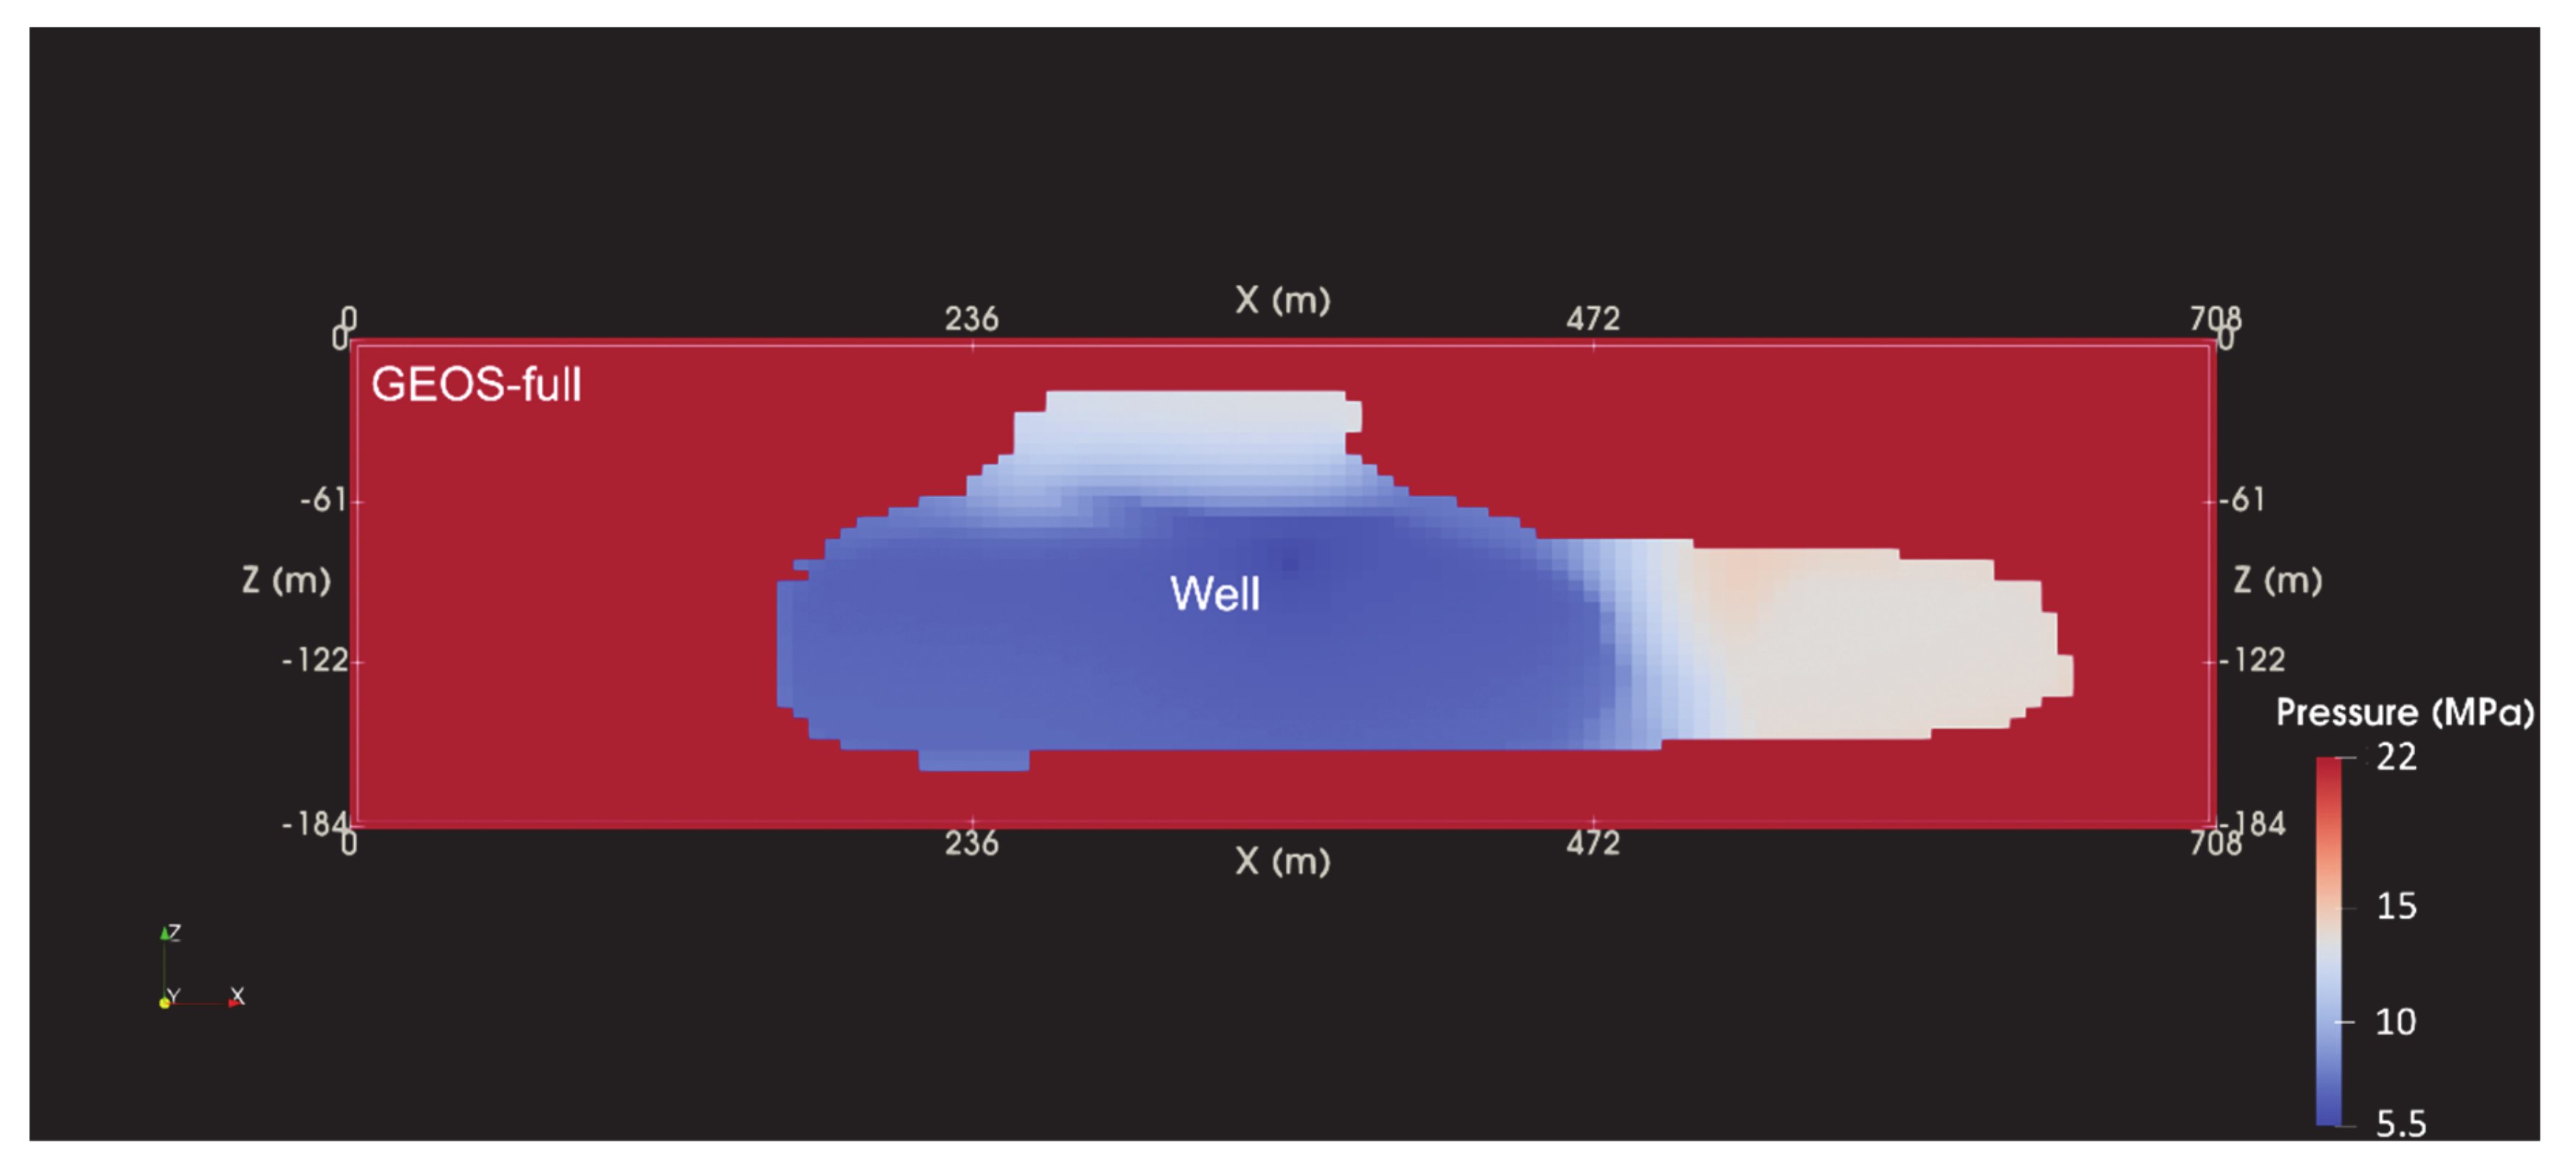
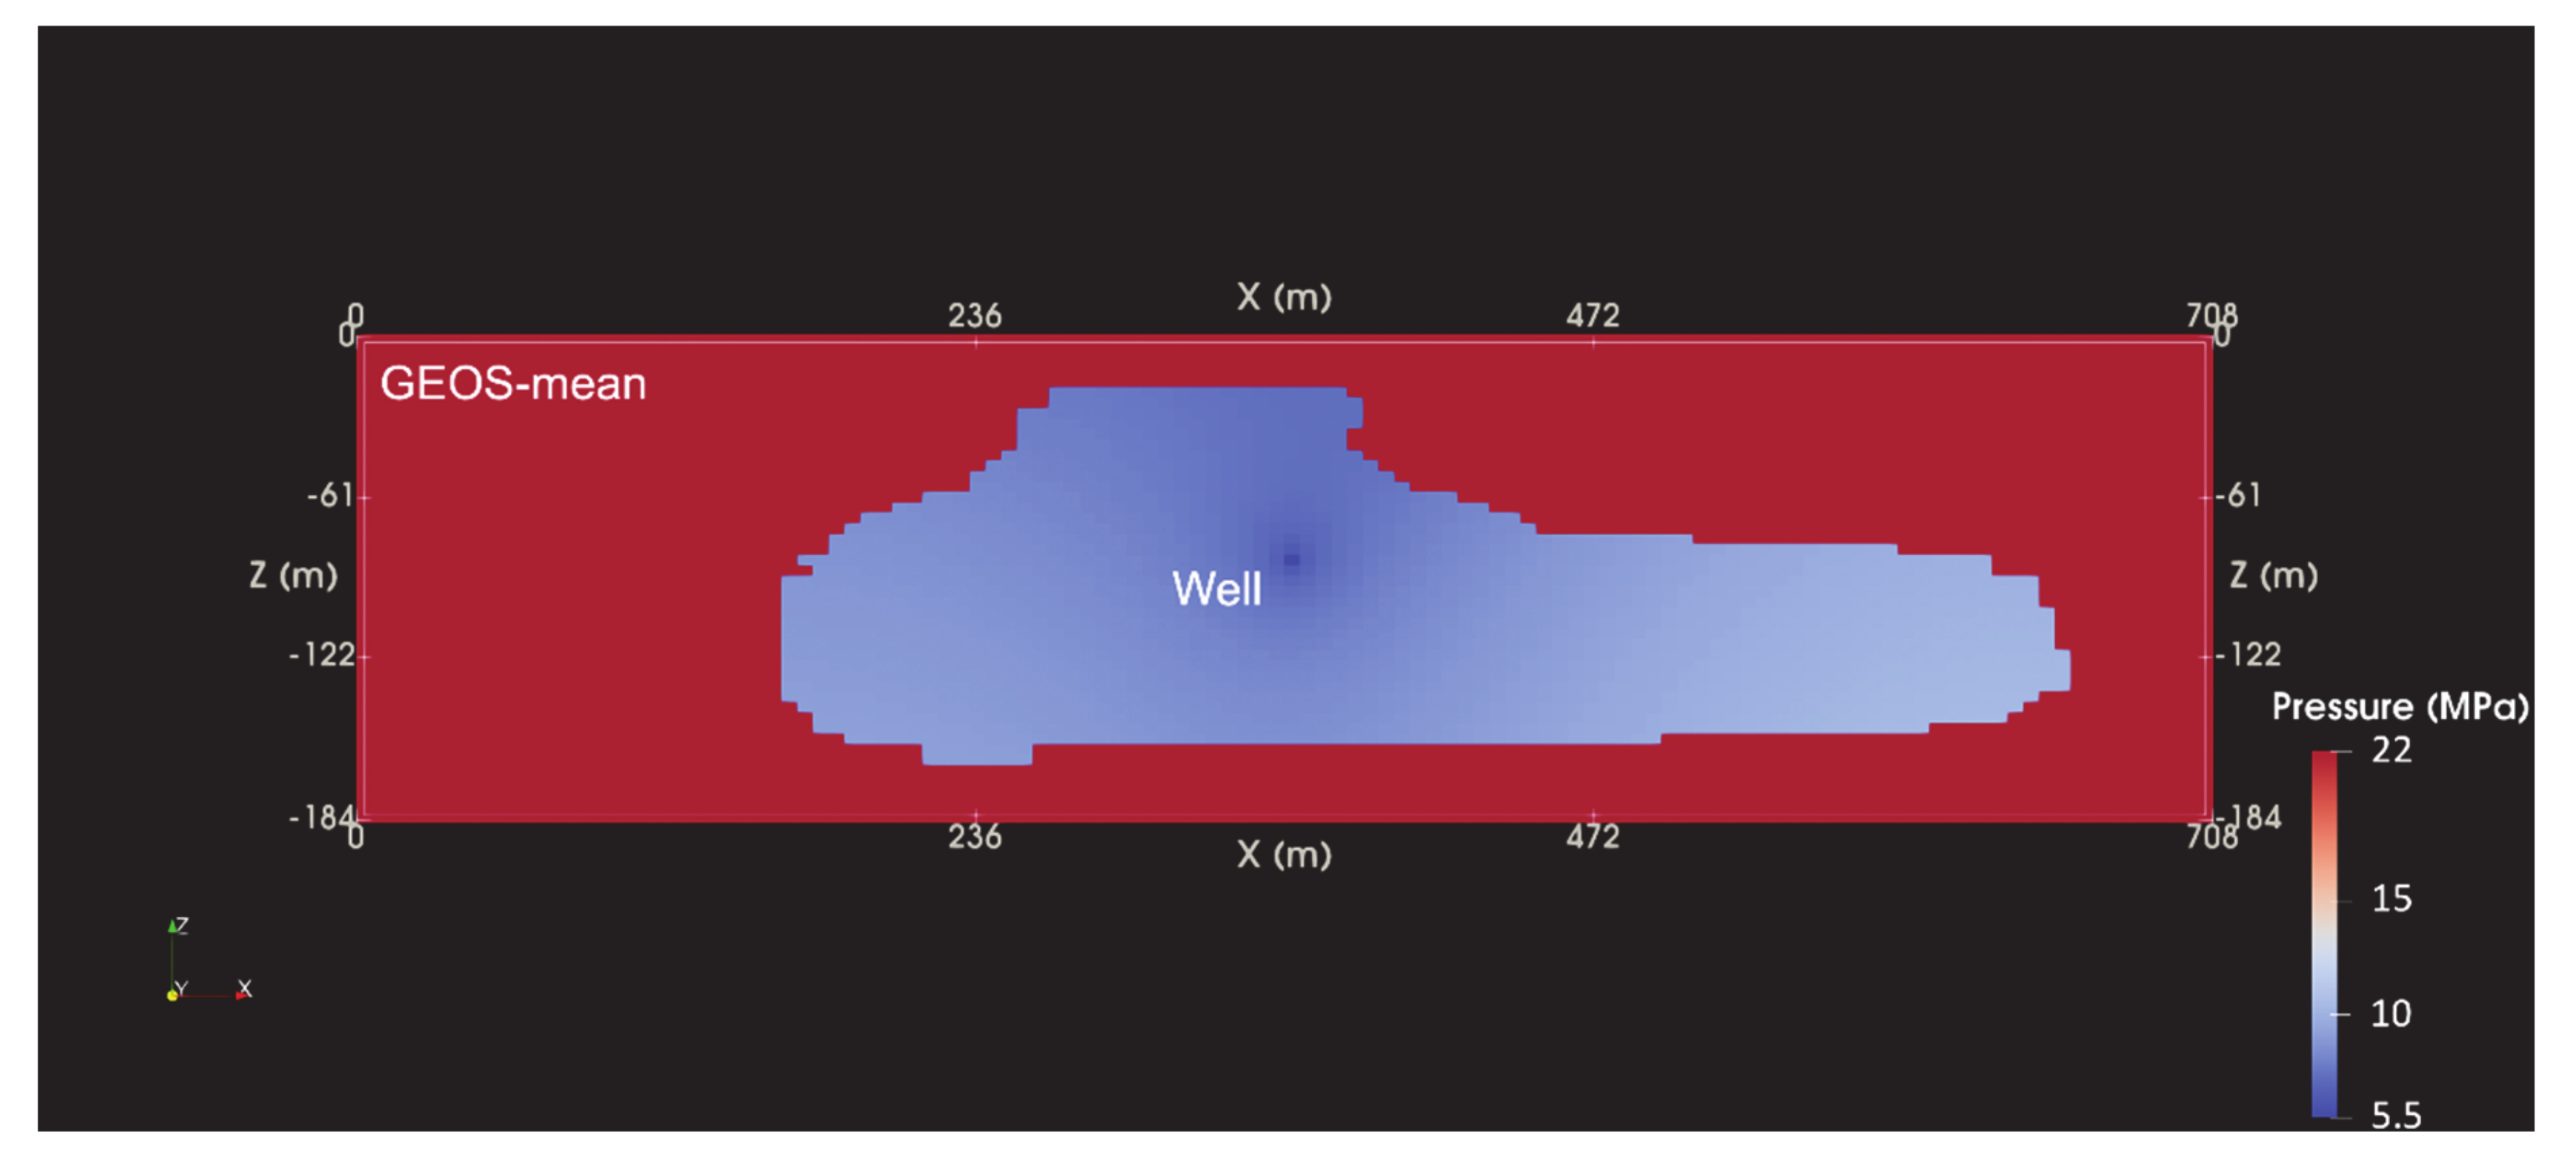
The pressure distribution in the 3rd hydraulic fracture at 1000 days is plotted in Figure 9 and Figure 10 for the GEOS-full and GEOS-mean cases, respectively. With a uniform aperture (Figure 10), as we move away from the well, pressure increases smoothly in all directions. When a heterogeneous aperture distribution is used (Figure 9), the pressure distribution is clearly affected by variations in aperture (Figure 8), with the aperture variation reflected in zones of higher and lower pressure gradients across the plane of the fracture. Compared to a homogeneous aperture, using a heterogeneous aperture leads to wider range of in-fracture pressure variation. Steep pressure gradients are observed where aperture changes abruptly (e.g., the top region and the right wing of the fracture in Figure 6). Because flow in the hydraulic fracture is driven by the pressure gradient, the aperture heterogeneity, which results from the heterogeneous stress field during fracturing, the non-uniform distribution of proppant concentration, and the stress-shadowing effect, can have significant influence on the production behavior of the modeled clusters and the overall production behavior of the fractured stage.
Figure 11 illustrates the cumulative oil and gas production, as simulated by TOUGH+OGB, for the three fracture simulation cases GEOS-full, GEOS-mean and Rectangular. The values shown are multiplied by the number of stimulation stages to estimate overall production from the entire 4SM well. The use of a homogeneous (GEOS-mean) aperture results in a reduced estimate of cumulative oil production compared to the case with a heterogeneous aperture distribution (Figure 11a), both at early and later times, which is likely due to the limiting of the extent of the highest-permeability fracture pathways by the regions of constricted aperture (and thus lower conductivity). Simulated gas production (Figure 11b) shows relatively low values during the first 400 to 500 days followed by enhanced production for the remaining time period. The late gas production increase is likely due to the localized increase in pressure gradients within the fracture and the near-fracture zone in the matrix, which tends to enhance exsolution of gas from the oil.
It is expected that increasing fracture aperture leads to increased production, but in the case of heterogeneous fractures—in which apertures vary by orders of magnitude over the extent of the fracture, resulting in the creation of heterogeneous flow pathways within the fracture—the net effect on production remains unclear. The present results qualitatively emphasize the impact of fracture shape and aperture heterogeneity on oil production, and the importance of the use of more realistic, physics-derived representations of hydraulic fractures as allowed by the GEOS-TOUGH coupled workflow.
A more detailed quantitative sensitivity analysis is still needed, and this is a component of the HFTS project that is currently in progress. In addition to examining the effect of the treatment of heterogeneity in the representation of the stimulated fractures, numerical experiments based on the five-cluster system described in Section 4.1 are examining the effect of (1) uncertainties in initial shale permeability, (2) uncertainties in initial water and oil saturations, (3) changes in fracture permeability due to proppant rearrangement, embedment or breakage, (4) changes in fracture permeability due to chemical reactions from exposure to stimulation fluids, and (5) development (and properties) of an altered (lower permeability) layer (“skin”) at the fracture-shale interface due to chemical alteration of the near-fracture matrix. Preliminary analysis of these simulations has revealed:
(1)
The initial water saturation in the altered layer at the fracture-shale interface affects the early-time production behavior
(2)
Gas exsolution in the fracture and in the near-fracture zone, and early-time gas production is sensitive to fracture mean aperture. This is important as gas saturation in the near-fracture zone has significant effects on the mobility of the oil phase.
(3)
The oil and gas production rates, derived from stage-by-stage simulation, are overpredicted at longer timescales compared to HFTS field data, suggesting interference between wells.
Many of these potential effects will be quantified by the laboratory experiments discussed in the following section. Characterization of core samples from the HFTS site will give us increasingly detailed knowledge of the state of the reservoir post-fracturing, after pre-production shut-in, and after production. Issues such as the thickness of the altered layer at the fracture-shale interface, the properties of the layer (after geochemical alteration), and the near-fracture and bulk properties of the shale matrix will be compared to the sensitivity studies (numerical experiments) to guide the next round of simulations, with an eye on history matching production data. The experimental work will also lead to micro-scale insights, which will be upscaled when possible and incorporated in the geological model for production simulation and into the physical properties and processes options of TOUGH+OGB.

5. Micro-Scale Experiments and Simulations

Here we describe the sophisticated imaging, testing and modeling methods to probe the mechanical and chemical processes occurring within propped fractures and across the fracture-rock interfaces. Results will ultimately be used to derive constitutive relationships to incorporate the effect of such processes in the reservoir-scale simulations. Below, we first discuss the experimental work done on proppant mechanics (Section 5.1) and then describe the fracture and matrix reaction experiments, plus associated reactive transport modeling (Section 5.2). While the experimental focus in Section 5.1 and Section 5.2 is different, we recognize that mechanical and chemical effects cannot be separated. We therefore conduct the proppant mechanics experiments on both unreacted and reacted samples, and we ensure that the fracture reaction experiments are done at appropriate confining stresses.

5.1. Micro- to Mesoscale Experiments on Proppant Mechanics

Micro- to mesoscale interactions at the proppant-matrix interface can significantly affect the production behavior because processes like proppant rearrangement, embedment or breakage can lead to fracture closure and possibly collapse. These processes may be accelerated by alteration of fracture faces through exposure to acid fluids during the spearhead and pad stages of hydraulic fracturing operations, which can weaken the rock matrix and even affect proppant behavior. The proppant-proppant, proppant-shale, and shale-shale contacts are the micro-scale features that control the mechanical evolution of a propped fracture, bearing the stress that induces the fracture closure during product recovery. Here we describe the experimental setups and workflows which test and quantify permeability changes as a result of single proppant and proppant monolayer experiments. We demonstrate the workflow on shale samples obtained from other unconventional reservoirs. An experimental program on Wolfcamp Shale samples from the HFTS will be started soon, to be reported in future publications. Experiments will be conducted with unreacted samples as well as samples that have been altered during exposure to stimulation fluids during a simulated “shut-in” period.

5.1.1. Micro-Scale In Situ X-Ray Imaging of Proppant Mechanics

In a propped fracture, the (chemo-)mechanical behavior of the proppant-shale contacts controls the evolution of the fracture including its permeability, ultimately providing fundamental inputs to models aiming, for example, at estimating the sustainability of fractures in unconventional oil and gas plays. In order to better understand the dynamics of these processes, we have developed both hardware and software tools based on X-ray micro-imaging, able to investigate scenarios at the micro-scale focusing either on single (fundamental micromechanics) or multiple (interaction of proppant grains) contacts.
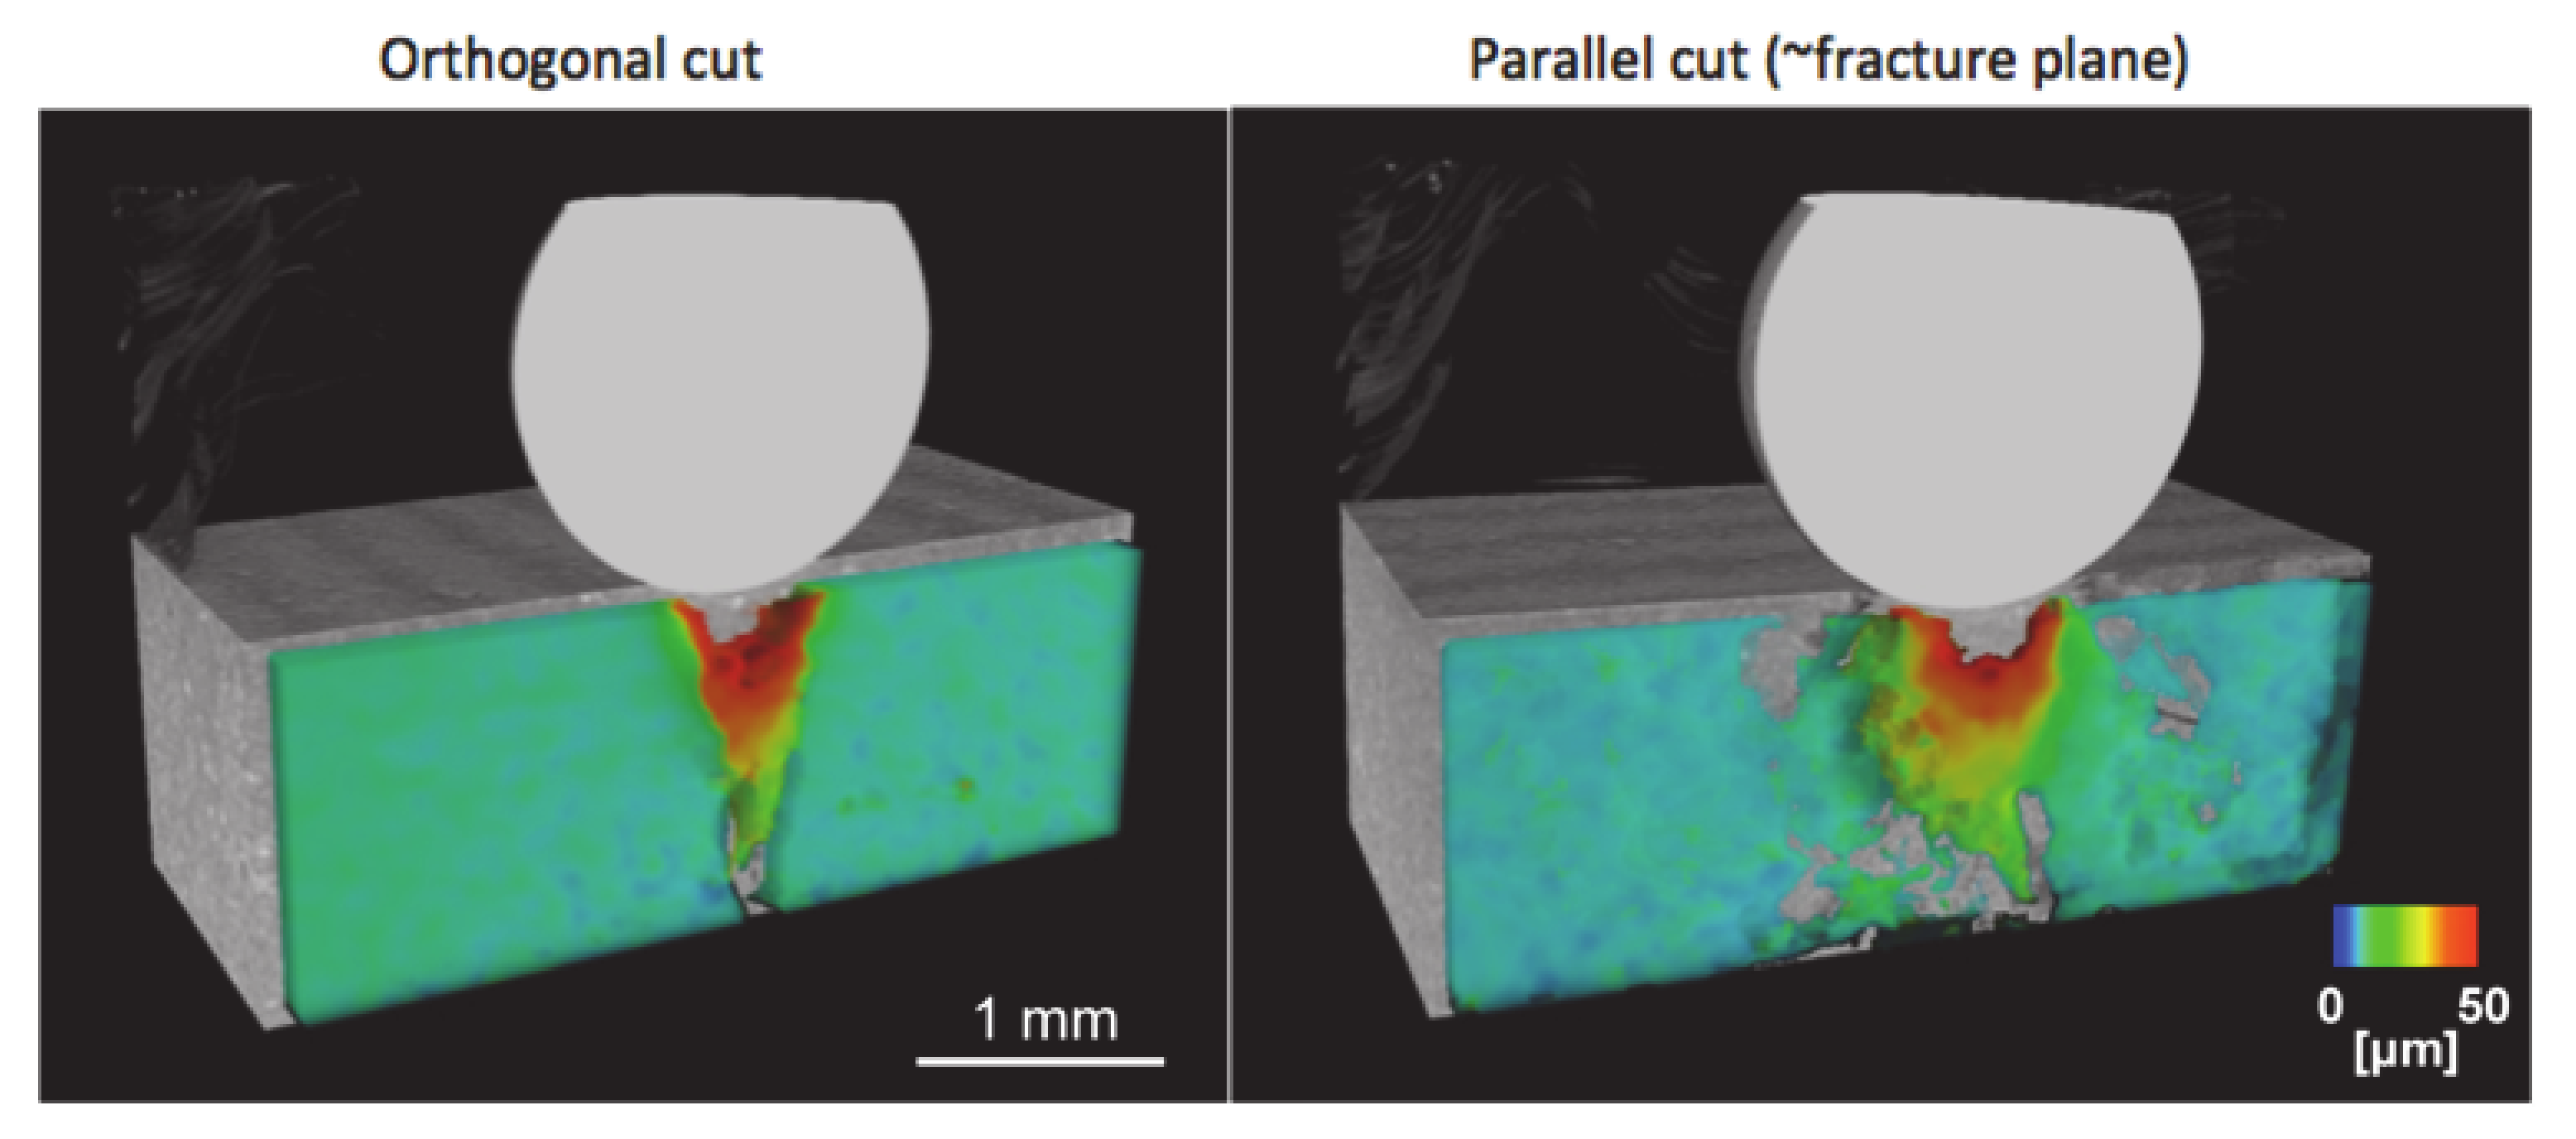
The fundamental micromechanical studies focusing on the single proppant-shale contact rely on the novel concept of “in situ indentation coupled with 4D X-ray imaging”. This concept is based on performing an indentation test (Brinell-type indenter) at controlled conditions while performing synchrotron X-ray micro computed tomography (SXRmCT) scans on the sample. This is carried out adapting the mini-triaxial cell described in [13] by adding a piston/cylinder system with a silicon nitride indenter sphere attached to a loading piston controlled by an external pump that provides the indentation force. The system allows the measurement of a full loading/unloading curve at specified confining pressure (effective stress), temperature, and fluid chemistry conditions, thus enabling measurements at relevant subsurface conditions. Using in situ SXRmCT, we can directly visualize in 3D the evolution of the microstructure of the sample under the indenter tip, during the indentation. The deformation of the sample can also be fully quantified using data processing techniques such as digital volume correlation (DVC), able to provide 3D maps of displacements, shear strain, volumetric strain, etc. This setup is especially helpful in characterizing the micro-mechanical response of the proppant-shale contacts, addressing issues such as the brittle vs. ductile response (as a function of mineral and organic composition, temperature, etc.), or the role of chemical weathering on the shale surfaces, where the indentation plus imaging approach allows observation and quantification of the mechanical response of the weathered layer and of the pristine shale underneath. An example of an indentation and X-ray imaging with DVC analysis on a brittle shale sample is shown in Figure 12, where the color scale illustrates the local displacement along the vertical axis. The estimate of micro-mechanical properties at the single contact helps in understanding the behavior of the single proppant grain, for example how specific proppants would embed in ductile or brittle shale, or how the embedment will control the closure of the fracture.
The same in situ SXRmCT technique can be used to probe the behavior of more realistic propped fractures with multiple proppant grains and to directly assess the consequence of such behavior on the fracture conductivity. We deployed this technique with proppant-filled fractures under increasing axial (normal to the fracture surface) loading conditions to induce closure while keeping confining and pore pressure constant (Figure 13a,b). The closure of propped fractures at increasing differential stress can provide information such as the mechanical response of the shale surface, the mechanical response of the proppant, the spatial rearrangement of the proppant, the evolution of the topology of the pore space (fracture aperture, connectivity, etc.), the evolution of proppant-proppant, and proppant-shale contacts. The collected datasets are then used to model flow velocity fields within the propped fracture sample and correlate the evolution of fracture conductivity with the different processes observed during the closure (Figure 13c). The example shows that, for this particular configuration, proppant rearrangement is the main factor affecting the fracture conductivity loss during closure.
The relationship between normalized conductivity in the fracture and the differential stress on the sample exemplifies an upscaling method from the micro-scale behavior to the reservoir-scale models described in Section 4 (Figure 13c). After conducting experiments on Wolfcamp Formation core, we will incorporate the resulting permeability-stress relationships into GEOS and/or TOUGH+ to describe proppant behavior and its macroscopic implications during stimulation and, in particular, during production.

5.1.2. Meso-Scale Testing of Proppant Mechanics

Because in-situ X-ray micro imaging as described above cannot be conducted on more than a few proppant grains, nor continuously over an extended period of time (e.g., several weeks), we have also tested a technique involving an oedometric compaction visualization cell in combination with UV fluorescence imaging [43] which allows for larger-scale (diameter ~44 mm) testing of the spatial and temporal evolution of proppant-bearing fractures. Going to such larger scales is particularly important when strong embedment occurs for sparsely distributed sub-monolayer proppants, and when fluid flow takes place along tortuous pathways between heterogeneously distributed proppant grains. To demonstrate this testing technique, we examined the fracture closure and proppant embedment behavior for a range of mineralogical compositions, for samples with and without acid surface treatment, with focus on the impact of shale ductility. An example from experiments conducted on Wolfcamp Shale from the HFTS is shown in Figure 14.
For this experiment, in spite of a relatively high clay content (~37% of illite and illite/smectite mix clays), we observed fracture closure primarily caused by instantaneous and delayed crushing of quartz proppant grains (diameter ~1 mm), which was accompanied by some plastic and creep deformation of the shale matrix. Direct measurement of fluid permeability is conducted by imposing a hydraulic gradient along the fracture, which, again, allows us to derive permeability versus effective stress relationships for use in reservoir scale models.

5.2. Impact of Micro-Scale Reactions on Permeability

Microscopic understanding of how and where chemical processes affect hydrocarbon flow (1) from the shale matrix into the primary fractures and (2) from the primary fractures towards the production wells is key to predicting how reservoir stimulation and production practices impact overall hydrocarbon recovery from hydraulically-fractured reservoirs. These reactions are a result of exposure of the shales, during injection and shut-in, to stimulation fluids which often have very different chemistry from the resident brines in the reservoir and are highly reactive with the matrix, resulting in rapid chemical alteration. The fluid-shale interactions cause dissolution that weakens fracture faces, making them more susceptible to closure and proppant embedment, and precipitation of mineral scale, which reduces permeability. As described below, we conducted targeted fracture and matrix reaction experiments, coupled with reactive transport modeling, to quantify chemical alteration on the fracture-matrix surface and its impacts on pressure-driven and diffusive flow of hydrocarbons from the matrix to the fractures and along propped fractures. Ultimately, these integrated experimental and numerical investigations at the microscopic scale will provide input to the reservoir-scale simulations in order to account for changes in hydrocarbon flow within the reservoir due to chemical alteration.

5.2.1. Geochemical Transport Experiments

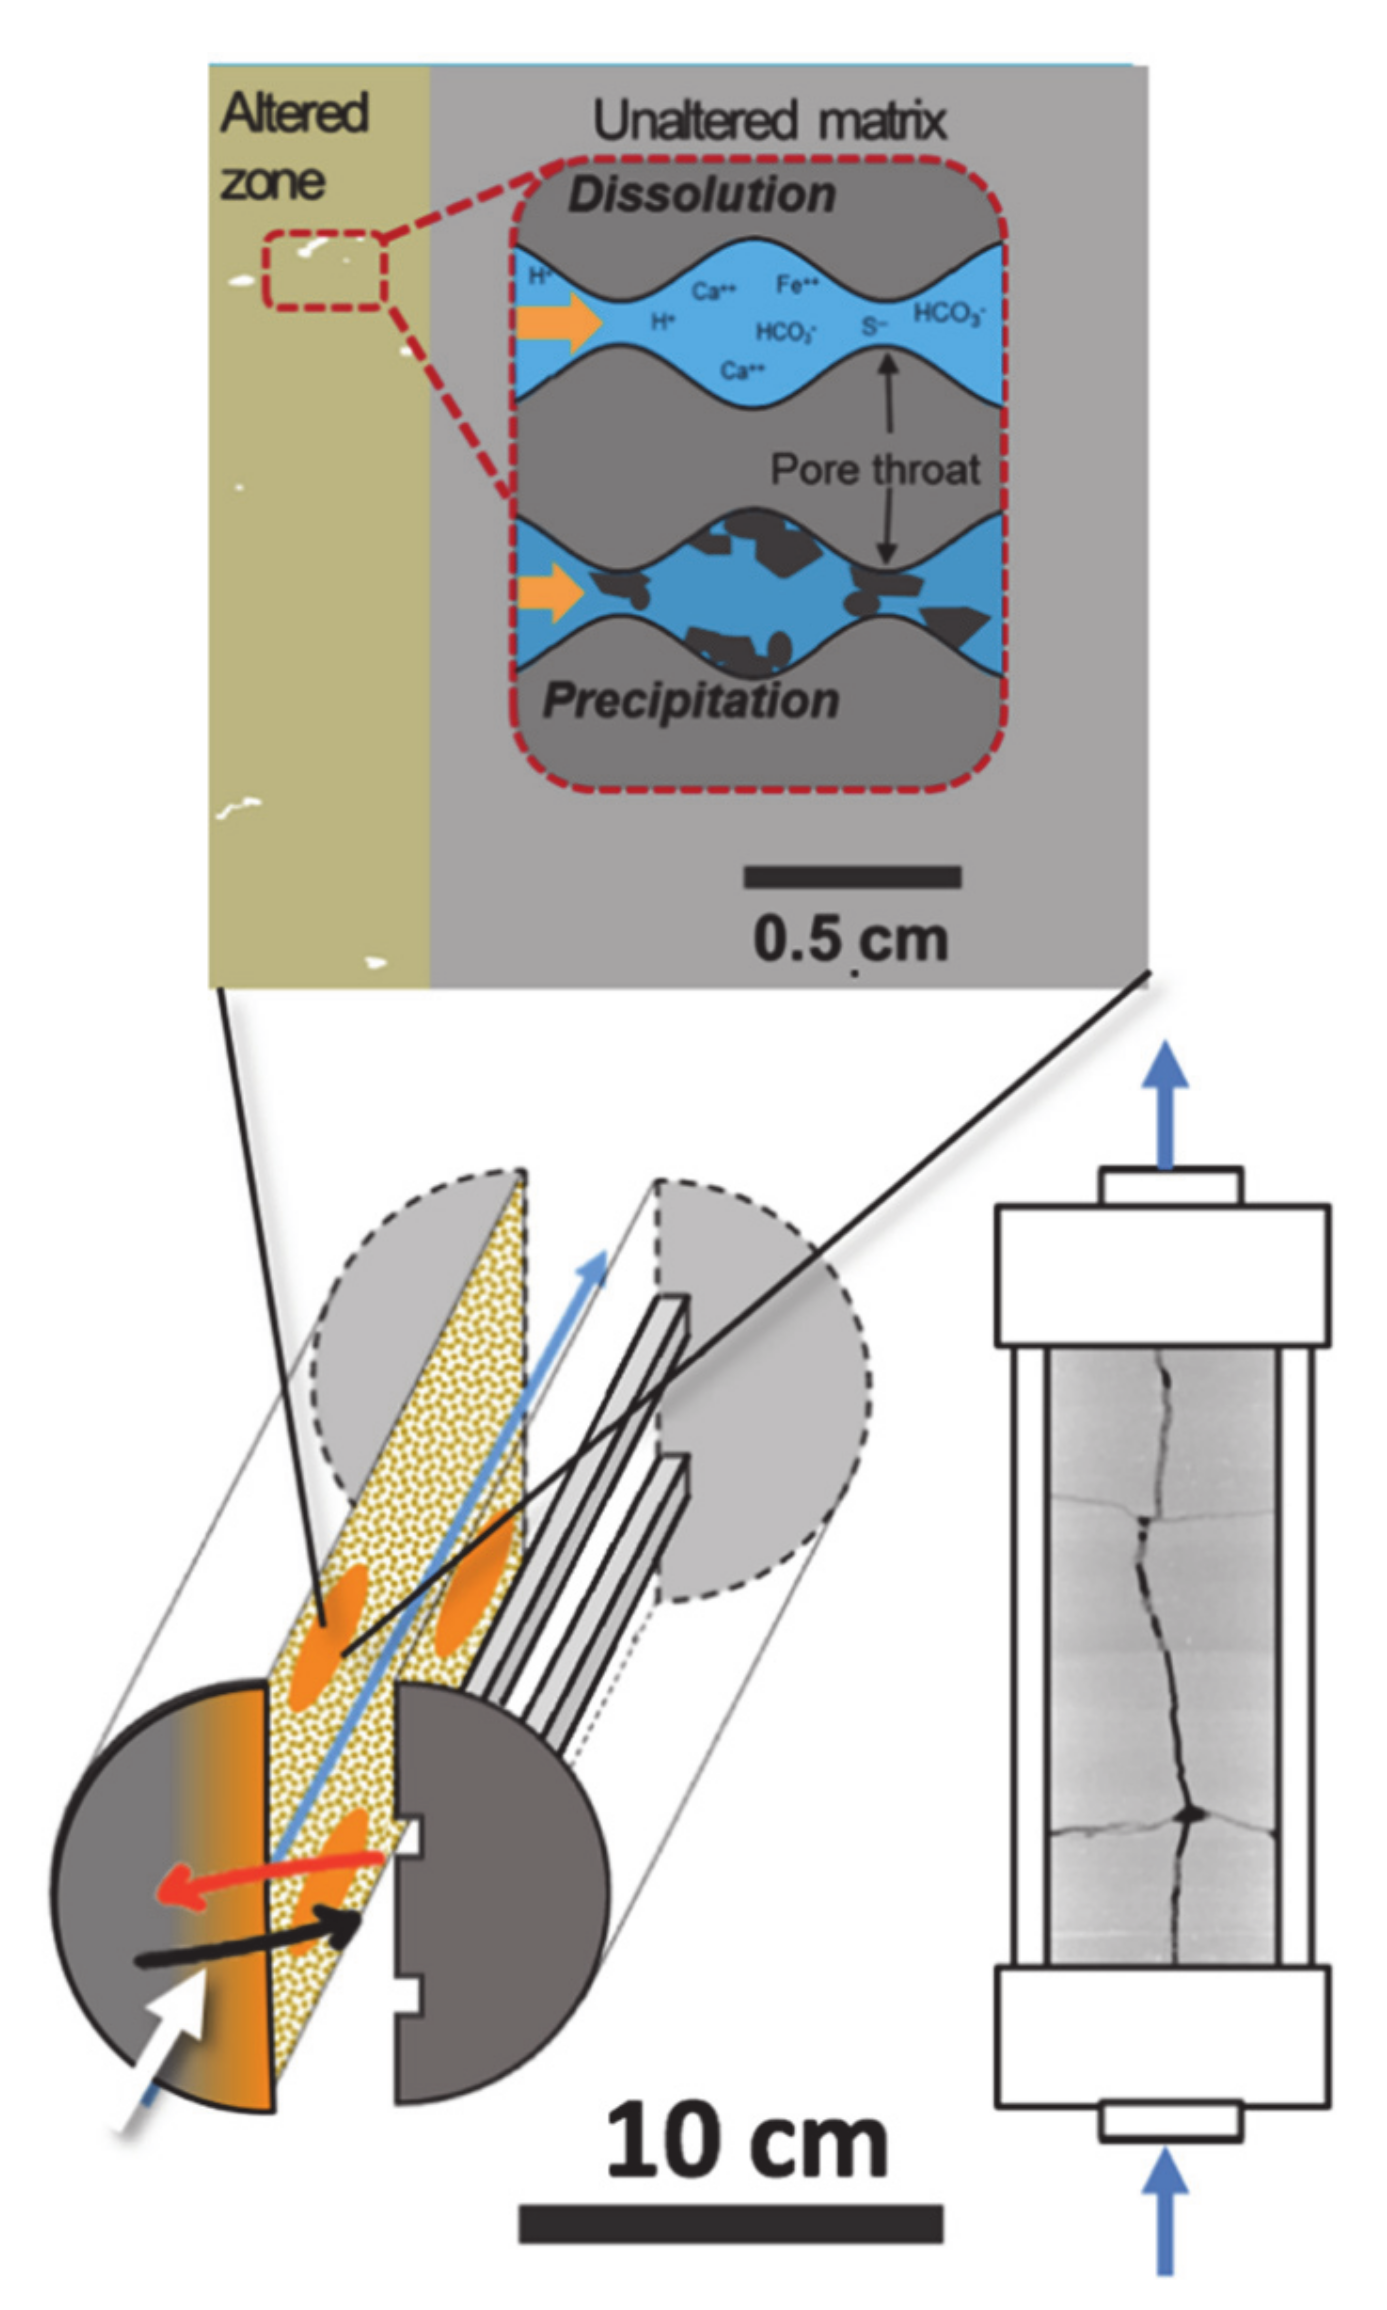
As shown in the schematic in Figure 15, two types of experiments are being conducted on Wolfcamp cores from the HFTS Project, chiefly: (1) flow-through reaction experiments in engineered fractures without and with proppants (using carved slots with controlled initial aperture) to explore the evolution in chemistry and fracture geometry over time in the presence of a range of fluids, (2) batch reaction experiments to investigate the development of a “skin” (i.e., altered zone) at the surface of the shale matrix due to fluid penetration and associated geochemical alteration of the matrix rock. The latter experiments are complemented by diffusion for various types of charged and uncharged solutes (cations, anions, and uncharged molecules) to understand transport controls on the rates of alteration reactions. Note that the experiments described here investigate the geochemical reactions of samples exposed to stimulation fluids during fracturing and shut-in periods, with the test duration mimicking standard hydraulic fracturing practice. What has not been evaluated, and will need to be done in future studies, is the potential importance of the reversibility of the chemical reactions and of their effects on the permeability in the vicinity of the fracture-matrix interface during the 3–5 year (minimum) production life of shale oil wells.
In order to optimize the experimental design and parameters to use to study controlled fractures in HFTS cores, we conducted preliminary investigations of flow through engineered fractures on Marcellus shale [44]. Figure 16 illustrates the design and results from these Marcellus core experiments. The fracture surfaces were prepared by milling small holes in regular patterns to mimic the impact of asperity contacts in real fractures in a controlled manner. Fracturing fluids were then injected into and through the fractures, with and without proppants, and careful characterization of the fracture surfaces was conducted before and after exposure using SEM and CT. Measurements of experimental permeability along pre- and post-reacted samples provided information on how flow pathways have been altered due to the observed chemical reactions. Utilizing a similar design, the research team is currently conducting flow-through experiments with a controlled geometry and modified fluid recipe representative of HFTS Wolfcamp fracturing operations. The observed changes of permeability between pre- and post-reacted samples will be used to derive permeability modifiers for reservoir-scale models.
The setup and preliminary results from batch reaction experiments at the surface of the shale matrix are shown in Figure 17 [45]. The goal of this work is two-fold: (1) to adapt an imaging methodology to simultaneously distinguish and monitor fluid flow, diffusion, and detailed mineral alteration over time in shale cores, and (2) to investigate the development of an altered zone (i.e., “skin”) due to fluid penetration and associated geochemical and permeability alteration of the matrix rock. The experiments were designed to directly image fluid imbibition with time using Br as a low-reactivity tracer, in order to monitor fluid intrusion of acidic hydraulic fracture fluid into shale cores and to link it to mineral alteration and chemical reactions. This study was conducted by using a time series of small (1 mm thick) samples exposed to stimulation fluid formulations. The Br low-reactivity tracer added to the fluid is readily imaged using synchrotron-based x-ray fluorescence mapping. Individual samples reacted for specified time intervals were imaged for the Br tracer along with other important elements (S, K, Na, Si, Fe, Ca, etc.) to evaluate alteration (dissolution/precipitation) of important minerals that will have an impact on rock porosity/permeability [45]. The previously described Br experiments involve multiple transport processes (pressure-driven advective, capillary imbibition, and diffusion). In order to quantify diffusion rates, it is necessary to use a tracer-based experimental method. This is accomplished by measuring breakthrough of Br through one-mm-thick slabs of Wolfcamp Shale that were fully saturated with solution prior to experimentation. Both of these Br tracer studies provide valuable information on both advective and diffusive movement in these unconventional shales which aid in computer simulations of both reactive transport modeling and reservoir flow modeling.

5.2.2. Reactive Transport Modeling

Complementing our experimental work are reactive transport simulations that predict altered pore geometries which in turn influence shale porosity, diffusivity, and permeability. This alteration of porosity, permeability, and diffusivity at the micro- to mesoscale (mm to cm) scale will affect permeability at the larger reservoir (Darcy) scale. Here we briefly describe diffusion-reaction modeling of selected experiments discussed above.
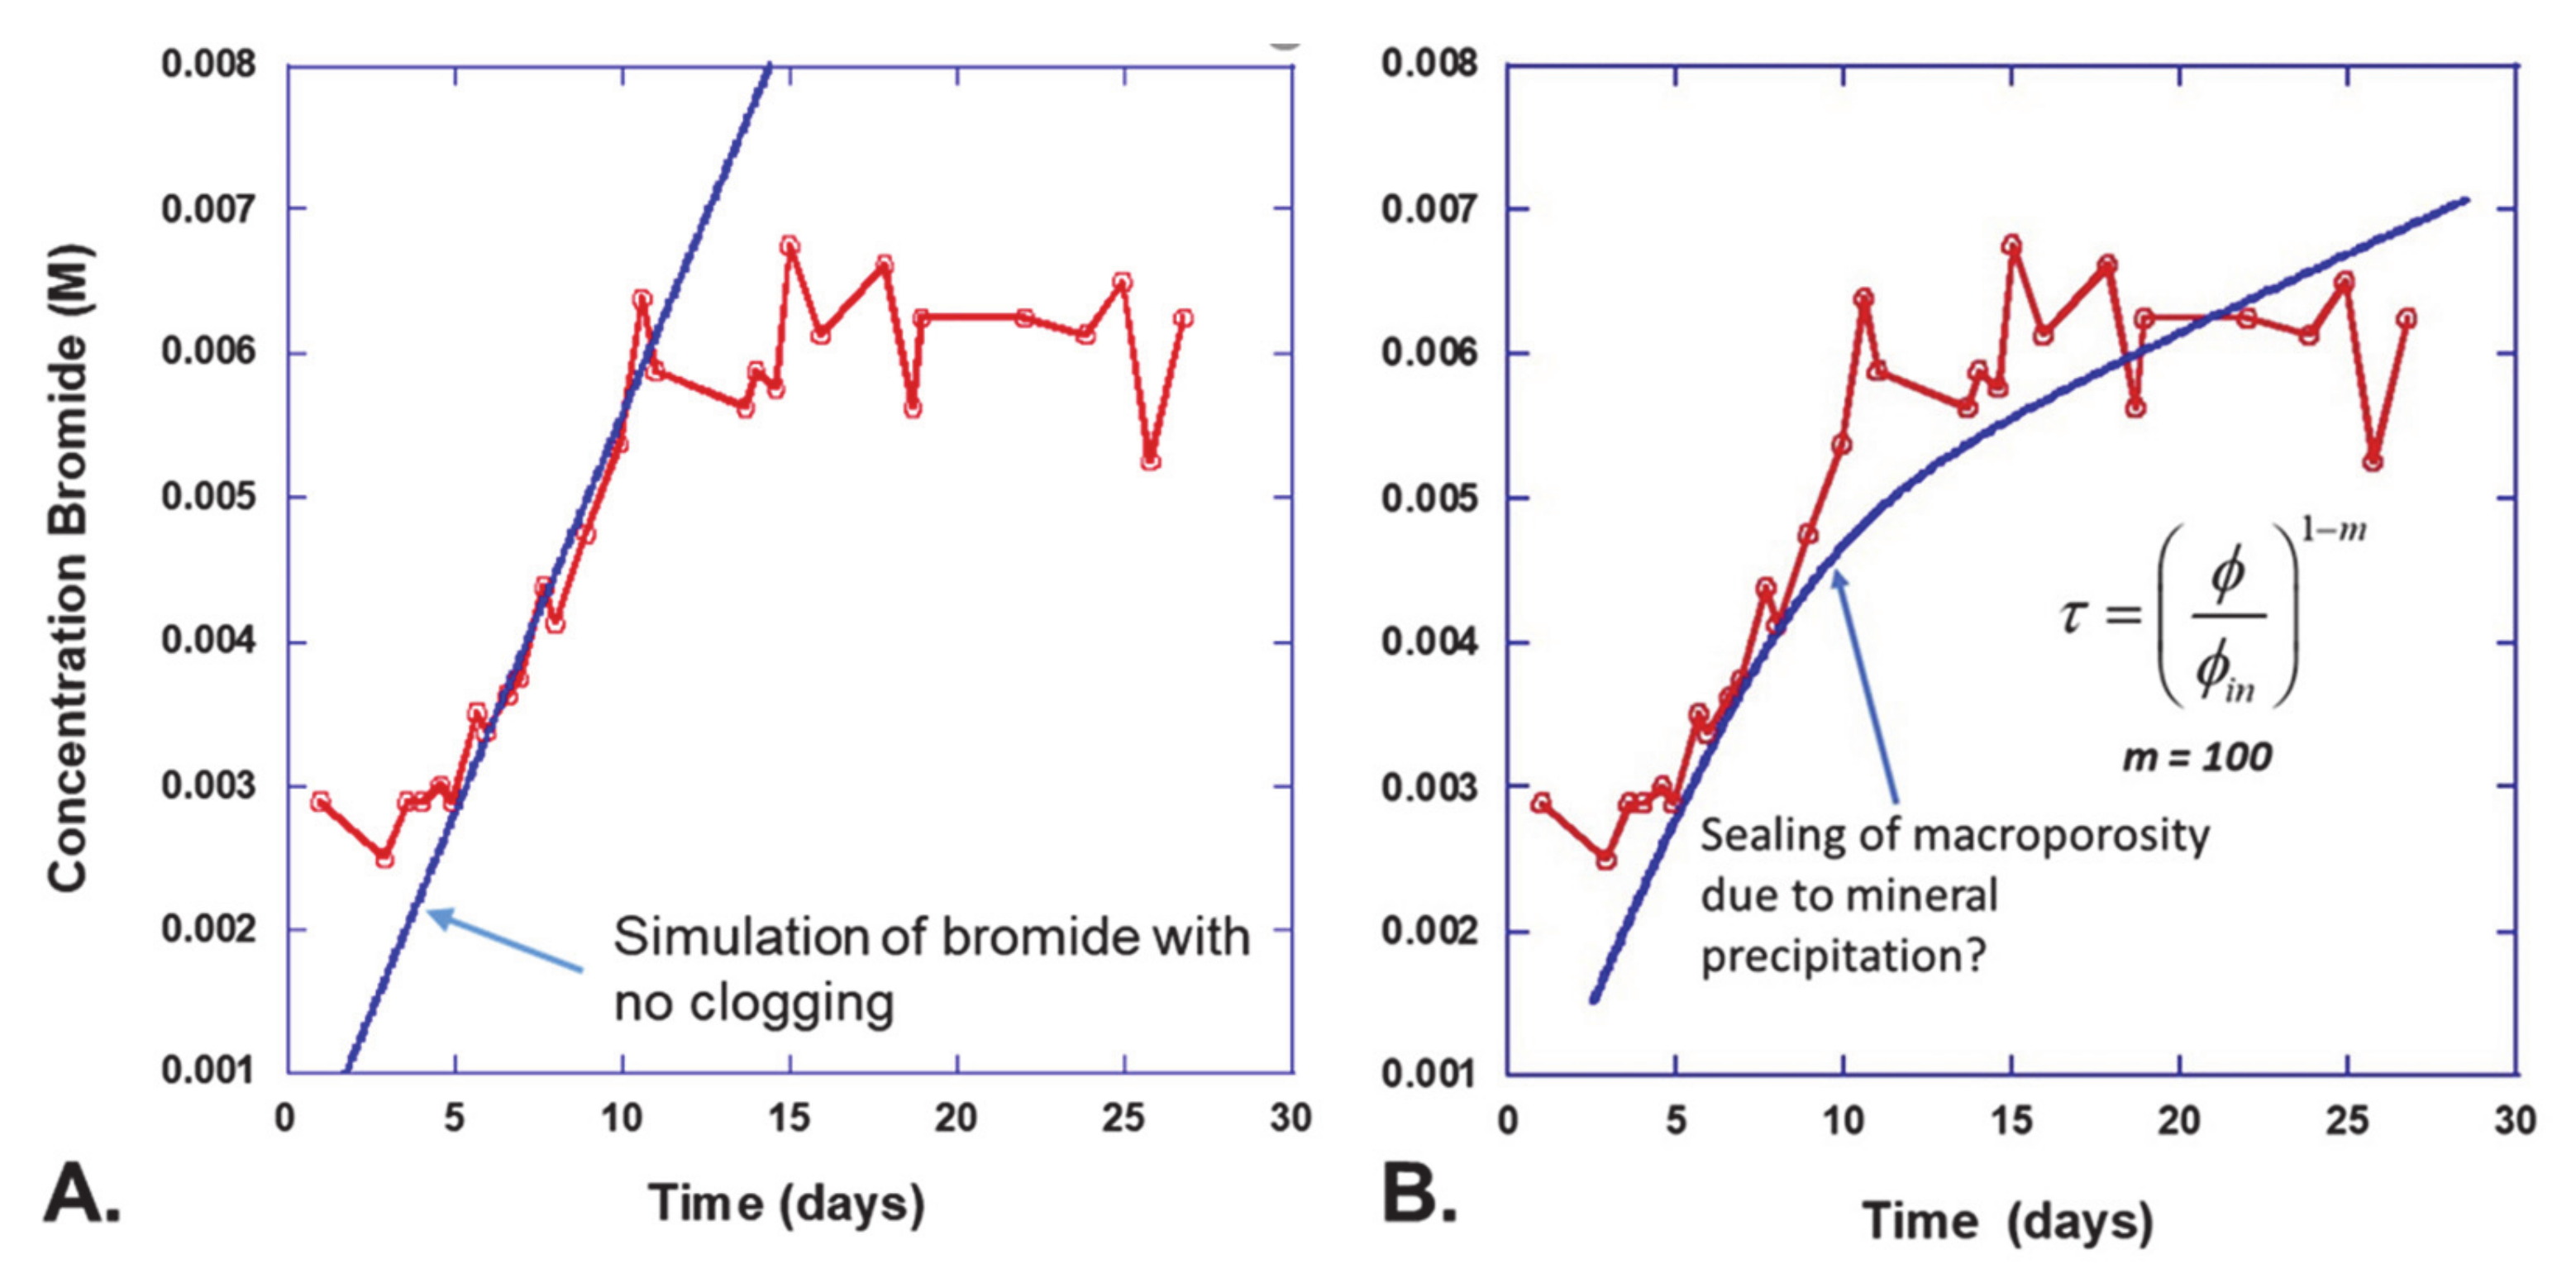
Results from diffusion-reaction modeling of the bromide tracer experiments are summarized in Figure 18. While designed nominally as a purely non-reactive tracer experiment, the low pH (4.5) of the solutions may have led to dissolution and subsequent re-precipitation in the experiments. Such effects could contribute to effective diffusivity reduction if the porosity is sufficiently reduced over a narrow front separated from the mineral dissolution front where the porosity has increased.
Figure 18A shows diffusion-reaction modeling of the shale reaction experiment described above, with no feedback with mineral dissolution and precipitation. The measured data show that an initial breakthrough of the Br tracer through the 1 mm shale sample begins < 1 week after the initiation of the experiment, but ceases after ~10 days (flattening of Br concentrations on the downstream side of shale). This suggests that mineral precipitation inhibits further diffusion through the sample. The modeling, in contrast, shows a linear increase in concentration assuming Fick’s Law applies, that is, the diffusion rate is proportional to the concentration gradient. A second set of simulations makes use of a dual continuum model that accounts separately for “bulk water porosity”, where the porewater is assumed electrically neutral, and “diffuse layer porosity”, where the pore water has a net positive charge that balances the fixed negative charge of the clays in the shale (Figure 18B). This approach, captured in the code CrunchClay [9,10], combines a Nernst-Planck treatment of diffusion in the pore water with the dual porosity approach in which cations accumulate in the diffuse layer while anions are suppressed. The dissolution and precipitation of iron hydroxide (goethite) results in a focused clogging of the pore space at about 0.15 mm from the low concentration end of the 1 mm shale sample, resulting in a cessation of diffusion at about 10 days.
Additional pore-scale reactive transport modeling was performed to investigate the impacts of precipitation on porosity and diffusivity in a general sense using CrunchFlow based on a pure Fickian diffusion model [46]. Figure 19 shows the simulation results and the fitted relationship between porosity and effective diffusivity under a range of precipitation scenarios (e.g., nucleation vs. surface growth). All the simulations showed significant decreases in the effective diffusivity for a small amount of porosity reduction, due to the clogging of pore throats and small pores by mineral precipitation. Such significant diffusivity reduction due to reactions is consistent with above experimental observations showing strong limitation of the diffusive flux. We are using these results to inform new diffusivity to porosity relationships that account for clogging of pores. Once the full parameter space has been explored, we can readily incorporate these relationships into the reservoir-scale production simulations described in Section 4.2.

6. Discussion and Conclusions

We have developed a new multi-scale simulation framework for unconventional stimulation and production. The framework comprises a seamless process for integrating the powerful geomechanical code for reservoir-scale stimulation (GEOS) with a high-performance multi-phase code for production (TOUGH+). To account for the impact of mechanical processes and chemical reactions occurring within individual fractures and at the fracture-shale interfaces, we have conducted micro-scale experimental and modeling studies and developed strategies to provide upscaled constitutive relationships for the reservoir scale models. We are currently testing the new modeling framework using field data and core samples from the HFTS, a recent field-based joint research experiment with intense monitoring of hydraulic fracturing and shale production in the Wolfcamp Formation in the Permian Basin, USA. Below is a brief summary of our findings to date:
  • Observations from the HFTS suggest a need for fundamental corrections to popular conceptual models of stimulation and production in unconventional reservoirs. Specifically, we have demonstrated that the presence of fracture swarms may help explain the reduced hydraulic fracture lengths observed via microseismic signals. Our proposed approach for addressing this phenomenon can readily be incorporated into existing simulators and reduce the need for ad hoc parametric fitting.
  • We have developed an automated procedure for TOUGH+ reservoir simulations based on GEOS fracture outputs. Preliminary production models for the HFTS suggest the importance of fracture/well interference and highlight other relevant sensitivities, such as the effect of near-fracture shale alterations (“skin” effect).
  • We conducted a series of experiments on micro- to meso-scale proppant behavior in unreacted and reacted HFTS core. Experimental analysis provides relationships between normalized conductivity in the propped fracture and the differential stress on the sample, which can be directly used as input to reservoir-scale simulations.
  • Fracture flow-through experiments were conducted to measure reactions effects in realistic fractures. Furthermore, we established procedures and pore-scale modeling analysis to investigate micro-scale shale alteration due to interactions with fracturing fluids. We are currently working on upscaling methods for micro-scale fracture and shale reactions that can be used in the field scale models for stimulation and production.
In future work, we will present a more quantitative evaluation of the multi-scale modeling framework in direct comparison with the full HFTS dataset. The application of our advanced computational tools describing pore- to reservoir-scale processes has two goals: (1) enhance the utilization and integration of HFTS results, and (2) use the HFTS field data and focused laboratory experiments on HFTS core samples to validate and improve the computational tools. However, given its focus on fundamental properties and upscaling workflows, we expect the impact of this work to go far beyond the specific HFTS application: the new modeling framework can be used to provide a better predictive understanding of stimulation and production processes in various unconventional oil and gas projects. The validated simulation workflow provides a physics-based predictive tool to guide the optimization of operational parameters (for example, fracturing stage design, fracturing fluid viscosity and pumping rate), aimed at increased productivity, decreased cost and minimization of environmental impacts. Using these high-fidelity simulations for a range of unconventional plays and conditions will also provide a suite of ground-truth predictions that can be used to train advanced machine learning approaches for basin-specific stimulation and production behavior.

Author Contributions

J.T.B., J.M. (J. Morris), J.R.B., and A.H. conceptualized and supervised the study, developed the overall methodology, and also worked on funding acquisition. J.M. (J. Morris), P.F., W.F. (W. Fan), Y.H., J.H., C.S.S., and R.S. conducted the reservoir-scale hydraulic fracturing simulations. M.R., G.M., and Z.L. performed the reservoir-scale production simulations. T.K., S.N., and M.V. performed the micro-mechanical laboratory studies and upscaling of results. J.R.B., F.B., W.F. (W. Fu), A.D.J., V.N., D.C., J.M. (J. Moore), A.H., C.L., and W.X. conducted the various micro-reaction experiments. H.D., C.S., and A.C. performed the micro-scale reactive transport simulations to evaluate experimental results and develop upscaling methods. J.C. provided information on the HFTS field experiments and related data. All authors supported writing, draft preparations, and manuscript review. All authors have read and agreed to the published version of the manuscript.

Funding

Funding for this work was provided by the U.S. Department of Energy’s Office of Fossil Energy, Office of Oil and Natural Gas.

Institutional Review Board Statement

Not applicable.

Informed Consent Statement

Not applicable.

Data Availability Statement

Not applicable.

Acknowledgments

This work was performed under the auspices of the U.S. Department of Energy by Lawrence Berkeley National Laboratory under Award Number DE-AC02-05CH11231, by Lawrence Livermore National Laboratory under Contract DE-AC52-07NA27344, by the National Energy Technology Laboratory under the Onshore Unconventional Resources Field Work Proposal (1022415), and by the SLAC National Accelerator Laboratory under contract DE-AC02-76SF00515. SLAC would like to thank Guangchao Li of the Stanford Environmental Measurements Laboratory 1 for help with collection of solution data and Sam Webb and Sharon Bone of the Stanford Synchrotron Radiation Lightsource (SSRL) Beamline 2–3 with help in collecting the multiple element X-ray fluorescence images. SSRL is a national user facility supported by the DOE Office of Science, Office of Basic Energy Sciences. The authors are grateful for the financial support provided by the U.S. Department of Energy’s Office of Fossil Energy, Office of Oil and Natural Gas.

Conflicts of Interest

The authors declare no conflict of interest.

References

  1. McClure, M.; Picone, M.; Fowler, G.; Ratcliff, D.; Kang, C.; Medam, S.; Frantz, J. Nuances and frequently asked questions in field-scale hydraulic fracture modeling. In Proceedings of the SPE Hydraulic Fracturing Technology Conference and Exhibition, The Woodlands, TX, USA, 4–6 February 2020. SPE-199726-MS. [Google Scholar] [CrossRef]
  2. Kempka, T.; Class, H.; Görke, U.-J.; Norden, B.; Kolditz, O.; Kühn, M.; Walter, L.; Wang, W.; Zehner, B. A Dynamic Flow Simulation Code Intercomparison based on the Revised Static Model of the Ketzin Pilot Site. Energy Procedia 2013, 40, 418–427. [Google Scholar] [CrossRef] [Green Version]
  3. CMG. STARS User Guide; Computer Modeling Group LTD: Calgary, AB, Canada, 2018. [Google Scholar]
  4. Settgast, R.R.; Fu, P.; Walsh, S.D.; White, J.A.; Annavarapu, C.; Ryerson, F.J. A fully coupled method for massively parallel simulation of hydraulically driven fractures in 3-dimensions. Int. J. Numer. Anal. Methods Géoméch. 2016, 41, 627–653. [Google Scholar] [CrossRef]
  5. Moridis, G.J.; Pruess, P. User manual of the TOUGH+ v1.5 core code: A general purpose simulator of non-isothermal flow and transport through porous and fractured media. In Lawrence Berkeley National Laboratory Report LBNL-6869E; Lawrence Berkeley National Laboratory: Berkeley, CA, USA, 2014. [Google Scholar]
  6. Voltolini, M.; Ajo-Franklin, J. Evolution of propped fractures in shales: The microscale controlling factors as revealed by in situ X-Ray microtomography. J. Pet. Sci. Eng. 2020, 188, 106861. [Google Scholar] [CrossRef]
  7. Hakala, J.A.; Crandall, D.; Moore, J.; Phan, T.T.; Sharma, S.; Lopano, C.L. Laboratory-scale studies on chemical reactions between fracturing fluid and shale core from the Marcellus Shale Energy and Environmental Laboratory (MSEEL) site. In Proceedings of the Unconventional Resources Technology Conference, Austin, TX, USA, 24–26 July 2017. [Google Scholar]
  8. Li, Q.; Jew, A.D.; Kohli, A.; Maher, K.; Brown, J.G.E.; Bargar, J. Thicknesses of Chemically Altered Zones in Shale Matrices Resulting from Interactions with Hydraulic Fracturing Fluid. Energy Fuels 2019, 33, 6878–6889. [Google Scholar] [CrossRef]
  9. Tournassat, C.; Steefel, C.I. Modeling diffusion processes in the presence of a diffuse layer at charged mineral surfaces: A benchmark exercise. Comput. Geosci. 2019, 1–18. [Google Scholar] [CrossRef] [Green Version]
  10. Steefel, C.I.; Tournassat, C. A model for discrete fracture-clay rock interaction incorporating electrostatic effects on transport. Comput. Geosci. 2021, 25, 395–410. [Google Scholar] [CrossRef]
  11. Adachi, J.; Siebrits, E.; Peirce, A.; Desroches, J. Computer simulation of hydraulic fractures. Int. J. Rock Mech. Min. Sci. 2007, 44, 739–757. [Google Scholar] [CrossRef]
  12. Lecampion, B.; Bunger, A.; Zhang, X. Numerical methods for hydraulic fracture propagation: A review of recent trends. J. Nat. Gas Sci. Eng. 2018, 49, 66–83. [Google Scholar] [CrossRef] [Green Version]
  13. Voltolini, M.; Kwon, T.-H.; Ajo-Franklin, J. Visualization and prediction of supercritical CO2 distribution in sandstones during drainage: An in situ synchrotron X-ray micro-computed tomography study. Int. J. Greenh. Gas Control. 2017, 66, 230–245. [Google Scholar] [CrossRef]
  14. Vankeuren, A.N.P.; Hakala, J.A.; Jarvis, K.; Moore, J.E. Mineral Reactions in Shale Gas Reservoirs: Barite Scale Formation from Reusing Produced Water As Hydraulic Fracturing Fluid. Environ. Sci. Technol. 2017, 51, 9391–9402. [Google Scholar] [CrossRef]
  15. Moore, J.; Hakala, A.; Lopano, C.; Xiong, W.; Phan, T.; Paukert Vankeuren, A.; Sharma, S.; Pilewski, J.; Jarvis, K.; Brown, S.; et al. Bench-top experiment evaluating simulated hydraulic fracturing fluid interactions with Marcellus Shale core. In Proceedings of the Unconventional Resources Technology Conference, Houston, TX, USA, 23–25 July 2018; p. 2901634. [Google Scholar]
  16. Marcon, V.; Joseph, C.; Carter, K.E.; Hedges, S.W.; Lopano, C.L.; Guthrie, G.D.; Hakala, J.A. Experimental insights into geochemical changes in hydraulically fractured Marcellus Shale. Appl. Geochem. 2017, 76, 36–50. [Google Scholar] [CrossRef]
  17. Harrison, A.L.; Jew, A.D.; Dustin, M.K.; Thomas, D.L.; Joe-Wong, C.; Bargar, J.R.; Johnson, N.; Brown, G.E.; Maher, K. Element release and reaction-induced porosity alteration during shale-hydraulic fracturing fluid interactions. Appl. Geochem. 2017, 82, 47–62. [Google Scholar] [CrossRef]
  18. Jew, A.D.; Dustin, M.K.; Harrison, A.L.; Joe-Wong, C.; Thomas, D.L.; Maher, K.; Brown, G.E.; Bargar, J. Impact of Organics and Carbonates on the Oxidation and Precipitation of Iron during Hydraulic Fracturing of Shale. Energy Fuels 2017, 31, 3643–3658. [Google Scholar] [CrossRef] [Green Version]
  19. Jew, A.D.; Harrison, A.L.; Dustin, M.K.; Joe-Wong, C.M.; Thomas, D.L.; Maher, K.; Brown, G.E., Jr.; Cercone, D.; Bargar, J.R. Mineralogical changes that control pore-scale shale-gas properties. In Proceedings of the Unconventional Resources Technology Conference, Austin, TX, USA, 24–26 July 2017. URTeC: 2708858. [Google Scholar]
  20. Li, Q.; Jew, A.D.; Kiss, A.M.; Kohli, A.; Alalli, A.; Kovscek, A.R.; Zoback, M.D.; Cercone, D.; Maher, K.; Brown, G.E., Jr.; et al. Imaging pyrite oxidation and barite precipitation in gas and oil shales. In Proceedings of the Unconventional Resources Technology Conference, Houston, TX, USA, 23–25 July 2018. [Google Scholar]
  21. Jew, A.D.; Li, Q.; Cercone, D.; Maher, K.; Brown, G.E., Jr.; Bargar, J.R. Barium sources in hydraulic fracturing systems and chemical controls on its release into solution. In Proceedings of the Unconventional Resources Technology Conference, Houston, TX, USA, 23–25 July 2018. URTeC: 2899671. [Google Scholar]
  22. Jew, A.D.; Bargar, J.R.; Brownlow, J.; Laughlan, M. Strontium behavior in Midland Basin unconventional reservoirs: The importance of base fluids. In Proceedings of the Unconventional Resources Technology Conference, Austin, TX, USA, 20–22 July 2020. URTeC: 3016. [Google Scholar]
  23. Alalli, A.; Li, Q.; Jew, A.; Kohli, A.; Bargar, J.; Zoback, M.; Kovscek, A. Effects of hydraulic fracturing fluid chemistry on shale matrix permeability. In Proceedings of the Unconventional Resources Technology Conference, Houston, TX, USA, 23–25 July 2018. URTeC: 2881314. [Google Scholar]
  24. Ciezobka, J.; Courtier, J.; Wicker, J. Hydraulic Fracturing Test Site (HFTS)—Project overview and summary of results. In Proceedings of the Unconventional Resources Technology Conference, Austin, TX, USA, 23–25 July 2018. [Google Scholar]
  25. Weijermars, R.; Nandlal, K.; Tugan, M.F.; Dusterhoft, R.; Stegent, N. Wolfcamp Hydraulic Fracture Test Site drained rock volume and recovery factors visualized by scaled complex analysis method (CAM): Emulating multiple data sources (production rates, water cut, pressure gages, flow regime changes, sand b-sigmolds). In Proceedings of the Unconventional Resources Technology Conference, Austin, TX, USA, 20–22 July 2020. [Google Scholar]
  26. Salahshoor, S.; Maity, D.; Ciezobka, J. Stage-level data integration to evaluate the fracturing behavior of horizontal wells at the Hydraulic Fracturing Test Site (HFTS): An insight into the production performance. In Proceedings of the Unconventional Resources Technology Conference, Austin, TX, USA, 20–22 July 2020. [Google Scholar]
  27. Sherman, C.S.; Mellors, R.; Morris, J.P.; Ryerson, F.J. Geomechanical modeling of distributed fiber-optic sensor measurements. Interpretation 2019, 7, SA21–SA27. [Google Scholar] [CrossRef]
  28. Sherman, C.S.; Morris, J.P.; Fu, P.; Settgast, R.R. Recovering the microseismic response from a geomechanical simulation. Geophys. 2019, 84, KS133–KS142. [Google Scholar] [CrossRef]
  29. Iyer, J.; Walsh, S.D.; Hao, Y.; Carroll, S. Assessment of two-phase flow on the chemical alteration and sealing of leakage pathways in cemented wellbores. Int. J. Greenh. Gas Control. 2018, 69, 72–80. [Google Scholar] [CrossRef]
  30. Hao, Y.; Settgast, R.R.; Tompson, A.F.B.; Fu, P.; Morris, J.P.; Ryerson, F.J. The effect of fracture-matrix interactions on multiphase flow in fractured reservoirs—Development of a discrete fracture model. In Proceedings of the XXI International Conference on Computational Meth-ods in Water Resources, CMWR 2016, Toronto, ON, Canada, 20–24 June 2016. [Google Scholar]
  31. Hao, Y.; Settgast, R.R.; Tompson, A.F.B.; Fu, P.; Morris, J.P.; Ryerson, F.J. Discrete fracture modeling of multiphase flow and hydro-carbon production in fractured shale or low permeability reservoirs. In Proceedings of the American Geophysical Union Fall Meeting, San Francisco, CA, USA, 12–16 December 2016. [Google Scholar]
  32. Hao, Y.; Settgast, R.R.; Tompson, A.F.B.; Ryerson, F.J. Numerical evaluation of multiphase flow processes and their effects on hy-drocarbon production in hydraulically fractured reservoirs. In Proceedings of the 9th International Conference on Porous Media & Annual Meeting, Rotterdam, The Netherlands, 8–11 May 2017. [Google Scholar]
  33. Zhang, K.; Moridis, G.J. A Domain decomposition approach for large-scale simulations of coupled processes in hydrate-bearing geologic media. In Proceedings of the 6th International Conference on Gas Hydrates, Vancouver, BC, Canada, 6–10 July 2008. [Google Scholar]
  34. Huang, J.; Morris, J.P.; Fu, P.; Settgast, R.R.; Sherman, C.S.; Ryerson, F.J. Hydraulic-Fracture-Height Growth Under the Combined Influence of Stress Barriers and Natural Fractures. SPE J. 2019, 24, 302–318. [Google Scholar] [CrossRef]
  35. Kim, J.; Moridis, G.J. Gas Flow Tightly Coupled to Elastoplastic Geomechanics for Tight and Shale Gas Reservoirs: Material Failure and Enhanced Permeability. SPE Am. Unconv. Resour. Conf. 2012, 19, 1100–1125. [Google Scholar] [CrossRef] [Green Version]
  36. Kim, J.; Um, E.S.; Moridis, G. Integrated simulation of vertical fracture propagation induced by water injection and its borehole electromagnetic responses in shale gas systems. J. Pet. Sci. Eng. 2018, 165, 13–27. [Google Scholar] [CrossRef]
  37. Courtier, J.; Chandler, K.; Gray, D.; Martin, S.; Thomas, R.; Wicker, J.; Petroleum, L.; Ciezobka, J. Best practices in designing and executing a comprehensive Hydraulic Fracturing Test Site in the Permian Basin. In Proceedings of the Unconventional Resources Technology Conference, Austin, TX, USA, 24–26 July 2017. [Google Scholar]
  38. Stegent, N.; Candler, C. Downhole microseismic mapping of more than 400 fracturing stages on a multiwell pad at the Hydraulic Fracturing Test Site (HFTS): Discussion of operational challenges and analytic results. In Proceedings of the Unconventional Resources Technology Conference, Houston, TX, USA, 23–25 July 2018. URTeC: 2902311. [Google Scholar]
  39. Raterman, K.T.; Farell, H.E.; Mora, O.S.; Janssen, A.L.; Gomez, G.A.; Busetti, S.; McEwen, J.; Davidson, M.; Rutherford, R.; Reid, G.J.; et al. Sampling a stimulated rock volume: An Eagle Ford Example. In Proceedings of the Unconventional Resources Technology Conference, Austin, TX, USA, 20–22 July 2020. URTeC: 2670034. [Google Scholar]
  40. Gale, J.F.W.; Elliott, S.J.; Laubach, S.E. Hydraulic fractures in core from stimulated reservoirs: Core fracture description of HFTS slant core. In Proceedings of the Unconventional Resources Technology Conference, Midland Basin, TX, USA, 23–25 July 2018. URTeC: 2902624. [Google Scholar]
  41. Fu, W.; Morris, J.P.; Fu, P.; Huang, J.; Sherman, C.S.; Settgast, R.R.; Wu, H.; Ryerson, F.J. Developing upscaling approach for swarming hydraulic fractures observed at Hydraulic Fracturing Test Site through multiscale simulations. In Proceedings of the SPE Hydraulic Fracturing Technology Conference and Exhibition, The Woodlands, TX, USA, 4–6 February 2020. SPE-199689-MS. [Google Scholar]
  42. Olorode, O.M.; Freeman, C.M.; Moridis, G.; Blasingame, T. High-Resolution Numerical Modeling of Complex and Irregular Fracture Patterns in Shale-Gas Reservoirs and Tight Gas Reservoirs. SPE Reserv. Eval. Eng. 2013, 16, 443–455. [Google Scholar] [CrossRef]
  43. Nakagawa, S.; Borglin, S.E. Laboratory In-Situ Visualization of long-term fracture closure and proppant embedment in brittle and ductile shale samples. In Proceedings of the 53rd US Rock Mechanics/Geomechanics Symposium, New York, NY, USA, 23–26 June 2019. ARMA 19–1996. [Google Scholar]
  44. Xiong, W.; Gill, M.; Moore, J.; Crandall, D.; Hakala, J.A.; Lopano, C. Influence of reactive flow conditions on barite scaling in Marcellus Shale during stimulation and shut-in period of hydraulic fracturing. Energy Fuels 2020, 34, 13625–13635. [Google Scholar] [CrossRef]
  45. Noël, V.; Spielman-Sun, E.; Druhan, J.L.; Fan, W.; Jew, A.D.; Kovscek, A.R.; Brown, G.E., Jr.; Bargar, J.R. Synchrotron X-ray imaging of element transport resulting from unconventional stimulation. In Proceedings of the Unconventional Resources Technology Conference, Austin, TX, USA, 20–22 July 2020. URTeC: 3295. [Google Scholar]
  46. Steefel, C.I.; Appelo, C.A.J.; Arora, B.; Jacques, D.; Kalbacher, T.; Kolditz, K.; Lagneau, V.; Lichtner, P.C.; Mayer, K.U.; Meeussen, J.C.L.; et al. Reactive transport codes for subsurface environmental simulation. Comput. Geosci. 2015, 19, 445–478. [Google Scholar] [CrossRef] [Green Version]
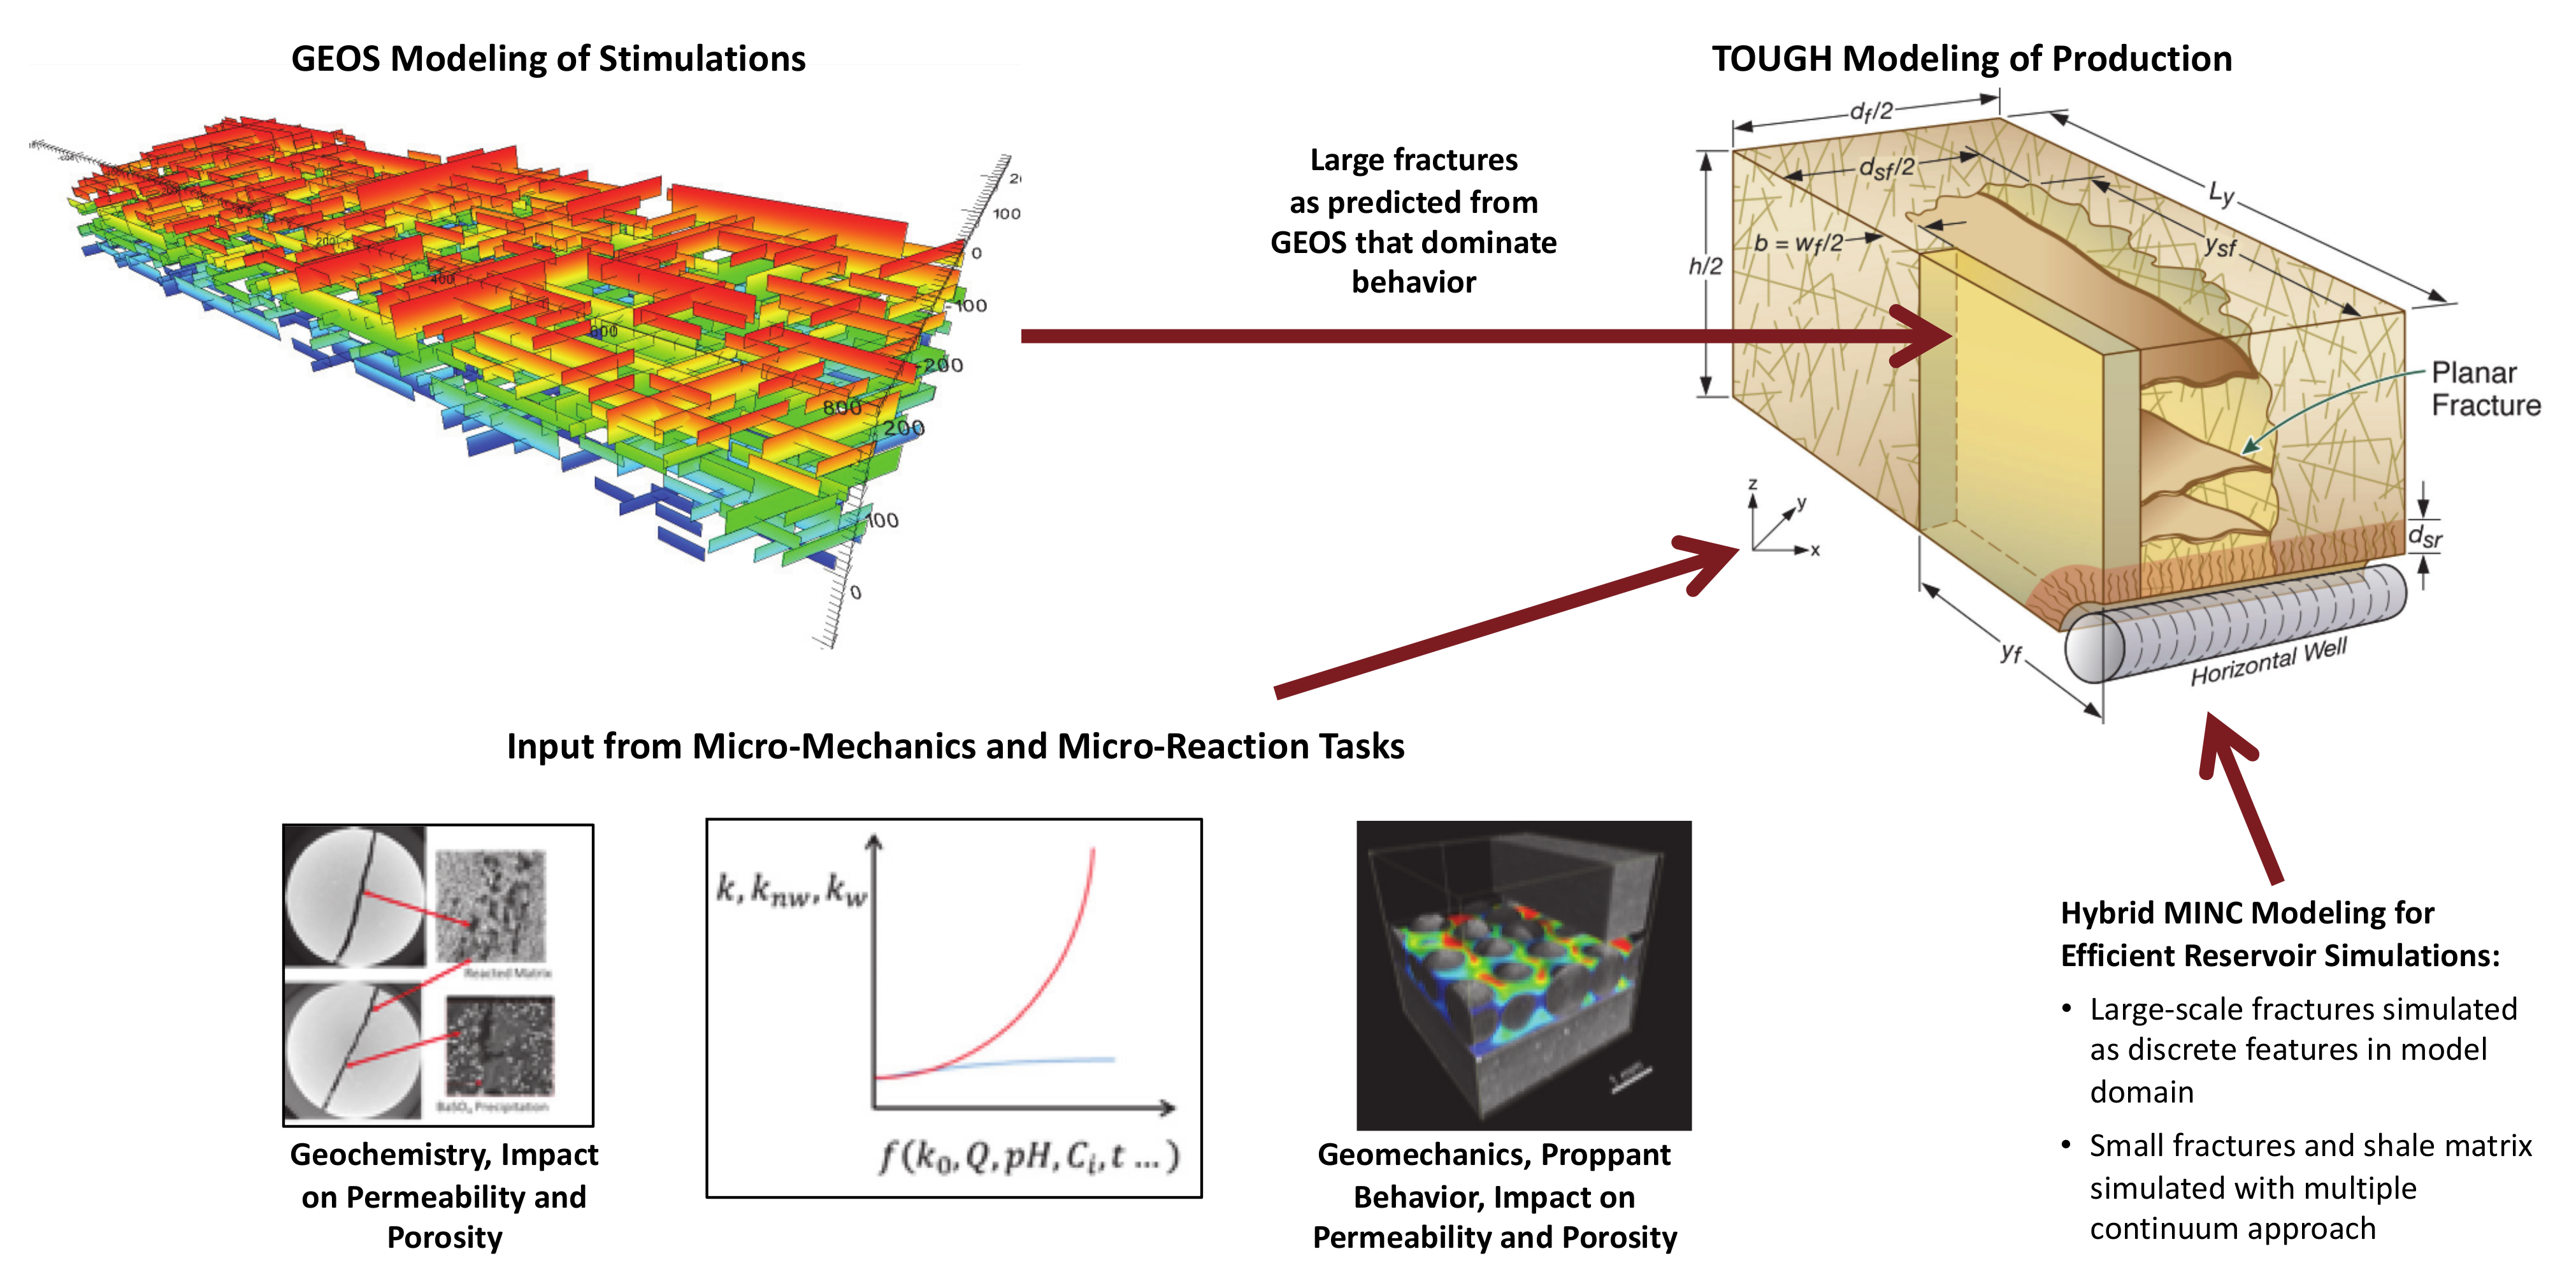
Figure 1. Schematic showing the framework for reservoir-scale stimulation and production simulations informed by micro-scale processes.
Energies 14 00641 g001
Figure 2. Example of fracture meshing and refinement based on GEOS-derived aperture.
Energies 14 00641 g002
Figure 3. Left—Map showing the location of the HFTS experiment in the Permian Basin. Right—Details of the HFTS (from [26]).
Energies 14 00641 g003
Figure 4. (A) Depiction of the continuous core sections collected adjacent to the stimulated producing Upper Wolfcamp well. (B) Example of a whole core interval. Hydraulic fracture shown in right panel. (C) Examples of a hydraulic fractures cutting a natural fracture captured in the core (from [24]).
Energies 14 00641 g004
Figure 5. Tightly-spaced hydraulic fractures observed at the HFTS. Top: 3-ft long core-back sample containing eight parallel/sub-parallel hydraulic fractures. Bottom: CT scan image of the corresponding core sample. More details may be found in [26].
Energies 14 00641 g005
Figure 6. GEOS simulation results and microseismic data. (a) Fracture aperture and minimum horizontal stress distributions; (b) simulated fracture geometry and aperture, front view; (c) fracture extent indicated by microseismic event distributions.
Energies 14 00641 g006
Figure 7. Simulation stencil representing a single fracture in a single stage along the production well. Note the plane of symmetry at the fracture face (this is a ½-space problem). No-flow boundaries at the left and right edges imply that the well is part of a series of parallel wells with spacing Xmax.
Energies 14 00641 g007
Figure 8. Propped aperture for the 3rd of the 5 hydraulic fractures shown in Figure 6.
Energies 14 00641 g008
Figure 9. Pressure in the 3rd hydraulic fracture at 1000 days. Aperture in the fracture is the same as that shown in Figure 8 (GEOS-full).
Energies 14 00641 g009
Figure 10. Pressure in the 3rd hydraulic fracture at 1000 days. The aperture of the fracture is homogeneous (GEOS-mean).
Energies 14 00641 g010
Figure 11. Cumulative oil (a) and gas (b) production for the three representations of the upscaled fracture.
Energies 14 00641 g011
Figure 12. A Si-Nitride sphere is used to indent an oil shale sample (bedding is vertical) to observe the response of the sample. Two orthogonal views are shown. The Z (i.e., vertical) displacement field obtained via DVC has been overlaid in color. The strongly anisotropic damage zone following the sample fabric is evident. The DVC volumes were calculated after the first fracturing event (parallel to the bedding) during the loading of the sample.
Energies 14 00641 g012
Figure 13. In situ SXRmCT forced closure of propped fracture by increasing the differential stress of the system: a shale sample with a single fracture filled with quartz proppant is measured in a mini-triaxial cell while increasing the stress perpendicular to the fracture plane, in increments. From the tomographic datasets (rendered in gray) Stokes flow simulations are run to calculate the velocity flow fields (rendered in colors) and the fracture conductivity at the different stages ((a): starting point, (b): maximum applied stress). Coupling imaging and modeling allows to understand the role of the different mechanisms involved in the loss of conductivity during the closure process (c).
Energies 14 00641 g013
Figure 14. A long-term proppant embedment experiment on a surface of a clay-rich Wolfcamp Shale sample from the HFTS. A lab system which was designed specifically for in-situ optical visualization (a). The experiment was conducted at a temperature of 120°C and an effective stress of 27 MPa, with a monolayer of quartz proppant covering ~50% of a 44-mm diameter sample. In spite of a relatively high clay content in the sample, severe proppant crushing (b) and some embedment due to shale matrix deformation (c) were observed. The experiment was continued over 2 weeks, and the time-dependent deformation of the fracture was monitored (d).
Energies 14 00641 g014
Figure 15. Schematic showing the two types of reaction experiments conducted on Wolfcamp Shale from the HFTS Project, with flow-through reaction experiments in fracture at the bottom and batch reaction experiments on shale surfaces at the top.
Energies 14 00641 g015
Figure 16. Example with Marcellus Shale of the experimental design for simulating flow through fractured shale [44]. Similar controlled geometry studies are being examined with HFTS Wolfcamp samples as part of this multi-laboratory study.
Energies 14 00641 g016
Figure 17. X-ray mapping of a low-reactivity Br tracer added in the frac fluid to map fluid penetration and gain insights about ion transport and chemical reactions occurring in shale. The inset at the top shows a core slice that was imaged using this method. The imaged sections show heat maps of the estimated mass of bromide in each pixel. After 5 min, fluid has penetrated about 300 µm. After 7 days, the fluid has imbibed throughout the core and has accumulated near the fracture face.
Energies 14 00641 g017
Figure 18. Time evolution of bromide concentration in low concentration distal reservoir. Red lines with circular symbols indicate experimental data. Blue line shows simulation results. (A) single porosity simulation without clogging, (B) dual porosity simulation with clogging in the bulk porosity, while diffusion can continue in the diffuse layer porosity. The system starts sealing at about 10 days, resulting in a flattening of the concentration profile.
Energies 14 00641 g018
Figure 19. Pore-scale simulation results (data points) illustrating changes in the porosity-effective diffusivity relationship (fitted solid lines) as a result of mineral precipitation under different precipitation scenarios (black, blue and red are nucleation scenario with varied surface area and kinetic rate; green and magenta are the surface growth scenario with different kinetic rates).
Energies 14 00641 g019
Table 1. Parameters used for production simulation.
ParameterValue
Domain dimension (x, y, z) [m] 708 × 96 × 184
Grid resolution (x, y, z) [m] 6.0 × v a r i a b l e × 4.0
Total fracture area (Rectangular) [m2] 2.22 × 10 5
Total fracture area (GEOS) [m2] 2.223 × 10 5
Matrix permeability [nD, 10−21 m2]100.0
Matrix porosity [-]0.07
Fracture porosity [-]0.95
Bottomhole pressure [MPa]5.5
Bottomhole temperature [°C]65.0
Initial reservoir pressure [MPa]21.5
Initial reservoir temperature [°C]65.0
Initial reservoir oil saturation [-]0.55
Initial reservoir gas-oil ratio [SCF/STB]600
Publisher’s Note: MDPI stays neutral with regard to jurisdictional claims in published maps and institutional affiliations.