Article

Phase Shifting Transformer Electromagnetic Model Dedicated for Power System Protection Testing in a Transient Condition

Department of Power System & Control, Faculty of Electrical Engineering, Silesian University of Technology, Bolesława Krzywoustego 2 street, 44-100 Gliwice, Poland
*
Author to whom correspondence should be addressed.
Energies 2021, 14(3), 627; https://doi.org/10.3390/en14030627
Submission received: 21 November 2020 / Revised: 20 January 2021 / Accepted: 22 January 2021 / Published: 26 January 2021
(This article belongs to the Special Issue Power System Transients and Protection)

Abstract

:
Complex phase shifting transformer protection scheme and complexity of the object itself created a need to use simulation programs for their analysis. Often phase shifting transformer (PST) are modeled as a simplified series impedance and quadrature voltage source which cannot be used for power system protection analysis, especially in a transient condition. Therefore, the procedure of building realistic PST model was presented by using available transformer models with calculation of their parameters including interconnections between units. Paper consist calculations based on case study with symmetrical dual-core PST example. Additionally, theoretical background of PST principle, operation, and their impact of power system protection were introduced with numerus examples of PST model verification.

Graphical Abstract

1. Introduction

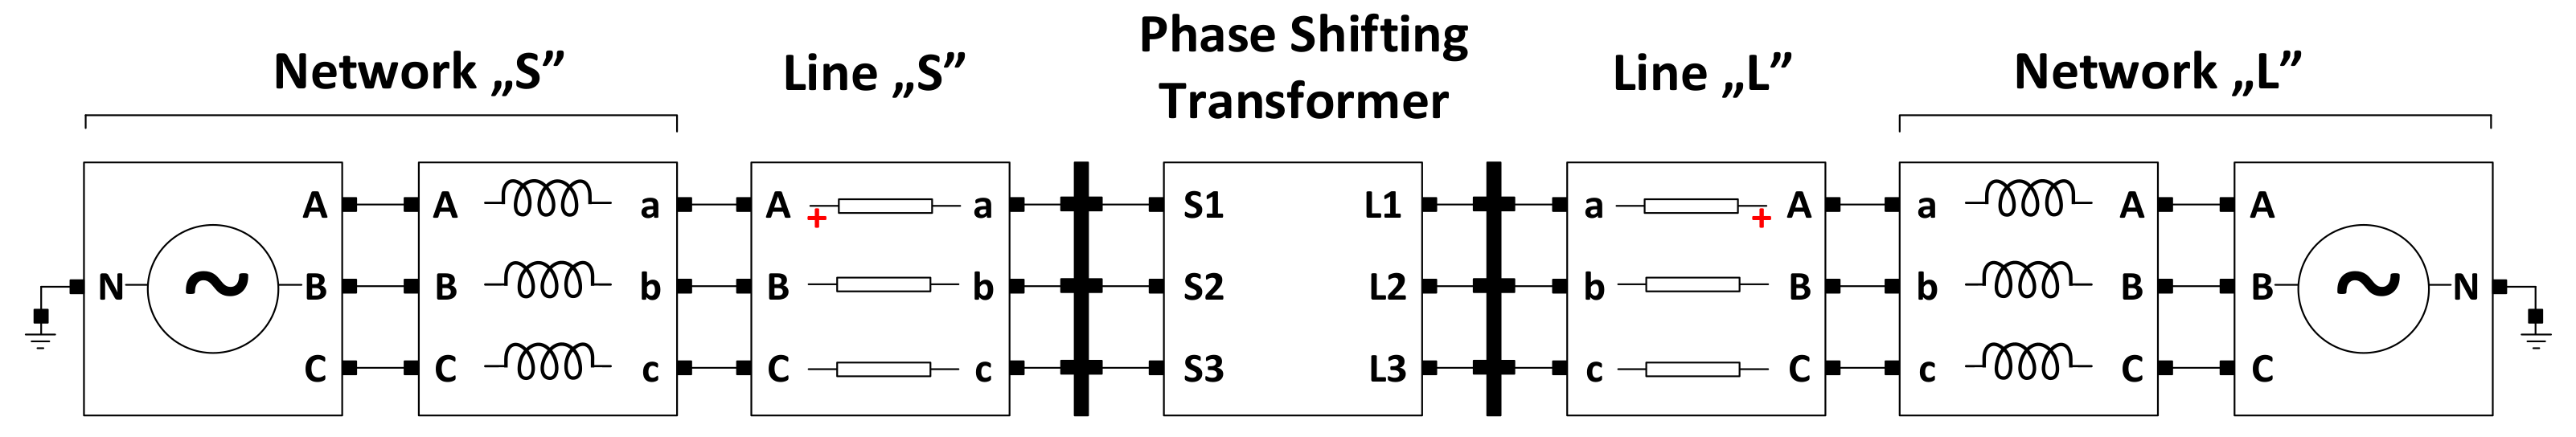
1.1. Principle of Using Phase Shifting Transformer in the Grid

Increasing demand of the power flow control in the grid nowadays among others is mainly costs by the numbers of installed renewable energy sources [1]. Therefore, it is a need to control the power flow in the network. In the market could be found many different solutions to change the power flow like, e.g., changing the impedance of the circuit connecting two grids which in practice needs to build new over headline (OHL) and it is very expensive solution. Another option is to regulate the voltage amplitude between the grids which at some point might have a risk of achieving overvoltage for connected electrical assets. The most popular and applicable solution is changing the phase angle between the connected grids and for that reason phase shifting transformer (PST) is mostly chosen [2].
To have general overview of the power flow regulation concept double infeed network topology with parallel connection via OHLs (L1, L2) will be used for an explanation (Figure 1a). To exchange the active power PSR between sending ES and receiving ER source total impedance ZT there must be a phase shift δ difference between the vector voltages of ES and ER:
P SR = U ES R T 2 + X T 2 · R T U ES U ER cos δ + X T U ER sin δ
Equation (1) describe that power can be changed by adjusting the values of the impedance (where: RT is the total resistance and XT reactance between the grids) which can be observed in the power curve shown in Figure 1b (blue and red line) which corresponds to the network configuration (Figure 1a—CB_L1 closed, CB_L2 open, by-pass—closed). Grids ES and ER are connected only by line 1 and there can be observed that in the phase angle ~95° maximum power can be transferred (1 p.u.).
By closing circuit breaker CB_L2 (PST by-pass still closed) grid ES and ER are now connected with two lines L1 and L2 (ZL1 = ZL2) in parallel the total impedance (ZT) decrease which allowed to increase the power exchange (Figure 1b red line). This solution of changing the total impedance is “0” or “1” possible option to regulate the power flow. To have more flexibility PST has been installed in series with line L2 (PST by-pass open) which in the first moment decrease the power exchange because of the additional impedance of PST (ZT—decreased, Figure 1b yellow line) even that now it is possible to control the power flow by changing the phase angle by PST(assuming that ZPST = XPST):
P PST = U S · U L X T · sin α SL
PST allows to adjust the phase angle αSL between the voltage vectors of the source “S”—US and the load “L”—UL side (Figure 1c), and this allows to control the flow of active and reactive power in the branch with PST (Line L2) and in its network environment (line L1). Additionally, it is also possible to control the magnitude of power and flow direction. What is important to notice that the impedance of PST is changing depends on the αSL (2) which have to be considered as well (see Section 2.3).

1.2. General Information about Power System Protection Scheme for PST

PST is mainly connected between two grids in a range of GVA power exchange and as an example the cross border between the countries can be used and in Poland for instance in almost all interconnections PSTs are installed where one single unit have a rated power of 1.2 GVA [3].
This makes the object itself very important from strategic and system stability point of view. That is why a lot of emphasis should be placed into the proper designing of Power System Protection (PSP) concept and their testing procedure afterwards. The key aspect of properly designed PSP is reliability considered in two most important goals:
  • Dependability—protection relay (as a part of PSP) must trip when called upon, which means that in case of the fault inside the protected area (limited by used protection functions) is required to disconnect faulty object from the source supply (open circuit breaker) as fast as possible (for main protection time range for 220 kV network it is about 120 ms including circuit breaker time [4]) to reduce the detrimental effect, e.g., of short circuit currents.
  • Security—protection relay must not-trip when not supposed to. In relation to the expected action from dependability can be referred by knowing that this time if the fault is outside of the protected area protection relay should identify this condition and not disconnect the healthy object (selectivity) from the network, which in the worst case, can cost losing stability and at the end lead to the blackout especially if considering disconnecting healthy PST where there was power exchange in a range of GVA. This can be as an indication to the cascaded disconnecting of the power plant near to the cross-border connection.
As has been described the proper design for the PSP force a need to know all aspects related to the protected object in healthy and transient condition in order to properly choose the protected function and calculated the threshold setting for them. PST can certainly be considered as a non-standard object which makes that protection concept at some point is getting to be complicated, and it is not easy to find the week points of the chosen PSP concept which has been investigated in many works [5,6,7,8,9].
With the use of dedicated programs for short-circuit studies by use of electrodynamic models it is possible to significantly increase the quality of the PSP scheme designing and decrease the time needed for manual analysis [10,11]. Another important aspect is to have the option to test the physical protection relays after they are selected by using the transient signals from the short circuit studies performed in a dedicated software [12,13].
The key point of using this approach for designing and testing PSP by using described approach is first to use software which has implemented advanced algorithms to calculate the analog signals (current and voltages) and second of all (but not less important) is to have dedicated model and describe it accurately. Mainly the object data are provided in the factory test report or in the nameplate, e.g., power transformer where the information such a rated voltage, power, vector group and short circuit voltage can be used to determine the model data. With the example of PST even it is two interconnected power transformers it is complicated to get a proper data for the modeling purposes if only PST data are provided and there is a need to describe two separate units of transformers.
Over years many different models of PST have been presented [6,11,12,14,15,16] by using different approach. Important to notice is that PST model based on series impedance connection and quadrature voltage should not be used for a PSP studies as they are not dedicated for these purposes. Only by using realistic interconnection of transformers can give the proper results which could be used, and by that the main problem appear. How to calculate the data of the separate units by having only the PST test results data (Table 1). This PST example will be quoted often in this paper and used as real case study.
Among other very important aspects considered in this paper such a dedicated model, presented test results of the real PSP verification the most valuable point from the authors point of view is the element related to the recalculation of the transformers unit data based on the PST nameplate only.
With briefly described most important background information’s about the principle of using PST and protection concept before going deeper into the modeling topic and possible impact of PST operation for selected protection functions is justified to shortly discuss the types of PSTs and based on chosen example describe how they are working internally in a healthy condition (reminder: it is a key element for proper PSP design).

2. Construction and Operation of the Selected PST

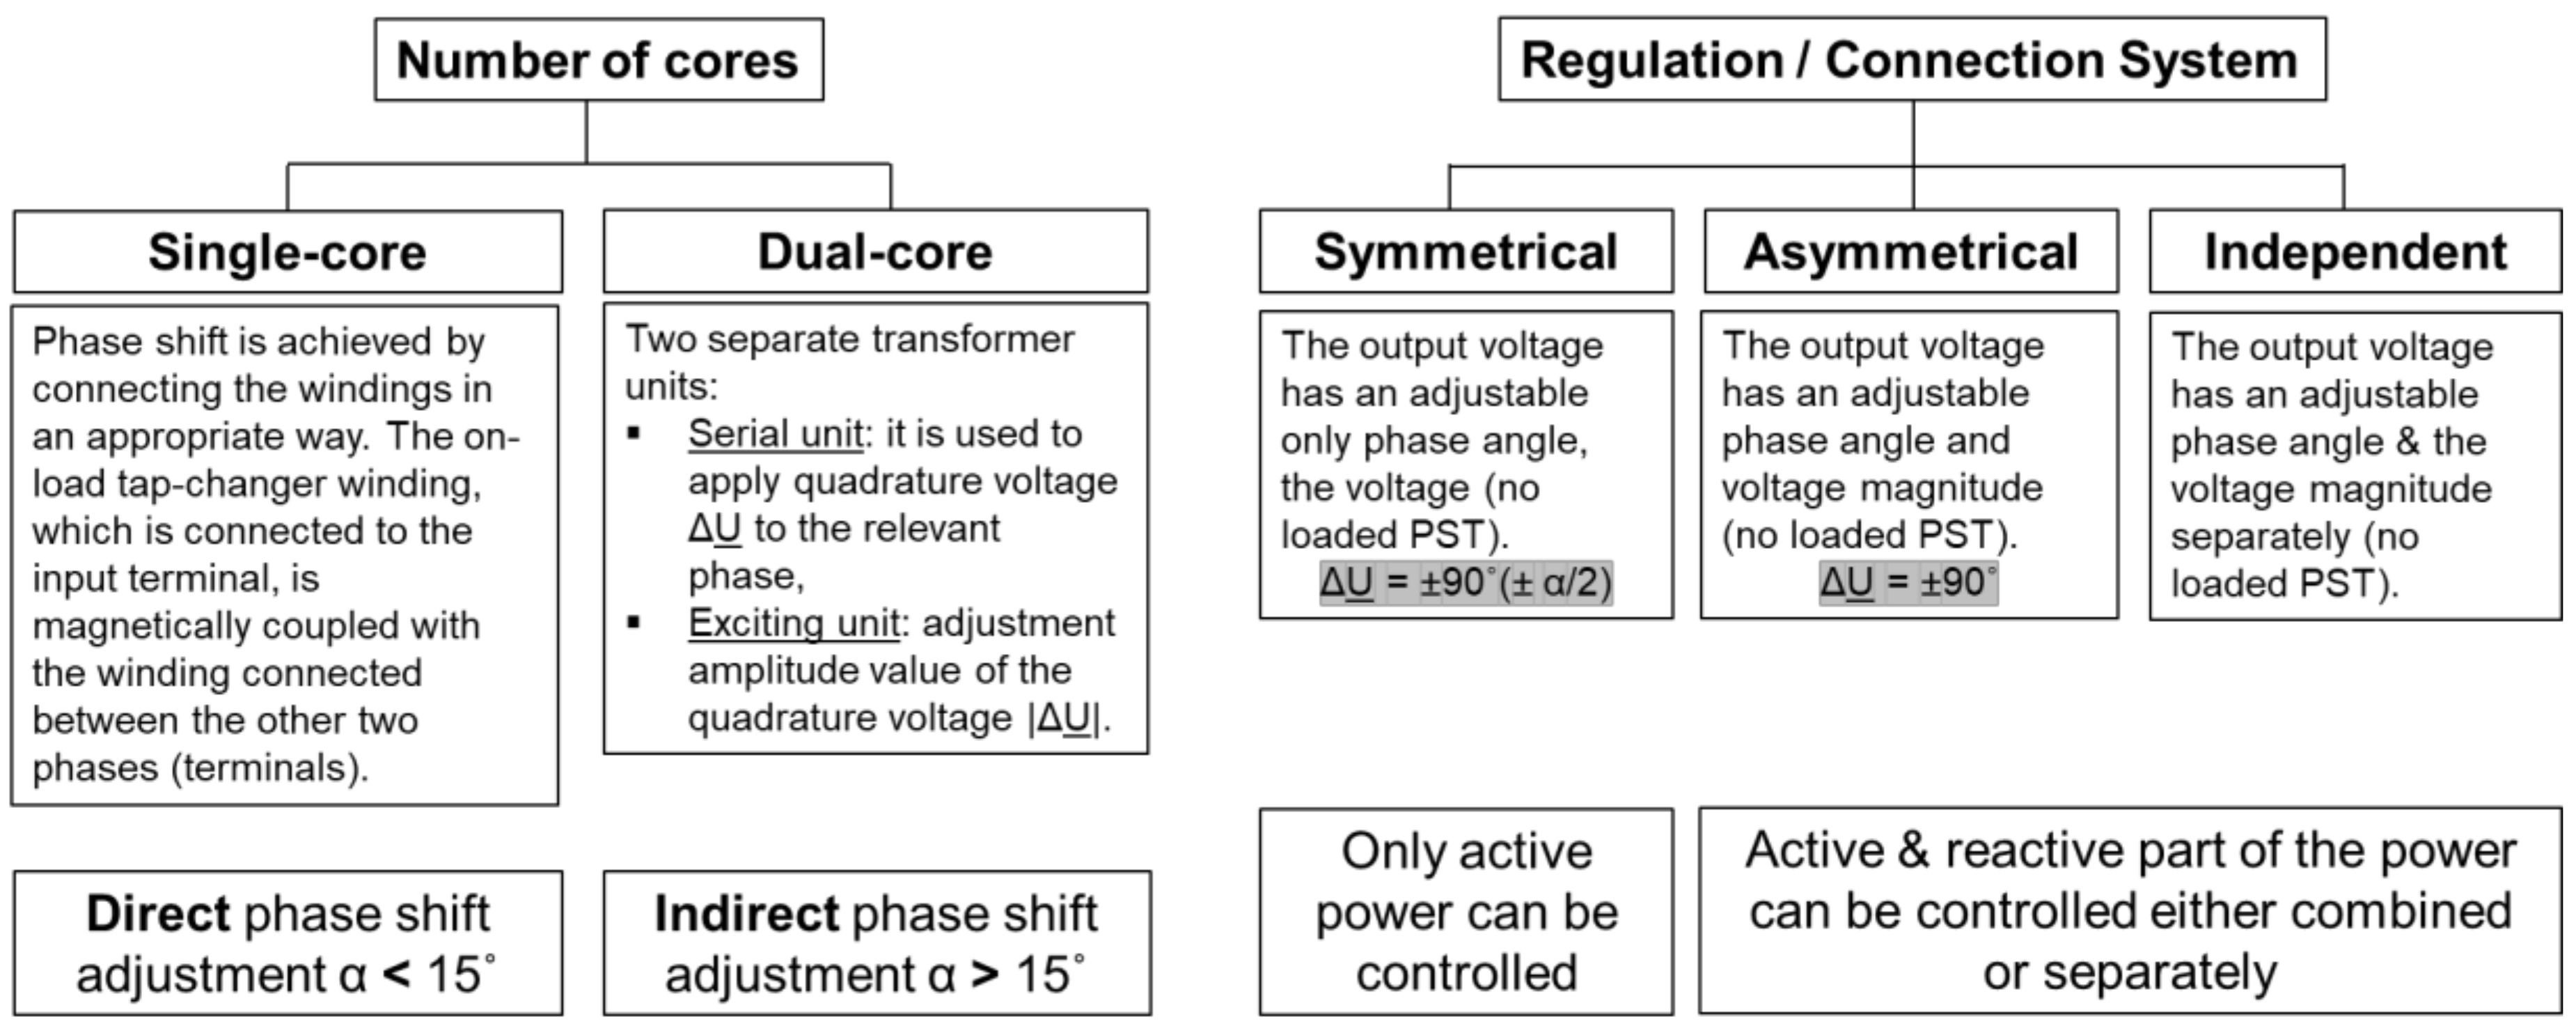
2.1. General Informations about PST and Their Types Division

PSTs can be built on the basis of different construction solutions, i.e., different system of connections of transformer units windings. The choice of the solution depends on the end user requirements: rated voltage, power, maximum phase shift adjustment range αSL, regulation method (symmetric–asymmetric–independent). This makes that different PST types solution can be chosen as: single or dual-core, 1- or 3-phase unit, direct or indirect phase angle regulation. Determined division of PST has been presented in Figure 2.
The publication focuses on dual core PST, which is one of the most complex variant of PST and at the same time most frequently used in the network and thus requires extensive PSP structure. Usually there are also the biggest problems with its correctness. Symmetric dual-core PST consists of two separate transformer units: a serial unit (SU) and exciting unit (EU) (Figure 3). SU and EU can be placed either in one or in two separate tanks. However, due to the construction of this type of PST for power flow control at the level of GVA values, they are most often made as two-cabinet units.

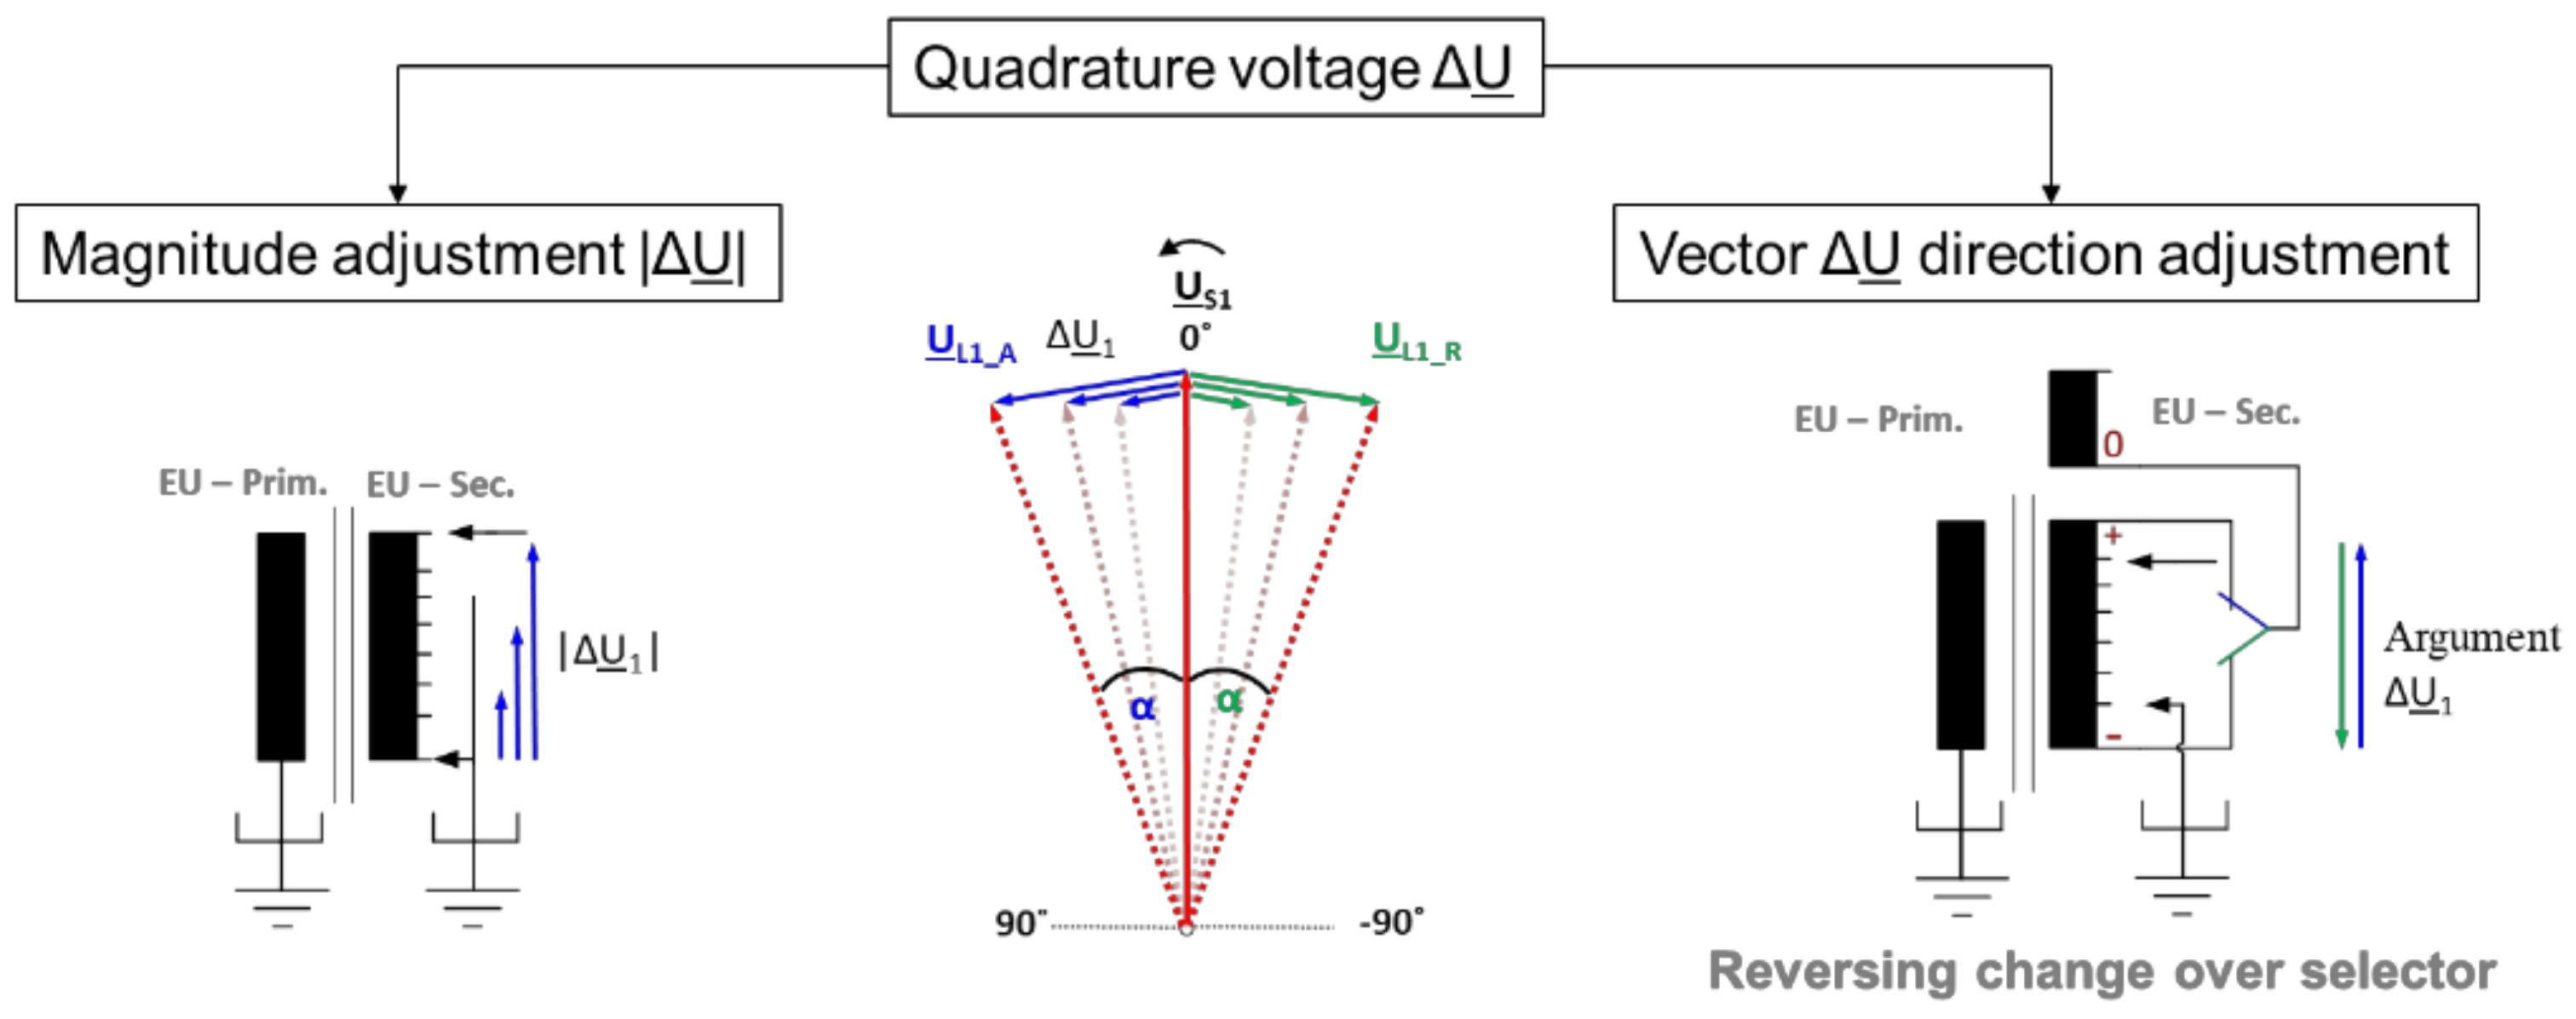
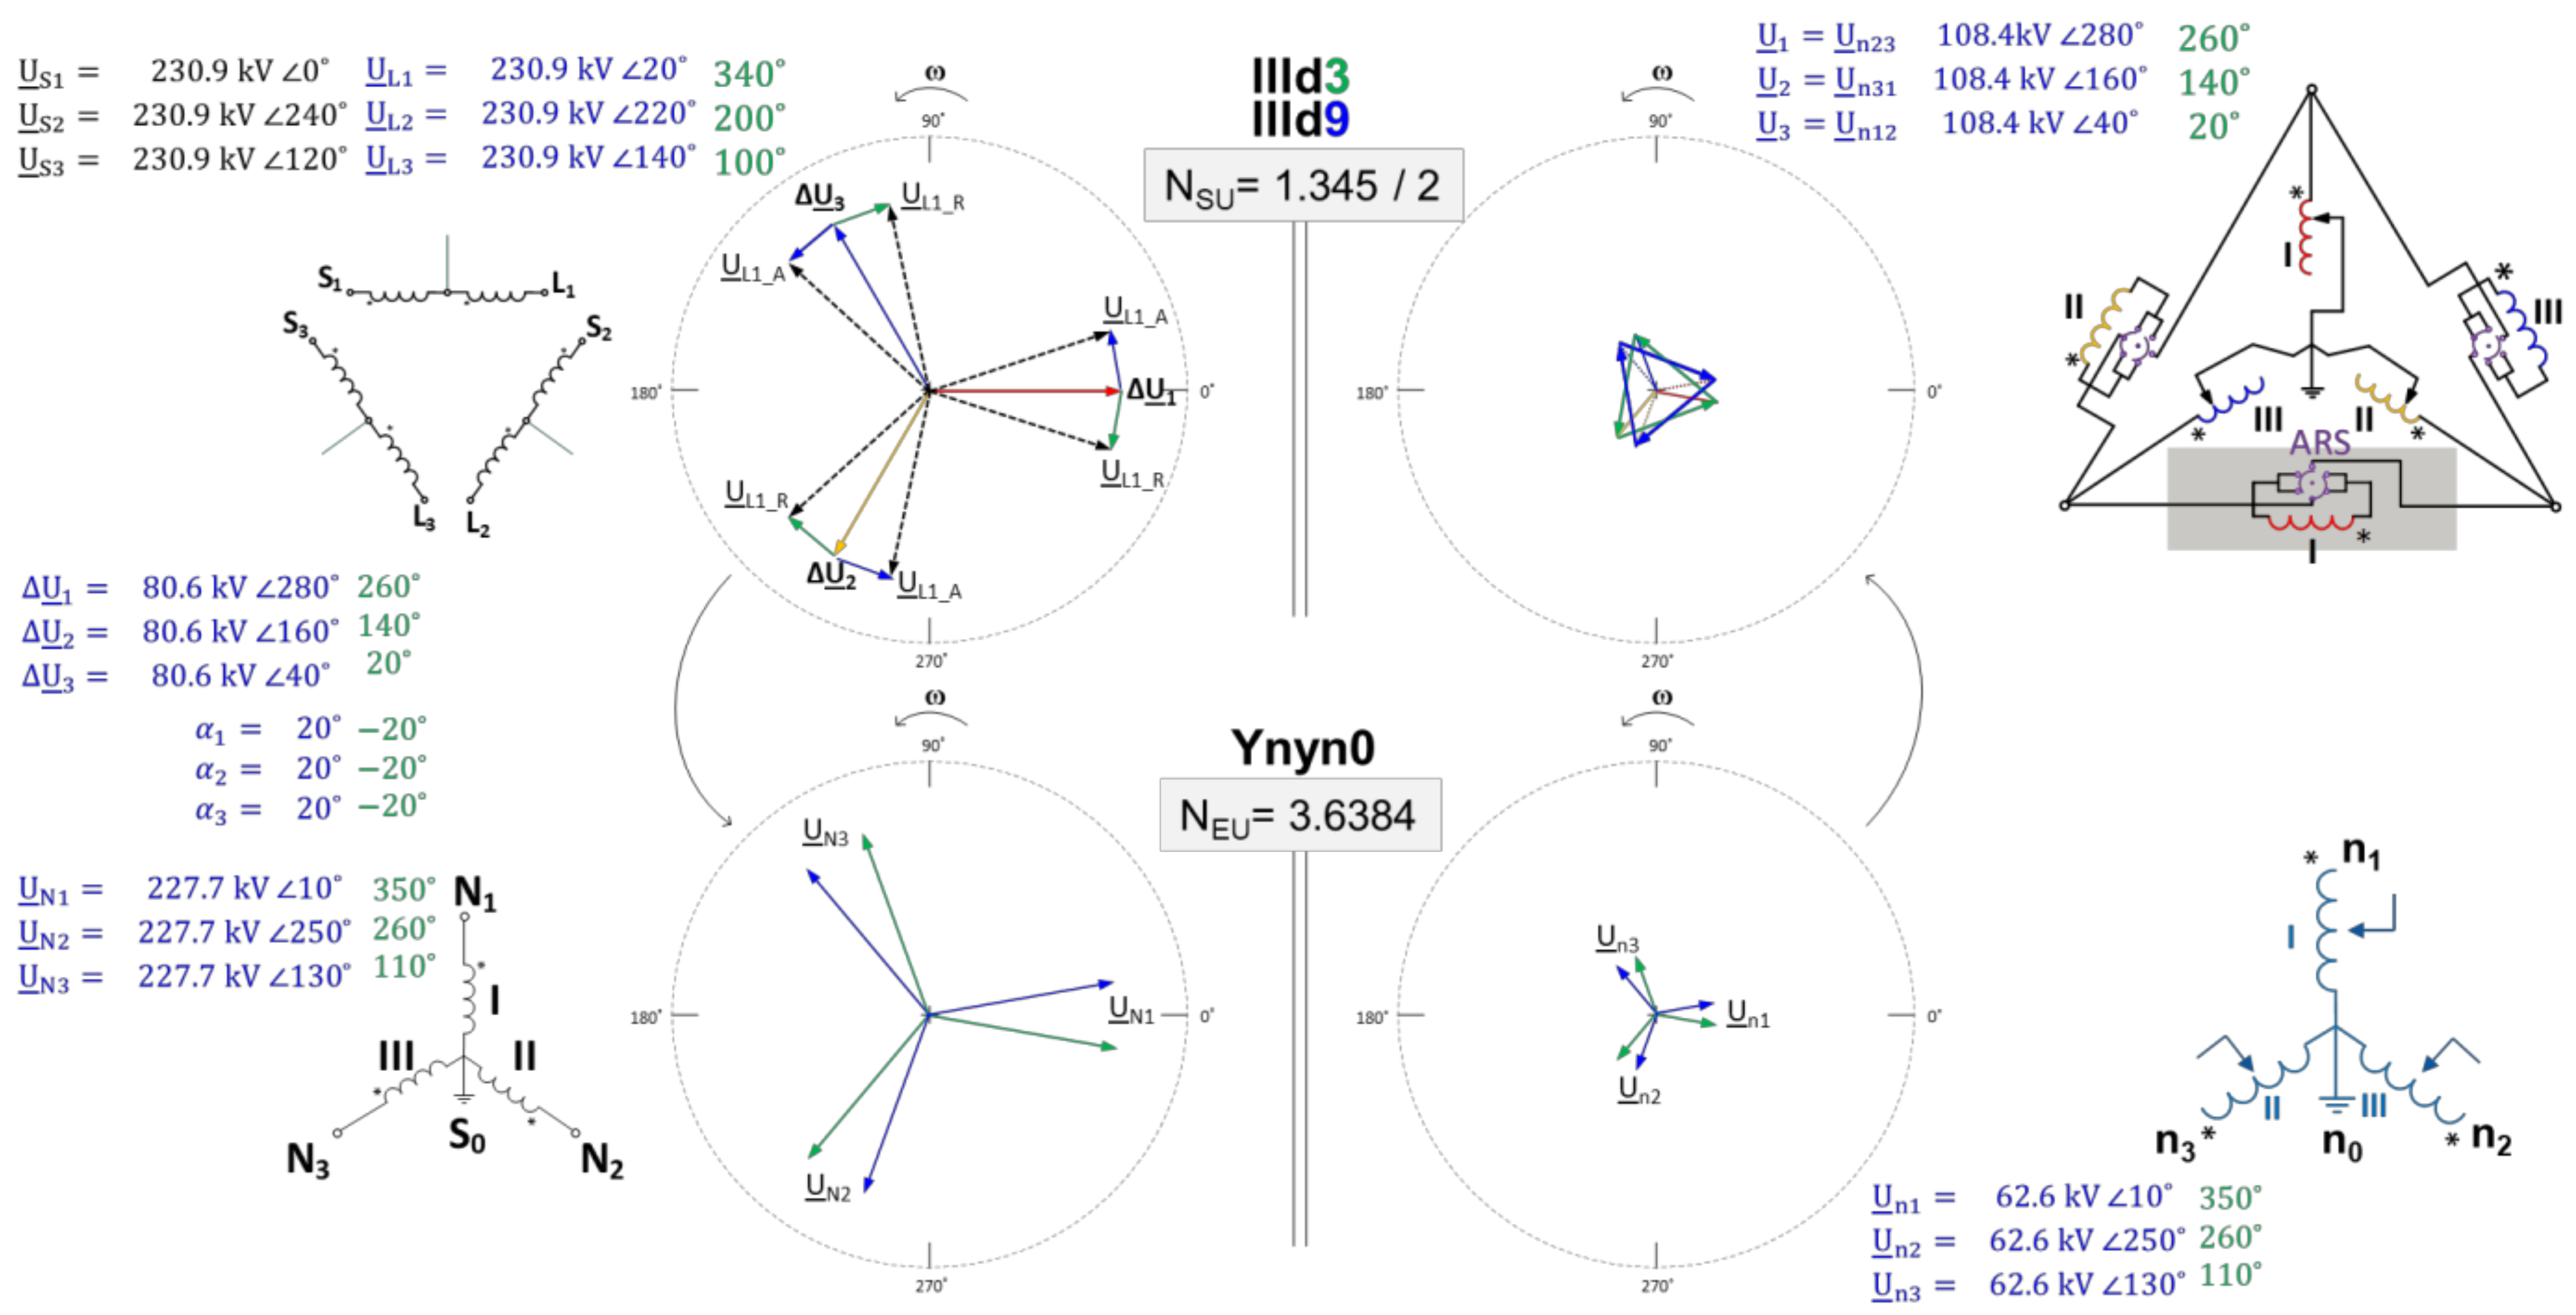
2.2. Voltage Distribution inside the PST (Based on Selected Type)

For selected type of the regulation (symmetrical) primary winding of SU is configured as a series winding—III or sometimes called “open winding” and in the symmetrical solution the series winding is driven into two separate and identical (by number of turns) coils. The beginning and the end of the series winding is named as a source—“S” and load “L” side (referring to the power transformer primary and secondary side), and based on the vector voltages on “S” and “L” side it is possible to say if the phase angle αSL is positive or negative. By the standard [17] definition it stands that:
  • Positive (advanced) αSL—is when voltage vector (phase 1, 2, 3) of load side UL is leading the relevant vector voltage (phase 1, 2, and 3) on the source side US.
  • Negative (retard) αSL—is when voltage vector (phase 1, 2, 3) of load side UL is lagging the relevant vector voltage (phase 1, 2, and 3) on the source side US.
Exactly between two coils of the series winding the primary winding of the exciting unit is galvanically interconnected with a winding configuration of star connection with neutral point—YN.
The secondary winding of SU is connected in a delta system which is supplied by the secondary winding EU (regulation). The interconnection of secondary windings EU and SU is made by taking into account the appropriate phase connection, so that the quadrature voltage ΔU is placed at angle of ±90° (±αSL/2) to the voltage vector of the relevant phase US. The adjustment of the ΔU quadrature voltage (Figure 4) in this type of PST is carried out indirectly by adjusting the ratio of the secondary winding of EU by changing the tap position of on-load tap-changer (OLTC).
As was already introduced both—the value and sign (±) of the phase shift αSL can be changed (Figure 4). The value of αSL is changed by the OLTC position adjustment and sign is changed by the reorientation of the ΔU phase angle which is done by changing either the vector group of the secondary winding EU (yn0–6) by using the reversing change over selector or SU (d3–9) by using special switch Advanced-Retard Switch (ARS). Both solutions are doing the same, means shifting the quadrature voltage ΔU by 180°.
For visualization purposes based on the example with using the numbers and voltages vector diagram the “cooperation” between the particular winding of the SU and EU was presented in Figure 5 (technical data of units are placed on the diagram). The information’s provided when describing the symmetrical dual-tank PST solutions are relevant to the Figure 5 referred to windings’ configurations shown in Figure 3 and rated data placed in Table 1.

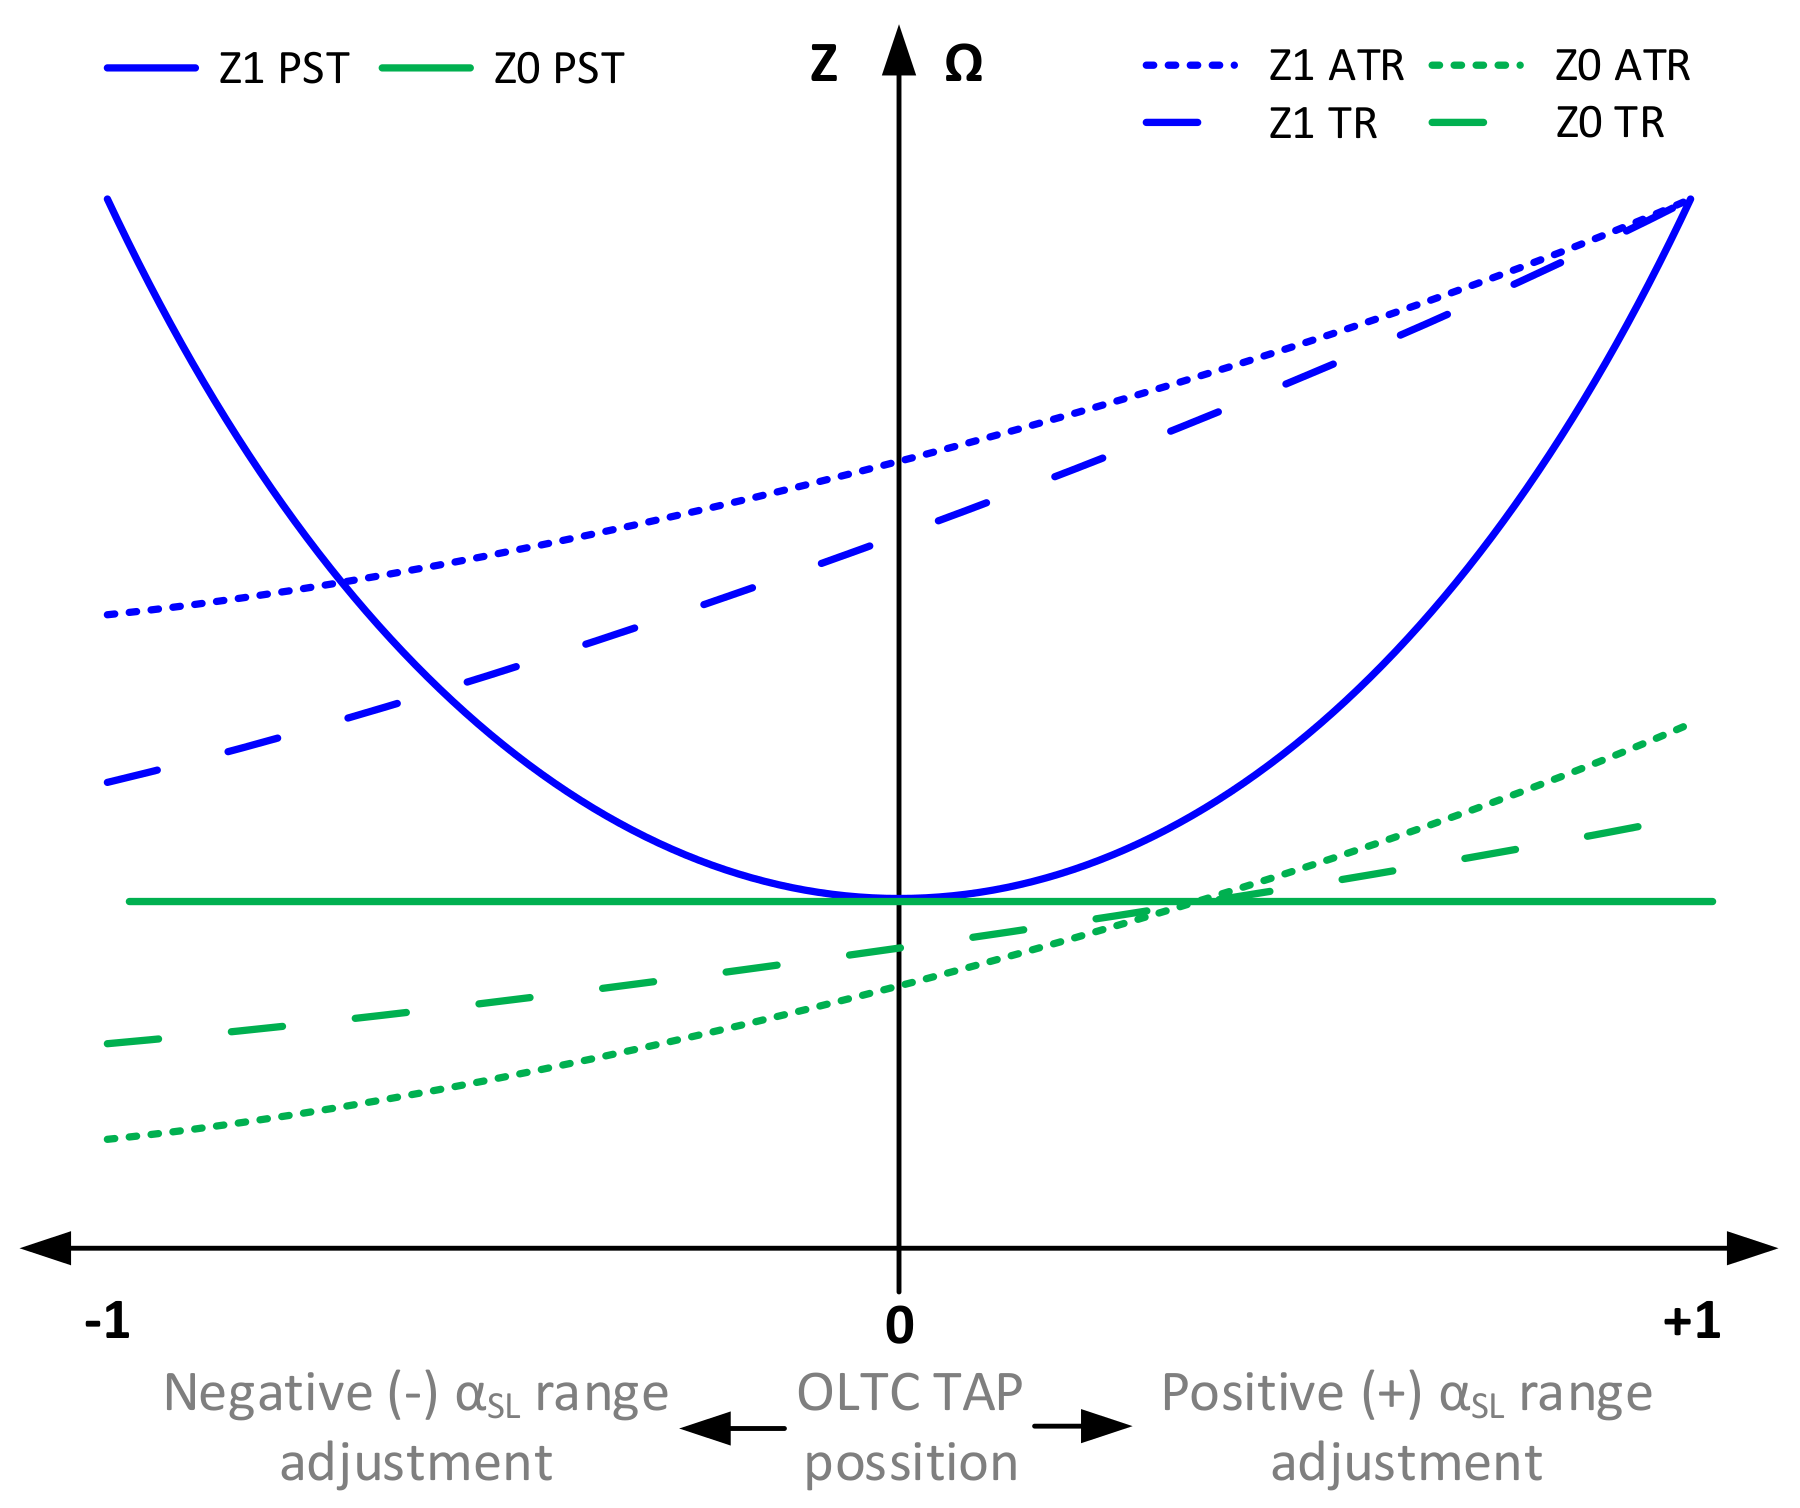
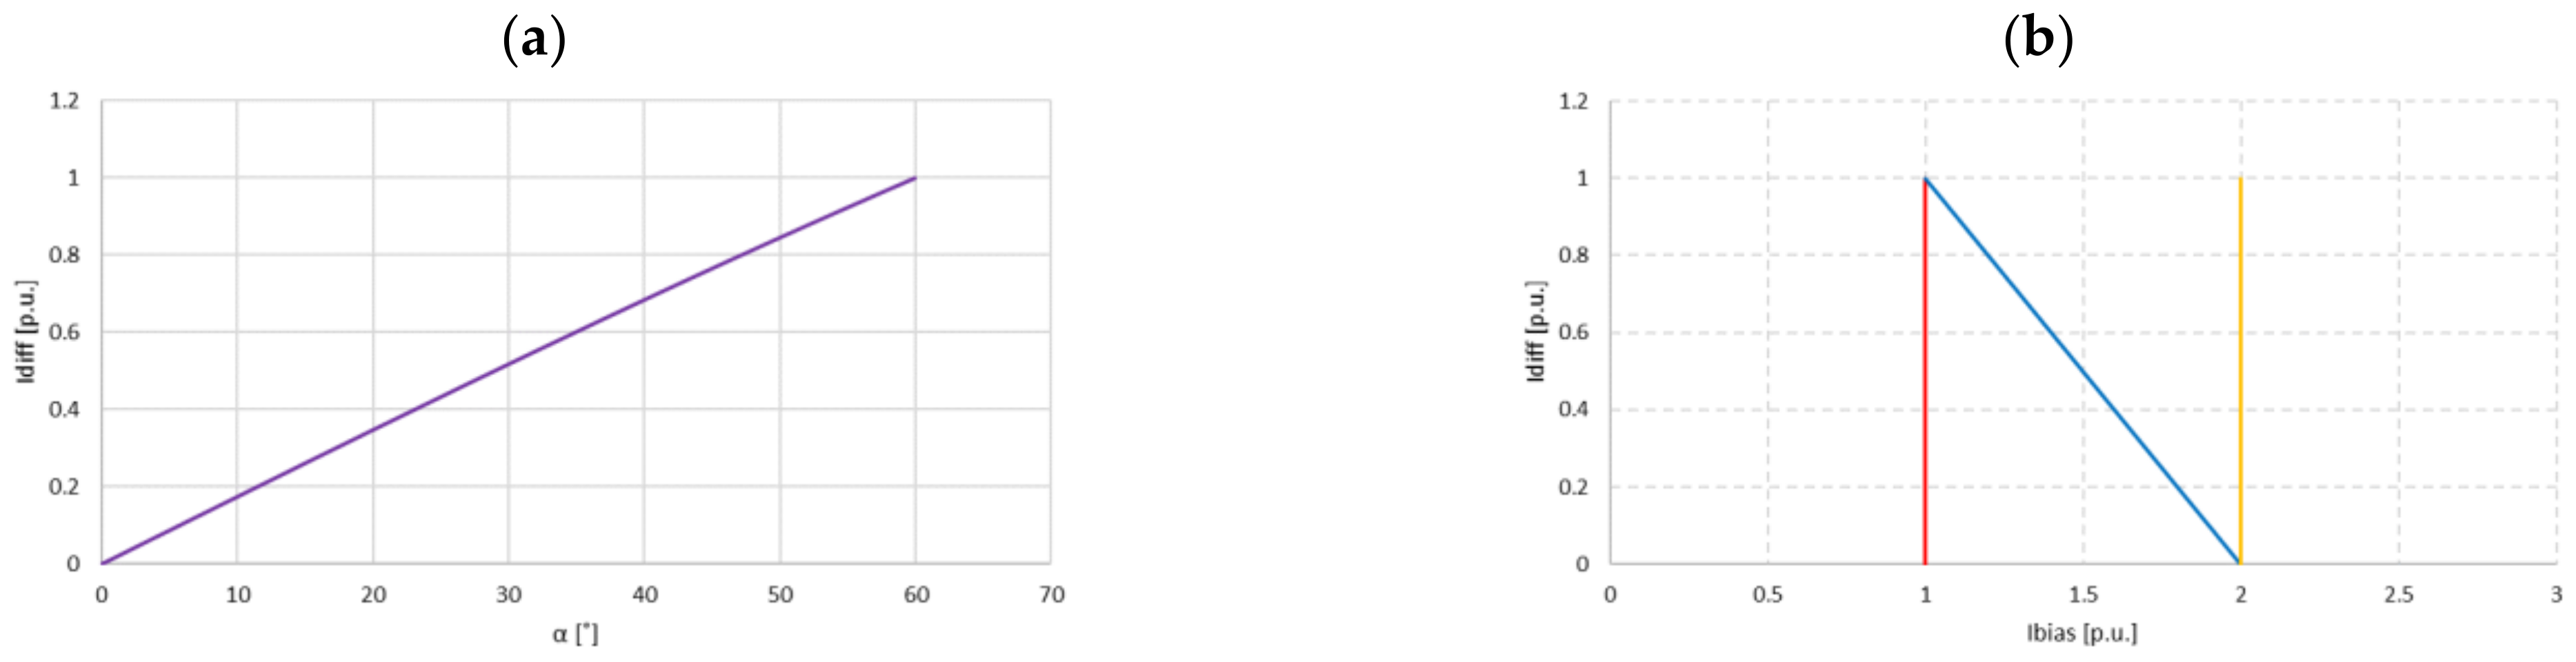
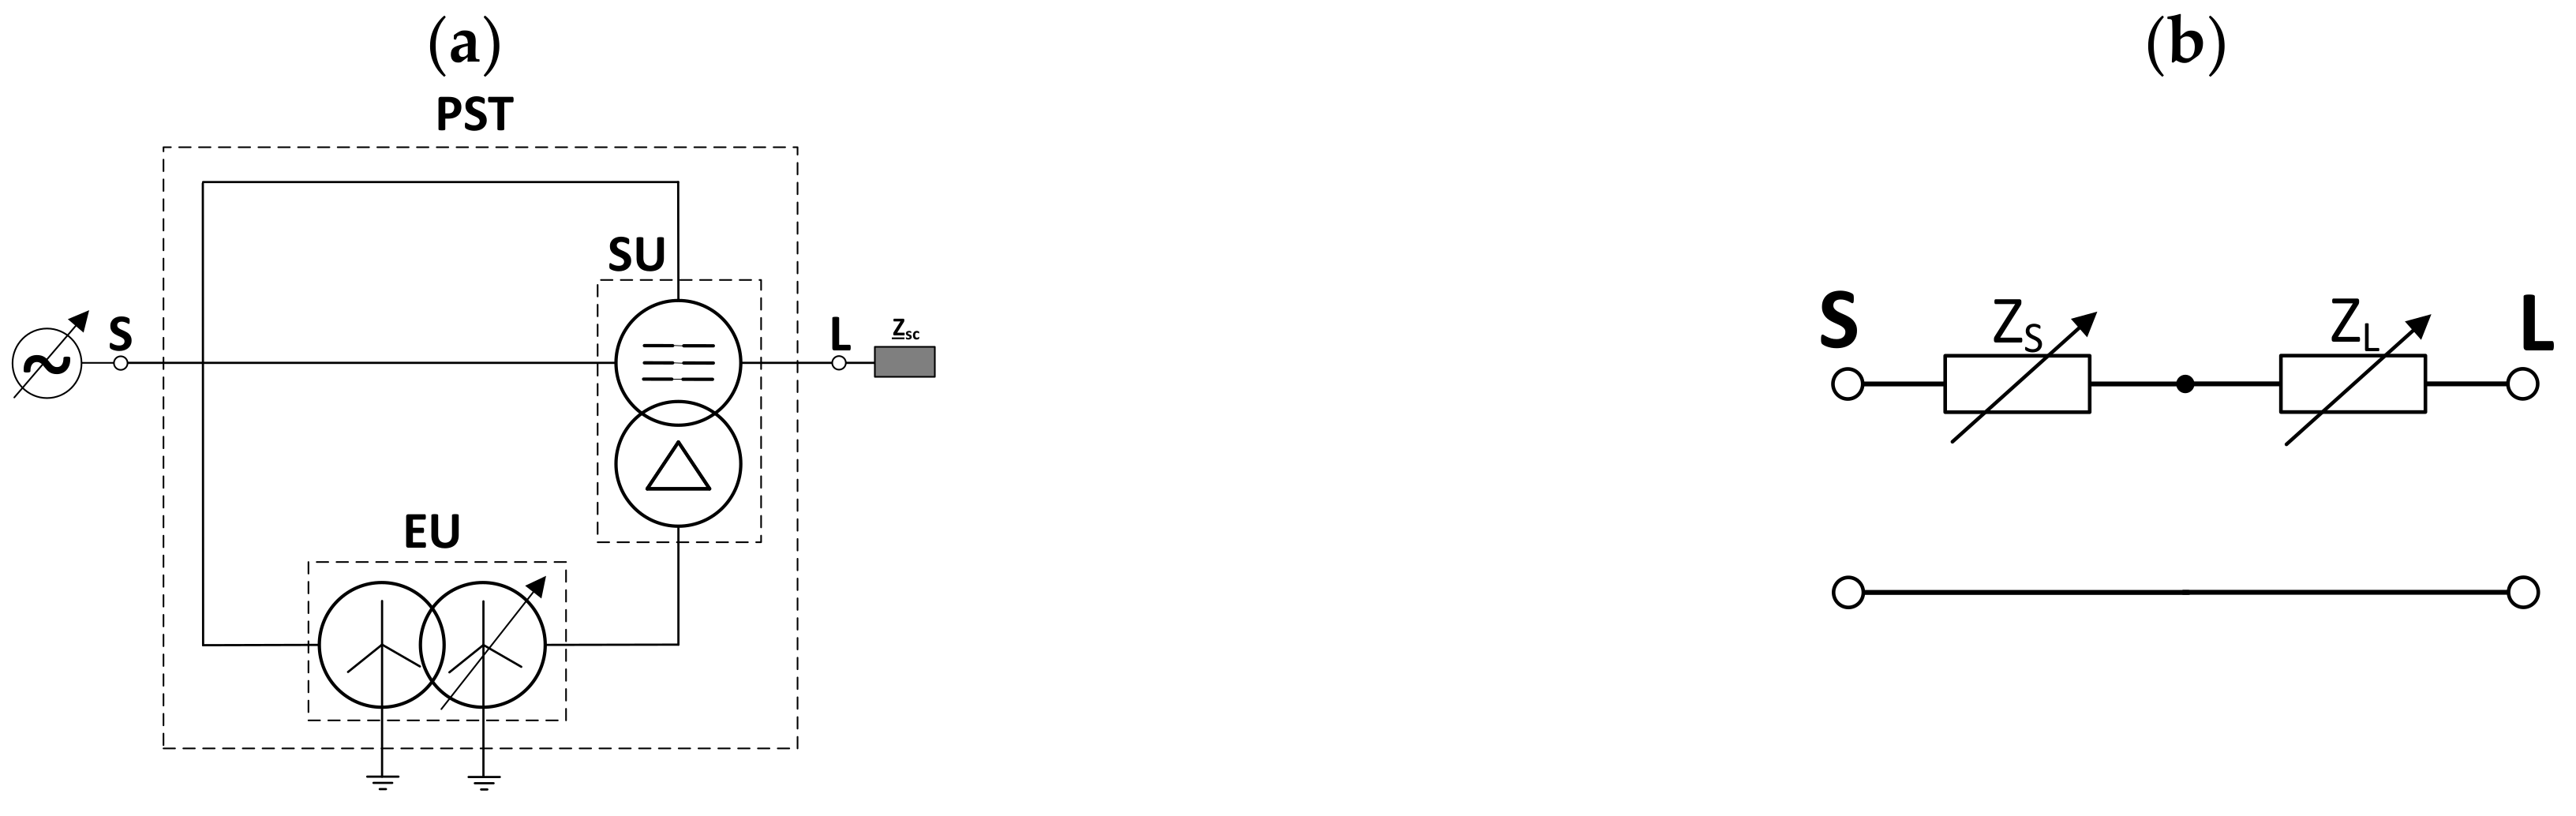
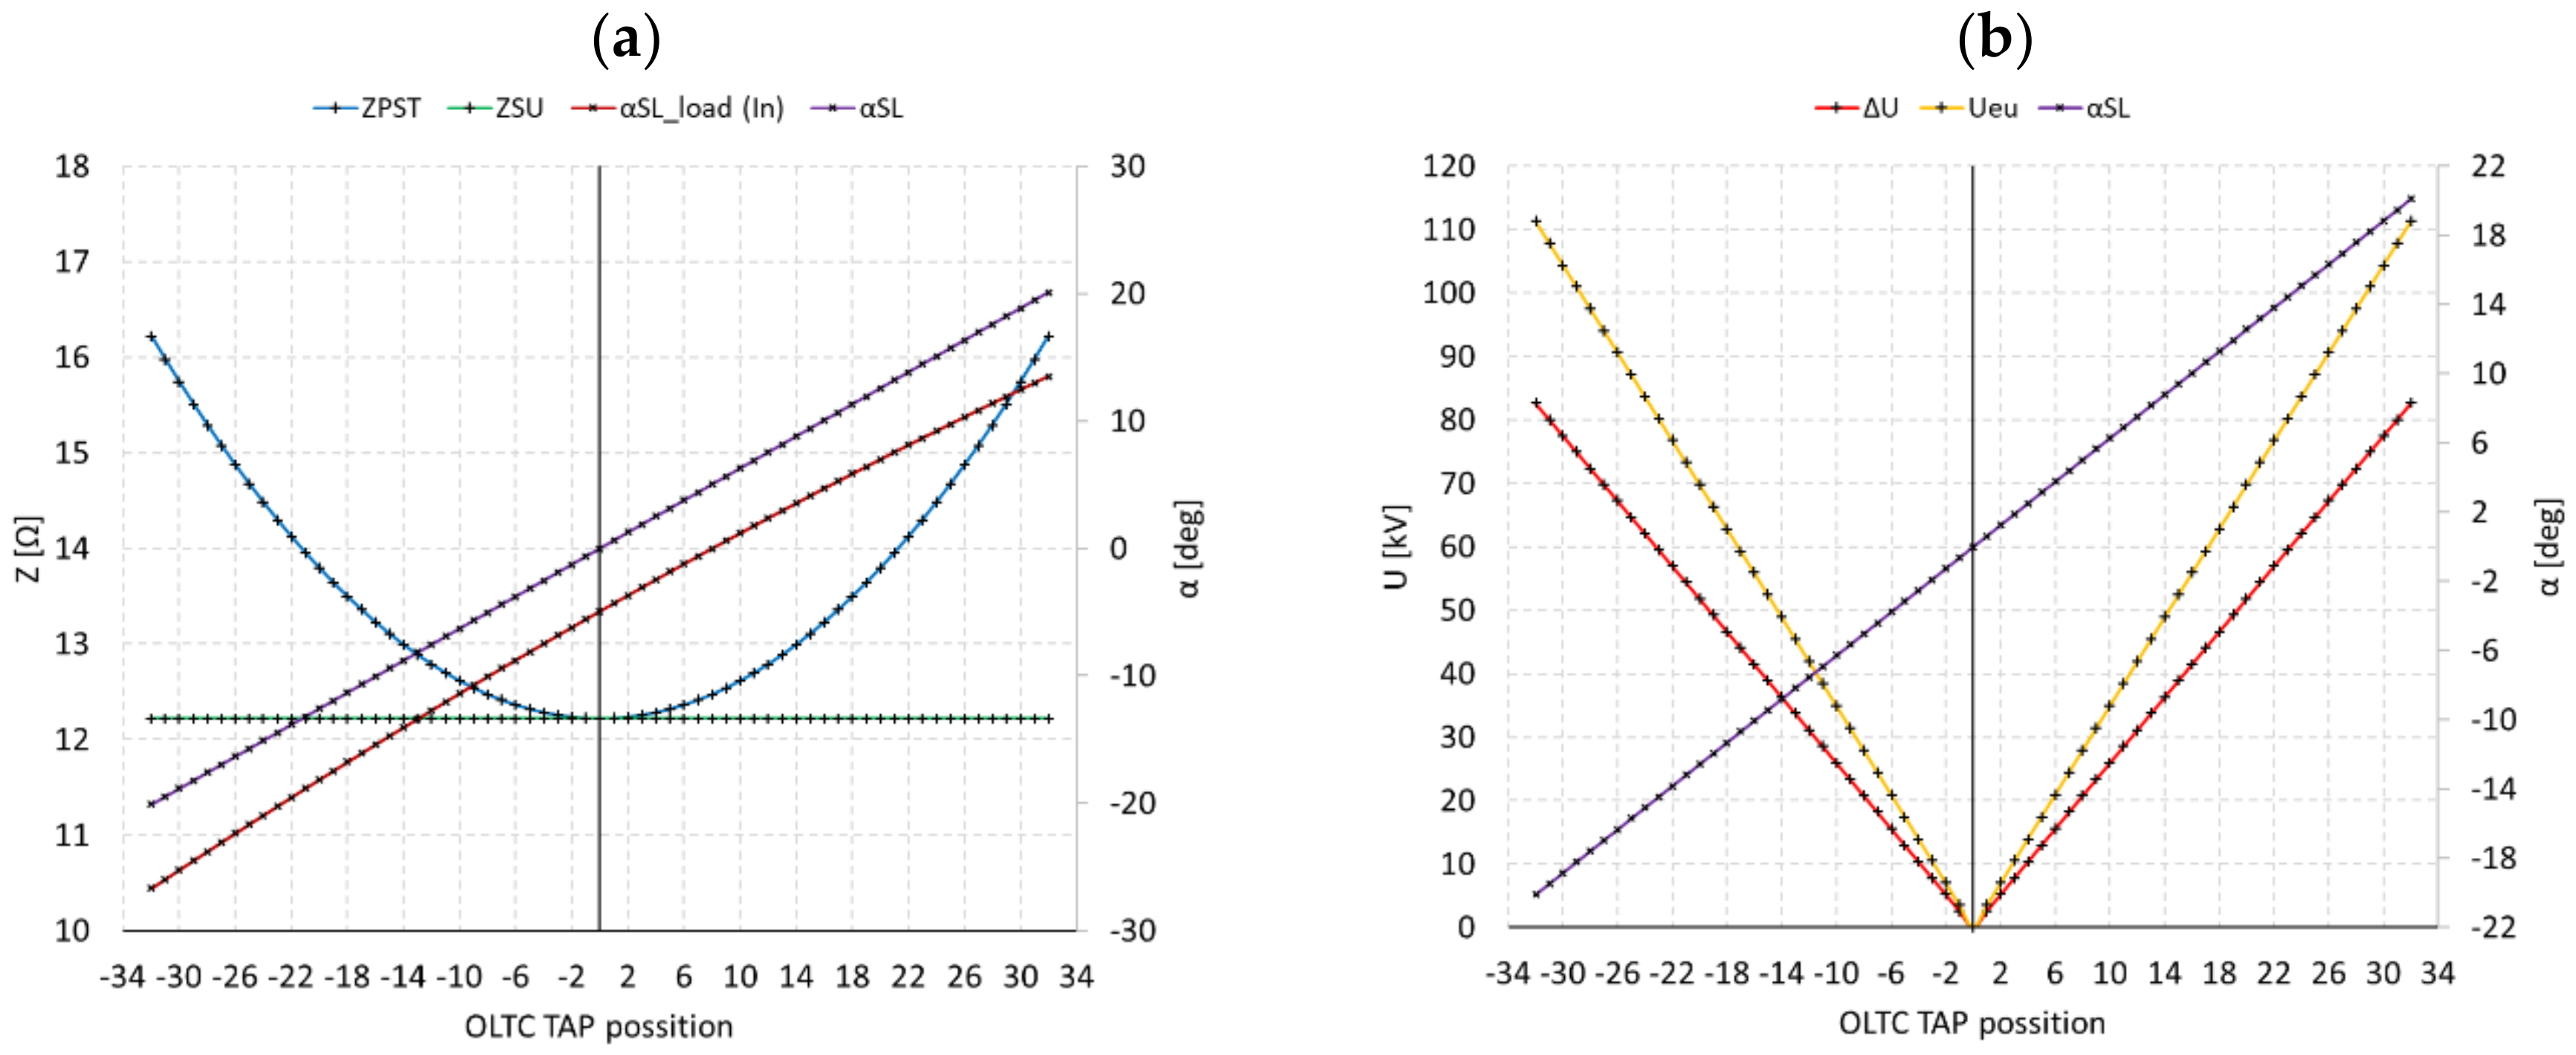
2.3. PST Load Condition Impact on the Phase Shift Adjustment

The incorporation of PST into the network branch causes the change of phase angles not only due to the introduction of quadrature voltage by PST. It is also necessary to take into account the influence on phase shift costs by the voltage drop ΔUPST on the PST impedance ZPST, which may increase or decrease the PST regulation effect αSL. In order to know the operating conditions of PST under load condition, it is necessary to divide PST into two components [18]:
  • ideal transformer without losses (internal impedance ZPST = 0 Ω), which represents the introduction of quadrature voltage ΔU;
  • transformer with ratio 1:1 with losses (internal impedance ZPST ≠ 0 Ω), which represents voltage drop on PST during the load condition.
Model of such representation of PST is shown on Figure 6.
Based on the PST model for load condition (Figure 6) and knowing the source side voltage US (reference) it is possible to calculate the load side voltage UL under the load condition with additional information of the current IS = IL and the internal impedance on the current OLTC TAP position (actual phase shift):
  U _   L =   U _ S Δ   U _ PST =   U _ S   Z _ PST ·   I _ L ,
Assuming the correlations between the load side voltage UL under load condition and voltage drop ΔUPST on the internal impedance ZPST (by the nameplate driven as the percentage value of the resistance RPST% and reactance XPST%):
  Z _ PST ·   I _ L U _ L = Δ U _ PST U _ L = R PST % 100 + j X PST % 100 ,
by using relations (4), we can drive an Equation (5) which will allowed to describe the internal phase angle β value and by that at the end provide valuable information on how the actual impedance ZPST and load parameters (current magnitude and power factor cosφ) can influence the final phase shift αSL:
β = arctg   I _ L · jX PST · cos φ L R PST · sin φ L U L +   I _ L · jX PST · sin φ L + R PST · cos φ L .
Considering the internal angle β (5) and the actual phase shift position in no-load condition αSL0 in loaded condition should be noticed (assuming that power is transferred from source to load side of PST):
  • for the advanced position “A” the actual phase shift αSL_A is lower compare to the phase shift in no-load condition αSL0:
α SL _ A = α SL 0 β ,
  • while for retard position “R” the actual phase shift αSL_R is higher compare to the phase shift in no-load condition αSL0:
α SL _ R = α SL 0 + β .
Important information to know about the PST impedance is that this value for the positive sequence impedance magnitude of the |Z1PST| is changing nonlinearity depends on the actual phase shift position (OLTC TAP position) where zero sequence impedance |Z0PST| remain on the same value (Figure 7). Additionally, for comparison purposes of the impedance changing over the TAP position in different objects autotransformer (Z1ATR and Z0ATR) and power transformer (Z1TR and Z0TR) units data was used. It has been found that the impedance curve Z1 PST (Figure 7) can be different from which method (machine) was used to change the TAP position [19].

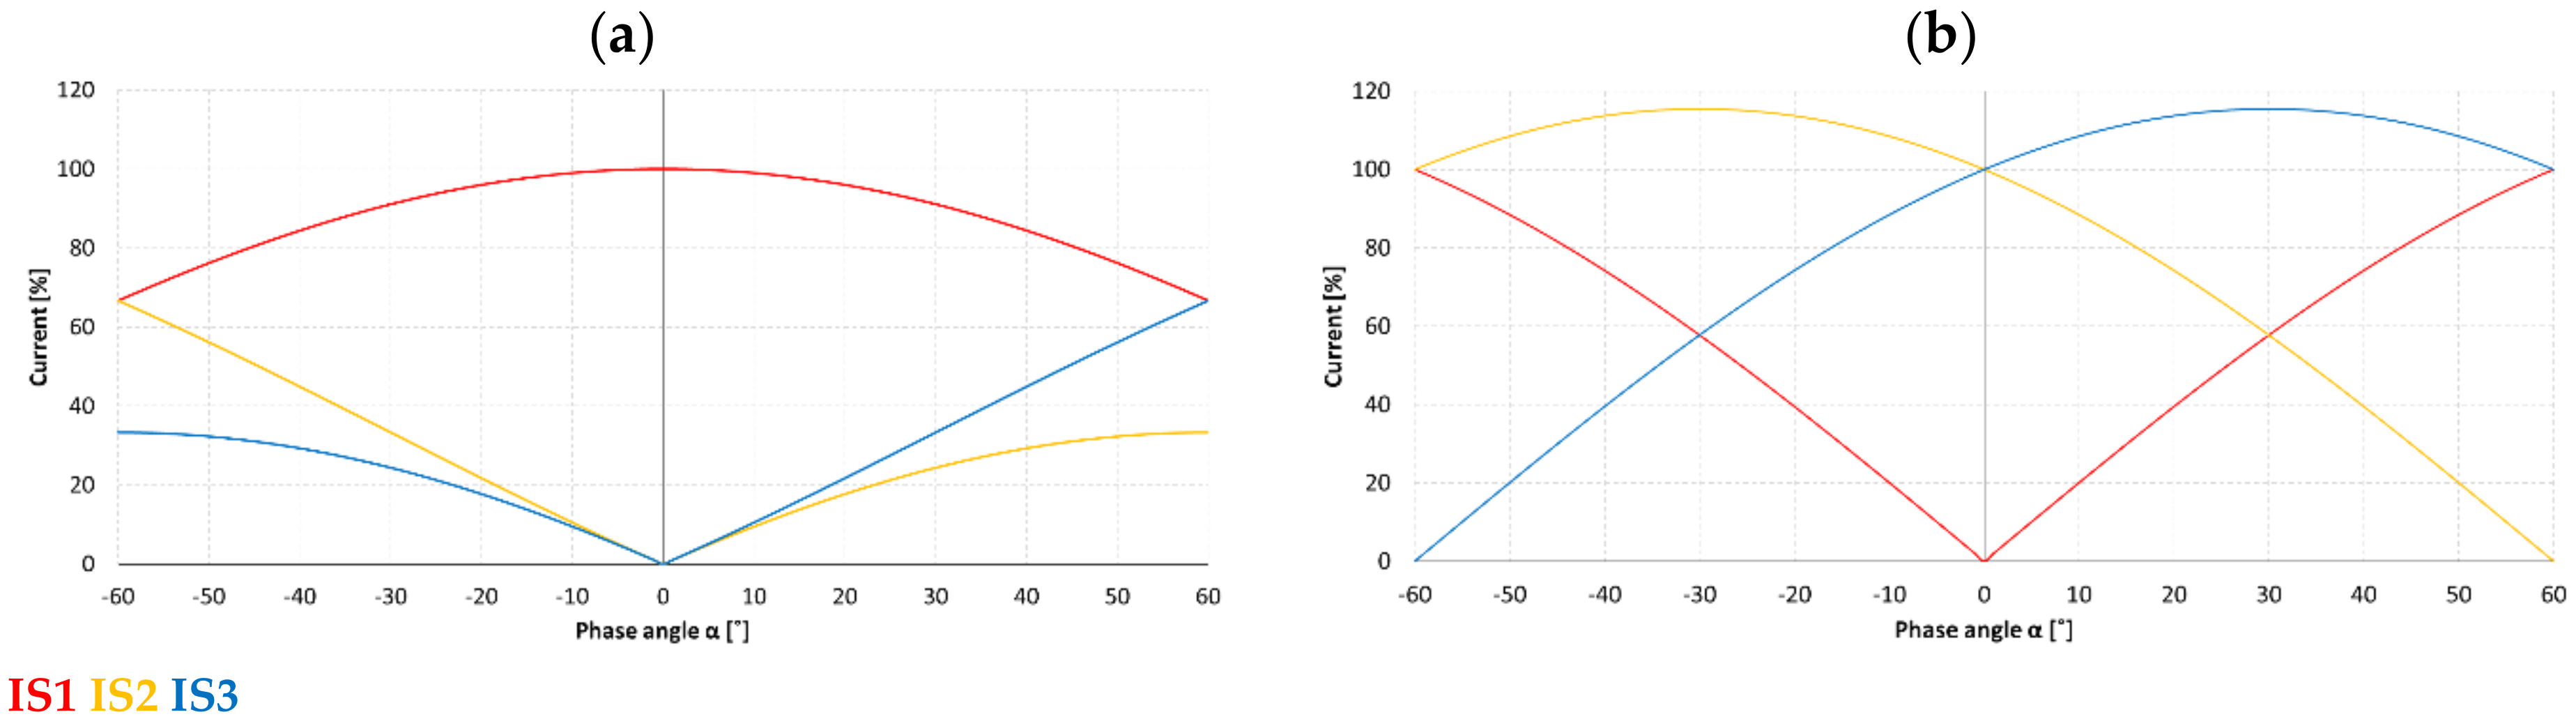
2.4. Current Distribution inside the PST during the Load Condition

To have complete picture about what is happening during the normal operation condition of selected PST (Table 1) additionally the current distribution have been described (Figure 8) considering two operation positions: advance (Figure 8a) and retard (Figure 8b) as an example ARS installed in delta winding is use.
With the information about source voltage ES and total impedances which includes source ZS, PST ZPST and load Zload impedances it is possible to drive the Equation for calculating the PST source side current ISx (where x is number of phases 1, 2, and 3 assuming the symmetrical load):
  I _ Sx =   E _ Sx   Z _ S +   Z _ PST +   I _ Load
The load side current ILx is the source side current ISx (8) additionally shifted by the α angle:
I _ Lx = I _ Sx cos φ Load + α
As the primary winding of EU is directly connected between two divided coils of the series winding by knowing the currents from source ISx and load ILx side (where x is the number of phase: 1, 2, and 3) and using first Kirchhoff’s law it is possible to calculate the currents in this winding in all phases INx:
I _ Nx = I _ Sx I _ Lx
The currents flowing inside delta winding (SU—secondary side) for all phases Id1, Id2, and Id2 is in relation to the sum of the currents ISx and ILx (where x is the number of phase: 1, 2, and 3) flowing thru the series winding with respecting the turns ratio NSU of series unit, divided by 2 because of the two equal coils (referred in Section 2.2) and because of the delta winding connection the √3 have to be considered:
  I _ d 1 = N SU 2 · 1 3 ·   I _ S 1 +   I _ L 1   I _ d 2 = N SU 2 · 1 3 ·   I _ S 2 +   I _ L 2   I _ d 3 = N SU 2 · 1 3 ·   I _ S 3 +   I _ L 3
By knowing that secondary side of the SU is galvanically interconnected to the secondary side of EU and already calculated currents inside the delta winding (11) with simply applying the first Kirchhoff’s law it is possible to calculate the currents in the secondary side of the EU for advance (Figure 8a) and retard (Figure 8b) position (12).
Advance   I _ n 1 =   I _ d 2   I _ d 3   I _ n 2 =   I _ d 3   I _ d 1   I _ n 3 =   I _ d 1   I _ d 2 ; Retard   I _ n 1 =   I _ d 3   I _ d 2   I _ n 2 =   I _ d 1   I _ d 3   I _ n 3 =   I _ d 2   I _ d 1

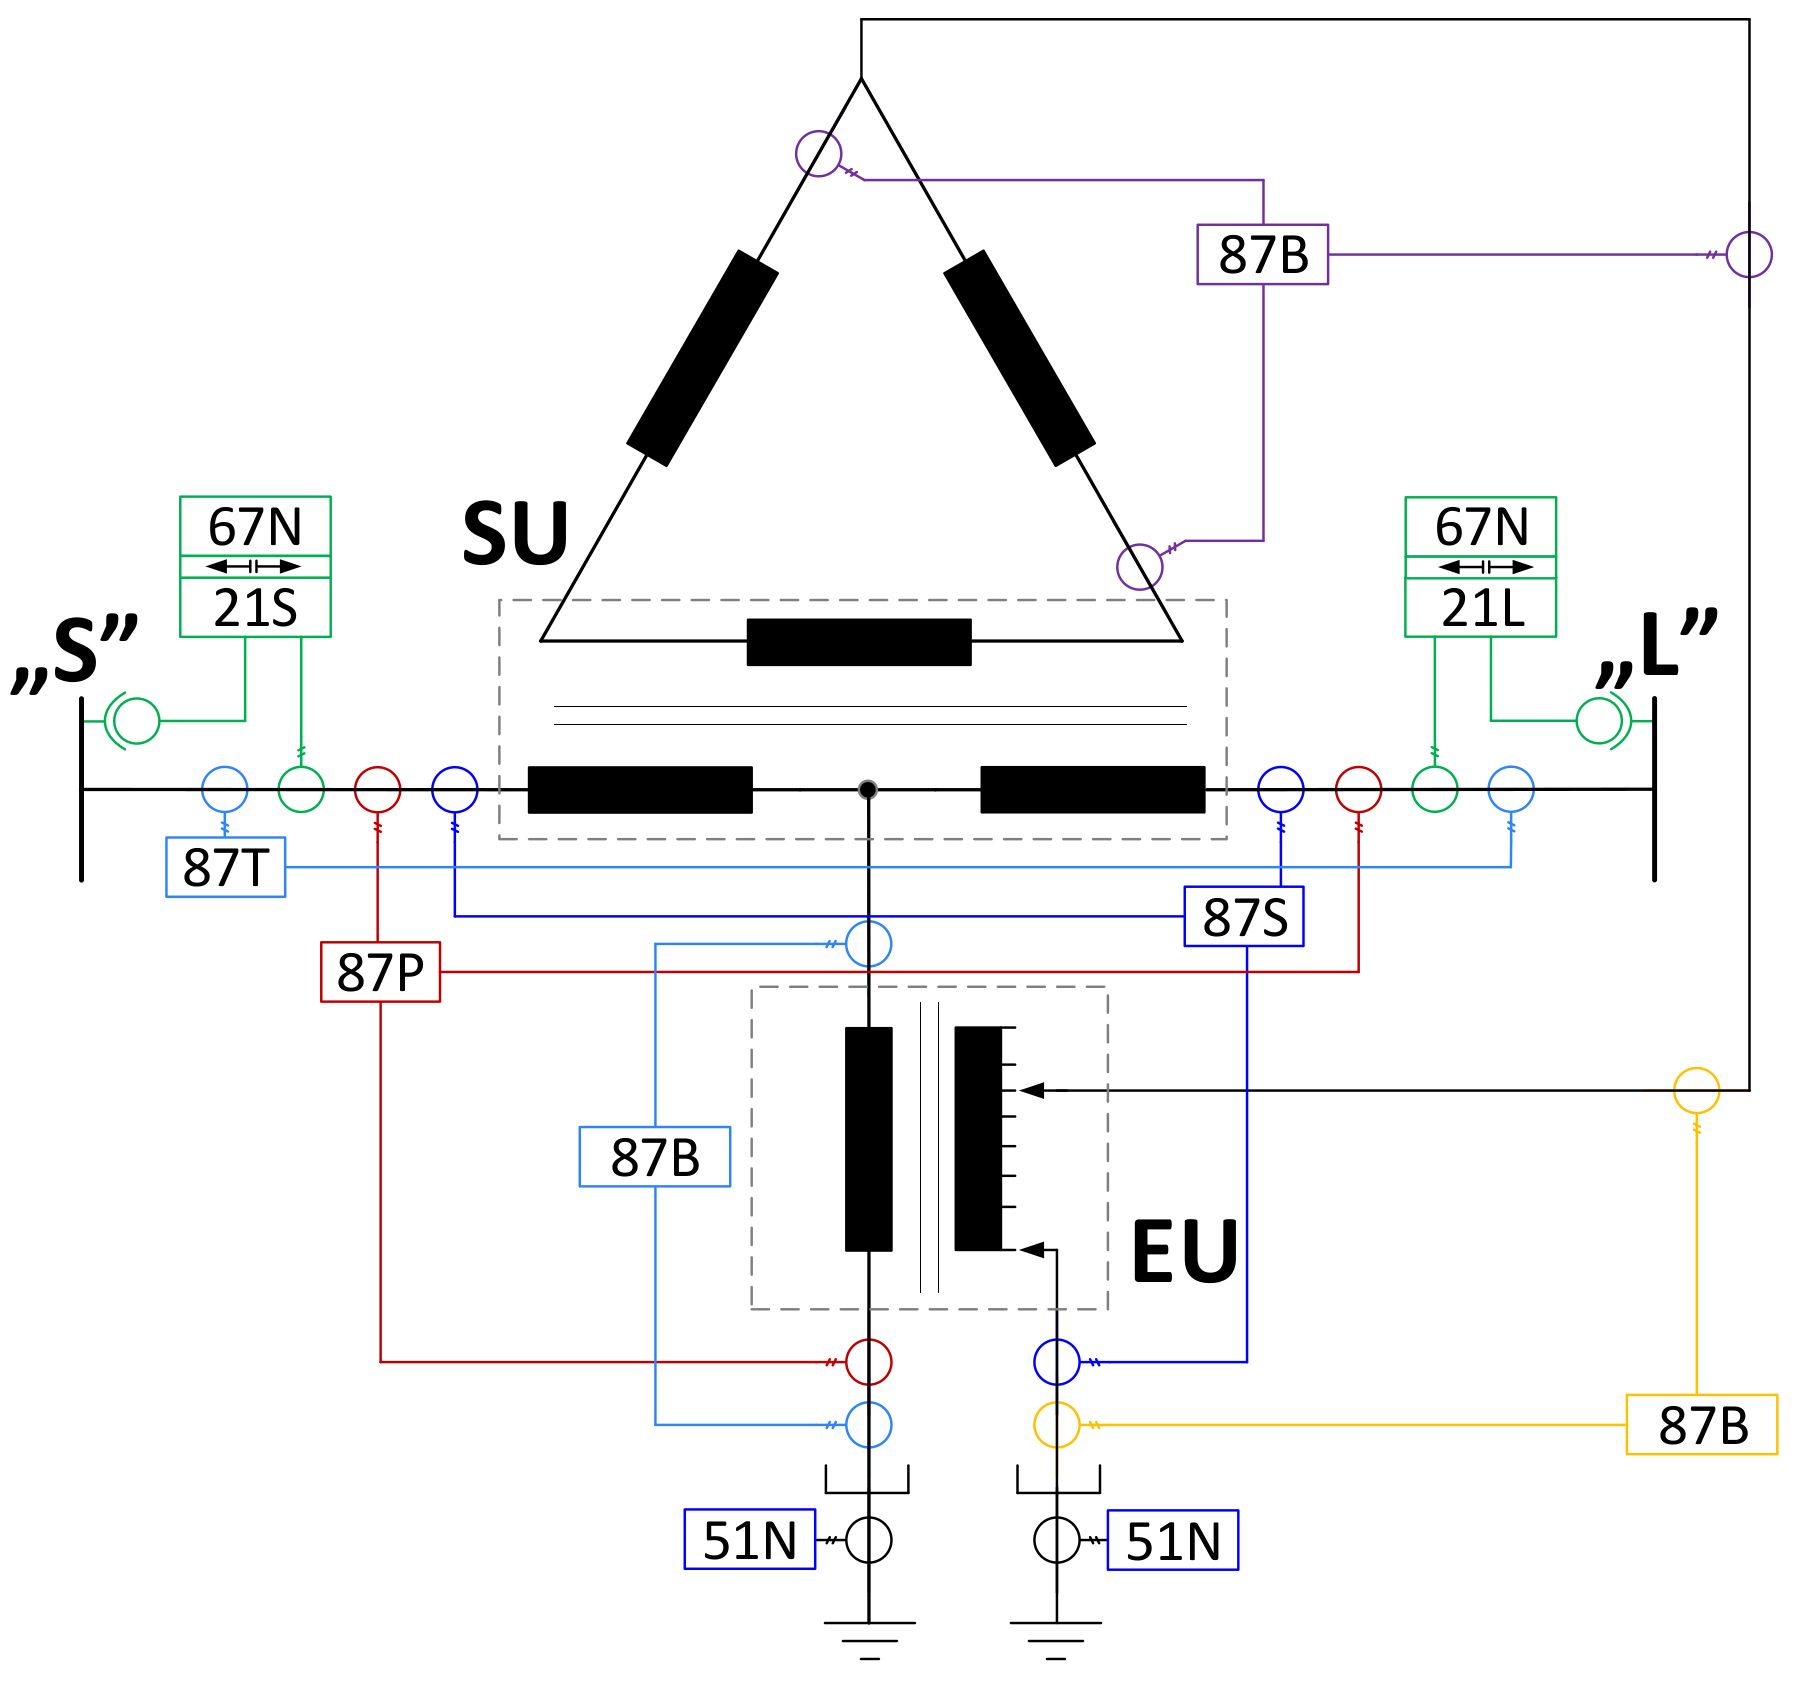
3. Power System Protection Scheme Applied for PST

From [20] is stated that main protection function which should be used for power transformers (PT) with rated power >10 MVA differential protection—87T should be used (note: for better understanding from this place all protection function mentioned in the paper will be described by using ANSI Standard Device Numbers). As the PST is the PTs interconnected between each other it is possible to illustrate if (or when) 87T can be used in a protection scheme for PST. The Figure 9a represent the relevance of the phase shift on the differential current Idiff which is calculated as a difference of current IS (8) and IL (9) referred to the nominal current as a p.u. values:
I diffx =   I _ Sx   I _ Lx
Additionally, is shown how the non-standard phase shift can influence the operation of 87T function in normal load condition amidst of the differential characteristic (Figure 9b) by considering the differential (12) and stabilization (13) current Ibias with using different formulas:
I bias _ 1 = max   I _ Sx ;   I _ Lx I bias _ 2 =   I _ Sx +   I _ Lx I bias _ 3 =   I _ Sx +   I _ Sx + I diff
It can be clearly seen that by using different stabilization current at some point in non-faulty condition the 87T function (example settings Idiff> threshold 0.25 p.u. and slope 1 = 0.5) might operate which is which is undesirable according to mentioned main requirements from protection system (see Section 1.2). For Ibias_1 the phase angle limit is 33°, Ibias_2 = 60° and for Ibias_3 = 41°.
When considering the external faulty condition (outside of the protected area) and the behavior of 87T by using the Equation (14) provided by [21]:
  I _ S 1   I _ S 2   I _ S 3 = U S 3 U L ·   I _ L 1   I _ L 2   I _ L 3 · 1 + 2 cos α 1 + 2 cos α + 120 ° 1 + 2 cos α 120 ° 1 + 2 cos α 120 ° 1 + 2 cos α 1 + 2 cos α + 120 ° 1 + 2 cos α + 120 ° 1 + 2 cos α 120 ° 1 + 2 cos α
can be seen that current transformation for unsymmetrical faults, e.g., phase 1-ground (Figure 10a) and phase 2–3 (Figure 10b) also might have an impact for 87T operation (Figure 11).
By increasing the phase angle α in a range of 0° ÷ 60° with 5° step for external fault phase 1 to ground on the load side of the PST the un-faulted phases (2 and 3) transformation costs that limit of the non-operation function 87T is achieved in phase 3 for 40° phase shift α (Figure 11). Stabilization current Equation used in this example was Ibias_2 (13).
Among others described PST operations conditions are the main reasons for what 87T function shouldn’t be used for PST protection scheme. For that extended protection concept has been developed [21,22] (Figure 12). An approach that PST is visible as two separate transformers units has been used where main protections are differential functions:
87P (P—Primary) is configured as a differential function based on the KCB (Kirchoff Current Balance) and using the current signals from source and load (SU) and primary side of EU,
87S (S—Secondary) is configured as a differential function based on the ATB (Ampere Turns Balance) and using the current signals from source and load (SU) and secondary side of EU.
Additionally:
87B (B—busbar) in some cases is used as an additional differential function based on KCB,
21S & 21L (S—Source and L—Load PST side) distance protection,
51N (N—neutral) earth overcurrent function,
67N directional earth overcurrent function.
The adopted way of approaching the configuration of the PSP structure causes a high degree of its complexity. For such a complex PSP structure one can expect difficulties with correct analysis of all applied protection functions.
Difficulties with testing the correctness of presented (Figure 12) PST protection system functions and settings can be reduced by using multi-variant short circuit simulations. This requires using of an electromagnetic PST model. However, the development of a dedicated PST simulation model requires a detailed recognition of the design and operation of the individual PST components. This is necessary in order to correctly map the working conditions of the PST in dynamic states accompanying short circuits, particularly asymmetrical short circuits (in which case the PST behaves differently from PT). The complexity of the issue and its importance is confirmed by numerous publications, which deal with the subject matter of modelling various types of PST constructions for the purposes of short-circuit and flow analyses [5] ÷ [15] and partly has been also presented in this paper.

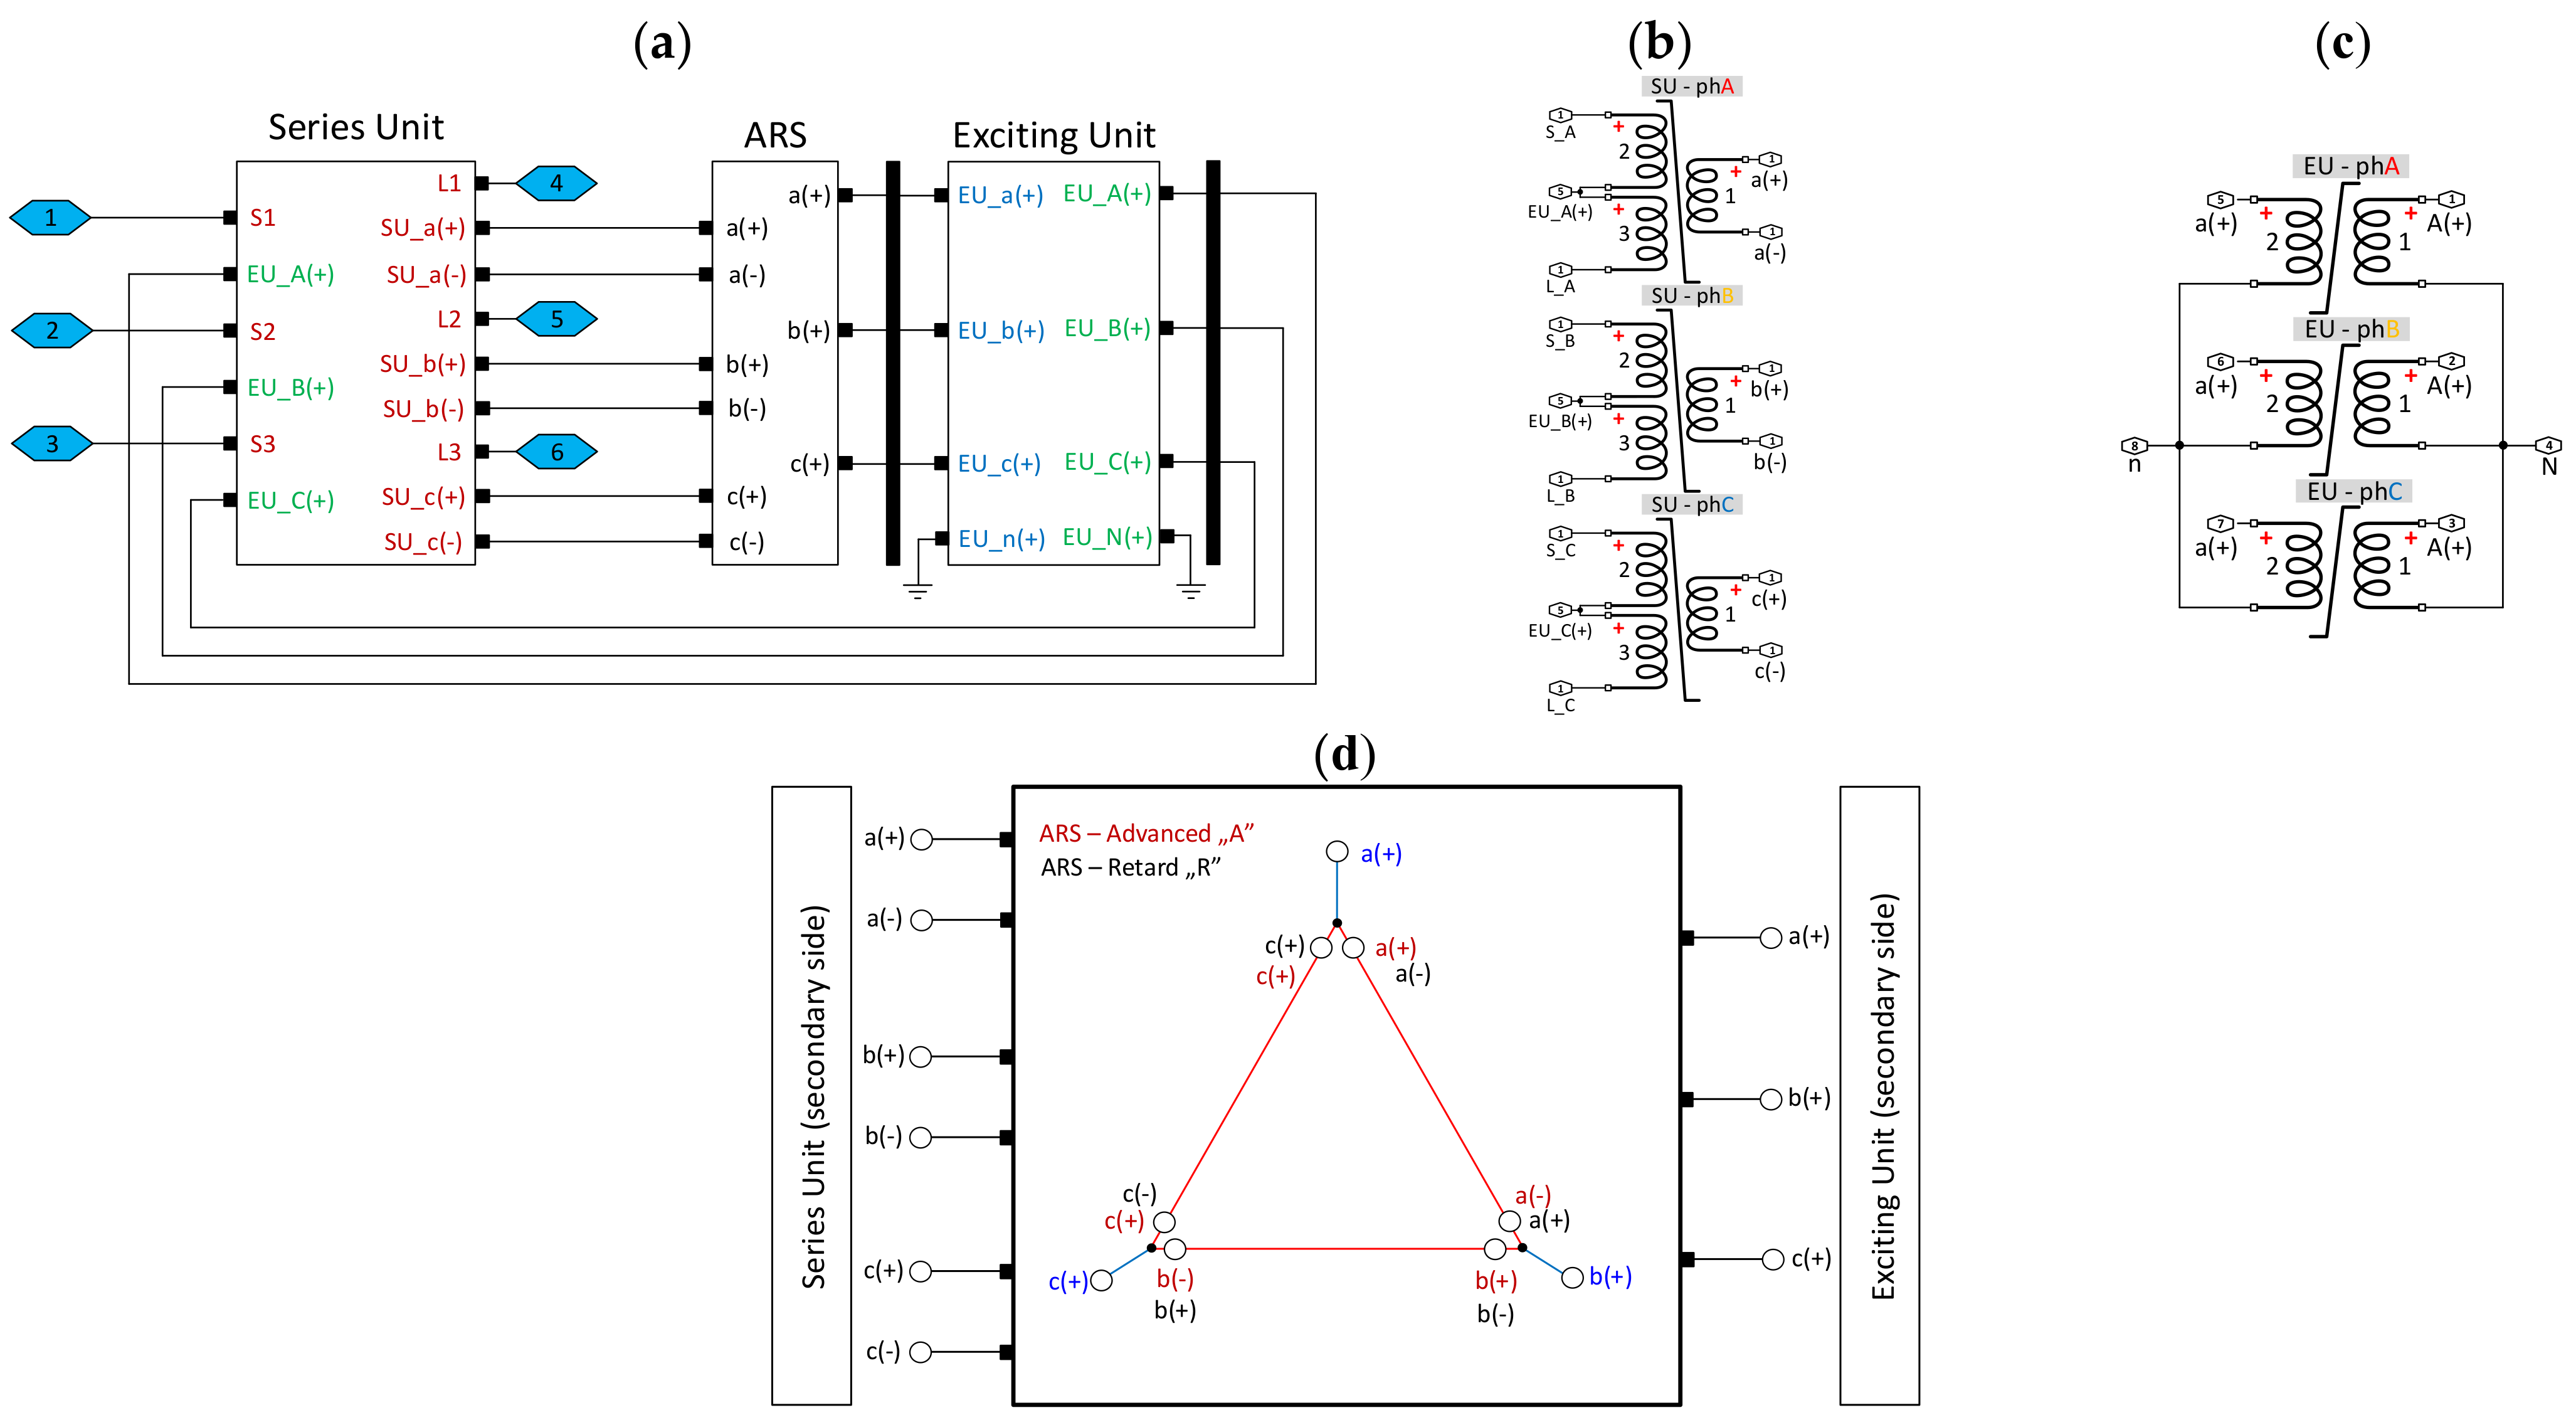
4. Electromagnetic Model of Symmetrical Dual-Tank PST

4.1. General Information about the Model

The proposed PST model is built on the basis of a case study for real application example (Table 1). The available models of single-phase two- and three-winding transformers from the Matlab Simulink library were used for its elaboration, taking into account the required connection layout for the PST construction type under consideration (Figure 3) in a symmetrical two-core solution.
The main challenge of modeling the PST as a two separate units’ approach is to recalculate their parameters by knowing only, the PST data as a one complete unit from the nameplate (Table 1). The short circuit voltages Usc% test procedure is done by making the proper short-circuit on L-PST side Zsc~0 Ω and regulating the 3-ph voltage source Utest (ph-ph value) on the S-PST side to achieve the nominal current In will flow (Figure 13a). Depends if the test current Itest was exactly nominal current or not the short circuit voltage is calculated to the target values by following formula:
U sc % α = U test · I n U n · I test · 100 % Z PST α =   U sc % α · U n 2 100 · S n
The same test procedure is repeated for different phase shift positions and at the end the short circuited impedance are the most important for the future use which can be represented in a simplified short circuit transformer model by considering only the series branch which includes source ZS and load ZL side impedance different for different phase shift position (Figure 13b) and can typically is represented as a one total impedance ZPST =ZS+ZL. Based only on this test procedure is difficult to know what the short circuit parameter for SU and EU are separately.
With knowing only, the base information the procedure for recalculation of SU and EU parameters will be described.

4.2. Series Unit Parameter Calculations for 3-Winding Transformer Model

Series Unit (Figure 14a) is represented as three-winding transformer model (Figure 14b). Starting point for calculating the SU parameters are the nameplate data (Table 1) such a: nominal voltage UPSTn, power Sn, short circuit voltage at neutral TAP (phase shift) position usc%_0 and winding turns ratio of the SU (series/delta winding) NSU.
Wanted values for a used three-winding transformer are: nominal voltages (P-primary, S-secondary, T-tetriary) UPn, USn, UTn, powers SPn, SSn, STn, short circuit voltages for the winding group (PS-primary—secondary, PT—primary—tertiary, ST—secondary—tertiary) Usc%_PS, Usc%_PT, Usc%_ST (Figure 14c) and vector group.
The first step is to calculate the know short circuit impedances of series winding based on the short circuit voltage stated for the neutral TAP position which is 0° phase shift (Table 1). For this position α = 0°only series winding impedance is measured as no phase shift means no current is flowing thru the EU windings:
Z SU = u sc · U n 2 S n = 0.871 · 410 2 1200 = 12.20   Ω     Z S =   Z L = Z SU 2 = 12.20 2 = 6.10   Ω  
When using three-winding transformer model to represent SU its necessary to reflect each winding as a representation of SU windings. For that it has been adopted:
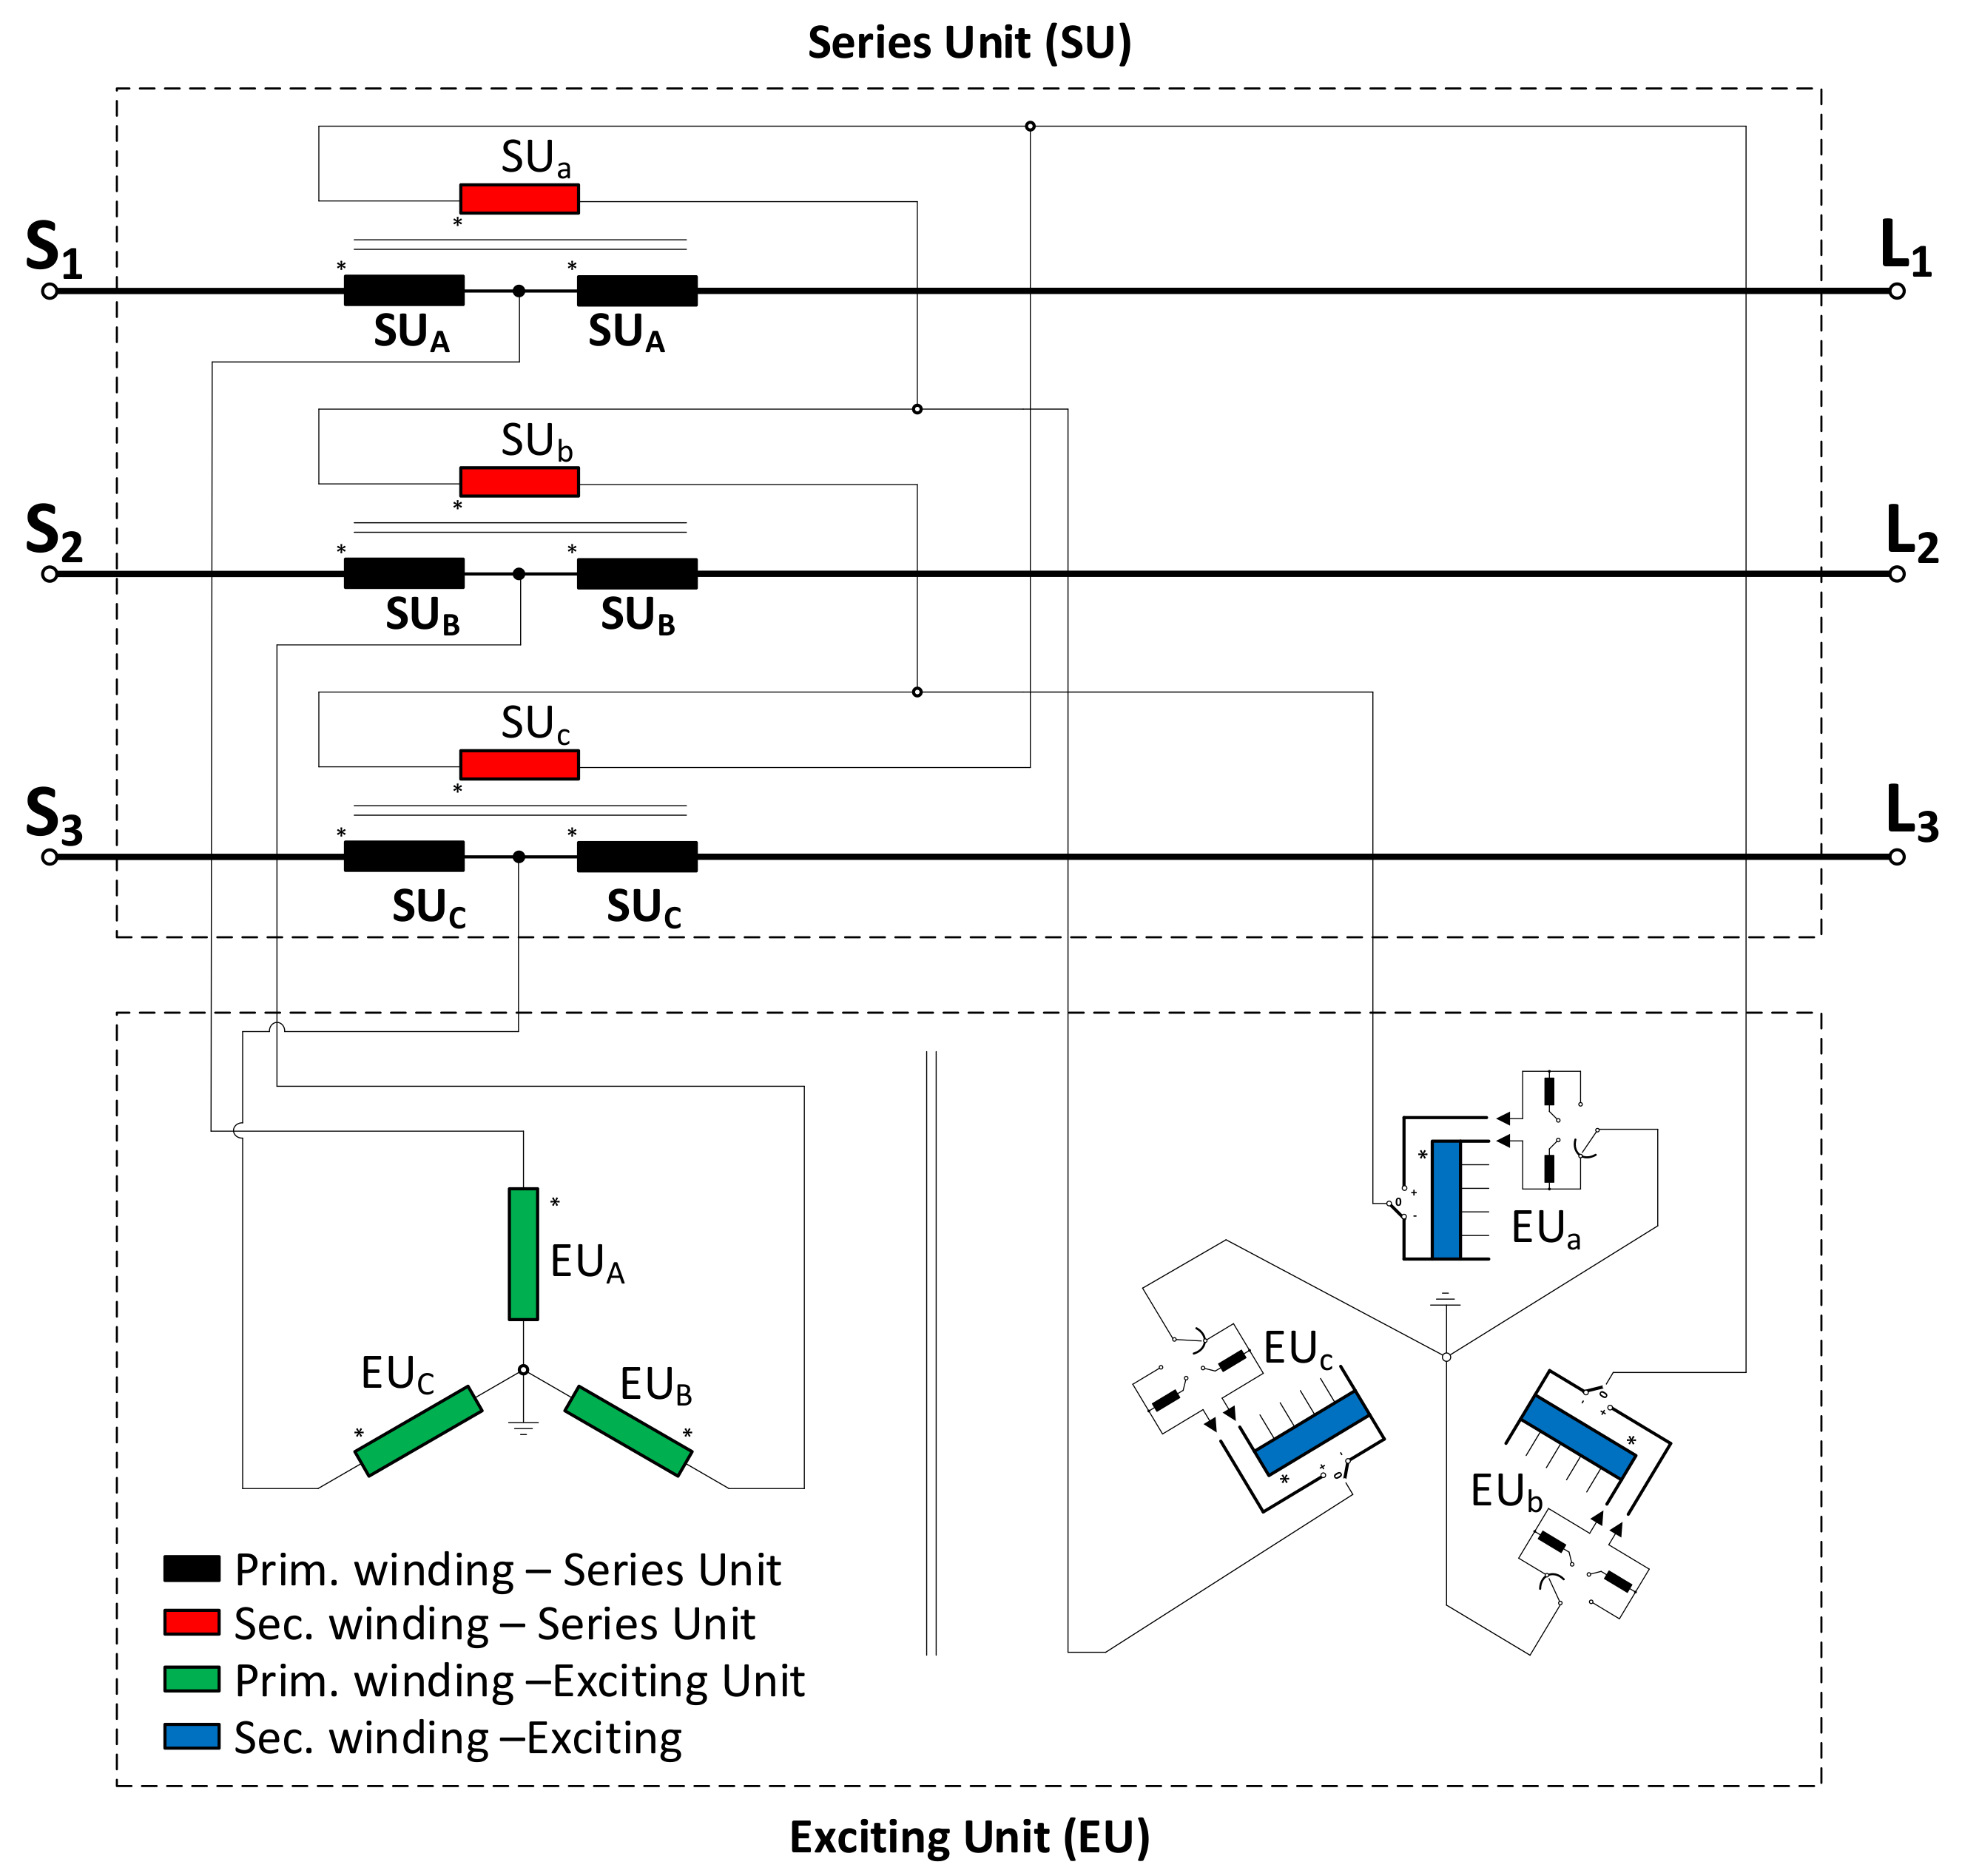
  • Primary and secondary winding of three-winding transformer will represent series winding of SU as it has two equal windings between which primary side of EU is connected;
  • Tertiary winding will represent secondary side of SU connected in delta configuration.
Based on mentioned primary to secondary Usc_PS and primary to tertiary Usc_PT short circuit voltage will be half of the short circuit voltage of PST Usc_PST for α = 0°.
Because the secondary-tertiary short circuit voltage Usc_ST is also influencing pars winding impedance (18) this value is a quarter of the Usc_PST for α = 0°. To calculate the pars winding reactance’s: XP, XS, XT (Figure 14c) based on (17) reference power 1200 MVA (PST rated power) and voltage 410 kV has been used:
X P = U sc _ PS 2 + U sc _ PT 2 U sc _ ST 4 2 · 100 % · U nP 2 S nP = 0.436 + 0.436 0.218 2 · 100 % · 410 2 1200 = 4.58   Ω   X S = U sc ST 4 + U sc PS 2 U sc PT 2 2 · 100 % · U nP 2 S nP = 0.218 + 0.436 0.436 2 · 100 % · 410 2 1200 = 1.53   Ω X T = U sc _ PT 2 + U sc _ ST 4 U sc _ PS 2 2 · 100 % · U nP 2 S nP = 0.436 + 0.218 0.436 2 · 100 % · 410 2 1200 = 1.53   Ω
The configuration of primary and tertiary winding reactance’s represents the series winding from the source side XS:
X S = X P + X T = 4.58 + 1.53 = 6.11   Ω  
Primary and secondary winding reactance’s represents the series winding from the load side XL:
X L = X P + X S = 4.58 + 1.53 = 6.11   Ω  
Finally, the total reactance of the series winding XPST is
X PST = X S + X L = 6.11 + 6.11 = 12.22   Ω  
where reference value (17) is equal to 12.20 Ω.
By knowing the ratio of SU (NSU = 1.345) it is possible to provide the voltages values for each sides of three-winding transformer:
U Pn = U Sn = U PSTn = 410   kV U Tn = U Pn + U Sn N SU = 410 + 410 1.345 = 608.5   kV
Rated Power for all windings were set as the PST rated power 1200 MVA.
The last wanted value for SU is the vector group for tertiary (delta) winding. As has been described in the introduction part to create phase shift between the source and load side voltage vectors quadrature voltage ΔU has to be applied in a phase shift of ±90° ± α/2 (for symmetrical type) this can be achieved by configurating the delta winding with a variable vector group d3—retard and d9—advance position.

4.3. Exciting Unit Parameters Calculations for 2-Winding Transformer Model

The second step is focus on driving the data for EU depends on the OLTC TAP position with already known SU parameters (which are not related to TAP position) and theoretical information’s about voltages and currents distribution inside PST (SU and EU).
Primary side voltage EU is equal to the rated voltage of PST:
U n P _ E U = U n P S T = 410   kV  
Maximum voltage ratio for EU, means secondary side voltage of EU is depends on the maximum phase shift for PST which based on Table 1 is equal to αmax = ±20.1°.
U nS EU _ max = 2 · U nPST 3 · N SU · sin α max 2 = 2 · 410 3 · 1.345 · sin 20.1 2 = 111.3 kV   115   kV
Assuming n = 32 regulation TAP positions the step voltage for OLTC is
U nS EU _ step = U nS EU _ max n = 115 32 = 3.59   kV / TAP
The rated power of the EU is related to the PST rated power (1200 MVA) and αmax = ±20.1°:
S n _ EU = 2 · S n _ EU · sin α max 2 = 2 · 1200 · sin 20.1 2 = 418.8   MVA   ~   419   MVA  
Vector group for EU according to the selected type is YNyn0.
The short circuit reactance (assuming that Z~X) for EU can be find [23] as a function PST impedance for current phase shift position XPST(α), SU reactance XSU (17) and series winding “S” side reactance XS (19—referred to EU power):
X EU = X PST α X SU · cos α 2 2 4 X S · sin α 2 2 4 sin α 2 2 = 34.42   Ω

4.4. Compleate PST Model Description

With all required data (Section 4.2 and Section 4.3) now it is possible to build the complete PST (symmetrical, dual-core). The relevant structure of modelled PST (Figure 15a) contains a sub-model of SU (Figure 15b), EU (Figure 15c), and ARS (Figure 15d) containing internal switch system, by means of which the connection system of the EU secondary side with the SU secondary side is reconfigured as shown in Figure 3. The required measuring sensors inside and outside of the SU and EU tanks are also introduced.
Summarized SU and EU data are presented in Table 2.

5. Discussion of the Simulation Results

To carry out the verification plan of developed PST model, a test network was designed to represent a cross-border connection of two large power grids at the voltage level of 400 kV (Figure 16). The coupling elements of both power system grids are transmission lines and PST installed between them. Grids were modeled as substitute power systems “S” and “L” with parameters selected according to [24]: Ur = 400 kV; φS = 0°; φL = 0°; Ssc = 12.46 GVA; Z1 = (1.23 + 14.77) Ω; Z0 = (6.15 + 24.62) Ω; R0/X1 = 0.42; X0/X1 = 1.67.
The transmission lines on “S” and “L” side of the PST have been modelled as distributed lines with parameters selected according to [12]: tower type Y52; single-line with conductor type AFL 8-525; number of lightning conductors 2x AFL 1.7 x 70 mm2, line length 35 km; Z1 = (1.05 + 11.20) Ω; Z0 = (8.40 + 27.30) Ω; B1 = 120.93 µS; B0 = 79.00 µS.

5.1. Steady State PST Model Verification

The research on the developed PST model in a steady state condition (no faulty) was targeted on verification in terms of fulfilment of regulatory assumptions:
  • according to the regulation type (symmetrical) by changing the EU OLTC TAP position will only lead to a change the phase shift αSL without changing the magnitude of voltage on the “L” side of the PST (test performed in accordance with [3]—tests shall be performed with the assumption of a symmetrical power source on the “S” side and no load on the PST).
  • determination of short circuit voltage Usc% for the positive symmetric components in the order of compliance and zero for representative PST TAP positions (test performed according to [3]).
  • determination of the full range of changes of αSL value in the PST operating state without load and with rated load (@1200 MVA cosφ = 1,0) for the extreme PST control positions (32A—maximum support αSL = +20.1°, 0—neutral position αSL = 0°, 32R—maximum blocking αSL = −20.1°).
The results of the simulation verification tests are summarized in Table 3 and additionally plotted in two charts where Figure 17a represents the full range (OLTC scope) of the impedance changes with no-load and on-load phase shift αSL. Additionally values of the quadrature voltage ΔU and regulation voltage (EU secondary side) were introduced (Figure 17b). Comparison (Table 2) with the nominal and measurement data presented in Table 1 unequivocally confirms the conformity of the developed PST model with its actual equivalent. The αSL adjustment range of the model corresponds exactly to the data on the rating plate. The symmetrical control in the PST has been confirmed (US/UL maintains a constant value over the entire αSL control range, which means no change in the UL voltage value).
Furthermore, the determined values of the short circuit parameters for the positive and zero-sequence symmetrical component correspond to the data from actual object, where reference (based on the nameplate) positive sequence impedance for different TAP position was calculated based on this equation:
X PST α = X PST α = 0 ° + X PST α max X PST α = 0 ° · sin α 2 sin α max 2 2

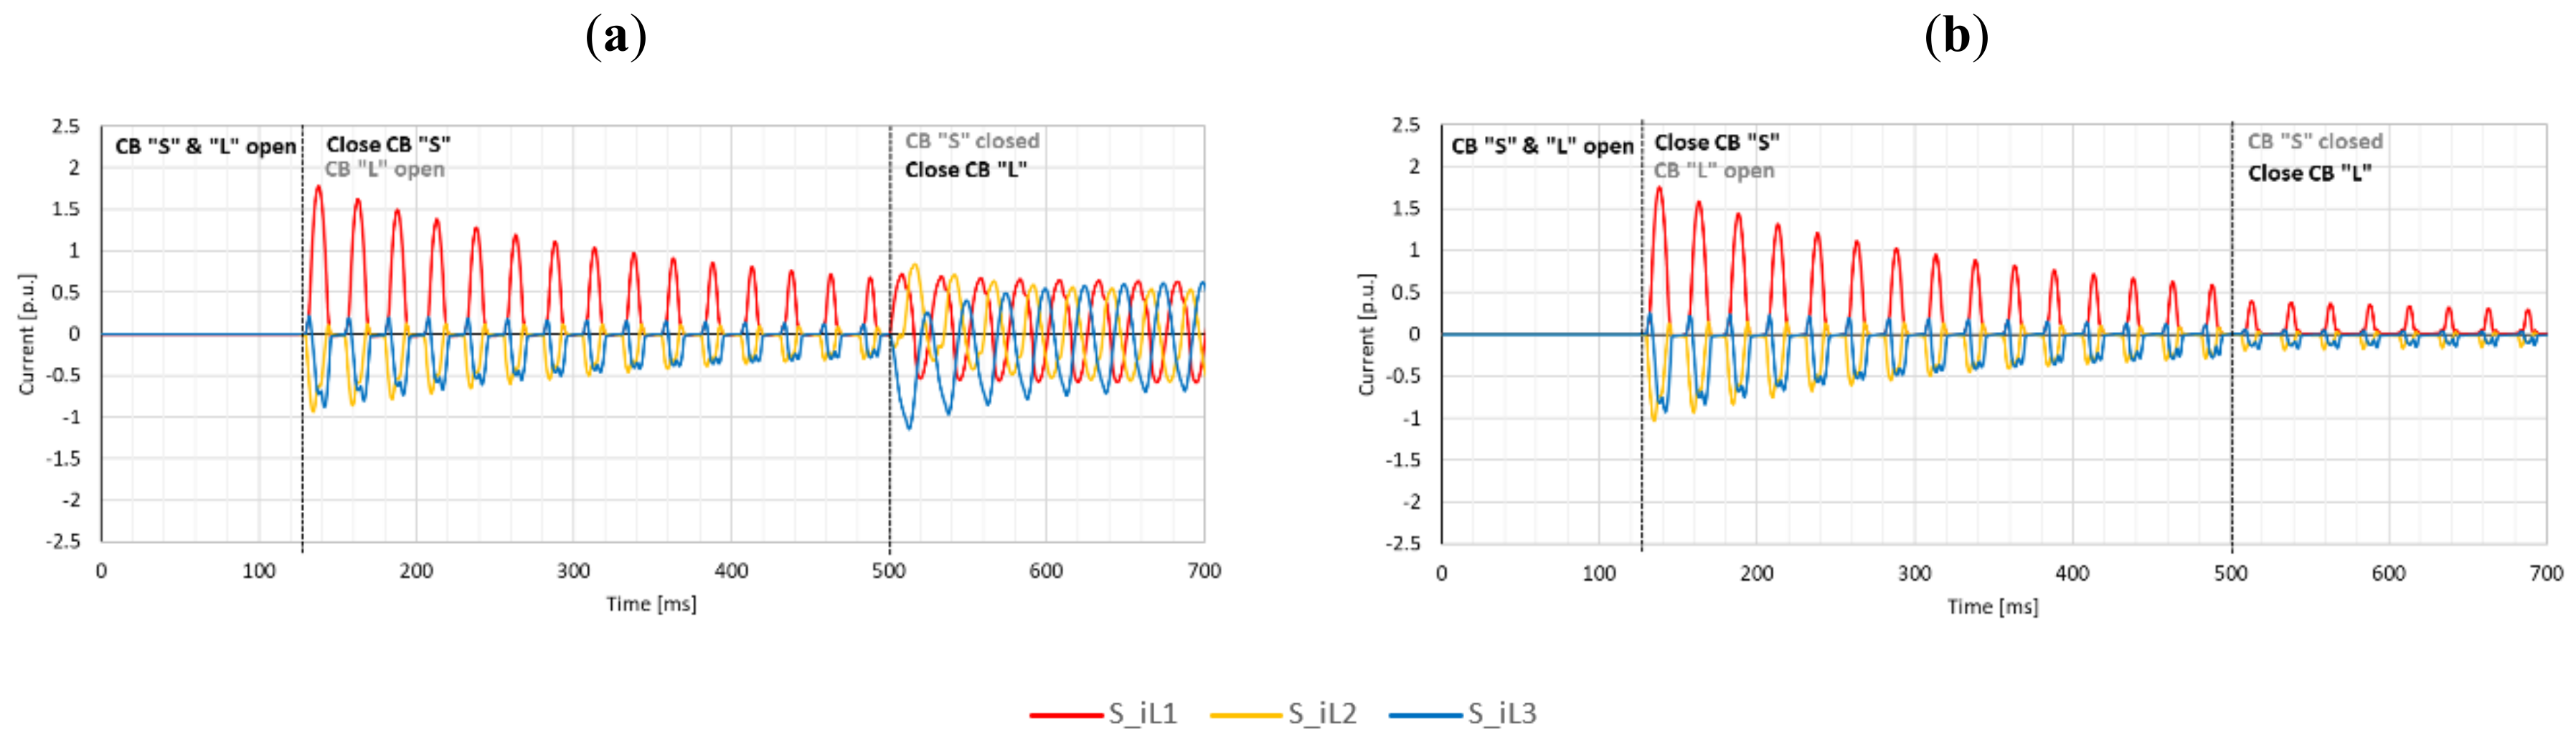
5.2. Transient PST Model Verification

First test procedure for a short circuit studies was done by verification the PST model results according to the standard [21]. Test procedure require to supply PST from the source side and perform at last two types of faults: phase-to-ground and phase-to-phase in the load side and see the short circuit currents transformation done by PST in few different phase shift positions (e.g., ±20°; ±10°; 0°). Table 3 presents the results for the phase-to-ground fault scenario where from the load side current distribution presented in percentage is as follow: IL1 = 100%, IL2 = IL3 = 0%. The source side currents contribution are vitrificated based (Figure 10a). Deviation for this fault’s scenario (Table 4) shows that developed model is represented very accurate where deviation is approximately 0%.
Next fault scenario made for the PST model verification is phase-to-phase L2–L3 (IL1 = 0%, IL2 = 100%, IL3 = −100%). short circuit on the load side and observe currents contribution on source side (Figure 10b). Deviation for this fault’s scenario (Table 5) shows that developed model is represented very accurate where deviation is approximately 0%.
In the second stage of verification of the developed PST model, simulation tests were conducted, which are performed for the purpose of PSP analyses, i.e., phenomena occurring in transition states.
The verification was a two-stage switching on of PST, at time t = 130 ms there was a switch “S”, then after 500 ms a switch “L” was switched on. Courses of momentary values of inrush current (t = 130 ÷ 500 ms) and switching current (t = 500 ÷ 700 ms) for different PST control positions are shown on Figure 18.
Such testing is used for verification of correctness of PSP PST operation, from which tripping is expected to be blocked after detection of the inrush current (this is done by analyzing the shape of the course of the momentary value of phase currents). By simulating the attaching current (Figure 18 t = 500 ÷ 700 ms) it is possible to properly select the position of PST control before it is switched on, in order to reduce the value of amplitude of these currents caused by too big difference of voltage phase angles between connected power grids [25].

6. Using PST Electromagnetic Model for Power System Protection Purposes

6.1. PSP Settings Calculations

PST model can be used for PSP settings calculations by considering different fault scenarios (based on [20]):
different fault loops for extreme and neutral TAP positions: phase-to-ground (LG), phase-to-phase (LL), phase-to-phase with ground (LLG), 3-phase (LLL);
to check the CT’s possible saturations the maximum fault current (LLL) should be investigated for minimum PST impedance (neutral—0°);
for symmetrical dual core PST additionally for EU CT’s possible saturation should be investigated for maximum and minimum PST TAP position;
for external faults with maximum and minimum PST TAP position check possible overexcitation of the SU.

6.2. PSP Verification in a Transient Conditions

Verification of PSP concept scheme with using transient analog signals allowed to verify the behavior of the physical protection algorithms used by the protection relays. The following general aspects of faults scenarios should be considered:
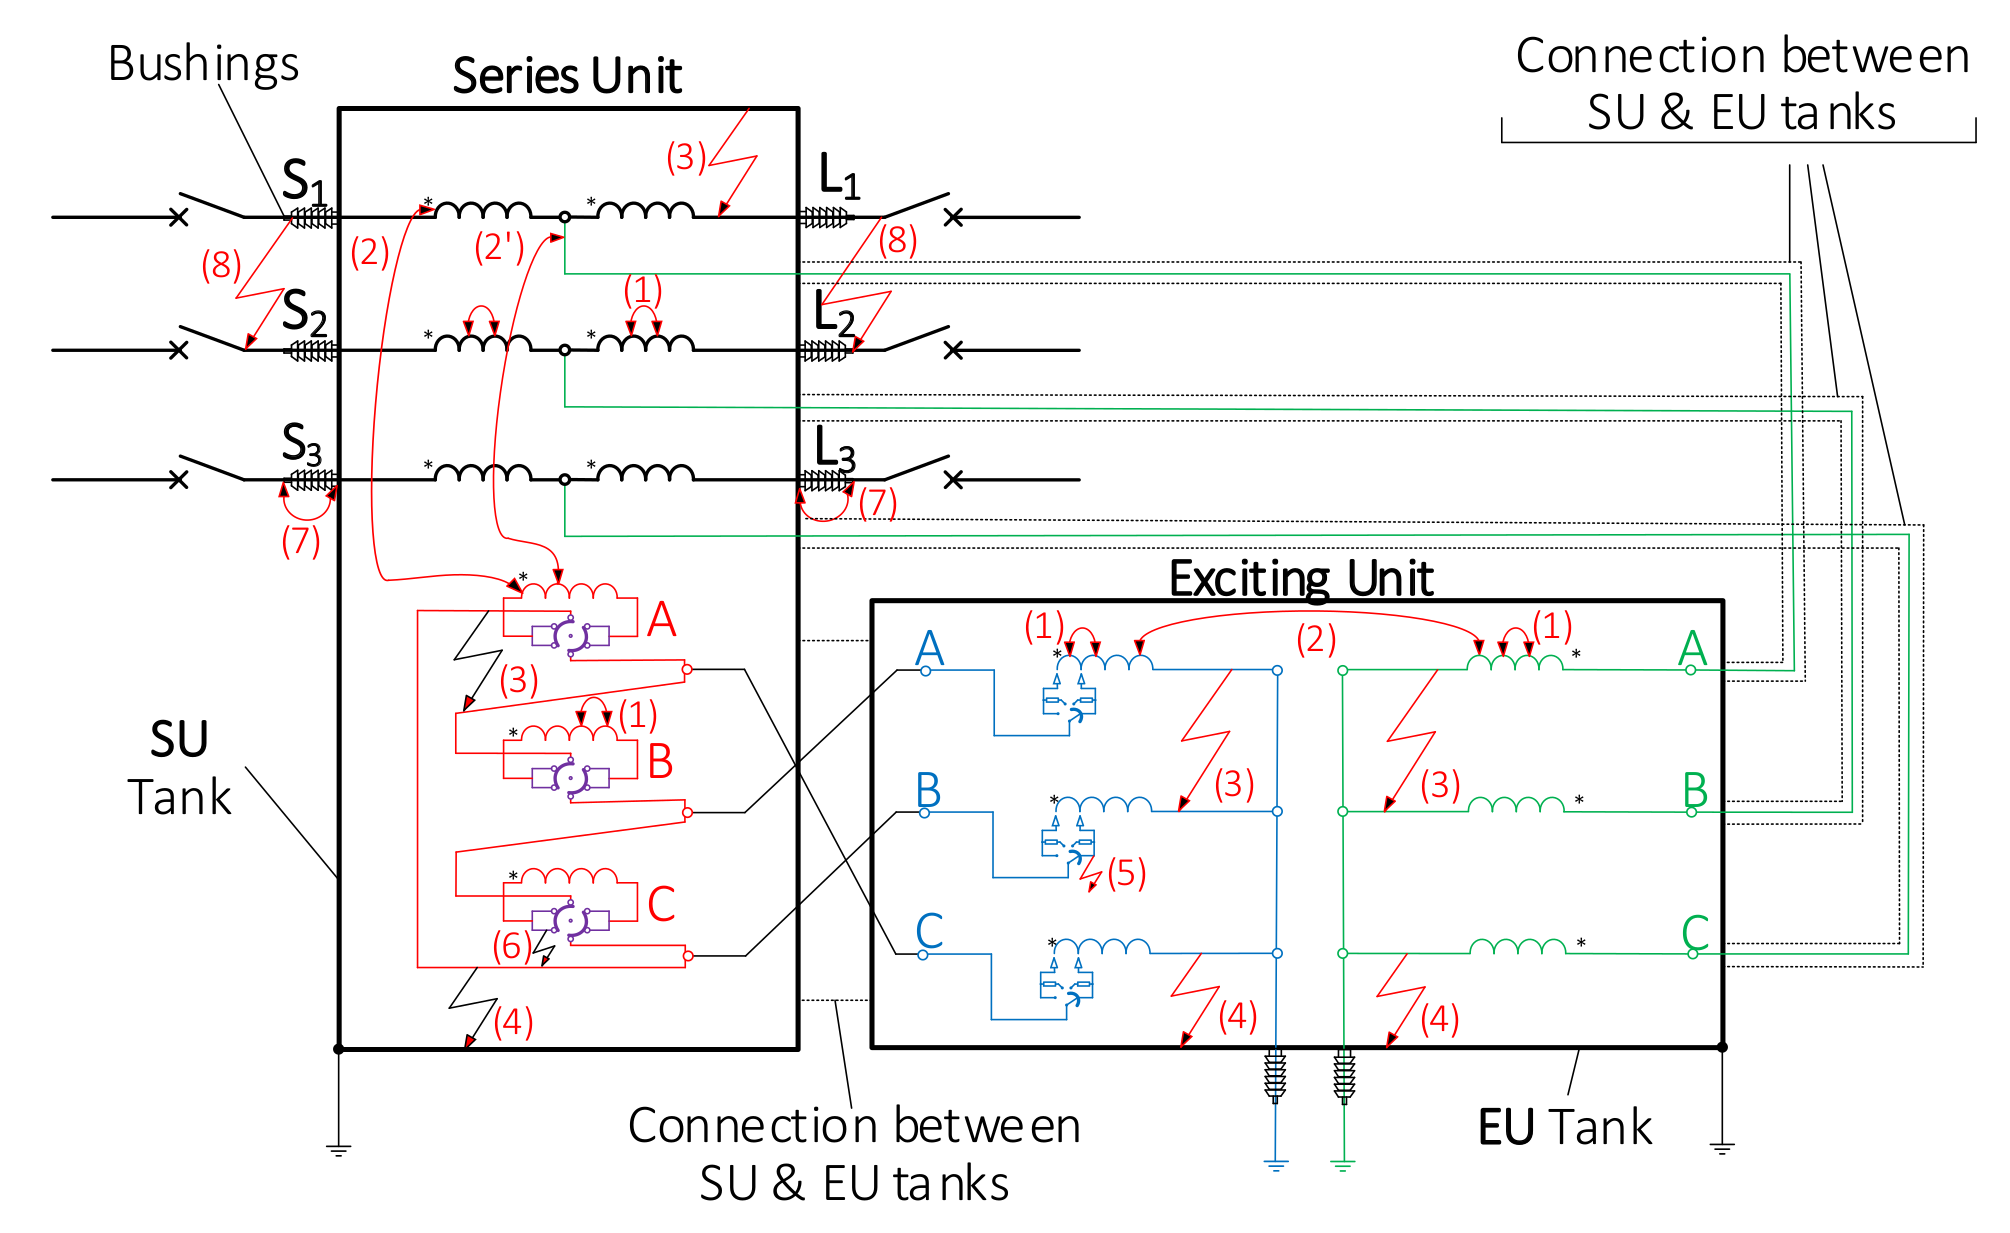
Internal faults (Figure 19): on bushings (LG, LL, LLG, and LLL) and inside the tank SU & EU with turn-to-ground and turn-to-turn faults for different fault position and for extreme and neutral PST TAP position
external faults (Figure 19): on busbar “S” and “L” PST side as on the relevant lines (LG, LL, LLG, and LLL) for extreme and neutral PST TAP position;
Witch such an approach additionally dynamic analog signals are used to check behavior of different protection algorithms:
(a)
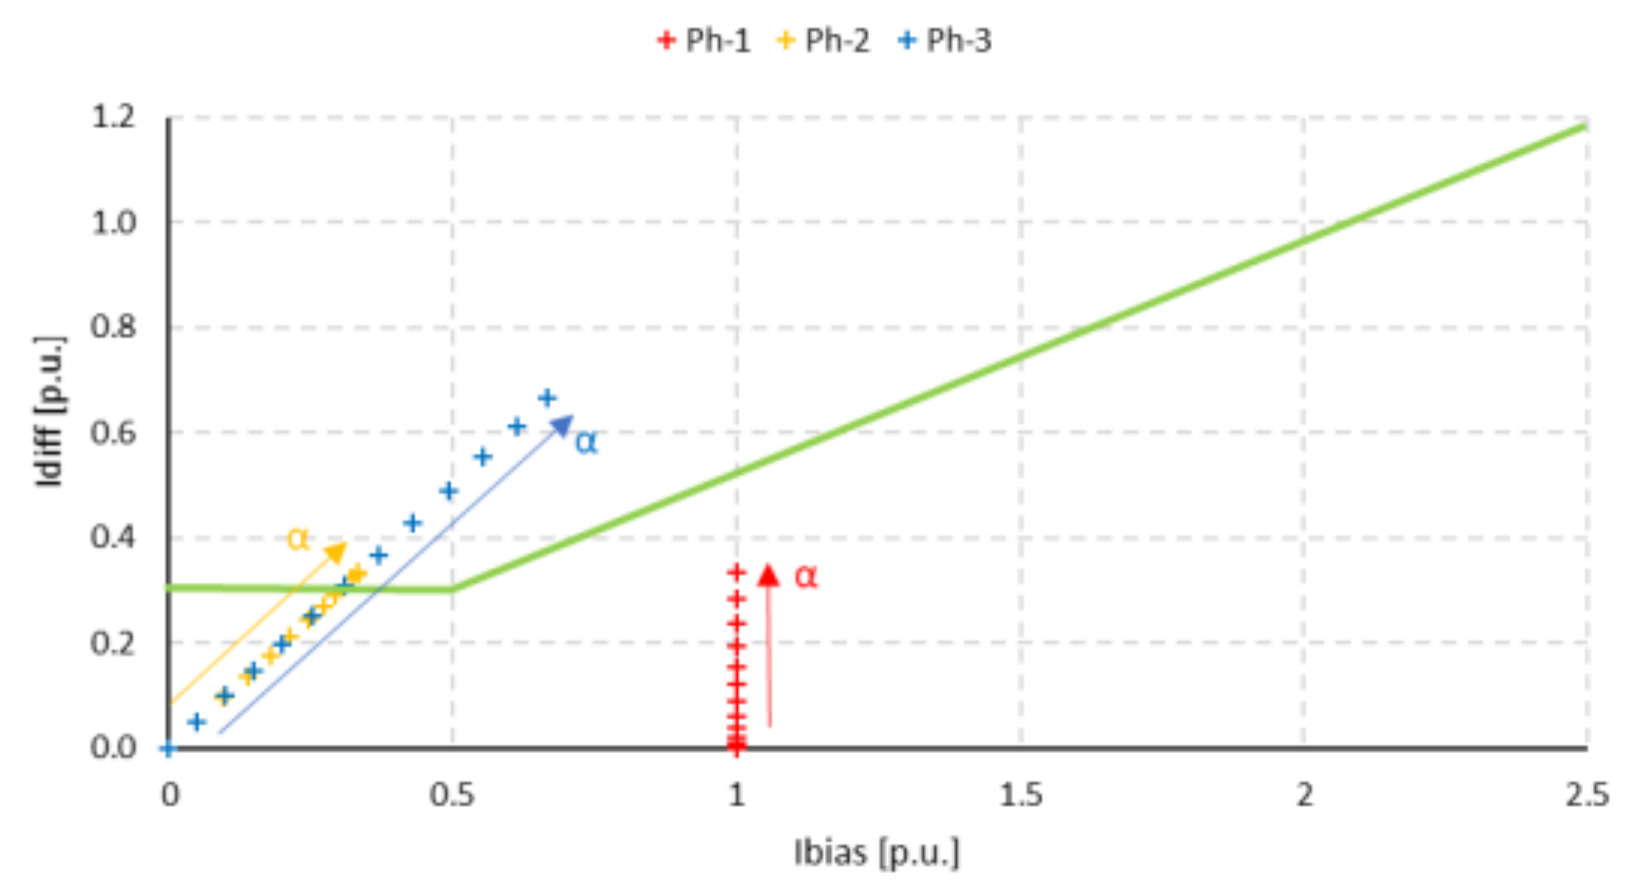
Differential protection (87):
trajectory of differential/restraint current in a differential plane for applied functions (87T or 87P or 87S) considering CT saturations;
energization current inrush studies;
saturation of SU (external faults).
(b)
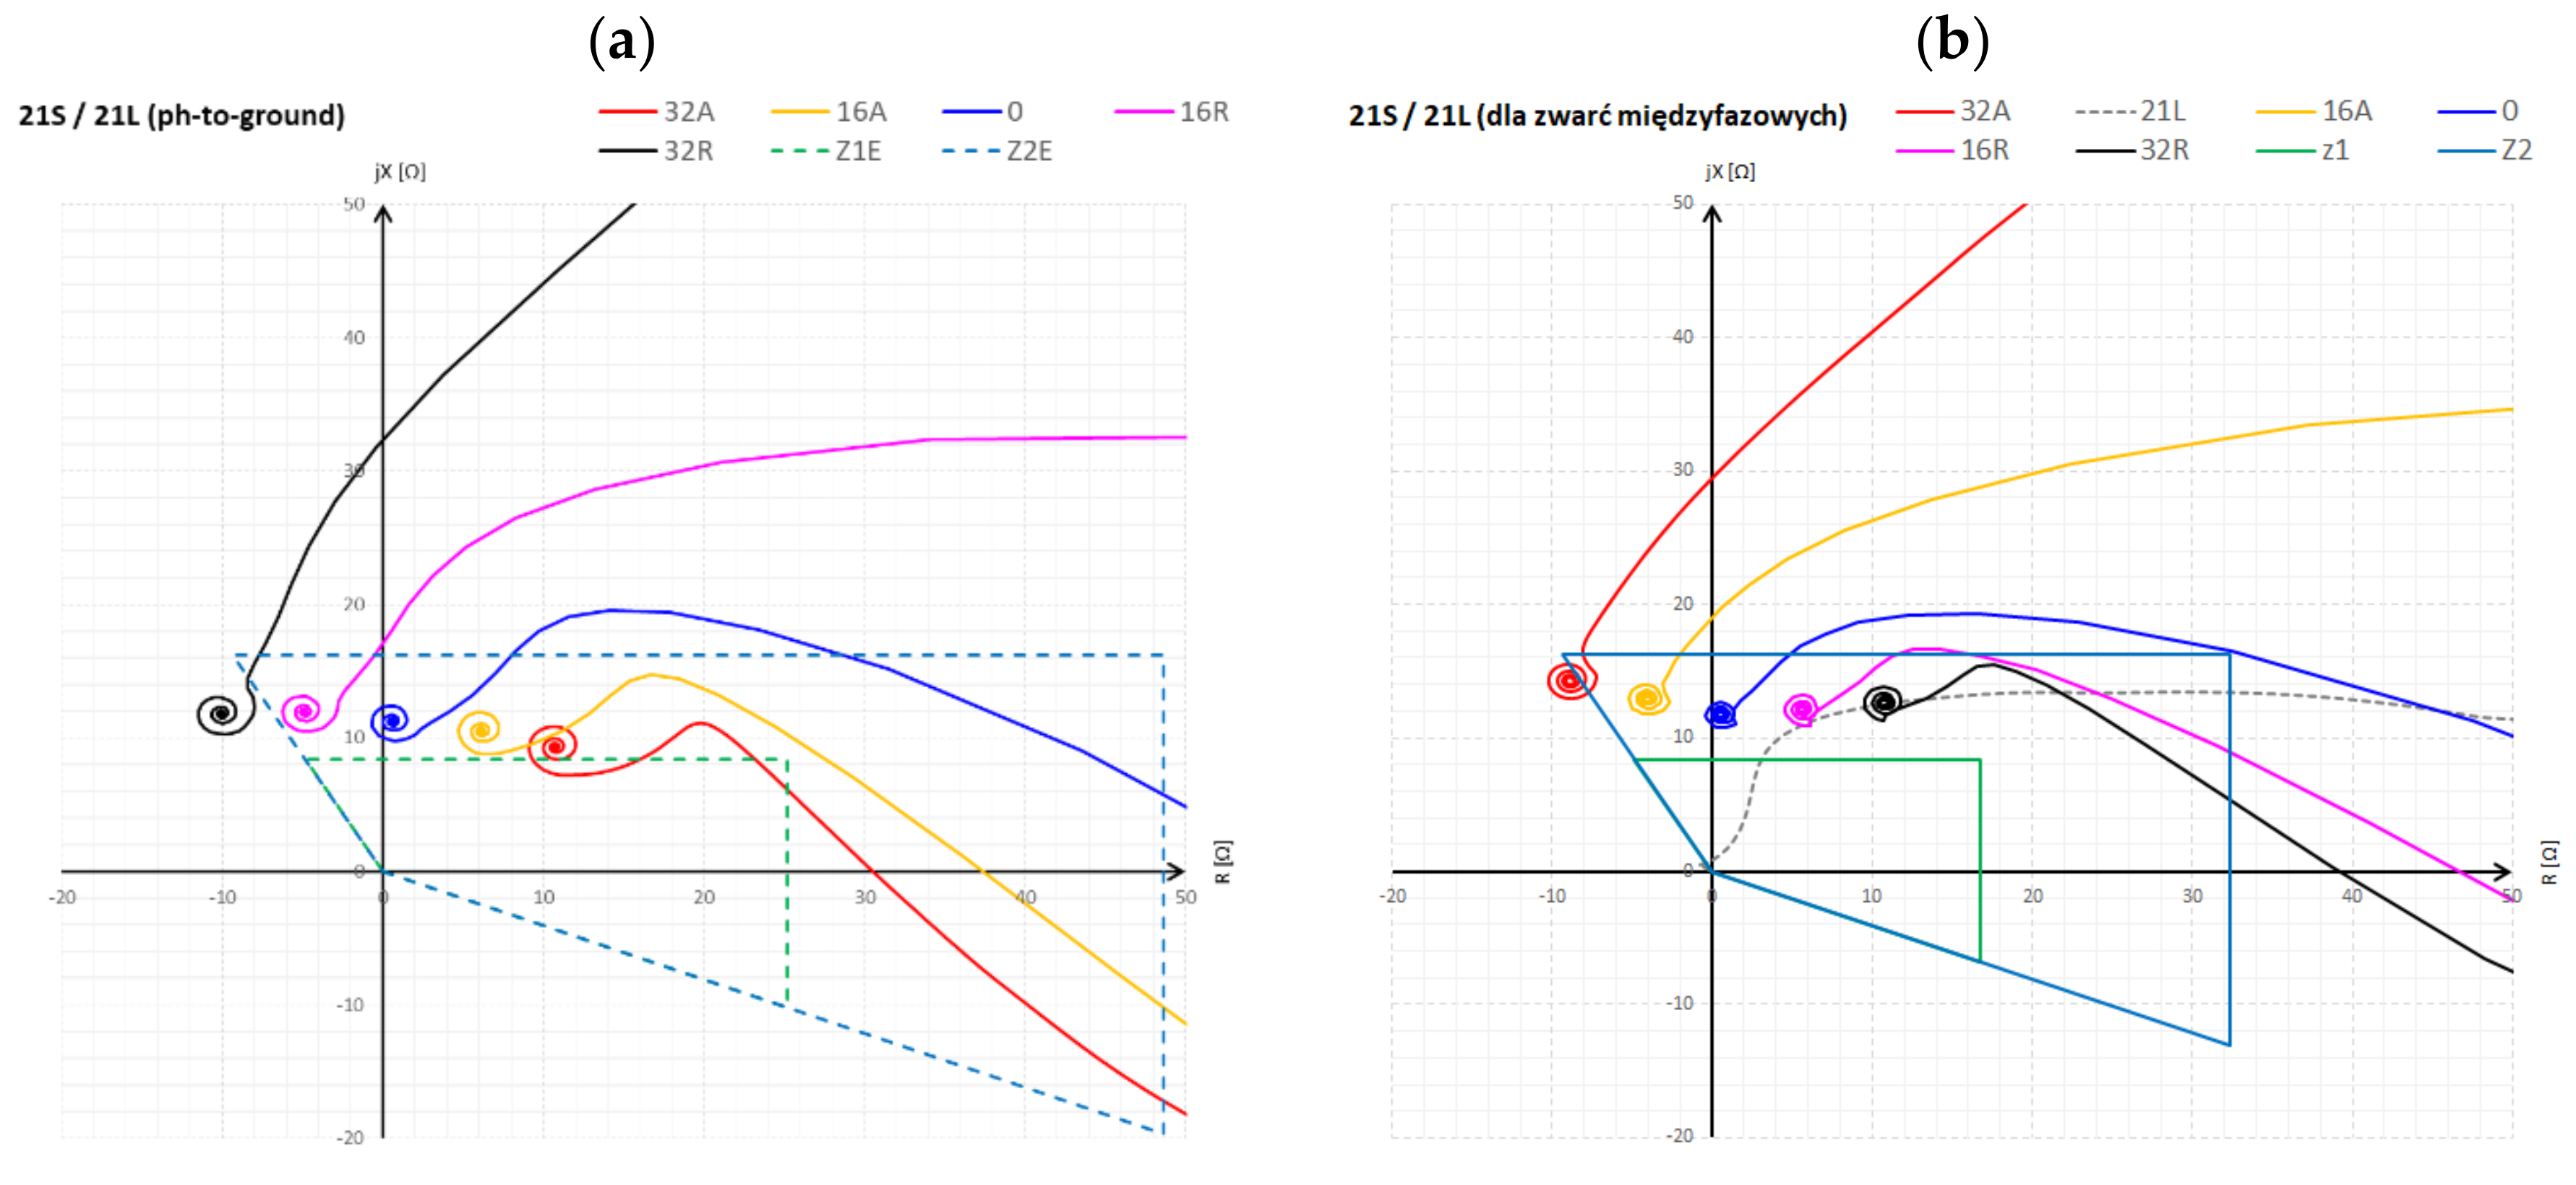
Distance protection (21) and additional active functions:
trajectory of short circuit impedance in a complex impedance plane considering CT saturations;
zone reaches;
tele-protection scheme (if applied);
power swing blocking function
(c)
Overcurrent protection (51):
Time grading and current threshold with accordance to the line protection settings;
energization current inrush studies.

6.3. Example of Transient PSP Studies

The use of the developed PST model for testing the correct operation of PSP has been presented for the simulation of a two-phase metallic short-circuit located at location no. 8 (Figure 19), for different PST TAP position. The distance protection function (21), for which the highest risk of malfunction was identified in [5,13]. The results of short circuit simulation in the test network with the PST model are shown in Figure 20. These are the trajectories of the ends of short circuit loop impedance vectors determined by the protection installed on the “S” side of the PST (21S) and the protection on the “L” side of the PST (21L). There is a noticeable influence of PST control on the value of the vector parameters of the determined impedance, which has a significant impact on the correctness of identification of the short circuit location by the PST distance protection function. This example shows that even two distance relays are located very close to each other it is worth to consider if tele-protection function could be used to reduce the mismatch operation numbers.
Another example of the negative impact of PSTs on protection function 87T was used. The example (Figure 21) shows the external fault L1–L2 at 50% line LS length of the line section S (Figure 16) for a maximum PST TAP position 32A (+20°). In the following example L1–L2 fault causes that the maximum determined differential current Idiff with Ibias comes from non-faulty phase (L3) which cost the mismatch operation.

7. Conclusions

The complexity of the object itself (PST) and its protection scheme force to use simulation programs for the verification process which needs to be done based on dedicated PST model for transient simulations. The biggest challenge of developing realistic PST model is to decode the individual unit is data based on the nameplate data only (Table 1). The research made in the paper prove that proposed procedure for calculating the SU and EU parameters gave the very accurate results (deviation <0.1%) when compare them to the real object data for the normal (Table 3) and short circuit condition (Table 4 and Table 5).
Presented procedure for calculating the unit is data can be used as a base for dual-core, symmetrical PST modeling by using standard available transformer models in different software platforms. This makes the procedure universal. The developed PST model allows for multithreaded simulation studies thanks to reliable mapping of a real object. This allows for its use both for steady state analyses (power distribution and mutual interaction of interconnected parts of power grids) and for the needs of PSP analyses, including—what is particularly important—in electromagnetic transient states accompanying short circuits. The validity of using this type of analysis for the purpose of PSP analysis has been demonstrated for several selected examples.

Author Contributions

Conceptualization T.B., M.S., A.H., P.R.; methodology, T.B., M.S., A.H., P.R., P.S.; validation, T.B., M.S., A.H., P.R., P.S.; formal analysis, T.B., M.S., A.H., P.R., P.S.; investigation, T.B., M.S., A.H.; resources, T.B., M.S.; data curation, T.B., M.S., A.H.; writing—original draft preparation, T.B., M.S.; visualization, T.B.; supervision, A.H., P.S.; project administration, A.H., P.S. All authors have read and agreed to the published version of the manuscript.

Funding

This research received no external funding.

Institutional Review Board Statement

Not applicable.

Informed Consent Statement

Not applicable.

Data Availability Statement

The study did not report any data.

Conflicts of Interest

The authors declare no conflict of interest.

References

  1. Anderski, T. Grid Development for Long Term Planning. e-Highway2050, Final Conference Brussels. 3–4 November 2015. Available online: http://www.pfbach.dk/firma_pfb/e_highway2050_booklet.pdf (accessed on 25 January 2021).
  2. Peirano, E. Technologies Data Base and Technological Innovation Needs Up to 2050. e-Highway2050, Final Conference Brussels. 3–4 November 2015. Available online: https://docs.entsoe.eu/baltic-conf/bites/www.e-highway2050.eu/fileadmin/documents/Results/D3_1_Technology_assessment_from_2030_to_2050.pdf (accessed on 25 January 2021).
  3. Jemielity, J.; Opala, K.; Ogryczak, T. System Sterowania Przesuwnikami Fazowymi SSPF w SE Mikułowa. IEN Gdańsk. 2014. Available online: http://www.ien.gda.pl/pl/offer/705 (accessed on 25 January 2021).
  4. Białas, T.; Dobroczek, A.; Dytry, H.; Lubosny, Z.; Machowski, J.; Tomica, M.; Romantowska, K.; Wroblewska, S.; Wojcik, A. Zasady Doboru i Nastawiania Zabezpieczeń Elementów Systemu Elektroenergetycznego Wysokiego Napięcia; Transmission System Operator Library PSE; WNT: Warsaw, Poland, 2010; ISBN 978-83-931931-0-3. [Google Scholar]
  5. Szubert, K. Influence of Phase Shift Transformer on Distance Protection’s Operation; Available online: http://pe.org.pl/articles/2013/7/40.pdf (accessed on 25 January 2021).
  6. Solak, K.; Rebizant, W.; Schiel, L. Modeling and Analysis of the Single-Core Phase Shifting Transformer and Its Differential Protection. In Proceedings of the 2015 Modern Electric Power Systems (MEPS), Wroclaw, Poland, 6–9 July 2015. [Google Scholar]
  7. Solak, K.; Rebizant, W.; Schiel, L. EMTP Testing of Selected PST Protection Schemes. In Proceedings of the 2014 15th International Scientific Conference on Electric Power Engineering (EPE), Brno, Czech Republic, 12–14 May 2014. [Google Scholar]
  8. Gajić, Z.; Podboj, M.; Traven, B.; Krašovec, A. When existing recommendations can let you down. In Proceedings of the 11th IET International Conference on Developments in Power Systems Protection (DPSP 2012), Birmingham, UK, 23–26 April 2012; ISBN 978-1-84919-620-8. [Google Scholar]
  9. Halinka, A.; Rzepka, P.; Szablicki, M. The “Propagation” of Unsymmetrical Faults by Phase Shifting Transformers (Przenoszenie zwarć niesymetrycznych przez przesuwniki fazowe). Przegląd Elektrotechniczny 2017, 93, 109–112. [Google Scholar]
  10. Thomson, M.J.; Miller, H.; Burger, J. AEP Experience with Protection of Three Delta/Hex Phase Angle Regulating Transformers. In Proceedings of the 60th Annual Georgia Tech Protective Relaying Conference, Atlanta, GA, USA, 2–5 May 2006. [Google Scholar]
  11. Tziouvaras, D.A.; Jimenez, R. 138 kV phase shifting transformer protection: EMTP modeling and model power system testing. In Proceedings of the Eighth IEE International Conference on Developments in Power System Protection, Amsterdam, The Netherlands, 5–8 April 2004; Volume 1, pp. 343–347. [Google Scholar]
  12. Cook, B.; Thomson, M.J.; Garg, K.; Malichkar, M. Phase-Shifting Transformer Control and Protection Settings Verification. In Proceedings of the 2018 71st Annual Conference for Protective Relay Engineers (CPRE), College Station, TX, USA, 26–29 March 2018. [Google Scholar] [CrossRef]
  13. Bednarczyk, T.; Halinka, A.; Rzepka, P.; Szablicki, M. Analiza działania zabezpieczenia podimpedancyjnego dwukadziowego symetrycznego przesuwnika fazowego. Zesz. Nauk. Wydziału Elektrotechniki Autom. Politech. Gdan. 2017, 53, 1–4. [Google Scholar]
  14. Aghdam, H.N. Analysis of Phase-Shifting Transformer (PST), on Congestion management and Voltage Profile in Power System by MATLAB/Simulink Toolbox. Res. J. Appl. Sci. Eng. Technol. 2011, 3, 650–659, ISSN 2040-7467. [Google Scholar]
  15. Youssef, R.D. Phase Shifting Transformer in load flow and short-circuit analysis: Modelling and control. IEE Proc. C 1993, 140, 331–336. [Google Scholar] [CrossRef]
  16. Entsoe. Phase Shifting Transformer Modelling; Version 1.0.0. CGMES V2.4.14; Available online: https://eepublicdownloads.entsoe.eu/clean-documents/CIM_documents/Grid_Model_CIM/ENTSOE_CGMES_v2.4_28May2014_PSTmodelling.pdf (accessed on 25 January 2021).
  17. IEC/IEEE 60076-57-1202: Power Transformers—Part 57-1202: Liquid Immersed Phase-Shifting Transformers. Available online: https://ieeexplore.ieee.org/document/7932247 (accessed on 25 January 2021).
  18. IEEE Std. C57.135-2001. Guide for the Application, Specification, and Testing of Phase-Shifting Transformers. Available online: https://ieeexplore.ieee.org/document/1009183 (accessed on 25 January 2021).
  19. Orosz, T.; Tamus, Z.Á. Impact of short-circuit impedance and tap changing method selection on the key-design parameters of core-form power transformers. Electr. Eng. 2018, 100, 1631–1637. [Google Scholar] [CrossRef]
  20. IEEE Std. C37.91-2000. IEEE Guide for Protective Relay Applications to Power Transformers. Available online: https://ieeexplore.ieee.org/document/875997 (accessed on 25 January 2021).
  21. IEEE Std. C37.245-2018. IEEE Guide for the Application of Protective Relaying for Phase-Shifting Transformers. Available online: https://ieeexplore.ieee.org/document/8721751/definitions#definitions (accessed on 25 January 2021).
  22. Ibrahim, M.A.; Plumptre, F.P. Protection of Phase Angle Regulating Transformers; PSRC WG K1; IEEE Special Publication: Middlesex, NJ, USA, 1999; Available online: https://www.pes-psrc.org/kb/published/reports/Protection_of_PAR_Transformers_Report.pdf (accessed on 25 January 2021).
  23. Jabłoński, M. Podstawowe parametry i schemat zastępczy transformatora do przesuwania fazy. In Transformatory Energetyczne i Specjalne; ZREW: Kazimierz Dolny, Poland, 2002. [Google Scholar]
  24. Kacejko, P.; Machowski, J. Zwarcia w Systemach Elektroenergetycznych; WNT: Warszawa, Poland, 2012. [Google Scholar]
  25. Szablicki, M.; Rzepka, P.; Halinka, A.; Sowa, P. Concept of Control System for Optimal Switching of Phase Shifting Transformers. In Proceedings of the 12th International Conference, Mikulov, Czech Republic, 21–23 May 2018; pp. 1–5. [Google Scholar]
Figure 1. (a) Double infeed network example, (b) power diagram over the phase angle between ES and ER, (c) example of phase shifting transformer (PST) general view.
Energies 14 00627 g001
Figure 2. Division of PSTs by design and adjustment.
Energies 14 00627 g002
Figure 3. Connection diagram of windings for symmetrical dual-core PST (vector group IIId S0-3/9).
Energies 14 00627 g003
Figure 4. Quadrature voltage adjustment.
Energies 14 00627 g004
Figure 5. Voltage vector diagram for individual PST transformer units based on symmetrical, dual-tank solution with rated voltage of 400 kV and maximum phase shift adjustment (±20°).
Energies 14 00627 g005
Figure 6. (b) PST representation model for a load condition study and relevant vector diagrams visualization for load condition impact on the phase shift for (a) advance and (c) retard position.
Energies 14 00627 g006
Figure 7. PST, ATR, and TR impedance in a function of the OLTC TAP position.
Energies 14 00627 g007
Figure 8. Symmetrical dual-core PST single line diagram for current distribution investigation (only 1-ph shown) for (a) advance and (b) retard position.
Energies 14 00627 g008
Figure 9. Influence of non-standard phase shift on (a) differential current, (b) differential & bias current amidst of the differential characteristic.
Energies 14 00627 g009
Figure 10. PST “S” side short circuit current contribution for (a) phase-to-ground and (b) phase-to-phase fault on “L” side.
Energies 14 00627 g010
Figure 11. Non-standard phase shift influence on differential function 87T.
Energies 14 00627 g011
Figure 12. Example of a PSP for symmetrical PST (scheme for one phase only).
Energies 14 00627 g012
Figure 13. (a) General view of PST under short circuit test procedure and their (b) equivalent simplified circuit.
Energies 14 00627 g013
Figure 14. (a) Physical model of SU, (b) 3-winding transformer model used for SU representation and their (c) short circuit equivalent circuit (where * is a beginning of the coil).
Energies 14 00627 g014
Figure 15. (a) General view of the PST to be modelled and internal layout of the model for (b) serial unit, (c) add-on unit, (d) ARS switch.
Energies 14 00627 g015
Figure 16. System under test diagram with developed PST model.
Energies 14 00627 g016
Figure 17. Total range (a) PST impedance and phase shift adjustment for no- and on-load condition with reflecting to (b) EU regulation voltage parameters and quadrature voltage.
Energies 14 00627 g017
Figure 18. Inrush current during two step approach switching on the PST to the network for the tap position (a) 32R and (b) 0.
Energies 14 00627 g018
Figure 19. Possible place for faults in the PST model.
Energies 14 00627 g019
Figure 20. Short-circuit impedance trajectories z for a short circuit loop (a) phase-to-ground (LG), (b) phase-to-phase (LL).
Energies 14 00627 g020
Figure 21. Differential and stabilization current trajectories.
Energies 14 00627 g021
Table 1. Rated data of the modelled PST [3].
DescriptionParameterUnit
Rated powerSr1200 MVA
Rated voltageUr410 kV
Rated currentIr1690 A
Number of turns SUPrim/delta winding1.345
Vector groupIIId S0-3/9
Phase shift adjustment (63 TAPs ±32 and 0)OLTC + ARS in delta winding
Phase adjustment angle range in no-load conditionαSL0±20.1°
Phase adjustment angle range in load condition
(1200 MVA and cosφ = 1)
αSL_load+13.4°
−26.7°
Short-circuit voltage in accordance with the characteristic OLTC/ARS positionsuk% αSL(−)11.58%
uk% αSL(0)8.71%
uk% αSL(+)11.58%
Load losses ΔPCu in accordance with the characteristic OLTC/ARS positionsαSL(−)2052 W
αSL(0)995.9 W
αSL(+)2048 W
Short circuit zero-sequence impedanceZ012.23 Ω
Table 2. Summarized serial unit (SU) and exciting unit (EU) calculated data.
UnitRated VoltageRated PowerShort Circuit VoltageVector Group
UPn/USn/UTnSPn/SSn/STnUsc_PS%/Usc_PT%/Usc_ST%
kVGVA%
SU410/410/608.51200/1200/12004.36/4.36/2.18 @1.2 GVAIII/III/d3–9
EU410/1154198.56 @0.419 GVAYNyn0
Table 3. Results of parameters and regulation capabilities of the developed PST model.
OptionOLTC/ARS TAP Position
32(A)0−32(R)
Adjustment angle αSL (no-load condition)+20.1°0.1°−20.1°
US/UL ratio (no-load condition)1.021.021.02
Adjustment range of phase shift αSL in load condition (1200 MVA)+13.4°−5.1°−26.7°
Determined short circuit voltage Usc%11.58%8.71%11.58%
Zero-sequence impedance12.22 Ω
Table 4. Short circuit currents contribution for phase-to-ground fault scenario (L1–N).
αIEEEPST Model
IS (%)IL (%)IS (%)IL (%)Deviation (%)
S1S2S3L1L2L3S1S2S3L1L2L3S1S2S3
−20°95.9721.7517.731000095.9721.7617.73100000.0000.0150.017
−10°98.9810.539.511000098.9910.539.51100000.0050.0030.006
1000010000100.00.040.03100000.0000.0000.000
+10°98.989.5110.531000098.999.5110.53100000.0050.006−0.003
+20°95.9717.7321.751000095.9717.7321.75100000.0000.0170.012
Table 5. Short circuit currents contribution for phase-to-phase fault scenario (L2–L3).
αIEEEPST Model
IS (%)IL (%)IS (%)IL (%)Deviation (%)
S1S2S3L1L2−L3S1S2S3L1L2−L3S1S2S3
−20°39.49113.7174.22010010039.50113.7274.2201001000.0170.0070.002
−10°20.05108.5088.45010010020.05108.588.4501001000.0020.0040.002
010010001001000.00100.0399.9601001000.0000.039−0.04
+10°20.0588.45108.50010010020.0588.45108.5101001000.0020.0020.004
+20°39.4974.202113.71010010039.5074.22113.7201001000.0170.0020.007
Publisher’s Note: MDPI stays neutral with regard to jurisdictional claims in published maps and institutional affiliations.

