A Data-Driven Approach to Extend Failure Analysis: A Framework Development and a Case Study on a Hydroelectric Power Plant

 , ,
, ,  ,
,  ,
,
Abstract
1. Introduction
Data-Driven Failure Analysis Approaches
2. Materials and Methods
- Data collection and understanding
- Determination of the relevant associations
- Social network analysis and insights definition.
2.1. Data Collection and Understanding
2.2. Determination of the Relevant Associations
- Define min_sup: the minimum support threshold required to consider a rule;
- Define min_conf: the minimum confidence threshold required to consider a rule;
- Use the FP-growth algorithm [27] to determine the frequent itemsets;
- Combine pairs of frequent itemsets to create the association rules; delete rules having confidence lower than min_conf.
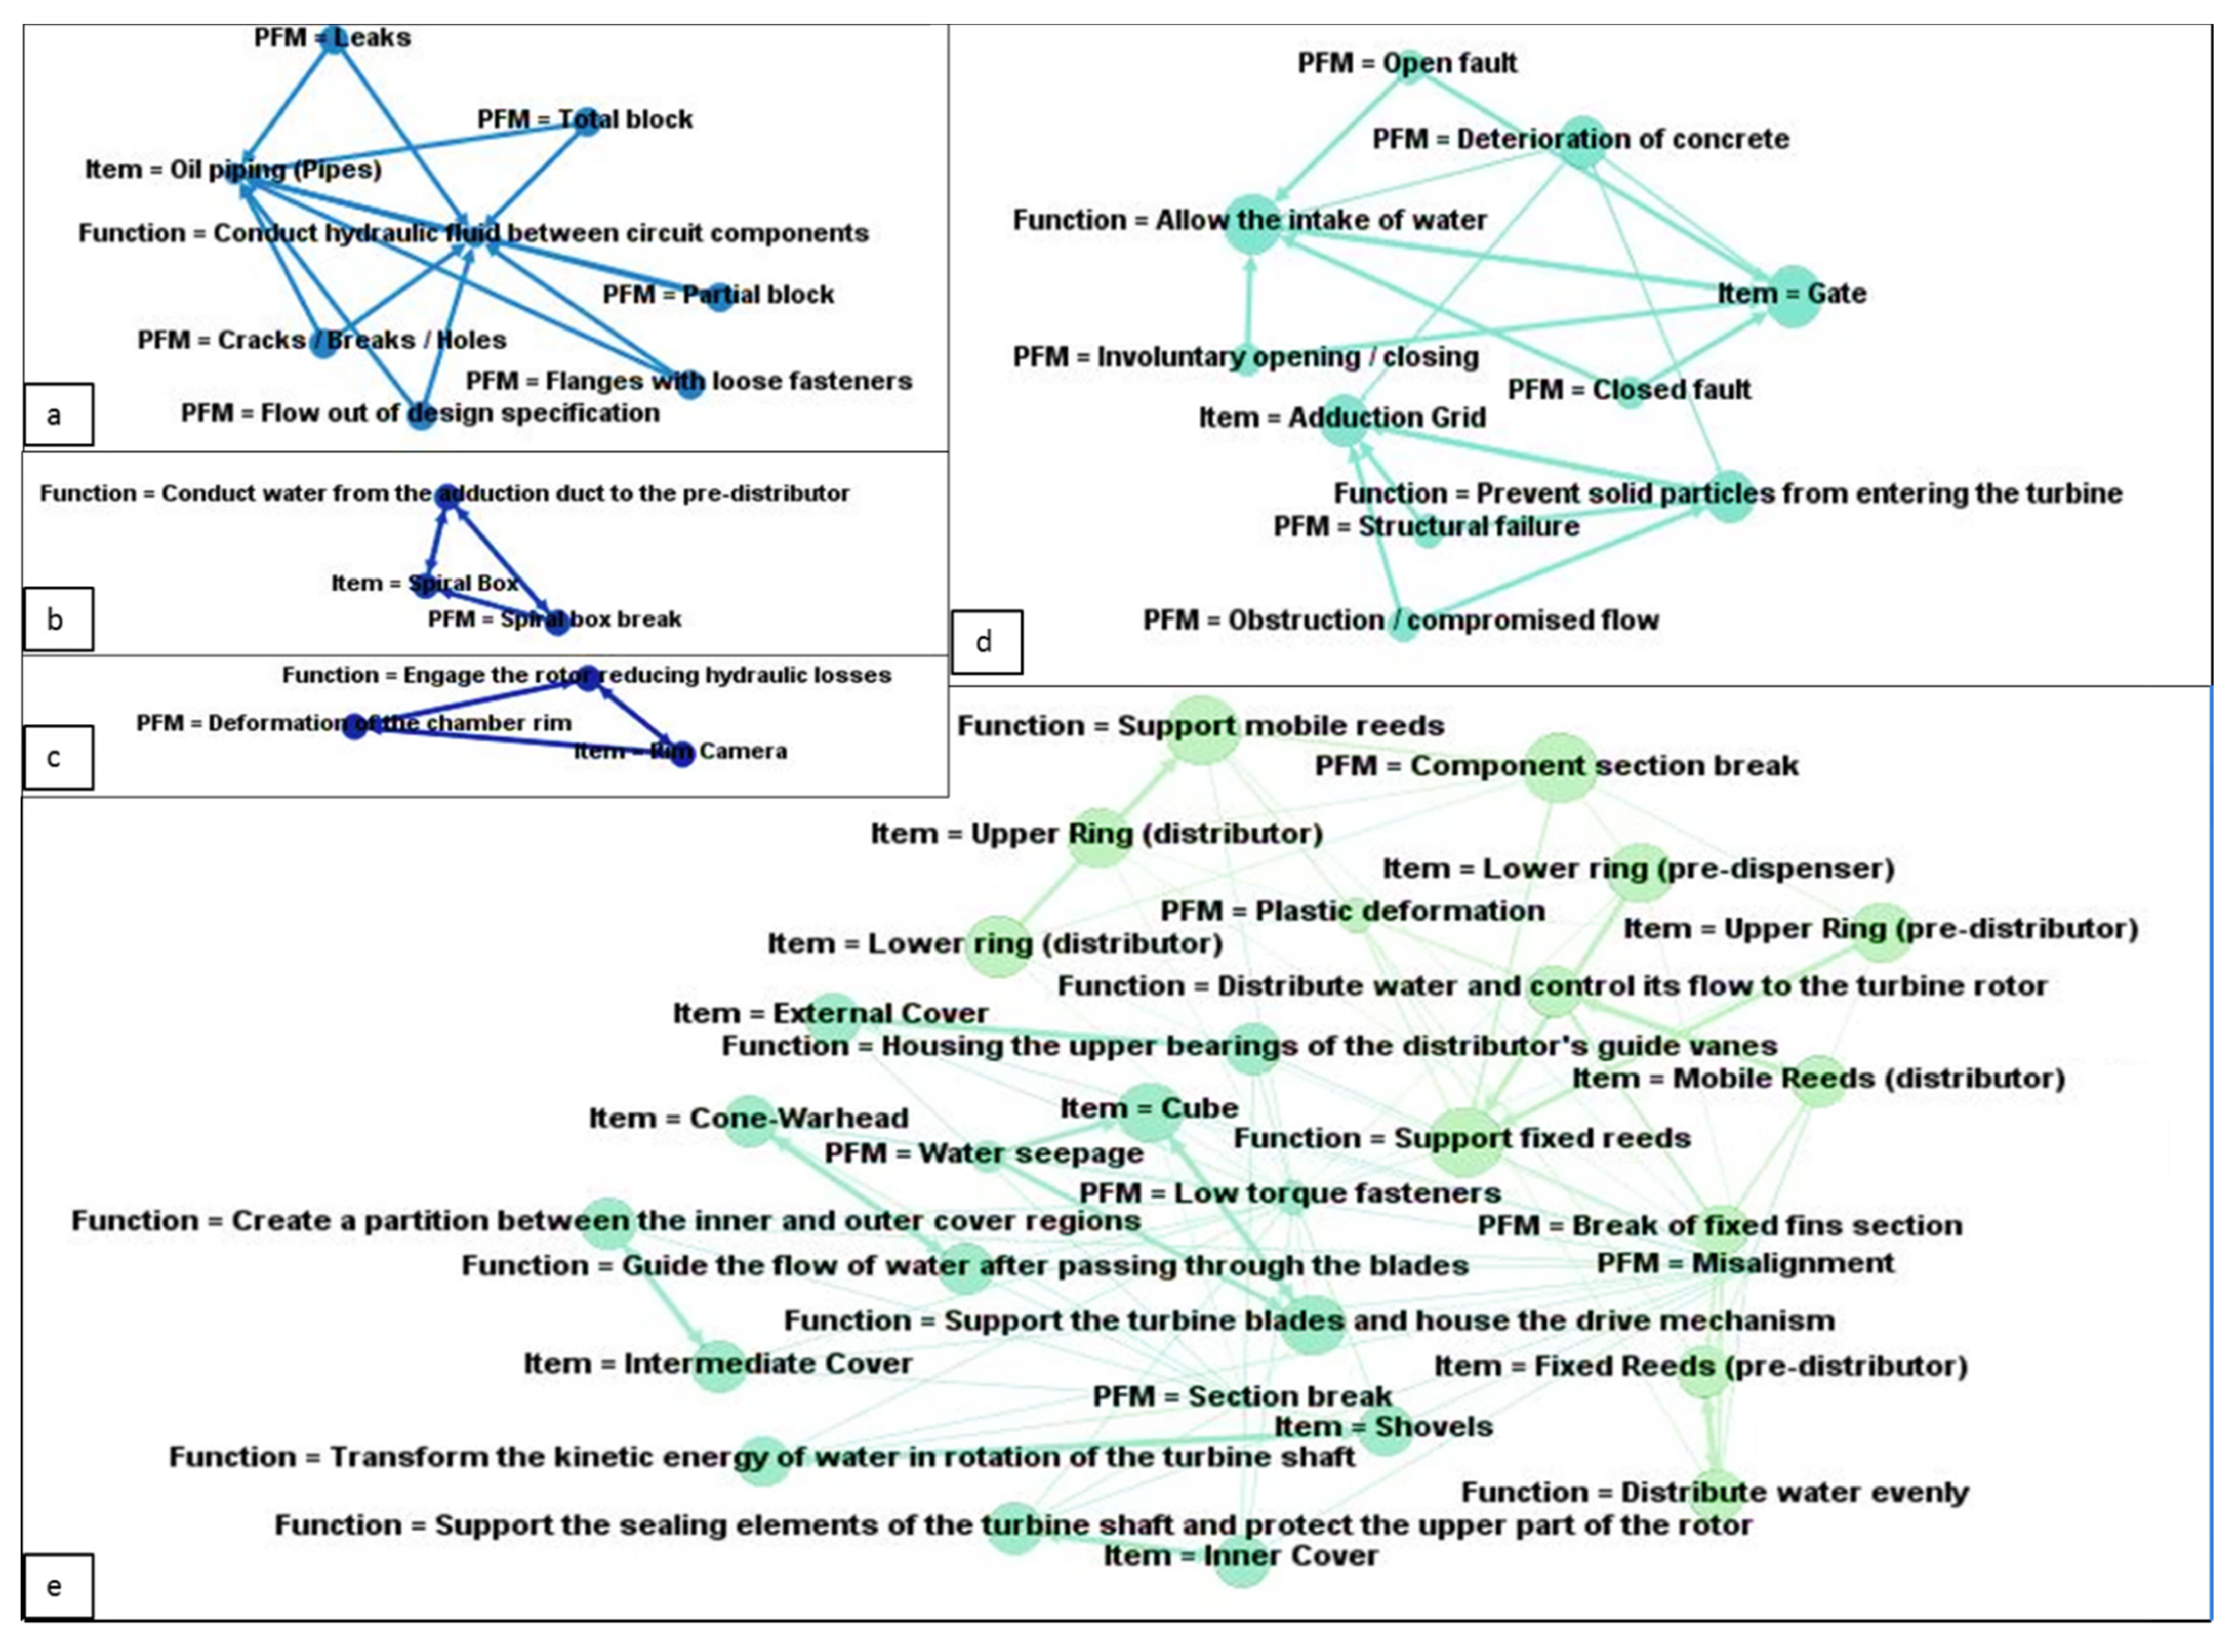
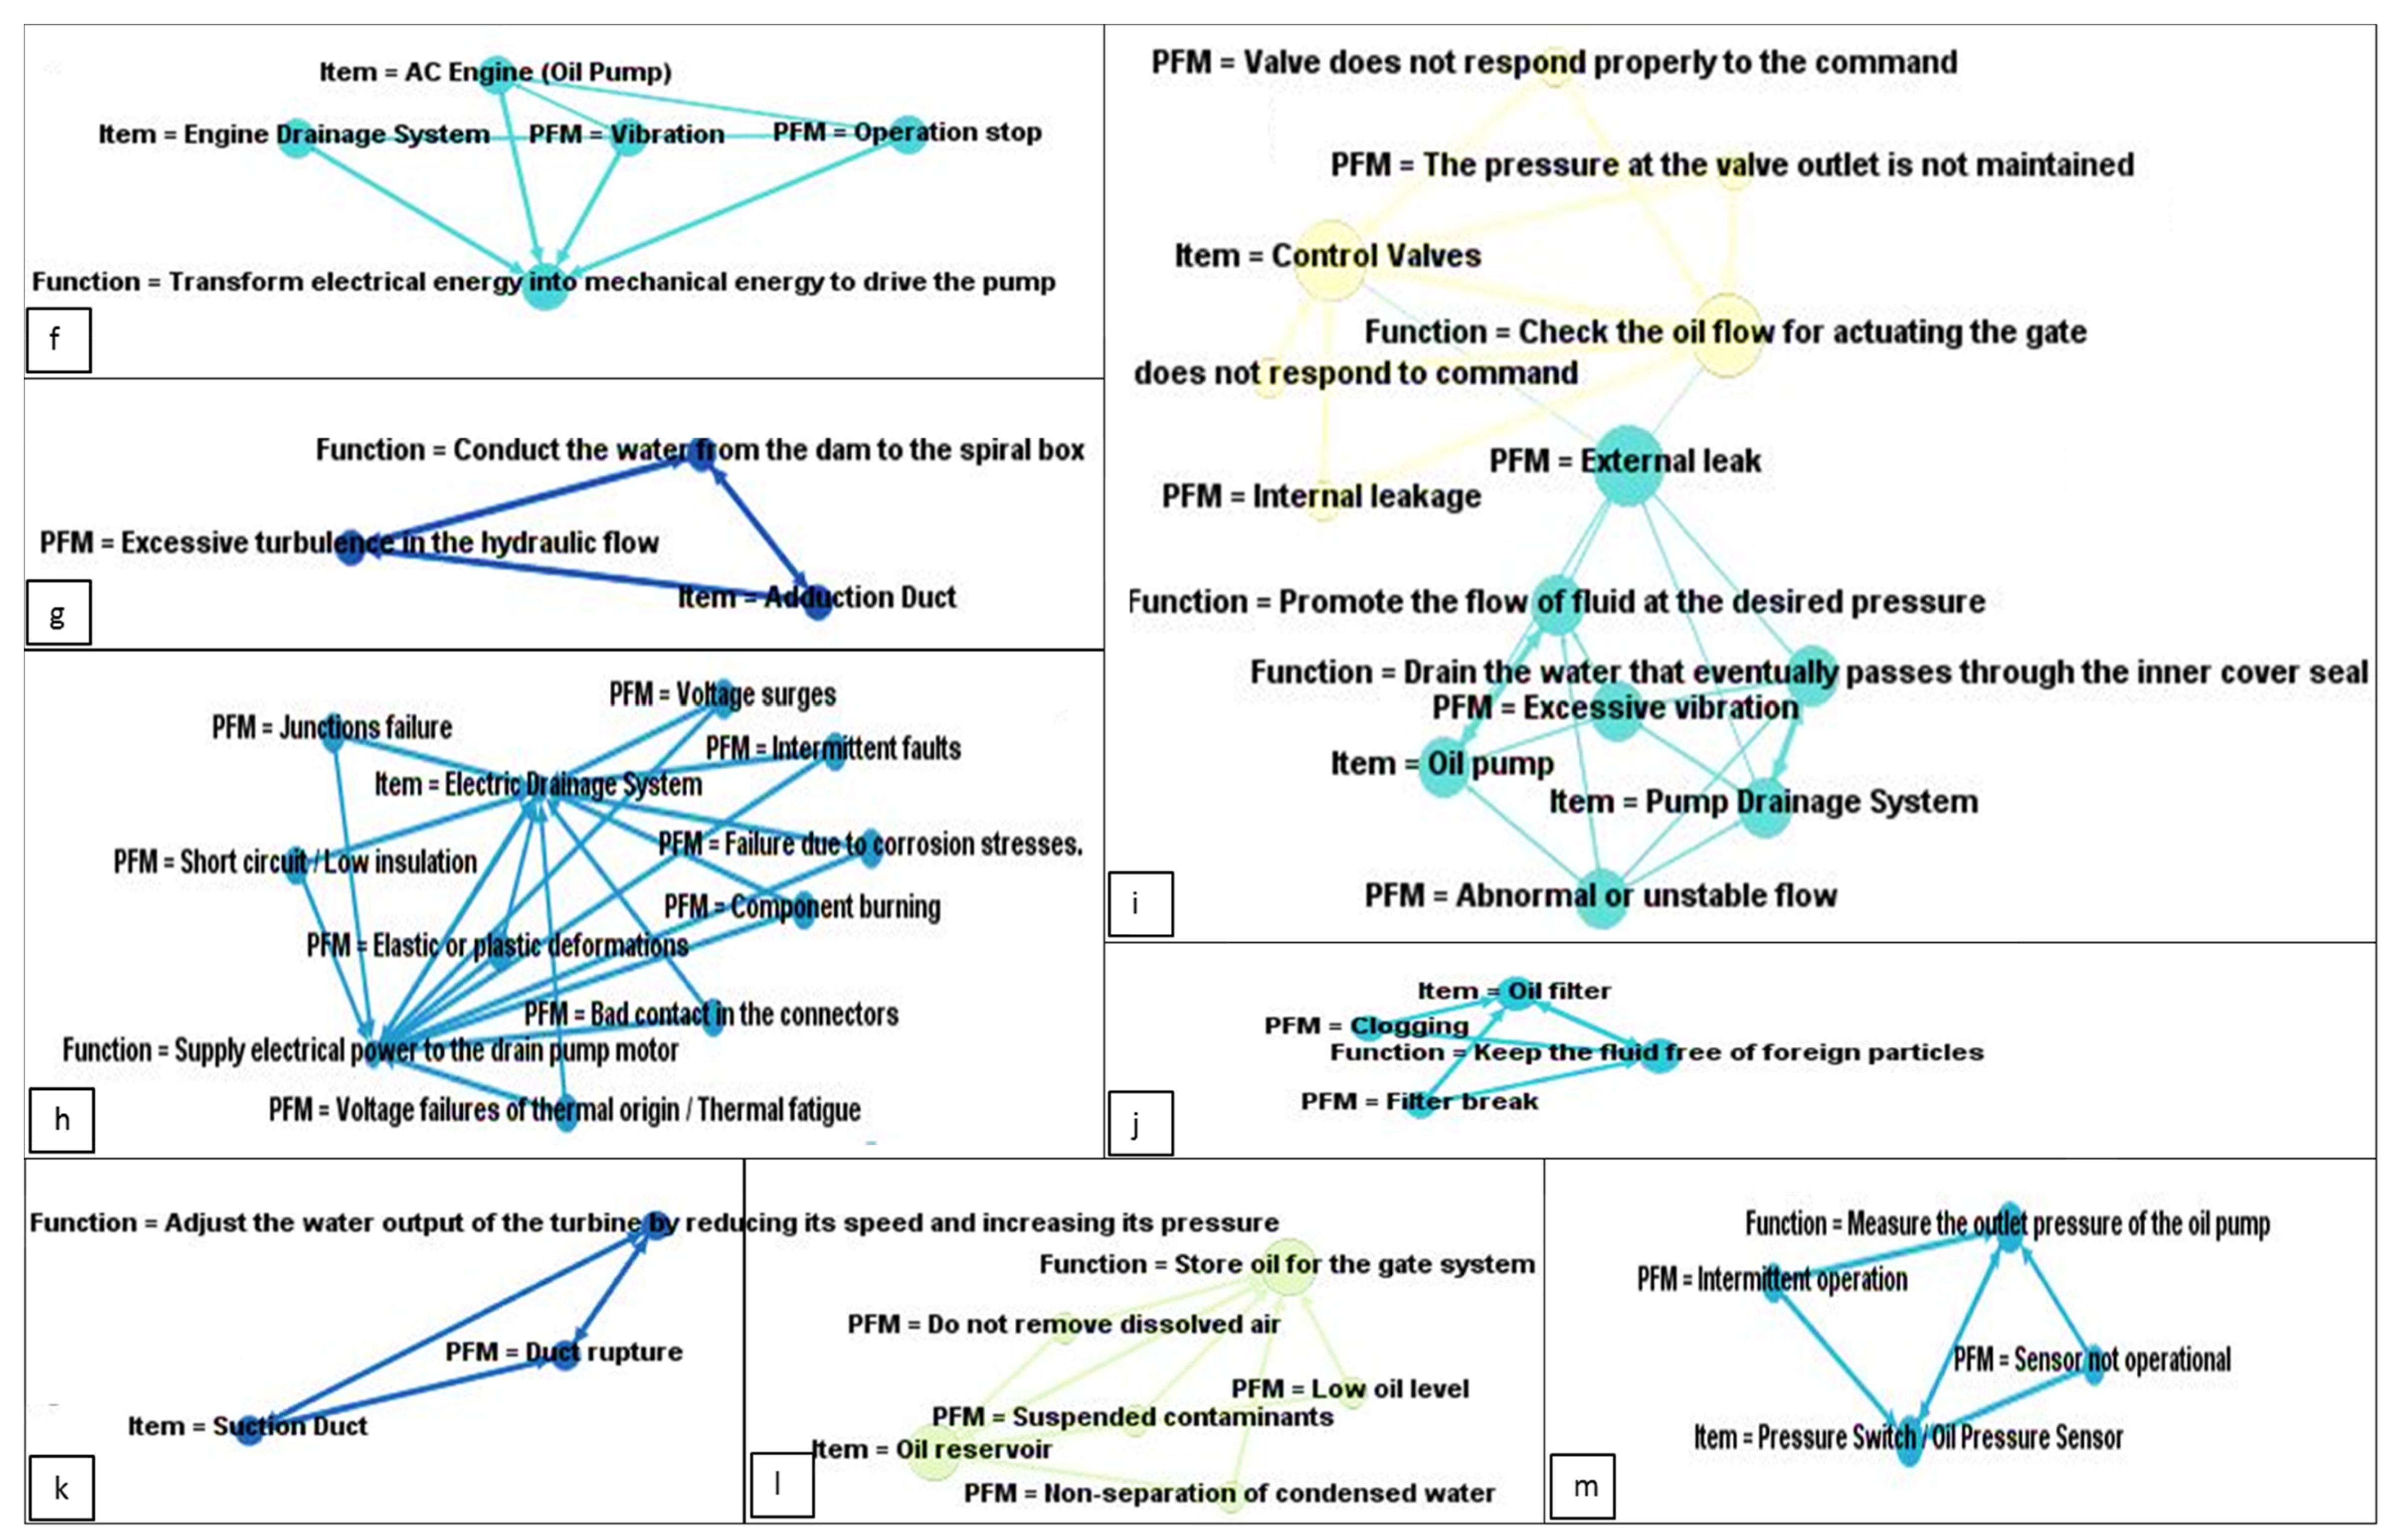
2.3. Social Network Analysis and Insights Definition
3. Application to a Case Study
3.1. Case Study
3.2. Data-Driven Framework Application
- System: one of the three main systems composing the HPP;
- Name: one of the 152 components relevant for the study;
- PFM: potential failure mode occurring on the component;
- Main functions: effect of the PFM on the main functionality of the component;
- FR: the failure rate of the component (it can be actual if the FM has already occurred or theoretical if the FM is potential);
- MTTR: the mean time to repair, expressed in hours;
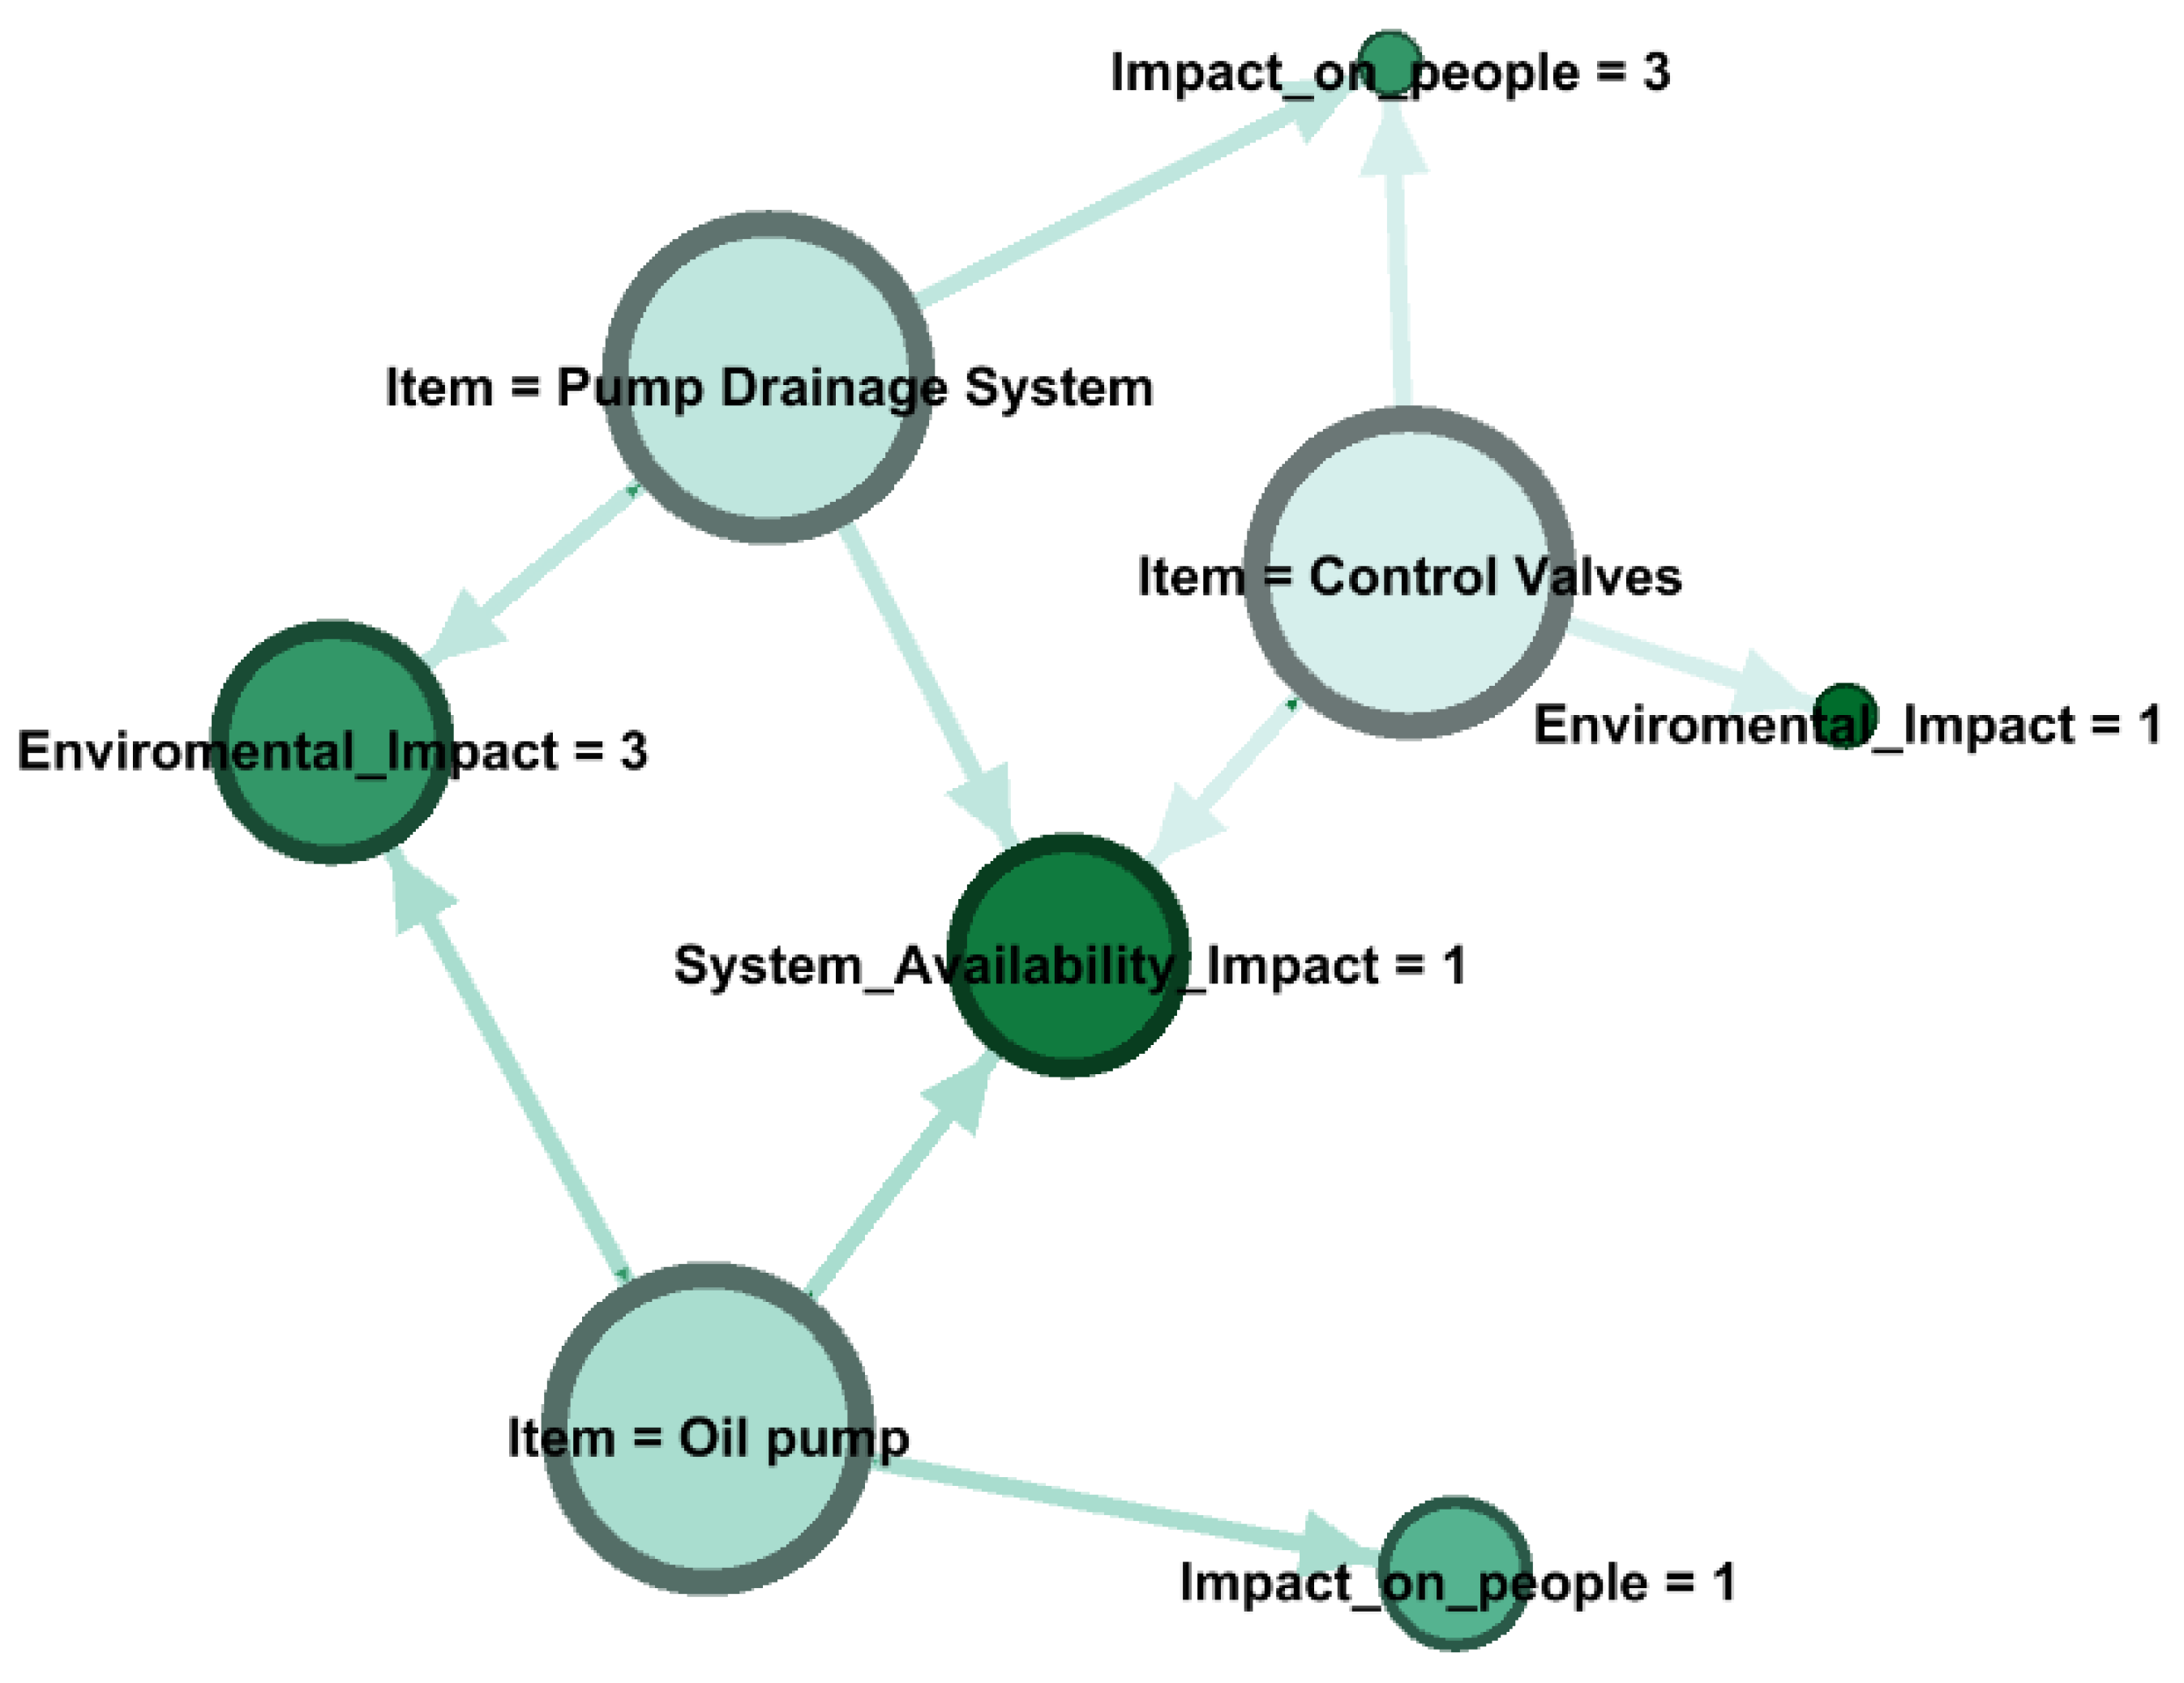
- SAI: the impact of the FM occurrence on the availability of the system;
- IOP: the impact of the FM occurrence on people;
- EI: the impact of the FM occurrence on the environment.
- Create the SN using all the ARs;
- Determine the most interesting node based on the OD;
- Filter the ARs and create more specific SNs, limiting the analysis to the nodes considered more relevant;
- Formalize the information extracted.
4. Discussion
4.1. Theoretical Implications
4.2. Practical Implications
5. Conclusions
Author Contributions
Funding
Acknowledgments
Conflicts of Interest
References
- Perez-Canto, S.; Rubio-Romero, J.C. A model for the preventive maintenance scheduling of power plants including wind farms. Reliab. Eng. Syst. Saf. 2013, 119, 67–75. [Google Scholar] [CrossRef]
- Allan, G.; Eromenko, I.; Gilmartin, M.; Kockar, I.; McGregor, P. The economics of distributed energy generation: A literature review. Renew. Sustain. Energy Rev. 2015, 42, 543–556. [Google Scholar] [CrossRef]
- Murad, C.A.; Melani, A.H.D.A.; Michalski, M.A.D.C.; Netto, A.C.; De Souza, G.F.M.; Nabeta, S.I. Fuzzy-FMSA: Evaluating Fault Monitoring and Detection Strategies Based on Failure Mode and Symptom Analysis and Fuzzy Logic. ASCE-ASME J. Risk Uncertain. Eng. Syst. Part B Mech. Eng. 2020, 6. [Google Scholar] [CrossRef]
- Özcan, E.C.; Ünlüsoy, S.; Eren, T. A combined goal programming–AHP approach supported with TOPSIS for maintenance strategy selection in hydroelectric power plants. Renew. Sustain. Energy Rev. 2017, 78, 1410–1423. [Google Scholar] [CrossRef]
- Darabnia, B.; Demichela, M. Maintenance an Opportunity for Energy Saving. Chem. Eng. Trans. 2013, 32, 259–264. [Google Scholar]
- Li, R.; Arzaghi, E.; Abbassi, R.; Chen, D.Y.; Li, C.; Li, H.; Xu, B. Dynamic maintenance planning of a hydro-turbine in operational life cycle. Reliab. Eng. Syst. Saf. 2020, 204, 107129. [Google Scholar] [CrossRef]
- Pisacane, O.; Potena, D.; Antomarioni, S.; Bevilacqua, M.; Ciarapica, F.E.; Diamantini, C. Data-driven predictive maintenance policy based on multi-objective optimization approaches for the component repairing problem. Eng. Optim. 2020, 1–20. [Google Scholar] [CrossRef]
- Kougias, I.; Aggidis, G.; Avellan, F.; Deniz, S.; Lundin, U.; Moro, A.; Muntean, S.; Novara, D.; Pérez-Díaz, J.I.; Quaranta, E.; et al. Analysis of emerging technologies in the hydropower sector. Renew. Sustain. Energy Rev. 2019, 113, 109257. [Google Scholar] [CrossRef]
- Bevilacqua, M.; Braglia, M.; Gabbrielli, R. Monte Carlo simulation approach for a modified FMECA in a power plant. Qual. Reliab. Eng. Int. 2000, 16, 313–324. [Google Scholar] [CrossRef]
- Carpitella, S.; Certa, A.; Izquierdo, J.; La Fata, C.M. A combined multi-criteria approach to support FMECA analyses: A real-world case. Reliab. Eng. Syst. Saf. 2018, 169, 394–402. [Google Scholar] [CrossRef]
- Grunske, L.; Lindsay, P.; Yatapanage, N.; Winter, K. An Automated Failure Mode and Effect Analysis Based on High-Level Design Specification with Behavior Trees. Comput. Vis. 2005, 3771 LNCS, 129–149. [Google Scholar]
- Ben Said, A.; Shahzad, M.K.; Zamai, E.; Hubac, S.; Tollenaere, M. Experts’ knowledge renewal and maintenance actions effectiveness in high-mix low-volume industries, using Bayesian approach. Cogn. Technol. Work. 2016, 18, 193–213. [Google Scholar] [CrossRef]
- Belinelli, M.; Federal University of Technology; Zattar, I.C.; Da Silva, M.M.; Seleme, R.; De Souza, G.F.; Rodrigues, M.; De Oliveira, C.C.; Savoldi, A. Prioritization of the Industrial Maintenance Activities According its Ergonomics Risks using Multi-criteria Analysis AHP. Int. J. Eng. Trends Technol. 2018, 59, 214–222. [Google Scholar] [CrossRef]
- Aggogeri, F.; Adamini, R.; Aivaliotis, P.; Borboni, A.; Eytan, A.; Merlo, A.; Németh, I.; Taesi, C.; Pellegrini, N. Robotic System Reliability Analysis and RUL Estimation Using an Iterative Approach. In Advances in Intelligent Systems and Computing; Springer Science and Business Media LLC: Berlin/Heidelberg, Germany, 2020; Volume 980, pp. 134–143. [Google Scholar]
- Ragab, A.; Yacout, S.; Ouali, M.S.; Osman, H. Prognostics of multiple failure modes in rotating machinery using a pattern-based classifier and cumulative incidence functions. J. Intell. Manuf. 2016, 30, 255–274. [Google Scholar] [CrossRef]
- Bonacina, F.; Corsini, A.; Cardillo, L.; Lucchetta, F. Complex Network Analysis of Photovoltaic Plant Operations and Failure Modes. Energies 2019, 12, 1995. [Google Scholar] [CrossRef]
- Han, R.; Zhou, Q. Data-driven Solutions for Power System Fault Analysis and Novelty Detection. In Proceedings of the 2016 11th International Conference on Computer Science & Education (ICCSE), Nagoya, Japan, 23–25 August 2016; IEEE: Nagoya, Japan, 2016; pp. 86–91. [Google Scholar]
- Shahbaz, M.; Srinivas, M.; Harding, J.A.; Turner, M. Product Design and Manufacturing Process Improvement Using Association Rules. Proc. Inst. Mech. Eng. Part B J. Eng. Manuf. 2006, 220, 243–254. [Google Scholar] [CrossRef]
- Buddhakulsomsiri, J.; Siradeghyan, Y.; Zakarian, A.; Li, X. Association rule-generation algorithm for mining automotive warranty data. Int. J. Prod. Res. 2006, 44, 2749–2770. [Google Scholar] [CrossRef]
- Ciarapica, F.E.; Bevilacqua, M.; Antomarioni, S. An approach based on association rules and social network analysis for managing environmental risk: A case study from a process industry. Process. Saf. Environ. Prot. 2019, 128, 50–64. [Google Scholar] [CrossRef]
- Antomarioni, S.; Pisacane, O.; Potena, D.; Bevilacqua, M.; Ciarapica, F.E.; Diamantini, C. A predictive association rule-based maintenance policy to minimize the probability of breakages: Application to an oil refinery. Int. J. Adv. Manuf. Technol. 2019, 105, 3661–3675. [Google Scholar] [CrossRef]
- Crespo, A.; Carmona, A.D.L.F.; Antomarioni, S. A Process to Implement an Artificial Neural Network and Association Rules Techniques to Improve Asset Performance and Energy Efficiency. Energies 2019, 12, 3454. [Google Scholar] [CrossRef]
- Savino, M.M.; Brun, A.; Riccio, C. Integrated system for maintenance and safety management through FMECA principles and fuzzy inference engine. Eur. J. Ind. Eng. 2011, 5, 132. [Google Scholar] [CrossRef]
- Tso, K.S.; Tai, A.T.; Chau, S.N.; Alkalai, L. On Automating Failure Mode Analysis and Enhancing its Integrity. In Proceedings of the 11th Pacific Rim International Symposium on Dependable Computing (PRDC’05), Hunan, China, 12–14 December 2005; IEEE: Hunan, China, 2006; Volume 2005, pp. 287–292. [Google Scholar]
- Xu, Z.; Dang, Y.; Munro, P.; Wang, Y. A data-driven approach for constructing the component-failure mode matrix for FMEA. J. Intell. Manuf. 2019, 31, 249–265. [Google Scholar] [CrossRef]
- Liu, Y.; Hu, X.; Zhang, W. Remaining useful life prediction based on health index similarity. Reliab. Eng. Syst. Saf. 2019, 185, 502–510. [Google Scholar] [CrossRef]
- Li, X.; Ran, Y.; Zhang, G.; He, Y. A failure mode and risk assessment method based on cloud model. J. Intell. Manuf. 2020, 31, 1339–1352. [Google Scholar] [CrossRef]
- Lv, J.; Xu, S.; Zhang, R.; Xiao, H.; Chen, Z. Safety Analysis of Metro Turnouts Based on Fuzzy FMECA. In Proceedings of the 2018 IEEE International Conference on Internet of Things (iThings) and IEEE Green Computing and Communications (GreenCom) and IEEE Cyber, Physical and Social Computing (CPSCom) and IEEE Smart Data (SmartData), Nalifax, NS, Canada, 30 July–3 August 2018; IEEE: Nalifax, NS, Canada, 2018; pp. 599–606. [Google Scholar]
- Chang, K.H.; Cheng, C.-H. Evaluating the risk of failure using the fuzzy OWA and DEMATEL method. J. Intell. Manuf. 2009, 22, 113–129. [Google Scholar] [CrossRef]
- Liu, H.C.; Chen, Y.Z.; You, J.; Li, H. Risk evaluation in failure mode and effects analysis using fuzzy digraph and matrix approach. J. Intell. Manuf. 2014, 27, 805–816. [Google Scholar] [CrossRef]
- Khorshidi, H.A.; Gunawan, I.; Ibrahim, M.Y. Data-Driven System Reliability and Failure Behavior Modeling Using FMECA. IEEE Trans. Ind. Inform. 2015, 12, 1253–1260. [Google Scholar] [CrossRef]
- Li, F.; Upadhyaya, B.R.; Coffey, L.A. Model-based monitoring and fault diagnosis of fossil power plant process units using Group Method of Data Handling. ISA Trans. 2009, 48, 213–219. [Google Scholar] [CrossRef]
- Byington, C.S.; Matt, W.; Bharadwaj, S.P. Automated Health Management for Gas Turbine Engine Accessory System Components. In Proceedings of the 2008 IEEE Aerospace Conference, Big Sky, MT, USA, 1–8 March 2008; IEEE: Big Sky, MT, USA, 2008; pp. 1–12. [Google Scholar]
- Ying-Min, W.; Feng-Bin, Y. Fault Diagnosis of Electric Actuator in the Thermal Power Plant Based on Data-Driven. In Proceedings of the 2009 International Conference on Energy and Environment Technology, Guilin, China, 16–18 October 2009; IEEE: Guilin, China, 2009; pp. 667–670. [Google Scholar]
- Ajami, A.; Daneshvar, M. Data driven approach for fault detection and diagnosis of turbine in thermal power plant using Independent Component Analysis (ICA). Int. J. Electr. Power Energy Syst. 2012, 43, 728–735. [Google Scholar] [CrossRef]
- Zhao, Y.; Di Maio, F.; Zio, E.; Dong, C.; Zhang, Q. Optimization of a Dynamic Uncertain Causality Graph (DUCG) for Fault Diagnostics in Nuclear Power Plants by Genetic Algorithm. In Proceedings of the 24th ICONE Conference-International conference on Nuclear Engineering, Houston, TX, USA, 26–30 June 2016; ASME International: Houston, TX, USA, 2016; pp. 1–8. [Google Scholar]
- Banjanovic-Mehmedovic, L.; Hajdarevic, A.; Kantardzic, M.; Mehmedovic, F.; Dzananovic, I. Neural network-based data-driven modelling of anomaly detection in thermal power plant. Autom 2017, 58, 69–79. [Google Scholar] [CrossRef]
- Dhini, A.; Kusumoputro, B.; Surjandari, I. Neural Network Based System for Detecting and Diagnosing Faults in Steam Turbine of Thermal Power Plant. In Proceedings of the 2017 IEEE 8th International Conference on Awareness Science and Technology (iCAST), Taichung, Taiwan, 8–10 November 2017; IEEE: Taichung, Taiwan, 2017; pp. 149–154. [Google Scholar]
- Jiménez, A.A.; Gómez Muñoz, C.Q.; García Márquez, F.P. Machine learning for wind turbine blades maintenance management. Energies 2018, 11, 1–16. [Google Scholar]
- Hu, C.; Youn, B.D.; Wang, P.; Taek Yoon, J. Ensemble of data-driven prognostic algorithms for robust prediction of remaining useful life. Reliab. Eng. Syst. Saf. 2012, 103, 120–135. [Google Scholar] [CrossRef]
- US Military Standard. MIL-STD-1629a. Procedures for Performing a Failure Mode, Effect and Criticality Analysis; Department of Defense: Washington, DC, USA, 1980.
- Hand, D.J. Data Mining: Statistics and More? Am. Stat. 1998, 52, 112. [Google Scholar] [CrossRef]
- Chen, W.C.; Tseng, S.S.; Wang, C.Y. A novel manufacturing defect detection method using association rule mining techniques. Expert Syst. Appl. 2005, 29, 807–815. [Google Scholar] [CrossRef]
- Agrawal, R.; Imieliński, T.; Swami, A. Mining association rules between sets of items in large databases. In Proceedings of the 1993 ACM SIGMOD International Conference on Management of Data, Washington, DC, USA, 26–28 May 1993. [Google Scholar]
- Han, J.; Pei, J.; Yin, Y. Mining frequent patterns without candidate generation. SIGMOD 2000, 29, 1–12. [Google Scholar] [CrossRef]
- Xiao, S.; Hu, Y.; Han, J.; Zhou, R.; Wen, J. Bayesian Networks-based Association Rules and Knowledge Reuse in Maintenance Decision-Making of Industrial Product-Service Systems. Procedia CIRP 2016, 47, 198–203. [Google Scholar] [CrossRef][Green Version]
- Otte, E.; Rousseau, R. Social network analysis: A powerful strategy, also for the information sciences. J. Inf. Sci. 2002, 28, 441–453. [Google Scholar] [CrossRef]
- Knoke, D.; Yang, S. Social Network Analysis; SAGE Publications: Newbury Park, CA, USA, 2008. [Google Scholar]
- Brandes, U. A faster algorithm for betweenness centrality. J. Math. Sociol. 2001, 25, 163–177. [Google Scholar] [CrossRef]
- Scott, J. Social Network Analysis. Sociology 1998, 22, 109–127. [Google Scholar] [CrossRef]
- Tan, P.N.; Kumar, V.; Srivastava, J. Selecting the right objective measure for association analysis. Inf. Syst. 2004, 29, 293–313. [Google Scholar] [CrossRef]


| System | Name | PFM | Main Functions | FR | MTTR | SAI | IOP | EI |
|---|---|---|---|---|---|---|---|---|
| AXIS | Generator Shaft | Break | Provide rotation for electricity generation | 0.000001 | 168 | 9 | 7 | 1 |
| Left-Hand Side | Right-Hand Side | Support | Confidence |
|---|---|---|---|
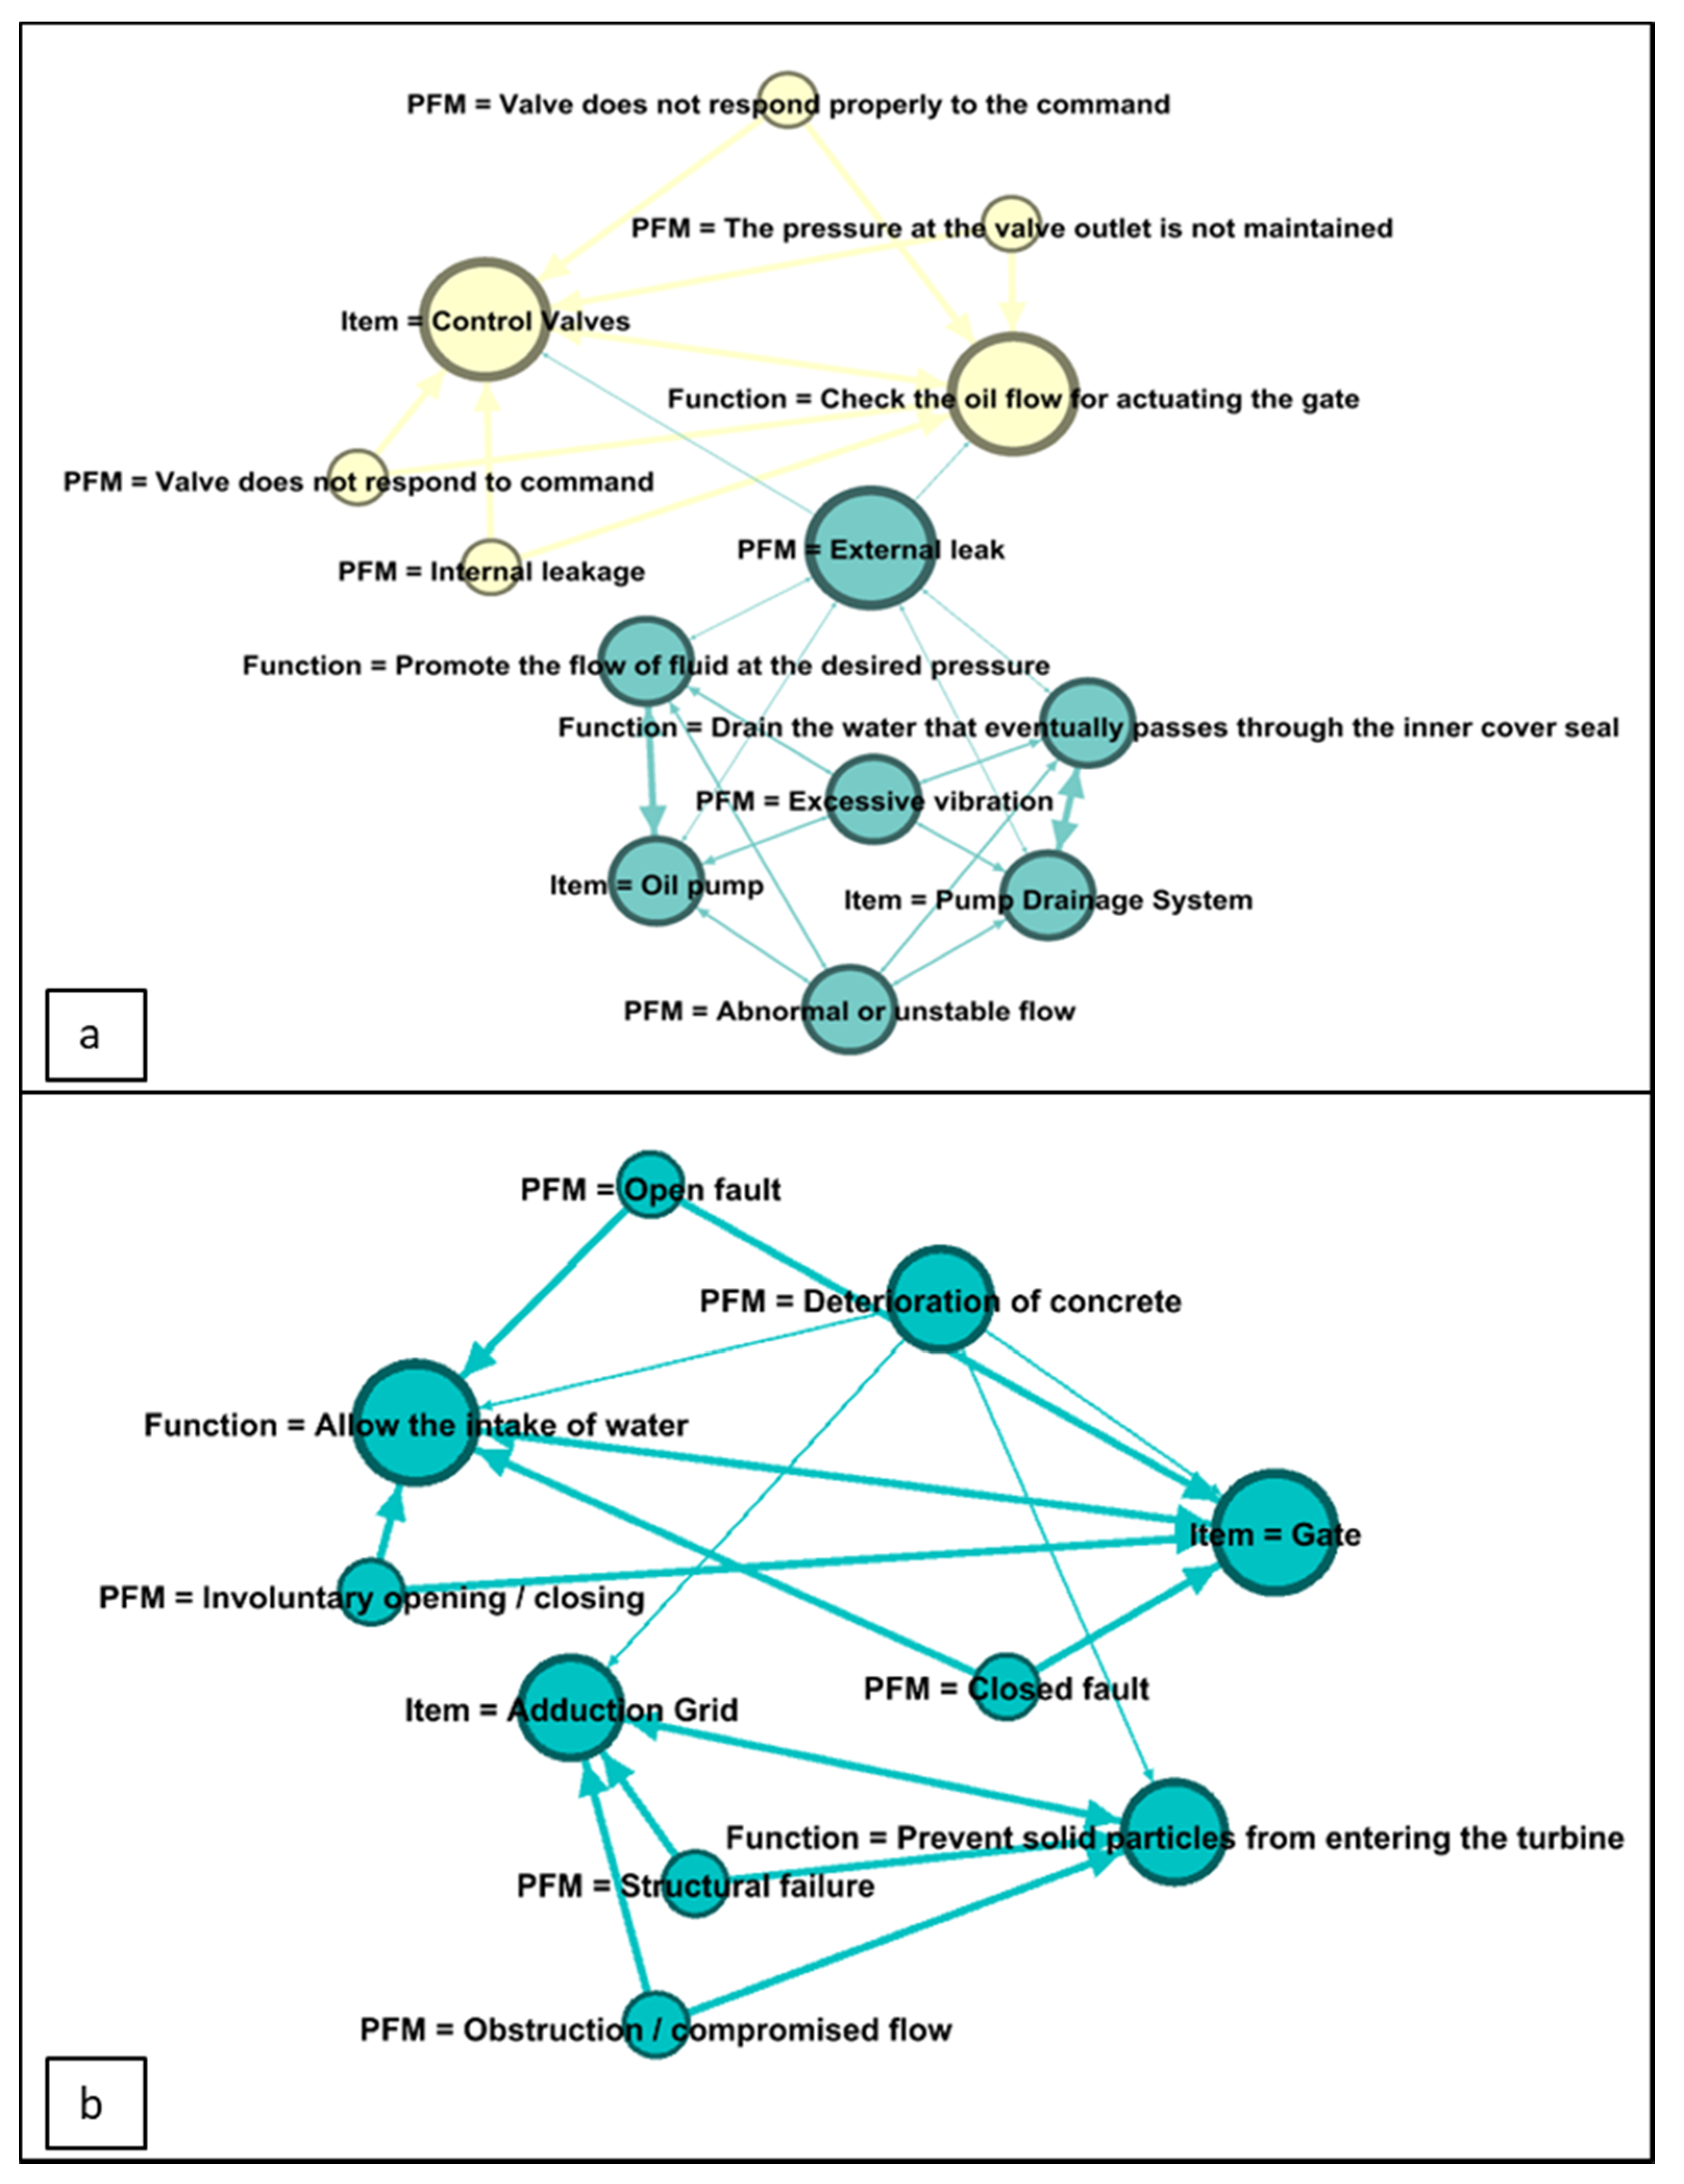
| PFM = External leak | Item = Pump drainage system | 0.011 | 0.333 |
| PFM = External leak | Item = Oil pump | 0.011 | 0.333 |
| PFM = External leak | Item = Control valves | 0.011 | 0.333 |
| PFM = External leak | Function = Promote the flow of fluid at the desired pressure | 0.011 | 0.333 |
| PFM = External leak | Function = Drain the water that eventually passes through the inner cover seal | 0.011 | 0.333 |
| PFM = External leak | Function = Check the oil flow for actuating the gate | 0.011 | 0.333 |
| Function = Check the oil flow for actuating the gate | Item = Control valves | 0.056 | 1 |
| Function = Drain the water that eventually passes through the inner cover seal | Item = Pump drainage system | 0.033 | 1 |
| Function = Promote the flow of fluid at the desired pressure | Item = Oil pump | 0.033 | 1 |
| Left-Hand Side | Right-Hand Side | Support | Confidence |
|---|---|---|---|
| PFM = Deterioration of concrete | Item = Gate | 0.011 | 0.500 |
| PFM = Deterioration of concrete | Item = Adduction grid | 0.011 | 0.500 |
| PFM = Deterioration of concrete | Function = Allow the intake of water | 0.011 | 0.500 |
| PFM = Deterioration of concrete | Function = Prevent solid particles from entering the turbine | 0.011 | 0.500 |
| Item = Gate | PFM = Deterioration of concrete | 0.011 | 0.250 |
| Item = Adduction grid | PFM = Deterioration of concrete | 0.011 | 0.333 |
| Function = Prevent solid particles from entering the turbine | PFM = Deterioration of concrete | 0.011 | 0.333 |
| Function = Allow the intake of water | PFM = Deterioration of concrete | 0.011 | 0.250 |
| Item = Gate | Function = Allow the intake of water | 0.044 | 1.000 |
| Item = Adduction grid | Function = Prevent solid particles from entering the turbine | 0.033 | 1.000 |
| Function = Allow the intake of water | Item = Gate | 0.044 | 1.000 |
| Function = Prevent solid particles from entering the turbine | Item = Adduction grid | 0.033 | 1.000 |
Publisher’s Note: MDPI stays neutral with regard to jurisdictional claims in published maps and institutional affiliations. |
© 2020 by the authors. Licensee MDPI, Basel, Switzerland. This article is an open access article distributed under the terms and conditions of the Creative Commons Attribution (CC BY) license (http://creativecommons.org/licenses/by/4.0/).
Share and Cite
Antomarioni, S.; Bellinello, M.M.; Bevilacqua, M.; Ciarapica, F.E.; da Silva, R.F.; de Souza, G.F.M. A Data-Driven Approach to Extend Failure Analysis: A Framework Development and a Case Study on a Hydroelectric Power Plant. Energies 2020, 13, 6400. https://doi.org/10.3390/en13236400
Antomarioni S, Bellinello MM, Bevilacqua M, Ciarapica FE, da Silva RF, de Souza GFM. A Data-Driven Approach to Extend Failure Analysis: A Framework Development and a Case Study on a Hydroelectric Power Plant. Energies. 2020; 13(23):6400. https://doi.org/10.3390/en13236400
Chicago/Turabian StyleAntomarioni, Sara, Marjorie Maria Bellinello, Maurizio Bevilacqua, Filippo Emanuele Ciarapica, Renan Favarão da Silva, and Gilberto Francisco Martha de Souza. 2020. "A Data-Driven Approach to Extend Failure Analysis: A Framework Development and a Case Study on a Hydroelectric Power Plant" Energies 13, no. 23: 6400. https://doi.org/10.3390/en13236400
APA StyleAntomarioni, S., Bellinello, M. M., Bevilacqua, M., Ciarapica, F. E., da Silva, R. F., & de Souza, G. F. M. (2020). A Data-Driven Approach to Extend Failure Analysis: A Framework Development and a Case Study on a Hydroelectric Power Plant. Energies, 13(23), 6400. https://doi.org/10.3390/en13236400