Article

A Dynamic Benchmark System for Per Capita Carbon Emissions in Low-Carbon Counties of China

1
Key Laboratory of Urban Environment and Health, Institute of Urban Environment, Chinese Academy of Sciences, Xiamen 361021, China
2
The Institute of Urban Environment, University of Chinese Academy of Sciences, Beijing 100049, China
*
Author to whom correspondence should be addressed.
Energies 2021, 14(3), 599; https://doi.org/10.3390/en14030599
Submission received: 15 December 2020 / Revised: 14 January 2021 / Accepted: 16 January 2021 / Published: 25 January 2021

Abstract

:
As the most basic unit of the national economy and administrative management, the low-carbon transformation of the vast counties is of great significance to China’s overall greenhouse gas emission reduction. Although the low-carbon evaluation (LCE) indicator system and benchmarks have been extensively studied, most benchmarks ignore the needs of the evaluated object at the development stage. When the local economy develops to a certain level, it may be restricted by static low-carbon target constraints. This study reviews the relevant research on LCE indicator system and benchmarks based on convergence. The Environmental Kuznets Curve (EKC), a dynamic benchmark system for per capita carbon emissions (PCCEs), is proposed for low-carbon counties. Taking Changxing County, Zhejiang Province, China as an example, a dynamic benchmark for PCCEs was established by benchmarking the Carbon Kuznets Curve (CKC) of best practices. Based on the principles of best practice, comparability, data completeness, and the CKC hypothesis acceptance, the best practice database is screened, and Singapore is selected as a potential benchmark. By constructing an econometric model to conduct an empirical study on Singapore’s CKC hypothesis, the regression results of the least squares method support the CKC hypothesis and its rationality as a benchmark. The result of the PCCE benchmarks of Changxing County show that when the per capita income of Changxing County in 2025, 2030, and 2035 reaches USD 19,172.92, USD 24,483.01, and USD 29,366.11, respectively, the corresponding benchmarks should be 14.95 tons CO2/person, 14.70 tons CO2/person, and 13.55 tons CO2/person. For every 1% increase in the county’s per capita income, the PCCE allowable room for growth is 17.6453%. The turning point is when the per capita gross domestic product (PCGDP) is USD 20,843.23 and the PCCE is 15.03 tons of CO2/person, which will occur between 2025 and 2030. Prior to this, the PCCE benchmark increases with the increase of PCGDP. After that, the PCCE benchmark decreases with the increase of PCGDP. The system is economically sensitive, adaptable to different development stages, and enriches the methodology of low-carbon indicator evaluation and benchmark setting at the county scale. It can provide scientific basis for Chinese county decision makers to formulate reasonable targets under the management idea driven by evaluation indicators and emission reduction targets and help counties explore the coordinated paths of economic development and emission reduction in different development stages. It has certain reference significance for other developing regions facing similar challenges of economic development and low-carbon transformation to Changxing County to formulate scientific and reasonable low-carbon emission reduction targets.

1. Introduction

More and more evidence shows the sudden and irreversible threat of climate change, mainly caused by human activities. On the other hand, in the context of global climate change and the acceleration of the process of urbanization, the fragility of the ecosystem of human society, especially developing countries, is constantly appearing and tending to increase, and it urgently needs to develop in the direction of sustainable transformation. Under a series of global climate change-related agreements and structural frameworks, countries around the world have set corresponding quantitative mitigation targets to promote the responsible use of resources and respond to the negative impact of climate change. As the largest carbon emitter in the world, China has accounted for 28.26% of the global carbon emissions. In 2018, its carbon dioxide emissions were 9.42 billion tons [1], creating huge pressure to reduce emissions. The urgent situation of global climate change after the Paris Agreement has also caused China to face huge challenges, and China proposed a new national determined contribution plan to address climate change in 2030: Carbon emissions per unit of GDP will be reduced by 60–65% compared to 2005, and carbon emissions will reach the peak and strive to reach the peak as soon as possible. At the general debate of the 75th UN General Assembly, China announced that it would reach the peak of carbon dioxide emissions by 2030 and reach the level of carbon neutrality by 2060, so as to make a targeted response to climate change. To this end, the country needs to make more efforts in low-carbon development. The county is the basic unit of China’s national economy and administrative management system and plays an important role in China’s overall greenhouse gas emission reduction. By the end of 2017, China had a total of 2851 county-level administrative units, covering more than 90% of the land, over 60% of the population, and over 70% of GDP [2,3]. Since the initiation of the new urbanization process at the 18th National Congress of the Communist Party of China in 2012, the importance of inter-county competition has increased and has gradually become an important feature of city-level/regional competition and national economic development [4]. The county has experienced the inevitable process of rapid industrialization and urbanization and a large number of manufacturing industries have moved from the city, which has intensified the pressure on resources and the environment [5]. At the same time, coal still accounts for a large proportion of primary energy consumption in county-level industrial sectors, and the carbon-intensive development model remains unchanged, which has caused many environmental problems [6]. In this case, the rapid development of low-carbon transition in counties is necessary and imminent.
Low-carbon development first means effective control of carbon emissions, based on friendly environmental technologies and processes. Indicators, targets, and benchmarks are usually important means to achieve this process. By comparing the indicators with selected benchmarks, problems in the management of urban low-carbon development can be found, and the potential and direction of emission reduction can be identified. For a long time, China has attached great importance to climate change issues and has formulated a series of carbon control targets and low-carbon development pilot policies. Among the widely used macro-level carbon control indicators, such as total carbon emission, carbon intensity, and per capita carbon emissions (PCCE), China has set carbon emission intensity targets as a national-level commitment to quantitatively reduce carbon emissions per unit of GDP [7,8]. Some low-carbon pilots initiated by the National Development and Reform Commission in 2010, 2012, and 2017, usually in provinces and cities, have also set total carbon emissions as emission reduction targets [9]. Due to the actual needs of the country to fulfill its commitment to address climate change, most previous studies have focused on the national, provincial, and urban scales in recent years, focusing on carbon inventory accounting and carbon dioxide emission sources as the basis for controlling carbon emissions [10]. However, at the county level, there is neither systematic statistical data, such as the energy balance sheet to support greenhouse gas (GHG) inventory accounting, nor official carbon emission constraints. Effective indicators or targets can promote better measurement, evaluation, and monitoring of low-carbon development at the county level in China. Therefore, two important issues need to be addressed: (1) which carbon control indicators can be used as effective guidance for county-level carbon control in China, and (2) how to formulate effective and reasonable benchmarks to guide local low-carbon transformation while coordinating local development needs. Regarding the first issue, some scholars believe that per capita energy consumption or carbon emissions are better than China’s traditional GDP-based measurement targets, because its real picture of the situation is less distorted, and policymakers can better allocate resources to deal with climate issues [11,12]. Under the pressure of reducing carbon emissions, more carbon emission space means greater development rights. After the United Nations Framework Convention on Climate Change (UNFCCC) put forward the basic principle of “common but differentiated responsibilities and respective capabilities (CBDR–RC),” it became a prerequisite for the international community to discuss future carbon allocation space. The carbon emission quota allocation target based on PCCEs has focused on the equal allocation of carbon emission rights, has been especially supported by developing countries, and has become an important standard for human welfare [13,14,15]. Meanwhile, the higher the per capita carbon emissions, the lower the carbon emission utilization efficiency [16]. In the long run, the PCCEs of developed countries will gradually decline with the development of technology and the implementation of related policies, while developing countries led by China will be the main driving force for the rapid increase of global PCCEs [17]. Therefore, the expectation of reducing the growth of PCCEs in developing countries and gradually converging to developed countries is of great significance to achieving global emission reduction targets and will also affect multilateral climate agreements and long-term policy negotiations (e.g., [18,19,20,21]). The more general view is to set an upper limit for the PCCEs of developing countries so as to achieve the global emission reduction target [18]. At the county level in China, in order to cope with local efficiency and the equity of the low-carbon transition on a microscale, the PCCE, as a key carbon control indicator, is crucial and will help promote overall regional and national carbon emission reductions.
As for the second issue, the benchmark of low-carbon indicators means constraints on emitters, which will prompt local governments to formulate low-carbon development routes and plans to reduce greenhouse gases. The benchmark defines a set of maximum feasible performance thresholds or low-carbon targets within a certain period of time. It should not be too high to distinguish low-performance areas or too low to highlight the efforts of excellent areas and weaken the driving force for regional improvement [22,23]. The existing low-carbon evaluation (LCE) tools have different sources of indicator benchmarks, including average levels, local targets, international best practices, typical performance, etc. [24]. Under the premise that national, provincial, and municipal policies have not yet established county-level greenhouse gas emission reduction targets in China, best practices can be used as benchmarks to encourage county-level low-carbon transitions. Although the LCE indicators and their benchmarks have been extensively studied, most of the benchmarks are static and rarely consider the needs of the evaluation object at the development stage. When the local economy of counties develops to a certain level, they may be restricted by incompatible low-carbon targets. In addition, best practices are usually advanced, and developed areas where the PCCE has reached its peak have relatively high requirements for developing counties, which can lead to evaluation bias and inoperability.
Aiming to solve the above mentioned two scientific issues, the rest of this article is shown in Figure 1, which details the development and application of the system. The second section summarizes the related research of PCCEs and evaluation benchmark. In the third section, Changxing County, Zhejiang Province is selected as the research area, and the research framework, construction methods, and principles of the dynamic benchmark system are introduced. The fourth section is the application of the system. The fifth section introduces the results and analysis. The sixth section provides conclusions and discussions.

2. Literature Review

To further clarifying evaluation and benchmarking methods based on the PCCE, this section mainly summarizes the LCE tools and benchmarking methods related to PCCEs, the allocation schemes of PCCE reduction targets in the context of international climate negotiations, and the driving factors that may affect the PCCE benchmarking and target setting.

2.1. LCE Tools and Benchmarking Methods

In the process of low-carbon transition, indicator assessment tools have become an important technical guarantee, and have been extensively studied and applied in urban sustainable development and low-carbon assessment (Table 1). LCE tools based on indicators and benchmarks are simplified, integrated, and forward-looking. They help the region monitor the status quo and development trends, understand the specific goals and priorities of management, promote practice and reasonable policies, and have important guiding significance for the implementation of low-carbon theories and plans [22,23,24].
The level of low-carbon development and its changes can be evaluated by comparing the value of the evaluation indicator with the benchmark to determine whether the set target has been reached and whether the measures to improve the level of low-carbon development are effective. Benchmarking methods can be divided into two categories: Relative comparison and absolute comparison. The first method of comparison is to determine a benchmark from a set of evaluation objects as the basis for tracking and comparing low-carbon development levels. For example, the carbon emission value of a certain year is selected as the benchmark. The carbon emission situation of the base year reflects the current actual situation of the city, the carbon emission structure is reasonable, the carbon emission inventory and statistical data are complete, true, and reliable and typical and representative. Alternatively, the value is obtained by summarizing the low-carbon development of the city over a period of time to understand the changes in the low-carbon development level and using the annual average level as the benchmark. Absolute comparison is compared with objects outside the evaluated group, usually based on a preset target. The preset target can be local emission reduction targets; development strategies and plans formulated by the government, international organizations, experts, and best practice targets; advanced performance levels recognized by domestic and foreign evaluation systems, reflecting typicality and representativeness [24]; or even the value estimated by the scientific prediction model. By comparing the evaluation object with the baseline performance, the position of the object can be determined. Absolute comparison can make it easier for the assessed party to understand its own development from the perspective of raising standards and defining the best goals, but differences in subjective standards should be avoided.

2.2. The PCCE Allocation Schemes and the Convergence of PCCEs

The PCCE is one of the most important criteria to determine the spatial equity of carbon emissions and influence political economy of negotiating multilateral climate agreements [13]. Over the years, the per capita carbon quota of various countries allocation schemes has been widely studied. Based on the principles of participation, ability, equity, or historical responsibility of all members, the international community of climate change research has proposed schemes of the absolute per capita basis, equal per capita annual emission scheme, CBDR–RC principle under the UNFCCC framework, greenhouse development rights (GDRs) framework, proposal of the Prime Minister of India, the practice of South Africa in the early times, and the later North-South dialogue, the Triptych approach, and the Multi-Stage approach, and so on [25,26]. Among them, the contraction and convergence (C&C) framework initiated by the Global Commons Institute (GCI) in the 1990s is widely supported by many parties, especially developing countries. The C&C framework takes per capita emissions as the indicator of responsibility sharing and plans to greatly reduce the total global carbon emissions by gradually equalizing the PCCEs of different countries [13,19,20].
The convergence theory is mainly discussed in macroeconomic theory based on Solow’s neoclassical economic growth model and is widely tested for empirical research [27]. It holds that in the long run, if the savings rate, population growth rate, and technological factors are fixed, then the income level of poorer countries will catch up with richer countries and reach equilibrium. It mainly examines the relationship between economic growth rate and initial economic level [28]. If the PCCEs in different countries and regions show the empirical trends of convergence, the gap in their PCCE levels will gradually narrow to the same level or their respective stable states or will change toward a common equilibrium level over time, which means that everyone will have the equal right of CO2 emission permits in the long run [19]. This also affects the feasibility and effectiveness of carbon emission reduction plans based on PCCEs [20]. Since the pioneering work of Strazicich and List in 2003 discovered the random and conditional convergence of PCCEs in 21 industrialized countries from 1960 to 1997 [29], the convergence hypothesis has received considerable attention in environmental policy literature that has studied various pollutant emissions. Under the influence of climate change negotiations and policy needs, research on the PCCE convergence is also developing rapidly [9,18,30]. Research on key issues, such as whether PCCEs in different regions converge, how they converge, and the drivers and trends of convergence, are believed to affect the rationality and effectiveness of climate change commitments and long-term policies [21].
The modes of convergence can be divided into absolute β convergence and conditional convergence. The β convergence can be determined following the traditional framework developed by Baumol in 1986 [19]. In absolute β convergence, all economies have the same steady-state level, while the economies with conditional convergence have different steady-state levels. This indicates that the gap between different clubs will continue to exist and that the characteristics of a particular country are controlled under certain conditions [30]. Income level is usually a key condition of the integration model. Li and Lin examined the convergence hypothesis in 110 countries around the world and found that there is conditional convergence in the PCCEs of countries with the same income level [20]. By combining income convergence with the EKC theory, Bulte et al. also verified from another perspective that the convergence of pollution emissions depends on regional income differences [31]. There are large spatial differences in the resource endowments, industrialization processes, industrial structures, and per capita incomes of eastern, central, and western China, which have a certain impact on the convergence of PCCEs [32]. In addition to income levels and various factors that directly or indirectly affect income levels, there are other factors considered to formulate optional rules to amend the per capita emissions approach, such as historical responsibilities, industrial structure, renewable energy potential, progress in emission reduction technologies, and the guidance of IPCC according to international agreements that make global efforts to reduce emissions [28]. Local governments may relax environmental laws and regulations through competitive actions, leading to distortions in pollution paths and differences in emissions [2,33,34].

2.3. Driving Factors of PCCEs

The main direct drivers of PCCEs and their impact have been widely discussed, such as economic growth (i.e., per capita gross domestic product (PCGDP), investment, industrial structure), population, urbanization, technological progress, energy consumption (i.e., energy structure and intensity), and other indirect factors, such as institutional system, government intervention, household consumption pattern and scale, etc. For most countries, economic growth usually actively drives the growth of energy consumption and carbon emissions [35]. Since American economists Grossman and Krueger first proposed the inverse U-shaped EKC hypothesis in 1991 to illustrate the correlation between environmental quality and per capita income [36], it has become an important theoretical basis for studying the relationship between PCCEs and economic growth, usually called the Carbon Kuznets Curve (CKC) in the field of carbon research [37]. Scholars have conducted empirical tests on the existence of CKC in countries and cities at different stages of development and have analyzed the impact of factors such as income levels, urbanization, trade and regulation, etc. [38,39]. Many studies have found that CKC exists in China and other regions [40,41]. At present, China has crossed the peak of carbon emission intensity, while the PCCE still maintain a rapid upward trend on the left side of U-shape [42]. In recent years, research on decoupling carbon emissions and economic growth and peak PCCEs prediction has rapidly emerged [33,40]. As incomes increase, PCCEs in high-income countries remain stable, which probably means that their economic growth is decoupled from carbon emissions [20].

2.4. Summary of Review and Contribution of This Article

Based on the above review, this paper argues that (1) PCCE is a basic carbon control indicator to measure equity and efficiency. Under the premise that there are no clear county-level emission reduction targets in China, using the PCCE as a key county-level carbon control indicator and benchmarking with best practices at home and abroad can stimulate local and reasonable low-carbon transitions at the microlevel and respond to the efficiency and equity issues. (2) Currently, counties generally lack statistical data on PCCEs and related emission reduction requirements, so it is difficult to adopt a comparative benchmark method. Choosing the best practices in the absolute comparison method as the benchmark will help encourage local governments to formulate the best emission reduction strategies and has been frequently used. (3) For counties that still regard economic development as their top priority, the PCCE benchmark should be set dynamically according to changes in economic development level and per capita income. Although extensive research has been conducted on LCE indicator systems and benchmarks, most of the benchmark settings ignore the needs of the assessed objects in the development stage. When the local economy reaches a certain level, it may be restricted by static low-carbon targets. In addition, when the value of the high-level area is selected as the benchmark, the area often crosses the peak of PCCEs and achieves decoupling, which may cause the benchmark to be too high, leading to evaluation bias and inoperability. (4) Theories of convergence and EKC provide important theoretical basis and new ideas for establishing dynamic benchmarks. Convergence studies have shown that the gap in PCCEs will gradually narrow as the gap between the economic development levels of developing and developed regions gradually decreases over time. Similarly, this also means that by modifying rules and adjusting relevant parameters (e.g., income level, energy potential, and industrial structure), it can be expected that the PCCEs of counties can converge to the state of best practice within a predetermined time, which provides a reasonable basis for benchmarking best practices.
The relationship between income level and PCCEs can be depicted by CKC. Therefore, the process of benchmarking best practices at the county level can be a process of benchmarking the convergence of best practice CKC curves. In this article, we provide research on exploring a dynamic benchmark system for PCCEs in developing counties. Compared with previous work, this study is based on convergence theory and EKC, establishes a supplementary method for determining low-carbon target constraints based on county economic development, and has carried out a case study on county-level carbon performance evaluation.

3. Method and Framework

3.1. Case Study

This study selected Changxing County, Huzhou City, Zhejiang Province as an example. This area is located in the geographic center of the Yangtze River Delta, one of the fastest-growing urbanized regions in China, and is an economically developed area with a dense population [43]. In 2015, the proportion of the three industries of Changxing County was 1.24: 91.19: 7.56. The secondary industry was the main industry. The energy consumption per unit of GDP was higher than the average level of Zhejiang and the country that year. Therefore, there is an urgent need to improve energy efficiency [44]. In the context of China’s new urbanization and the integrated development strategy of the Yangtze River Delta urban agglomeration, the local government is upgrading the industrial structure and urgently needs to achieve a green and low-carbon transition while developing rapidly. Therefore, selecting Changxing County as the research area can provide a reference for other developing regions facing similar economic development and low-carbon transition challenges, which has certain practical significance.

3.2. Research Framework

Based on the above theoretical analysis, we attempted to build a dynamic PCCE benchmark system that adapted to the development stage of the county, based on the theory of convergence and EKC, as shown in Figure 2. First, we clarified the idea of establishing a dynamic benchmark system and the selection principles of best practices, including comparability, data integrity, and CKC hypothesis acceptance. Second, based on the above theoretical analysis, we collected best practice databases through literature research, and the best practices that potentially met the benchmarking conditions were identified. Then, based on econometrics, the CKC hypothesis acceptance in this area was tested, and its rationality as a county-level benchmark was examined. Finally, we selected Changxing County, Zhejiang Province as an example to carry out empirical research.

3.3. Principles of County-Level Dynamic Benchmark Screening Method

(1)
Best practices
Some areas that are identified as excellent performers through mature low-carbon green evaluation tools or criteria can better coordinate the relationship between low-carbon transition and economic development and are good targets for best practice.
(2)
Comparability
These areas are comparable to the county in terms of scale and social and economic development, which will help the county achieve the same effect in the future.
(3)
Data integrity
The long-term series of carbon emissions and socioeconomic data in these areas can be obtained, which is of mathematical and statistical significance and is the basis for the next step of CKC verification.
(4)
CKC hypothesis acceptance
The county needs to converge on the best practice areas where the CKC hypothesis is accepted.

3.4. Best Practice Database and Potential Benchmark Screening

Considering the availability and comparability of data, this study selected best practice areas evaluated by well-known domestic and foreign green low-carbon assessment tools that have carried out quantitative assessments of carbon emissions at the city scale as the best practice database. These tools mainly included the Asian and European Green City Index [45,46], the European Green Capital Award (EGCA) prize [47], and the Lawrence Berkeley National Laboratory ELITE City Tool [22]. For the next step of the CKC test, we collected as much data as possible on PCCEs and PCGDP in the database (Table 2). The sources included published literature, evaluation tool reports (Asia and European Green City Index), official website (e.g., application materials of cities selected by the EGCA), government statistics database, database of Organization for Economic Co-operation and Development (OECD) (population economic data of European urban areas), World Bank database (PCCEs and PCGDP data of Singapore), etc.
Among the potential best practice regions that may have the potential to become the best practices, the regions with more than 5 years of data are Lisbon, Oslo, Hamburg, Nijmegen, and Singapore. The preliminary screening was conducted by examining the trend of their PCCEs and PCGDP fitting curve. The results show that Oslo and Hamburg have basically decoupled PCGDP and the PCCE, and that Nijmegen has a U-shaped curve (Figure 3a). Lisbon presents an inverted U-shape to a certain extent, while Singapore’s PCCEs show a trend of first rising and then falling in fluctuations (Figure 3b). Therefore, there may be a CKC hypothesis between PCGDP and PCCEs in Singapore and Lisbon, and these two places can be used as alternative benchmarks for comparison.
According to the screening principle, two conclusions can be drawn: (1) Comparability: Compared with developed European cities with sparse populations and high income levels, such as Lisbon, Singapore, as an Asian urban area, is more comparable in the scale and population density of counties in China. At the same time, Singapore has experienced economic development and energy transformation, and its development process has more reference significance. (2) Data integrity: Both regions can collect data for many years, but Singapore, as an urban country, can obtain longer-term serial panel data from the World Bank database. Based on the above analysis, Singapore is considered to be the greenest city country in the Asian Green City Index due to its outstanding green practices and achievements. In terms of maintaining and improving the urban environment, low-carbon economy, waste and water resources, and green transportation, it is better than the average of selected regions in the Asian Green City Index. In short, Singapore meets the principles of best practice, comparability and data integrity, and it can be tested for the CKC hypothesis in the next step.

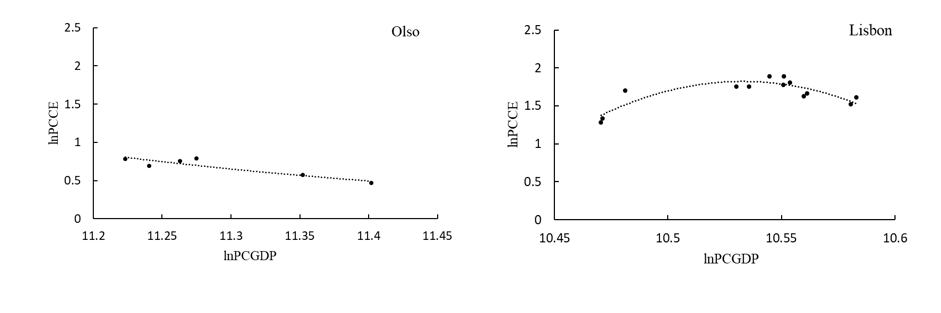
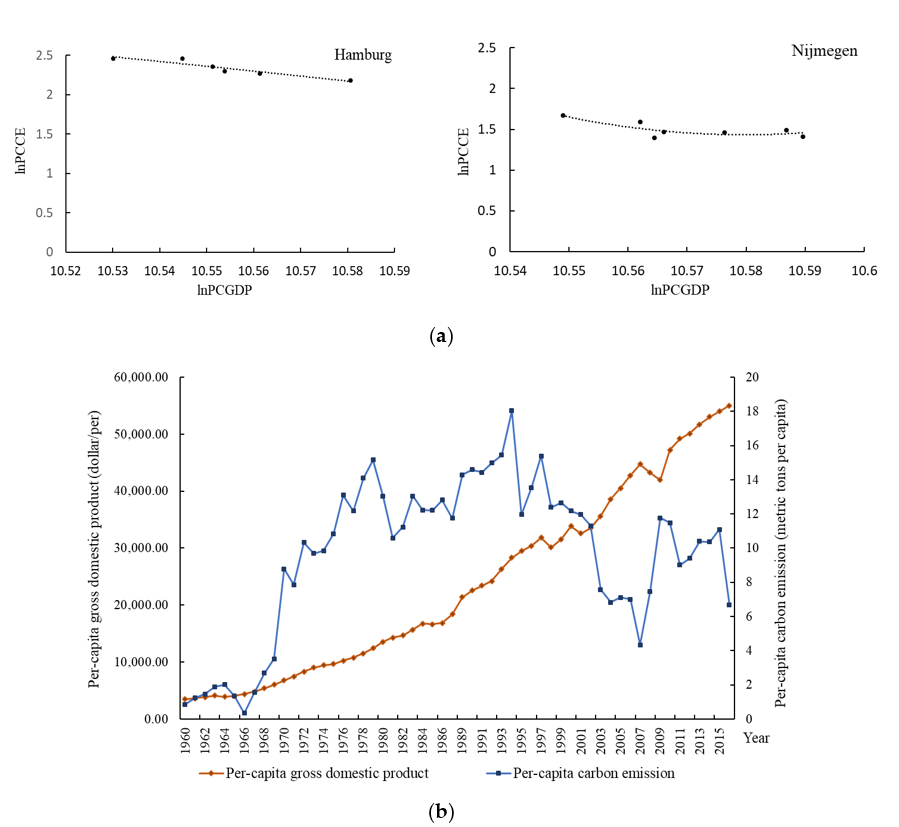
3.5. CKC Hypothesis Test

3.5.1. Model Building

EKC is widely regarded as an economic model that assumes an inverted U-shaped relationship between economic development and environmental quality. In this study, based on the well-studied classic equations, an econometric model was established to test the CKC hypothesis in Singapore. The CKC model uses PCCE as a representative variable to represent environmental quality and PCGDP as an independent variable to represent economic growth. The logarithm is used to simplify the data to reduce data fluctuations and eliminate heteroscedasticity, as shown in Formula (1). Several typical relationships between economic growth and per capita carbon dioxide emissions can be judged. First, when β1 > 0 and β2 = 0, it indicates that with economic growth, PCCEs increase sharply. Second, when β1 < 0 and β2 = 0, it indicates that economic growth has an inhibitory effect on PCCEs. Third, when β1 < 0 and β2 > 0, it indicates that there is a U-shaped relationship between economic growth and PCCEs, which is completely opposite to the Kuznets curve. Fourth, when β1 > 0 and β2 < 0, it indicates that there is an inverted U-shaped relationship between economic growth and PCCEs, which presents a typical Kuznets curve.
lnPCCEit = αi + β1lnPCGDPit + β2lnPCGDP2it + εit
In Formula (1), PCCEit is PCCE in tCO2e/person, PCGDPit is PCGDP in USD (constant USD 2010)/person, and εit is the random error term. Subscript i represents the country or region, and t refers to time. α is a constant, and βk is the coefficient of the explanatory variable, both of which were constants to be estimated.

3.5.2. Data Source and Processing

Annual timeseries data of World Bank’s (Singapore’s carbon emissions and PCGDP from 1960 to 2016) were used for empirical estimation of CKC [17]. In order to analyze timeseries data, the Augmented Dickey-Fuller (ADF) unit root test is usually used to check the stationarity of variables. Then, the Engle-Granger (EG) two-step cointegration test is usually used to test the correspondence between variables and obtain the cointegration equation [37]. The EVeiws 10.0 was used to perform these tests.

3.5.3. Stationarity Test

First, the stationarity test was performed on the dependent variable lnPCCE and the independent variables lnPCGDP, ln2PCGDP, and ln3PCGDP. The results of the stationarity test are shown in Table 3. The results indicate that, regardless of the significance level of 1%, 5%, or 10%, lnPCCE, lnPCGDP, and ln2PCGDP were all first-order single-integration sequences, which met the conditions of the same-order single-integration and could be tested for cointegration.

3.5.4. Cointegration Test and CKC Estimation

With lnPCCE as the dependent variable and lnPCGDP and ln2PCGDP as the independent variables, the Ordinary Least Squares (OLS) technique was used to estimate the parameters of variables [9,48]. The ar(1) term was added to eliminate autocorrelation, the stationary of which was tested, and the cointegration equation was obtained:
lnPCCE = 17.65462 *lnPCGDP − 0.887645 * ln2PCGDP − 85.0735 + [ar(1) = 0.484703]
t = (8.002494) (−7.704482) (−8.111192) (4.027369)
R2 = 0.881549 R2 = 0.874844 SE = 0.303375 F = 131.4806 DW = 1.888458
In Formula (2), PCCE is per capita carbon emission, PCGDP is PCGDP in USD (constant USD 2010)/person, and ar(1) is the residual, which can be regarded as the observed value of error.
The stationarity of the residual sequence of cointegration equation (Formula (2)) was tested, and the results suggest that the residual sequence is stable at the significance level of 1%. Therefore, lnPCCE has a cointegration relationship with lnPCGDP and ln2PCGDP, as shown in Table 4.
From the cointegration equation, it can be concluded that there is an inverted U-shaped curve relationship between Singapore’s PCCEs and economic growth (represented by PCGDP), as shown in Figure 4. Therefore, Singapore meets all the principles and can be used as a dynamic benchmark for carbon emissions per capita.
Based on the above Singapore CKC cointegration equation, the dynamic threshold model of PCCEs in counties was constructed (Formula (3)):
LnPCCE = 17.64529 * lnPCGDP − 0.887163 * ln2PCGDP − 85.02868
In Formula (3), lnPCGDP is the logarithm of the predicted value of GDP per capita in the county, and lnPCCE is the logarithm of the benchmark of carbon emission per capita in the county.

4. Results and Analysis

The study sets three development plans for Changxing County in 2025 (near future), 2030 (mid-term) and 2035 (long-term). The forecast data of PCCEs and PCGDP are derived from Qian’s research result in 2020 [44]. The county-level dynamic benchmarking refers to the establishment of a dynamic benchmark system for PCCEs based on different income levels by benchmarking the best practice CKC curve. Specifically, the historical PCCE value corresponding to the economic development level at a certain point in time of the best practice is used as the PCCE benchmark that the county should achieve under the same economic level. Substituting the PCGDP forecast data of Changxing County into Formula (3), the PCCE benchmark of Changxing County was calculated. The results are shown in Table 5.
According to this model, when the per capita income of Changxing County in 2025, 2030, and 2035 reaches USD 19,172.92, USD 24,483.01, and USD 29,366.11, respectively, the corresponding benchmarks should be 14.95 tons CO2/person, 14.70 tons CO2/person, and 13.55 tons CO2/person. For every 1% increase in the county’s per capita income, the PCCEs allowable room for growth is 17.6453%. The turning point is when the PCGDP is USD 20,843.23 and the PCCEs are 15.03 tons of CO2/person, which will occur between 2025 and 2030. Prior to this, the PCCE benchmark increases with the increase of PCGDP. After that, the PCCE benchmark decreases with the increase of PCGDP. According to Qian’s research, the PCCE in Changxing County is expected to reach its peak in 2030 (23.07tCO2/person) [44], and its driving factors include industrial structure, renewable energy potential, income level, etc. According to the benchmark constraint, it is clear and necessary to adjust local PCCEs factors, to promote PCCEs to converge to the benchmark within a predetermined time.
The application of benchmarks can help to judge and select future forecast scenarios. Meanwhile, if there is a gap between the forecast scenarios and the standards, the parameters of the forecast scenarios can be adjusted rationally, including the population (P), per capita GDP (R), industrial structure (S), energy intensity (U), energy structure (V), and carbon emission coefficient (W) [45]. So as to reach the standard threshold, the output is the recommended per capita GDP, urbanization rate, industrial added value, energy intensity, carbon emission coefficient of the power sector, coal consumption, development population size, etc., to promote the construction of low-carbon counties.

5. Conclusions and Discussion

5.1. Conclusions

The findings are focused on the hypothesis of the CKC trend for the noticed county, so the research may have a better consistency. Under this hypothesis, the spatial and temporal targets assumed for this county could be extended for other similar Chinese counties. Compared with previous studies, the significance of the establishment of the dynamic benchmark system lies in:
(1)
The system’s adaptability to different development stages, economical sensitivity, and enrichment of the methodology of low-carbon indicators evaluation and benchmark setting at the county scale. This method will have a certain influence on traditional LCE methods that use static benchmarks and makes a certain contribution to the scientific formulation of evaluation indicators and benchmarks.
(2)
The system’s ability to provide scientific basis for Chinese county decisionmakers to formulate reasonable targets under the management thinking driven by evaluation indicators and emission reduction targets, to help counties explore the coordinated path of economic development and emission reduction in different development stages, and to accelerate the transition to green and low carbon.
(3)
The system’s ability to better coordinate economic development and carbon emission reduction issues, which has certain reference significance for other developing regions that face similar challenges of economic development and low-carbon transformation to Changxing County to formulate scientific and reasonable low-carbon emission reduction targets.

5.2. Discussion

This article provides a preliminary exploration of dynamic benchmarking methodology. Compared with the traditional static benchmark method, it can adapt to the local needs of different development stages. However, the CKC hypothesis test in the key step of the dynamic benchmarking requires higher long-term sequence data in the best practice area. Therefore, in the process of scaling potential best practice areas, it may be difficult to obtain complete data. There are two main reasons: (1) At present, there are few urban-scale international greenhouse gas emission accounting methods, and the statistical basis of historical greenhouse gas inventory accounting and socioeconomic data at the urban scale is very different. (2) The evaluation tool usually only evaluates the value of a certain year in the best practice area. Except for the award-winning cities in European Green Capitals, as far as we know, long-term serial data are not required. In the future, the related accounting and collection of best practices will be further expanded to improve the rationality of benchmarking. At the same time, there are more than 2000 counties in China, and development types are quite diverse. Based on the system constructed in this study, the next step may be to explore and formulate different best practice benchmarks for different types of counties, and to establish a national PCCE control standards system for counties so that the results will have more universal significance. Also, the methods based on the CKC principle have some limitations. The method follows the commonly used cointegration and vector error correction modeling techniques to estimate, but the vector error correction modeling technique also has some problems. As some studies have pointed out, the error items will be affected by time and are not independent in time, which will lead to unreliable estimates. At the same time, the carbon emissions used in estimating the CKC model are usually calculated based on energy use, and the dependence of energy use on emissions may cause misspecification deviations, which leads to the model’s bias toward exaggerating the shape of CKC [49]. Therefore, in future studies, it is necessary to further modify the CKC model and combine the possible effects of other factors on emissions to make the results more accurate.

Author Contributions

L.G. and L.S. conceived and designed the methodologies; L.G. and X.S. collected and analyzed the data; L.G. and X.S. wrote the paper; L.G. and F.Y. revised the paper; L.S. and L.G. acquired funding. All authors have read and agreed to the published version of the manuscript.

Funding

This work was supported by the National Key Research and Development Program of China (2018YFC0704703).

Institutional Review Board Statement

Not applicable for studies not involving humans.

Informed Consent Statement

Not applicable for studies not involving humans.

Data Availability Statement

The data presented in this study are available on request from the corresponding author. The data are not publicly available due to the data in this article is part of the calculation process.

Acknowledgments

Valuable assistance and comments from Lishan Xiao, Chunming Li, as well as four anonymous reviewers are acknowledged.

Conflicts of Interest

The authors declare no conflict of interest.

References

  1. BP. BP Statistical Review of World Energy 2019. Available online: http://www.globalcarbonatlas.org/en/CO2-emissions (accessed on 14 October 2020).
  2. He, S.; Liao, F.; Li, G. Spatiotemporal analysis of county economy and the multi-mechanism process of regional inequality in rural China. Appl. Geogr. 2019, 111, 102073. [Google Scholar] [CrossRef]
  3. Ministry of Civil Affairs of China. Statistical Table of Administrative Divisions of the People’s Republic of China 2017. Available online: http://xzqh.mca.gov.cn/statistics/2017.html (accessed on 4 October 2020).
  4. Sun, J.W.; Xia, T.; Li, J. Macrocosm Urbanization: A New Model for the Integration of Urban and Rural Areas in Developed Regions. Jilin Univ. J. Sco. Sci. Ed. 2018, 58, 71–80, 205. (In Chinese) [Google Scholar]
  5. Yan, K.; Bao, S. County economic development must have New Thinking. Wisdom China 2018, 5, 94–95. (In Chinese) [Google Scholar]
  6. Liu, W.; Li, F. Thoughts and suggestions on low-carbon transformation and development of county economy in Shandong Peninsula Blue Economic Zone. Econ. Trade Pract. 2016, 16, 99. (In Chinese) [Google Scholar]
  7. Zhang, X.; Zhuang, G. China Provincial Carbon Emissions Differences Research Progress and Prospect. China Popul. Resour. Environ. 2015, 25, 135–143. (In Chinese) [Google Scholar]
  8. Liu, Z. China’s Carbon Emissions Report 2015; Working Paper; Belfer Center for Science and International Affairs Harvard Kennedy School: Cambridge, MA, USA, 2015; Available online: http://belfercenter.ksg.harvard.edu/files/carbon-emissions-report-2015-final.pdf (accessed on 4 October 2020).
  9. Wang, Q.; Chiu, Y.; Chiu, C. Driving factors behind carbon dioxide emissions in China: A modified production-theoretical decomposition analysis. Energy Econ. 2015, 51, 252–260. [Google Scholar] [CrossRef]
  10. Shan, Y.; Guan, D.; Hubacek, K.; Zheng, B.; Davis, S.J.; Jia, L.; Liu, J.; Liu, Z.; Mi, Z.; Meng, J.; et al. Climate change mitigation measures at the city level in China. Sci. Adv. 2018, 4, eaaq0390. [Google Scholar] [CrossRef] [PubMed] [Green Version]
  11. Chan, E.H.W.; Choy, L.H.T.; Yung, E.H.K. Current research on low-carbon cities and institutional responses. Habitat Int. 2013, 37. [Google Scholar] [CrossRef]
  12. Price, L.; Zhou, N.; Fridley, D.; Ohshita, S.; Lu, H.; Zheng, N.; Fino-Chen, C. The development of China’s low-carbon indicator system. Habitat Int. 2013, 37, 4–21. [Google Scholar] [CrossRef] [Green Version]
  13. Pan, X.; Teng, F.; Ha, Y.; Wang, G. Equitable Access to Sustainable Development: Based on the comparative study of carbon emission rights allocation schemes. Appl. Energy 2014, 130, 632–640. [Google Scholar] [CrossRef]
  14. Jobert, T.; Karanfil, F.; Tykhonenko, K.A. Convergence of per capita carbon dioxide emissions in the EU: Legend or reality? Energy Econ. 2010, 32, 1364–1373. [Google Scholar] [CrossRef]
  15. Baeumler, A.; Ijjasz-Vasquez, E.S.M. (Eds.) Sustainable Low-Carbon City Development in China; World Bank Publications: Washington, DC, USA, 2012. [Google Scholar]
  16. Wu, H. China’s Multi-Scale Regional Carbon Emission Reduction: Pattern, Mechanism and Path; China Development Press: Beijing, China, 2014. (In Chinese) [Google Scholar]
  17. World Bank. CO2 Emissions (Metric Tons Per Capita) in World Bank Database. 2016. Available online: https://data.worldbank.org/indicator/EN.ATM.CO2E.PC (accessed on 10 December 2020).
  18. Aldy, J.E. Per Capita Carbon Dioxide Emissions: Convergence or Divergence? Environ. Resour. Econ. 2006, 33, 533–555. [Google Scholar] [CrossRef] [Green Version]
  19. Baumol, W.J. Productivity Growth, Convergence and Welfare. American Economic Review. 1986, 76, 1072–1085. [Google Scholar] [CrossRef]
  20. Li, X.; Lin, B. Global convergence in per capita CO2 emissions. Renew. Sust. Energ. Rev. 2013, 24, 357–363. [Google Scholar] [CrossRef]
  21. Karakaya, E.; Alatas, S.; Yilmaz, B. Replication of Strazicich and List (2003): Are CO2 emission levels converging among industrial countries? Energy Econ. 2017, 82, 135–138. [Google Scholar] [CrossRef]
  22. Tan, S.; Yang, J.; Yan, J.; Lee, C.; Hashim, H.; Chen, B. A holistic low carbon city indicator framework for sustainable development. Appl. Energy 2017, 185, 1919–1930. [Google Scholar] [CrossRef]
  23. Azizalrahman, H.; Hasyimi, V. Towards a generic multi-criteria evaluation model for low carbon cities. Sustain. Cities Soc. 2018, 39, 275–282. [Google Scholar] [CrossRef]
  24. Zhou, N.; He, G.; Williams, C.; Fridley, D. ELITE cities: A low-carbon eco-city evaluation tool for China. Ecol. Indic. 2015, 48, 448–456. [Google Scholar] [CrossRef] [Green Version]
  25. Den, E.M.; Berk, M.M.; Lucas, P. Simplified Multi-Stage and Per Capita Convergence: An Analysis of Two Climate Regimes for Differentiation of Commitments; RIVM Report 728001027/2004; National Institute of Public Health and the Environment (RIVM); Netherlands Environmental Assessment Agency: The Hague, The Netherlands, 2004. [Google Scholar]
  26. Elzen, M.D.; Berk, M.; Lucas, P.; Criqui, P.; Kitous, A. Multi-Stage: A Rule-Based Evolution of Future Commitments under the Climate Change Convention. Int. Environ. Agreem. 2006, 6, 1–28. [Google Scholar] [CrossRef]
  27. Barro, R.J.; Sala-I-Martin, X. Convergence. J. Political Econ. 1992, 100, 223–251. [Google Scholar] [CrossRef]
  28. Islam, N. What have We Learnt from the Convergence Debate? J. Econ. Surv. 2003. [Google Scholar] [CrossRef] [Green Version]
  29. Strazicich, M.C.; List, J.A. Are CO2 Emission Levels Converging Among Industrial Countries? Environ. Resour. Econ. 2003, 24, 263–271. [Google Scholar] [CrossRef]
  30. Acar, S.; Soderholm, P.; Brannlund, R. Convergence of per capita carbon dioxide emissions: Implications and meta-analysis. Clim. Policy 2018, 18, 512–525. [Google Scholar] [CrossRef]
  31. Bulte, E.; List, J.A.; Strazicich, M.C. Regulatory federalism and the distribution of air pollutant emissions. J. Reg. Sci. 2007, 47, 155–178. [Google Scholar] [CrossRef]
  32. Hou, L.; Tang, L.; Qian, Y.; Chen, H.; Wang, L. Study of county-level low-carbon standards in China based on carbon emissions per capita. Int. J. Sustain. Dev. World Ecol. 2019, 26, 698–707. [Google Scholar] [CrossRef]
  33. Tapio, P. Towards a theory of decoupling: Degrees of decoupling in the EU and the case of road traffic in Finland between 1970 and 2001. Transp. Policy 2005, 12, 137–151. [Google Scholar] [CrossRef] [Green Version]
  34. Brock, W.; Taylor, M. The Green Solow model. J. Econ. Growth 2010, 15, 127–153. [Google Scholar] [CrossRef]
  35. Wang, S.; Li, G.; Fang, C. Urbanization, economic growth, energy consumption, and CO2 emissions: Empirical evidence from countries with different income levels. Renew. Sustain. Energy Rev. 2018, S1364032117309644. [Google Scholar] [CrossRef]
  36. Grossman, G.M.; Krueger, A.B. Environmental Impacts of a North American Free Trade Agreement; National Bureau of Economic Research: Cambridge, MA, USA, 1991. [Google Scholar]
  37. Shuai, C.; Chen, X.; Shen, L.; Jiao, L.; Wu, Y.; Tan, Y. The turning points of carbon Kuznets curve: Evidences from panel and time-series data of 164 countries. J. Clean. Prod. 2017, 162, 1031–1047. [Google Scholar] [CrossRef]
  38. Li, K.; Lin, B. Impacts of urbanization and industrialization on energy consumption/CO2 emissions: Does the level of development matter? Renew. Sustain. Energy. Rev. 2015, 52, 1107–1122. [Google Scholar] [CrossRef]
  39. Fu, J.; Zhao, C. Will environmental regulations affect the export trade of pollution-intensive industries?—Analysis based on China’s panel data and trade gravity model. Economist 2014, 02, 47–58. (In Chinese) [Google Scholar]
  40. Wang, Q.; Su, M. The effects of urbanization and industrialization on decoupling economic growth from carbon emission—A case study of China. Sustain. Cities Soc. 2019, 51, 101758. [Google Scholar] [CrossRef]
  41. Wang, Z.; Ye, X. Re-examining environmental kuznets curve for china’s city-level carbon dioxide emissions. Spat. Stat. 2017, 21, 377–389. [Google Scholar] [CrossRef]
  42. Sustainable Development Strategy Study Group Chinese Academy of Sciences. China Sustainable Development Strategy Report 2009—China’s Approach towards a Low Carbon Future; Science Press: Beijing, China, 2009. (In Chinese) [Google Scholar]
  43. Zhou, C.; Wang, S.; Wang, J. Examining the influences of urbanization on carbon dioxide emissions in the Yangtze river delta, China: Cuznets curve relationship. Sci. Total Environ. 2019, 675, 472–482. [Google Scholar] [CrossRef]
  44. Qian, Y.; Sun, L.; Qiu, Q.; Tang, L.; Shang, X.; Lu, C. Analysis of CO2 Drivers and Emissions Forecast in a Typical Industry-Oriented County: Changxing County, China. Energies 2020, 13, 1212. [Google Scholar] [CrossRef] [Green Version]
  45. EIU. European Green City Index: Assessing the Environmental Performance of European’s Major Cities; Economist Intelligence Unit: Munich, Germany, 2009. [Google Scholar]
  46. EIU. Asian Green City Index: Assessing the Environmental Performance of Asia’s Major Cities; Economist Intelligence Unit: Munich, Germany, 2011. [Google Scholar]
  47. European Commission. Applicant City for the European Green Capital Award 2017. 2015. Available online: http://ec.europa.eu/environment/europeangreencapital/applying-for-the-a.ward/2017-egca-applicantcities/2015.11.06 (accessed on 14 October 2020).
  48. Orubu, C.O.; Omotor, D.G. Environmental quality and economic growth: Searching for environmental kuznets curves for air and water pollutants in Africa. Energy Policy 2011, 39, 4178–4188. [Google Scholar] [CrossRef]
  49. Itkonen, J.V.A. Problems estimating the carbon Kuznets curve. Energy 2012, 39, 274–280. [Google Scholar] [CrossRef]
Figure 1. Flow of dynamic benchmark system framework development.
Energies 14 00599 g001
Figure 2. Research framework of the dynamic benchmark system for county PCCEs.
Energies 14 00599 g002
Figure 3. (a) Changes of per capita gross domestic product (PCGDP) and PCCE in potential best practice areas [47]. (Oslo, Lisbon, Hamburg, and Nijmegen). (b) Changes of PCGDP and PCCEs in potential best practices (Singapore).
Energies 14 00599 g003aEnergies 14 00599 g003b
Figure 4. Logarithmic Environmental Kuznets Curve (EKC) and fitting curve of PCCEs and PCGDP in Singapore.
Energies 14 00599 g004
Table 1. Per capita carbon emission (PCCE)-related low-carbon evaluation (LCE) tools and benchmarking methods.
CategoriesLCE ToolScaleCarbon Emission IndicatorBenchmarking Method
Relative comparison methodSiemens Green City Index (Europe and Asia)CitiesPCCESelection of the most important cities in Europe and Asia for comparison
European Green Capital Award (EGCA)Carbon dioxide emissionsComparison of European cities that submitted applications
Low Carbon City Index System of Chinese Academy of Social SciencesPCCECompare with national average or with historical data
American Green Building Certification (LEED for Cities)Cities and communitiesCarbon dioxide emission decline rateBenchmark classification test according to national and global standards
Absolute comparison methodLow carbon eco-city assessment tool (ELITE)CitiesPCCESet benchmarks concerning Chinese goals, international best practice standards and performance
Guide to Low Carbon Community of National Development and Reform Commission of ChinaPCCE, industrial carbon dioxide emissions intensityRefer to the energy conservation and emission reduction performance of many international cities to determine the local benchmark
CASBEE for Cities in JapanAverage annual carbon emissions per personComparative scoring based on a clear graded scoring system
China National Development and Reform Commission Low Carbon Community GuideCommunitiesCO2 emission reduction rateSet specific target reference values
BREEAM-CommunityReduction in CO2 emissionsComparative scoring based on a clear graded scoring system
Green Star-Community in AustraliaClimate adaptation planning and reporting
Green Mark for Districts in SingaporeBlockCarry out carbon emission accounting
Evaluation standard of green ecological city of China’s Ministry of Housing and Urban-Rural DevelopmentBlockCarbon emissions per unit of GDP, PCCE, and carbon emissions per unit area
Table 2. List and data of the European Green Capital Award (EGCA)-winning cities.
YearCityYear of Data (Per Capita CO2)
2010Stockholm1990, 2000, 2005
2011Hamburg1990, 1997, 2003–2006
2012Vitoria-Gasteiz2000, 2002, 2004, 2006
2013Nantes1990, 1999, 2003, 2009
2014Copenhagen2010
2015Bristo2010
2016Ljubljana2004–2011
2017Essen1990, 2011
2018Nijmegen2008–2014
2019Olso1990, 2013
2020 Lisbon2002–2014
2021Lahti2017
Table 3. Stationarity test results of PCCE and PCGDP.
lnPCCEΔlnPCCElnPCGDPΔlnPCGDPln2PCGDPΔln2PCGDP
Inspection type
(c,t,k)
(c, 0, 0)(0, 0, 0)(c, 0, 0)(c, t, 1)(c, 0, 0)(c, t, 1)
ADF−2.778122−7.694709−2.740418−5.412487−2.003508−5.743101
T value
(p value)
−2.595033 *
(0.0679)
−2.607686 ***
(0.0000)
−2.595033 *
(0.0737)
−4.137279 ***
(0.0002)
−2.595033
(0.2846)
−4.137279 ***
(0.0001)
Note: c,t,k represent intercept, time trend term, and lag period, respectively; Δ denotes the first order difference. *, **, *** indicate rejection of the null hypothesis at 10%, 5%, and 1% significance levels, and null hypothesis of the cointegration test means there is no correlation.
Table 4. Test results of residual sequence stationarity.
VariableExamination Form
(c,t,k)
ADFT Value
(p Value)
e(C,0,3)−6.354384−4.130526 ***
(0.0000)
Note: *, **, *** indicate rejection of the null hypothesis at 10%, 5%, and 1% significance levels, and null hypothesis of the cointegration test means there is no correlation.
Table 5. Calculation results of PCCE benchmark in Changxing County.
Forecast Period (Year)ln PCGDPChangxing 1 (Dollar)PCCEChangxing
(Dollar)
ln PCGDPln PCCEBenchmarkPCCEBenchmark
(Dollar)
Recent period (2025)19172.9222.949.8612543722.70443471214.95
Mid-term period (2030)24483.0123.0710.10573472.68764284214.70
Long-term period
(2035)
29366.1122.0910.287596452.60636539913.55
Publisher’s Note: MDPI stays neutral with regard to jurisdictional claims in published maps and institutional affiliations.

