Article

Generating Electricity from Natural Evaporation Using PVDF Thin Films Incorporating Nanocomposite Materials

1
Iolani School, Honolulu, HI 96822, USA
2
Department of Civil & Environmental Engineering, University of Hawaii at Mānoa, Honolulu, HI 96822, USA
3
Department of Mechanical Engineering, University of Hawaii at Mānoa, Honolulu, HI 96822, USA
*
Authors to whom correspondence should be addressed.
Energies 2021, 14(3), 585; https://doi.org/10.3390/en14030585
Submission received: 6 November 2020 / Revised: 16 January 2021 / Accepted: 20 January 2021 / Published: 24 January 2021
(This article belongs to the Section A: Sustainable Energy)

Abstract

:
Natural evaporation has recently come under consideration as a viable source of renewable energy. Demonstrations of the validity of the concept have been reported for devices incorporating carbon-based nanocomposite materials. In this study, we investigated the possibility of using polymer thin films to generate electricity from natural evaporation. We considered a polymeric system based on polyvinylidene fluoride (PVDF). Porous PVDF films were created by incorporating a variety of nanocomposite materials into the polymer structure through a simple mixing procedure. Three nanocomposite materials were considered: carbon nanotubes, graphene oxide, and silica. The evaporation-induced electricity generation was confirmed experimentally under various ambient conditions. Among the nanocomposite materials considered, mesoporous silica (SBA-15) was found to outperform the other two materials in terms of open-circuit voltage, and graphene oxide generated the highest short-circuit current. It was found that the nanocomposite material content in the PVDF film plays an important role: on the one hand, if particles are too few in number, the number of channels will be insufficient to support a strong capillary flow; on the other hand, an excessive number of particles will suppress the flow due to excessive water absorption underneath the surface. We show that the device can be modeled as a simple circuit powered by a current source with excellent agreement between the theoretical predictions and experimental data.

1. Introduction

Evaporation is a ubiquitous natural process in which a liquid changes into a gas by absorbing enough thermal energy to overcome its ambient vapor pressure. About half of the solar energy absorbed by the Earth contributes to evaporation [1,2], which makes it the most important process affecting natural water cycles [3,4]. Natural evaporation can be expected in any scenario with air flow, including ordinary room environments. While other clean-energy harvesting technologies, such as electromechanical [5,6,7,8,9], thermoelectric [10,11], electrochemical [12,13,14], and photovoltaic [15,16] technologies, have been the subjects of extensive and continuing investigations, evaporation as a source of renewable energy has gone largely untapped until only very recently. Thanks to recent advances in hygroscopic materials [17,18,19,20,21], mechanical energy can be generated from ambient humidity through physical deformation of materials under a continuous cycle of water absorption and desorption. In order to power wireless sensors or portable devices, this method needs another set of generators that convert mechanical energy into electrical energy, which complicates the whole energy transduction system. More recently, an electricity generator working directly via natural evaporation has been developed. The proposed device utilizes evaporation-driven fluid flow in the pores of materials to generate a continuous streaming current [22,23]. Specifically, the device relies on the fact that an electric double layer is spontaneously formed when a surface comes into contact with a liquid. Accordingly, when flow is driven through the porous media, mobile ions in the electric double layer will be carried by the flow, leading to an ionic current. However, the particle flame synthesis method used to fabricate the device is not economically or environmentally viable. Moreover, the flame-made carbon black sheets incorporated into the device are fragile and easy to peel off. Some efforts have been made to solve these issues. Ding et al. [24] collected particles using the flame synthesis method and coated them with other polymers in order to solve the weak adhesion problem. This approach still requires the dirty and energy-inefficient flame method to fabricate the particles. Ma et al. [25] synthesized an advanced metal–organic-framework-based hybrid material to replace the fragile flame-deposited carbon material. Zhang et al. [26] utilized a partially reduced graphene oxide sponge to generate electricity from natural evaporation.
While those studies focused on novel advanced materials, many types of particles are cheaply and easily available from commercial suppliers. As demonstrated in many studies, particles can be used as functional fillers to form high performance polymeric systems [27,28]. In this study, several commercially available particles—carbon tubes, silica, and graphene oxide—were examined to study their effectiveness when used in evaporative energy harvesting devices. Mixing, which is a mature technological process widely used in industry, was used to prepare suspensions of the particle and an adhesive, polyvinylidene fluoride (PVDF). PVDF is an inexpensive and commonly available adhesive that can easily be processed with industrial mixers to incorporate microparticles and nanoparticles and coated onto a substrate. As PVDF-based thin films have been considered in a wide spectrum of water-related applications due to its mechanical, thermal, and chemical stability and its resistance to aging [29,30], adding a power generation function to the films will enhance the versatility and performance of this polymeric system, opening doors to other opportunities such as self-powered operation. Here we show that thin film-based energy harvesting devices can be fabricated very easily by ink coating of the suspension onto a substrate. Among the material formulations tested, devices using 45 wt.% silica show better performance than the others in terms of open-circuit voltage, which can reach up to 200 mV, and the device with 45 wt.% graphene oxide particles generated the highest short circuit current of about 300 nA. The optimal power output of 45 wt.% graphene oxide particles can reach up to 4 nW in a room. We show that the device can be modeled as an electrical circuit of resistive loads, powered by a current source. The theoretical results obtained agree well with experimental data. Overall, in this study, we show that a robust, porous energy harvesting device can be fabricated cheaply and easily using commercially available particles and adhesives via a mixing process. Due to the low cost of the materials and the simplicity of the preparation method, this study demonstrates an economical and sustainable method to power low power-consumption sensors and portable devices using natural evaporation.

2. Results

2.1. Device Design and Working Mechanism

A device design concept similar to those used in related previous studies was adopted in this study [23,25]. Figure 1 shows 3D rendered models of a prototype harvester. As shown in Figure 1a, a 2 in × 3 in glass slide was used as the substrate. Two L-shaped electrodes were formed on the substrate. The electrodes were fabricated by coating graphene platelet (with a nominal particle-size of 25 μm) ink onto the glass slide to form the transverse parts of the L-shaped electrodes. Graphite foil tapes were used for the longitudinal parts that were used to connect to measuring equipment. The working material, i.e., the suspension of PVDF incorporated with particles, was then coated on the substrate to make the composite thin film, which covered the two transverse leads. The electrodes were sealed with epoxy except the tips at the top of the glass slides. Figure 1b shows a 3D rendered image of the device in operation. The device was placed in a beaker, with part of the working material immersed in the deionized water; the bottom electrode was below the water level. Due to capillary action, the water in the beaker climbed up through the microchannels in the film and evaporated. When the evaporation rate matched the capillary drive, a steady flow in the microchannels was established.
It is well understood that at a solid–water interface, an electric double layer is spontaneously established due to association and disassociation reactions or ion adsorptions. While the structure of an electric double layer is complicated, it can be considered as a structure consisting of an inner layer in which the counter ions attracted by the surface charge are strongly attached to the surface, and an outer layer in which the counter ions are loosely bound in a diffuse way. When water is driven through the channels, e.g., by evaporation or capillarity, the ions in the inner layer of the electric double layer stay attached to the surface, and those in the diffuse layer move along with the moving water molecules. This movement of ions generates an ionic current, i.e., the streaming current. The streaming current can be calculated using [31]
I s = A ε r ε 0 η l Δ P ζ ,
where I s is the streaming current, ζ is the zeta potential, ε 0 is the permittivity of a vacuum, ε r and η are the dielectric constant and viscosity of the water, and l and A are the pore length and the total cross-section of all pores, respectively. Δ P is the pressure that drives the water flow. In this case it is determined by several parameters, such as the evaporation rate, the capillary pull, and the water content in the capillary region. In the steady state, the flow stabilizes, giving a constant pressure, and thus a constant streaming current. Concerning charge transport, the presence of the streaming current will lead to the accumulation of mobile ions at one end of the channels. Due to this accumulation, a potential difference between the two ends of the channels will also develop. Moreover, the potential difference is associated with an electric field, which exerts a force on the ions in the opposite direction to the direction of the flow [32]. The corresponding conduction current I c is described as I c = A σ V s / l , where σ is the water conductivity and V s is the potential difference. In the steady state, the two contributions to ion motion balance out, and the net current is zero—i.e., I c = I s . The steady-state potential difference can be given as
V s = ε r ε 0 Δ P ζ σ η .
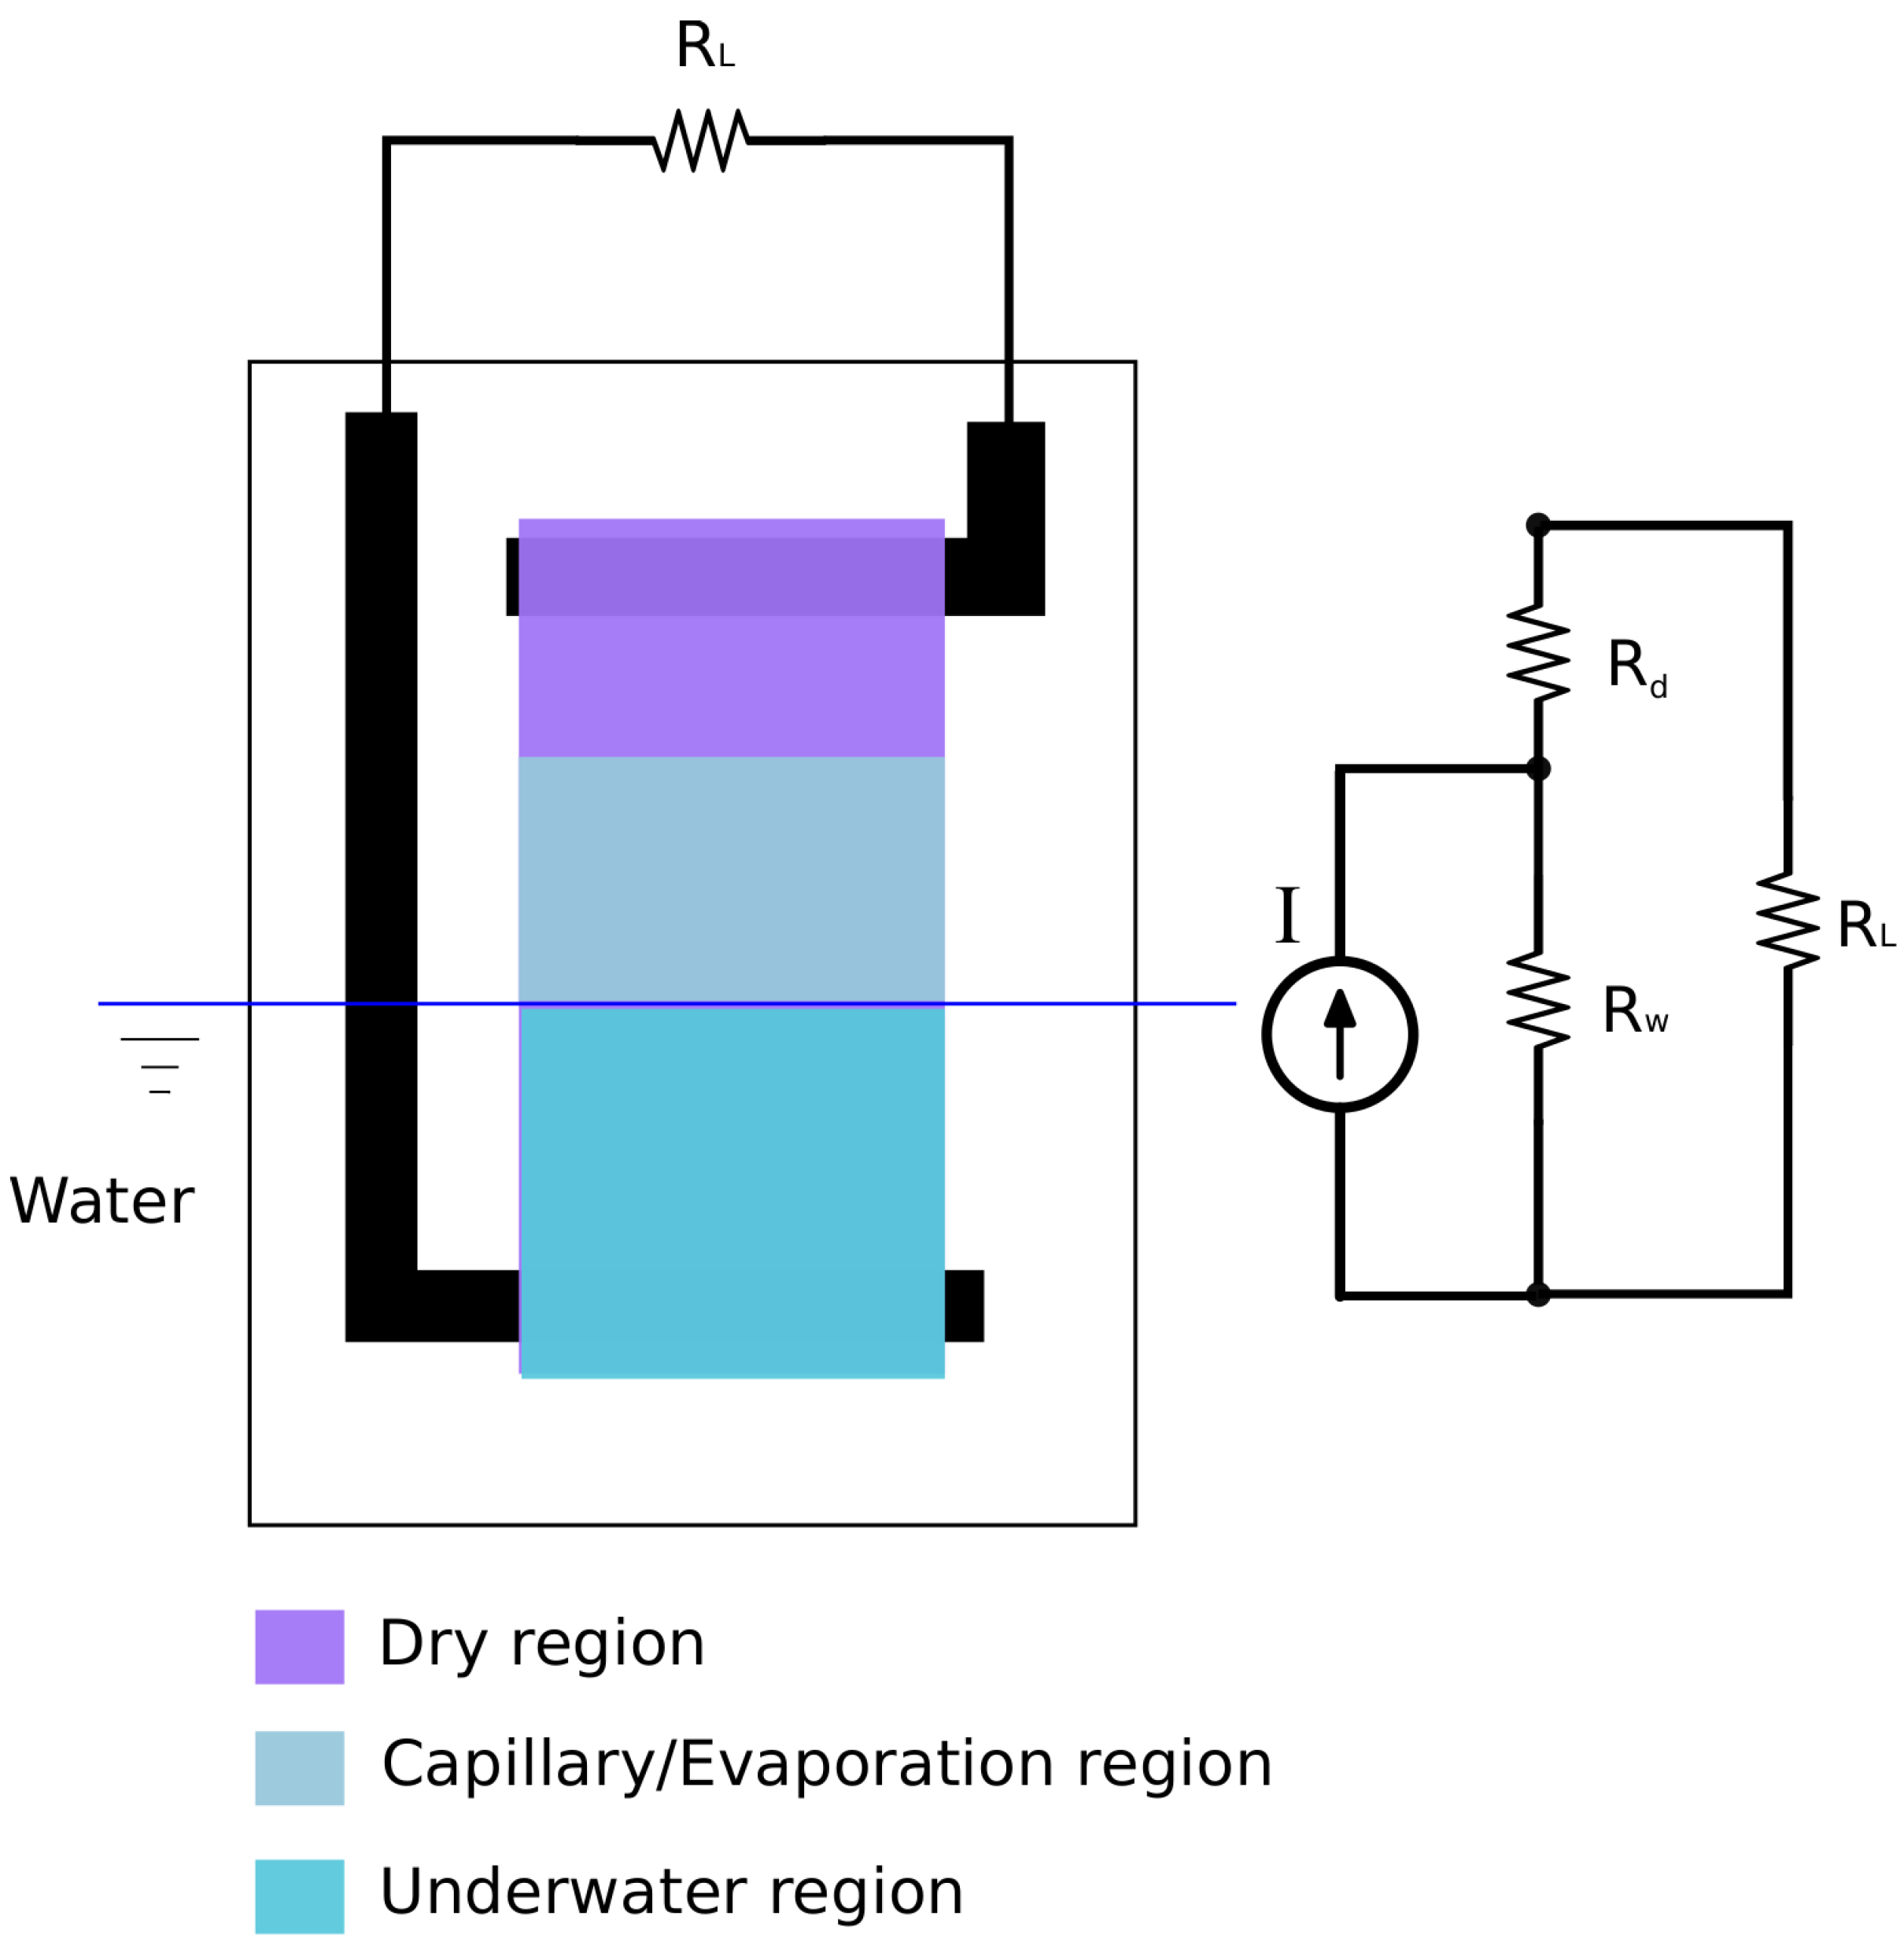
The device can be modeled with an equivalent circuit shown in Figure 2. The evaporation-induced flow of ions can be modeled as a current source, I; the conductivity of the fluid and the working material is modeled as internal resistance. In a general case where water cannot climb all the way up to cover the entire working area, there will be a wet region and a dry region, as shown, each represented by a resistor, i.e., R d and R w for the dry and the wet regions, respectively. The wet region includes both the underwater portion and that above the waterline because of capillary action. It is noted that R w includes contributions from the conductivity of the film (solid) and the water, and can be further considered as two resistors, one for the film and one for water, connected in parallel. Therefore, without a load resistance, i.e., R L = , the circuit is closed due to the conducting current I c flowing through R w . When the voltage between the electrodes is measured, the internal resistance of the meter is the load resistance. When this resistance is much higher than R w , the measured voltage is approximately that across R w .

2.2. Performance Evaluation of the Device

In this study, we investigated the effectiveness of three materials as the working material for the energy harvesting device. They were carbon tubes, mesoporous silica (SBA-15), and graphene oxide. The working area was fabricated with PVDF as the polymer network and NMP as the solvent. The materials considered were added with different wt.% to the PVDF and NMP mixture to make the nanoparticle thin films. Unless mentioned otherwise, the working areas of all devices were of the same dimensions, i.e., 20 mm × 20 mm. Detailed information of the fabrication process is provided in the Materials and Methods section of this article.

2.2.1. Carbon Tubes

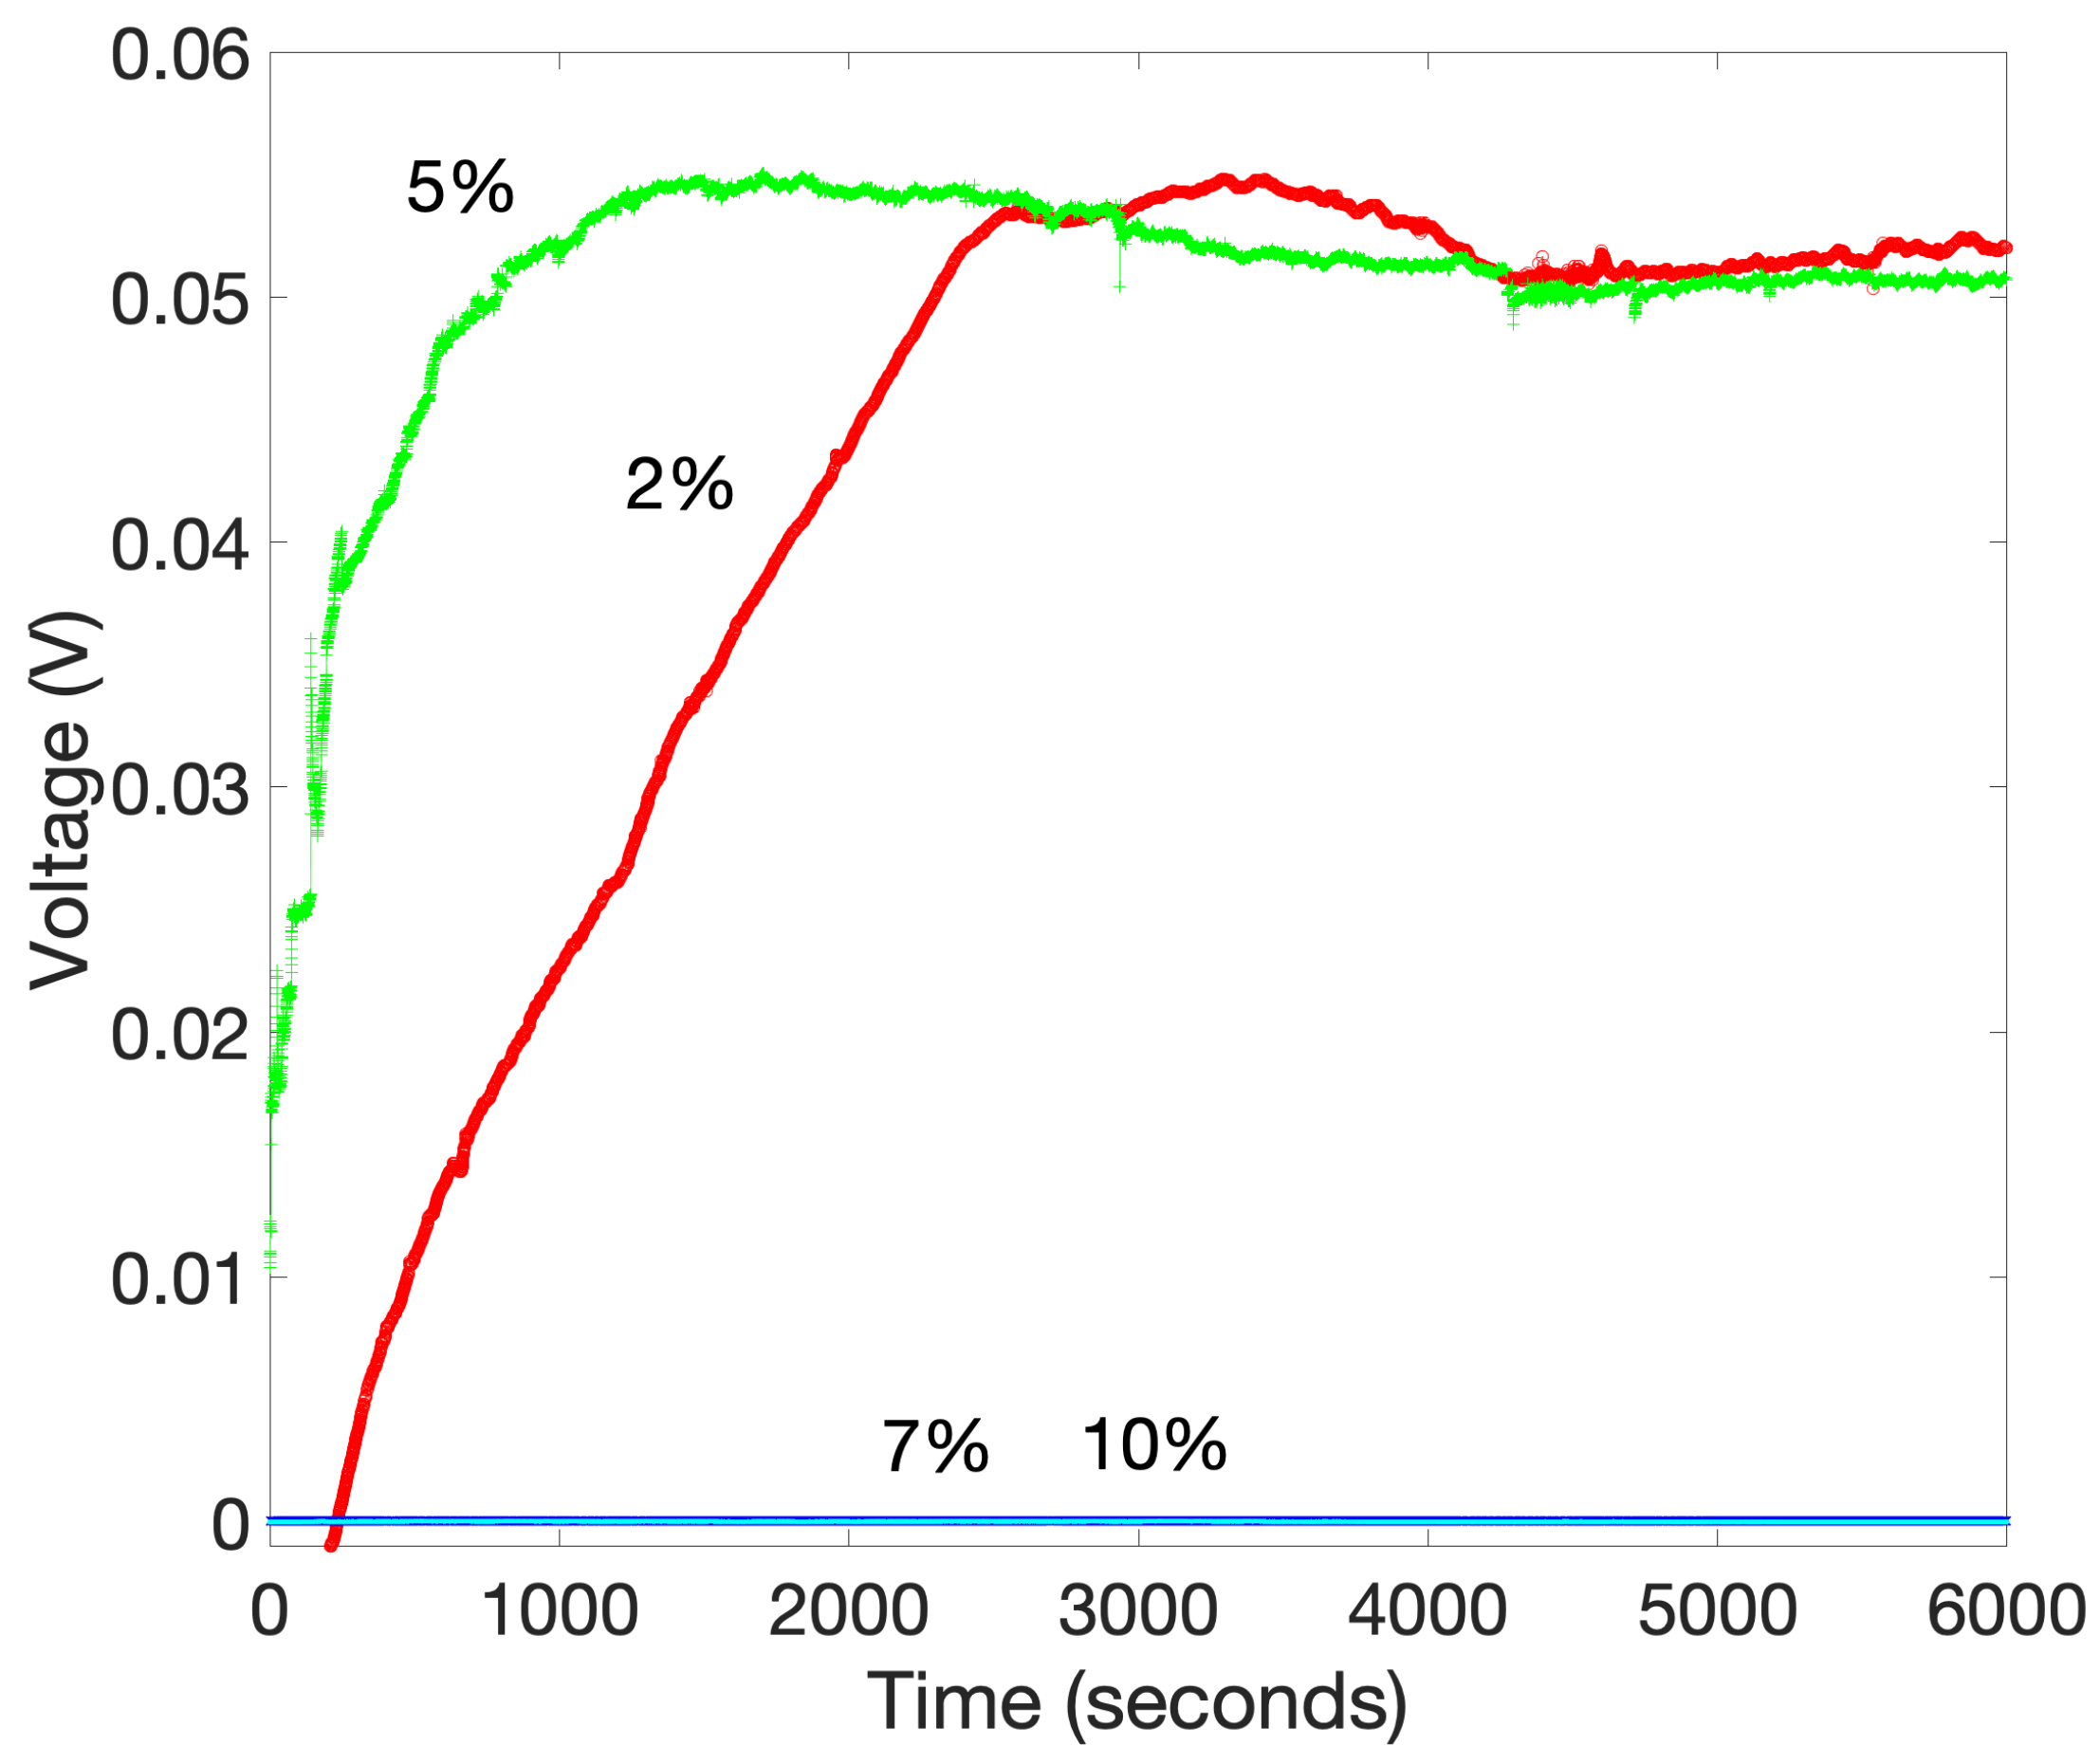
Multi-walled carbon tubes with 30–50 nm outside diameter and 5–12 nm inside diameter were considered in this study. The average length of the carbon tubes was 10–20 μm. The Brunauer–Emmett–Teller (BET) surface area provided by vendors is about 100 m 2 /g. The use of relatively long carbon tubes is believed to help the formation of microcapillary channels necessary for the evaporation-induced capillary flow. The films are roughly 100 μm thick measured by calipers. The results obtained for devices with 2, 5, 7, and 10 wt.% carbon tubes are shown in Figure 3. The PVDF films with 2 and 5 wt.% carbon tubes clearly show the open-circuit voltage rises continuously from the start of the evaporation process and gradually reaches a stable value of roughly 50 mV. Increasing the carbon tube content to 7 wt.% dramatically reduces the voltage, which is roughly 20 μV. As the capillary action is a mechanical process that relies on the nature of the micro channels, increasing the content of particles should in fact enhance capillarity, and thus natural evaporation due to a larger surface area [33]. We argue that this significant drop of voltage is the result of the dramatic increase of the conductivity of the film. The resistance of the device with 5 wt.% carbon tubes in a dry condition is beyond the limit of the measuring equipment, and it is approximately 24 M Ω when the device is in operation. This resistance is due to the resistivity of the deionized water, which is around 18 M Ω -cm. The film with 10 wt.% carbon tubes is conducting with a resistance of 8 k Ω under both the dry and wet conditions. Therefore, for the device with 10 wt.% carbon tubes, the internal resistance R w in Figure 2 is dominated by the resistance of the film, not the resistance of the deionized water. The results shown in Figure 3 correlate well with a steady-state streaming current of approximately 2.5 nA for both cases. As 10 wt.% carbon tubes make the film conductive, further increasing the carbon tube content does not reduce the resistance by the same order of magnitude. The devices fabricated with 80 wt.% carbon tubes produce tens of micro volts with a resistance of 2–5 k-ohm. Figure 4 shows scanning electron microscope (SEM) and transmission electron microscope (TEM) images of a PVDF film with 5 wt.% carbon tubes. Portions of some carbon nanotubes are on the surface of the film, as shown in the SEM image. Embedded carbon nanotubes and their multiwall structure, and the interior space of a nanotube, are shown in the TEM images. Due to the low particle content, the number of capillary channels is very limited. This is believed to have limited the evaporation-induced flow, resulting in a low open-circuit voltage. It is noted that when a pure PVDF film without any added particles was used, no open-circuit voltage was observed. This is to be expected, as pure PVDF is not porous and does not contain any channels for water flow.

2.2.2. Mesoporous Silica (SBA-15)

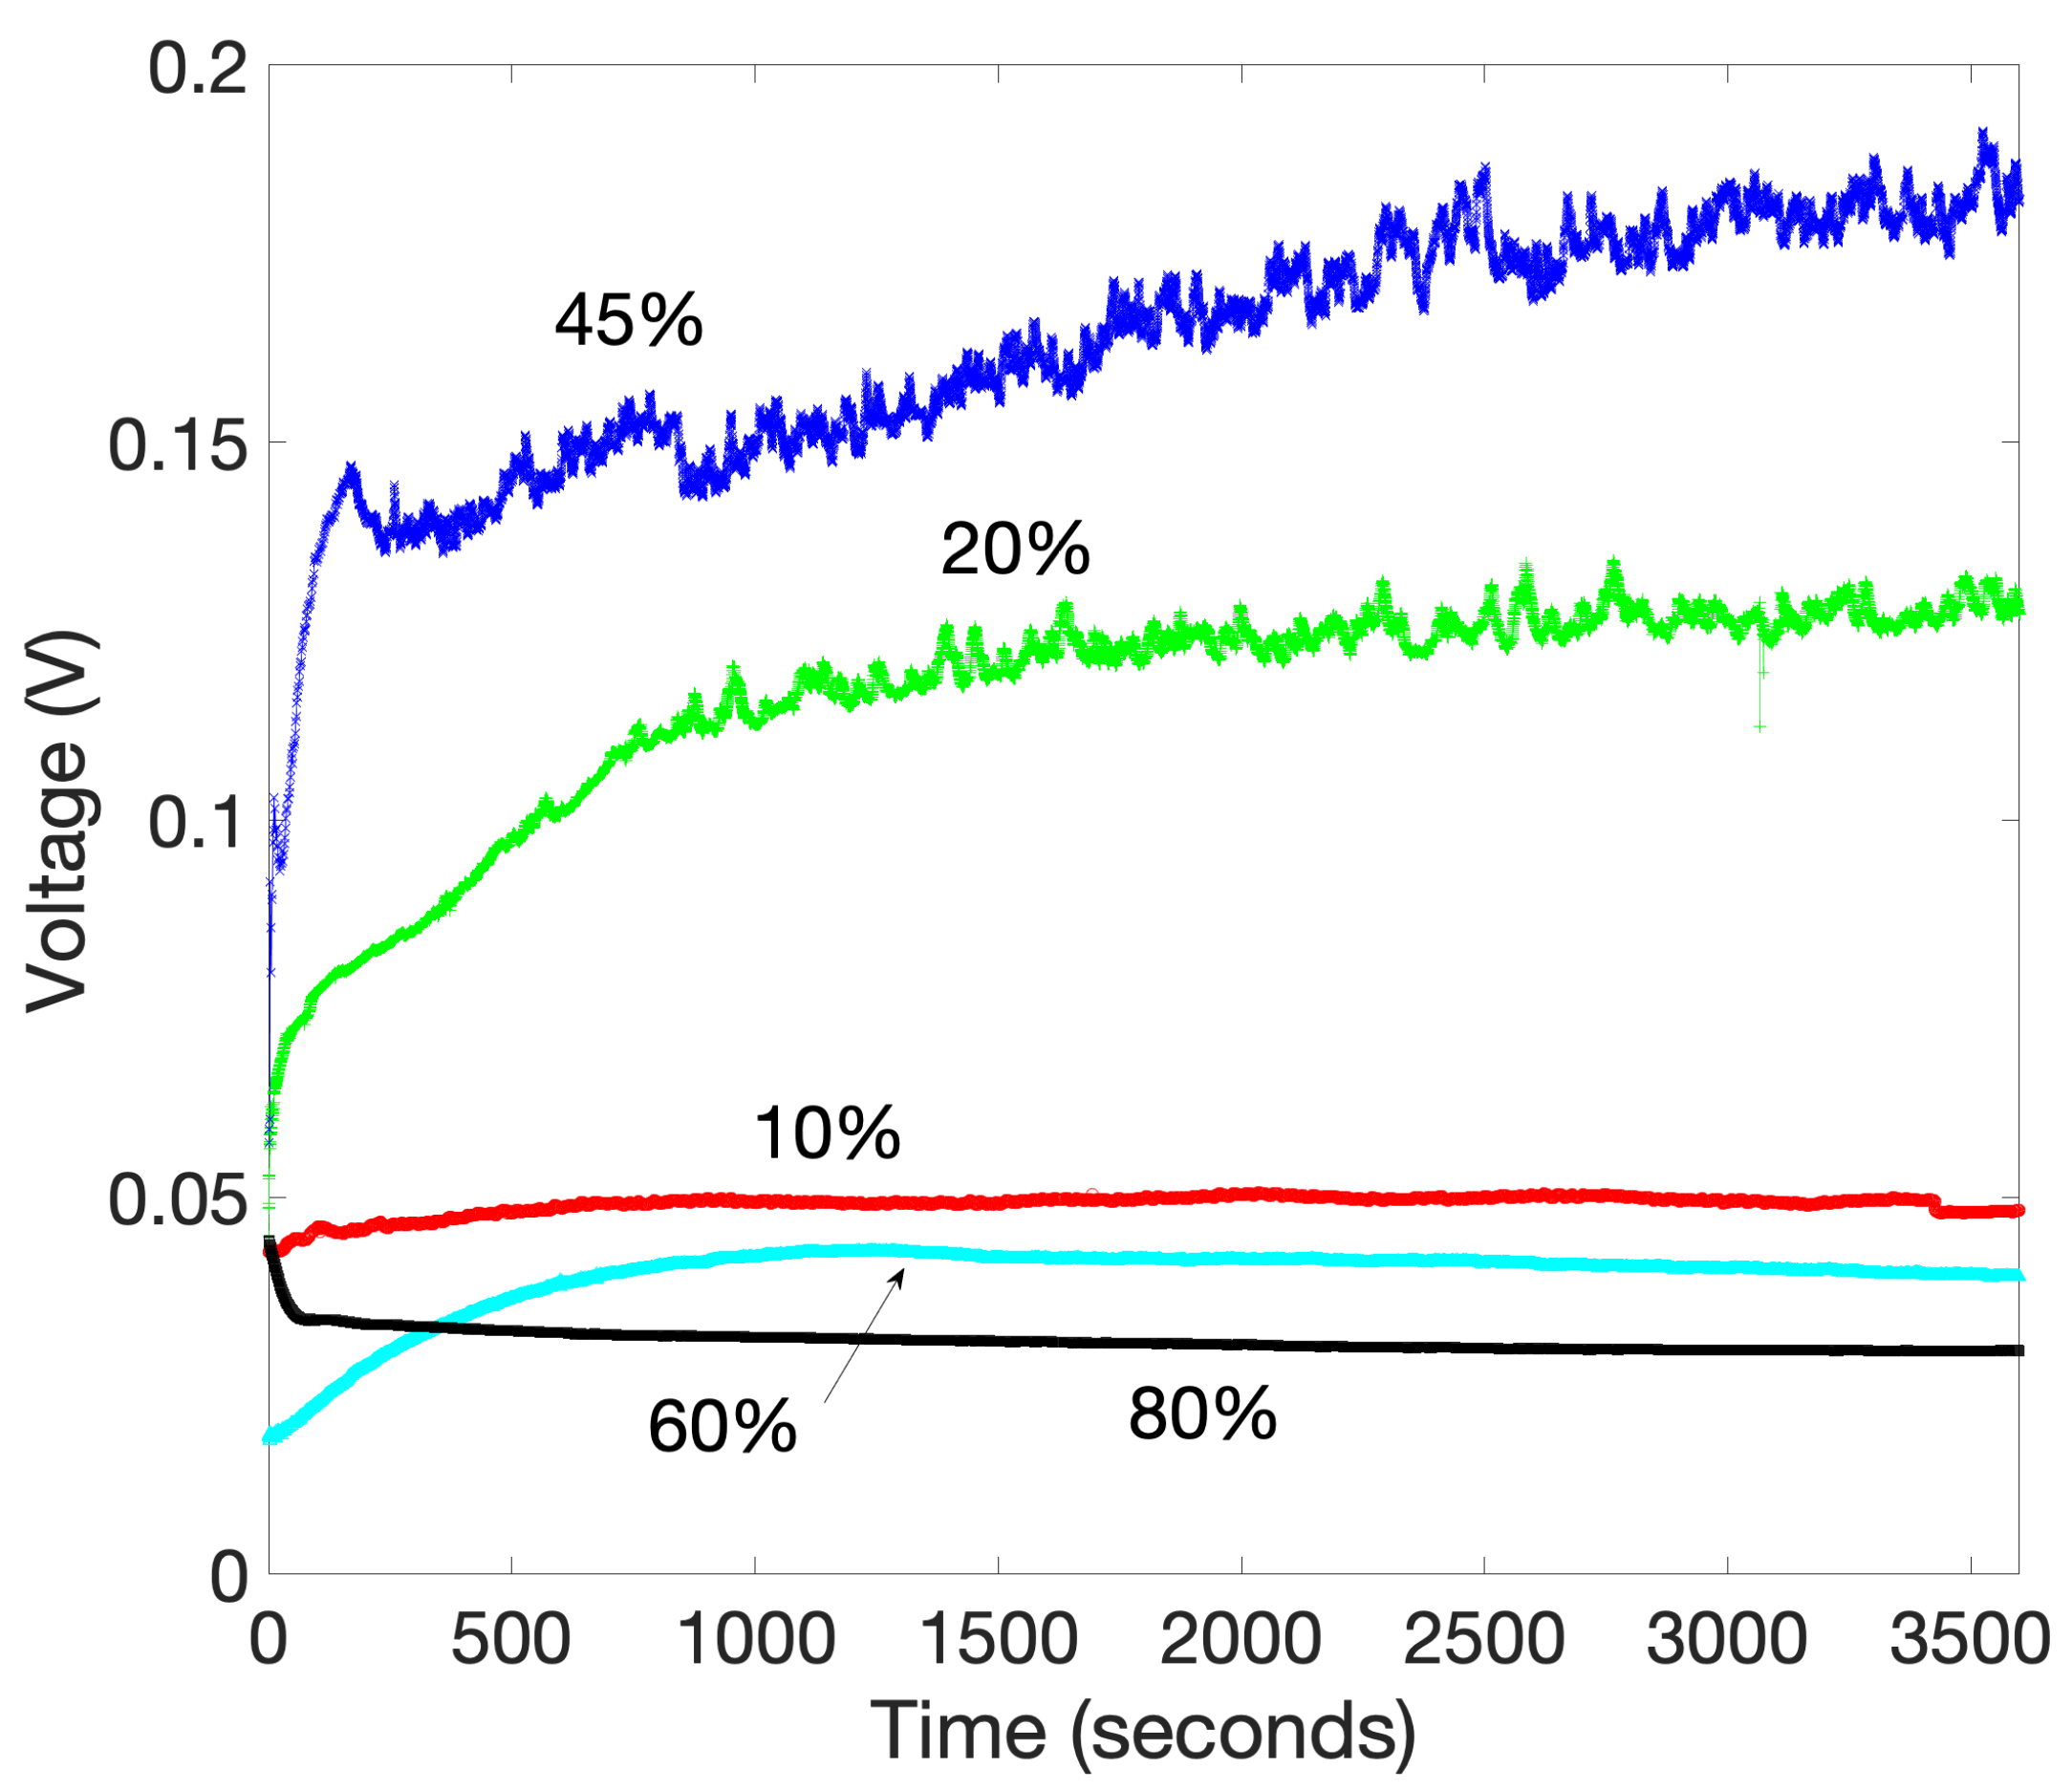
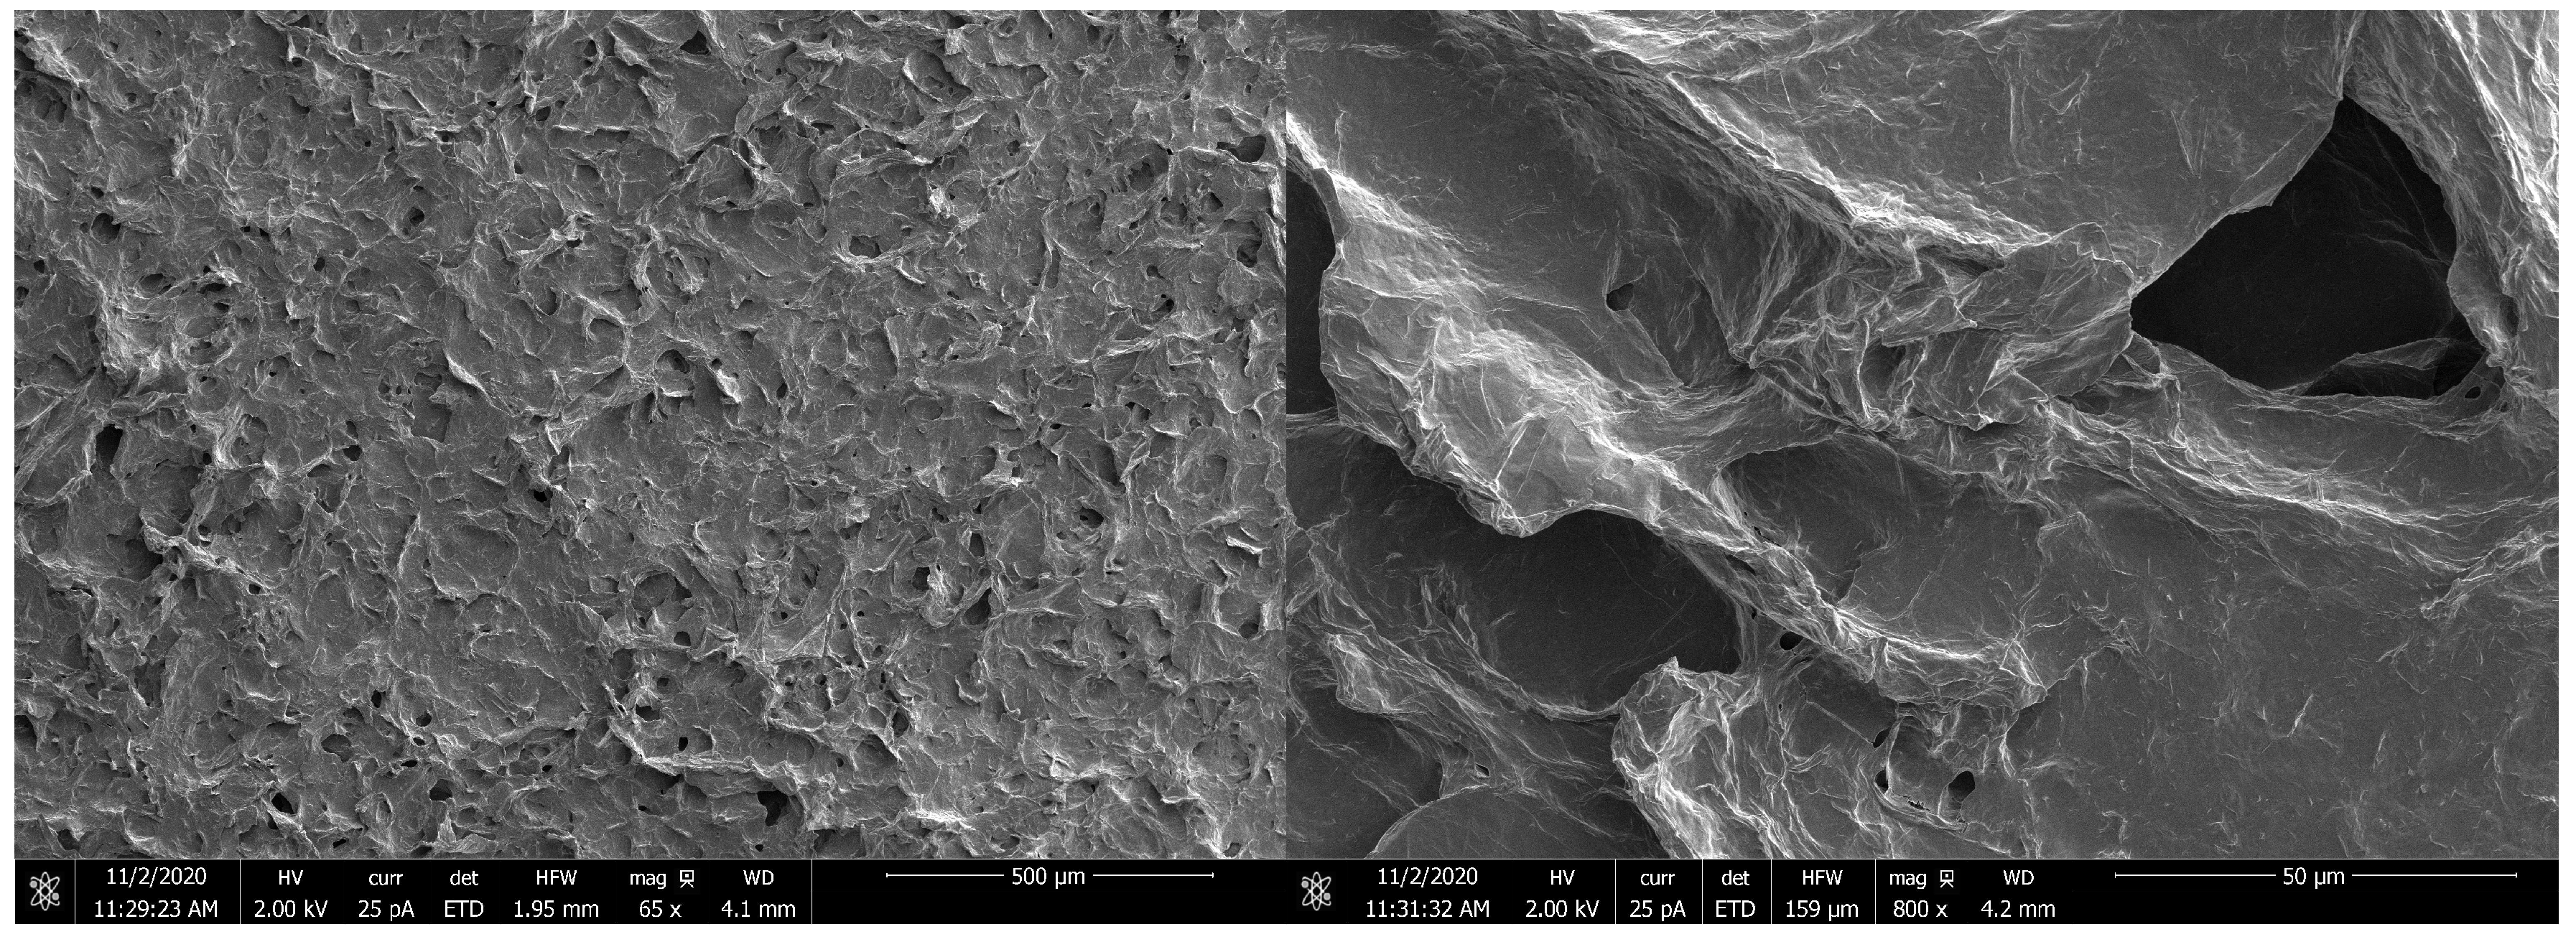
Silica is an abundant material, commonly used as a desiccant due to its strong affinity to water. We used mesoporous silica particles (SBA-15). The particle size was 1–4 μ m and the pore diameter was 6–11 nm . The BET surface area provided by vendors is about 550 m 2 / g . Here, we used five weight percentages of silica particles in a PVDF film, i.e., 10, 20, 45, 60, and 80 wt.%. The thickness of every film was around 100 μm. The results are shown in Figure 5. It is seen that the device with 45 wt.% silica generated the highest steady-state voltage, i.e., approximately 180 mV, whereas the devices with 10 and 80 wt.% silica generated much lower voltages. As silica is a good insulator, the internal resistance R w was determined by the conductivity of the deionized water used, which was the same for all devices. The observed performance can be explained as follows. As silica has a high affinity to water and a high water absorptive capacity, a device with a higher content of silica would absorb more water. Consider the device with 80 wt.% silica. The water content in the capillary region of the working area can be dramatically higher than for the other two devices with lower silica content. Such water content can be so high that it creates an in-situ reservoir underneath the surface of the capillary region. The reservoir provides a sustainable supply of water for evaporation but significantly reduces the water flow, resulting in a low streaming current, and thus a low steady-state open-circuit voltage. If the content of silica is low, i.e., 10 wt.%, the number of capillary channels will be small, leading to a low streaming current. It appeared that 45 wt.% silica provided the highest streaming potential in this study. The short circuit current was around 3.5 nA. A SEM image is provided in Figure 6. As can be seen, the number of microchannels available for capillary action is significantly higher than for the films with carbon tube particles.

2.2.3. Graphene Oxide

Graphene oxide is a single monomolecular layer of graphite with various oxygen-containing functional groups. Graphene oxide particles have recently been applied in various energy harvesting studies—moisture and evaporation energy harvesting ones [24,34], for example. Graphene oxide with a particle diameter of 0.5–3 μm and a thickness of 0.55–1.2 nm was considered. The carbon to oxygen ratio was roughly 2 to 1. The BET surface area of the graphene oxide was 250–400 m 2 / g . We considered five weight percentages of graphene oxide, i.e., 10, 20, 45, 60, and 80 wt.%. The resulting films were roughly 100 μm thick. The device’s performance is shown in Figure 7. The resistances of the five devices in operation were 30 M Ω , 1.8 M Ω , 300 k Ω , 300 k Ω , and 300 k Ω for the devices of 10, 20, 45, 60, and 80 wt.% graphene oxide, respectively. The resistance of pristine graphene oxide in dry conditions is indefinite. Once it is immersed in deionized water, the resistance is surprisingly low—in the order of M Ω —possibly due to its unique structure and the sufficient presence of functional groups. Once again, the device with 45 wt.% graphene oxide generated the highest open-circuit voltage, around 90 mV. The short circuit current was roughly 300 nA. The SEM image of a film with 45 wt.% graphene oxide is shown in Figure 8.

2.3. Performance of the Device under Different Ambient Conditions

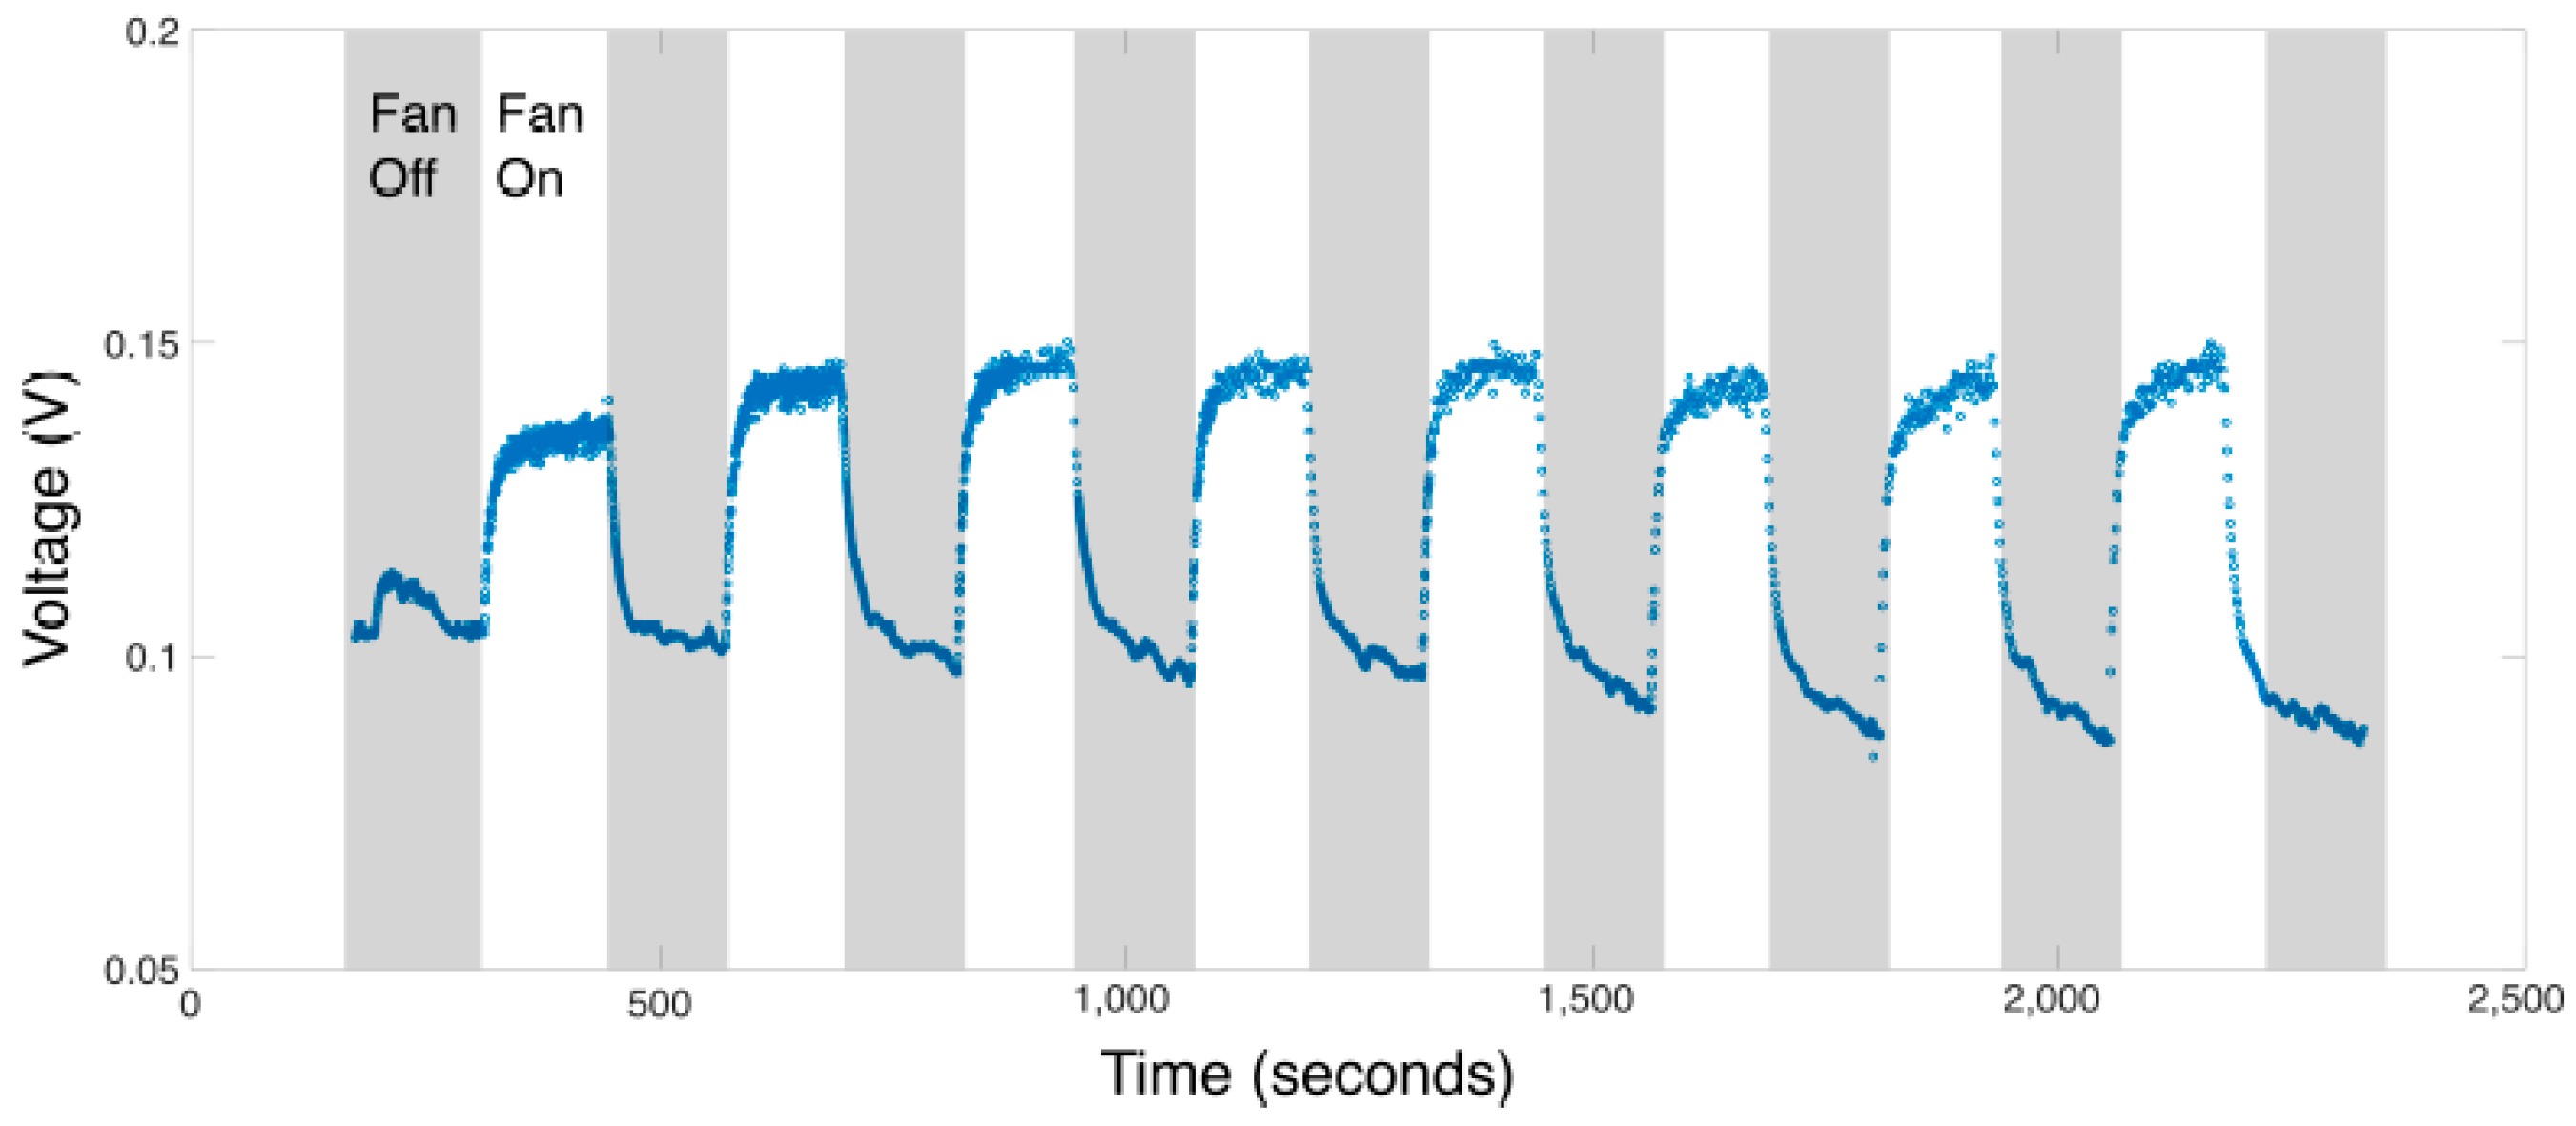
In terms of open-circuit voltage, the results show that the device with 45 wt.% silica outperformed the ones fabricated with a different material or silica with a different weight percentage. In the rest of this article, we focus on devices with 45 wt.% silica only. We first investigate the effect of ambient conditions on the performance. We consider two cases, i.e., (1) the evaporation process is intentionally suppressed, and (2) the evaporation process is deliberately enhanced. Figure 9 shows the results obtained when the device was covered and uncovered repetitively with a plastic wrap. A significant drop in the open-circuit voltage was observed when the device was covered, and it quickly reached the normal open-circuit voltage when the cover was removed. This clearly shows that when the evaporation is suppressed (by covering the device), the voltage drops accordingly. Figure 10 shows the results obtained when a fan is used to increase air circulation, thereby enhancing the evaporation. The fan was blowing on the device at a constant speed and a constant angle. It is seen that as soon as the fan was turned on, the open-circuit voltage quickly tose to a higher value, and returned to its original value shortly after the fan was turned off. The results in Figure 9 and Figure 10 show a strong correlation between the voltage generated and the evaporation rate. It is worth noting that the devices using carbon nanotubes and graphene oxide show the same trends. Therefore, one may conclude that the generated voltage was indeed due to evaporation.

2.4. Voltage Profile within the Working Area

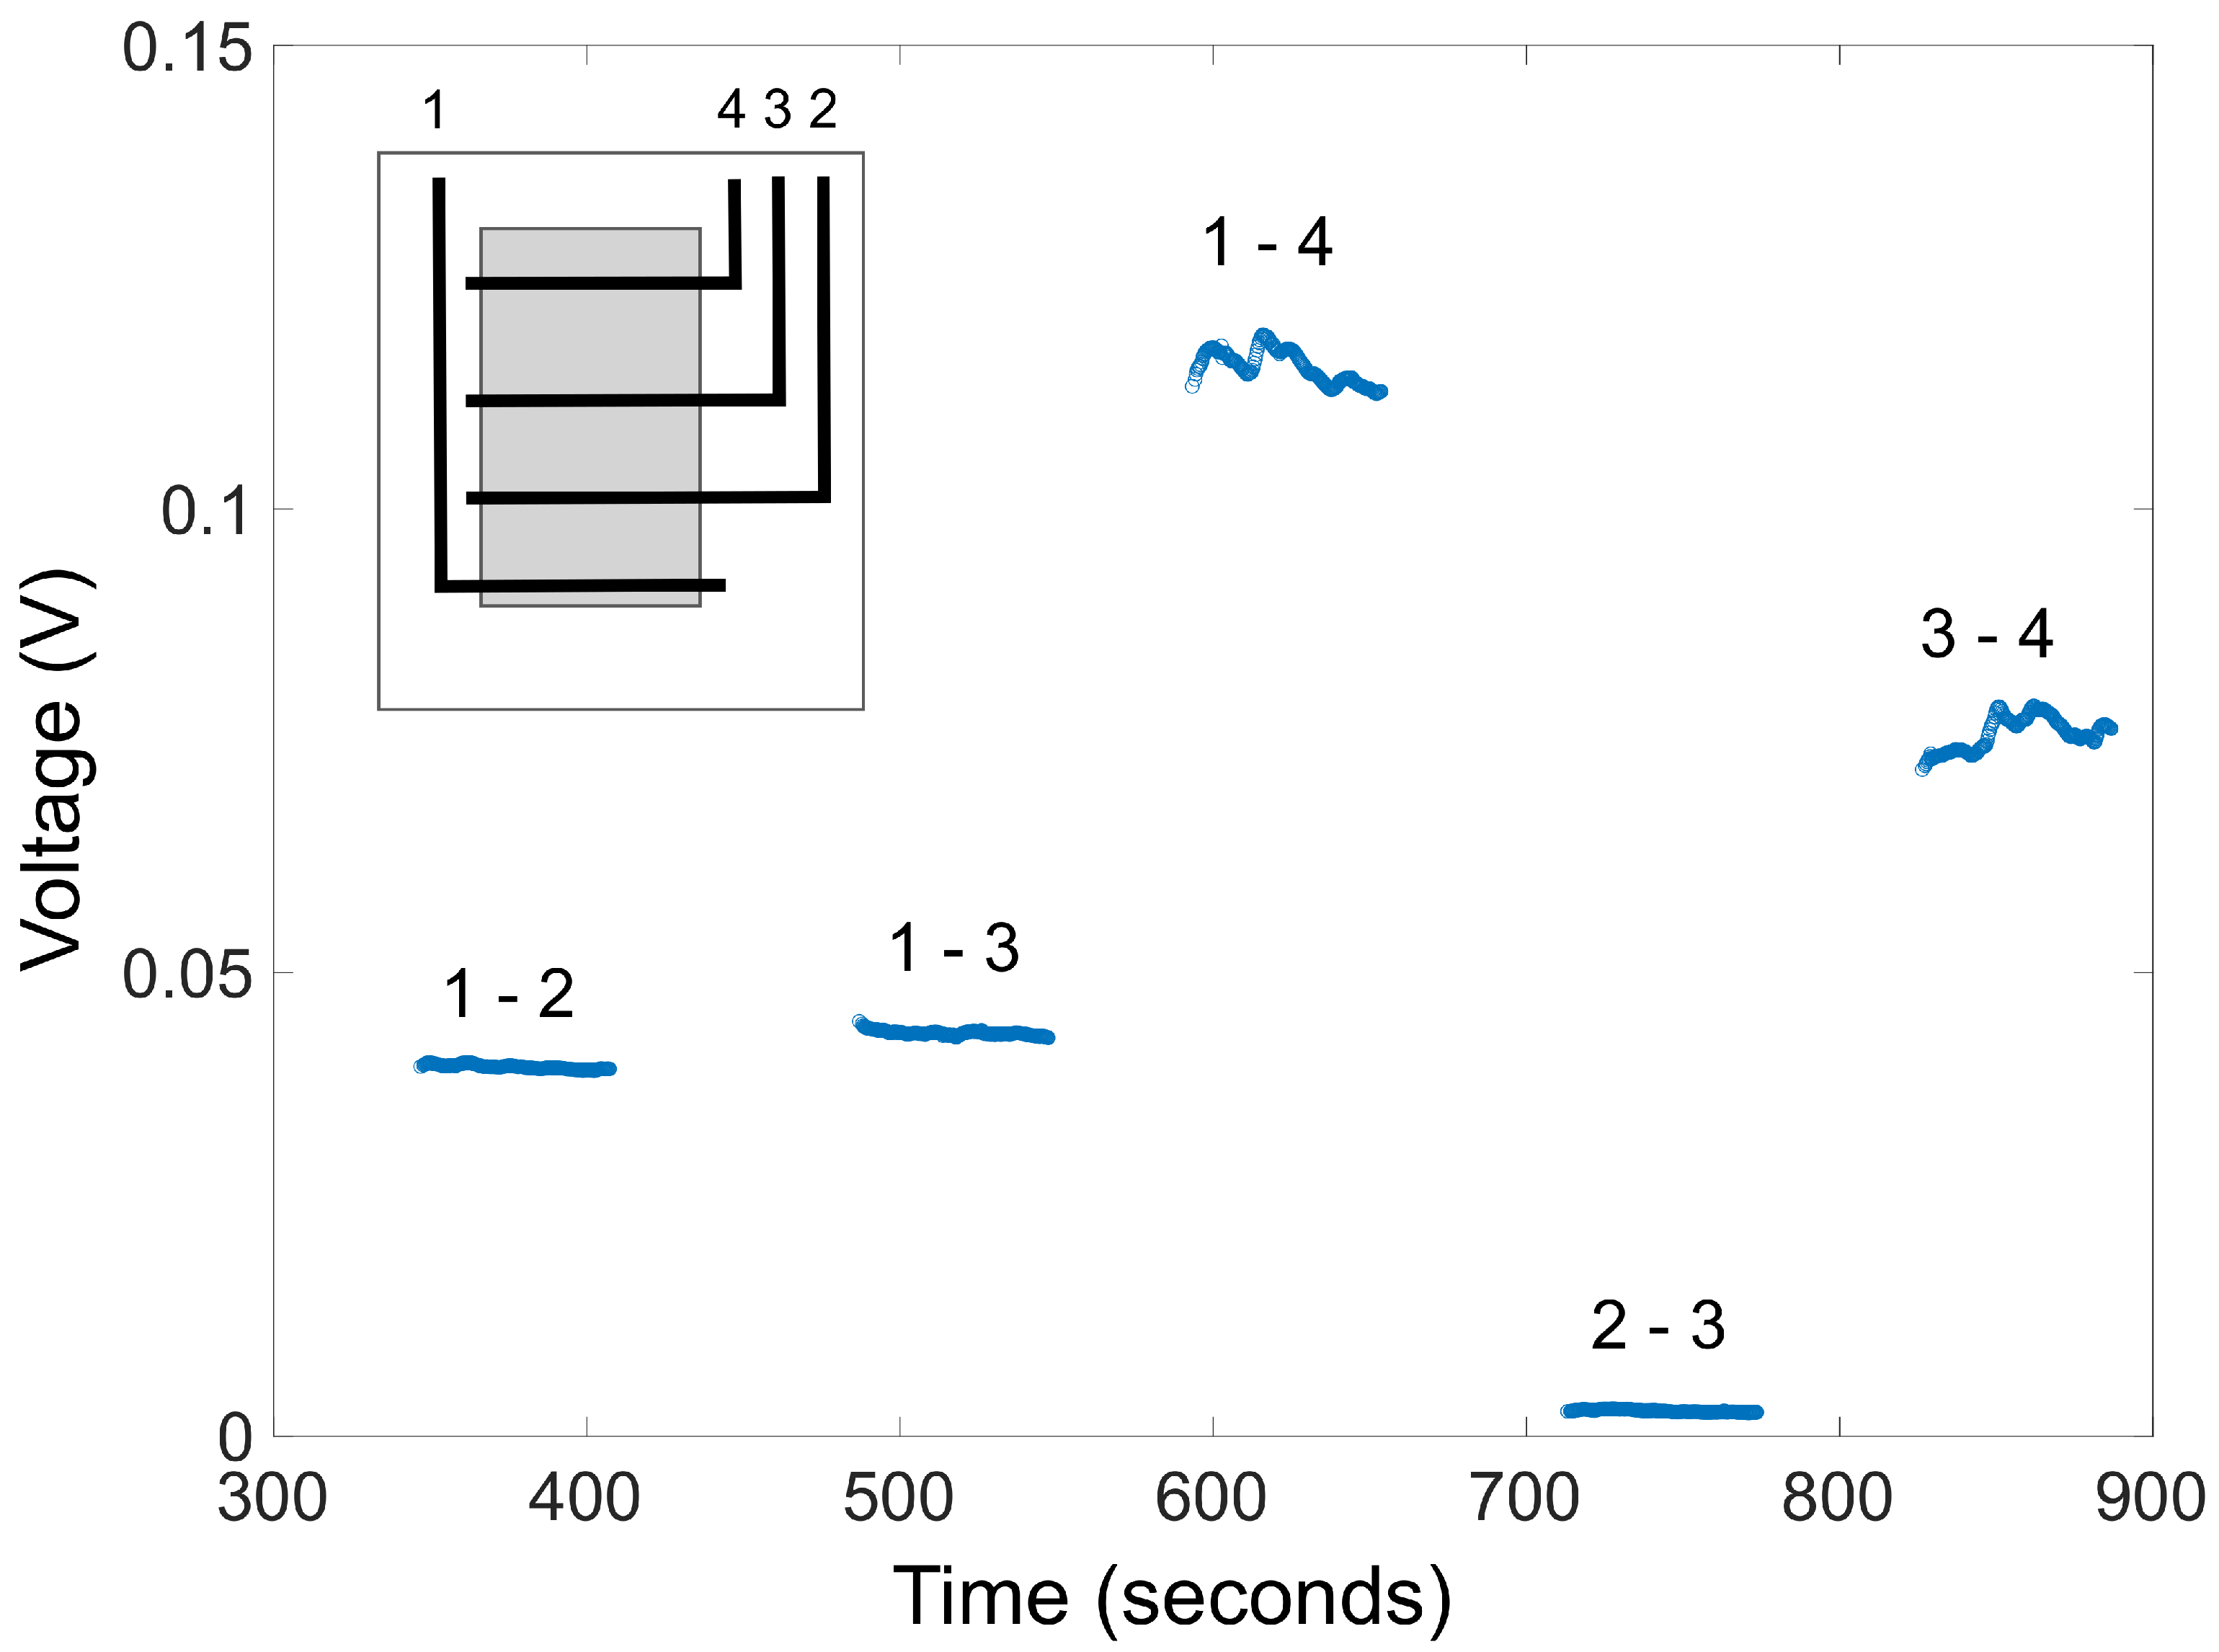
In order to demonstrate that the voltage generated is due to capillary flow in the porous working area, we investigate a device with multiple electrodes and measure the voltages between different electrodes. Figure 11 shows the results. As expected, the voltage distribution is consistent with the direction of the capillary flow, including for all selected pairs of electrodes. The voltage between the top and bottom electrodes (1 and 4) is the highest, which is also the same as the sum of the voltages between electrodes 1-2, 2-3, and 3-4. The voltage between electrodes 2 and 3 is noticeably lower than for other pairs of neighboring electrodes, which may reflect differential spreading of the electrodes during the ink deposition process.

2.5. Electrical Outputs

The electrical power output of the device with 45 wt.% graphene oxide and that with 45 wt.% silica is evaluated with pure resistive load. Figure 12 shows the relationships between the load resistance and the power delivered to the load for the two devices. As predicted by the model shown in Figure 2, there exists an optimal resistance that will extract the maximum power from the device. The optimal resistance, R L , o p t can be obtained as
R L , o p t = R w + R d .
For the optimal load resistance, the current across the electric load is I L = I R w 2 ( R w + R d ) . Moreover, the open circuit voltage can be expressed as V = I R w . The optimal power output can therefore be obtained as
P o p t = V 2 4 ( R w + R d ) ,
where V is the open circuit voltage.
In this case of graphene oxide, the optimal resistance is approximately 300 k-ohm, which is consistent with the measured resistance of R d + R w . The optimal power is about 4 nW. The optimal resistance of the device with 45 wt.% silica is approximately 30 M-ohm, which is consistent with the measured resistance 30 M-ohm of R w + R d . As the conductivity of the deionized water used is around 18 M Ω / cm, which would contribute a few mega ohms toward R w , such a high internal resistance of 30 M-ohm is believed to result from a high resistance of the dry region, R d . The optimal power of 45 wt.% silica is about 0.1 nW. The optimal resistance of the device with 5 wt.% carbon nanotube is approximately 20 M-ohm, which is consistent with the measured resistance 24 M-ohm of R w + R d . The optimal power of 5 wt.% carbon nanotube is about 0.03 nW. The excellent agreement between the theoretical prediction and the experimental data confirms the validity of the circuit model shown in Figure 2. Thus, the proposed device can be regarded as a current source connected to two resistors. Accordingly, a higher open circuit voltage does not necessarily imply a higher power output. For instance, devices containing 45 wt.% graphene oxide particles generate approximately 90 mV, half of the voltage obtained using 45 wt.% mesoporous silica. However, as the series resistance is much lower, devices using 45 wt.% graphene oxide particles produce the highest power output under the same evaporation conditions, and therefore have the highest energy harvesting efficiency.

3. Discussion

The results obtained suggest it is possible to incorporate particles into polymeric material to create polymer thin films for harvesting energy from natural evaporation. As the evaporation-induced streaming current is the underlying mechanism for electricity generation, a high flux of the capillary flow in the microchannels is desired. This implies more particles would be beneficial because a higher level of porosity can be achieved in the resulting polymer film. It is noted, however, that more particles may cause other issues that will limit the electrical output, especially the open-circuit voltage. When conducting materials are used, a high percentage of such particles will make the film conducting, and thus, create a short circuit, resulting in a very low output voltage. For example, when carbon tubes are used, the weight percent needs to be below 10%; any amount higher than that will dramatically reduce the sheet resistance of the film. This is consistent with the results reported in the literature [28]. Excessively more particles may dramatically increase the level of water content in the capillary region. Evaporation from such a reservoir of water underneath the surface is much slower due to a number of required transport processes in a porous medium [33], and thus, the capillary pressure is low, leading to a low streaming potential. This is consistent with the results obtained with 80 wt.% graphene oxide and silica. As for the enormous water absorbing capability of silica, the drop of the open-circuit voltage is more significant. It is noted that devices with 45 wt.% silica and devices with 45 wt.% graphene oxide offer different advantages. As for the high internal resistance, devices with silica can sustain a higher voltage but with a lower current. Devices with graphene oxide, on the other hand, can generate a higher steady-state current with a much lower level of internal resistance. The high streaming current implies a high evaporation rate and a strong capillary flow.

4. Materials and Methods

Chemicals and reagents. Multi-wall carbon tubes (MWCNTs) with purity of 98 wt.%, 30–50 nm outside diameter, 5–12 nm inside diameter, and 10–20 μm average length, were purchased from Carbon Tubes Plus. Graphene oxides with 99 wt.% purity, 0.5–3 μm particle diameter, 0.55–1.2 nm (<3 layers) particle thickness, content of elements: 68% carbon and 31% oxygen, were purchased from structured and Amorphous Materials, Inc. Mesoporous silica (SBA-15) particles with 1–4 μm particle size and 6–11 nm pore diameter were purchased from ACS material. Graphene platelets with 25 μm particle size, 6–8 nm (<3 layers) particle thickness were purchased from Sigma-Aldrich. N-Methyl-2-pyrrolidone (NMP) organic compound and polyvinylidene fluoride (PVDF) powder were purchased from Sigma-Aldrich.
Synthesis of particle suspension. For the horizontal leads, Graphene platelets and PVDF were mixed together with a weight ratio of 10:1 in NMP solvent using a planetary mixer (AR100) for 30 min. For the silica and GO, ink for five different weight ratios of particles was synthesized: 10, 20, 45, 60, and 80 wt.%. The MWNT suspension has four weight ratios: 2, 5, 7, and 10 wt.%. After mixing, we visually inspected the inks to check for a uniform appearance and to ensure that no sediment was observed.
Fabrication of the devices. Two 5 mm wide electrodes were formed using conductive graphite tapes (vertical direction) and graphene platelets ink (horizontal). The distance between two horizontal leads was about 25 mm. Particle ink was then coated uniformly on the glass slides crossing two horizontal leads using the doctor blade method. The casting tape thickness is about 300 μm. The slides were then heated at 40 C for five hours to dry. Epoxy was used to fully cover any exposed leads to avoid contact with water upon immersion. The slides were then cured at 25 C overnight. Before use, the slides were immersed in a deionized water for 12 h. The film thickness was roughly 100 μm measured by calipers.
Electrical measurements. The voltage and current measurements were obtained by an electrometer (Keithley 6517B). The communications between a computer and the electrometer were established with a KUSB-488B cable. The air flow was generated by an electric fan.

5. Conclusions

We have demonstrated that particles incorporated into PVDF can result in a porous polymeric system which can be used to generate electricity through natural evaporation. Among the particles considered, silica showed better performance in terms of open-circuit voltage, possibly because of the high specific surface area and hydrophilicity. Due to the extremely high internal resistance, the power output of the devices is low, even though the streaming potential can reach over 200 mV. Graphene oxide can generate a remarkably higher level of current, but because of the low internal resistance, the open-circuit voltage is lower. In this study, all particles were used without any surface treatment. As surface modifications such as plasma treatment can significantly enhance the surface charge, it seems a logical next step to use plasma-treated silica particles for better device performance. The size of the capillary channels could be another important parameter, as it directly affects the electric double layer structure. Investigating the optimal particle size and the optimal thickness of the polymer film may lead to viable ways of improving the energy harvesting performance.

Author Contributions

Conceptualization, A.M.; methodology, A.M., J.Y., and W.U.; software, A.M.; formal analysis, A.M., J.Y., and W.U.; investigation, A.M., J.Y., and W.U.; resources, A.M., J.Y., and W.U.; data curation, A.M. and J.Y.; writing—original draft preparation, A.M.; writing—review and editing, J.Y. and W.U.; visualization, A.M. and J.Y.; supervision, J.Y. and W.U.; project administration, A.M., J.Y. and W.U.; funding acquisition, A.M. and W.U. All authors have read and agreed to the published version of the manuscript.

Funding

This research was funded by the Kay fellowship at Iolani School.

Data Availability Statement

The data presented in this study are available on request from the corresponding authors.

Acknowledgments

A. Ma thanks Chan at Iolani School for the advice and guidance. The authors thank Y. Zuo and X. Xu for assistance with experiments.

Conflicts of Interest

The authors declare no conflict of interest. The funders had no role in the design of the study; in the collection, analyses, or interpretation of data; in the writing of the manuscript, or in the decision to publish the results.

References

  1. Wild, M.; Folini, D.; Schär, C.; Loeb, N.; Dutton, E.G.; König-Langlo, G. The global energy balance from a surface perspective. Clim. Dyn. 2013, 40, 3107–3134. [Google Scholar] [CrossRef] [Green Version]
  2. Cavusoglu, A.H.; Chen, X.; Gentine, P.; Sahin, O. Potential for natural evaporation as a reliable renewable energy resource. Nat. Commun. 2017, 8, 1–9. [Google Scholar] [CrossRef] [PubMed]
  3. Worden, J.; Noone, D.; Bowman, K. Importance of rain evaporation and continental convection in the tropical water cycle. Nature 2007, 445, 528–532. [Google Scholar] [CrossRef] [PubMed]
  4. Laliberté, F.; Zika, J.; Mudryk, L.; Kushner, P.; Kjellsson, J.; Döös, K. Constrained work output of the moist atmospheric heat engine in a warming climate. Science 2015, 347, 540–543. [Google Scholar] [CrossRef] [PubMed]
  5. Beeby, S.P.; Tudor, M.J.; White, N.M. Energy harvesting vibration sources for microsystems applications. Meas. Sci. Technol. 2006, 17, R175. [Google Scholar] [CrossRef]
  6. Caliò, R.; Rongala, U.B.; Camboni, D.; Milazzo, M.; Stefanini, C.; De Petris, G.; Oddo, C.M. Piezoelectric energy harvesting solutions. Sensors 2014, 14, 4755–4790. [Google Scholar] [CrossRef] [PubMed] [Green Version]
  7. Wang, Z.L.; Chen, J.; Lin, L. Progress in triboelectric nanogenerators as a new energy technology and self-powered sensors. Energy Environ. Sci. 2015, 8, 2250–2282. [Google Scholar] [CrossRef]
  8. Yu, J.; Ma, E.; Ma, T. Exponential energy harvesting through repetitive reconfigurations of a system of capacitors. Commun. Phys. 2018, 1, 1–10. [Google Scholar] [CrossRef]
  9. Xu, W.; Zheng, H.; Liu, Y.; Zhou, X.; Zhang, C.; Song, Y.; Deng, X.; Leung, M.; Yang, Z.; Xu, R.X.; et al. A droplet-based electricity generator with high instantaneous power density. Nature 2020, 578, 392–396. [Google Scholar] [CrossRef]
  10. Bell, L.E. Cooling, heating, generating power, and recovering waste heat with thermoelectric systems. Science 2008, 321, 1457–1461. [Google Scholar] [CrossRef] [Green Version]
  11. Sootsman, J.R.; Chung, D.Y.; Kanatzidis, M.G. New and old concepts in thermoelectric materials. Angew. Chem. Int. Ed. 2009, 48, 8616–8639. [Google Scholar]
  12. Post, J.W.; Veerman, J.; Hamelers, H.V.; Euverink, G.J.; Metz, S.J.; Nymeijer, K.; Buisman, C.J. Salinity-gradient power: Evaluation of pressure-retarded osmosis and reverse electrodialysis. J. Membr. Sci. 2007, 288, 218–230. [Google Scholar] [CrossRef] [Green Version]
  13. Achilli, A.; Cath, T.Y.; Childress, A.E. Power generation with pressure retarded osmosis: An experimental and theoretical investigation. J. Membr. Sci. 2009, 343, 42–52. [Google Scholar] [CrossRef]
  14. Rica, R.A.; Ziano, R.; Salerno, D.; Mantegazza, F.; Van Roij, R.; Brogioli, D. Capacitive mixing for harvesting the free energy of solutions at different concentrations. Entropy 2013, 15, 1388–1407. [Google Scholar] [CrossRef] [Green Version]
  15. Grätzel, M. Photoelectrochemical cells. In Materials For Sustainable Energy: A Collection of Peer-Reviewed Research and Review Articles from Nature Publishing Group; World Scientific: Singapore, 2011; pp. 26–32. [Google Scholar]
  16. Swarnkar, A.; Marshall, A.R.; Sanehira, E.M.; Chernomordik, B.D.; Moore, D.T.; Christians, J.A.; Chakrabarti, T.; Luther, J.M. Quantum dot–induced phase stabilization of α-CsPbI3 perovskite for high-efficiency photovoltaics. Science 2016, 354, 92–95. [Google Scholar] [CrossRef] [PubMed] [Green Version]
  17. Ma, M.; Guo, L.; Anderson, D.G.; Langer, R. Bio-inspired polymer composite actuator and generator driven by water gradients. Science 2013, 339, 186–189. [Google Scholar] [CrossRef] [PubMed] [Green Version]
  18. Chen, X.; Mahadevan, L.; Driks, A.; Sahin, O. Bacillus spores as building blocks for stimuli-responsive materials and nanogenerators. Nat. Nanotechnol. 2014, 9, 137–141. [Google Scholar] [CrossRef] [Green Version]
  19. Zhang, L.; Liang, H.; Jacob, J.; Naumov, P. Photogated humidity-driven motility. Nat. Commun. 2015, 6, 1–12. [Google Scholar]
  20. Chen, X.; Goodnight, D.; Gao, Z.; Cavusoglu, A.H.; Sabharwal, N.; DeLay, M.; Driks, A.; Sahin, O. Scaling up nanoscale water-driven energy conversion into evaporation-driven engines and generators. Nat. Commun. 2015, 6, 1–7. [Google Scholar]
  21. Arazoe, H.; Miyajima, D.; Akaike, K.; Araoka, F.; Sato, E.; Hikima, T.; Kawamoto, M.; Aida, T. An autonomous actuator driven by fluctuations in ambient humidity. Nat. Mater. 2016, 15, 1084–1089. [Google Scholar] [CrossRef]
  22. Yin, J.; Li, X.; Yu, J.; Zhang, Z.; Zhou, J.; Guo, W. Generating electricity by moving a droplet of ionic liquid along graphene. Nat. Nanotechnol. 2014, 9, 378–383. [Google Scholar] [CrossRef] [PubMed]
  23. Xue, G.; Xu, Y.; Ding, T.; Li, J.; Yin, J.; Fei, W.; Cao, Y.; Yu, J.; Yuan, L.; Gong, L.; et al. Water-evaporation-induced electricity with nanostructured carbon materials. Nat. Nanotechnol. 2017, 12, 317–321. [Google Scholar] [CrossRef] [PubMed]
  24. Ding, T.; Liu, K.; Li, J.; Xue, G.; Chen, Q.; Huang, L.; Hu, B.; Zhou, J. All-printed porous carbon film for electricity generation from evaporation-driven water flow. Adv. Funct. Mater. 2017, 27, 1700551. [Google Scholar] [CrossRef]
  25. Ma, Q.; He, Q.; Yin, P.; Cheng, H.; Cui, X.; Yun, Q.; Zhang, H. Rational Design of MOF-Based Hybrid Nanomaterials for Directly Harvesting Electric Energy from Water Evaporation. Adv. Mater. 2020, 32, 2003720. [Google Scholar] [CrossRef] [PubMed]
  26. Zhang, G.; Duan, Z.; Qi, X.; Xu, Y.; Li, L.; Ma, W.; Zhang, H.; Liu, C.; Yao, W. Harvesting environment energy from water-evaporation over free-standing graphene oxide sponges. Carbon 2019, 148, 1–8. [Google Scholar] [CrossRef]
  27. He, L.; Tjong, S.C. A graphene oxide–polyvinylidene fluoride mixture as a precursor for fabricating thermally reduced graphene oxide–polyvinylidene fluoride composites. RSC Adv. 2013, 3, 22981–22987. [Google Scholar] [CrossRef]
  28. Fontananova, E.; Bahattab, M.A.; Aljlil, S.A.; Alowairdy, M.; Rinaldi, G.; Vuono, D.; Nagy, J.B.; Drioli, E.; Di Profio, G. From hydrophobic to hydrophilic polyvinylidenefluoride (PVDF) membranes by gaining new insight into material’s properties. RSC Adv. 2015, 5, 56219–56231. [Google Scholar] [CrossRef]
  29. Kang, G.D.; Cao, Y.M. Application and modification of poly(vinylidene fluoride) (PVDF) membranes—A review. J. Membr. Sci. 2014, 463, 145–165. [Google Scholar] [CrossRef]
  30. Boo, C.; Lee, J.; Elimelech, M. Omniphobic Polyvinylidene Fluoride (PVDF) Membrane for Desalination of Shale Gas Produced Water by Membrane Distillation. Environ. Sci. Technol. 2016, 50, 12275–12282. [Google Scholar] [CrossRef] [PubMed]
  31. Russel, W.B.; Saville, D.A.; Schowalter, W.R. Colloidal Dispersions; Cambridge Monographs on Mechanics; Cambridge University Press: Cambridge, UK, 1989. [Google Scholar] [CrossRef]
  32. Probstein, R.F. Physicochemical Hydrodynamics; Wiley: New York, NY, USA, 1994. [Google Scholar]
  33. Mosthaf, K.; Helmig, R.; Or, D. Modeling and analysis of evaporation processes from porous media on the REV scale. Water Resour. Res. 2014, 50, 1059–1079. [Google Scholar] [CrossRef]
  34. Kang, A.K.; Zandi, M.H.; Gorji, N.E. Fabrication and Degradation Analysis of Perovskite Solar Cells with Graphene Reduced Oxide as Hole Transporting Layer. J. Electron. Mater. 2020, 49, 2289–2295. [Google Scholar] [CrossRef]
Figure 1. 3D rendered images of the prototype device. (a) Device. (b) Device in operation. Evaporation occurs over the whole surface area of the working material above the water line.
Energies 14 00585 g001
Figure 2. Equivalent circuit model of the device.
Energies 14 00585 g002
Figure 3. Open-circuit voltage of the PVDF film with carbon nanotube loading (wt.%).
Energies 14 00585 g003
Figure 4. (a) SEM image of a PVDF film with 5 wt.% carbon nanotubes. Portions of some carbon nanotubes are shown to be on the surface of the film. (b,c) TEM images of carbon nanotubes in a PVDF film.
Energies 14 00585 g004
Figure 5. Open-circuit voltage of a PVDF film with silica particle loading (wt.%).
Energies 14 00585 g005
Figure 6. SEM images of a PVDF film with 45 wt.% silica particles.
Energies 14 00585 g006
Figure 7. Open-circuit voltage of a PVDF film with graphene oxide particle loading (wt.%).
Energies 14 00585 g007
Figure 8. SEM images of a PVDF film with 45 wt.% graphene oxide particles.
Energies 14 00585 g008
Figure 9. Effect of suppressing evaporation by covering the device.
Energies 14 00585 g009
Figure 10. Effect of enhancing evaporation by increasing air circulation.
Energies 14 00585 g010
Figure 11. Voltage variation along the capillary path. Inset shows the schematic diagram of the device.
Energies 14 00585 g011
Figure 12. Power output with different load resistances. (a). PVDF film with 45 wt.% graphene oxide, (b). PVDF film with 45 wt.% silica. (c). PVDF film with 5 wt.% carbon nanotube. Markers represent experimental data; line represents theoretical results.
Energies 14 00585 g012
Publisher’s Note: MDPI stays neutral with regard to jurisdictional claims in published maps and institutional affiliations.