Article

SiO2 Promoted CaO Diffusion to C Phase at 1500 and 1700 °C

1
Beijing Advanced Innovation Center for Soft Matter Science and Engineering, Beijing University of Chemical Technology, Beijing 100029, China
2
State Key Laboratory of Chemical Resource Engineering, Beijing University of Chemical Technology, Beijing 100029, China
*
Authors to whom correspondence should be addressed.
Energies 2021, 14(3), 587; https://doi.org/10.3390/en14030587
Submission received: 20 December 2020 / Revised: 17 January 2021 / Accepted: 21 January 2021 / Published: 24 January 2021

Abstract

:
To better understand the mass transfer behaviors in CaC2 production from CaO and coke, this paper studies the diffusion behaviors of CaO and graphite, with or without ash, at 1500 and 1700 °C. CaO and graphite are pressed into tablets and heated alone or in close contact. Physical and chemical changes in these tablets are analyzed by XRD and SEM+EDX. In some experiments, thin Mo wires are placed between the closely contacted CaO and graphite tablets to identify the diffusion direction. It is found that the diffusion between CaO and low-ash graphite is very limited. SiO2 in a high-ash graphite diffuses into CaO tablet and reacts with CaO to form Ca2SiO4, which then diffuses into the graphite tablet easily and leads to CaC2 formation at 1700 °C.

1. Introduction

Calcium carbide (CaC2), produced from the reaction of coke (C) and calcium oxide (CaO) shown by Reaction (1) [1], is a major coal-derived commodity chemical used mainly in the production of polyvinyl chloride [2], polyvinyl acetate and 1,4-butanediol. China is the largest producer of CaC2, with an annual production of more than 29 million tons in 2018.
3C + CaO = CaC2 + CO
The current CaC2 production requires a temperature of greater than 2000 °C, which is realized by electric arc heating. This process is highly energy intensive. with an electricity consumption of about 3250 kWh/t for a CaC2 product of 80% purity. [3] This energy requirement corresponds to 29.3 × 10⁶ kJ/t if the electricity is produced from coal-fired power generation with a thermal efficiency of 40%. To reduce the large energy loss in the power generation, auto-thermal CaC2 production was studied, [4,5] which employs in-situ oxidation of a portion of coke to generate a high temperature environment and to provide sufficient energy for the endothermic reaction (Reaction (1)). Since the two reactants are solid while the products CaC2 and CO are in the molten and gaseous states, respectively, under the production conditions, the overall reaction system is very complex in mass and heat transfer. [6,7] Understand these transport phenomena would help to develop more efficient CaC2 production processes, including the auto-thermal one, which can be operated at lower temperatures to yield solid products with optimized particle size distribution and ash contents of the reactants.
The diffusion behaviors of C and CaO at high temperatures have been studied. Briefly, El−Naas et al. investigated CaC2 production in a fluidized bed plasmas reactor and assumed solid–solid diffusion between C and CaO. [8] Kameyama reported the formation of a solid intermediate CaO·C via mutual diffusion of C and CaO at temperatures higher than 1000 °C, the formation of Ca and CO from the intermediate at 1400 °C and higher, and consequently, the formation of CaC2. [9] Müller reported the diffusion of C ions into CaO at temperatures of 1000–1500 °C to form CaC3O, which transformed into CaC2 and CO at temperatures higher than 1500 °C. [10] Li et al. reported the formation of CaC2 at temperatures higher than 1540 °C and attributed the reaction to diffusion of CaO into C, in the nano-crystal form at temperatures lower than 1700 °C, while in the CaC2-CaO eutectic form at temperatures higher than 1700 °C. [11] Ji et al. studied the reaction of high purity graphite and CaO and reported CaC2 formation through C diffusion to CaO [12]. Clearly, the diffusion behaviors reported for the CaC2 production are not consistent in the literature, and further studies are needed, especially those using different methods.
Kirkendall effect is a well-known method for studying solid-solid diffusion at high temperatures [13]. Typical experiments include one that uses a molybdenum (Mo) wire placed in between closely contacted Cu and Ni plates to mark its position shift at high temperatures and consequently to analyze the difference in diffusion rate of the two metals. Sun [14] and Mrowec [15] studied the role of diffusion in reactions of HCl-CaO and SO2-CaO, respectively, by placing a fine Pt film at the inter-surface of the solids. In light of the above experiments, this paper studies the diffusion behaviors of CaO and graphite at temperatures relevant to CaC2 production using two closely contacted graphite and CaO tablets, with or without fine molybdenum (Mo) wires placed in between. The changes at the interface of the two tablets are analyzed with XRD and SEM (+EDX). The role of SiO2 in graphite on the diffusion behavior is emphasized.

2. Materials and Methods

2.1. Preparation of Raw Materials

Two types of graphite were used. One contained little minerals (termed pure-C, from Qingdao Shengrui graphite Ltd., Laixi, China), while another contained 21.64 wt% minerals (termed ash-C, from Tianjin Fucheng Chemicals). The proximate and ultimate analyses of these graphite were carried out following the Chinese National Standard GB/T12-2008 and GB/T476-2008, respectively, and are shown in Table 1. The mineral composition of ash-C is shown in Table 2. Analytical-grade CaO powder was used. It was heat treated at 900 °C for 3 h in a flow of N2 (99.999 % pure) to convert possible Ca(OH)2 and CaCO3 into CaO, which yielded a CaO purity of 98.26%. Mo wires with a diameter of 0.12 mm were used as the marker.
The graphite and CaO powders of 0.5 g were pressed separately at a pressure of 20 MPa into tablets in a die with an inner diameter of 13 mm, which yielded tablets with a thickness of 1.78 mm for CaO and 1.90 mm for the graphite. For the Kirkendall experiments, 0.5 g graphite or CaO was first pressed in the die at a pressure of 10 MPa, after laying the Mo wires on the upper surface of the sample it was pressed again at 20 MPa to yield a tablet with the Mo wires on one side of the surface.

2.2. Apparatus

The high temperature experiments were conducted in a tube furnace under an argon atmosphere. The furnace is LTF18/-/300 from Lenton Ltd. with a corundum tube of 70 mm in diameter and 120 mm in length. A single sample tablet or a set of two tablets (one over another) was placed between two tungsten blocks that was placed in the isothermal zone of the furnace (40 mm in the center). The weight of the upper tungsten block was 170 g, which was used to ensure the close contact of the two tablets. The temperatures for the diffusion experiments were 1500 and 1700 °C. The former is lower, while the latter is higher than the initial formation temperature of calcium carbide reported (1540 °C [11]). The samples were analyzed with a scanning electron microscope (SEM, Hitachi S4700, Japan) equipped with energy dispersive (EDX) analyzers and with a powder X-ray diffraction (XRD, Bruker D8 Forcus, Germany). The XRD employs Cu K α1 radiation and was operated at 40 KV and 40 mA, and the sample was scanned over a 2θ range of 20° to 90° at a step size of 12 °min−1.

3. Results and Discussion

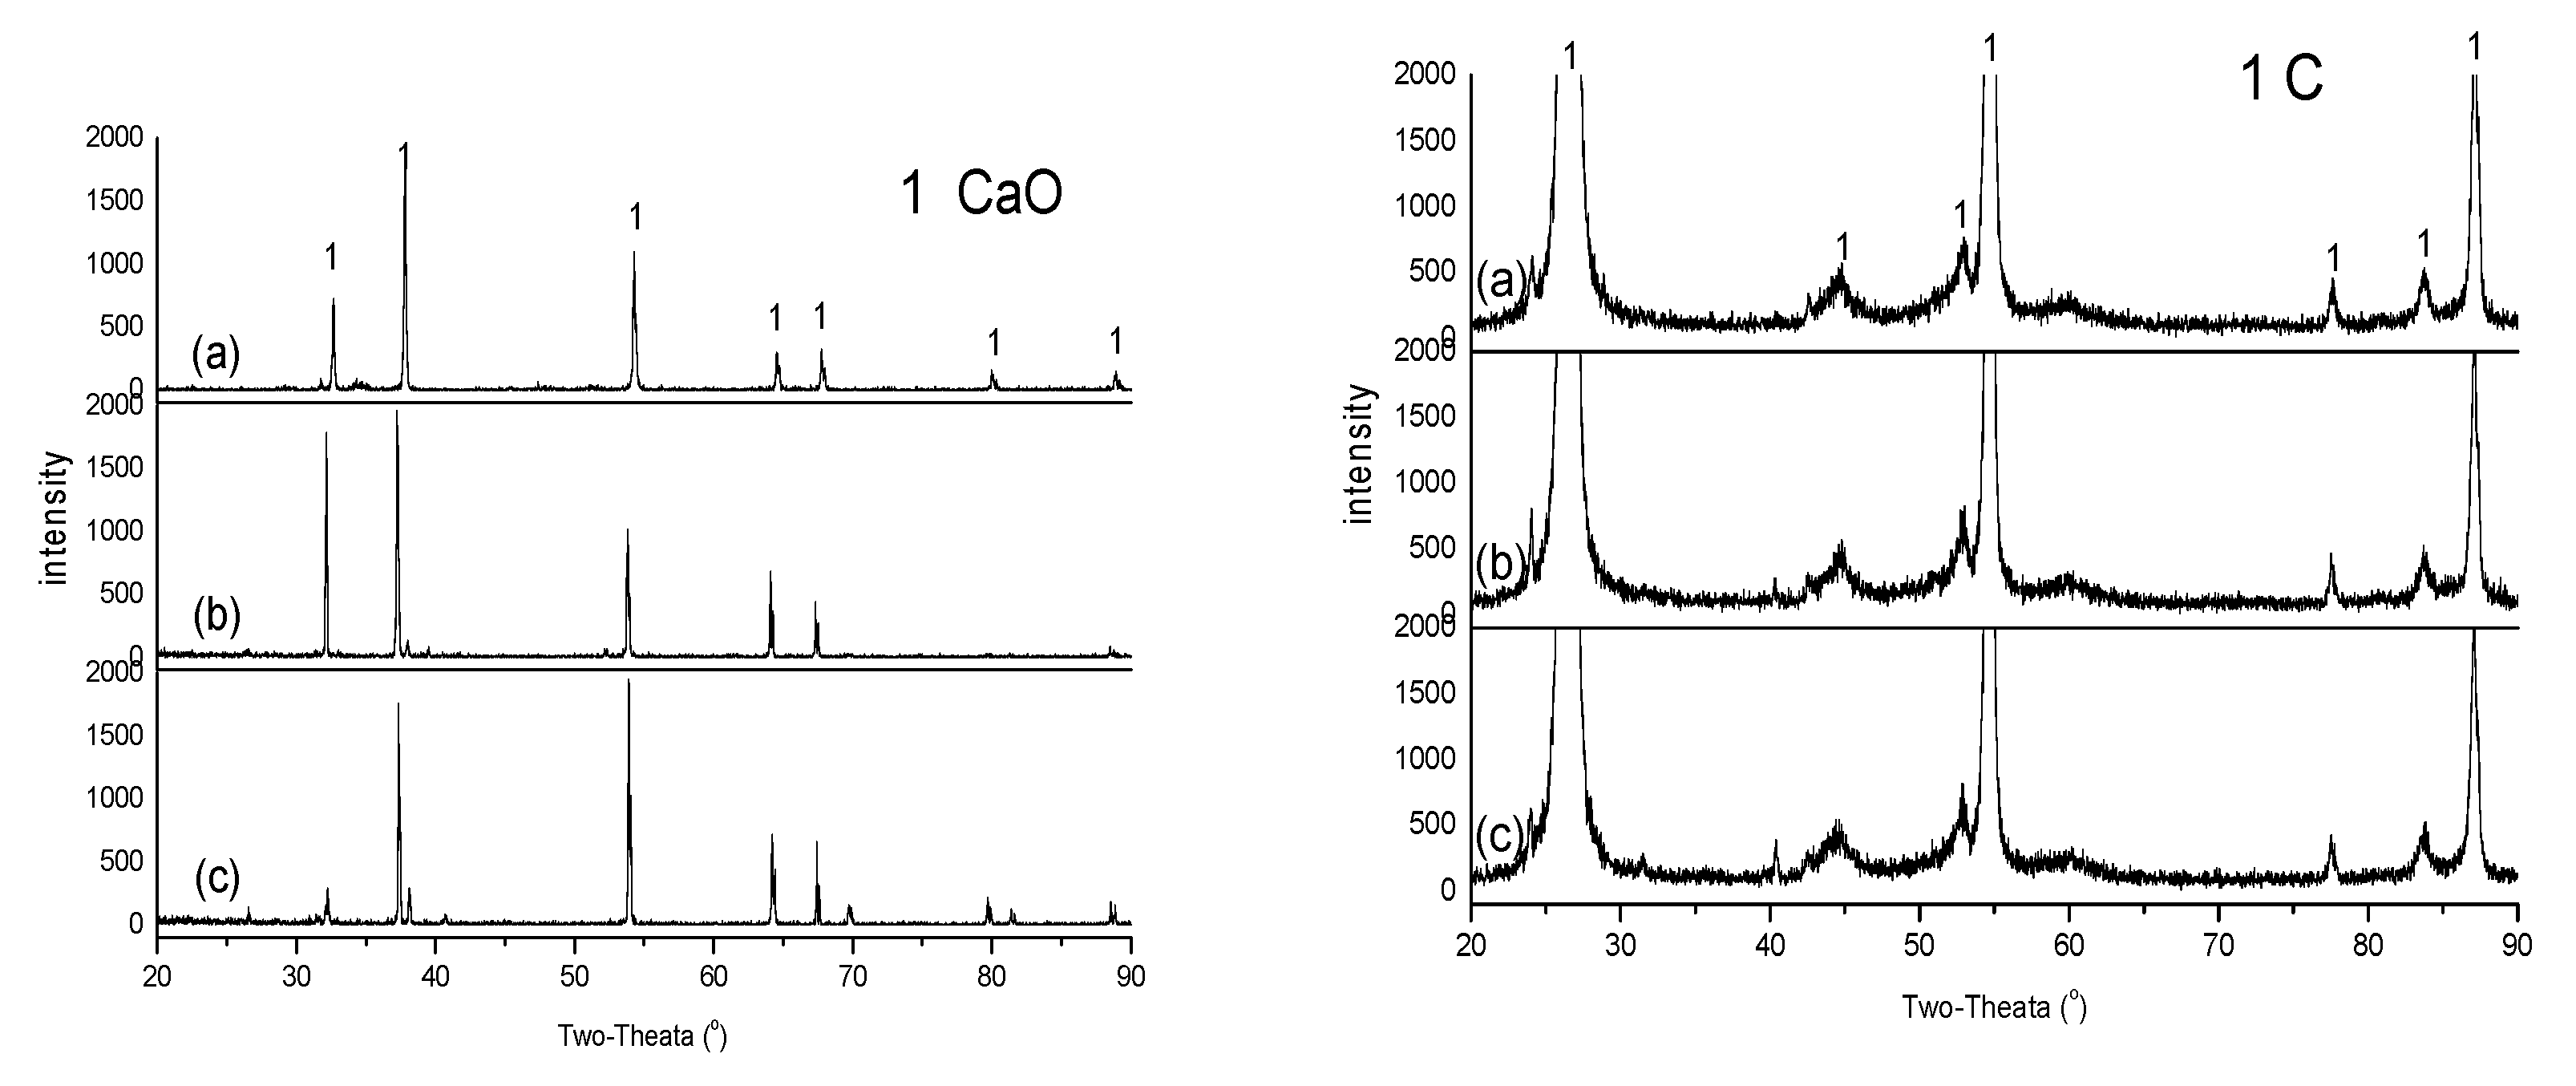
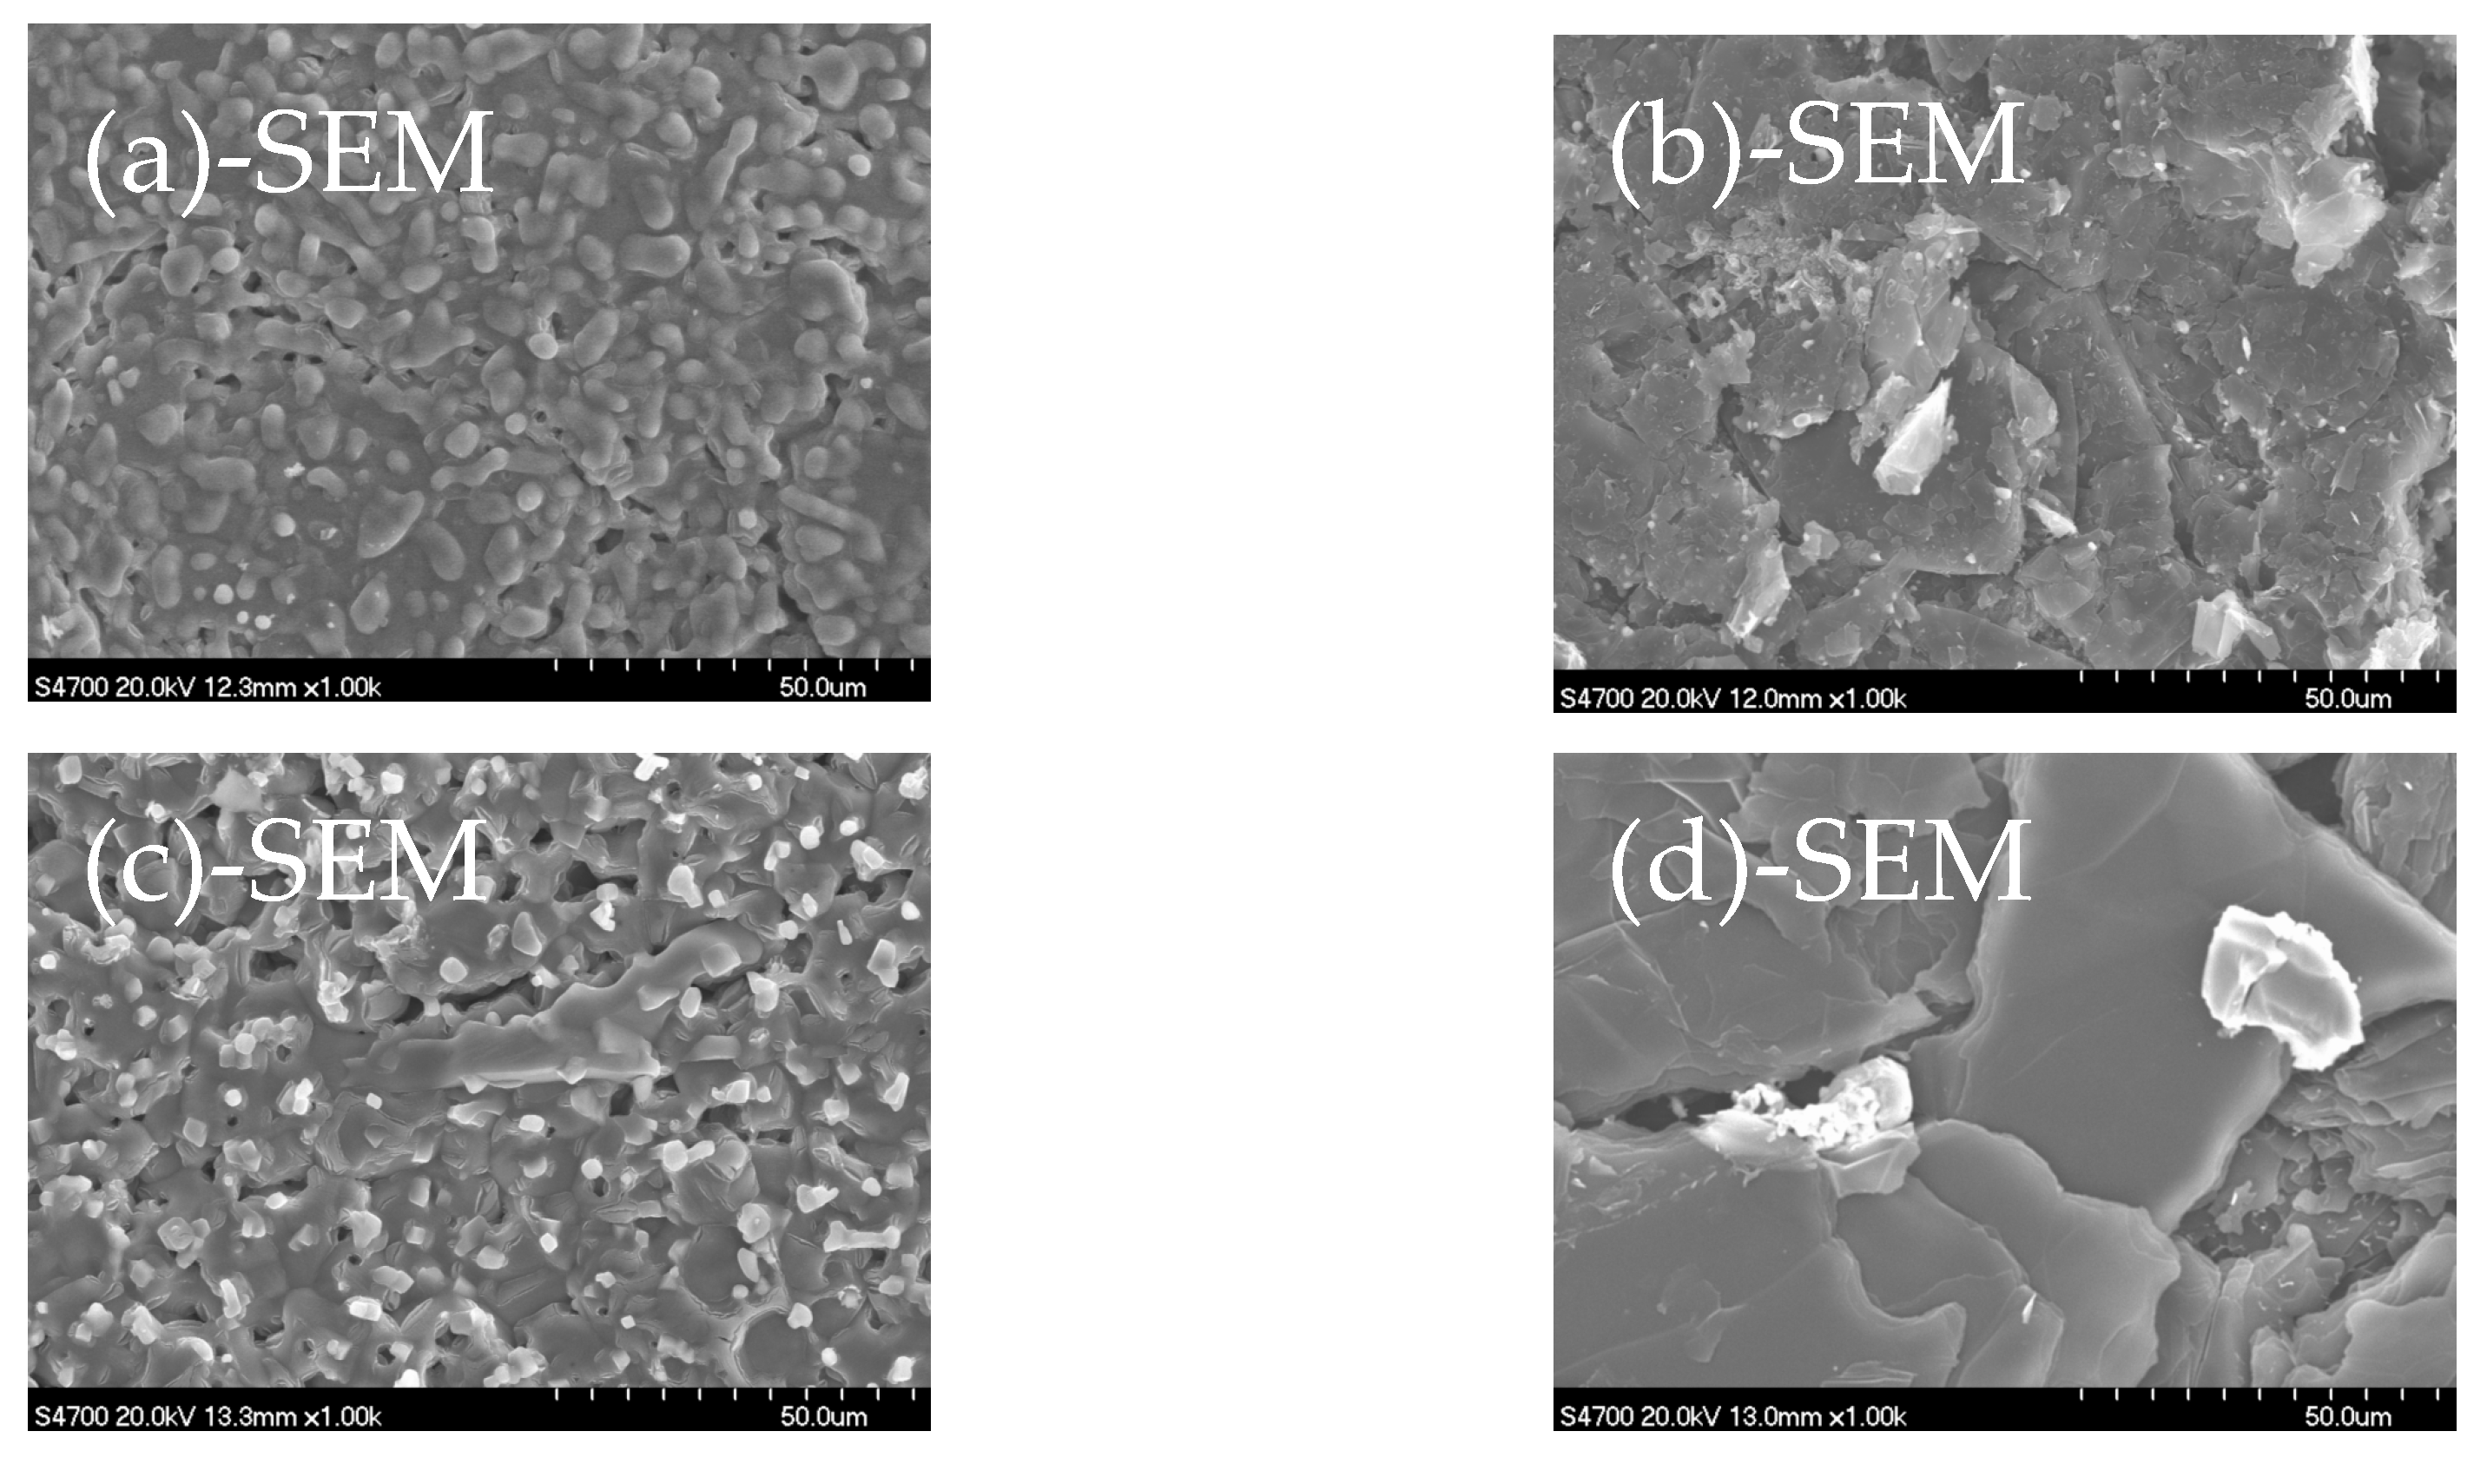
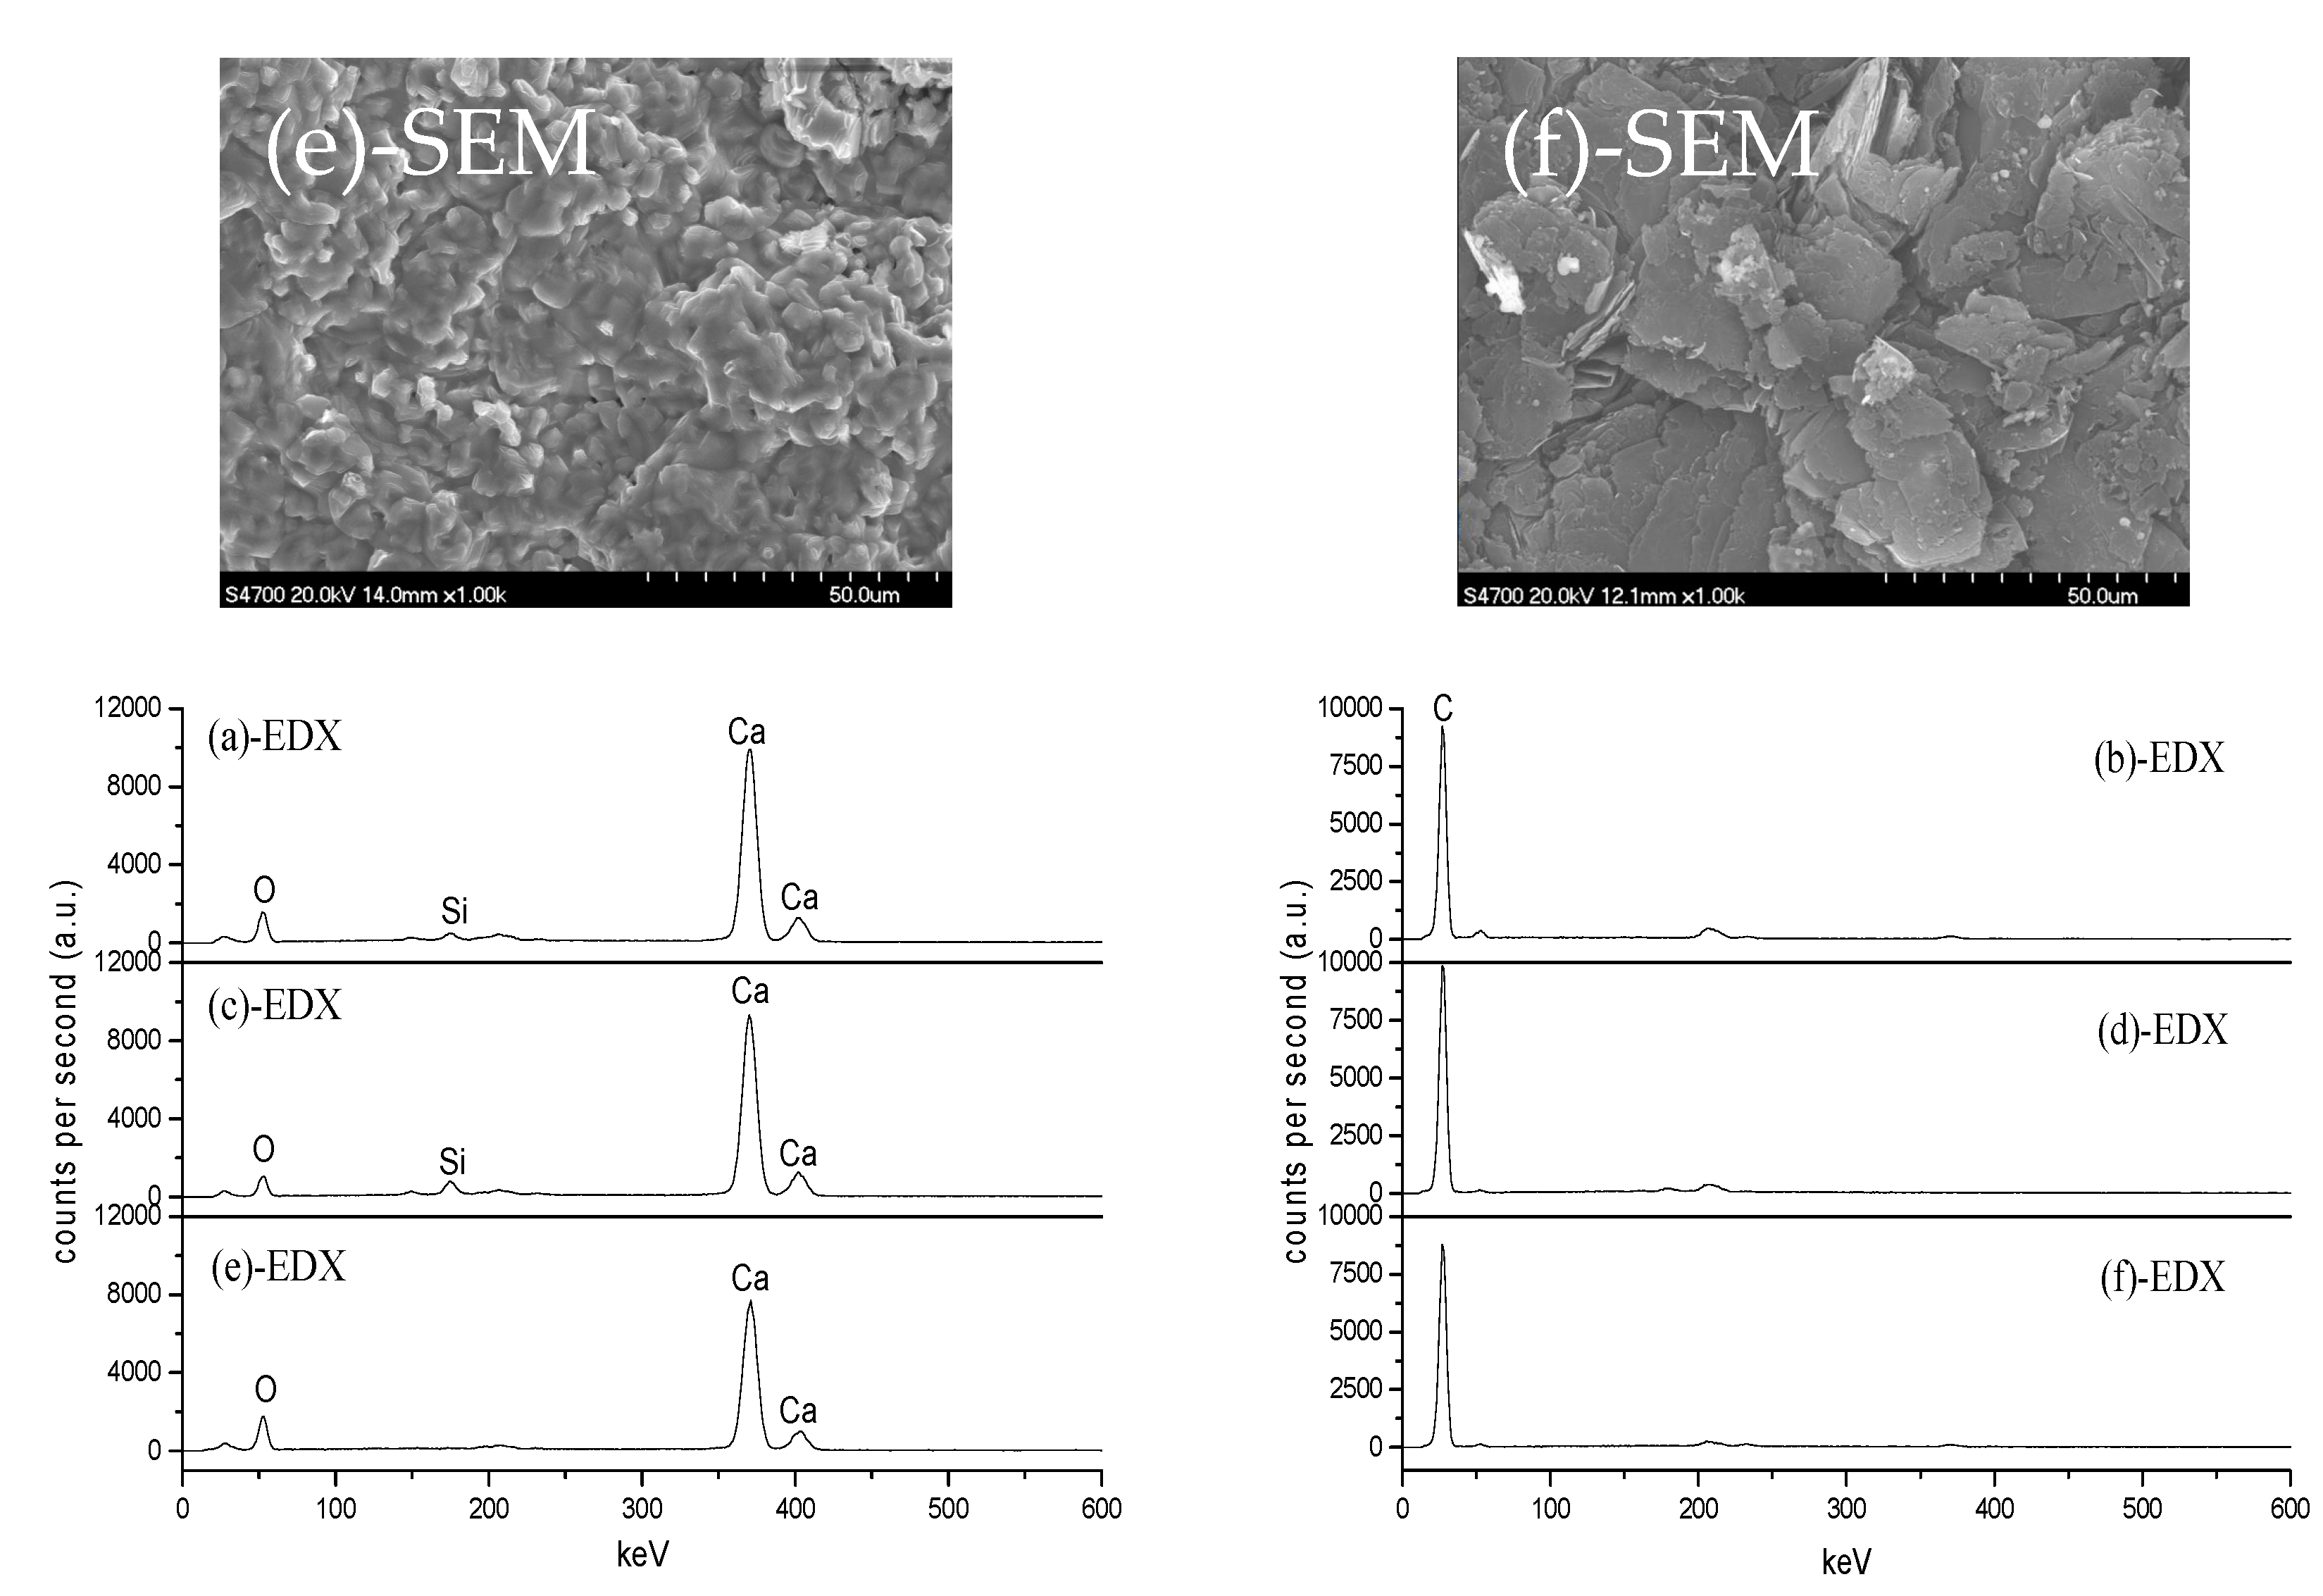
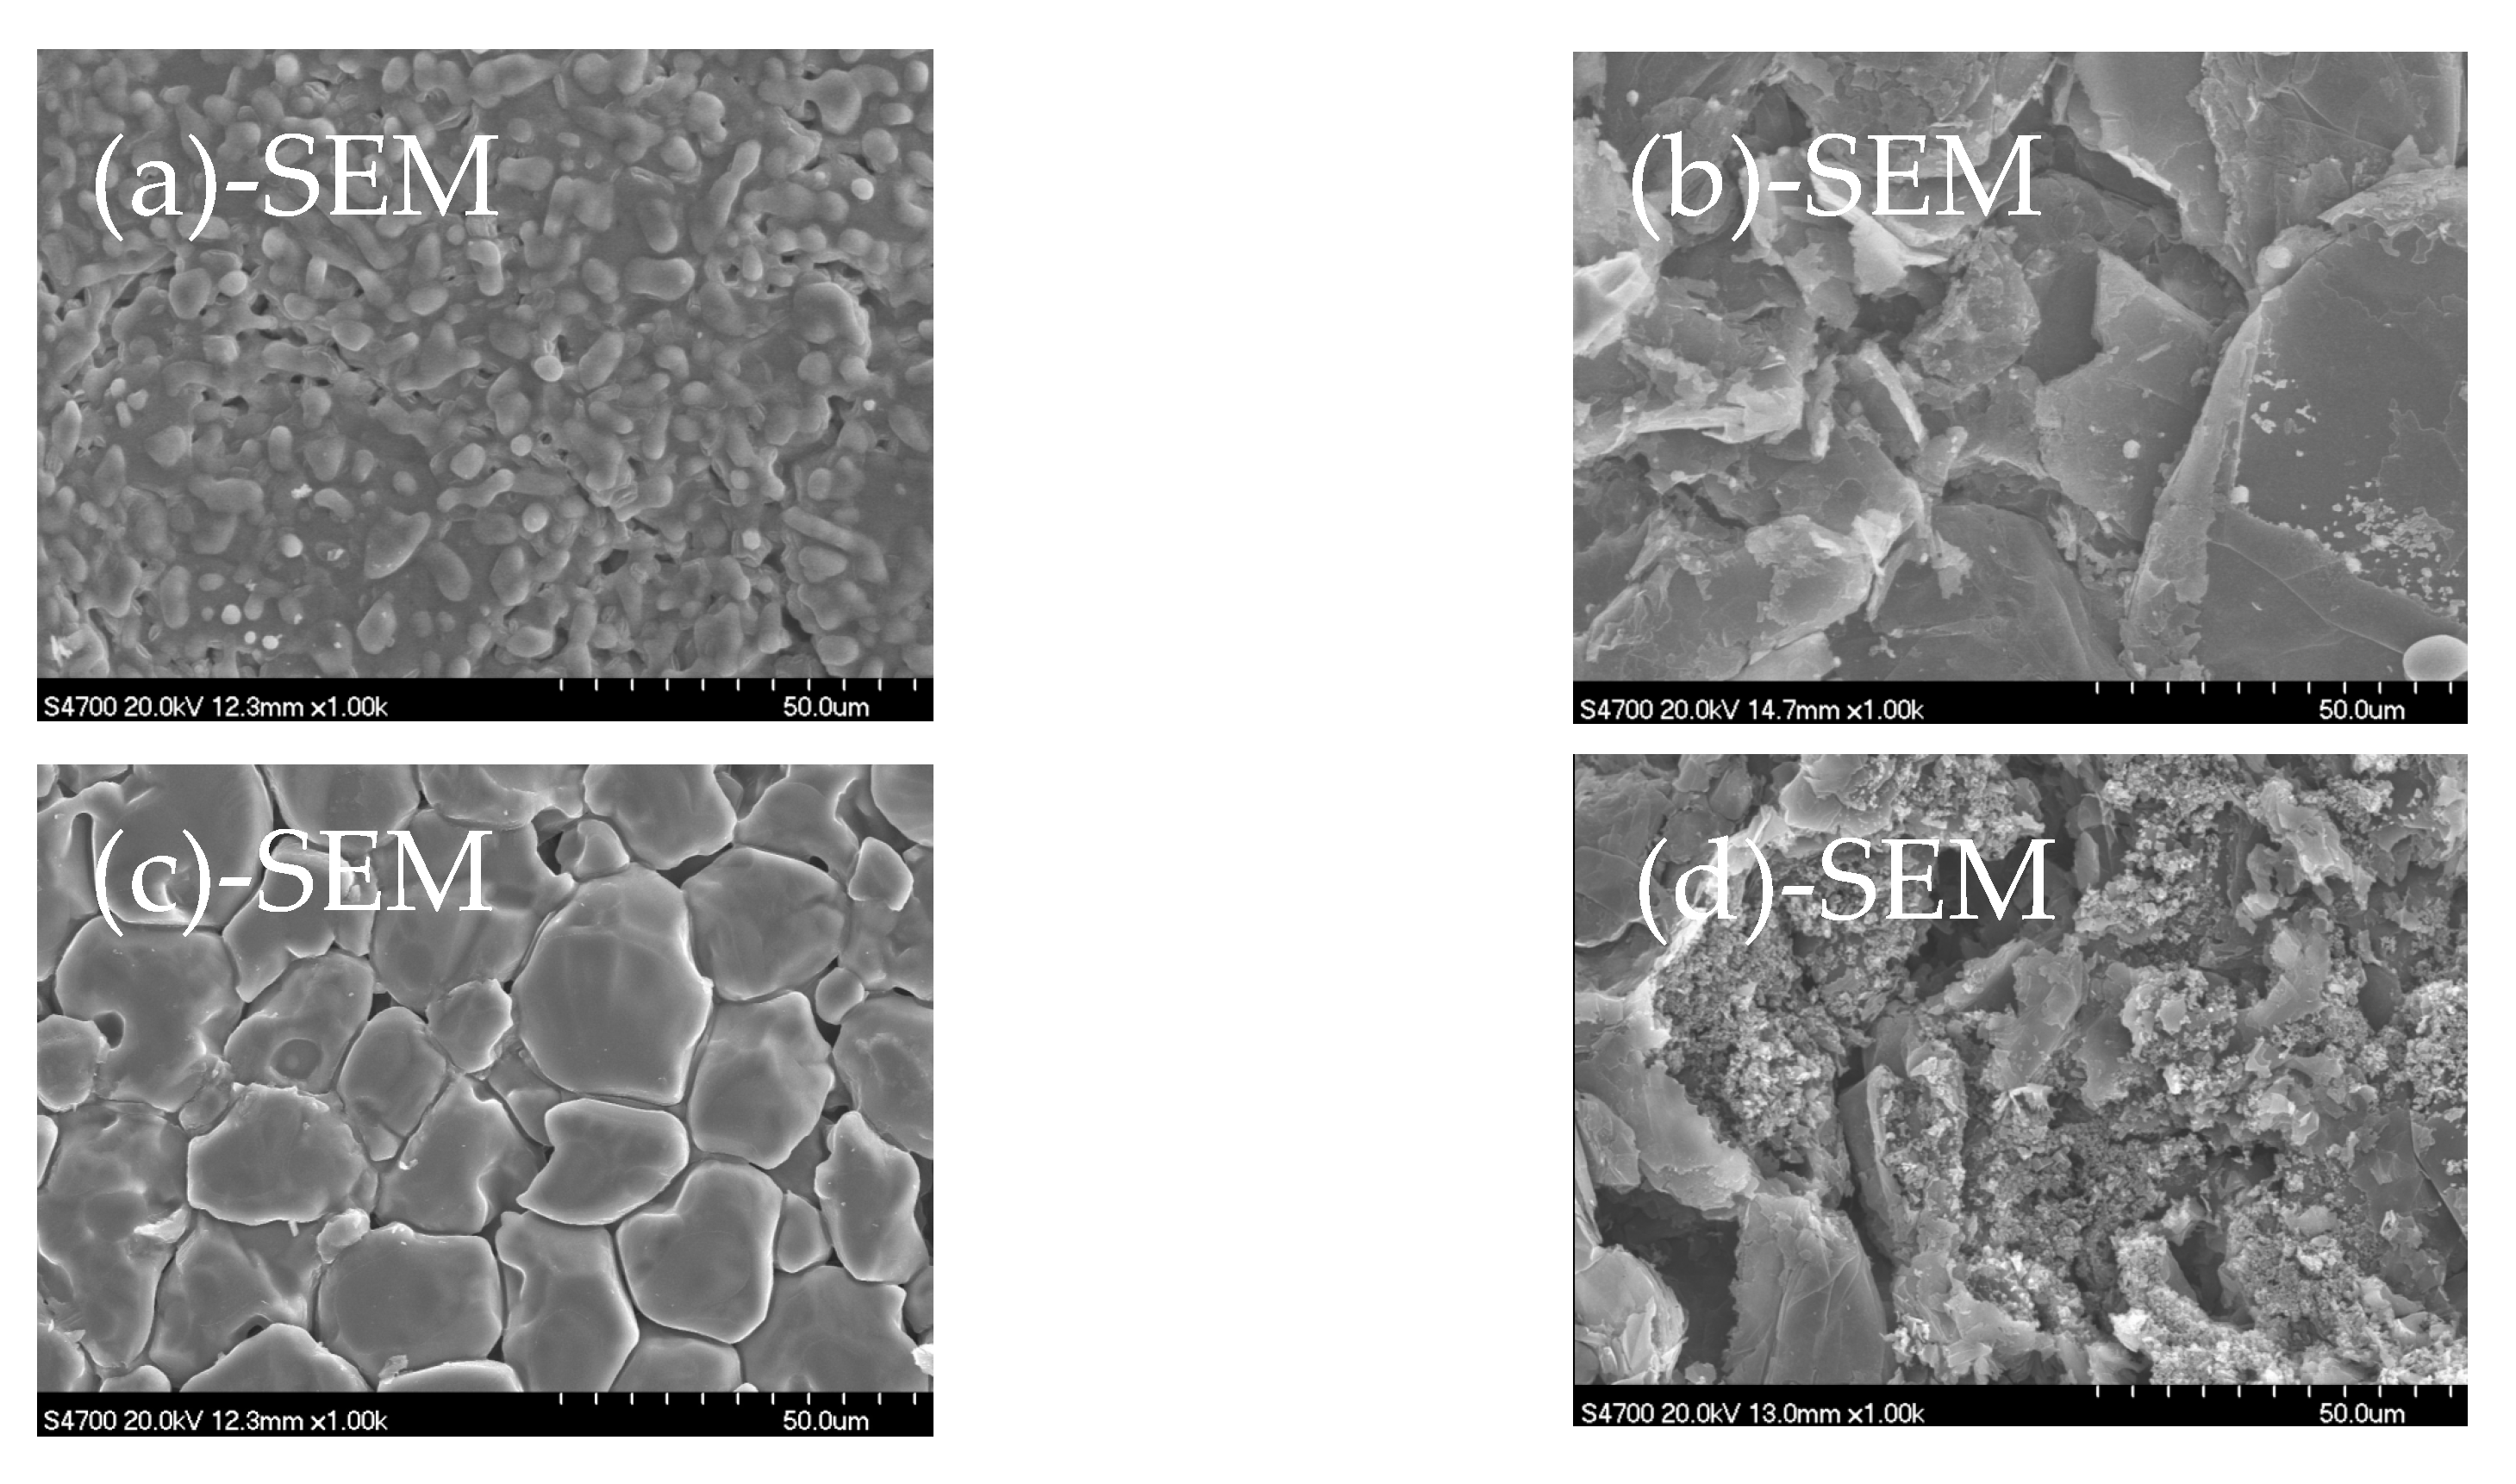
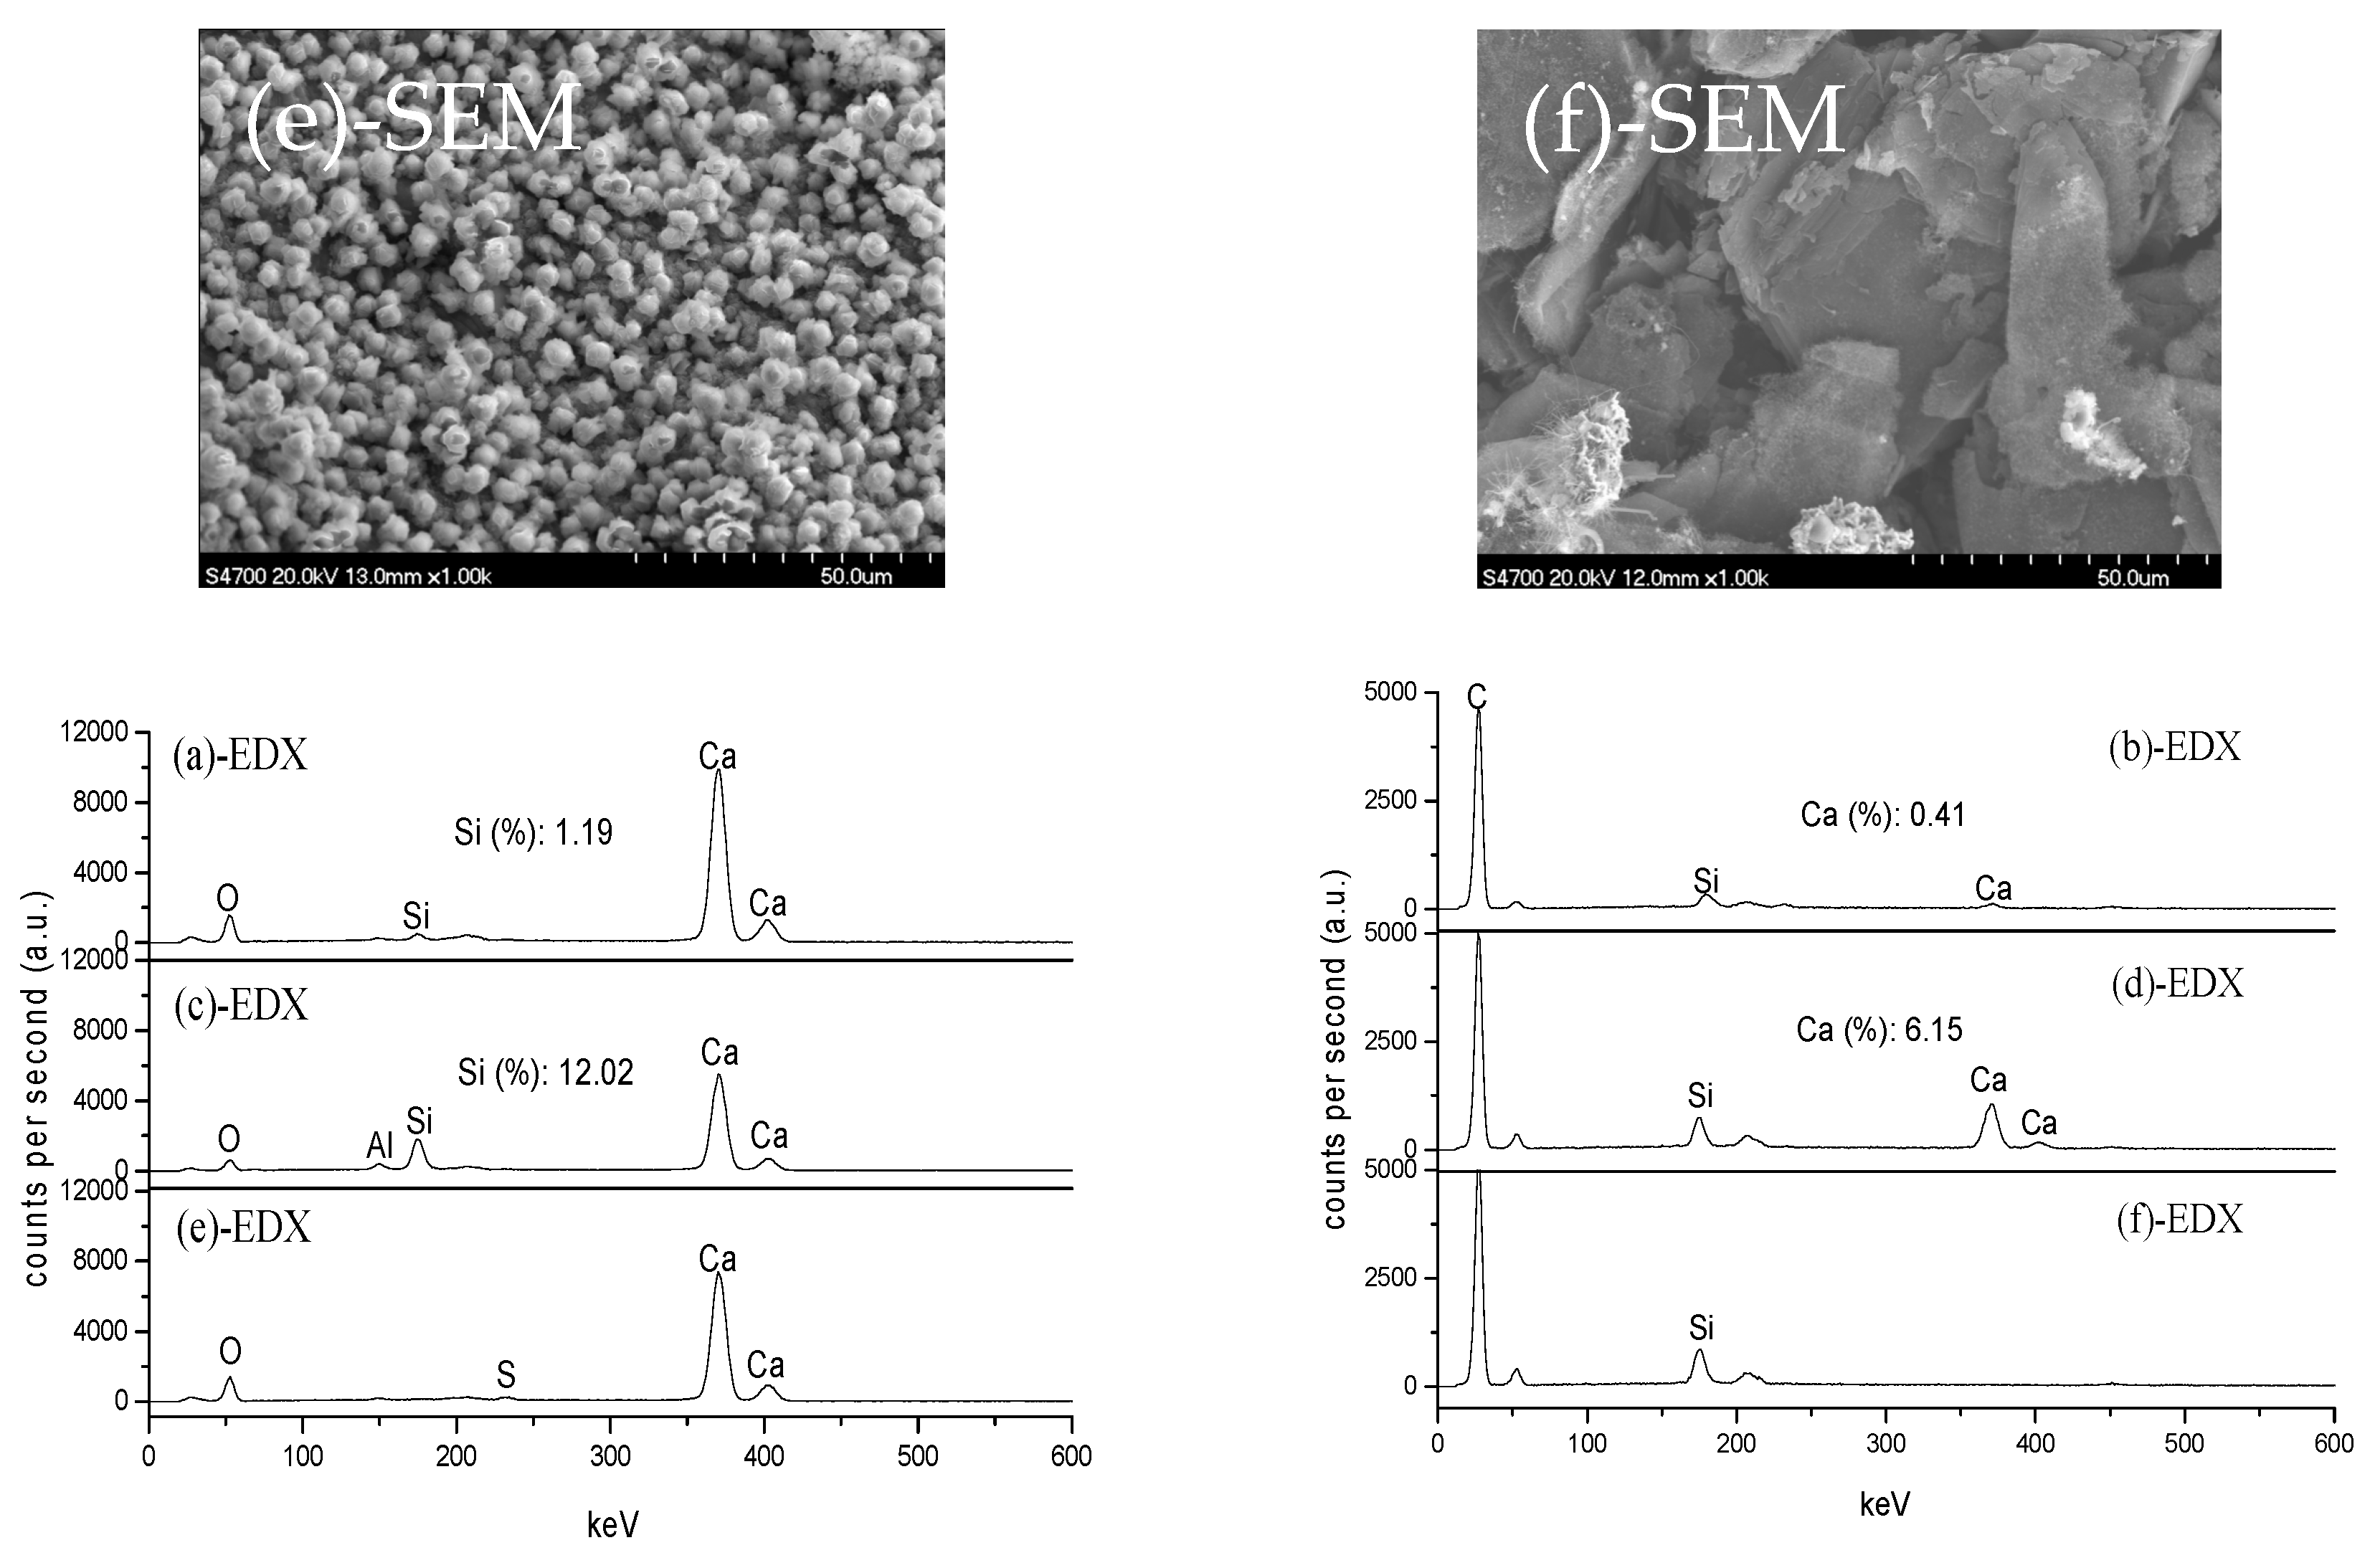
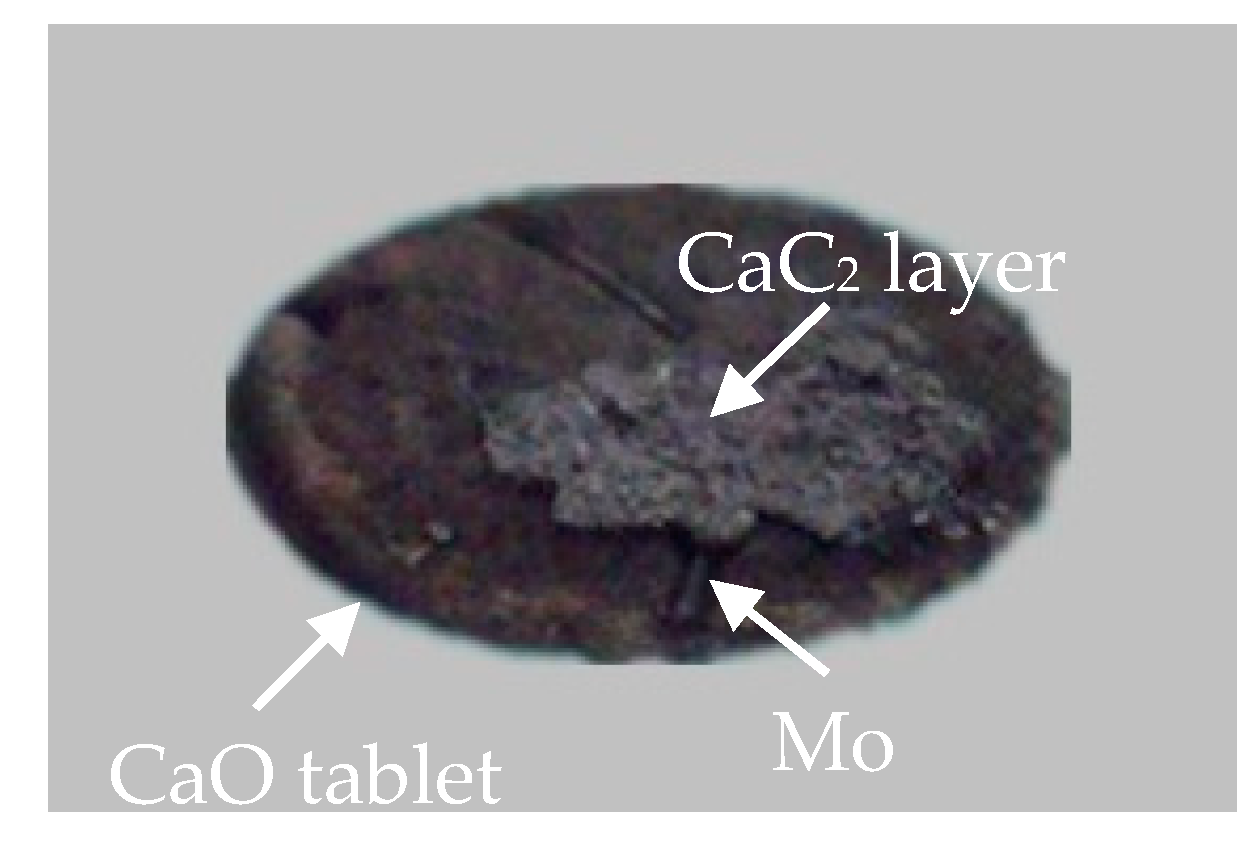
3.1. Physical and Chemical Changes of the Tablets

Experiments in the absence of the Mo wire marker were carried out to understand the effect of temperature on the physical and chemical changes of reactant tablets alone or in close contact. The conditions were 1500 and 1700 °C for 2 h and the data are shown in Table 3. It is seen that the heat treatment reduced the mass and size of the CaO tablet and the decreases at 1700 °C are larger than those at 1500 °C. The graphite tablets, pure-C and ash-C, decreased in mass but changed little in size. The larger mass losses of ash-C tablets than that of pure-C tablets, which were also greater than the mass of ash in the ash-C tablet, suggest that the mass losses occurred in both ash and carbon. This may be attributed to reduction of some of the ash components by C, which results in the evaporation of reduced metals and release of CO, indicating promoted ash migration or mass transfer by C.
It was found that the closely contacted CaO and pure-C tablets did not adhere to each other at these temperatures. The mass losses of these two tablets are about 1% more than those heated alone, but no new product was visible at the interface, indicating the occurrence of some trace reactions at the interphase that cannot be identified by the method used here. Similar behaviors were also found for the CaO and ash-C tablets in close contact at 1500 °C. The closely contacted CaO and ash-C tablets at 1700 °C, however, lost much more mass than the tablets heated alone, about 30% for CaO tablet and 7% for ash-C tablet, and a new product layer was found at the interface, about 0.0852 g. The product was CaC2 because it released acetylene upon mixing with deionized water. The incremental mass losses correspond to a CaO:C molar ratio of about 1:2, which is significantly different from the stoichiometric CaO:C ratio of Reaction (1), 1:3. This indicates that some amounts of CaO diffused out of the CaO tablet, possibly through dissolution into CaC2 to form an eutectic, a reaction between CaO and CaC2 to form gaseous Ca and CO as reported in the literature [16], and the reaction of CaO with the ash in the ash-C tablet. [17] These indicate that the mass transfer of CaO is promoted by the ash in the ash-C tablet.
To better understand the mass transfer behavior, all the samples in Table 3 were subjected to XRD and SEM+EDX analyses. Figure 1 shows that the XRD spectra of the CaO tablets under the 3 conditions, alone at 1500 °C (spectrum (a), left) and in close contact with the pure-C tablet at 1500 (spectrum (b), left) and 1700 °C (spectrum (c), left), are very similar; so are the XRD spectra of pure-C tablets (spectra (a), (b) and (c), right). Figure 2 shows that the SEM+EDX (x1000) spectra of the CaO tablets under the 3 conditions are also similar and so are the SEM+EDX spectra of pure-C tablets. These behaviors support the findings discussed earlier that little mass transfer can be found between the CaO and pure-C tablets under these temperatures, even though they were in close contact.
Figure 3 shows the XRD spectra of CaO and ash-C tablets after being heated individually or in close contact. Different from the CaO tablet heated alone at 1500 °C (spectrum (a), left), the CaO tablets heated in close contact with the ash-C tablet show Ca2SiO4 (spectrum (b), left), which can be ascribed to a reaction of CaO with SiO2, as reported by Wang et al. [18], indicating migration of SiO2 from the ash-C tablet. The absence of Ca2SiO4 at 1700 °C may be ascribed to its decomposition, as reported by Huffman et al. [17]. The absence of CaC2 and SiC peaks at 1700 °C (spectrum (c), left) indicates little C diffusion from the ash-C tablet to the CaO tablet. The appearance of the single C peak at 2θ of 26° at both temperatures (spectra (b) and (c), left) is somewhat surprising, since other major C peaks are absent. Its origin, therefore, is not clear at present.
Figure 3 also shows that the ash-C tablets in close contact with the CaO tablet are very different from that heated alone, including the appearances of SiO2, Al2O3 and Ca2SiO4 at 1500 °C (spectrum (b), right) and SiC and CaC2 at 1700 °C (spectrum (c), right; note: a CaC2 layer is formed between the CaO and the ash-C tablets at 1700 °C). These phenomena indicate the diffusion of CaO to the ash-C tablets, which leads to a reaction of CaO with SiO2 at 1500 °C to form Ca2SiO4 [17] and a reaction of CaO with C at 1700 °C to form CaC2. The disappearance of Ca2SiO4 at 1700 °C may be attributed to its reaction with C that forms CaC2 and SiC [19].
It is worth noting that few Al- and Fe-containing compounds can be observed in Figure 3, even though their contents in ash-C are not minute; about 42 wt.% and 28 wt.% of SiO2 in ash-C, respectively. These seem to suggest that the diffusion rates of Al2O3 and Fe2O3 are not as fast as SiO2 in graphite and/or their reaction with CaO are slower than SiO2. This is in agreement with that reported by Li et al., i.e., effect of SiO2 on CaC2 formation is larger than that of Al2O3 and Fe2O3. [19]
Figure 4 shows SEM+EDX results of the samples analyzed in Figure 3. Clearly, the morphology of the closely contacted CaO and ash-C tablets is different from that when heated alone. The contact of ash-C tablet makes the surface of CaO tablet melt at 1500 °C and form spherical granules of about 5 µm in diameter at 1700 °C. This is accompanied by an increase in Si content at 1500 °C (12.02%) and the disappearance of Si at 1700 °C, which agrees with the behavior shown in Figure 3, i.e., the formation of Ca2SiO4 at 1500 °C and the disappearance of Ca2SiO4 at 1700 °C. The contact of CaO tablet makes the surface of ash-C tablets change too; surface erosion by increased Ca and Si contents at 1500 °C and surface recovery at 1700 °C due to the disappearance of Ca.
Figure 5 shows XRD and SEM+EDX results of the CaC2 layer (about 0.4 mm in thickness) formed between the closely contacted CaO and ash-C tablets at 1700 °C. It is clear that the sample contains CaC2 and CaO as well as trace amounts of Si and Al.

3.2. Diffusion Behavior Identified by Mo Wire Marker

The above data and discussion indicate that the major mass transfer at 1500 and 1700 °C is CaO, from the CaO tablet to the ash-C tablet, but it is visible mainly in the presence of SiO2. The SiO2, in this case, migrates from the ash-C tablet to the CaO tablet. This mutual diffusion is somewhat complex. The formation of CaC2 layer between the CaO and ash-C tablets may also be complex because the diffusion of C may be influenced by CaC2 when it is formed at the interface. To better understand the extent of diffusion of CaO and C, Mo wire markers were placed between the CaO and the ash-C tablets before heating (Sample a in Figure 6). The models in Figure 6 are used as guidelines to identify the mass transfer behaviors. It is seen that after heating if the Mo wires locate at the top of CaC2 layer (keeping contact with CaO, Model b), the main diffusion should be CaO to ash-C, i.e., the decrease of the CaO tablet in thickness and the appearance of a new layer of CaC2; if the thickness of the ash-C tablet decreases but the Mo wires keep at the top surface of the ash-C tablet (Model c), the main diffusion should be C in ash-C to CaO; if the Mo wires stay in the middle of CaC2 layer (Models d), the main diffusion should be mutual for the two reactants. The result of an experiment at 1700 °C in Figure 7 shows that the location of Mo wires are similar to Model b, i.e., away from the ash-C side (close to the CaO tablet that has been removed from the top of the CaC2 layer), indicating the diffusion of CaO to ash-C. This behavior is confirmed by Figure 8, in which the Mo wires were placed on the CaO tablet surface before heating and were found remaining at the CaO side after heating to 1700 °C.

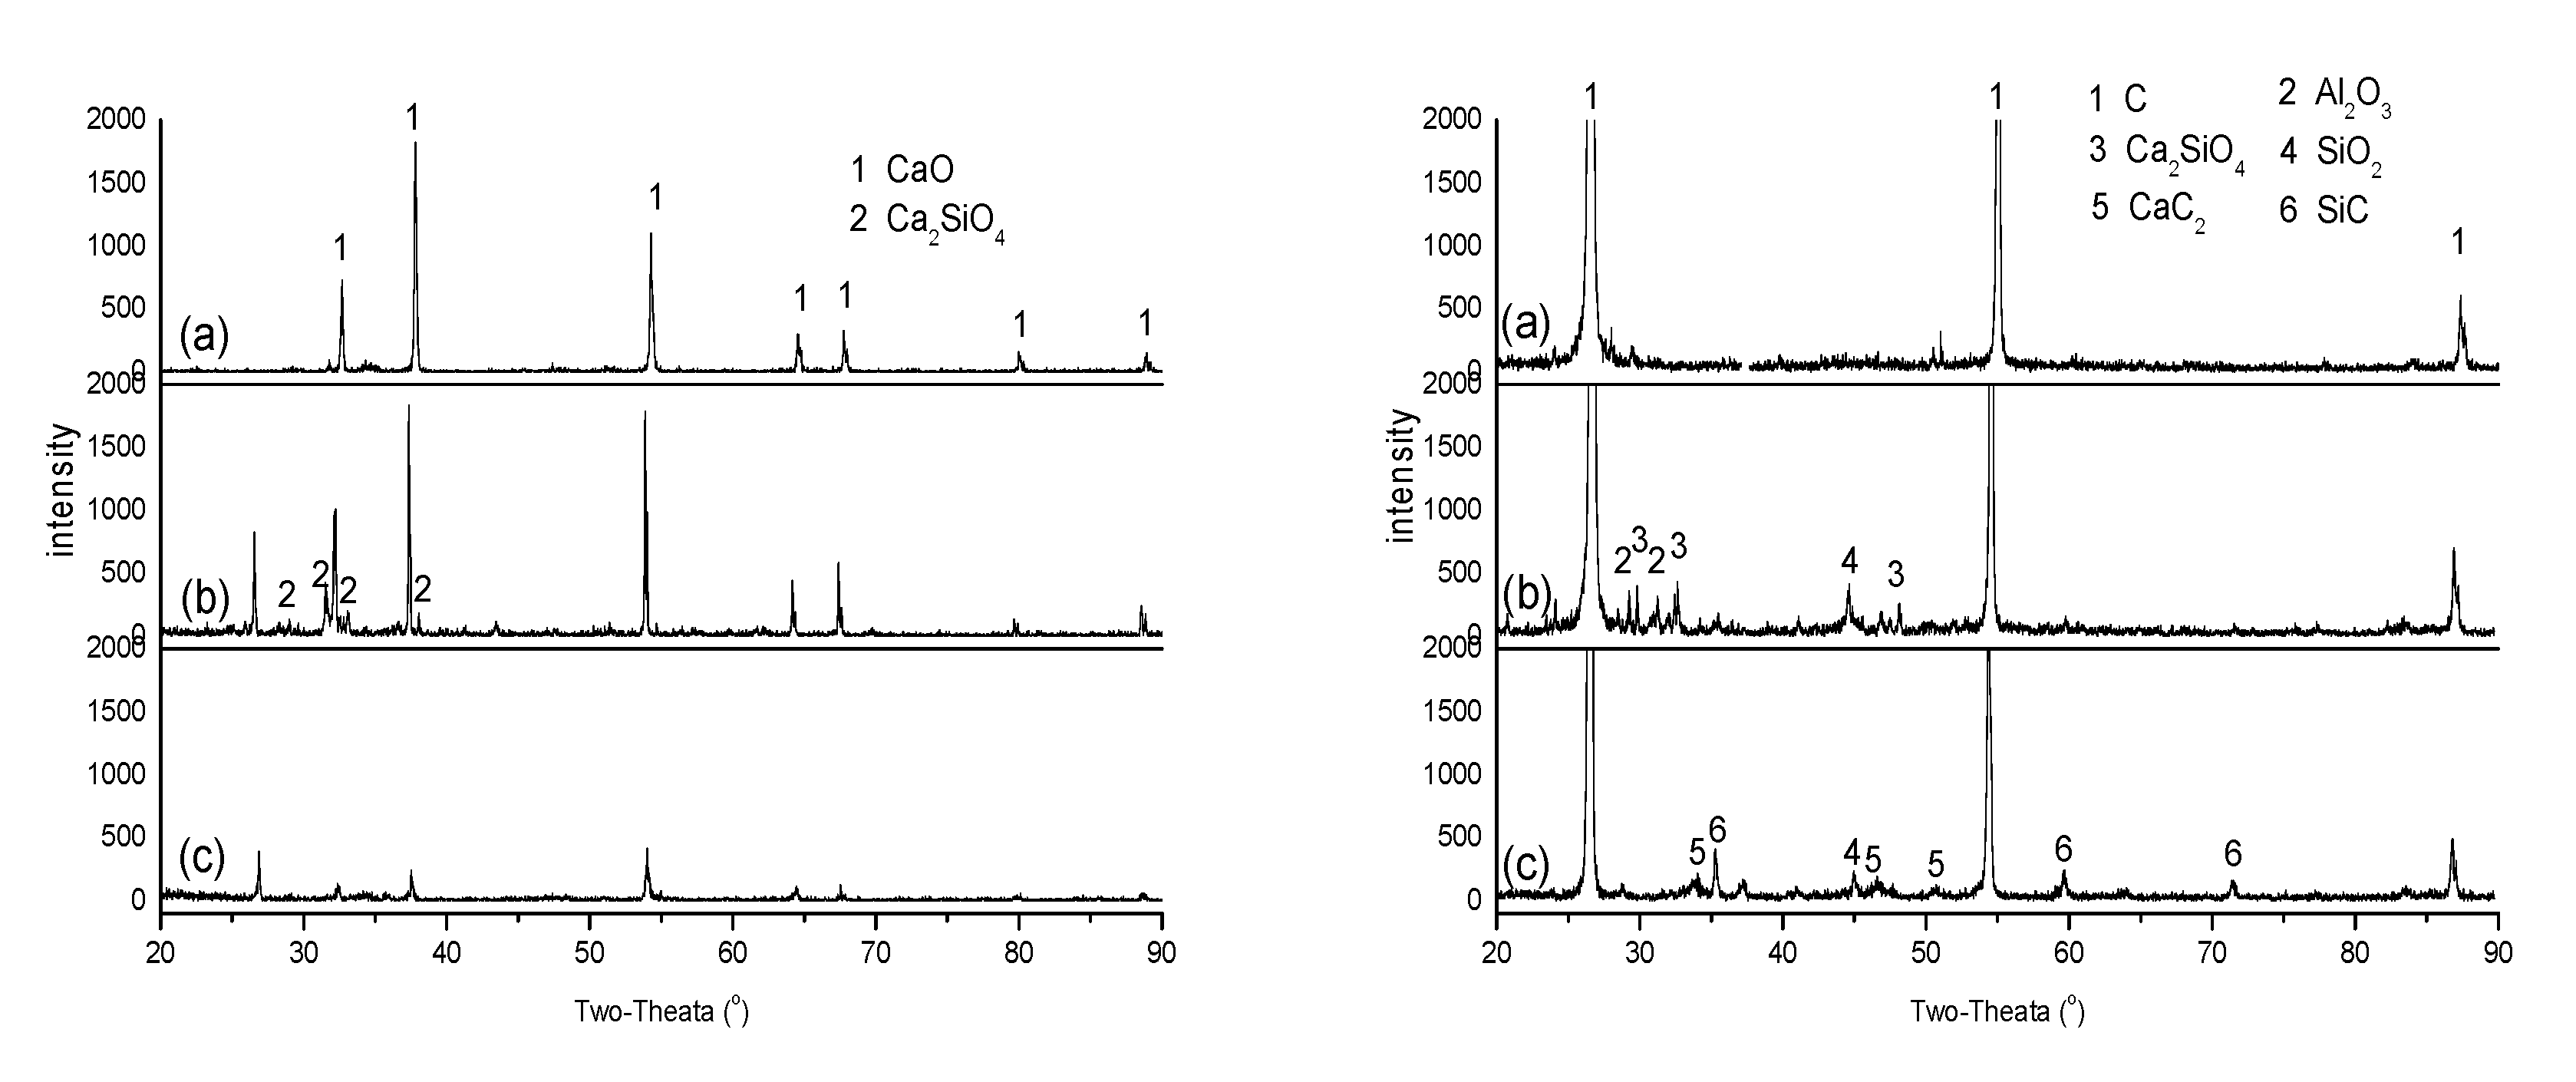
3.3. Behaviors of SiO2 and Ca2SiO4

The above discussion shows that the diffusion of SiO2 from the ash-C tablet to the CaO tablet plays an important role in promoting CaO diffusion, possibly via the formation of Ca2SiO4. To better understand these behaviors, the CaO and the ash-C tablets in close contact were subjected to heating at 1500 °C for 1, 2 and 4 h and analyzed by XRD. Figure 9 shows that CaO peaks (left, CaO tablets) decrease while Ca2SiO4 peaks appear in 1 and 2 h heating, indicating diffusion of SiO2 from the ash-C tablet to the CaO tablet and consequently the reaction between SiO2 and CaO to form Ca2SiO4. The Ca2SiO4 peaks, however, disappear in 4 h and a peak ascribed to the CaO-Ca2SiO4 eutectic appears. The low melting point of CaO-Ca2SiO4 eutectic, 1454 °C, [20] suggests increased mass transfer of Ca species, which would promote CaC2 formation, provided that the temperature is sufficiently high, greater than 1540 °C, [11] for example.
Figure 9 also shows that the surface of ash-C tablet (right, ash-C tablets) was enriched with SiO2 and Al2O3 in 1 h heating and then SiO2 converted to Ca2SiO4 in 2 and 4 h, indicating again the diffusion of CaO from the CaO tablet to the ash-C tablet with the aid of SiO2. The above information agrees with that reported by Ji et al. [21]. The absence of Ca2Al2O5 and calcium aluminosilicates in these XRD spectra also indicates that Al2O3 is not as active as SiO2 in reacting with CaO at the temperature.

4. Conclusions

At temperatures of 1500 and 1700 °C, which are lower and higher than the initial formation temperature of CaC2 from CaO and C (1540 °C), respectively, little diffusion can be found between CaO and a low-ash graphite (pure-C) in 2 h. The SiO2 in a high-ash graphite (ash-C) diffuses into the CaO phase and reacts with CaO to form Ca2SiO4 at these temperatures. A CaO-Ca2SiO4 eutectic may be formed at temperatures lower than 1500 °C, which promotes diffusion of Ca species into graphite and results in CaC2 formation at 1700 °C. Little graphite diffusion into the CaO phase is evidenced under the conditions. SiO2 is faster in mass transfer and more reactive with CaO than Al2O3 and Fe2O3 at the temperatures studied.

Author Contributions

Z.L. and Q.L. designed the study and revised the paper; L.N. performed the experiments and drafted the paper; R.W. and J.W. made intellectual contributions to this study and did some supporting work; Y.P. edited the paper form and did some supporting work. All authors have read and agreed to the published version of the manuscript.

Funding

The work is financially supported by the Major State Basic Research Project (2011CB201306) and the National Natural Science Foundation of China (21121064 and 20976011).

Institutional Review Board Statement

Not applicable.

Informed Consent Statement

Not applicable.

Data Availability Statement

Data is contained within the article.

Conflicts of Interest

The authors declare no conflict of interest.

References

  1. Kim, C.S.; Baddour, R.F.; Howard, J.B.; Meissner, H.P. CaC2 production from CaO and coal or hydrocarbons in a rotating-arc reactor. Ind. Eng. Chem. Process Des. Dev. 1979, 18, 323–328. [Google Scholar] [CrossRef]
  2. Sun, W. Reviews of the calcium carbide industry in 2012 and prospect in 2013. Econ. Anal. China Pet. Chem. Ind. (Chin.) 2013, 4, 29–31. [Google Scholar]
  3. Liu, X.; Zhu, B.; Zhou, W.; Hu, S.; Chen, D.; Charla, G. CO2 emissions in calcium carbide industry: An analysis of China’s mitigation potential. Int. J. Greenh. Gas Control 2011, 5, 1240–1249. [Google Scholar] [CrossRef]
  4. Wang, R.; Ji, L.; Liu, Q.; Zheng, D.; Liu, H.; Liu, Z. Development of Auto-Thermal Production of Calcium Carbide. J. Chem. Ind. Eng. (Chin.) 2014, 65, 2417–2425. [Google Scholar]
  5. Peter, P.; Werner, H.; Richard, M. Ullmann’s Encyclopedia of Industrial Chemistry: Acetylene; John Wiley & Sons, Inc.: New York, NY, USA, 2012. [Google Scholar]
  6. Rowan, S.L.; Celik, I.B.; Escobar Vargas, J.A.; Pakalapati, S.R.; Targett, M. Reaction Kinetics Modeling of CaC2 Formation From Coal and Lime. Ind. Eng. Chem. Res. 2014, 53, 2963–2975. [Google Scholar] [CrossRef]
  7. Li, Z.; Liu, Z.; Wang, R.; Guo, X.; Liu, Q. Conversion of bio-char to CaC2 at low temperatures-morphology and kinetics. Chem. Eng. Sci. 2018, 192, 516–525. [Google Scholar] [CrossRef]
  8. El-Naas, M.H.; Munz, R.J.; Ajersch, F. Production of calcium carbide in a plasma-jet fluid bed Reactor. In Proceedings of the ISPC-12, Minneapolis, MN, USA, 21–25 August 1995; Volume 613–618. [Google Scholar]
  9. Kameyama, N. Electrochemistry: Theory and Applications; Maruzen: Chiyoda-ku, Tokyo, 1956; Volume III-2, pp. 134–142. [Google Scholar]
  10. Müller, M.B. Structure properties and reactions of CaO in burnt lime. Part 2. Diffusion of carbon into solid lime. Scand. J. Metall. 1990, 19, 191–200. [Google Scholar]
  11. Li, G.; Liu, Q.; Liu, Z.; Zhang, Z.C.; Li, C.; Wu, W. Production of Calcium Carbide from Fine Biochars. Angew. Chem. Int. Ed. 2010, 49, 8480–8483. [Google Scholar] [CrossRef]
  12. Ji, L. Fundamental Study of Chemical Reactions and Mass Transfer in CaC2 Production. PhD Dissertation, Beijing University of Chemical Technology, Beijing, China, 2016. [Google Scholar]
  13. Smigelskas, A.D.; Kirkendall, E.O. Zinc Diffusion in Alpha Brass. Trans. AIME 1947, 171, 130–142. [Google Scholar]
  14. Sun, Z.; Yu, F.; Li, F.; Li, S.; Fan, L. Experimental Study of HCl Capture Using CaO Sorbents: Activation, Deactivation, Reactivation, and Ionic Transfer Mechanism. Ind. Eng. Chem. Res. 2011, 50, 6034–6043. [Google Scholar] [CrossRef]
  15. Mrowec, S. Defects and Diffusion in Solids; Elsevier: New York, NY, USA, 1980. [Google Scholar]
  16. Li, G.; Liu, Q.; Liu, Z. CaC2 Production from Pulverized Coke and CaO at Low Temperatures: Reaction Mechanisms. Ind. Eng. Chem. Res 2012, 51, 10742–10747. [Google Scholar] [CrossRef]
  17. Huffman, G.P.; Huggins F., E. Reactions and transformation of coal mineral matter at elevated temperature. Mineral Matter and Ash in Coal, Chapter 8. Acs Symp. Ser. 1986, 301, 100–113. [Google Scholar]
  18. Wang, J.; Ishida, R.; Takarada, T. Carbothermal reductions of quartz and Kaolinite with coal char. Energy Fuels 2000, 14, 1108–1114. [Google Scholar] [CrossRef]
  19. Li, G.; Liu, Q.; Liu, Z. CaC2 Production from Pulverized Coke and CaO at Low Temperatures: Influence of Minerals in Coal-Derived Coke. Ind. Eng. Chem. Res 2012, 51, 10748–10754. [Google Scholar] [CrossRef]
  20. Kay, D.A.R.; Taylor, J. Activities of silica in the lime+alumina+silica system. Trans. Faraday Soc. 1960, 56, 1372–1386. [Google Scholar] [CrossRef]
  21. Ji, l.; Liu, Z.; Wang, R.; Wu, J.; Lin, X.; Liu, Q. Transformation of silicon-bearing minerals during CaC2 production and its effect on CaC2 formation. J. Taiwan Inst. Chem. Eng. 2016, 66, 80–87. [Google Scholar] [CrossRef]
Figure 1. XRD analysis: (a) CaO and pure-C (1500 °C); (b) CaO+pure-C (1500 °C); (c) CaO+pure-C (1700 °C).
Energies 14 00587 g001
Figure 2. SEM+EDX analyses: (a) CaO (1500 °C); (b) pure-C (1500 °C); (c) CaO (+pure-C, 1500 °C); (d) pure-C (+CaO, 1500 °C); (e) CaO (+pure-C, 1700 °C); (f) pure-C (+CaO, 1700 °C).
Energies 14 00587 g002aEnergies 14 00587 g002b
Figure 3. XRD analyses: (a) CaO (left) and ash-C (right) alone at 1500 °C; (b) CaO (left) and ash-C (right) when they were in close contact at 1500 °C; (c) CaO (left) and ash-C (right) when they were in close contact at 1700 °C.
Energies 14 00587 g003
Figure 4. SEM+EDX analyses:(a) CaO (1500 °C); (b) ash-C (1500 °C); (c) CaO (+ash-C,1500 °C); (d) ash-C (+CaO,1500 °C); (e) CaO (+ash-C,1700 °C); (f) ash-C (+CaO,1700 °C).
Energies 14 00587 g004aEnergies 14 00587 g004b
Figure 5. The analyses of CaC2 layer: XRD (left) and SEM+EDX (right).
Energies 14 00587 g005
Figure 6. Diffusion models between CaO and ash–C distinguished by the Mo wires: (a) Sample a; (b) CaO diffuses into C; (c) C diffuses into CaO; (d) mutual diffusion of CaO and C.
Energies 14 00587 g006
Figure 7. Location of Mo wires after the sample (CaO+ash-C with Mo wires) after the heat treatment at 1700 °C.
Energies 14 00587 g007
Figure 8. Location of Mo wires after the sample (ash-C+CaO with Mo wires) after the heat treatment at 1700 °C.
Energies 14 00587 g008
Figure 9. XRD analysis of CaO (left) and ash-C (right) after being heat treated at 1500 °C for different time: (a) CaO or ash-C alone; (b) CaO+ash-C (1 h); (c) CaO+ash-C (2 h); (d) CaO+ash-C (4 h).
Energies 14 00587 g009
Table 1. Proximate and ultimate analyses of the graphite (wt.%).
SamplesProximate Analysis
(wt %, Air-Dry Basis)
Ultimate Analysis
(wt %, Air-Dry Basis)
MoistureAshVolatileCHONS
ash-C2.6421.643.7871.280.992.670.390.39
pure-C-0.12-99.870.01
Table 2. Ash contents of ash-C (mg/g).
SamplesSiO2Al2O3Fe2O3CaOTiO2SO3
ash-C84.4835.7724.0633.481.563.25
Table 3. Mass and size of samples after the heat treatments.
Samples1500 °C1700 °C
Mass
(g)
Diameter
(mm)
Thickness
(mm)
Mass
(g)
Diameter
(mm)
Thickness
(mm)
CaO0.462912.101.560.446511.621.46
pure-C0.487913.021.900.481213.021.90
ash-C0.378213.061.900.341912.941.90
Pure-C (+CaO)0.481213.021.880.479313.021.88
ash-C (+CaO)0.376313.041.920.317712.941.52
CaO (+pure-C)0.461412.101.560.440811.621.44
CaO (+ash-C)0.460112.121.520.311411.601.02
CaC2 (CaO+ash-C)---0.0852-0.40
Note: The original mass of CaO or graphite tablets is 0.50 ± 0.02 g and the original thicknesses are 1.78 mm for the CaO tablet and 1.90 mm for the graphite tablets. The standard deviations are 1.02% for the CaO tablets and 0.78% for the graphite tablets.
Publisher’s Note: MDPI stays neutral with regard to jurisdictional claims in published maps and institutional affiliations.

