Article

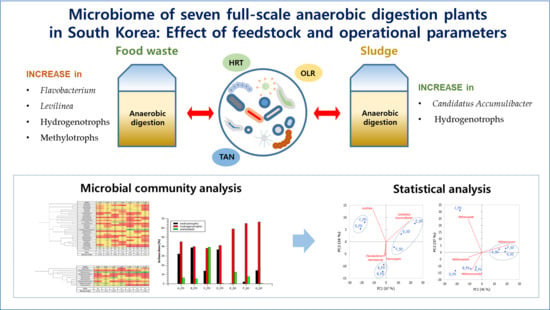
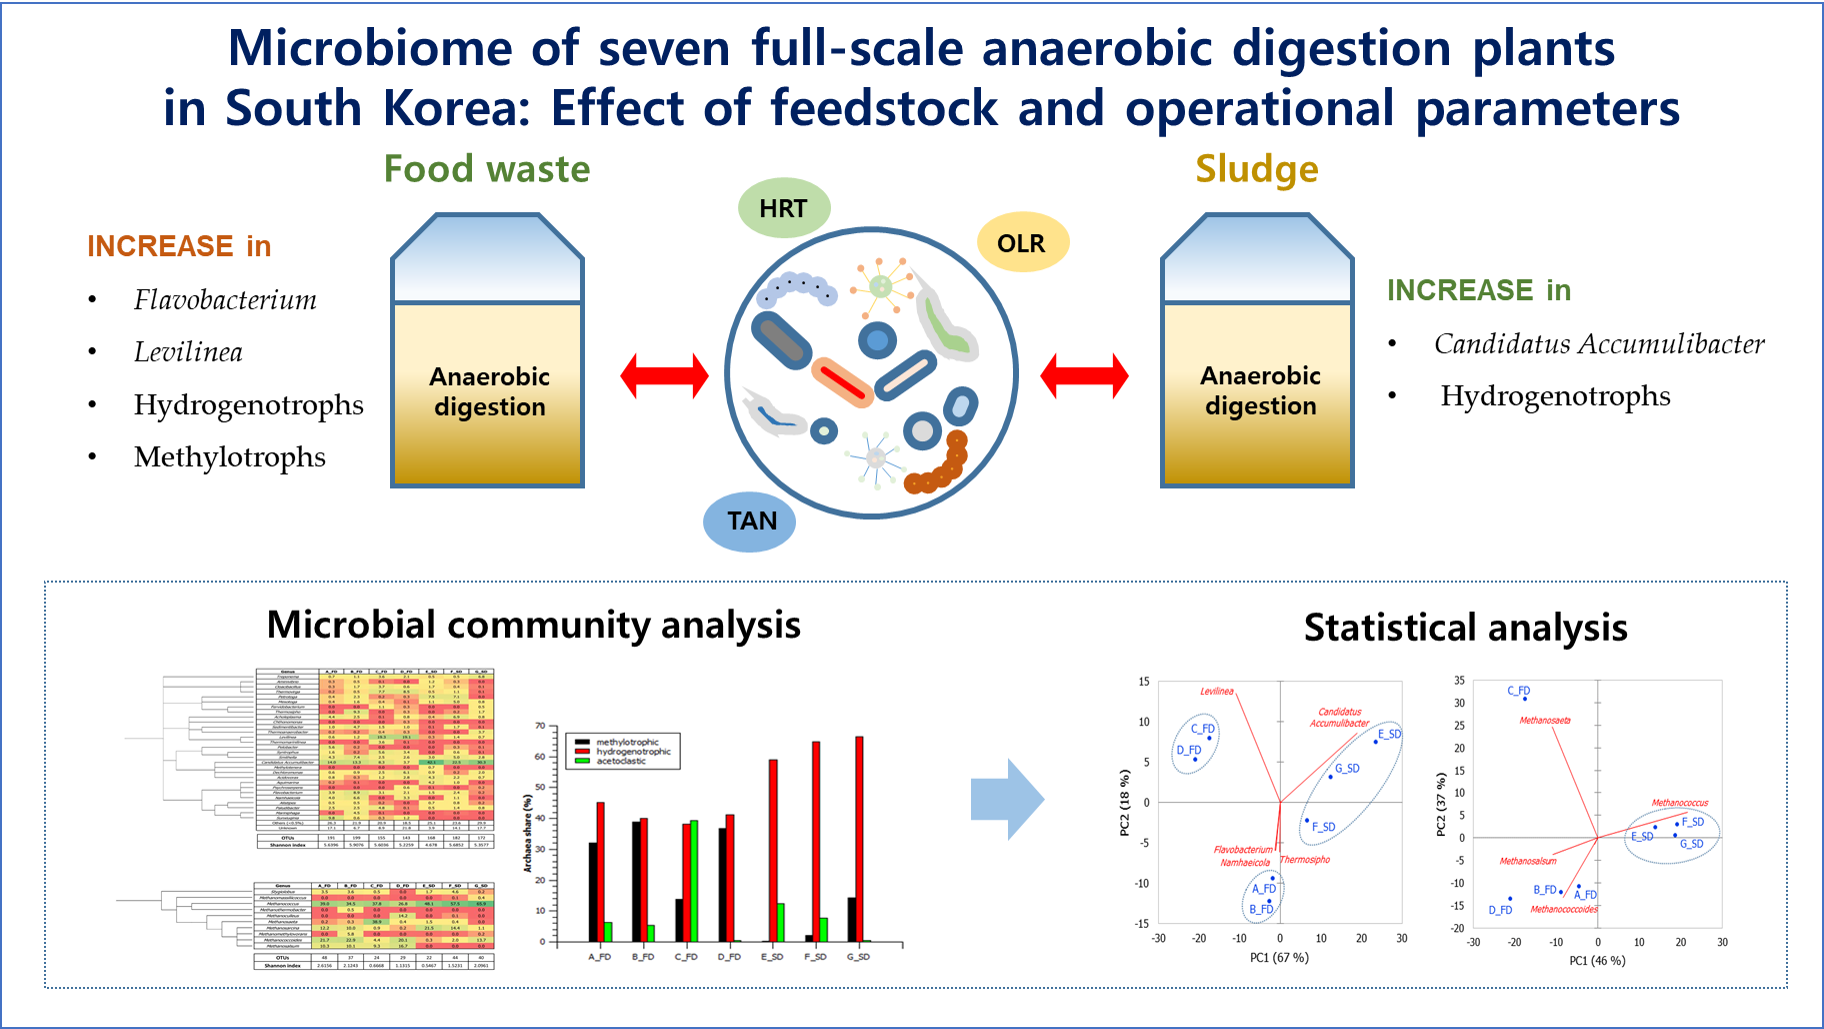
Microbiome of Seven Full-Scale Anaerobic Digestion Plants in South Korea: Effect of Feedstock and Operational Parameters

1
Department of Environmental Engineering, Chungbuk National University, 1 Chungdae-ro, Seowon-Gu, Cheongju 28644, Korea
2
NIBIO, Norwegian Institute of Bioeconomy Research, P.O. Box 115, N-1431 Ås, Norway
3
Waste-Energy Research Division, Environmental Resources Research Department, National Institute of Environmental Research, Environmental Research Complex, Incheon 22689, Korea
*
Author to whom correspondence should be addressed.
Both authors contributed equally to this work.
Energies 2021, 14(3), 665; https://doi.org/10.3390/en14030665
Submission received: 21 December 2020 / Revised: 18 January 2021 / Accepted: 22 January 2021 / Published: 28 January 2021
(This article belongs to the Special Issue Sustainable Waste Management and Potential for Waste-to-Energy)

Abstract

:
In this study, the microbiomes linked with the operational parameters in seven mesophilic full-scale AD plants mainly treating food waste (four plants) and sewage sludge (three plants) were analyzed. The results obtained indicated lower diversity and evenness of the microbial population in sludge digestion (SD) plants compared to food digestion (FD) plants. Candidatus Accumulibacter dominated (up to 42.1%) in SD plants due to microbial immigration from fed secondary sludge (up to 89%). Its potential activity in SD plants was correlated to H2 production, which was related to the dominance of hydrogenotrophic methanogens (Methanococcus). In FD plants, a balance between the hydrogenotrophic and methylotrophic pathways was found, while Flavobacterium and Levilinea played an important role during acidogenesis. Levilinea also expressed sensitivity to ammonia in FD plants. The substantial differences in hydraulic retention time (HRT), organic loading rate (OLR), and total ammonium nitrogen (TAN) among the studied FD plants did not influence the archaeal methane production pathway. In addition, the bacterial genera responsible for acetate production through syntrophy and homoacetogenesis (Smithella, Treponema) were present in all the plants studied.

Graphical Abstract

1. Introduction

The growing world population as well as rapid economic development are leading to increased generation of organic wastes. Food waste (FW) and sewage sludge (SS) are the most copious and problematic forms of organic waste. Life-cycle assessment studies have shown that anaerobic digestion (AD) is a reliable option not only for the treatment of FW and SS but also for biogas production [1,2,3]. In addition, AD has other benefits including reduced sludge generation, odor removal, pathogen reduction, and the generation of nutrient-rich compost [3]. In South Korea, approximately ninety AD plants that treat FW and SS are operational, and the biogas produced is utilized for the generation of heat and power, and is also fed into the natural gas grid after biogas upgrading [4].
The food chain of AD consists of four distinct stages involving the mutualistic behavior of various anaerobic microorganisms: bacteria are involved in hydrolysis, acidogenesis, and acetogenesis, while methanogenesis is performed by a specific branch of archaea via the hydrogenotrophic or acetoclastic pathway [5]. During AD, the complex activity of bacterial and archaeal consortia degrades organic matter into methane (CH4) and carbon dioxide (CO2). Therefore, it is commonly accepted that the microbial community is a key factor for efficient biogas production [6].
Even though the AD food chain has been delineated, the complexity of the microbial communities responsible for AD is not yet fully understood. This is mainly due to a high number of potential variables that determine the microbial community structure; the structure is dependent on biotic and abiotic factors such as feedstock characteristics/origin and operational parameters (e.g., temperature, feeding pattern, organic loading rate (OLR), hydraulic retention time (HRT), and sludge retention time (SRT)). Extensive studies on the influence of ammonia, pH, and temperature on the structure of microbial communities have been undertaken [7,8,9]. However, the impact of microbial immigration from feedstock is usually neglected, while interactions among microorganisms (e.g., syntrophy) or microbial responses to external parameters are mostly unknown or are considered to be unrelated. Knowledge development with regard to these relationships can lead to better microbial management and process stability, especially in the case of hardly biodegradable organic matter.
Recent developments in high-throughput sequencing tools have enabled the sequencing of large microbial communities in complex biological samples at low cost and with short analytical times. Therefore, the number of studies focused on microbial communities originating from laboratory, pilot, and full-scale AD plants, and using 454 pyrosequencing of the 16S rRNA gene, are increasing [8,9,10,11]. A comprehensive overview of the microbial communities involved in AD is necessary to understand the influence of particular microorganisms on the AD process under specific conditions. However, there is still limited information available that can be used to compare full-scale AD plants having different feedstocks such as FW and SS, including information on the impact of microbial immigration.
In this study, the microbiomes in seven full-scale AD plants fed with FW (four plants) and SS (three plants) were compared to identify the factors that influence microbial community structure under specific conditions by using next-generation sequencing (NGS). In addition, to gain a deeper understanding of the results obtained, principal component analysis (PCA) was performed.

2. Materials and Methods

2.1. Full-Scale Anaerobic Digestion Plants Studied and Sample Collection Procedure

Sludge samples collected from seven mesophilic, full-scale anaerobic digesters operating stably in South Korea were investigated. The plants were primarily fed either FW or food waste leachate (FWL) in food digestion (FD) plants (four plants), and SS (a mixture of primary and secondary sludge originating from wastewater treatment plants; three plants) in sludge digestion (SD) plants as shown in Table 1. Sample collection for the determination of influent characteristics, effluent parameters, and the characteristics of microbial communities was performed simultaneously in the spring of 2016. The samples were dispensed into a sterile tube and centrifuged at 14,000× g for 15 min. The solids obtained were stored at −80 °C prior to analysis.
The plants are characterized by different working volumes ranging from 17,500 to 180,000 m3 with the share of SS at FD plants ranging from 4% to 28%. The range of HRT for FD plants was 14.8–39 days, while for SD plants, it was 17.8–49 days. OLR in all the plants ranged between 0.6 and 2.6 kg volatile solid (VS)/m3/d. Further details regarding the plant characteristics are summarized in Table 1.

2.2. Analysis of Microbiome

DNA extraction and pretreatment were performed based on Yun et al. (2016) [12]. Quantification of polymerase chain reaction (PCR) product libraries was performed using the Picogreen assay (Victor 3). The GS-FLX titanium emPCR Kit (454 Life Sciences, Branford, CT, USA) was used for emPCR (clonal amplification of the purified library). A 20-ng aliquot was used as the DNA sample for a 50 μL PCR reaction. To amplify the targeted sequence, the 16S universal primers 27F (5-GAGTTTGATCMTGGCTCAG-3) and 518R (5-WTTACCGCGGCTGCTGG-3) for bacteria, and Arc21F (5-TCCGGTTGATCCYGCCGG-3) and Arc516r (5-GGTDTTACCGCGGCKGCTG-3) for archaea were used [13,14]. The adaptors CCATCTCATC CCTGCGTGTCTCCGACTCAG (forward) and CCTATCCCCTGTGTGCCTTGGCAGTCTCAG (reverse), with barcodes 5-AGTACGCTAT-3 for bacteria and 5-AGTATACATA-3 for archaea, were used. A FastStart High Fidelity PCR system (Roche) was used to perform PCR. The PCR was performed under the following conditions: 94 °C for 3 min, 35 cycles at 94 °C for 15 s, 55 °C for 45 s, 72 °C for 1 min, and a final elongation step at 72 °C for 8 min.
PCR products were purified using AMPure beads (Beckman Coulter, Brea, CA, USA). A 454 pyrosequencing Genome Sequencer, FLX Titanium (Life Sciences, Branford, CT, USA), was used for sequencing; sequencing was performed by a commercial facility (Macrogen, Seoul, South Korea). The generated sequences were analyzed using the QIIME software [15]; sequences with more than one ambiguous base call, and those that were 300 nt or shorter were removed [16]. Collection of sample-specific sequences was performed based on the barcode sequences tagged to each sample. Forward and reverse primers and barcodes were trimmed from the initial sequences. Infernal was used to align the trimmed sequences; covariance models for the analysis of the aligned sequences were obtained from the Ribosomal Database Project [17]. The NCBI BLAST database was used for sequences spanning. For aligned sequences, the distance matrix was calculated, and OTUs (95−100% similarity) were assigned using the furthest neighbor clustering algorithm. The OTUs defined at a 3% distance level were phylogenetically classified with a modified bacterial RDP II database containing 164,517 almost full-length 16S rRNA gene sequences prepared using TaxCollector (http://www.microgator.org). Interactive Tree of Life (iTOL) 4.4.2 software was used to generate the phylogenic tree [18]. PCA was performed with Pearson (n-1 type) using XLSTAT software (2019.3.2). Variables (axes F1 and F2) were filtered above 80%.

2.3. Analytical Methods for Physicochemical Parameters

Physicochemical parameters of the influent and effluent were analyzed. The chemical oxidation demand (COD), total ammonium nitrogen (TAN), total alkalinity (T-Alkalinity), total solids (TS), and volatile solids (VS) were analyzed using standard methods [19]. High-performance liquid chromatography (HPLC, YOUNGLIN SDV50A, Anyang, South Korea) with a Zorbax SB-Aq (4.6 mm ID × 150 mm) was used for the determination of volatile fatty acids (VFAs). The CH4 content of biogas was determined by gas chromatography (Gow Mac Series 580, GOW-MAC Instrument Co., Bethlehem, PA, USA) coupled with a thermal conductivity detector (TCD).

3. Results and Discussion

3.1. Performance of Full-Scale Anaerobic Digestion Plants

The physicochemical and operational parameters of seven mesophilic AD plants are summarized in Table 1. The B_FD plant is characterized by the highest OLR (2.6 ± 0.0 kg VS/m3/d), along with A_FD, E_SD, and F_SD which had higher OLRs (ranging between 1.4 ± 0.0 and 2.6 ± 0.1 kg VS/m3/d). A substantially lower OLR (<1.0 kg VS/m3/d) was maintained in the remaining plants (C_FD, D_FD, and G_SD).
The main effluent parameter that differentiated FD and SD plants was TAN. Higher concentrations of TAN were characteristic of FD plants compared to SD plants. Their elevated presence was caused by the fed FW which is a protein-rich feedstock. It has been reported that the share of protein in FW, such as fish and meat residue, can go up to 76% [20]. Therefore, in FD plants, TAN was between 1.1 and 2.5 g/L, while lower concentrations of 0.8–1.1 g/L were present at SD plants. During protein degradation, the amine group (-NH2) is released, forming ammonia/ammonium (NH3/NH4+). Since the reactors maintained a pH of approximately 8.0 (7.6–8.2), the NH4+ fraction prevailed over NH3. The presence of high NH3/NH4+ has been frequently reported to inhibit methanogens [21]. Nevertheless, despite elevated concentration of TAN, the influent carbon/nitrogen (C/N) ratio was higher (7.0–10.1) in FD plants compared to SD plants, where it ranged from 6.1 to 7.3.
A higher CH4 yield was characteristic of FD plants; it was in the range 0.24–0.41 m3 CH4/kg VS in FD plants, while lower values of CH4 yield in the range 0.14–0.28 m3 CH4/kg VS were observed at SD plants. A higher share of SS in the feedstock of FD plants reflected a lower CH4 yield. For B_FD where the share of SS in the feedstock was the highest (28%), the CH4 yield (0.24 ± 0.1 m3 CH4/kg VS) achieved was the lowest among FD plants. Regarding SD plants, the higher share of secondary sludge (SE) in the feedstock increased CH4 yield. In the case of E_SD with a 2.2 times higher share of SE, the CH4 yield was twice that of F_SD, reaching 0.28 ± 0.1 and 0.14 ± 0.1 m3 CH4/kg VS, respectively.

3.2. Microbial Diversity

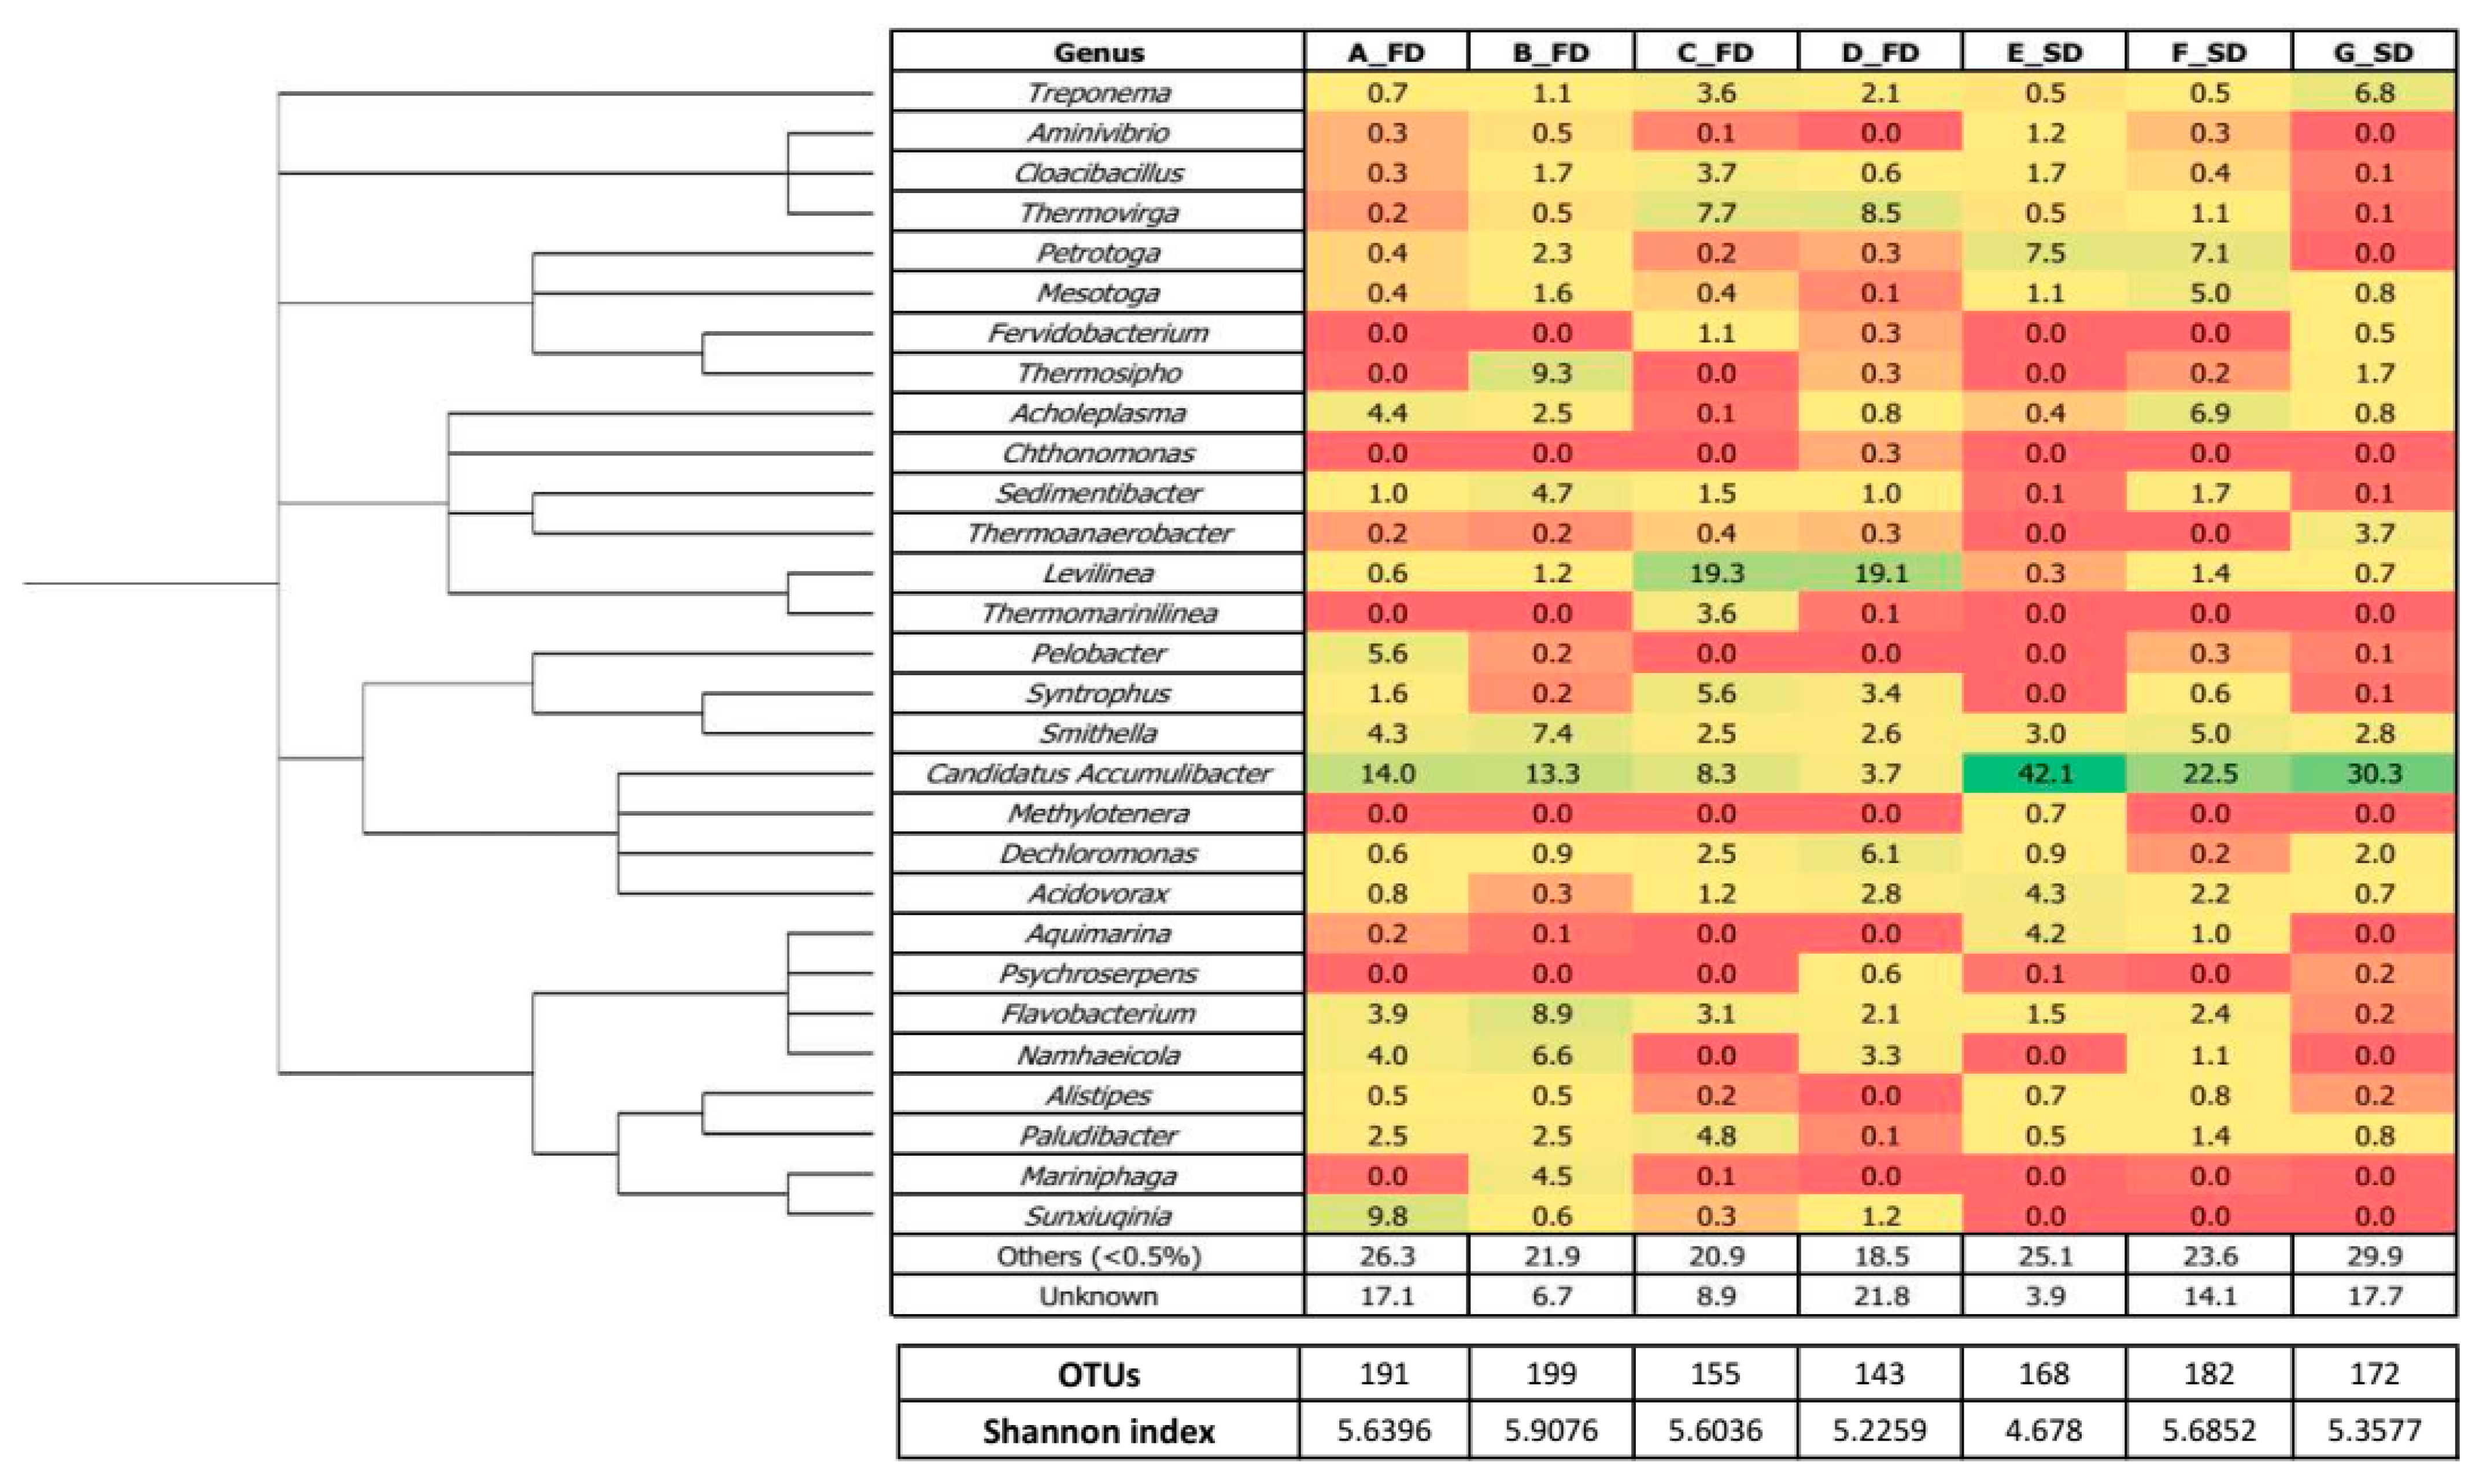
3.2.1. Bacterial Structure

The community structure and composition of bacterial genera of FD and SD plants are presented in Figure 1. Only three bacterial genera, Candidatus Accumulibacter, Smithella, and Treponema, were present in all the plants studied (share ≥ 0.5%). Candidatus Accumulibacter prevailed substantially in SD plants (E_SD, F_SD, and G_SD), with its share ranging between 22.5% and 42.1% (the highest in E_SD). Additionally, a high proportion of Candidatus Accumulibacter was found in the A_FD and B_FD plants (13.3–14.0%). The presence of this genus is typical of AD plants because it represents a model phosphate-accumulating organism (PAO). They usually predominate during enhanced biological phosphorus removal in full-scale wastewater treatment plants [22]. The significant presence of Candidatus Accumulibacter in the AD plants considered in this study can be attributed to microbial immigration during continuous feeding of SE rich in PAO into the AD plants. This can be observed in SD plants especially, where the share of SE was in the range 35–89%, and the highest share of fed SE coincided with the highest presence of Candidatus Accumulibacter.
Candidatus Accumulibacter activity during AD can be hypothesized based on its diverse metabolism. Apart from phosphate accumulation and denitrification, their ability for anaerobic production of hydrogen (H2) gas in the presence of acetate has been reported [21,22]. Therefore, it can be suggested that the continuously augmented (through feeding) Candidatus Accumulibacter could be responsible for H2 production during AD. The potential for H2 production by Candidatus Accumulibacter in SD plants can be inferred from the archaeal community structure where hydrogenotrophic methanogens prevailed (further description in the next section).
The two remaining bacterial genera (Smithella and Treponema), found in all samples, represent acetogenic bacteria. Smithella (2.5–7.4%, highest in B_FD) are recognized as mesophilic, syntrophic propionate-oxidizing bacteria producing acetate, while Treponema (0.5–6.8%, highest in G_SD) is one of the homoacetogenic bacteria, also producing acetate using H2 and CO2 [11,23,24,25]. Their common presence induces universal acetate production through syntrophic reaction and homoacetogenesis during AD.
The inherent presence of Dechloromonas, Flavobacterium, Levilinea, and Sedimentibacter was noticed in FD plants. Dechloromonas (0.6–6.1%, highest in D_FD) is a known hydrocarbon-degrading genus of bacteria with versatile metabolism, where NO3, NO2, ClO4, and SO42− act as electron acceptors to electron donors such as VFAs [26,27]. Due to its versatile metabolism, it could be involved in chloride reduction or denitrification, utilizing the VFAs generated during the acidogenic stage. The presence of Flavobacterium (2.1–8.9%, highest in B_FD) and Sedimentibacter (1.0–4.7%, highest in B_FD) has been reported in connection with the degradation of various compounds including proteins and carbohydrates [28,29,30]. In comparison to other genera inherent in FD plants, the share of Levilinea was the most uneven, and ranged between 0.6% and 19.3%. The A_FD and B_FD plants had a lower share of Levilinea (0.6–1.2%), while its presence was more pronounced in the C_FD and D_FD plants (19.1–19.3%), being the most prevalent bacteria in these plants. Levilinea is recognized as a mesophilic anaerobic bacterium that feeds on carbohydrates; however, it cannot utilize H2/CO2, VFAs, and alcohols (e.g., methanol and ethanol) [31,32]. The substantial differences in the share of Levilinea can be correlated with differences in feedstock quality among the FD plants—for example, carbohydrate and protein content. Additionally, based on Flavobacterium and Levilinea metabolism, it can be hypothesized that they play an important role in the acidogenesis stage of FW degradation.
The high share of Levilinea in the C_FD and D_FD plants coincided with the presence of Thermovirga, which was the second most prevalent genus in these plants (7.7–8.5%). Their metabolism facilitates the degradation of proteinous substrates [33]. Similarly, in the A_FD and B_FD plants, the genera associated with protein degradation were found in abundance. Sunxiuqinia (9.8%) and Thermosipho (9.3%) were the second most abundant genera at the A_FD and B_FD plants, respectively. Species of Sunxiuqinia grow anaerobically (i.e., Sunxiuqinia faeciviva) degrading proteins, whereas Thermosipho (i.e., Thermosipho japonicas) growth is supported by sulfur/thiosulfate as an electron acceptor [34,35]. Therefore, protein-degrading bacteria were commonly present in substantial proportions, independent of the TAN concentration, in FD plants.
The higher evenness and richness of microbial population due to Candidatus Accumulibacter prevalence was characteristic of SD plants compared to FD plants, indicating a high impact from microbial immigration. Nevertheless, a substantial number of genera such as Acidovorax, Mesotoga, and Paludibacter were commonly present (≥0.5%). In particular, the presence of Mesotoga and Paludibacter indicates the production of organic acids (i.e., acetic and propionic acid) primarily from carbohydrates but also from proteins [36,37]. The presence of Acidovorax (0.7–4.3%, highest in E_SD) was found to be intriguing due to its capability to denitrify in the presence of nitrogen oxide [38]. A lower share of Acidovorax was also found in FD plants.

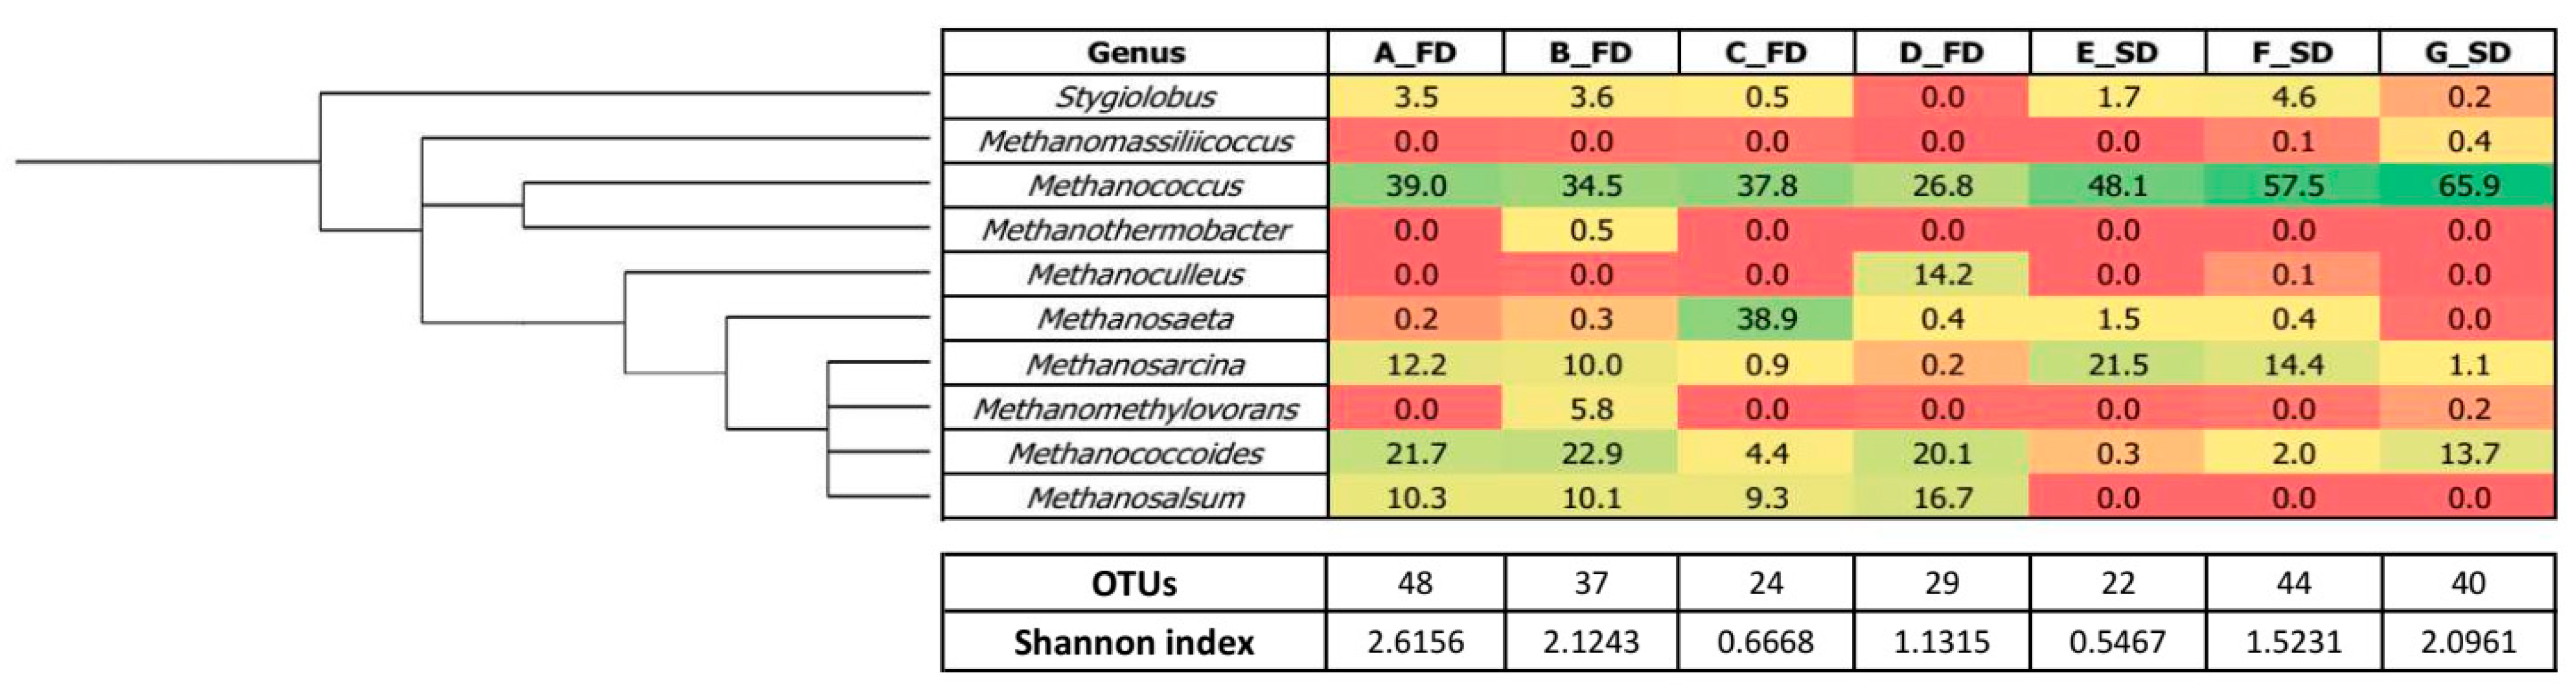
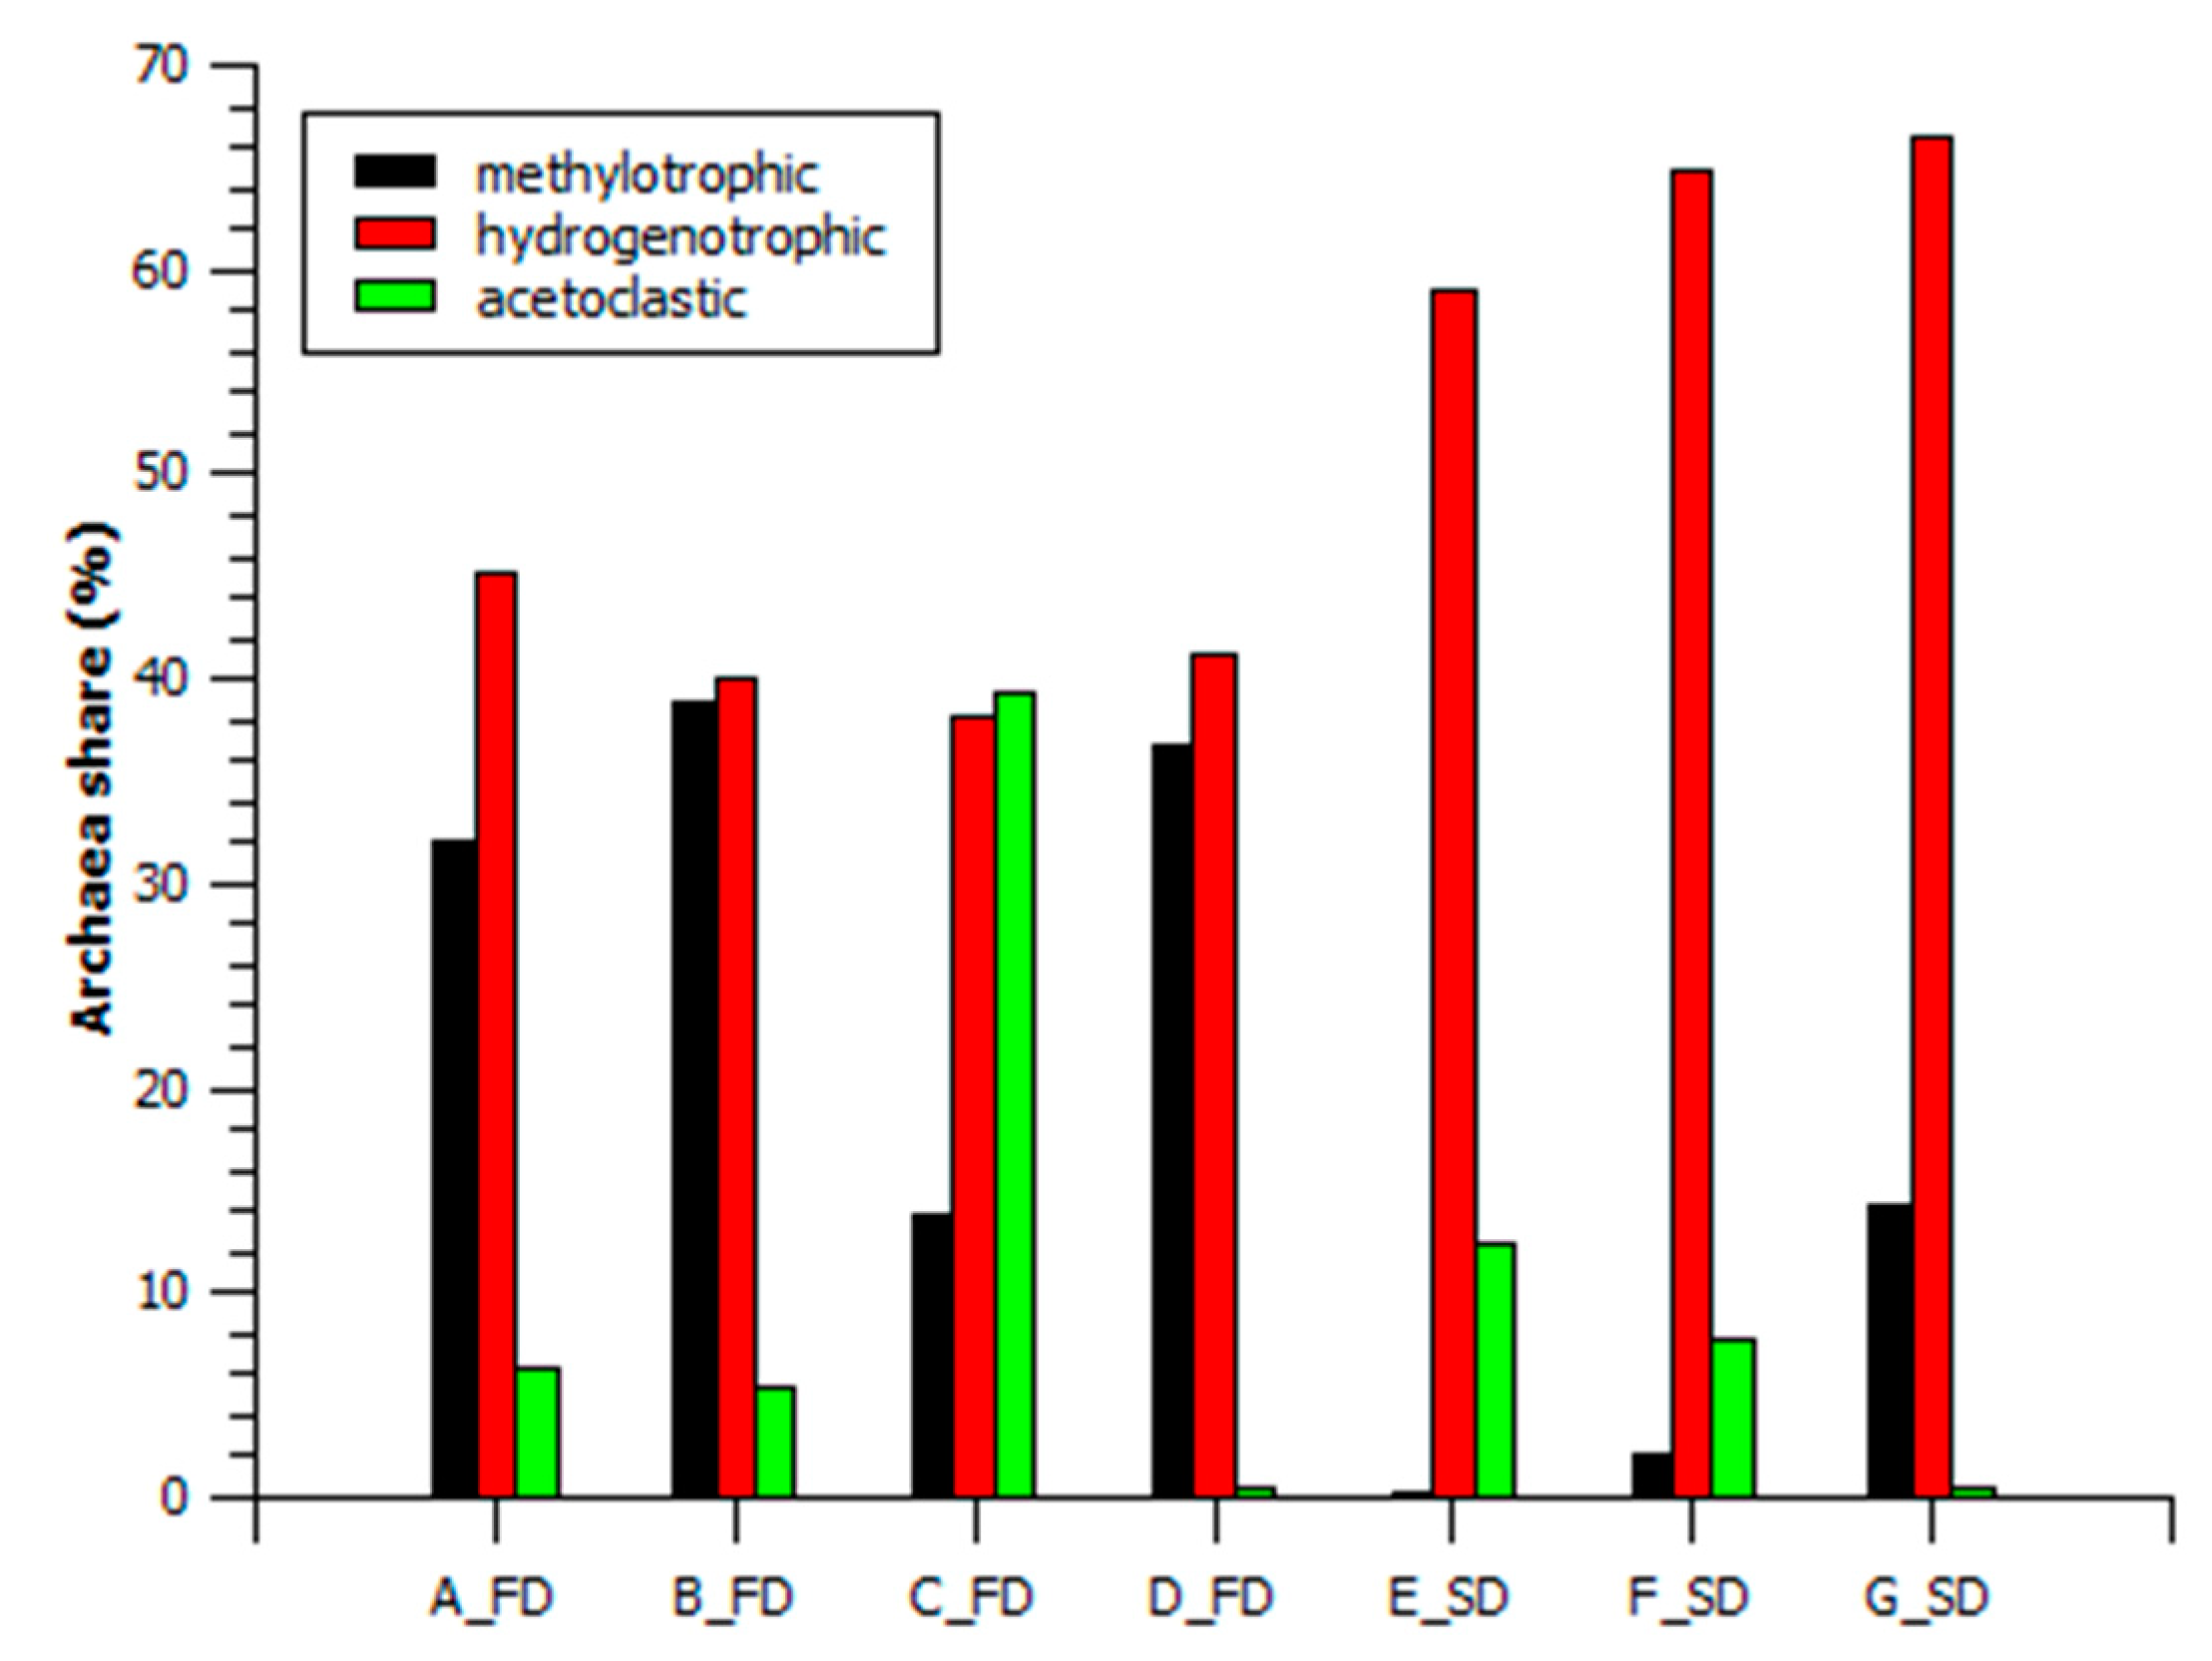
3.2.2. Archaeal Structure

Ten archaeal genera were found in all the study samples. Most genera represented methanogens (nine), while one represented sulfate-reducing archaea (SRA) (Table 2 and Figure 2). The chemolithoautotrophic SRA, Stygiolobus (0.2–4.6%), found in nearly all studied archaeal communities utilizes elemental sulfur (S0) and H2, signifying possible hydrogen sulfide (H2S) generation by archaea.
The detected methanogens represented three metabolic pathways. Two acetoclastic (Methanosaeta, Methanosarcina), four hydrogenotrophic (Methanococcus, Methanoculleus, Methanosarcina, Methanothermobacter), and four methylotrophic (Methanomassiliicoccus, Methanomethylovorans, Methanococcoides, and Methanosalsum) genera were found in all samples.
Methanococcus was the only archaea present in all FD and SD plants (share ≥0.5%), ranging between 26.8% and 65.9% (highest in G_SD). At the same time, Methanococcus is an archaeon that prevails in most plants, independent of feedstock origin.
In FD plants, in addition to Methanococcus, Methanococcoides (4.4–2.9%, highest in B_FD) and Methanosalsum (9.3–16.7%, highest in D_FD) were commonly present. SD plants only had one specific archaeal genus, Methanosarcina (1.1–21.5%, highest in E_SD).
Due to the diverse metabolism of the archaea, they were associated with specific metabolic groups, as shown in Table 2 and in Figure 3 (Methanosarcina was equally distributed between acetoclastic and hydrogenotrophic pathways). The hydrogenotrophic pathway prevailed in most of the plants studied; nevertheless, a clear difference between FD and SD plants is evident. In SD plants, the hydrogenotrophic pathway substantially prevailed, with a 58.9–66.4% share. The proportions of acetoclastic and methylotrophic pathways in SD plants were minor, and in the range of 0.6–12.3% and 0.3–14.2%, respectively. These results contradict those of previous studies, where the prevailing acetoclastic pathway was found to be characteristic of SD plants, with Methanosaeta frequently observed to be the dominant methanogen [39]. Even if the TAN concentration in SD plants was lower than that in FD plants, this discrepancy could be attributed to Methanosaeta inhibition by TAN; it has been reported that Methanosaeta can be inhibited even at TAN concentrations as low as 0.6 g/L [9]. Another fact that can be correlated with hydrogenotroph dominance in SD plants is the Candidatus Accumulibacter augmented with fed SE. As already mentioned in Section 3.2.1, Candidatus Accumulibacter prevailed in SD plants. Its potential activity in the presence of acetate could lead to H2 generation, facilitating CH4 generation primarily by Methanococcus, the dominating hydrogenotrophic methanogen.
In contrast, the FD plants were mostly characterized by a balance between hydrogenotrophic and methylotrophic pathways, occupying ranges of 38.3–45.1% and 13.7–38.9%, respectively. Usually, in mesophilic AD, a balance between acetoclastic and hydrogenotrophic methanogens or the dominance of one of them is observed [40]. Similar results were obtained only for the C_FD plant, where the acetoclastic pathway (Methanosaeta) dominated with a slight advantage over the hydrogenotrophic pathway. The most prevalent methylotrophs in FD plants were Methanococcoides and Methanosalsum. Methylotrophic methanogens are common in marine and hypersaline, sulfate-rich sediments where they utilize methylated compounds such as trimethylamine, dimethyl sulfate, and methanol [41]. This implies that the feedstock of FD plants had a higher salinity compared to that of SD plants, and that methanol or other methylated compounds could either be present in the feedstock or are generated at FD plants. Nevertheless, the substantial differences in HRT, OLR, and TAN among the studied FD plants did not significantly influence the archaeal methane production pathway (except in C_FD).

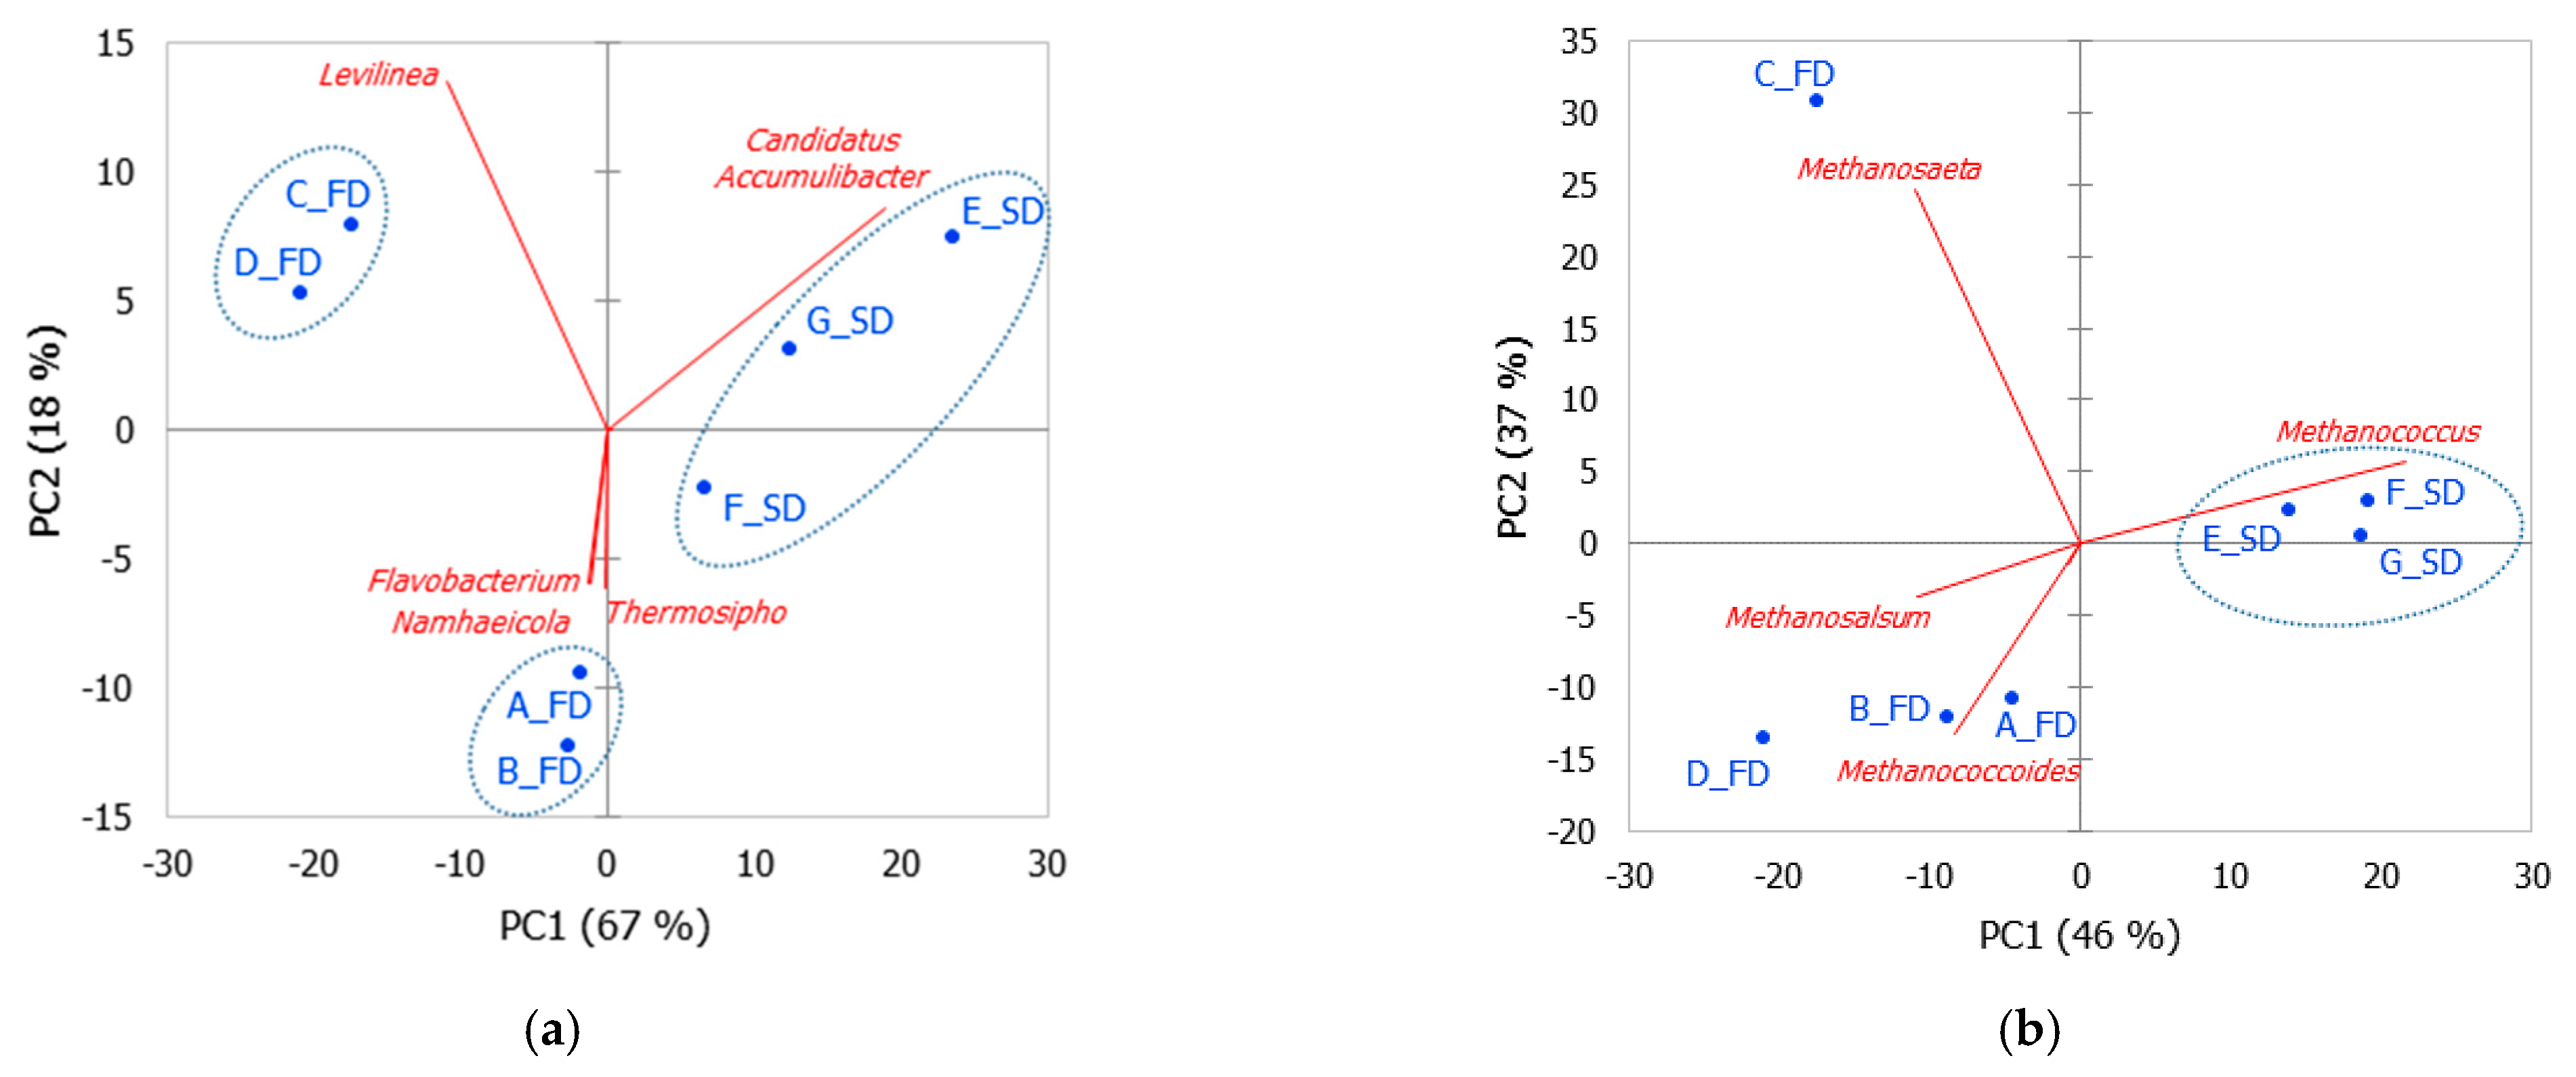
3.3. Principal Component Analysis

The correlations between the archaeal and bacterial communities were studied using PCA (Figure 4). As shown in Figure 4a, bacterial PCA clearly distinguished between the FD and SD plants, while differentiation based on the proportion of sludge and presence of FW or FWL in the feedstock was not achieved. The FD plants were additionally segregated into two groups: one including A_FD and B_FD, and another with C_FD and D_FD; segregation was achieved based on differences in TAN and OLR between these groups. Lower TAN (1.1–1.3 g/L) and HRT (14.8–19 d) were observed at the A_FD and B_FD plants compared to the C_FD and D_FD plants, which exhibited higher TAN (2.0–2.5 g/L) and HRT (22–39 d). The idea of bacterial genera distinguishing FD plants suggests the impact of substrate properties (i.e., TAN) on bacterial community structure. A similar differentiation in microbial community based on TAN presence was reported by De Vrieze et al. (2015) [7]. The divergence of bacterial FD plants from SD plants was mainly based on four bacterial genera. Levilinea was characteristic of C_FD and D_FD plants (high TAN and OLR), while Flavobacterium, Namhaeicola, and Thermosipho were characteristic of A_FD and B_FD plants (low TAN and OLR). Lower TAN at A_FD and B_FD plants was related to the short HRT. A previous study reported that TAN level decreased when HRT was shortened, and this could be due to the insufficient contact time to allow for the hydrolysis of protein compounds of the FW [42]. As already mentioned, Candidatus Accumulibacter was frequently found to be dominant in SD plants due to microbial immigration. Therefore, in the bacterial PCA plot, Candidatus Accumulibacter was a critical bacterial genus distinguishing SD plants from FD plants.
The archaeal PCA also facilitated the segregation of FD and SD plants (Figure 4b). A tighter grouping of SD plants can be observed on archaeal PCA compared to the bacterial plot. FD plants were characterized by a looser grouping, and the archaeal structure at the C_FD plant was significantly different from that at other plants. The four archaeal genera mostly shaped archaeal PCA. Methanococcus distinguished SD plants from FD plants, while Methanosalsum and Methanosarcina differentiated A_FD, B_FD, and D_FD. The presence of Methanosaeta led to the segregation of the C_FD plant from other plants.

4. Conclusions

The SD plants were characterized by lower diversity and evenness of microbial population compared to FD plants. Candidatus Accumulibacter dominated SD plants (up to 42.1%) due to secondary sludge (up to 89%) fed to the plants. Its potential role in H2 production was hypothesized, and confirmed by hydrogenotrophic methanogen dominance (Methanococcus) at SD plants. The presence of Flavobacterium and Levilinea played an important role in acidogenesis in FD plants, with Levilinea found to be sensitive to feedstock characteristics, that is, TAN presence. The hydrogenotrophic pathway substantially prevailed in SD plants (Methanococcus), while a balance between hydrogenotrophic and methylotrophic (Methanococcoides and Methanosalsum) pathways was found for most FD plants. Interestingly, the differences in HRT, OLR, and TAN between FD plants did not significantly influence the archaeal methane production pathway. Both at FD and SD plants, the bacterial genera responsible for acetate production through syntrophic reaction and homoacetogenesis (Smithella and Treponema) were found to be greater than or equal to 0.5%.

Author Contributions

Writing—original draft preparation, M.S.; formal analysis, H.-S.M.; investigation, D.L.; writing—review, editing, and supervision, Y.-M.Y. All authors have read and agreed to the published version of the manuscript.

Funding

This research was supported by the Korea Ministry of Environment as part of the Waste to Energy-Recycling Human Resource Development Project (YL-WE-19-002). This work was also supported by a grant from the National Institute of Environmental Research (NIER) funded by the Ministry of Environment (MOE) of the Republic of Korea (NIER-2018-01-01-044).

Institutional Review Board Statement

Not applicable.

Informed Consent Statement

Not applicable.

Data Availability Statement

Not applicable.

Conflicts of Interest

The authors declare that they have no known competing financial interests or personal relationships that could have appeared to influence the work reported in this paper.

References

  1. Cherubini, F.; Bargigli, S.; Ulgiati, S. Life cycle assessment (LCA) of waste management strategies: Landfill, sorting plant, and incineration. Energy 2009, 34, 2116–2123. [Google Scholar] [CrossRef]
  2. Evangelisti, S.; Lettieri, P.; Borello, D.; Clift, R. Life cycle assessment of energy from waste via anaerobic digestion: A case study in the UK. Waste Manag. 2014, 34, 226–237. [Google Scholar] [CrossRef] [PubMed]
  3. Pilli, S.; Yan, S.; Tyagi, R.D.; Surampalli, R.Y. Thermal pretreatment of sewage sludge to enhance anaerobic digestion: A review. Crit. Rev. Environ. Sci. Technol. 2015, 45, 669–702. [Google Scholar]
  4. Ministry of Environment. The State of Municipal Waste Generation and Treatment in 2012; Ministry of Environment: Seoul, Korea, 2019.
  5. Angenent, L.T.; Karim, K.; Al-Dahhan, M.H.; Wrenn, B.A.; Domíguez-Espinosa, R. Production of bioenergy and biochemicals from industrial and agricultural wastewater. Trends Biotechnol. 2004, 22, 477–485. [Google Scholar] [CrossRef]
  6. Hassa, J.; Maus, I.; Off, S.; Pühler, A.; Scherer, P.; Klocke, M.; Schlüter, A. Metagenome, metatranscriptome, and metaproteome approaches unraveled the composition and functional relationships of microbial communities residing in biogas plants. Appl. Microbiol. Biotechnol. 2018, 102, 5045–5063. [Google Scholar] [CrossRef] [Green Version]
  7. De Vrieze, J.; Saunders, A.M.; He, Y.; Fang, J.; Nielsen, P.H.; Verstraete, W.; Boon, N. Ammonia and temperature determine potential clustering in the anaerobic digestion microbiome. Water Res. 2015, 75, 312–323. [Google Scholar] [CrossRef]
  8. Kim, E.; Lee, J.; Han, G.; Hwang, S. Comprehensive analysis of microbial communities in full-scale mesophilic and thermophilic anaerobic digesters treating food waste-recycling wastewater. Bioresour. Technol. 2018, 259, 442–450. [Google Scholar]
  9. Smith, A.L.; Shimada, T.; Raskin, L. A comparative evaluation of community structure in full-scale digesters indicates that two-phase digesters exhibit greater microbial diversity than single-phase digesters. Environ. Sci. Water Res. Technol. 2017, 3, 304–311. [Google Scholar] [CrossRef]
  10. Kirkegaard, R.H.; McIlroy, S.J.; Kristensen, J.M.; Nierychlo, M.; Karst, S.M.; Dueholm, M.S.; Albertsen, M.; Nielsen, P.H. Impact of immigration on microbial community composition in full-scale anaerobic digesters. Sci. Rep. 2017, 7, 9343. [Google Scholar] [CrossRef]
  11. Zhang, Q.; Wang, M.; Ma, X.; Gao, Q.; Wang, T.; Shi, X.; Zhou, J.; Zuo, J.; Yang, Y. High variations of methanogenic microorganisms drive the full-scale anaerobic digestion process. Environ. Int. 2019, 126, 543–551. [Google Scholar] [CrossRef]
  12. Yun, Y.M.; Shin, H.S.; Lee, C.K.; Oh, Y.K.; Kim, H.W. Inhibition of residual n-hexane in anaerobic digestion of lipid-extracted microalgal wastes and microbial community shift Environ. Sci. Pollut. Res. 2016, 23, 7138–7145. [Google Scholar] [CrossRef]
  13. DeLong, E.F. Archaea in coastal marine environments. Proc. Natl. Acad. Sci. USA. 1992, 89, 5685–5689. [Google Scholar] [CrossRef] [Green Version]
  14. Ovreås, L.; Forney, L.; Daae, F.L.; Torsvik, V. Distribution of bacterioplankton in meromictic Lake Saelenvannet, as determined by denaturing gradient gel electrophoresis of PCR-amplified gene fragments coding for 16S rRNA. Appl. Environ. Microbiol. 1997, 63, 3367–3373. [Google Scholar] [CrossRef] [Green Version]
  15. Caporaso, J.G.; Kuczynski, J.; Stombaugh, J.; Bittinger, K.; Bushman, F.D.; Costello, E.K.; Fierer, N.; Peña, A.G.; Goodrich, J.K.; Gordon, J.I.; et al. QIIME allows the analysis of high-throughput community sequencing data. Nat. Methods 2010, 7, 335–336. [Google Scholar] [CrossRef] [Green Version]
  16. Li, W.; Fu, L.; Niu, B.; Wu, S.; Wooley, J. Ultrafast clustering algorithms for metagenomic sequence analysis. Brief. Bioinform. 2012, 13, 656–668. [Google Scholar]
  17. Cole, J.R.; Wang, Q.; Cardenas, E.; Fish, J.; Chai, B.; Farris, R.J.; Kulam-Syed-Mohideen, A.S.; McGarrell, D.M.; Marsh, T.; Garrity, G.M. The Ribosomal Database Project: Improved alignments and new tools for rRNA analysis. Nucleic Acids Res. 2009, 37, 141–145. [Google Scholar] [CrossRef] [Green Version]
  18. Letunic, I.; Bork, P. Interactive tree of life (iTOL) v4: Recent updates and new developments. Nucleic Acids Res. 2019, 47, W256–W259. [Google Scholar] [CrossRef] [Green Version]
  19. APHA. Standard Methods for the Examination of Water and Wastewater, 20th ed.; USA American Public Health Association: Washington, DC, USA, 1998. [Google Scholar]
  20. Morales-Polo, C.; del Mar Cledera-Castro, M.; Moratilla Soria, B.Y. Reviewing the anaerobic digestion of food waste: From waste generation and anaerobic processes to its perspectives. Appl. Sci. 2018, 8, 1804. [Google Scholar] [CrossRef] [Green Version]
  21. Chen, H.; Wang, W.; Xue, L.; Chen, C.; Liu, G.; Zhang, R. Effects of ammonia on the anaerobic digestion of food waste: Process performance and microbial community. Energy Fuels 2016, 30, 5749–5757. [Google Scholar] [CrossRef]
  22. Lu, H.; Oehmen, A.; Virdis, B.; Keller, J.; Yuan, Z. Obtaining highly enriched cultures of Candidatus Accumulibacter phosphates through alternating carbon sources. Water Res. 2006, 40, 3838–3848. [Google Scholar] [CrossRef]
  23. Camejo, P.Y.; Owen, B.R.; Martirano, J.; Ma, J.; Kapoor, V.; Santo Domingo, J.; McMahon, K.D.; Noguera, D.R. Candidatus Accumulibacter phosphatis clades enriched under cyclic anaerobic and microaerobic conditions simultaneously use different electron acceptors. Water Res. 2016, 102, 125–137. [Google Scholar] [CrossRef] [PubMed] [Green Version]
  24. Oyserman, B.O.; Noguera, D.R.; Del Rio, T.G.; Tringe, S.G.; McMahon, K.D. Metatranscriptomic insights on gene expression and regulatory controls in Candidatus Accumulibacter phosphatis. ISME J. 2016, 10, 810–822. [Google Scholar] [CrossRef] [PubMed] [Green Version]
  25. Kim, W.; Shin, S.G.; Han, G.; Cho, K.; Hwang, S. Structures of microbial communities found in anaerobic batch runs that produce methane from propionic acid--seeded from full-scale anaerobic digesters above a certain threshold. J. Biotechnol. 2015, 214, 192–198. [Google Scholar] [CrossRef] [PubMed]
  26. Chakraborty, R.; O’Connor, S.M.; Chan, E.; Coates, J.D. Anaerobic degradation of benzene, toluene, ethylbenzene, and xylene compounds by Dechloromonas strain RCB. Appl. Environ. Microbiol. 2005, 71, 8649–8655. [Google Scholar] [CrossRef] [PubMed] [Green Version]
  27. Horn, M.A.; Ihssen, J.; Matthies, C.; Schramm, A.; Acker, G.; Drake, H.L. Dechloromonas denitrificans sp. nov., Flavobacterium denitrificans sp. nov., Paenibacillus anaericanus sp. nov., and Paenibacillus terrae strain MH72, and N2O-producing bacteria isolated from the gut of the earthworm Aporrectodea caliginosa. Int. J. Syst. Evol. Microbiol. 2005, 55, 1255–1265. [Google Scholar] [CrossRef]
  28. Breitenstein, A.; Wiegel, J.; Haertig, C.; Weiss, N.; Andreesen, J.R.; Lechner, U. Reclassification of Clostridium hydroxybenzoicum as Sedimentibacter hydroxybenzoicus gen. nov., comb. nov., and description of Sedimentibacter saalensis sp. nov. Int. J. Syst. Evol. Microbiol. 2002, 52, 801–807. [Google Scholar]
  29. Gong, W.; Xie, B.; Deng, S.; Fan, Y.; Tang, X.; Liang, H. Enhancement of anaerobic digestion effluent treatment by microalgae immobilization: Characterized by fluorescence excitation-emission matrix coupled with parallel factor analysis in the photobioreactor. Sci. Total Environ. 2019, 678, 105–113. [Google Scholar] [CrossRef]
  30. Keating, C.; Chin, J.P.; Hughes, D.; Manesiotis, P.; Cysneiros, D.; Mahony, T.; Smith, C.J.; McGrath, J.W.; O’Flaherty, V. Biological phosphorus removal during high-rate, low-temperature, anaerobic digestion of wastewater. Front. Microbiol. 2016, 7, 226. [Google Scholar] [CrossRef] [Green Version]
  31. Hemp, J.; Ward, L.M.; Pace, L.A.; Fischer, W.W. Draft genome sequence of Levilinea saccharolytica KIBI-1, a member of the Chloroflexi class Anaerolineae. Genome Announc. 2015, 3, e01357-15. [Google Scholar] [CrossRef] [Green Version]
  32. Yamada, T.; Sekiguchi, Y.; Hanada, S.; Imachi, H.; Ohashi, A.; Harada, H.; Kamagata, Y. Anaerolinea thermolimosa sp. nov., Levilinea saccharolytica gen. nov., sp. nov. and Leptolinea tardivitalis gen. nov., sp. nov., novel filamentous anaerobes, and description of the new classes Anaerolineae classis nov. and Caldilineae classis nov. in the bacterial phylum Chloroflexi. Int. J. Syst. Evol. Microbiol. 2006, 56, 1331–1340. [Google Scholar]
  33. Wang, S.; Hou, X.; Su, H. Exploration of the relationship between biogas production and microbial community under high salinity conditions. Sci. Rep. 2017, 7, 1149. [Google Scholar]
  34. Takai, K.; Abe, M.; Miyazaki, M.; Koide, O.; Nunoura, T.; Imachi, H.; Inagaki, F.; Kobayashi, T. Sunxiuqinia faeciviva sp. nov., a facultatively anaerobic organoheterotroph of the Bacteroidetes isolated from deep subseafloor sediment. Int. J. Syst. Evol. Microbiol. 2013, 63, 1602–1609. [Google Scholar] [CrossRef] [PubMed]
  35. Takai, K.; Horikoshi, K. Thermosipho japonicus sp. nov., an extremely thermophilic bacterium isolated from a deep-sea hydrothermal vent in Japan. Extremophiles 2000, 4, 9–17. [Google Scholar] [CrossRef] [PubMed]
  36. Nesbø, C.L.; Bradnan, D.M.; Adebusuyi, A.; Dlutek, M.; Petrus, A.K.; Foght, J.; Doolittle, W.F.; Noll, K.M. Mesotoga prima gen. nov., sp. nov., the first described mesophilic species of Thermotogales. Extremophiles 2012, 16, 387–393. [Google Scholar] [CrossRef]
  37. Ueki, A.; Akasaka, H.; Suzuki, D.; Ueki, K. Paludibacter propionicigenes gen. nov., sp. nov., a novel strictly anaerobic, gram-negative, propionate-producing bacterium isolated from plant residue in irrigated rice-field soil in Japan. Int. J. Syst. Evol. Microbiol. 2006, 56, 39–44. [Google Scholar] [CrossRef] [Green Version]
  38. Singleton, D.R.; Lee, J.; Dickey, A.N.; Stroud, A.; Scholl, E.H.; Wright, F.A.; Aitken, M.D. Polyphasic characterization of four soil-derived phenanthrene-degrading Acidovorax strains and the proposal of Acidovorax carolinensis sp. nov. Syst. Appl. Microbiol. 2018, 41, 460–472. [Google Scholar]
  39. Sun, W.; Li, Y.; McGuinness, L.R.; Luo, S.; Huang, W.; Kerkhof, L.J.; Mack, E.E.; Häggblom, M.M.; Fennell, D.E. Identification of anaerobic aniline-degrading bacteria at a contaminated industrial site. Environ. Sci. Technol. 2015, 49, 11079–11088. [Google Scholar] [CrossRef]
  40. Zamanzadeh, M.; Hagen, L.H.; Svensson, K.; Linjordet, R.; Horn, S.J. Anaerobic digestion of food waste: Effect of recirculation and temperature on performance and microbiology. Water Res. 2016, 96, 246–254. [Google Scholar] [CrossRef]
  41. Lyu, Z.; Shao, N.; Akinyemi, T.; Whitman, W.B. Methanogenesis. Curr. Biol. 2018, 28, R727–R732. [Google Scholar] [CrossRef] [Green Version]
  42. Musa, M.A.; Idrus, S. Effect of Hydraulic Retention Time on the Treatment of Real Cattle Slaughterhouse Wastewater and Biogas Production from HUASB Reactor. Water 2020, 12, 490. [Google Scholar] [CrossRef] [Green Version]
Figure 1. The bacterial genera share and phylogenic tree of seven full-scale anaerobic digestion plants treating food waste and sewage sludge (share ≥ 0.5%) (OTU—operational taxonomic units).
Energies 14 00665 g001
Figure 2. The archaeal genera share and phylogenic tree of seven full-scale anaerobic digestion plants treating food waste and sewage sludge (OTUs—operational taxonomic units).
Energies 14 00665 g002
Figure 3. Metabolic share of methanogens of seven full-scale anaerobic digestion plants treating food waste and sewage sludge.
Energies 14 00665 g003
Figure 4. Principal component analysis of bacteria (a) and archaea (b) in seven full-scale anaerobic digestion plants treating food waste and sewage sludge (plots indicate only the most influential loadings).
Energies 14 00665 g004
Table 1. Characteristics and operational parameters of seven full-scale anaerobic digestion plants treating food waste and sewage sludge.
PlantsFeedstock Mixing Ratio (%:%)Reactor Volume
(1000 m3)
f HRT (day)InfluentEffluentCH4 Yield
(m3 CH4/kg VS)
pH
Feedstock Concentration
(g COD/L)
g C/Nh OLR
(kg VS/m3/d)
Nutrient (%)i VFA (g/L)j TAN (g/L)T-Alkalinity (g CaCO3/L)
ProteinFatCarbohydrate
A_FDa FW:b S
(94:6)
281918 ± 1.18.2 ± 0.21.5 ± 0.044.723.332.00.21 ± 0.01.3 ± 0.13.8 ± 0.20.3 ± 0.08.0 ± 0.1
B_FDc FWL:S
(72:28)
3914.838 ± 0.58.0 ± 0.12.6 ± 0.146.231.622.20.28 ± 0.01.1 ± 0.03.7 ± 0.10.24 ± 0.17.9 ± 0.1
C_FDFWL:S
(83:17)
752236 ± 0.610.1 ± 1.00.9 ± 0.045.241.013.90.27 ± 0.12.0 ± 0.25.1 ± 0.20.41 ± 0.18.0 ± 0.1
D_FDFWL:S
(96:4)
1803954 ± 0.17.0 ± 0.10.8 ± 0.155.735.19.20.54 ± 0.12.5 ± 0.15.0 ± 0.30.30 ± 0.28.2 ± 0.2
E_SDd PS:e SE
(11:89)
17.517.322 ± 0.16.4 ± 0.61.6 ± 0.158.226.914.90.80 ± 0.10.8 ± 0.02.5 ± 0.00.28 ± 0.17.9 ± 0.1
F_SDPS:SE
(59:41)
212849 ± 1.87.3 ± 0.51.4 ± 0.044.313.642.10.32 ± 0.01.1 ± 0.03.1 ± 0.00.14 ± 0.17.9 ± 0.0
G_SDPS:SE
(47:35:18)
25.123618 ± 1.16.1 ± 0.10.6 ± 0.066.410.523.10.25 ± 0.00.8 ± 0.02.2 ± 0.10.24 ± 0.07.6 ± 0.1
a FW—food waste; b S—sludge (mix of primary and secondary sludge); c FWL—food waste leachate; d PS—primary sludge; e SE—secondary sludge; f HRT—hydraulic retention time; g C/N—carbon/nitrogen; h OLR—organic loading rate; i VFA—volatile fatty acid; j TAN—total ammonium nitrogen.
Table 2. Metabolic association of archaea observed in seven full-scale anaerobic digestion plants treating food waste and sewage sludge (genus level according to Figure 2).
GenusMetabolism
Stygiolobuschemolithotrophic (S0+H2)
Methanomassiliicoccusmethylotrophic
Methanococcushydrogenotrophic
Methanothermobacterhydrogenotrophic
Methanoculleushydrogenotrophic
Methanosaetaacetoclastic
Methanosarcinaacetoclastic and hydrogenotrophic
Methanomethylovoransmethylotrophic
Methanococcoidesmethylotrophic
Methanosalsummethylotrophic
Publisher’s Note: MDPI stays neutral with regard to jurisdictional claims in published maps and institutional affiliations.

