Article

Theoretical Study of CO Adsorption and Activation on Orthorhombic Fe7C3(001) Surfaces for Fischer–Tropsch Synthesis Using Density Functional Theory Calculations

1
Corporate R & D Institute, Samsung Electro-Mechanics Co., Ltd., 150, Maeyoung-ro, Yeongtong-gu, Suwon 16674, Korea
2
C1 Gas & Carbon Convergent Research Center, Korea Research Institute of Chemical Technology, Daejeon 34114, Korea
*
Authors to whom correspondence should be addressed.
Energies 2021, 14(3), 563; https://doi.org/10.3390/en14030563
Submission received: 5 January 2021 / Revised: 18 January 2021 / Accepted: 19 January 2021 / Published: 22 January 2021
(This article belongs to the Special Issue Design and Application of Innovation Catalysts for Hydrogenation)

Abstract

:
Fischer–Tropsch synthesis (FTS), which converts CO and H2 into useful hydrocarbon products, has attracted considerable attention as an efficient method to replace crude oil resources. Fe-based catalysts are mainly used in industrial FTS, and Fe7C3 is a common carbide phase in the FTS reaction. However, the intrinsic catalytic properties of Fe7C3 are theoretically unknown. Therefore, as a first attempt to understand the FTS reaction on Fe7C3, direct CO* dissociation on orthorhombic Fe7C3(001) (o-Fe7C3(001)) surfaces was studied using density functional theory (DFT) calculations. The surface energies of 14 terminations of o-Fe7C3(001) were first compared, and the results showed that (001)0.20 was the most thermodynamically stable termination. Furthermore, to understand the effect of the surface C atom coverage on CO* activation, C–O bond dissociation was performed on the o-Fe7C3(001)0.85, (001)0.13, (001)0.20, (001)0.09, and (001)0.99 surfaces, where the surface C atom coverages were 0.00, 0.17, 0.33, 0.33, and 0.60, respectively. The results showed that the CO* activation linearly decreased as the surface C atom coverage increased. Therefore, it can be concluded that the thermodynamic and kinetic selectivity toward direct CO* dissociation increased when the o-Fe7C3(001) surface had more C* vacancies.

1. Introduction

FTS based on transition metal catalytic reactions converts CO and H2 into industrially useful products, such as hydrocarbons and oxygenated compounds. FTS is a non-petroleum process that uses a synthetic gas (syngas) as a feed material generated from natural gas, shale gas, coal, or biomass. Therefore, FTS has attracted considerable attention as an efficient method to replace crude oil resources, and it could ultimately become an economical and environmentally friendly means for using carbon-based energy [1,2].
The activity and selectivity of the FTS reaction are strongly dependent on the transition metal catalysts. In general, Ru-, Co-, and Fe-based catalysts are used, among them, Fe-based catalysts are widely used in industrial FTS because of their low cost and high intrinsic activity. Fe-based catalysts can produce a wide range of useful hydrocarbons, such as light olefins, gasoline, and long-chain hydrocarbons, depending on the process conditions. At the beginning of the reaction, Fe-based catalysts exist as various iron oxide phases, such as α-Fe2O3, γ-Fe2O3, FeOOH, Fe3O4, and FeO. However, most of these phases are converted into carbide phases under FTS conditions [3,4,5]. Therefore, iron carbides are known to directly contribute to FTS reactions. In previous theoretical and experimental studies, the phases of χ-Fe5C2, Fe7C3, θ-Fe3C, and η-Fe2C were observed under FTS conditions, and χ-Fe5C2 has been found to be the most catalytically active carbide phase [6,7]. Fe7C3 is also a common phase that is formed in the FTS reaction, and its formation is known to be more favorable than those of other carbides under severe conditions, such as those of industrial FTS reactions [8,9,10]. Recently, Chang et al. showed that Fe7C3 exhibited the highest intrinsic activity among three candidate carbides (η-Fe2C, Fe7C3, and χ-Fe5C2) under typical moderate temperatures in FTS conditions [10]. Thus, the presence and reactivity of Fe7C3 in the FTS reaction have been observed experimentally. However, theoretical studies on the intrinsic properties of this carbide catalyst are limited. Therefore, a systematic theoretical study is required.
In the FTS reaction, the formations of light olefins and long-chain hydrocarbons are initiated by the dissociation of C–O bonds [11,12]. Therefore, direct CO dissociation is one of the most important elementary reactions, which determine the intrinsic and overall reaction activity of the FTS catalyst. In general, direct CO dissociation is thermodynamically favorable on iron carbide surfaces because of the high stabilization of the dissociation products, such as C* and O* (* denotes the surface) [9,13]. However, the CO activation depends on the surface termination and carbon passivation of the iron carbide surfaces. For example, using the DFT, Ozbek et al. reported that direct CO dissociation was not energetically feasible on a carbon-saturated χ-Fe5C2 surface, while it was possible on a metal-like surface, i.e., χ-Fe5C2 with no C atoms [13]. This result indicates that surface termination has a significant effect on the adsorption and dissociation of CO. Furthermore, under FTS conditions, as C passivation continuously occurs on the surfaces, it is difficult to ignore the effect of the C atoms on the surface reactions [13,14,15]. Therefore, it is necessary to understand how the surface terminations and surface C coverage affect the CO activation on the Fe7C3 surface. We believe that understanding the CO activation on Fe7C3 with different surface terminations and C* coverages will make it possible to better understand the intrinsic catalytic properties of Fe7C3.
In this study, DFT calculations were performed to determine the preferred CO dissociation pathways on orthorhombic Fe7C3 (o-Fe7C3). Specifically, o-Fe7C3(001) was selected as the simulation surface because it shows the lowest surface energy among the three low-Miller-index surfaces ((100), (010), and (001)) [9]. First, the surface energies of various terminations of o-Fe7C3 were calculated, and their stabilities and ranks were determined. Then, the adsorption behaviors of CO*, C*, and O* on the selected o-Fe7C3(001) surfaces were investigated. Furthermore, the reaction and activation energies for direct CO dissociation pathways on the o-Fe7C3(001) surfaces were evaluated. Finally, the effects of the o-Fe7C3 surface on the surface energies and direct CO dissociation pathways were investigated.

2. Computational Method

The crystal structure of bulk o-Fe7C3, which is shown in Figure 1, was used to model the (001) surface. The optimized lattice constants were a = 6.857, b = 11.762, and c = 4.517 (α = β = γ = 90°) for a bulk structure of o-Fe7C3 with the space group Pnma, which were in agreement with the previously observed experimental values [16]. The images of Fe7C3(001) slabs and the molecular configurations of CO* and C* on these surfaces were provided in Supplementary Materials. The o-Fe7C3(001) slabs were simulated using a 2 × 2 unit cell with an eight-layer model (112 Fe and 48 C atoms), where the bottom half layers were fixed, and the others were relaxed (see Figure S1 in the Supplementary Materials). The surface energies of the o-Fe7C3(001) surfaces with different terminations were evaluated (see Section 3.1).
All the calculations were performed within the framework of spin-polarized DFT implemented in the Vienna Ab initio Simulation Package (VASP) [17,18,19]. The projector augmented wave (PAW) method was used to treat the ion–electron interactions [20]. The effects of exchange-correlation were described by the generalized gradient approximation (GGA) in the form of the Perdew–Burke–Ernzerhof (PBE) functional [21]. A vacuum of 15 Å was applied between the slabs, while a dipole correction was applied in the normal direction of the surface. Further, Gaussian smearing with a width of 0.05 eV was applied for the Fermi level. The energy cutoff for the plane-wave basis was set at 400 eV. A conjugated-gradient algorithm was used to optimize the atomic positions, where the criteria of convergence for the energy and force were set to 10−5 eV and 0.05 eV/Å, respectively. A 4 × 4 × 1 k-point mesh was selected for the Brillouin zone integration using the Monkhorst–Pack scheme. All the transition states for the CO dissociation on the o-Fe7C3(001) surfaces were obtained using the climbing image nudged elastic band (CINEB) method [22]. Zero-point energy (ZPE) corrections from the vibrational frequencies were applied to all the calculations. Details of the chemical potential calculations of the gas phase and surface species at temperature T and pressure P are provided in the references [15,23,24]. In this study, the enthalpy and entropy changes (from 0 K to T) of CO(g) were calculated using the experimental data reported in the JANAF thermochemical tables [25]. Furthermore, the internal energy change and entropy values of the CO*, C*, and O* species at T were calculated using vibrational modes based on the frustrated translation and rotation on the surface [24]. The standard pressure (P0) and P for CO(g) are 1 bar and 1.03 bar, respectively, while the T of the CO dissociation reaction is 613.15 K [15].
The harmonic transition state theory (HTST) was adopted to evaluate the relative CO* dissociation activities on the o-Fe7C3(001) surfaces with different terminations [26]. This theory made it possible to determine whether the kinetic barrier energies could be energetically surmounted and reach an observable rate at the reaction temperature. In the HTST, the reaction rate constant, k, can be expressed as follows:
k = ν · exp ( Δ G TS k B T ) ,
where ν is the pre-exponential factor, ΔGTS is the activation barrier energy, kB is the Boltzmann constant, and T is the reaction temperature. The pre-exponential factor can be calculated using the vibrational frequencies of the initial and transition states [26]:
ν =   1 N ν i   1 N 1 ν j T S ,
where νi are the vibrational frequencies associated with the initial state, and νjTS are the real vibrational frequencies associated with the transition state.
The free energy of CO dissociation is calculated as follows:
ΔG = ΔE + ΔZPE + ΔH − TΔS,
where ΔE, ΔZPE, ΔH, and TΔS denote the changes in the DFT energy, zero-point energy, enthalpy, and entropy, respectively, during the CO dissociation process.

3. Results and Discussion

This section discusses the surface energies of the o-Fe7C3(001) terminations and molecular adsorption/chemical bond dissociation of CO on the o-Fe7C3(001) surfaces. The C atom at the o-Fe7C3(001) termination, i.e., the bulk C atom exposed to the surface, is denoted as the surface C atom. The CO, C, and O adsorbed on the o-Fe7C3(001) surface from the CO(g) adsorption and dissociation are denoted as CO*, C*, and O*, respectively.

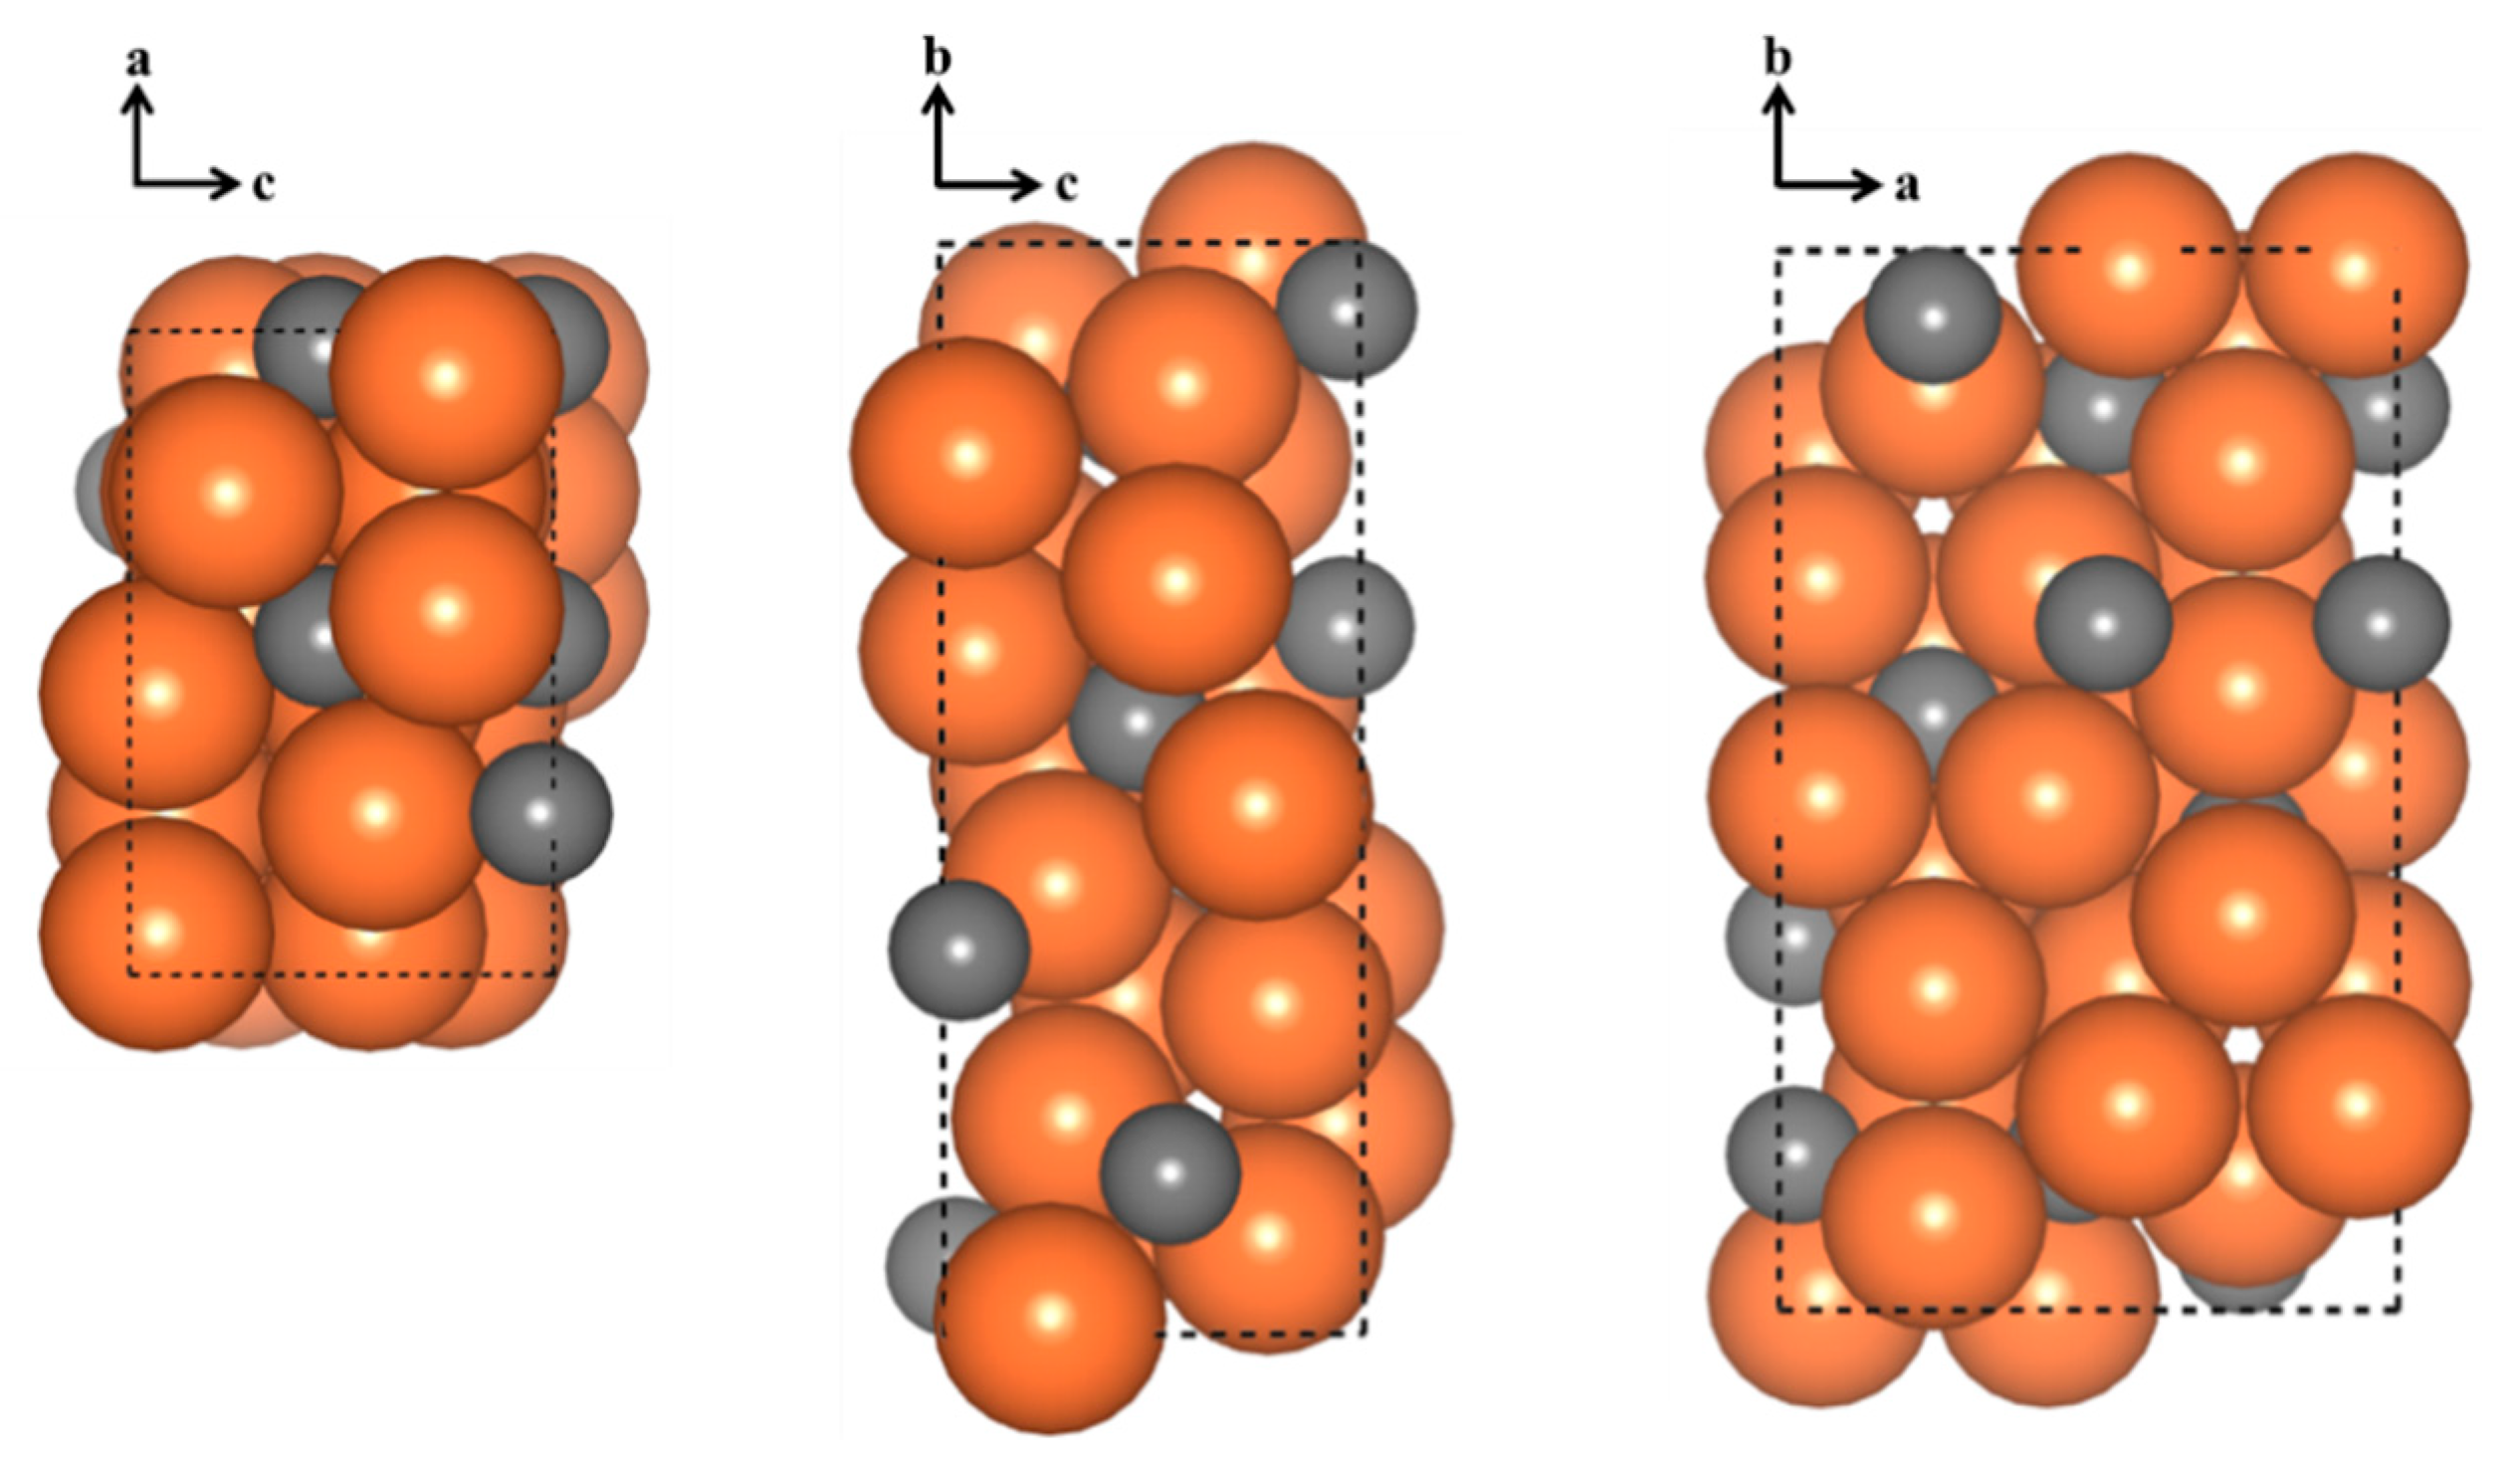
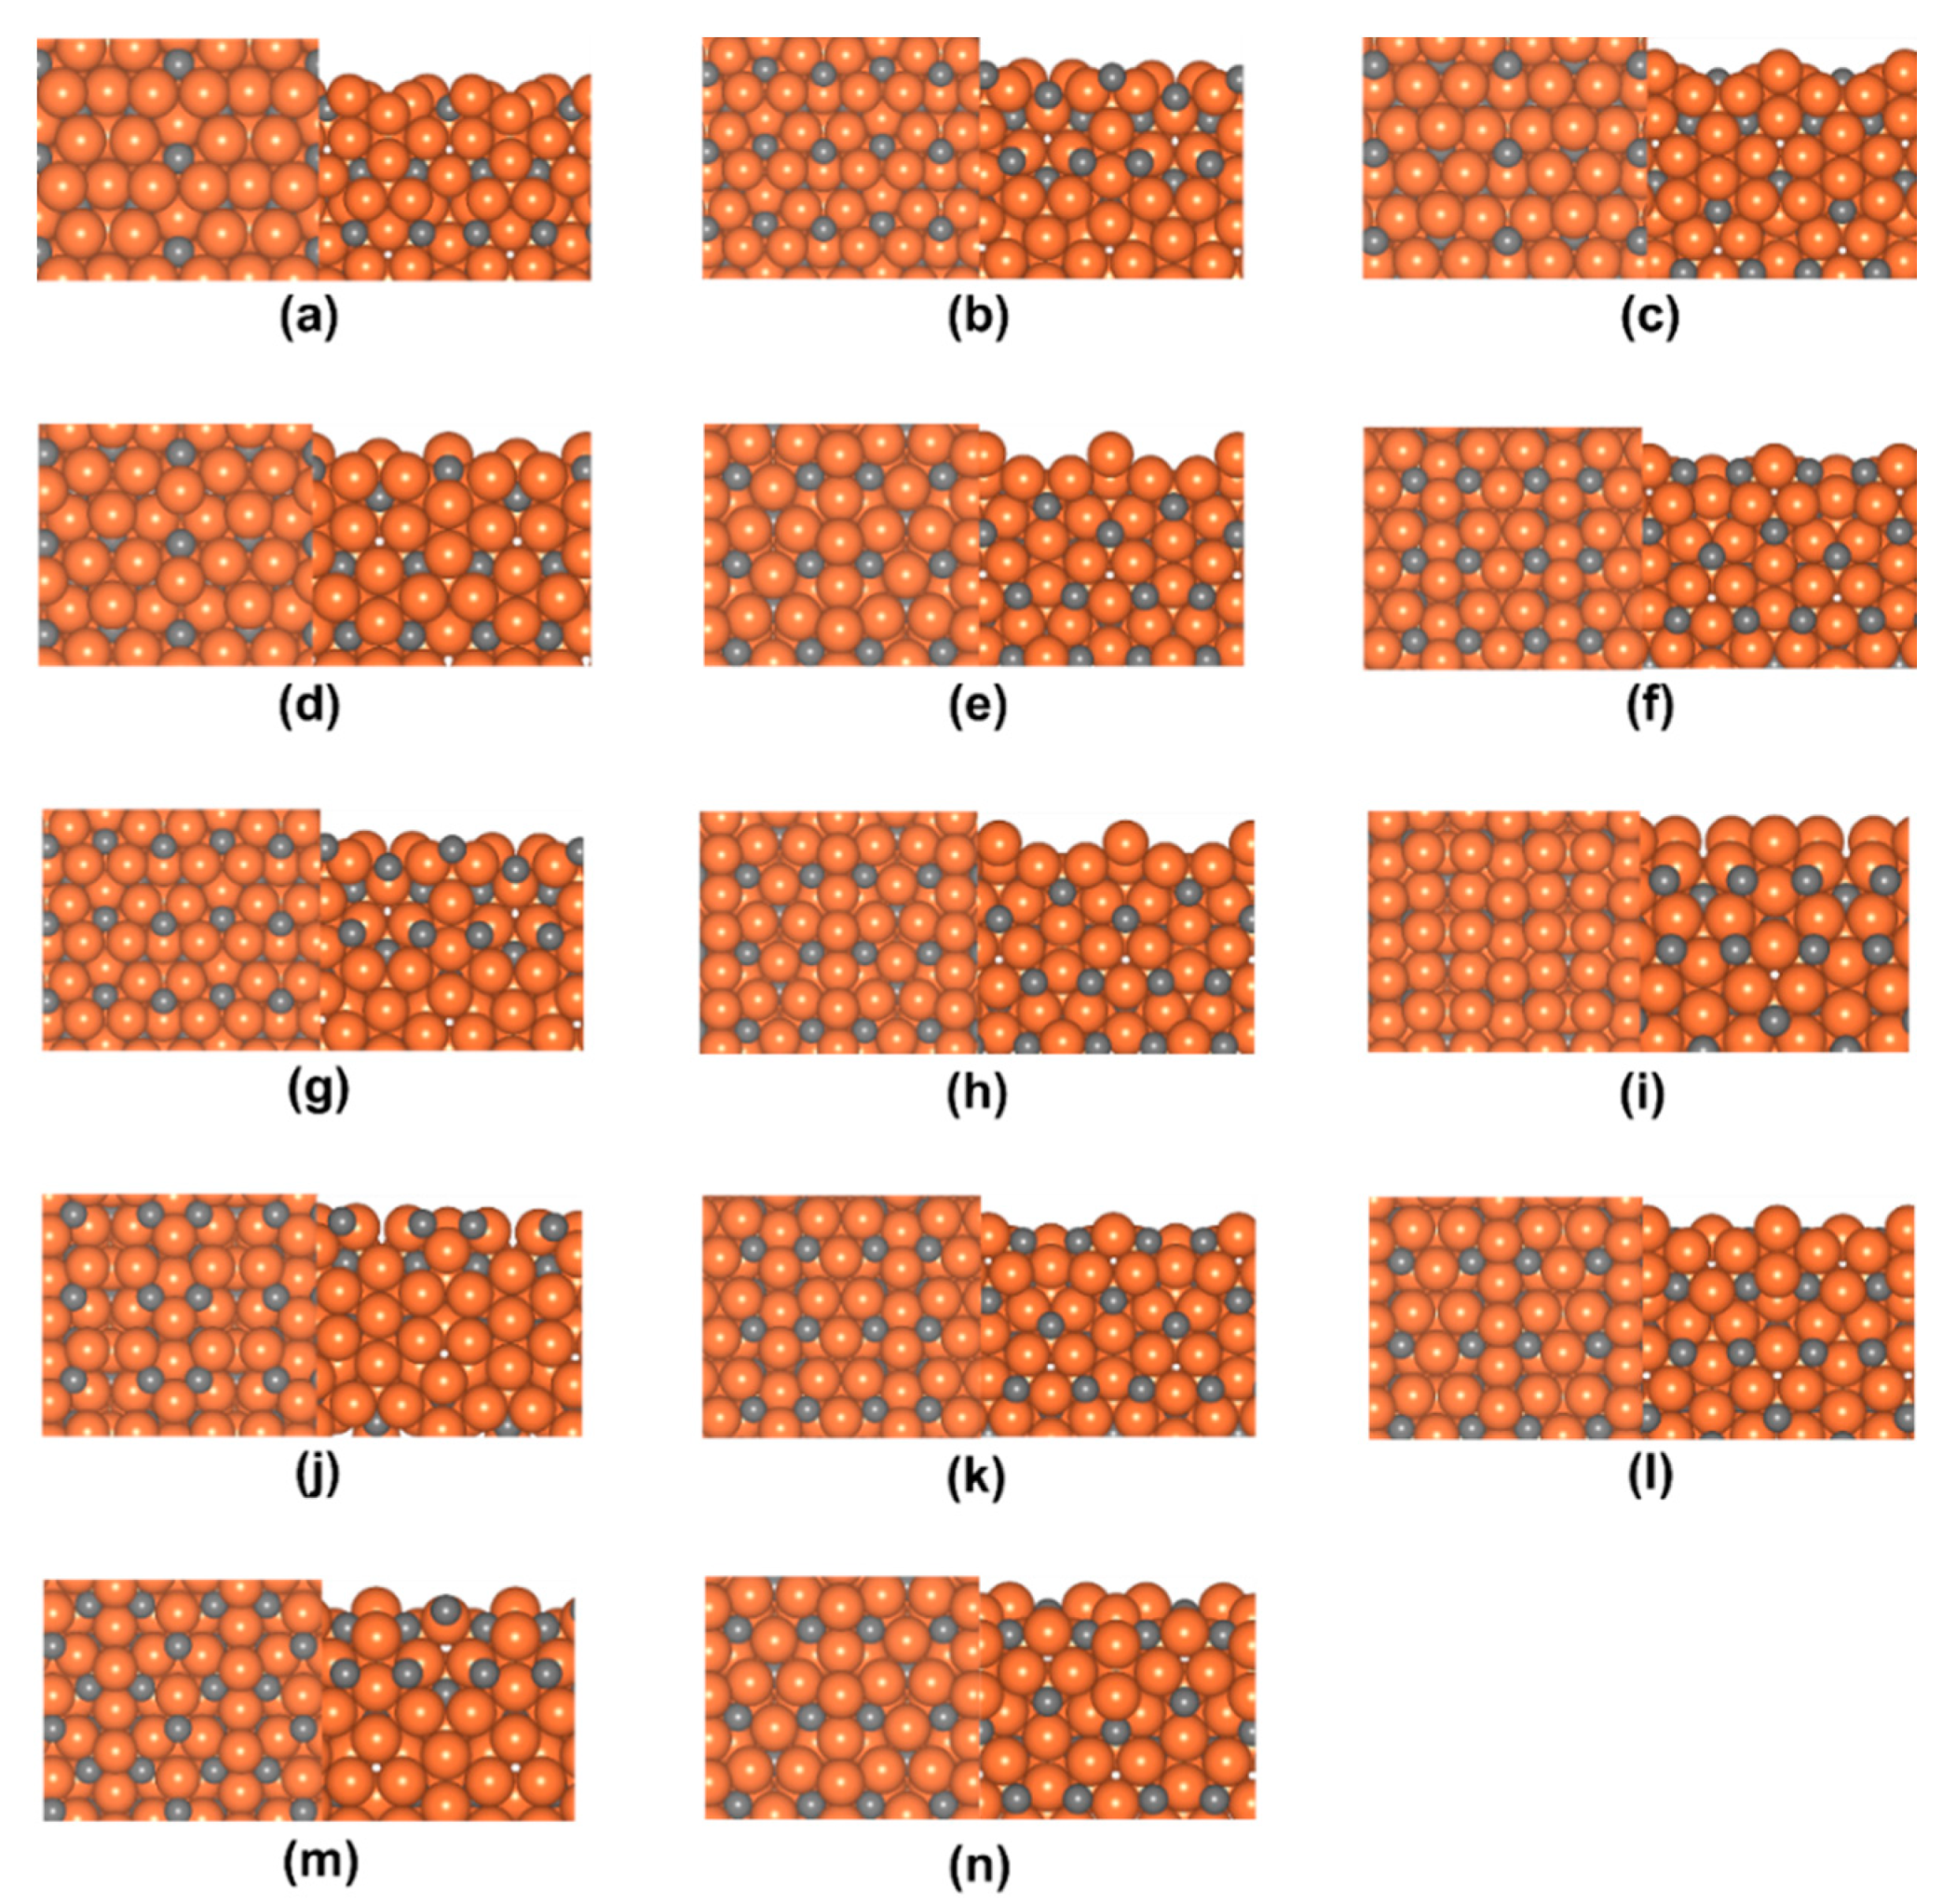
3.1. Surface Energies

To model the possible terminations at the o-Fe7C3(001) surfaces, the unit cell of bulk o-Fe7C3 was cut in a direction perpendicular to the (001) Miller plane at various fractional distances. Here, the notation introduced by Steynberg et al. was adopted to represent the surface terminations created by this cutting process [27]. Furthermore, this study focused on stoichiometric and symmetric/asymmetric terminations that were computationally tractable to determine the most stable surface termination of the o-Fe7C3(001) surface. Thus, the tested terminations were (001)0.06, (001)0.09, (001)0.13, (001)0.15, (001)0.20, (001)0.41, (001)0.59, (001)0.81, (001)0.85, (001)0.87, (001)0.91, (001)0.94, (001)0.99, and (001)1.00. The detailed surface structures of these 14 terminations are shown in Figure 2.
The surface energies were calculated using the cleavage energy (Ecle) and relaxation energy (Erel) [28,29]. The surface energy is represented as a sum of Ecle and Erel as follows:
γ = (Ecle + Erel)/A,
where γ is the surface energy of the o-Fe7C3(001) surface, and A is the surface area of the slab. The cleavage energy of a stoichiometric slab can be obtained from the following equation:
Ecle = (Eunrelax − nEbulk)/2,
where Eunrelax is the total DFT energy of the unrelaxed o-Fe7C3(001) slab, Ebulk is the total DFT energy of a bulk Fe7C3 unit cell, and n is the number of bulk Fe7C3 units in the slab. In Equation (3), the calculated energy, (Eunrelax − nEbulk), is divided by 2, because the cleavage energy is evenly distributed between the two terminations when cutting the bulk o-Fe7C3 unit cell. Furthermore, the relaxation energy is calculated as follows:
Erel = ErelaxEunrelax,
where Erelax is the energy of the slab when the bottom half layers are fixed and the others are relaxed. Therefore, Erel denotes the relaxation energy for the relaxed half, i.e., the termination to be evaluated.
Table 1 lists the surface C atom coverage and calculated surface energy for each surface termination. The results of this study showed that the surface energy of (001)0.20 was the lowest, implying that this termination was the most thermodynamically stable termination among those tested. In contrast, (001)0.15 had the highest surface energy, and it was the most thermodynamically unstable termination. Furthermore, in general, it was found that the surface energy of the termination decreased as the surface C atom coverage of the termination increased. For this reason, the metallic Fe surface ((001)0.85) that had no surface C atom was not stable compared to the carbon-covered terminations. Moreover, as shown in Table 1, the energetically highest ranked terminations (1–5) had carbon coverages of more than 0.3, implying that passivation of the surface C atoms stabilized the o-Fe7C3 surfaces.

3.2. CO* Activation

To understand the effects of the surface C atom coverages on the energetics of the CO* activation, adsorption and C–O bond dissociation were performed on the different terminations. For the terminations with the same surface C atom coverage, the surface with the lower surface energy was chosen. Thus, the (001)0.85, (001)0.13, (001)0.20, (001)0.09, and (001)0.99 slabs were used, where the surface C atom coverages were 0.00, 0.17, 0.33, 0.33, and 0.60, respectively (for the surface C atom coverage of 0.33, the two most stable terminations, (001)0.20 and (001)0.10, were tested). In addition, to evaluate the intrinsic properties of CO* activation, a simulation of CO* activation was performed at a surface CO* coverage of 0.1.

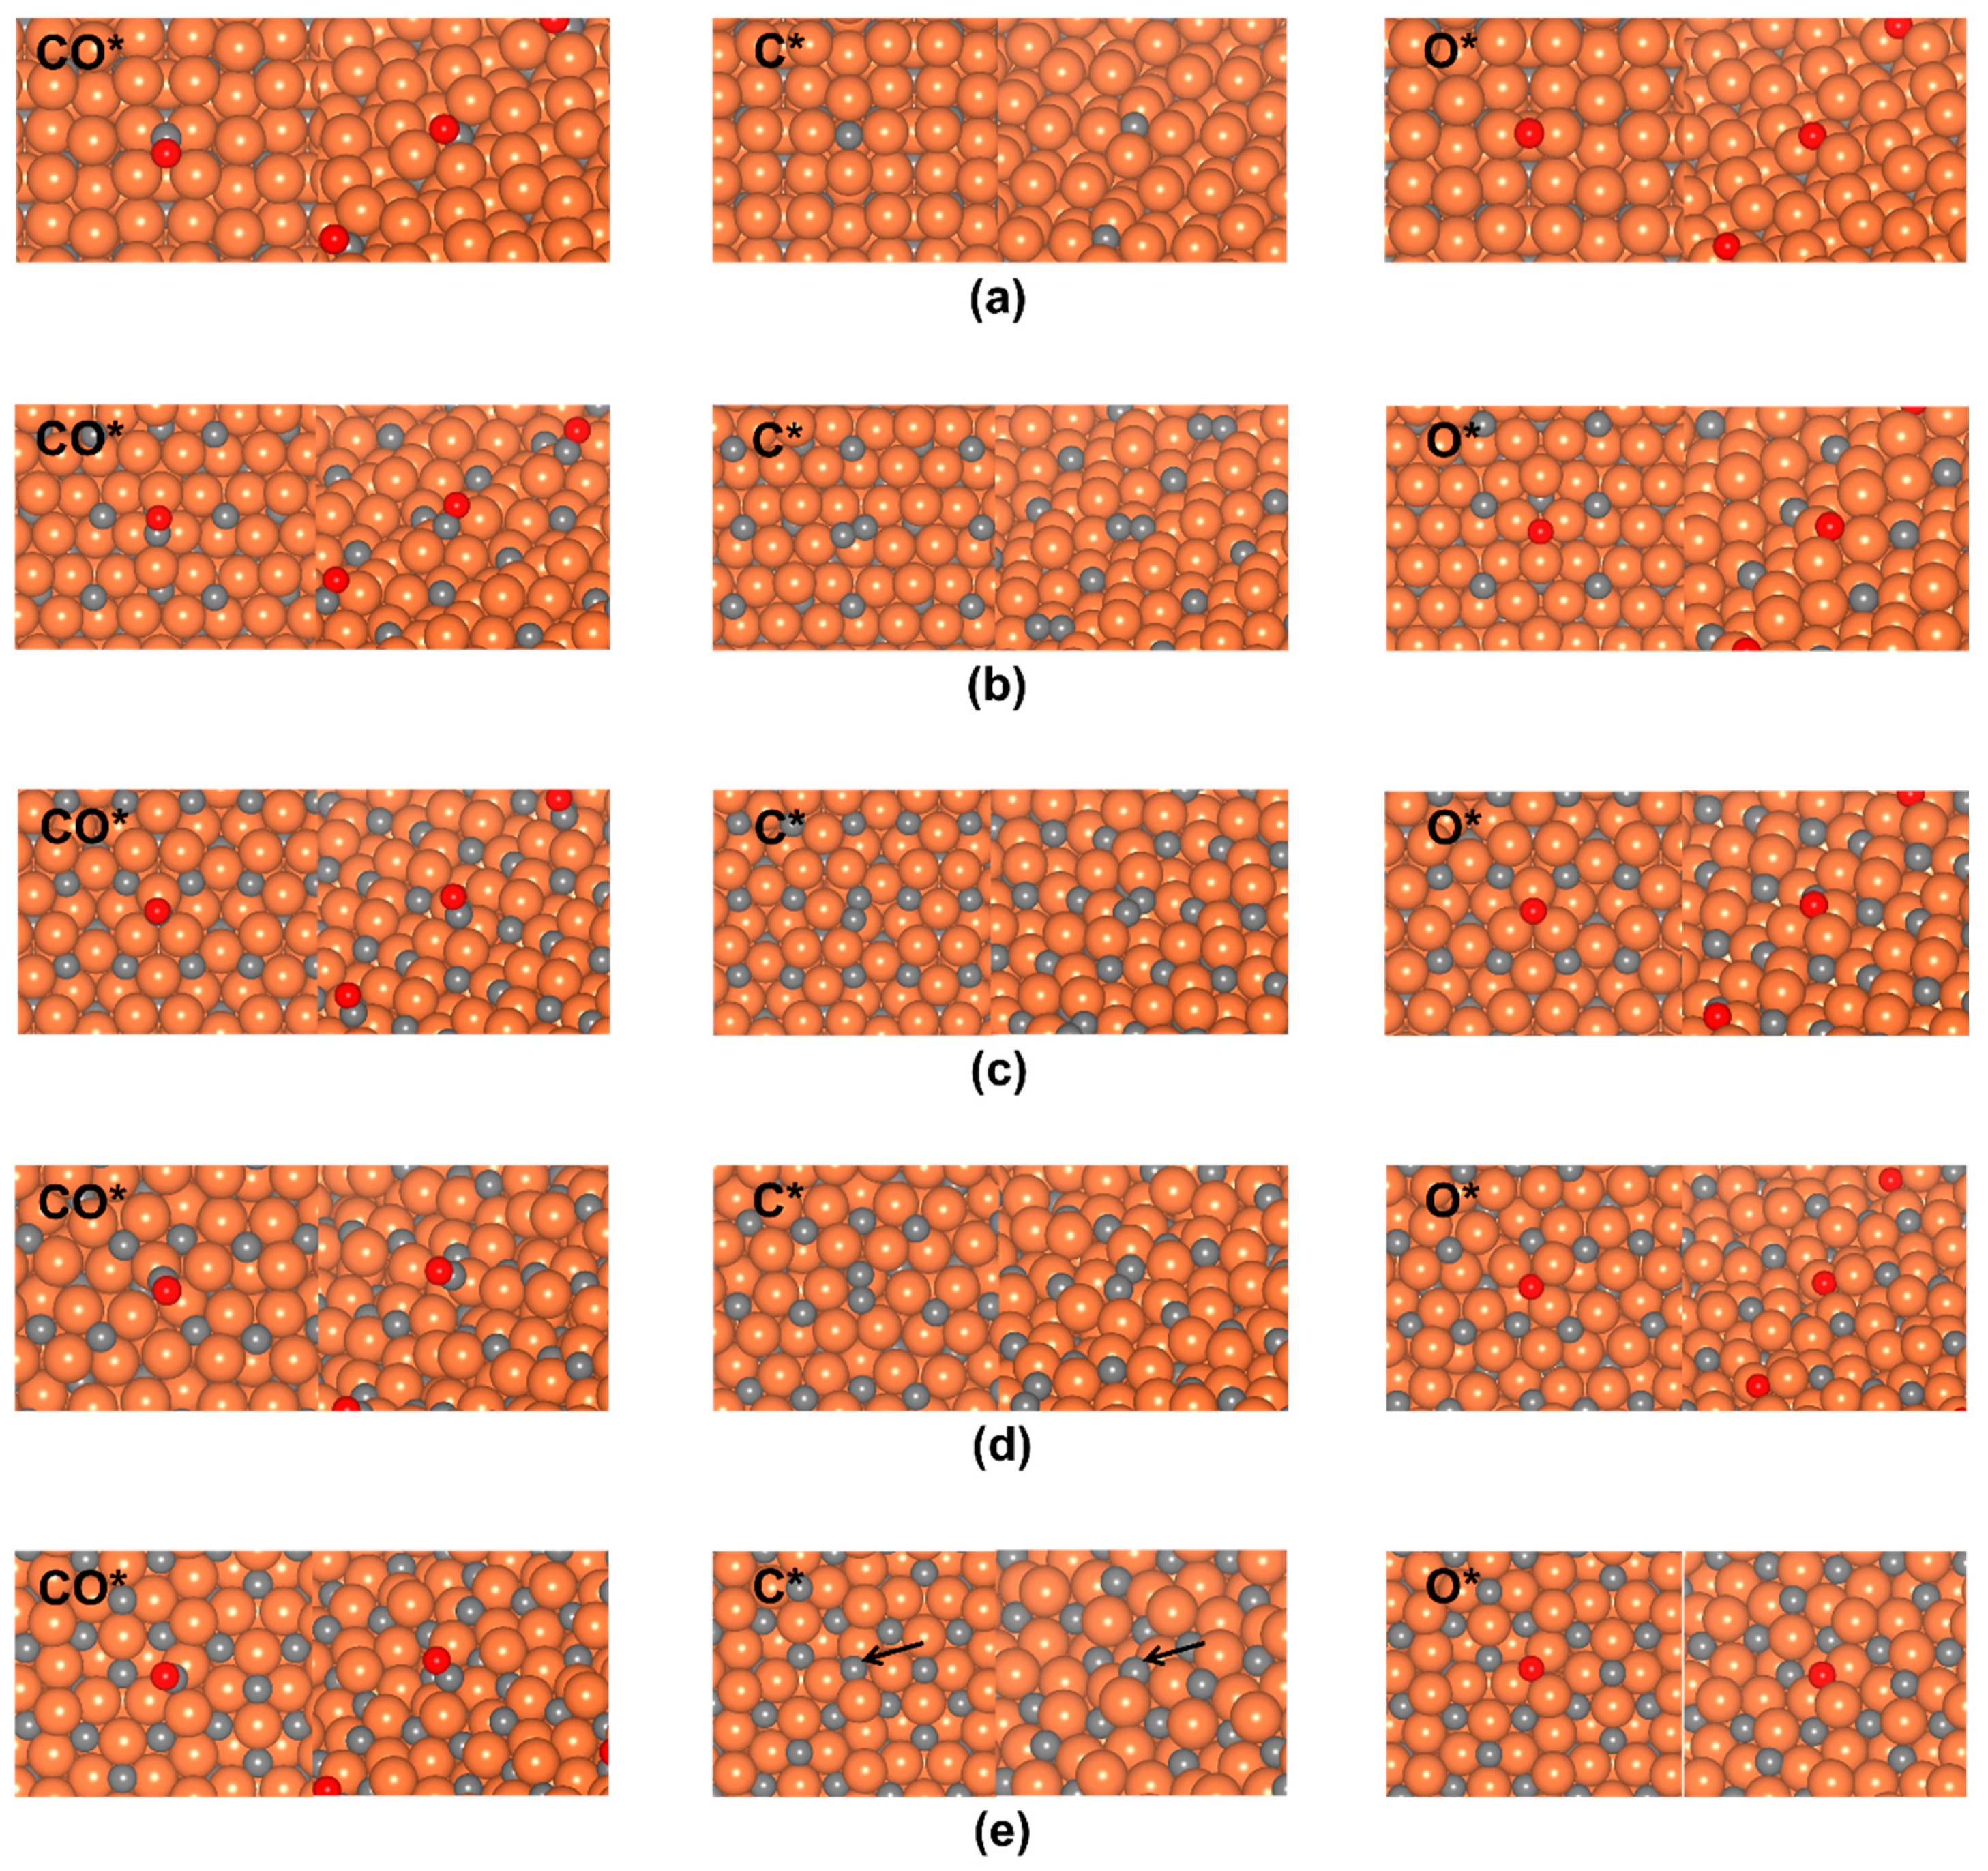
3.2.1. CO*, C*, and O* Adsorption

The preferred adsorption sites for CO*, C*, and O* on the o-Fe7C3(001) surfaces were investigated. The adsorptions on the top, bridge, three-fold, and four-fold sites were examined. Figure 3 shows the molecular configurations of the lowest energy states of CO*, C*, and O* adsorbed on the o-Fe7C3(001) surfaces.
Figure 3a shows the CO*, C*, and O* adsorbed on the o-Fe7C3(001)0.85 surface. The metallic Fe surface had various adsorption sites, such as the top, bridge, three-fold, and four-fold sites. The adsorption energies of CO* at all these sites were calculated to determine the lowest energy state for CO*. The results showed that CO* was the most strongly adsorbed at the four-fold site. This was similar to the B5 site, which was composed of four-fold and three-fold hollow sites [30,31]. Interestingly, the axis of CO* was nearly parallel to the surface, where it was bound to the surface through both C* and O* atoms. This adsorption mode, called a “side-on” configuration [32], was found to be 0.14 eV more stable than the mode where the C–O axis was vertical to the surface. The molecular configuration of perpendicular CO* is shown in Figure S2 in the Supplementary Materials. Furthermore, the DFT simulation showed that atomic C* and O*, as the product species from the CO* dissociation, favored the four-fold and bridge sites, respectively.
The adsorption of CO*, C*, and O* on the o-Fe7C3(001)0.13 surface is shown in Figure 3b. Because surface C atoms existed on this surface, the adsorption modes of CO*, C*, and O* were evaluated not only at the Fe sites but also at the C sites. A simulation showed that the lowest energy state of CO* was at the three-fold site of Fe atoms with a side-on configuration, where the CO* molecule leaned toward the Fe top site. Although CO* could be adsorbed on the surface C atoms through a C–C bond (Figure S3), this CCO* species was energetically 0.34 eV less stable than the lowest energy state of CO*. Meanwhile, atomic C* favored the formation of CC*, which was 0.58 eV more stable than the C* adsorbed at the three-fold Fe site (Figure S3). Atomic O* was the most energetically stable at the three-fold site of the Fe atoms.
The o-Fe7C3(001)0.20 surface was the most thermodynamically stable termination, hence, this termination likely played a crucial role in the CO reactions on the (001) plane. On this surface, the coverage of the surface C atoms was 0.33, hence, the effect of these surface C atoms was not negligible. Because the surface C atoms were located at the four-fold sites of the Fe atoms, as shown in Figure 2e, the adsorption modes of CO*, C*, and O* were evaluated at these Fe and C sites. Figure 3c shows the CO*, C*, and O* adsorbed on this surface. It was found that the CO* and O* favored adsorption on the three-fold sites of Fe, while C* preferred to be CC* on the surface. The molecular configuration of CO* was perpendicular, and this structure was 0.74 eV more stable than the side-on configuration of CCO*, which is shown in Figure S4. Atomic C* on the four-fold site of Fe was observed, as shown in Figure S4, however, this configuration was 0.53 eV less stable than the CC* structure.
o-Fe7C3(001)0.09 was a surface that also showed 0.33 coverage of the surface C atom. On this surface, the surface C atoms were located at the three-fold sites of Fe, as shown in Figure 2b. Figure 3d shows the CO*, C*, and O* adsorbed on the o-Fe7C3(001)0.09 surface. Geometric optimization of CO* using DFT showed that the CO* was the most energetically stable at the Fe top site with the perpendicular configuration. Although CCO* was observed (Figure S5), its energy was 0.46 eV less stable than CO* on the top site. Furthermore, the side-on configuration of CO* was possible when CO* was bound with the surface C atom (Figure S5). However, it was energetically 1.00 eV higher than the top CO* species, and was, therefore, not stable. It was also found that C* preferred the CC* species at the top and three-fold sites of Fe atoms, while O* was adsorbed on the three-fold sites of Fe atoms. CC* was 0.80 eV more stable than C* at the Fe site (Figure S5).
The last termination tested for the CO*, C*, and O* adsorptions were o-Fe7C3(001)0.99. This termination had the highest coverage of the surface C atom. Figure 3e shows the lowest energy states of the adsorbed CO*, C*, and O* on the o-Fe7C3(001)0.99 surface. The DFT results showed that CO* vertical to the surface preferred the four-fold sites of Fe atoms, while C* and O* favored the four-fold and three-fold sites of Fe atoms. The side-on configuration of CO* was only possible when it was bound to the surface C atom (Figure S6), although it was energetically 0.56 eV less stable than perpendicular CO*. However, C* could form a CC* species (Figure S6), and the energy difference with the C* at the four-fold site was only 0.05 eV, indicating that the surface C atom was also a stable adsorption site.

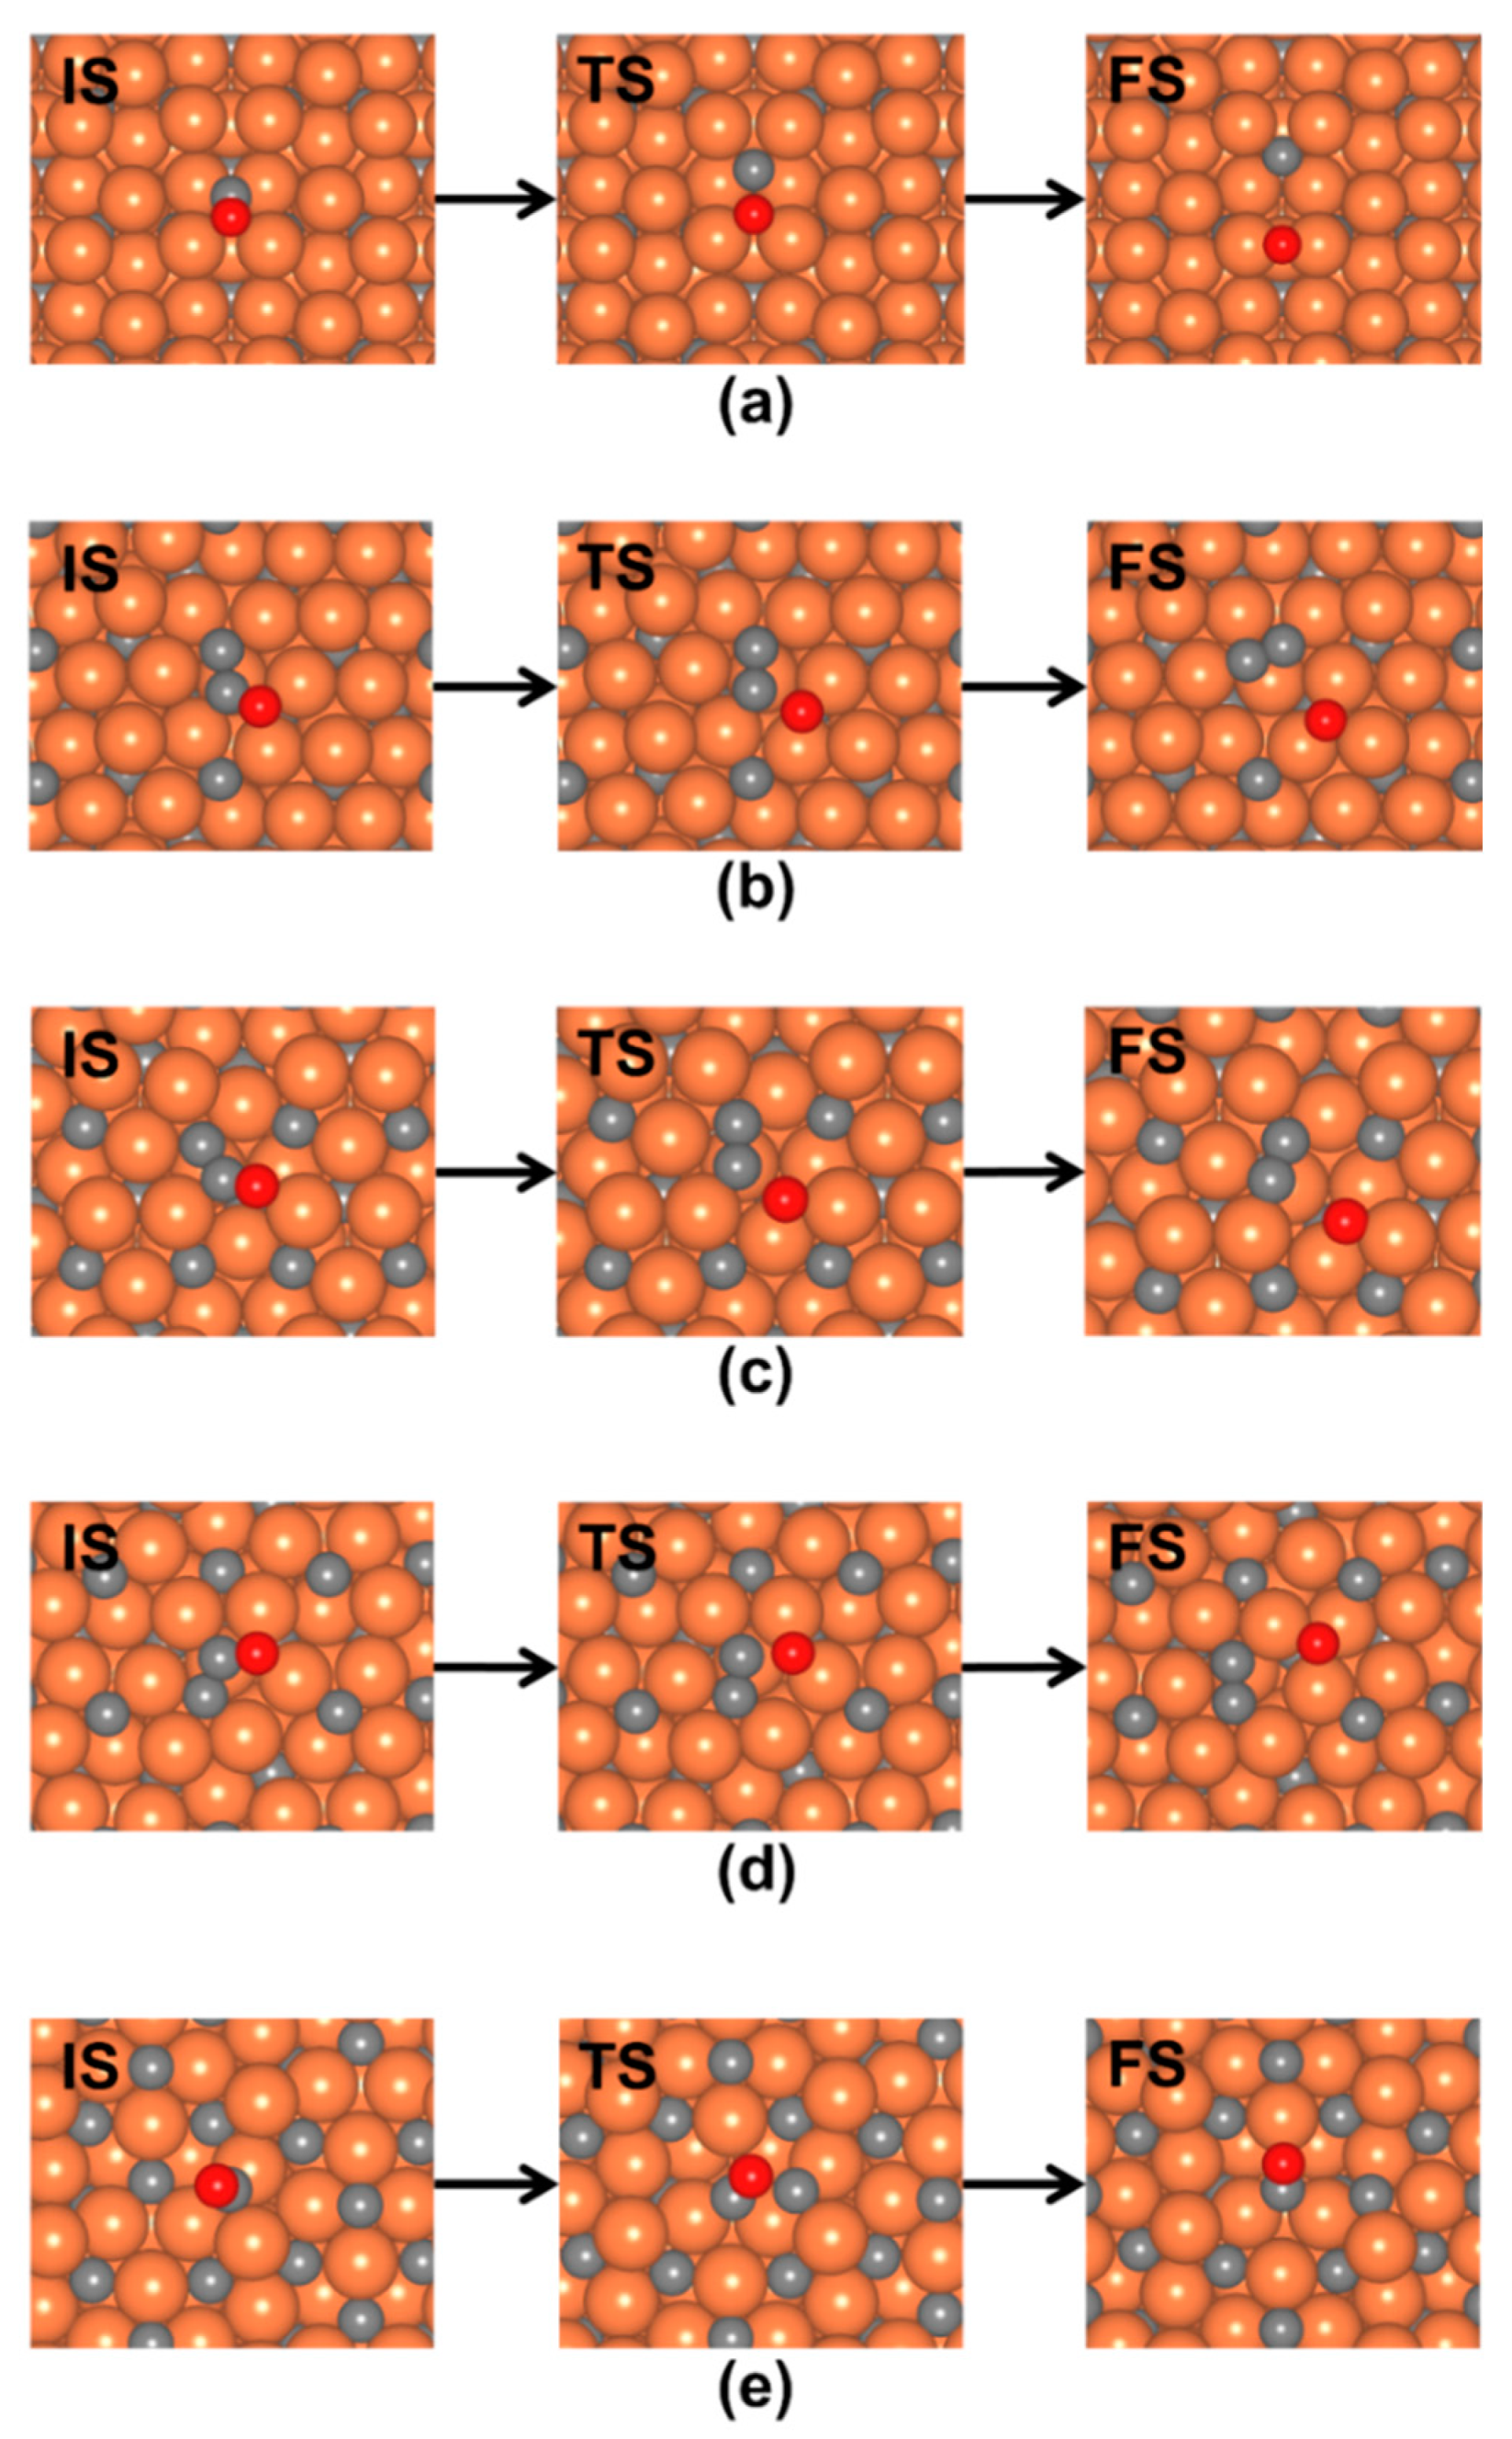
3.2.2. Direct CO* Dissociation

The direct CO* dissociation pathways were investigated on the o-Fe7C3 surfaces with different terminations. The NEB calculations provided the lowest energetic pathways that showed effective kinetic energies for CO* dissociation. This energy is defined as the energy difference between the lowest energy state of CO* and the transition state [33]. Thus, when a dissociation pathway started from the metastable state of CO*, the calculated kinetic energy included the thermodynamic diffusional energy from the lowest energy to the metastable state. Images of the initial, transition, and final states for CO* dissociation are shown in Figure 4.
Figure 4a shows the direct CO* dissociation pathway on the o-Fe7C3(001)0.85 surface. On this metallic Fe surface, CO* dissociation started from the 4 Fe atom sites, which had the lowest energy state of CO*. As the reaction proceeded, the C–O bond began to stretch, as shown in the transition state in Figure 4a. The final state for this pathway was one in which the C* and O* sat at the four-fold and bridge sites, respectively. The obtained kinetic barrier was 0.91 eV.
Direct CO* dissociation on the o-Fe7C3(001)0.13 surface is shown in Figure 4b. The CO* dissociation started from the metastable state of CO*, where CO* was adsorbed on a surface C atom with a side-on configuration. A C–O bond was dissociated over the three-fold site of Fe, which led to formations of CC* and O*, as shown in the final state in Figure 4b. The kinetic barrier of this elementary step was 1.48 eV, which was higher than that from the o-Fe7C3(001)0.85 surface.
The CO dissociation pathway on o-Fe7C3(001)0.20 started with side-on CO* that was adsorbed at Fe and the surface C atom, as shown in the initial state in Figure 4c. After dissociation, CC* and O* were stabilized at the four-fold and three-fold sites of Fe, respectively. The pathway on o-Fe7C3(001)0.09, as shown in Figure 4d, also started from a side-on configuration of CO*. In the product state, CC* was adsorbed on the four-fold sites of Fe, while O was bound to the three-fold site of Fe. The corresponding kinetic barrier energies on o-Fe7C3(001)0.20 and o-Fe7C3(001)0.09 were 1.85 and 1.74 eV, respectively.
The CO* dissociation examined on the o-Fe7C3(001)0.99 surface was a pathway where CO* started from the three-fold site of Fe, as shown in Figure 4e. As the reaction proceeded, the molecular axis of CO* leaned toward the surface C atom, and the C–O bond began to stretch. The final state for this pathway was one in which C* sat in the three-fold site on Fe, and O* was in the surface C atom. As a result, this pathway regenerated CO*, thus, the direct CO* dissociation that was expected to form C* and O* hardly occurred on the o-Fe7C3(001)0.99 surface. The calculated kinetic barrier energy was 1.95 eV, which was the highest energy among the CO* dissociation pathways on the o-Fe7C3(001) surfaces tested.

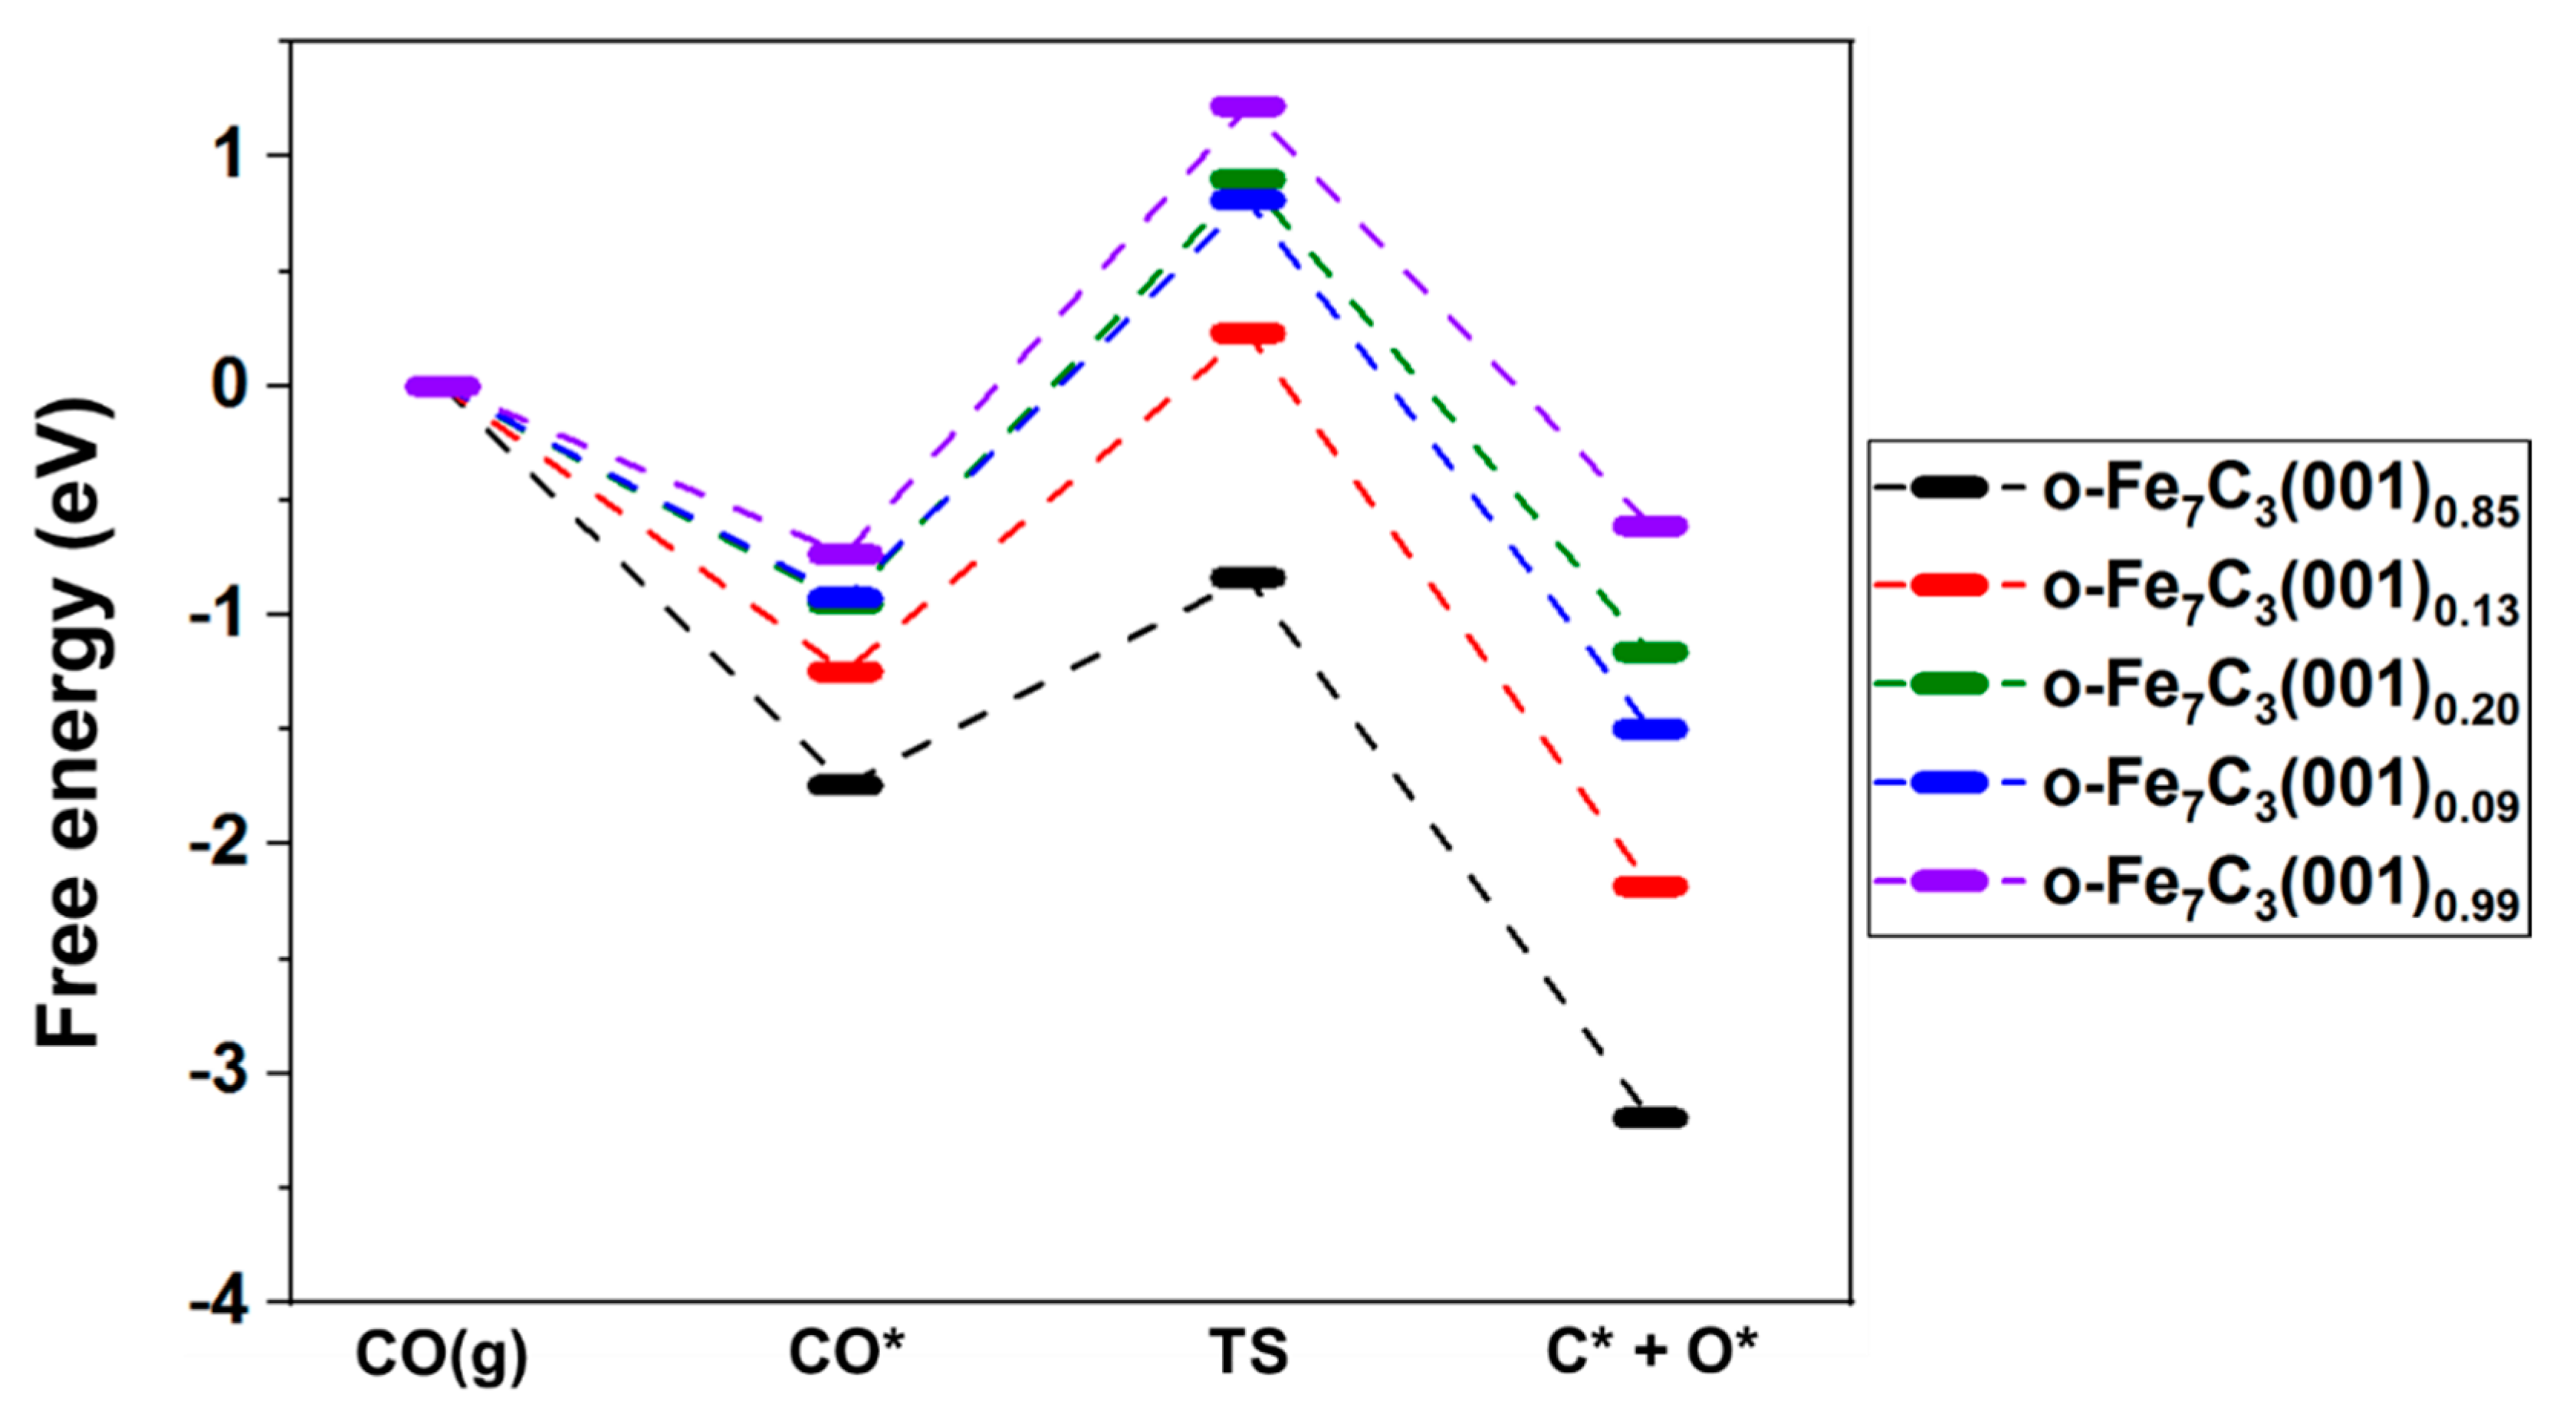
3.2.3. Free Energy Analysis

The free energy diagram for CO* dissociation on the o-Fe7C3(001) surfaces is shown in Figure 5. This diagram presents the free energies of CO(g), CO*, the transition states, and (C* + O*). At the final state, the C* and O* were “at infinite separation,” where only one atom in each unit cell was used in the free energy calculations [33]. A general trend observed in this free energy analysis was that the CO* activation linearly decreased as the surface C atom coverage increased. The CO* reaction on o-Fe7C3(001)0.99, where the coverage of the surface C atom was more than 0.60, was an endothermic process that led to CO* desorption. Meanwhile, on o-Fe7C3(001)0.85 and o-Fe7C3(001)0.13, where the coverage of the surface C atom was lower than 0.17, the reactions were strong exothermic processes that facilitated C–O bond breaking. On o-Fe7C3(001)0.20 and o-Fe7C3(001)0.09, the CO* dissociation reactions were close to thermo-neutral. In addition, the kinetic barrier energy for CO* dissociation linearly increased with the coverage of the surface C atom. Based on the HTST, the calculated reaction rate constants for o-Fe7C3(001)0.85 and o-Fe7C3(001)0.13 were 4.26 × 10⁴ and 8.66 × 10⁻¹, respectively. Thus, this could lead to observable reaction rates for direct CO * dissociation under FTS conditions. However, the o-Fe7C3(001)0.20, (001)0.09, and (001)0.99 surfaces had very small rate constants, implying that CO* dissociation was kinetically inhibited on carbon-rich surfaces. The high kinetic barriers on the carbon-rich surfaces were probably observed because there were few adsorption sites that could stabilize C* and O* after CO* dissociation, owing to the preoccupied C atoms on the surfaces. The reaction parameters calculated using the HTST are listed in Table 2.
The above-mentioned observations indicated that the thermodynamic and kinetic selectivity toward direct CO* dissociation increased when the o-Fe7C3(001) surface had more surface C vacancies, and more metallic features were obtained. The effect of the surface C atoms on CO* deactivation can be described by the charge transfer between the Fe and C atoms on the carbide surfaces [7]. In general, the surface C atoms on carbide surfaces are known to withdraw electrons from the surface Fe atoms, decreasing the charge in the Fe atoms. This diminishes the catalytic activity of the surfaces for direct CO* dissociation. This phenomenon was observed in a CO* activation study on χ-Fe5C2 surfaces [13,34], and the present results were in good agreement. Therefore, the surface C atom-deficient o-Fe7C3(001) surfaces were expected to exhibit high reactivity toward CO* adsorption and dissociation in the FTS reactions.
The o-Fe7C3(001)0.20 surface, which was thermodynamically the most stable termination, showed that CO* adsorption was possible. However, its chemical dissociation was kinetically unfavorable. Thus, further reactions for the consumption of CO* and surface C atoms were required for this surface to develop C* vacancies and become more catalytically active. At this stage, the details of additional reactions involving H-assisted CO* activation, CHx formations, and C-C bond formations cannot be explained. Nevertheless, these reactions are expected to contribute toward converting surface C* species into FTS products even at high surface coverages [13,34,35,36]. Thus, when part of or all the C* was removed through these reactions, the surface became a Fe-terminated one that could directly dissociate CO*. However, if too many carbon species accumulated on the surface, the activity of the catalyst rapidly decreased because the kinetic barrier energy for CO* dissociation rapidly increased with the C* coverage. This is probably why Fe-based catalysts have stability issues during the FTS reaction. Thus, the above-mentioned reaction scheme that included CO* adsorption, CO* dissociation, and C* regeneration on the Fe7C3(001) surfaces could play an important role in the CO* activation in the FTS reaction. Adjusting the reaction parameters with less reducing conditions could be a useful strategy to properly control the surface C* coverage. The precise design of the surface Fe species, whose electron charge is proximately regulated by the promoter, is also essential for controlling the C* coverage. Therefore, the CO* activation mechanism is expected to be a building block for understanding the details of these reactions, making it possible to elucidate the potential pathways for the FTS reaction on o-Fe7C3(001) surfaces. Furthermore, additional studies, including those on CO* hydrogenation and C-C bond formations using high-level exchange-correlation functionals, such as B3LYP or B3PW [37,38], will lead to an understanding of the entire FTS reaction on carbide surfaces and will become a basis for trend-based analysis.

4. Conclusions

This study investigated the catalytic features of the orthorhombic Fe7C3(001) (o-Fe7C3(001)) surfaces used in FTS via DFT calculations. The surface energies of 14 terminations on the o-Fe7C3(001) surface were first calculated using the cleavage energy (Ecle) and relaxation energy (Erel), and their relative values were compared to determine the most stable termination. The results showed that (001)0.20 was the most thermodynamically stable termination. Further, it was found that the surface energy of the termination generally decreased as the surface C atom coverage increased.
To understand the effects of the surface C atom coverages on the energetics of CO* activation, CO* adsorption and C–O bond dissociation were performed on o-Fe7C3(001) surfaces with different terminations. Thus, the elementary steps for CO* were tested on five surfaces, including (001)0.85, (001)0.13, (001)0.20, (001)0.09, and (001)0.99 terminations, where the surface C atom coverages were 0.00, 0.17, 0.33, 0.33, and 0.60, respectively. The adsorption study showed that most of the CO* and O* were stabilized on the three-fold or four-fold sites of the Fe surface, while C* was located at the surface C atom to form a CC* species. Furthermore, it was found that most of the CO* preferred perpendicular configurations, whereas the CO* on the o-Fe7C3(001)0.85 surface preferred a side-on configuration because of the presence of the B5-like site. The direct CO* dissociation pathways on the o-Fe7C3(001) surfaces showed that CO* activation linearly decreased as the surface C atom coverage increased. It was found that CO* desorption was a preferred reaction on the o-Fe7C3(001)0.99 surface, where the coverage of the surface C atom was 0.60, while CO* dissociation was a dominant reaction on the o-Fe7C3(001)0.85 and o-Fe7C3(001)0.13 surfaces, where the coverages of the surface C atom were 0.00 and 0.17, respectively. Therefore, it could be concluded that the thermodynamic and kinetic selectivity toward direct CO* dissociation increased when the o-Fe7C3(001) surface had more surface C vacancies, and more metallic features were obtained. The o-Fe7C3(001)0.20 surface, which was thermodynamically the most stable termination, showed that CO* adsorption was possible even though its chemical dissociation was kinetically unfavorable. Thus, further reactions, such as H-assisted CO* activation, CHx formations, and C-C bond formations, are required for this surface to develop C* vacancies and become more catalytically active.

Supplementary Materials

The following are available online at https://www.mdpi.com/1996-1073/14/3/563/s1, Figure S1: Top and side views of (a) o-Fe7C3(001)0.85, (b) (001)0.20, and (c) (001)0.99 surfaces, Figure S2: Top and side views of vertical CO* on o-Fe7C3(001)0.85 surface, Figure S3: Top and side or angled views of CCO* and C* on o-Fe7C3(001)0.13 surface, Figure S4: Top and side or angled views of CCO* and C* on o-Fe7C3(001)0.20 surface, Figure S5: Top and side or angled views of vertical CCO*, side-on CCO*, and C* on o-Fe7C3(001)0.09 surface, Figure S6: Top and side or angled views of CCO* and CC* on o-Fe7C3(001)0.99 surface.

Author Contributions

Conceptualization, H.-J.C. and Y.T.K.; data curation, H.-J.C.; formal analysis, H.-J.C.; investigation, H.-J.C. and Y.T.K.; visualization, H.-J.C.; supervision, H.-J.C. and Y.T.K.; writing—original draft preparation, H.-J.C.; writing—review & editing, Y.T.K. All authors have read and agreed to the published version of the manuscript.

Funding

This work was supported by the “Next Generation Carbon Upcycling Project” (NRF-2017M1A2A2043110) through the National Research Foundation (NRF) funded by the Ministry of Science and ICT, Republic of Korea.

Conflicts of Interest

The authors declare no conflict of interest.

References

  1. Dry, M.E. The Fischer-Tropsch process: 1950–2000. Catal. Today 2002, 71, 227–241. [Google Scholar] [CrossRef]
  2. Steynberg, A.P. Introduction to Fischer-Tropsch Technology. Stud. Surf. Sci. Catal. 2004, 152, 1–63. [Google Scholar]
  3. Huang, C.-S.; Xu, L.; Davis, B.H. Fischer-Tropsch synthesis: Impact of pretreatment of ultrafine iron oxide upon catalyst structure and selectivity. Fuel Sci. Technol. Int. 1993, 11, 639–664. [Google Scholar] [CrossRef]
  4. Jin, Y.; Datye, A.K. Phase transformations in iron Fischer-Tropsch catalysts during temperature-programmed reduction. J. Catal. 2000, 196, 8–17. [Google Scholar] [CrossRef]
  5. Zhang, Q.; Kang, J.; Wang, Y. Development of novel catalysts for Fischer-Tropsch synthesis: Tuning the product selectivity. ChemCatChem 2010, 2, 1030–1058. [Google Scholar] [CrossRef]
  6. Pham, T.H.; Duan, X.; Qian, G.; Zhou, X.; Chen, D. CO activation pathways of Fischer-Tropsch synthesis on χ-Fe5C2 (510): Direct versus hydrogen-assisted CO dissociation. J. Phys. Chem. C 2014, 118, 10170–10176. [Google Scholar] [CrossRef]
  7. Chen, B.; Wang, D.; Duan, X.; Liu, W.; Li, Y.; Qian, G.; Yuan, W.; Holmen, A.; Zhou, X.; Chen, D. Charge-tuned CO activation over a χ-Fe5C2 Fischer-Tropsch catalyst. ACS Catal. 2018, 8, 2709–2714. [Google Scholar] [CrossRef]
  8. Datye, A.K.; Jin, Y.; Mansker, L.; Motjope, R.T.; Dlamini, T.H.; Coville, N.J. The nature of the active phase in iron Fischer-Tropsch catalysts. Stud. Surf. Sci. Catal. 2000, 130, 1139–1144. [Google Scholar]
  9. Rivera de la Cruz, J.G.; Sabbe, M.K.; Reyniers, M.F. First principle study on the adsorption of hydrocarbon chains involved in Fischer-Tropsch synthesis over iron carbides. J. Phys. Chem. C 2017, 121, 25052–25063. [Google Scholar] [CrossRef]
  10. Chang, Q.; Zhang, C.; Liu, C.; Wei, Y.; Cheruvathur, A.V.; Dugulan, A.I.; Niemantsverdriet, J.W.; Liu, X.; He, Y.; Qing, M.; et al. Relationship between iron carbide phases (ε-Fe2C, Fe7C3, and χ-Fe5C2) and catalytic performances of Fe/SiO2 Fischer-Tropsch catalysts. ACS Catal. 2018, 8, 3304–3316. [Google Scholar] [CrossRef]
  11. Ojeda, M.; Nabar, R.; Nilekar, A.U.; Ishikawa, A.; Mavrikakis, M.; Iglesia, E. CO activation pathways and the mechanism of Fischer-Tropsch synthesis. J. Catal. 2010, 272, 287–297. [Google Scholar] [CrossRef]
  12. Petersen, M.A.; van Rensburg, W.J. CO dissociation at vacancy sites on Hägg iron carbide: Direct versus hydrogen-assisted routes investigated with DFT. Top. Catal. 2015, 58, 665–674. [Google Scholar] [CrossRef]
  13. Ozbek, M.O.; Niemantsverdriet, J.H. Elementary reactions of CO and H2 on C-terminated χ-Fe5C2(001) surfaces. J. Catal. 2014, 317, 158–166. [Google Scholar] [CrossRef]
  14. Cao, D.B.; Li, Y.W.; Wang, J.; Jiao, H. Adsorption and reaction of surface carbon species on Fe5C2(001). J. Phys. Chem. C 2008, 112, 14883–14890. [Google Scholar] [CrossRef]
  15. Yang, S.; Chun, H.-J.; Lee, S.; Han, S.J.; Lee, K.Y.; Kim, Y.T. Comparative study of olefin production from CO and CO2 using Na- and K-promoted zinc ferrite. ACS Catal. 2020, 10, 10742–10759. [Google Scholar] [CrossRef]
  16. Fang, C.M.; van Huis, M.A.; Zandbergen, H.W. Structural, electronic, and magnetic properties of iron carbide Fe7C3 phases from first-principles theory. Phys. Rev. B 2009, 80, 224108. [Google Scholar] [CrossRef] [Green Version]
  17. Kresse, G.; Hafner, J. Ab initio molecular dynamics for liquid metals. Phys. Rev. B 1993, 47, 558–561. [Google Scholar] [CrossRef]
  18. Kresse, G.; Hafner, J. Ab initio molecular-dynamics simulation of the liquid-metal-amorphous semiconductor transition in germanium. Phys. Rev. B 1994, 49, 14251–14269. [Google Scholar] [CrossRef]
  19. Kresse, G.; Furthmüller, J. Efficient iterative schemes for ab initio total-energy calculations using a plane-wave basis set. Phys. Rev. B 1996, 54, 11169–11186. [Google Scholar] [CrossRef]
  20. Kresse, G.; Furthmüller, J. Efficiency of ab-initio total energy calculations for metals and semiconductors using a plane-wave basis set. Comput. Mater. Sci. 1996, 6, 15–50. [Google Scholar] [CrossRef]
  21. Perdew, J.P.; Burke, K.; Ernzerhof, M. Generalized gradient approximation made simple. Phys. Rev. Lett. 1996, 77, 3865–3868. [Google Scholar] [CrossRef] [PubMed] [Green Version]
  22. Henkelman, G. A climbing image nudged elastic band method for finding saddle points and mini-mum energy paths. J. Chem. Phys. 2000, 113, 9901–9904. [Google Scholar] [CrossRef] [Green Version]
  23. Zhu, Y.A.; Chen, D.; Zhou, X.G.; Yuan, W.K. DFT studies of dry reforming of methane on Ni catalyst. Catal. Today 2009, 148, 260–267. [Google Scholar] [CrossRef]
  24. Cao, X.M.; Burch, R.; Hardacre, C.; Hu, P. An understanding of chemoselective hydrogenation on crotonaldehyde over Pt(111) in the free energy landscape: The microkinetics study based on first-principles calculations. Catal. Today 2011, 165, 71–79. [Google Scholar] [CrossRef]
  25. Chase, M.W. NIST-JANAF Thermochemical Tables, 4th ed.; National Institute of Standards and Technology: Gaithersburg, MD, USA, 1998; p. 643.
  26. Scholl, D.S.; Steckel, J.A. Density Functional Theory: A Practical Introduction, 1st ed.; John Wiley & Sons, Inc.: Hoboken, NJ, USA, 2009; pp. 131–161. [Google Scholar]
  27. Steynberg, P.J.; Van den Berg, J.A.; van Rensburg, W.J. Bulk and surface analysis of Hägg Fe carbide (Fe5C2): A density functional theory study. J. Phys. Condens. Matter 2008, 20, 064238. [Google Scholar] [CrossRef]
  28. Zhang, J.M.; Pang, Q.; Xu, K.W.; Ji, V. First-principles study of the (001) surface of cubic PbTiO3. Surf. Interface Anal. 2008, 40, 1382–1387. [Google Scholar] [CrossRef]
  29. Tian, X.; Wang, T.; Fan, L.; Wang, Y.; Lu, H.; Mu, Y. A DFT based method for calculating the surface energies of asymmetric MoP facets. Appl. Surf. Sci. 2018, 427, 357–362. [Google Scholar] [CrossRef]
  30. García-García, F.R.; Guerrero-Ruiz, A.; Rodriguez-Ramos, I. Role of B5-type sites in Ru catalysts used for the NH3 decomposition reaction. Top. Catal. 2009, 52, 758–764. [Google Scholar] [CrossRef]
  31. Arevalo, R.L.; Aspera, S.M.; Escaño, M.C.S.; Nakanishi, H.; Kasai, H. First principles study of methane decomposition on B5 step-edge type site of Ru surface. J. Phys. Condens. Matter 2017, 29, 184001. [Google Scholar] [CrossRef]
  32. Ge, Q.; Neurock, M. Structure dependence of NO adsorption and dissociation on platinum surfaces. J. Am. Chem. Soc. 2004, 126, 1551–1559. [Google Scholar] [CrossRef]
  33. Rempel, J.; Greeley, J.; Hansen, L.B.; Nielsen, O.H.; Nørskov, J.K.; Mavrikakis, M. Step effects on the dissociation of NO on close-packed rhodium surfaces. J. Phys. Chem. C 2009, 113, 20623–20631. [Google Scholar] [CrossRef]
  34. Broos, R.J.; Zijlstra, B.; Filot, I.A.; Hensen, E.J. Quantum-chemical DFT study of direct and H- and C-assisted CO dissociation on the χ-Fe5C2 Hägg carbide. J. Phys. Chem. C 2018, 122, 9929–9938. [Google Scholar] [CrossRef] [PubMed] [Green Version]
  35. Ozbek, M.O.; Niemantsverdriet, J.H. Methane, formaldehyde and methanol formation pathways from carbon monoxide and hydrogen on the (001) surface of the iron carbide χ-Fe5C2. J. Catal. 2015, 325, 9–18. [Google Scholar] [CrossRef] [Green Version]
  36. Chen, W.; Lin, T.; Dai, Y.; An, Y.; Yu, F.; Zhong, L.; Li, S.; Sun, Y. Recent advances in the investigation of nanoeffects of Fischer-Tropsch catalysts. Catal. Today 2018, 311, 8–22. [Google Scholar] [CrossRef]
  37. Eglitis, R.I.; Popov, A.I. Systematic trends in (0 0 1) surface ab initio calculations of ABO3 perovskites. J. Saudi Chem. Soc. 2018, 22, 459–468. [Google Scholar] [CrossRef]
  38. Eglitis, R.I.; Purans, J.; Gabrusenoks, J.; Popov, A.; Jia, R. Comparative ab initio calculations of ReO3, SrZrO3, BaZrO3, PbZrO3 and CaZrO3 (001) surfaces. Crystals 2020, 10, 745. [Google Scholar] [CrossRef]
Figure 1. Images of a−c, b−c, and a−b planes of unit cell of o-Fe7C3. Orange and gray balls in the figure represent Fe and C, respectively.
Energies 14 00563 g001
Figure 2. Top and side views of o-Fe7C3(001) surfaces with various terminations: (a) (001)0.06, (b) (001)0.09, (c) (001)0.13, (d) (001)0.15, (e) (001)0.20, (f) (001)0.41, (g) (001)0.59, (h) (001)0.81, (i) (001)0.85, (j) (001)0.87, (k) (001)0.91, (l) (001)0.94, (m) (001)0.99, and (n) (001)1.00. Orange and gray balls in the figure represent Fe and C, respectively.
Energies 14 00563 g002
Figure 3. Top and angled views of CO*, C*, and O* on o-Fe7C3(001) surfaces with different terminations: (a) (001)0.85, (b) (001)0.13, (c) (001)0.20, (d) (001)0.09, and (e) (001)0.99. Orange, gray, and red balls in the figure represent Fe, C, and O, respectively. Arrow in (e) points toward C*.
Energies 14 00563 g003
Figure 4. Top views of initial (IS), transition (TS), and final states (FS) for CO* dissociation on o-Fe7C3(001) surfaces with different terminations. The images were obtained from the NEB calculations: (a) (001)0.85, (b) (001)0.13, (c) (001)0.20, (d) (001)0.09, and (e) (001)0.99. Orange, gray, and red balls in the figure represent Fe, C, and O, respectively.
Energies 14 00563 g004
Figure 5. Free energy diagram for CO* dissociation pathways on o-Fe7C3(001) surfaces with different terminations. TS denotes the transition state.
Energies 14 00563 g005
Table 1. Surface energies of o-Fe7C3(001) surfaces with various terminations.
RankSurface TerminationSurface Energy (eV·Å2)Surface C Atom Coverage
1(001)0.200.140 (2.247) a0.33
2 b(001)0.090.153 (2.456)0.33
(001)0.590.153 (2.456)0.33
4(001)0.870.153 (2.458)0.33
5(001)0.810.156 (2.495)0.40
6(001)0.990.158 (2.529)0.60
7 c(001)0.410.160 (2.557)0.40
(001)0.910.160 (2.557)0.40
9(001)0.940.161 (2.582)0.40
10(001)1.000.164 (2.633)0.50
11(001)0.130.166 (2.657)0.17
12(001)0.060.179 (2.875)0.17
13(001)0.850.189 (3.032)0.00
14(001)0.150.192 (3.069)0.17
a The values in parentheses are the surface energies in J·m−2. b (001)0.09 and (001)0.59 are equivalent terminations. c (001)0.41 and (001)0.91 are equivalent terminations.
Table 2. Pre-exponential factors and reaction rate constants for CO* dissociation on o-Fe7C3(001) surfaces.
SurfacePre-Exponential Factor (ν) (s−1)Kinetic Barrier Energy (eV)Reaction Rate Constant (k) (s−1)
o-Fe7C3(001)0.851.24 × 10120.914.26 × 104
o-Fe7C3(001)0.131.21 × 10121.488.66 × 10−1
o-Fe7C3(001)0.201.30 × 10121.857.95 × 10−4
o-Fe7C3(001)0.091.48 × 10121.747.72 × 10−3
o-Fe7C3(001)0.991.22 × 10121.951.06 × 10−4
Publisher’s Note: MDPI stays neutral with regard to jurisdictional claims in published maps and institutional affiliations.

