Article

Combined Use of Solar and Biomass Energy for Sustainable and Cost-Effective Low-Temperature Drying of Food Processing Residues on Industrial-Scale

DBFZ Deutsches Biomasseforschungszentrum Gemeinnützige GmbH, Torgauer Straße 116, 04347 Leipzig, Germany
*
Author to whom correspondence should be addressed.
Energies 2021, 14(3), 561; https://doi.org/10.3390/en14030561
Submission received: 30 November 2020 / Revised: 13 January 2021 / Accepted: 19 January 2021 / Published: 22 January 2021

Abstract

:
In this study, a low-temperature drying plant based on renewable energies to dry food processing wastes is investigated. The demand-oriented heat supply is realized by a solar wall in combination with a biomass boiler. Due to the operational complexity of such a system with different sub-units and process parameters, steady-state simulations were performed in Aspen Plus to provide an insight into the process. Moreover, a time-resolved energetic evaluation was conducted to analyze the influence of varying capacity of the heat sources and operational strategy in addition to economic calculations. The simulations showed that an overall control strategy needs to consider the air properties as well as the flow rate of wet input material. In the reference case, the boiler must be operated at full load through the year to supply as much heat as possible. The revenue from the dried material was the most crucial parameter on the drying economics. Although the current plant configuration operating at 12 h per day and five days per week enable feasible results, the drying process can be more profitable by doubling the boiler capacity and increasing operational hours to 24 h per day and five days per week. The proposed plant can provide an environmentally friendly and cost-effective solution for the re-valorization of food-processing wastes into added-value compounds.

1. Introduction

Currently, the global population increase has caused a serious waste management problem, especially in food production and consumption [1,2,3]. One-third of the produced food in Europe is not consumed, and waste occurs at all stages of the supply chain. Accordingly, the EU annually generates nearly 90 million tons of food waste, which is an important environmental challenge, not only in terms of resource efficiency but also because food waste alone corresponds to about 8% of global greenhouse gas (GHG) emissions [2,4]. In this regard, minimization of food waste plays a significant role to reduce GHG emissions, to balance future supply and demand more sustainably as well as to protect biodiversity and the resources (i.e., freshwater, soil, and energy) used at all stages of the food value chain [5].
According to The European Commission’s Directive 2008/98/EC, a variety of strategies for waste management are recognized as key principles [5,6]. However, food waste management is one of the challenging areas to tackle in the EU’s Roadmap to “Resource Efficient Europe”, considering the large production volume of the food and beverage industries that represents the biggest manufacturing sector in the EU [7]. Therefore, sustainable circular economy strategies rather than conventional food waste processing (e.g., incineration and composting) shall be facilitated in the future [8]. In particular, food processing wastes are rich in functional bio-compounds, which can be used in nutraceuticals and pharmaceutical industries [4]. In this regard, an appropriate technology should be carefully selected to re-utilize these valuable compounds for further applications. Drying, as one of the most common industrial processes, can provide an alternative solution in this regard [9,10].
In addition to the challenges in waste management, increasing the share of renewable energy sources in long-term energy projections constitutes an essential task for energy intensive industries. Although renewable sources have many promising application areas individually, hybrid systems (in which more than one of these technologies are combined) have gained considerable attention lately for compensating their drawbacks along with their flexibility in operation [11]. Among them, the application of solar energy in the drying sector has been one of the most environmentally friendly technologies with low operational costs [12]. Yet, the drawback of solar drying is that the solar radiation depends on the seasonal and daily weather fluctuations [13]. To overcome this, solar drying can be coupled with an auxiliary biomass-based unit for heat generation to realize a continuous drying process in case the solar heat provision is insufficient. There are several studies available dealing with the combination of solar and biomass technologies coupled with a drying process in which many aspects, i.e., the comparison of the operational modes (solar, biomass, and biomass-solar) [13,14], the process design [15,16], modeling of the process with different software tools (i.e., Computational Fluid Dynamics (CFD) or Matlab) [17,18] or economic feasibility of the process [19] were discussed. It is important to highlight that these studies offer simple solutions for the local applications in relatively hot regions to dry locally available products or wastes [13,14,15,16,17,18,19,20,21]. Most of these drying set-ups are small-scale up to 100 kg and designed with multiple trays or drying chambers, which are batch operated. These kinds of basic designs are based mostly on natural convection without any pumps or other sub-systems, enabling easier process control. On the other hand, only a few of these studies focused on the economic feasibility of the proposed hybrid plants [19,20]. However, coupling solar and biomass for drying materials with higher moisture on an industrial-scale can be quite challenging [22]. Thus, each operational aspect, the plant location and design, type of the material to be dried and its further application areas in the market, as well as the economics of the process, should be considered carefully. Due to weather-dependent behavior of such a continuous plant with different sub-units and many process parameters is complex, especially in terms of control strategy. Moreover, the techno-economic analysis of the plant operation should also be considered by taking investment and operational costs into account to determine the optimum plant capacity and operational strategy. In this regard, Di Fraia et al. developed an integrated industrial drying system for sewage sludge based on solar energy and a combined heat and power unit fueled by biogas [23]. The authors used an existing wastewater treatment plant in Southern Italy as a case study. The simulations were carried out using TRNSYS and Aspen Plus. In the study, not only important operational parameters but also the economic feasibility of the proposed plant were discussed and compared with the current plant design [23]. The authors reported that integration of solar energy with combined heat and power system enabled 14.6% primary energy saving compared to existing plant design. Based on the economic calculations, they found out that the simple payback period of the proposed plant was 3.40 years, and increasing the capacity of the solar system had a negative influence on the economic performance of the system. To the best of the authors’ knowledge, such an industrial drying system based on renewables has not been published in the segment of food waste valorization yet.
In this regard, this study focuses on the development of a sustainable and alternative low-temperature drying technology for the re-valorization of food processing wastes. It is important to highlight that the proposed process was based on a pre-existing pilot plant located in Chiloeches (Guadalajara, Spain), which was operated solely on solar energy for drying of brewery spent grains (BSG) to be re-utilized in the market. To ensure a continuous drying process by compensating for the drawbacks of solar energy, especially during the night, a biomass boiler was integrated as a back-up heating system. In the proposed plant, the application of low-temperature drying, in which inlet hot gas temperature does not exceed 75 °C to preserve the valuable nutrition in the dried product that will be sold as animal feed in the market, is a key aspect. Unlike most of the small-scale locally available drying units discussed in the literature, the renewables-based drying plant in this study is an industrial scale plant in which the influence of not only the operational but also economical parameters become more critical. Thus, the objective of this study was to determine the optimal thermodynamic and economical design of the drying plant, which has to be operated solely based on solar and biomass energy.

2. Materials and Methods

2.1. Process Description

The process development was based on a drying plant that utilizes solar energy to dry a variety of waste materials. A biomass boiler was integrated to compensate for the drawbacks of solar energy not only due to the seasonal and daily weather fluctuations but also to ensure a continuous drying process during nights. The reference design of the drying plant consists of a solar roof with a two-stage SolarWall® (SW), which was equipped with panels and directs the inbound fresh air through two heating stages with an area of 2500 m2, a double-pass rotary dryer, and a multi-fuel biomass boiler with a thermal output of 950 kW. The biomass boiler and the double-pass rotary dryer was coupled with an air-water heat exchanger. The drying air temperature was limited to 75 °C to preserve the valuable nutrition in BSG, while the flow rate of drying air was also limited to max. 180,000 m3/h within the system. Based on their local and seasonal availability, different biomass residues (e.g., almond shells, olive stones, and wood from wine grape pruning) can be used as fuel in the boiler. In this study, BSG with a high moisture content of 80 % (wt.) was selected for the valorization by drying, whereas wood pellets were selected as fuel for the combustion process. The properties of both materials are summarized in Table 1.

2.2. Aspen Plus Modelling

In this study, Aspen Plus version 10 was used to develop the low-temperature drying process model. Biomass was defined as a “non-conventional” compound due to its heterogeneous nature, referring to the fact that it does not participate in phase or chemical equilibrium calculations unless it is converted into its conventional compounds [24]. Representation of “non-conventional” materials is mostly provided by the respective component attributes based on its proximate and ultimate analyses, Table 1. Two main properties of biomass, density, and enthalpy, were computed using “DCOALIGT” and “HCOALGEN” models, respectively. Peng-Robinson cubic equation of state (PENG-ROB) was selected as a physical property method considering the proposed system consists of a combustion process, where hydrocarbons are formed during a high-temperature process [25]. The process flowsheet that is displayed in Figure 1 was divided into three sub-sections, including (i) SW, (ii) double-pass rotary dryer, and (iii) biomass boiler. The SW with slope of 8° oriented south, absorptivity with 0.95, and an absorber type of perforated galvanized steel plate were not modeled in Aspen Plus. The properties of the ambient air (i.e., temperature and humidity) were calculated using TRNSYS software (version 17) based on Meteonorm® weather data, which was calculated from the average data of several years from [26] for the corresponding location. For every time step, conversion efficiency was calculated based on the air mass flow. The correlation was extrapolated from the available certificates of the SolarWall®. Afterward, these data were introduced as input data to Aspen Plus. AIR-101, i.e., heated air coming from the SW, was transferred via fans and entered, as AIR-102, either (i) into an air-water heat exchanger unit to increase its temperature up to 75 °C or (ii) by-passed the heat exchanger by entering directly into a double-pass rotary dryer, in case the temperature of AIR-102 is high enough for the drying process, especially on hot summer days. BSG was conveyed from a hopper to the double-pass dryer.
Aspen Plus offers different types of dryer models such as shortcut, convective, spray, and contact dryer. In this study, a convective dryer model was selected, considering the installed rotary dryer is a convective dryer type, which is commonly used to dry a variety of industrially produced solid materials with different characteristics [27]. To represent the characteristics of the double-pass dryer, two dryer models were cascaded (i.e., DRYER-1 and -2) similar to [28]. The convective dryer model requires three types of specific information, including physical properties of the dryer, heat and mass transfer properties, and data for the drying kinetics. The summary of the input data for each dryer together with the assumptions in the model can be summarized as follows:
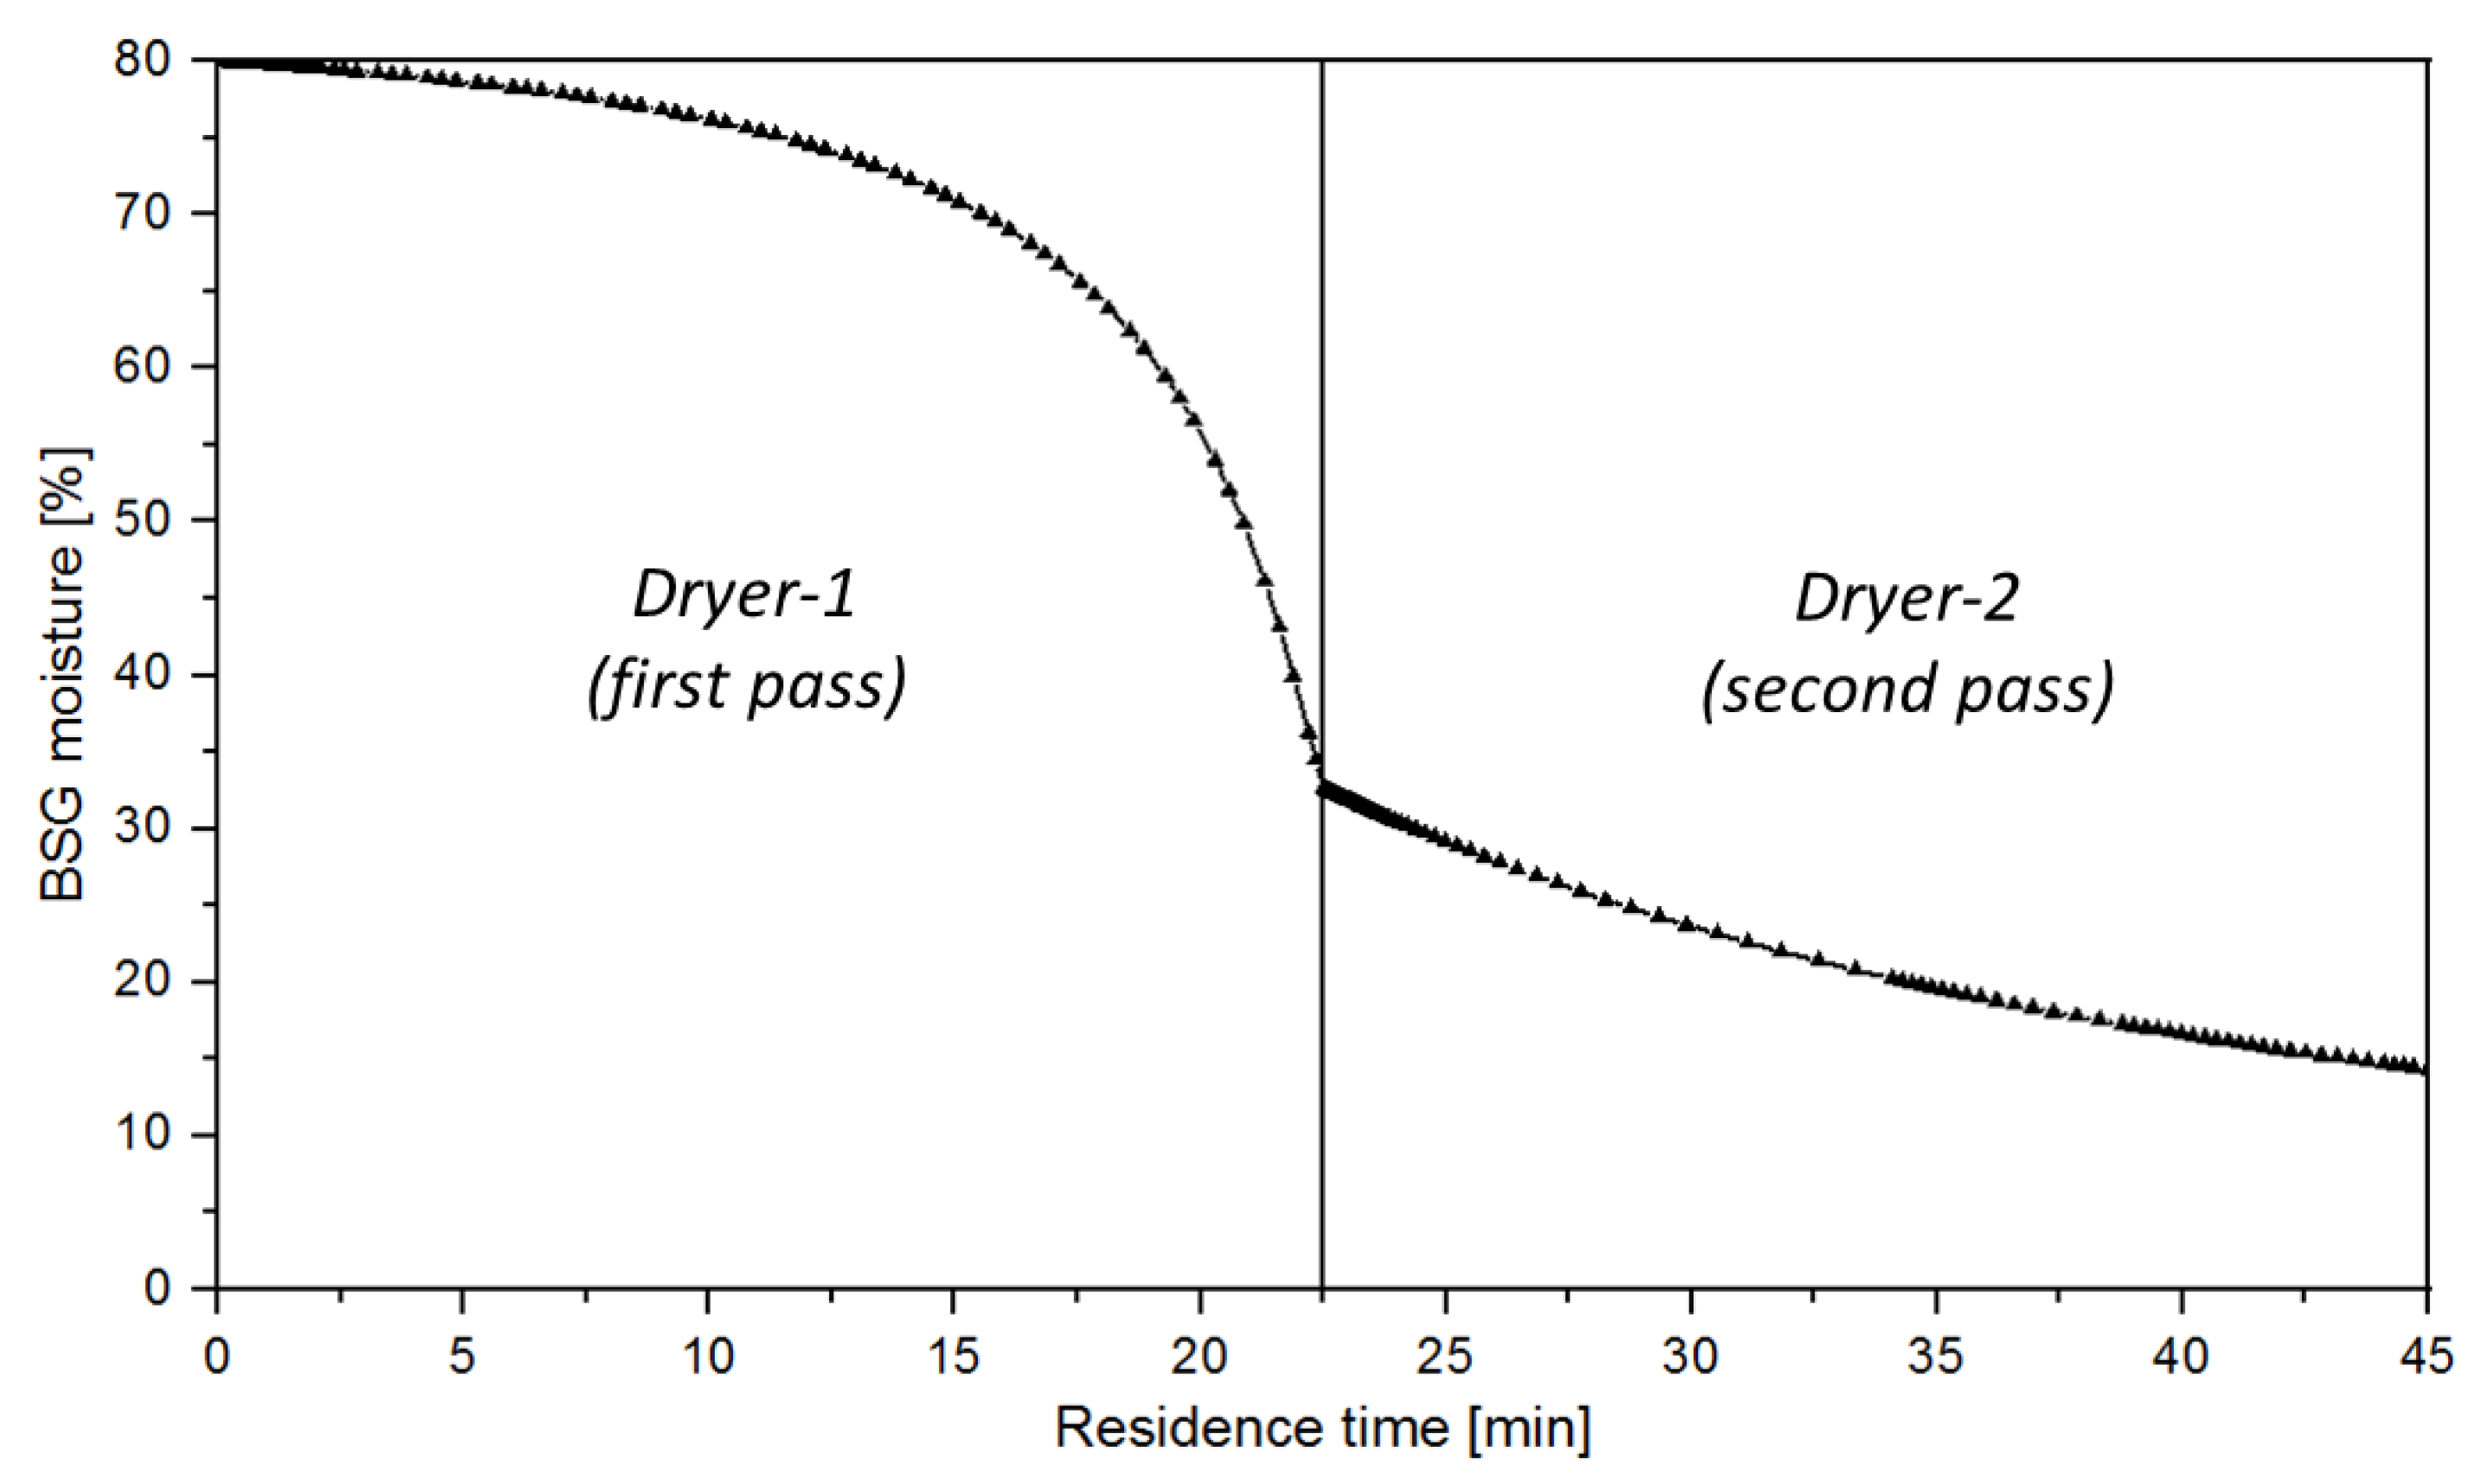
  • Dimensions: length and diameter of each pass is 9 m, and 1.5 m, respectively.
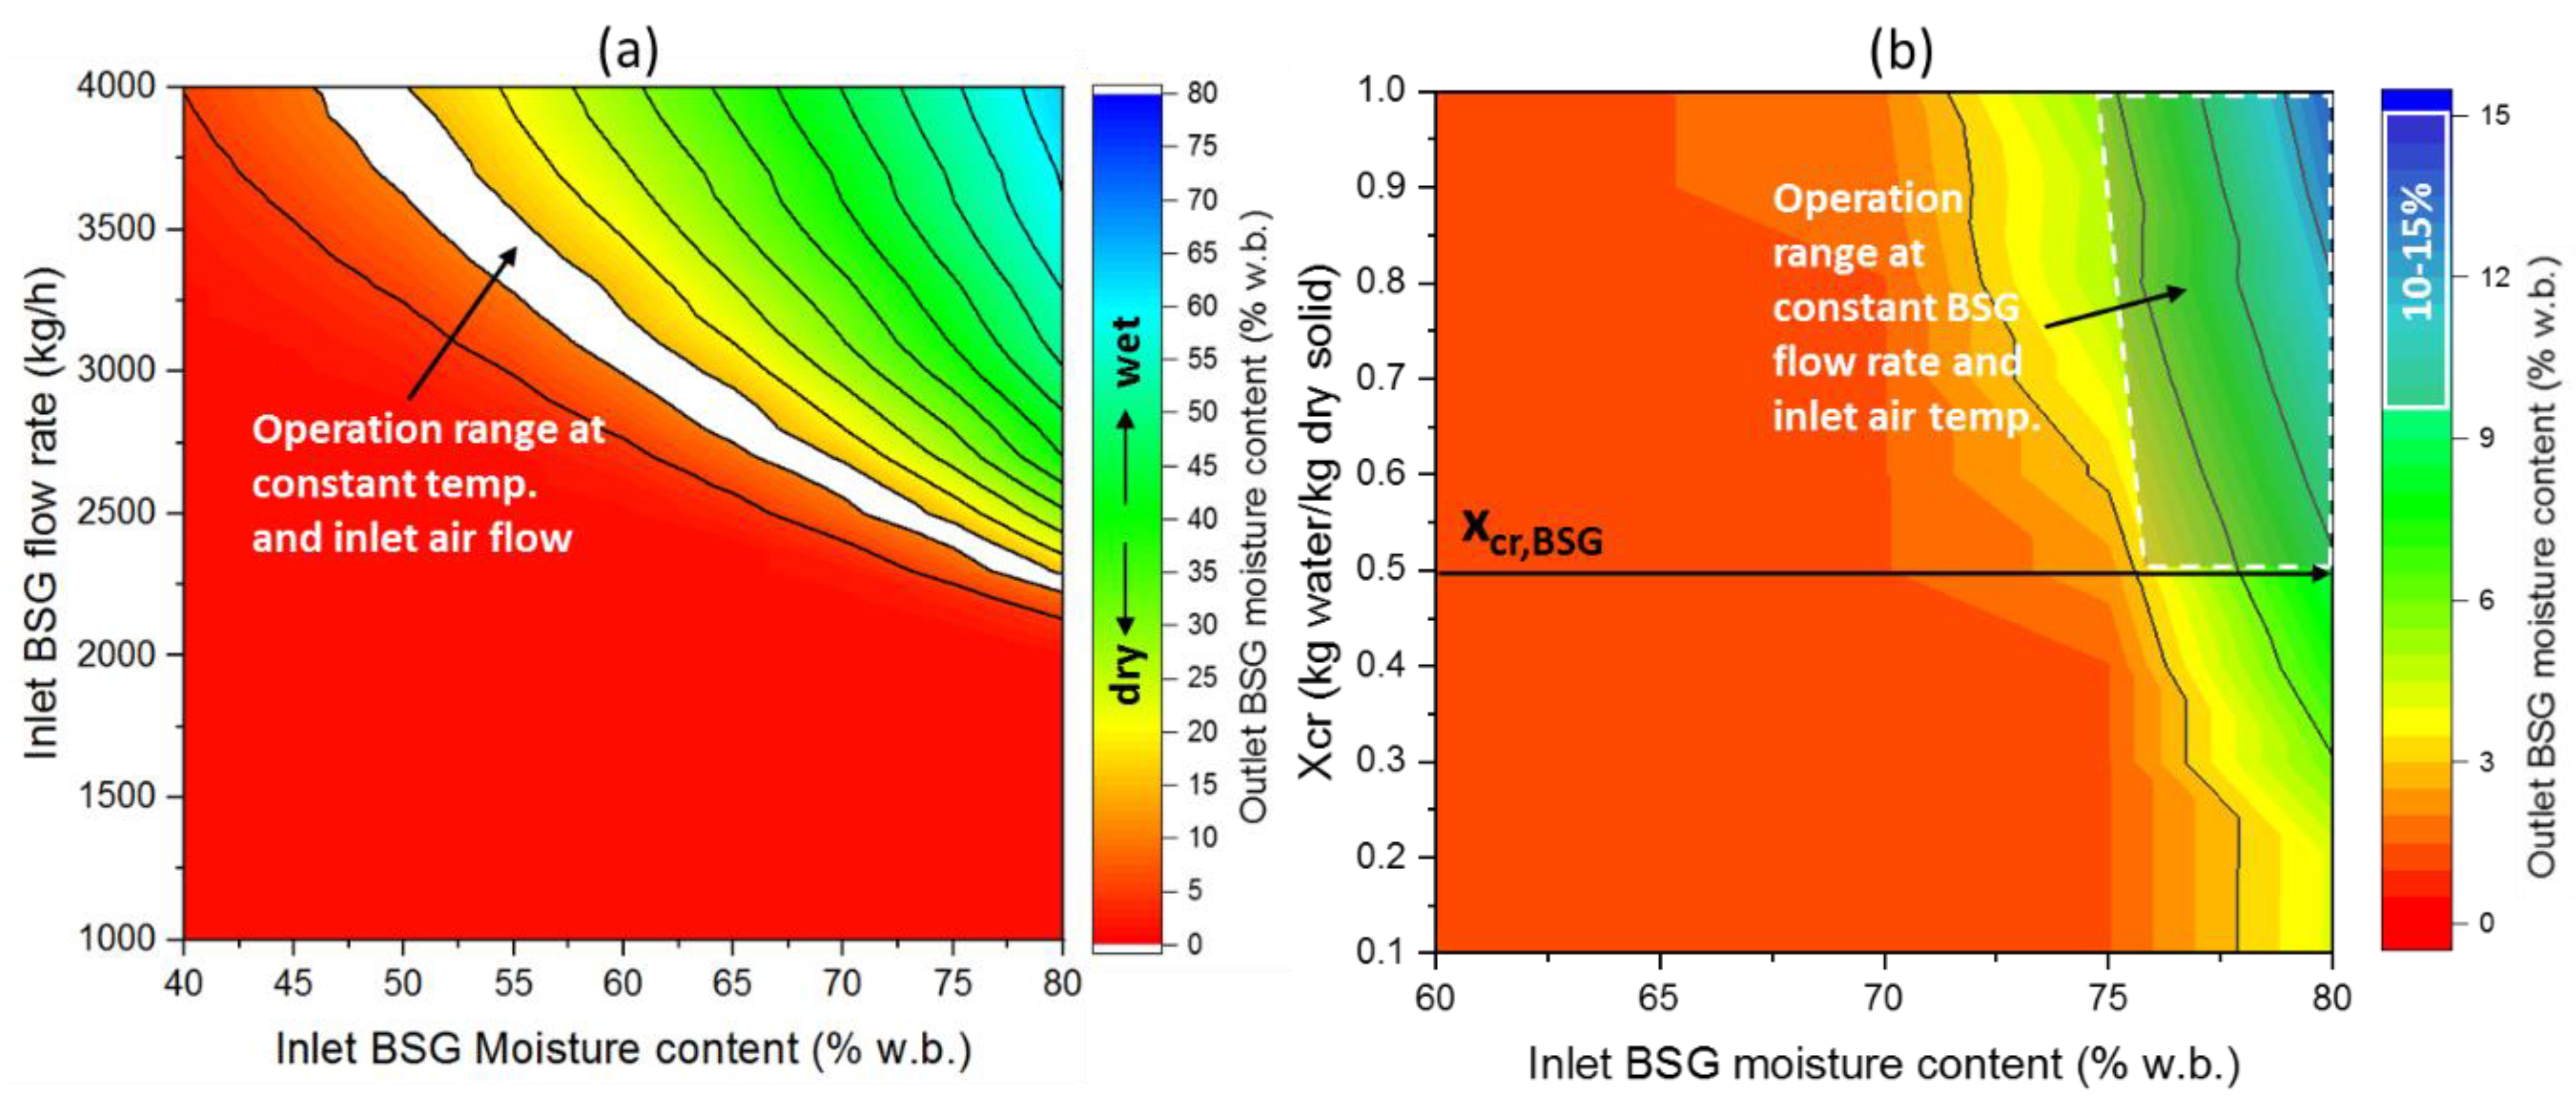
  • Information on the drying curve, critical (Xcr), and equilibrium (Xeq) moisture of the material, as well as heat and mass transfer coefficients to develop a model based on drying kinetics, can be found elsewhere [29]. In this study, Xcr is defined as critical moisture at which further evaporation is mass-transfer limited with a constant drying rate. It was set to 0.8 kgwater/kgdry solid considering the critical moisture of food and sludge-like materials being between 0.4–0.8 kgwater/kgdry solid [30]. The equilibrium moisture Xeq, defined as the moisture at which the remaining moisture in the solid is in equilibrium with the moisture with the surrounding atmosphere. It was set to 0.015 kgwater/kgdry solid [31].
  • The main assumptions in the dryer model can be summarized as follows:
    • The dryer is adiabatic (no heat losses) [32].
    • Drying gas and the solids passing through the dryer are considered as plug flow. Thus, complex solid material flow characteristics in the rotary dryer were neglected [33].
    • Ideal mixing of the particles inside the dryer in a lateral direction was assumed [32].
    • The moisture and temperature are spatially constant in each particle [32].
    • The total solid residence time was set to 45 min [30,34].
    • A co-current gas flow was considered for drying of heat-sensitive products with higher drying rates [33].
    • The number of transfer units (NTU) was set to two, since the NTU generally varies between 1.5–2.5 for rotary dryers [34,35].
    • In total, wet BSG material of 20,000 tons per year was set as the target amount.
The required heat for the heat exchanger was provided by a multi-fuel biomass boiler (Ökotherm®, Compact 6CL). In this study, wood pellets were selected as fuel, and their properties are given in Table 1. The boiler was modeled based on consecutive decomposition and combustion stages using RYield and RGibbs blocks. A calculator block “DECOMP-C” (see Figure 1) was integrated to convert the woody biomass fuel into its conventional gaseous compounds (C, H2, O2, N2, S, Cl2, H2O, etc.) while in the RGibbs block combustion of the gaseous compounds was modeled based on an equilibrium approach. The combustion heat was transferred to two inter-connected heaters (i.e., HEATER-1 and -2) to increase the water temperature from 65 to 85 °C. Another calculator block, “BOILREF-C” was integrated between the heaters to re-calculate the heat output of the boiler. The hot water is provided with a boiler efficiency of 90 % at a temperature of 85 °C to the air-water heat exchanger unit to heat up AIR-102, i.e., the air coming from the SW prior to the inlet of the dryer. The air-water heat exchanger was modeled using the “shortcut” method and the fouling in the heat exchanger was neglected in the model. In the simulations, the air-water heat-exchanger capacity was limited to 855 kW, which is equal to the nominal heat output of the boiler. In Table 2, the main process specifications used in the Aspen Plus simulations are summarized. The specific parameters of the dryer were kept constant during the simulations.
The simulations were performed to investigate process behavior regarding the development of a system controller based on two strategies:
(a)
A constant BSG flow rate at the dryer inlet.
(b)
A constant air inlet temperature of 75 °C.

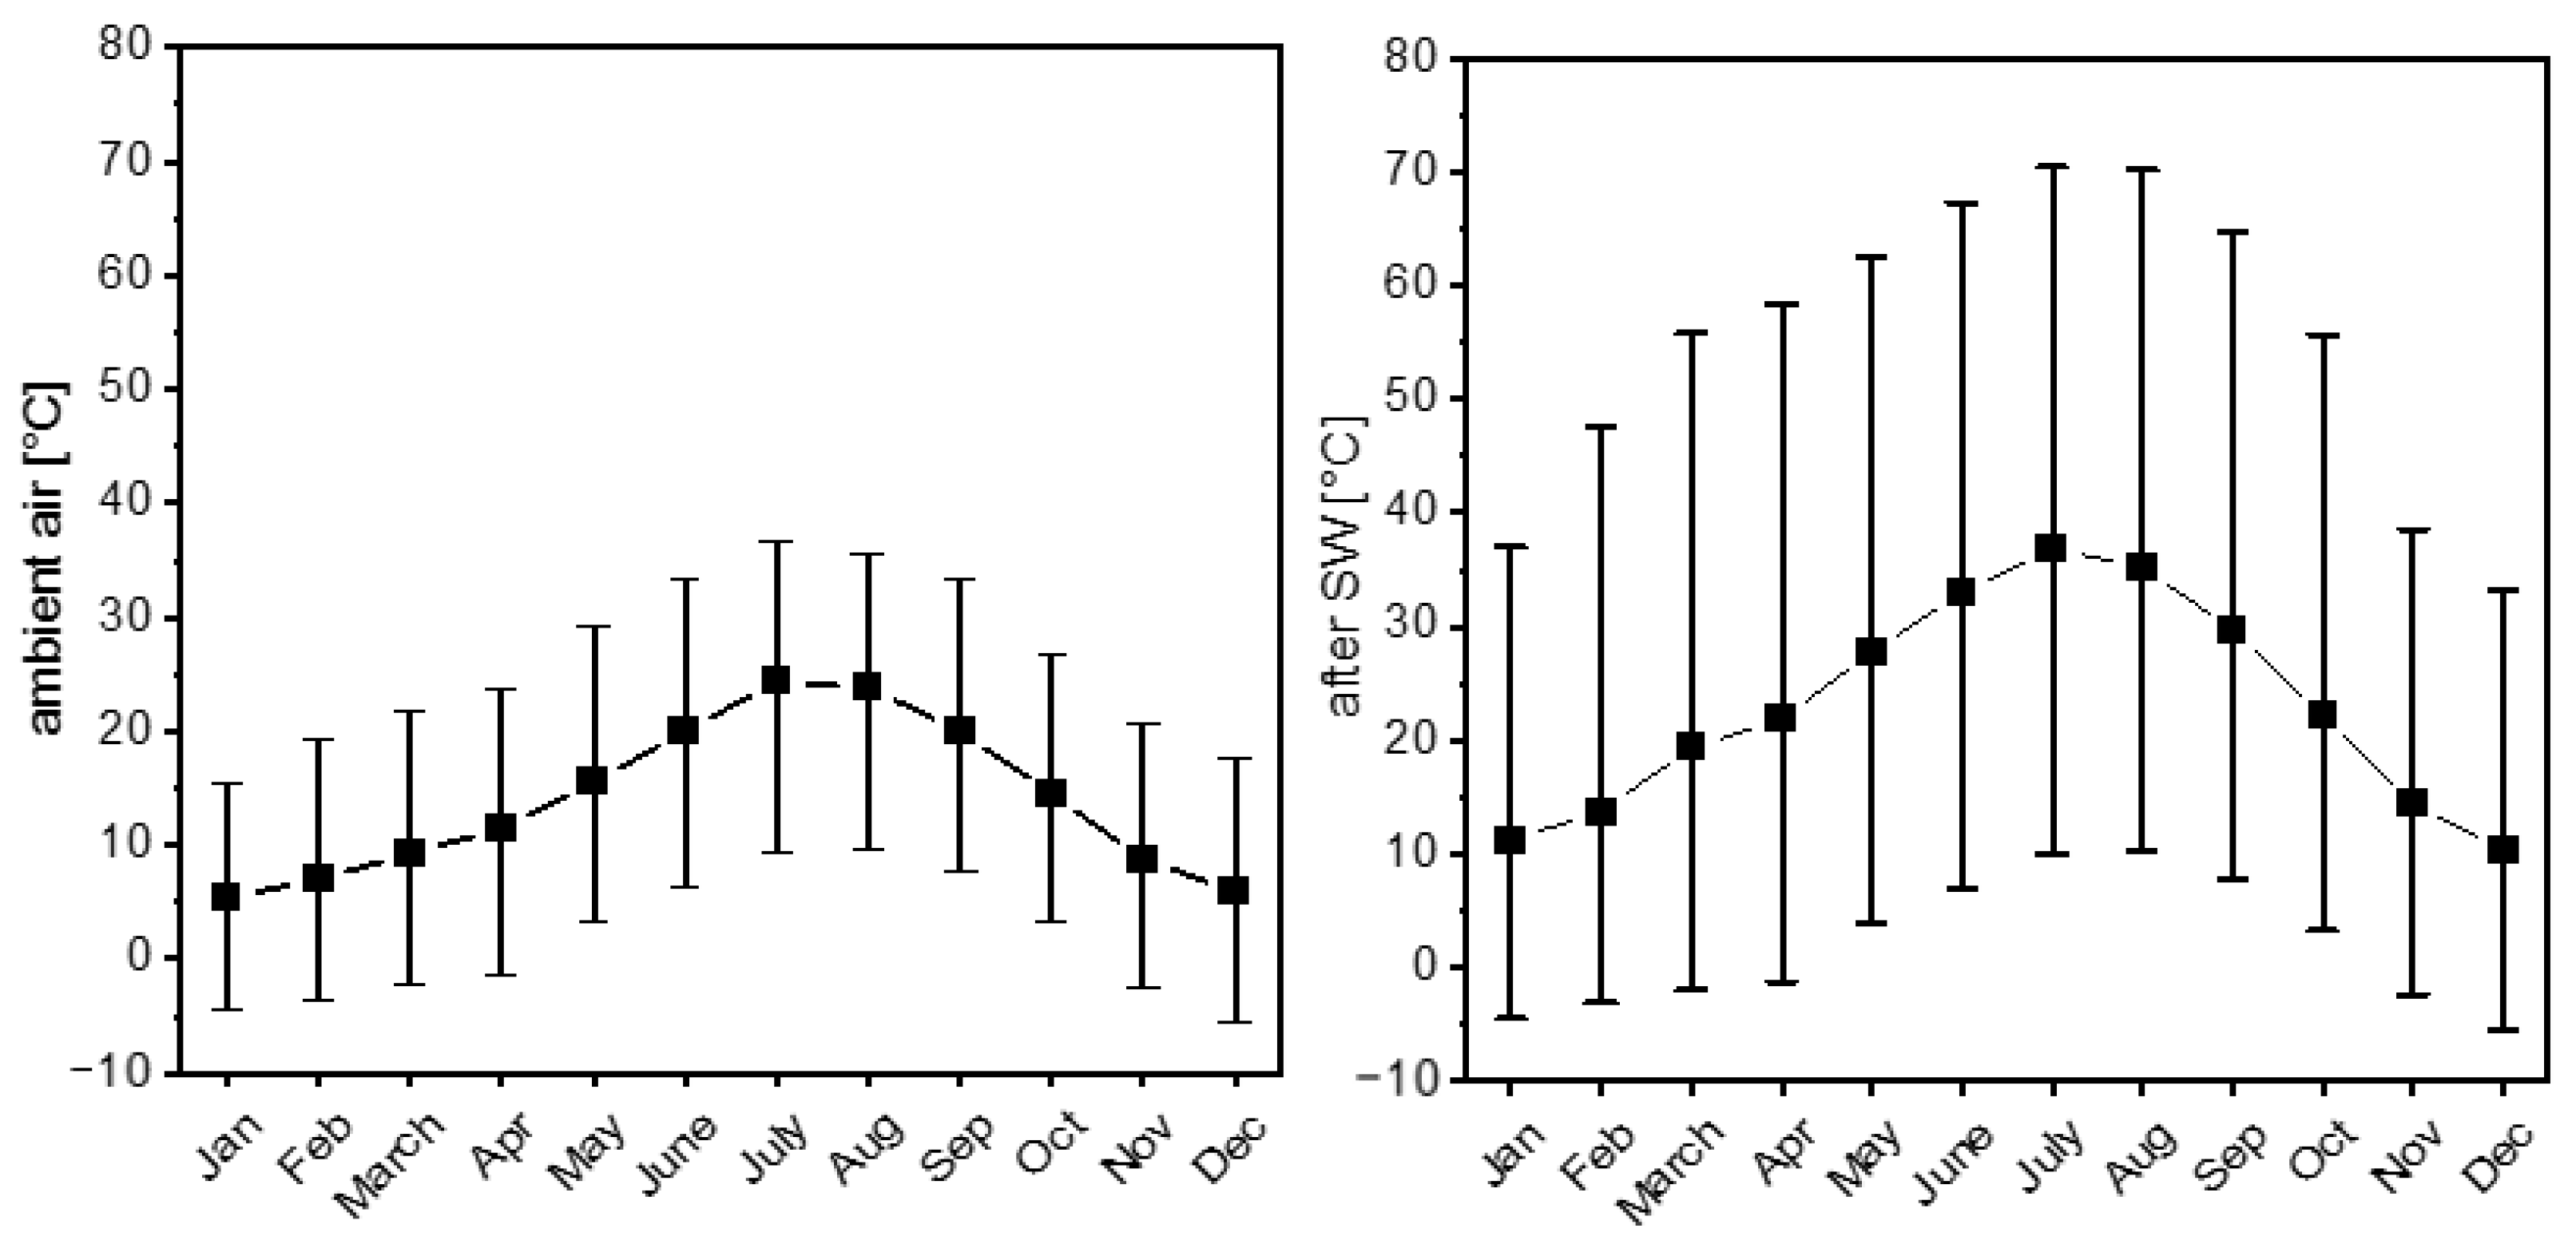
2.3. Parameter Variation and Weather Data Selection for the Aspen Plus Simulations

Drying is affected by many operational parameters such as the temperature, flow rate, moisture as well as the physical characteristics of the drying air and material to be dried. Furthermore, design parameters of the dryer such as length, diameter, the slope of the dryer play a role [36]. To investigate the impact of the operational parameters on the drying process, a sensitivity analysis was performed in Aspen Plus. Steady-state process simulations were performed individually for selected representative days, since the dynamic behavior of the proposed low-temperature drying process depends on the seasonal and daily fluctuations in the solar radiation. Figure 2 shows the average, minimum and maximum air temperatures before and after SW in the aforementioned location. Accordingly, based on the average temperatures, the coldest month (5.4 °C), the hottest month (24.3 °C), and the average month (14.5 °C) were determined for January, July, and October, respectively. The absolute humidity of the ambient air varied between 0.002 and 0.014 kg/kg throughout the year. The simulations were performed for the average of October as the basis for investigating the operational boundaries of the process in terms of varying inlet air properties (i.e., temperature and flow rate) and product flow rate, i.e., dried BSG. To study the influence of the weather fluctuations on the drying process, three different representative dates, including the corresponding day and night times, were selected. The summary of the selected days and the temperature and the absolute humidity of ambient air are listed in Table 3. The “day” term (D) indicates noon (12:00), while the “night” term (N) indicates midnight (00:00). The variations in operational parameters were studied based on these conditions.

2.4. Techno-Economic Analysis

To realize an in-depth economic analysis, a time-resolved thermodynamic calculation of the drying process was performed on the basis of 5 min time intervals over one year. Thus, the exploitable energy and operational hours from both renewable heat sources as well as the amount of monthly and annually dried material can be determined. The calculations were performed based on the following assumptions:
-
Isenthalpic drying process with constant moisture of the BSG of 0.8 kg/kg at the inlet and 0.15 kg/kg at the outlet of the dryer.
-
No thermal capacities of the plant equipment were considered.
-
Maximum air humidity at the dryer outlet was set to 75%.
-
The inlet air temperature into the dryer was kept constant at a maximum of 75 °C while the maximum inlet air flow rate within the system was limited to 180,000 m3/h.
-
Technical limitations of the dryer and drying process (e.g., rotational speed, residence time, and equilibrium moisture) were not considered.
Table 4 summarizes all equations used in these thermodynamic calculations. Briefly, the ambient air properties; temperature and humidity in addition to sloped radiation were taken from TRNSYS as input parameters to calculate the density (Equation (1)), saturation vapor pressure (Equation (2)), partial water vapor pressure (Equation (3)), absolute humidity (Equations (4) and (5)) and enthalpy (Equation (7)) of the ambient air. Following that, the mass flow rate of air was calculated iteratively until the required boiler capacity is equal to its maximum available capacity. The required amount of heat to reach the target air temperature was calculated using the first term of Equation (8). The second term of Equation (8), also equals to Equation (9), describes the heat output of the SW. The air temperature after SW (AIR-102 in Figure 1) was determined based on Equation (11), whereas the air temperature after heat exchanger (AIR-103 in Figure 1) was specified with the same equation using the required boiler heat (Pboil) parameter instead of the solar power (Psol) parameter. The enthalpy of air entering the dryer (AIR-103 in Figure 1) was calculated using Equation (7). The air temperature at the dryer outlet (AIR-105 in Figure 1) was determined iteratively until the targeted relative humidity was achieved. The water removal from the wet BSG material was calculated using Equations (13) and (14). Finally, the amount of annually dried raw material (DRYBSG in Figure 1), which will be sold as “product” was specified according to Equation (15).
Following that, a detailed cost analysis of the drying process was performed. The assumptions employed in the cost calculations are summarized as follows:
-
The calculations were based on the control strategy b in which inlet air temperature into the dryer was kept constant at 75 °C as done in Aspen Plus simulations (cf. Section 3.1).
-
The dryer design was assumed to be the same in all cases, while the capacities of the renewable heat sources (i.e., SW area and boiler capacity) were varied. The maximum input flow rate of the wet BSG material into the dryer is set to 4.0 t/h.
-
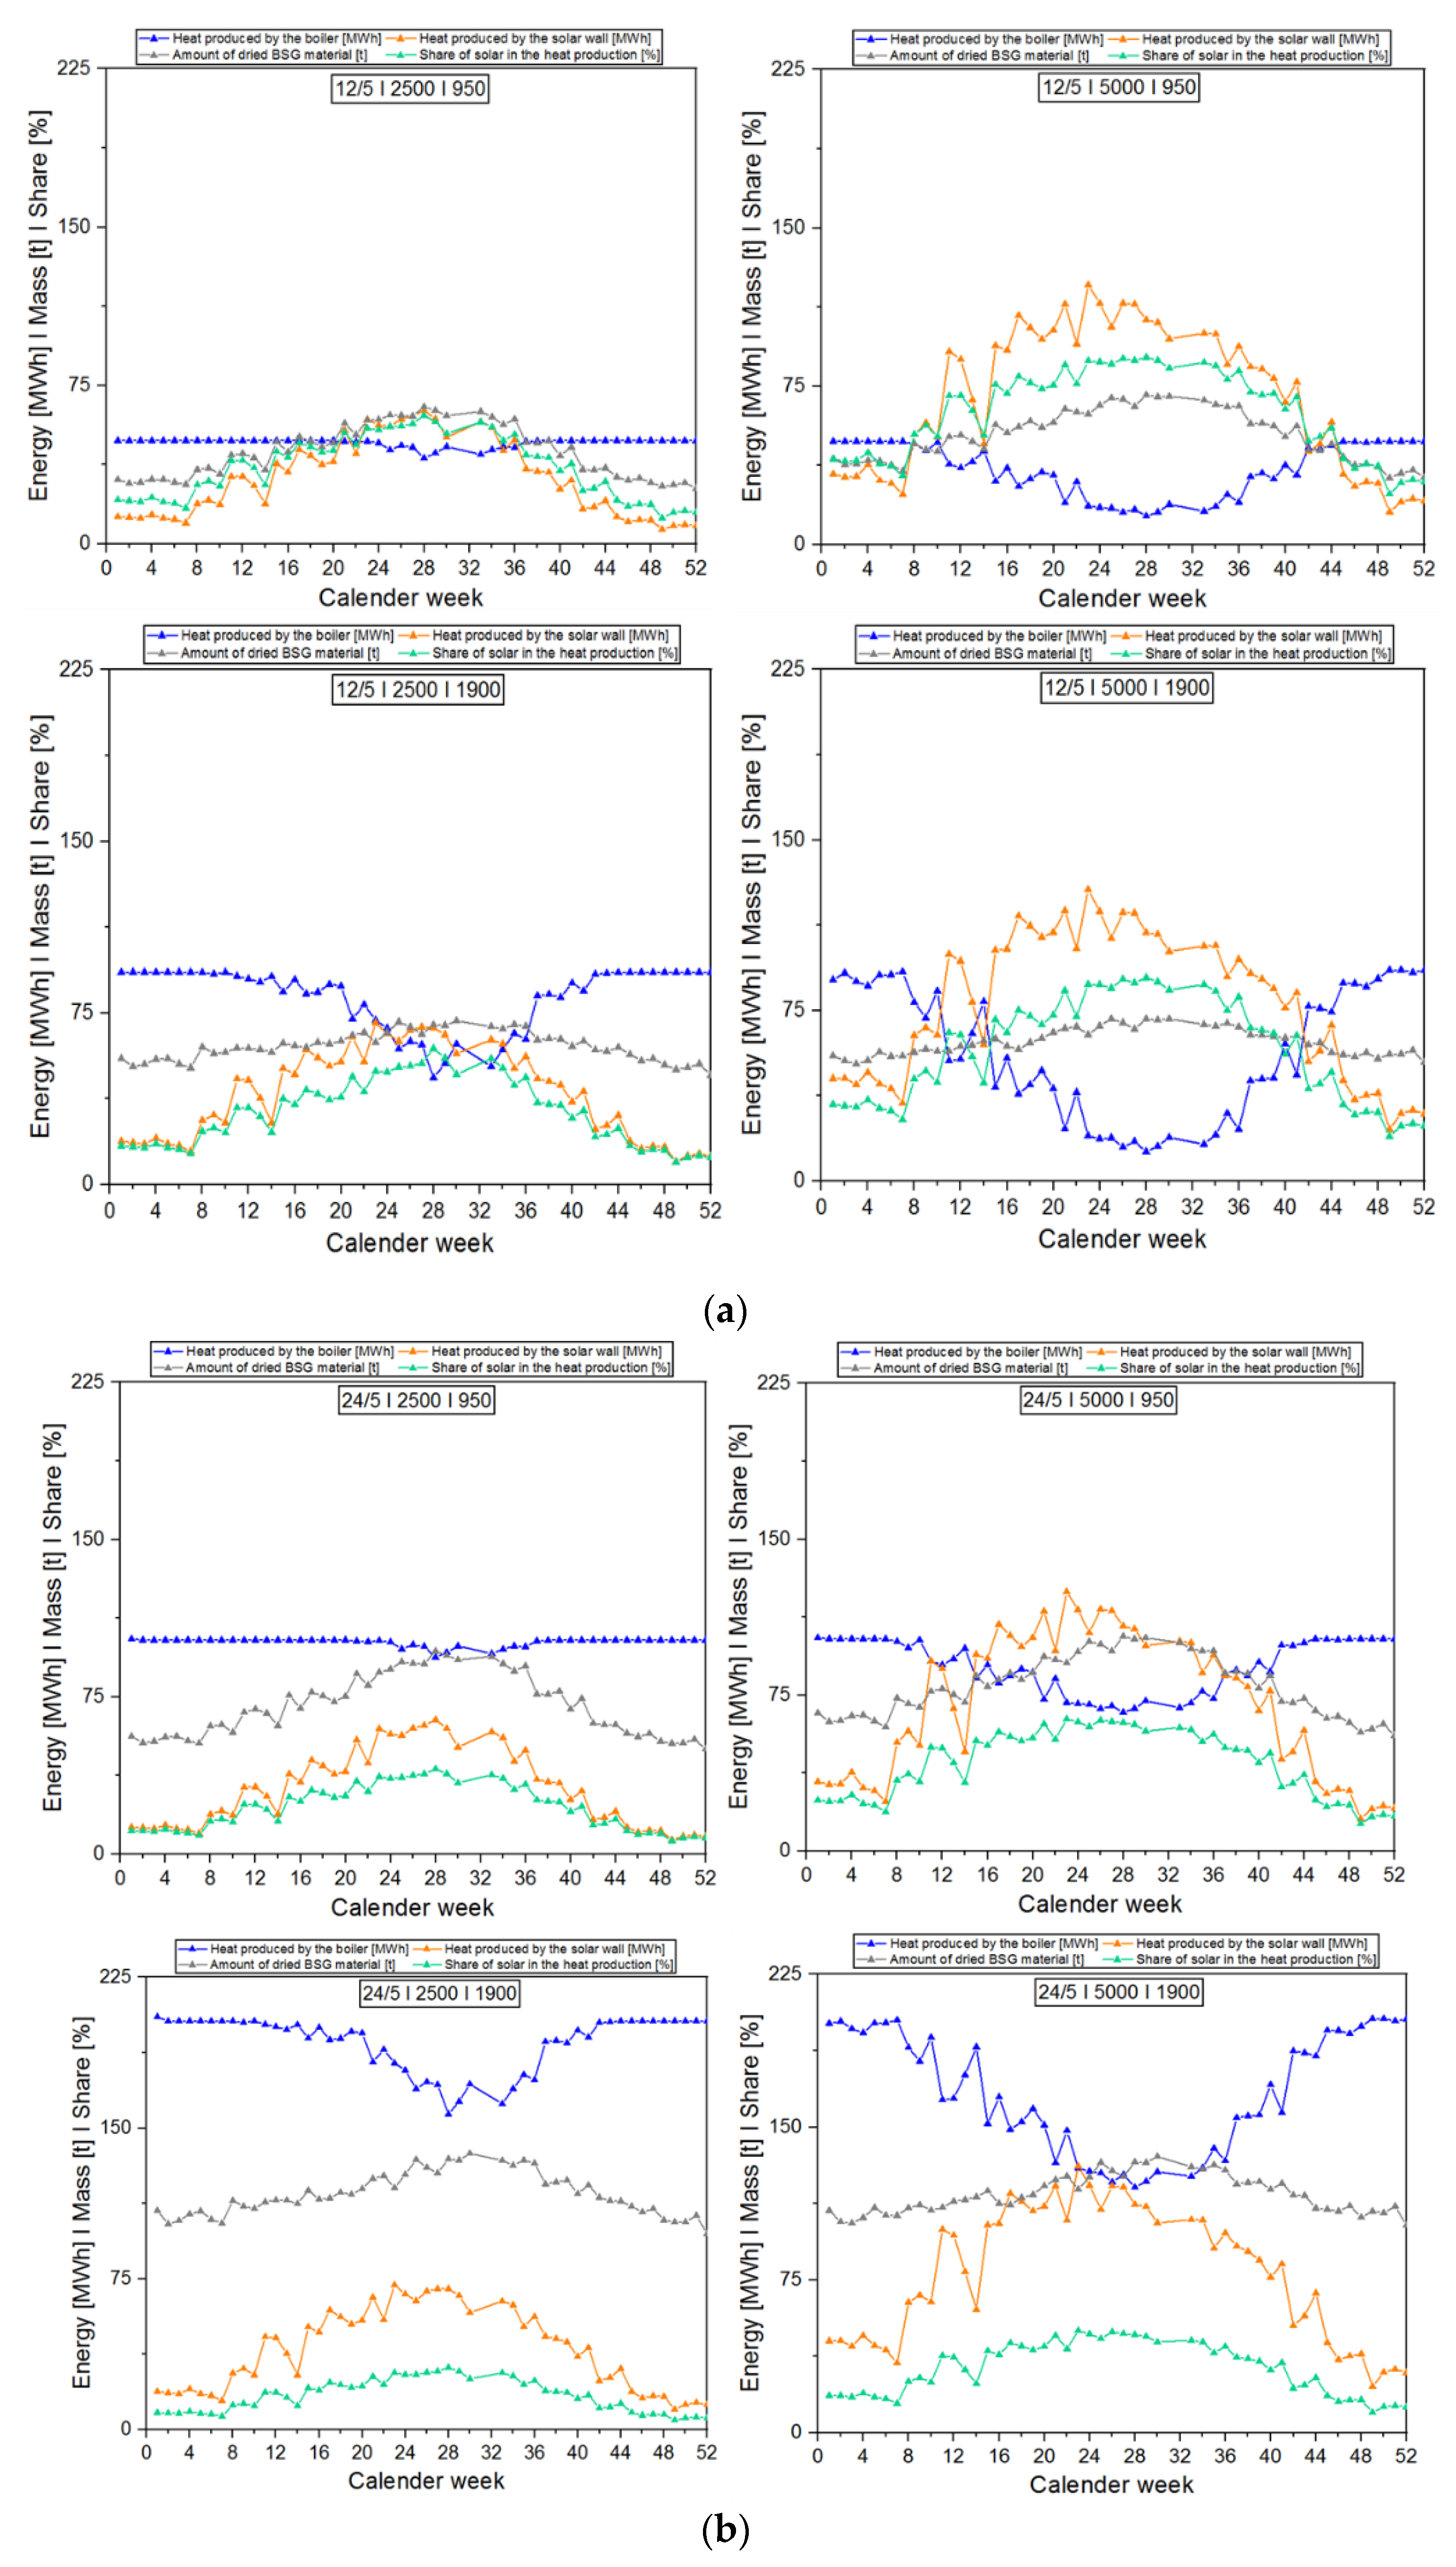
For a better comparison, the calculations were performed based on two operational strategies; 12 h/day and five days per week, as well as 24 h/day and five days per week. These will be shortly referred to as 12/5 and 24/5 within the text, respectively. The plant was operated between 9:00–17:00 in case of the operational strategy 12/5.
-
Reference design” refers to the plant configuration with 2500 m2 SW area and 950 kW boiler, unless otherwise is indicated in the text.
-
The calendar weeks 31 and 32 were planned for yearly maintenance; therefore, no plant operation occurred during this period in all scenarios.
A sensitivity analysis was carried out for the reference plant configuration for both operational strategies. The specific revenue (€/t), biomass fuel price (€/t), SW price (€/m²), SW area (m2), boiler capacity (kW) and investment costs of boiler and SW (€) were selected as input parameters for the sensitivity analysis since these parameters were assumed to be the most influential parameters on the annuity.
Table 5 summarizes the cost parameters and the specific costs in addition to other process-related parameters used in the cost calculations. The details of the annuity method used in cost calculations as well the parameters including annuity factor, cash value factor, and price-dynamic factor can be found in VDI 2067:2012 [37].

3. Results and Discussion

3.1. The Operational Boundaries of Drying Process

In Figure 3a,b, the performance maps of the drying process are displayed, showing the effect of the inlet air flow rate, inlet air temperature, and the inlet BSG flow rate on the outlet moisture of the dried BSG material. In Figure 3a, the properties of A-101 (i.e., inlet air flow rate and temperature) were varied while residence time and flow rate of wet BSG into the dryer (i.e., WETBSG) was kept constant at 2300 kg/h based on control strategy a. Thus, the combination of the inlet air temperature and the air flow rate are important parameters to keep the outlet moisture content of the dried BSG within the desirable range. As given in Figure 3a, the required inlet air flow rate to the dryer, AIR-103, should be kept at least at 110,262 kg/h to ensure the BSG moisture within the range of 10–15 wt.% at the outlet of the dryer. Above the maximum inlet air temperature (75 °C), the dried BSG material can become over dried, which is undesirable for the preservation of nutrient content. It is also possible to perform the drying process at temperatures lower than 75 °C by increasing the inlet air flow rate. As depicted in Figure 3a, the minimum inlet air temperature was limited to 55 °C for this configuration at a maximum inlet air flow rate. Throughout the year, there are 6513 data points (corresponding to a total time of 22.6 days) in which the temperature of stream A-101 fluctuates between 55–75 °C from March to October. Thus, 6.2% of the drying heat can be supplied solely by the SW. In this regard, it can be possible to dry wet BSG material continuously for ~6 h based on solar energy during the daytime, especially on hot summer days in July and August. Below 55 °C, a targeted BSG moisture cannot be achieved with a constant flow of the wet BSG and a constant residence time in the dryer. In this case, it is expected that the product will be under dried. Over or under drying is one of the critical issues regarding the product quality in terms of texture, color, taste, and physical and chemical properties of the product, which directly affects the application areas [33]. Apart from that, an adaptation of the residence time of the BSG material by adapting the rotation speed of the drum would be another solution to ensure a target moisture content of the BSG at the dryer outlet.
Besides that, Figure 3b shows the influence of inlet BSG and air flow rates on the outlet moisture of the product (i.e., dried BSG) in case the inlet air temperature is kept constant at 75 °C (control strategy b). As depicted in Figure 3b, an increase of the inlet air flow rate led to an increase in the amount of wet BSG that could be dried, since the heat transfer rate between drying air and the product was improved, resulting in an increase in drying rate [28]. With this configuration, the drying of higher amounts of wet BSG was possible by adjusting the inlet air and wet BSG flow rate. However, it is important to note that reduction of the wet BSG flow into the rotary dryer is challenging due to longer residence times in the dryer, which results in dead times between 15–60 min between the measurement of the product moisture and the controlled flow rate of the wet BSG [33]. On the other hand, in this configuration, the biomass boiler should be operated as a back-up to keep the inlet air temperature to the dryer constant, independent of the weather conditions in order to compensate the temperature difference of the inlet air, AIR-101, provided by the SW. This control strategy leads to higher fuel consumption by the boiler not only during nights and cold winter days but also during day times and hot summer period.
These results are in correlation with the findings of Di Fraia et al. [23]. In their study, sewage sludge with a moisture of 75% was dried based on solar and a cogeneration unit fueled by biogas. Similarly, the authors have used Aspen Plus to model the drying process using a convective dryer model to investigate the drying process depending on different process conditions. Accordingly, it was concluded that an increase in the drying temperature caused a decrease in the flow rate of the drying agent for fixed target-moisture content. The results also showed that the moisture content decreased as the flow rate was increased in case the drying temperature kept constant.
In addition to the flow rate and temperature, the humidity of the inlet air is another important property that affects the drying process. In this regard, Figure 4 displays the influence of the absolute humidity of the inlet air stream on outlet moisture of the BSG for an inlet air flow rate of 110,262 kg/h. Although air humidity affects the outlet moisture of the BSG, it is not as influential as the inlet air flow rate or temperature.
Another sensitivity analysis was carried out to understand the influence of the BSG material properties on the drying process. According to Figure 5a, the amount of wet BSG material to be dried should be adjusted depending on the moisture of the inlet BSG material. In the case of BSG drying, the high initial moisture of 80% resulted in a limited operational range in which the set moisture of the outlet BSG could only be achieved by decreasing the inlet flow rate of WETBSG into the dryer (see Figure 1). Apart from that, the inlet moisture of the BSG material plays an important role during plant operation in terms of material stickiness, which is commonly observed, especially in food handling and drying [38]. Therefore, controlling the moisture becomes critical to provide better process control [28]. Although offline methods in which on-site sampling and oven drying are used to determine the moisture may be practical and cost-effective, but inadequate and inhomogeneous sampling and time-delays cause challenges for the process control. Hence, providing online moisture measurement can ensure a more reliable and continuous drying operation [39].
Furthermore, the type of the material is the most influential parameter on critical moisture, although it may depend on other parameters such as relative humidity and temperature of the ambient air [27]. In this regard, rotary dryers are able to process a variety of products, including grains, beans, nuts, vegetables, herbs, woody biomass, animal feeds, agricultural wastes, and by-products [30]. To understand the influence of the material type on the drying process, the critical moisture Xcr of the dried BSG was varied between 0.1–1 kgwater/kgdry solid based on the data for a variety of materials [40]. As depicted in Figure 5b, it can be emphasized that the double-pass dryer model is capable of representing the drying characteristics of the BSG material with higher initial moisture, which are characterized with Xcr above 0.5 kgwater/kgdry solid such as sludge, several foods, vegetables, fruits, etc. The results also indicated that the operational ranges determined within this study are meaningful for the current plant configuration and cannot be transferred to other drying products. Thus, the operational range has to be determined for each drying material individually by adapting drying kinetics data, especially Xcr and Xequ, as well as the design parameters of the model.
Table 6 shows the influence of weather fluctuations on the drying process in terms of variations of the inlet air and wet BSG flow rates in relation to the heat provided by the biomass boiler and SW on the selected reference days given in Table 3. In the simulations, the inlet air temperature to the dryer (AIR-103) was kept constant at 75 °C, i.e., the biomass boiler served the base-load. The maximum capacity of the air-water heat exchanger was limited to 855 kW, which is equal to the nominal heat output of the biomass boiler. This technical constraint resulted in a significant variation of the inlet air flow rates depending on the date and time. As given in Table 6, the maximum amount of wet BSG material was dried on the hottest reference day in July where the temperature of the air after SW (AIR-102) was heated up to 65 °C (see Figure 2). In this case, 3734 kg/h wet BSG material was dried at the maximum inlet air flow rate. However, the biomass boiler was operated with the base-load heat source during day and night, except for 1107D and 1010D. The amount of wet BSG to be dried was found to be minimum as 940 kg/h during the night time in January, 0901N, while 1340 kg/h wet material could be dried during day time, 0901D, considering lower heat provided by SW.
Apart from that, the drying profile along the two cascaded convective dryer models in Aspen Plus is displayed in Figure 6 for the selected representative day 1010D in October. Accordingly, most of the moisture (with an overall evaporation rate of 1616.2 kg/h) was removed in Dryer-1, which represents the first pass of the double-pass rotary dryer in the model. Hosseinabadi et al. concluded similar results in their study in which they modeled a rotary dryer with triple-pass [28]. Their results indicated that around 45% of the moisture loss occurred in the first pass of their investigated dryer. This is mainly caused by the higher mass driving force at the beginning of the drying process due to the greater vapor pressure difference between particles and drying air. As the materials inside the dryer moved towards the dryer outlet, the moisture removal decreased slowly since the mass driving force decreases, and the particle moisture approached equilibrium [28,39]. In parallel, the removal of the remaining moisture in Dryer-2 was slower (i.e., overall evaporation rate of 145.8 kg/h) compared to the first-pass of the rotary dryer. As seen in Figure 6, with the proposed dryer model, it was possible to achieve the desired BSG outlet moisture after 45 min residence time.

3.2. Comparison of Monthly Heat Production Based On Different Plant Set-Ups and Operational Strategies

In Table 7, the results obtained from different plant configurations and operational strategies are summarized. At this point, it is important to note that the presented results are based on a given dryer design, and the calculations were based on control strategy b in which inlet air temperature was kept at 75 °C. Therefore, the examination was done with the aim to optimize the capacity of the renewable heat sources.
From Table 7, it is obvious that with increasing annual operational hours of the drying plant, the amount of heat provided by both renewable heat sources and the amount of dried BSG material could be increased. The total heat production is increased from 3962 to 6644 MWh; accordingly, the amount of dried wet material was increased from 6284 to 10,204 tons per year for the reference design in case the operational hours switched from 12/5 to 24/5. In comparison, the heat provided by the biomass boiler was higher than the heat provided by the SW for the reference plant design, which was independent for both operational strategies 12/5 and 24/5.
When the SW area was doubled while the plant operates 12/5, the total annual heat from the SW was increased to 5283 MWh. Doubling the boiler capacity to 1900 kW resulted in an even higher annual heat production of 6114 MWh and, therefore, higher amounts of dried wet BSG. The maximum amount of the total annual heat production was achieved in case the capacities of both heat sources were doubled. However, the amount of dried wet BSG from this configuration was found to be close to the plant configuration in which only the boiler capacity was doubled. An increase in the capacities of the heat sources led to similar results for the operational scenario of 24/5. In the case the SW area was doubled, the SW share increased from 23.5 to 44%, the total annual heat production increased to 7978 MWh. An increase in the boiler capacity resulted in higher total annual heat production of 11,675 MWh. The highest amount of dried wet BSG could be achieved with the plant configuration in which both the SW and biomass boiler capacities were doubled. This resulted in 12,319 MWh annual heat production, which almost doubled the amount of dried BSG material compared to the operation of the reference plant.
As can be seen from Table 7, in case the plant operates 12/5, it was not possible to reach the yearly target, which was set at 20,000 ton/a in Aspen Plus simulations, even though the capacities of both heat sources were doubled. If the reference plant is operated at 24/5, still only half of the annually targeted amount of dried BSG material can be achieved. The plant configurations with either double boiler capacity or double SW and boiler capacities enabled an annual production of 17,383 and 17,972 tons of dried BSG material, respectively.
In summary, the amount of annual heat provided by the SW and the boiler were the most influential parameters on drying capacity. For the investigated scenarios, the annually produced heat was not sufficient due to the technical constraints of the drying plant, such as high initial BSG moisture, low drying temperatures (max. 75 °C), and limited air flow rates to reach the targeted amount of material per year. Thus, the plant should be ideally operated at 24/5 and with higher heat source capacities to increase the amount of the annual heat production and the drying capacity.
Figure 7 shows the comparison of the weekly heat production from both renewable heat sources as well as the amount of the dried BSG material based on different heat capacities and the operational strategies 12/5 and 24/5. These results are important to get an insight into the operational characteristics of both renewable heat sources depending on the weather influence over the year. As depicted in Figure 7a,b, in the reference plant design, the boiler should be fully operated to supply the base-load over the whole year.
In general, the amount of heat provided by SW showed an increasing trend during the summer time. These findings were also in line with the study of Slim et al., in which the influence of the climatic effects on the drying plant operation was discussed [41]. Increasing the capacity of the heat sources caused a dynamic operation of the boiler over the year with a decreased amount of heat provided by the boiler in the summer time. For example, as can be seen from Figure 7a (top right), for the plant configuration with a double SW area operating at 12/5, it is possible to observe the increase in the heat provided by SW as well as a decrease in the heat provided by biomass boiler between calendar weeks 12–42 (i.e., mid-March to mid-October). During this period, the operational hours of the biomass boiler were reduced from 1710 to 1140 h while the amount of dried material was increased from 1510 to 1743 tons compared to reference plant design. This is mainly due to the hot weather with high solar radiation in the investigated location. On the other hand, in case the boiler capacity was increased to 1900 kW (bottom, left), a slight reduction in the operational hours of the boiler was observed in a shorter period between calendar weeks of 20 and 42 (i.e., mid-May to mid-October). Accordingly, the boiler operated only 39 h less compared to the reference plant design. Within this period, the amount of dried BSG material could be increased from 1151 to 1389 tons. In case that the capacity of both heat sources was doubled, the energy provided by the boiler as base-load was minimum between calendar weeks of 23 and 33 (i.e., June to mid-August). Thus, the energy provided by the SW showed an increment between calendar weeks of 10 and 42 (i.e., March to mid-October). Within this period, it was possible to dry 425 tons more BSG material compared to reference plant design.
For the operational strategy 24/5 (see Figure 7b), when the solar wall area is doubled (top, right of Figure 7b), the boiler operated 569 h less between calendar weeks of 12 and 42 (i.e., mid-March to mid-October) compared to reference plant design. The amount of dried BSG material was increased from 2341 to 2585 tons for the same time period. Doubling the boiler capacity resulted in a significant increase in the heat, as can be seen in Figure 7b (bottom left, blue line). Between the calendar weeks 20 and 42, the amount of dried BSG material increased from 1173 to 2672 tons. For the plant configuration with double SW and boiler capacity, there was a reduction in the operational hours of the boiler from 3960 to 3344 h in a longer period of time between calendar weeks of nine and 45 (i.e., March to November). The amount of dried BSG material within this period increased from 2771 to 4349 tons.
Based on the results, it was clear that the weather fluctuations over the year affect the amount of the dried BSG. Doubling the SW area reduced the annual operational hours of the boiler in longer periods. Comparing the effect of doubling the capacity of both heat sources, it was found that for plant configurations in which the biomass boiler capacity was 1900 kW, higher amounts of wet BSG could be dried. These results are in correlation with the study of Lamidi et al., in which authors reviewed the performance comparison by using different energy sources and reported that biomass-based drying efficiency is higher than solar-based drying [42]. The doubled capacity of both renewable heat sources increased the total annual heat production even more and, therefore, the amount of the wet BSG material to be dried. The plant configurations in which the capacity of both heat sources was doubled, a more continuous and constant drying process could be achieved compared to other plant configurations (grey line). These observations apply to both operational strategies, i.e., 12/5 and 24/5.
Yet, economic aspects such as investment, operational, and personal costs should be considered to decide on the best plant configuration. Thus, the results of economic analysis will be discussed in the next chapter.

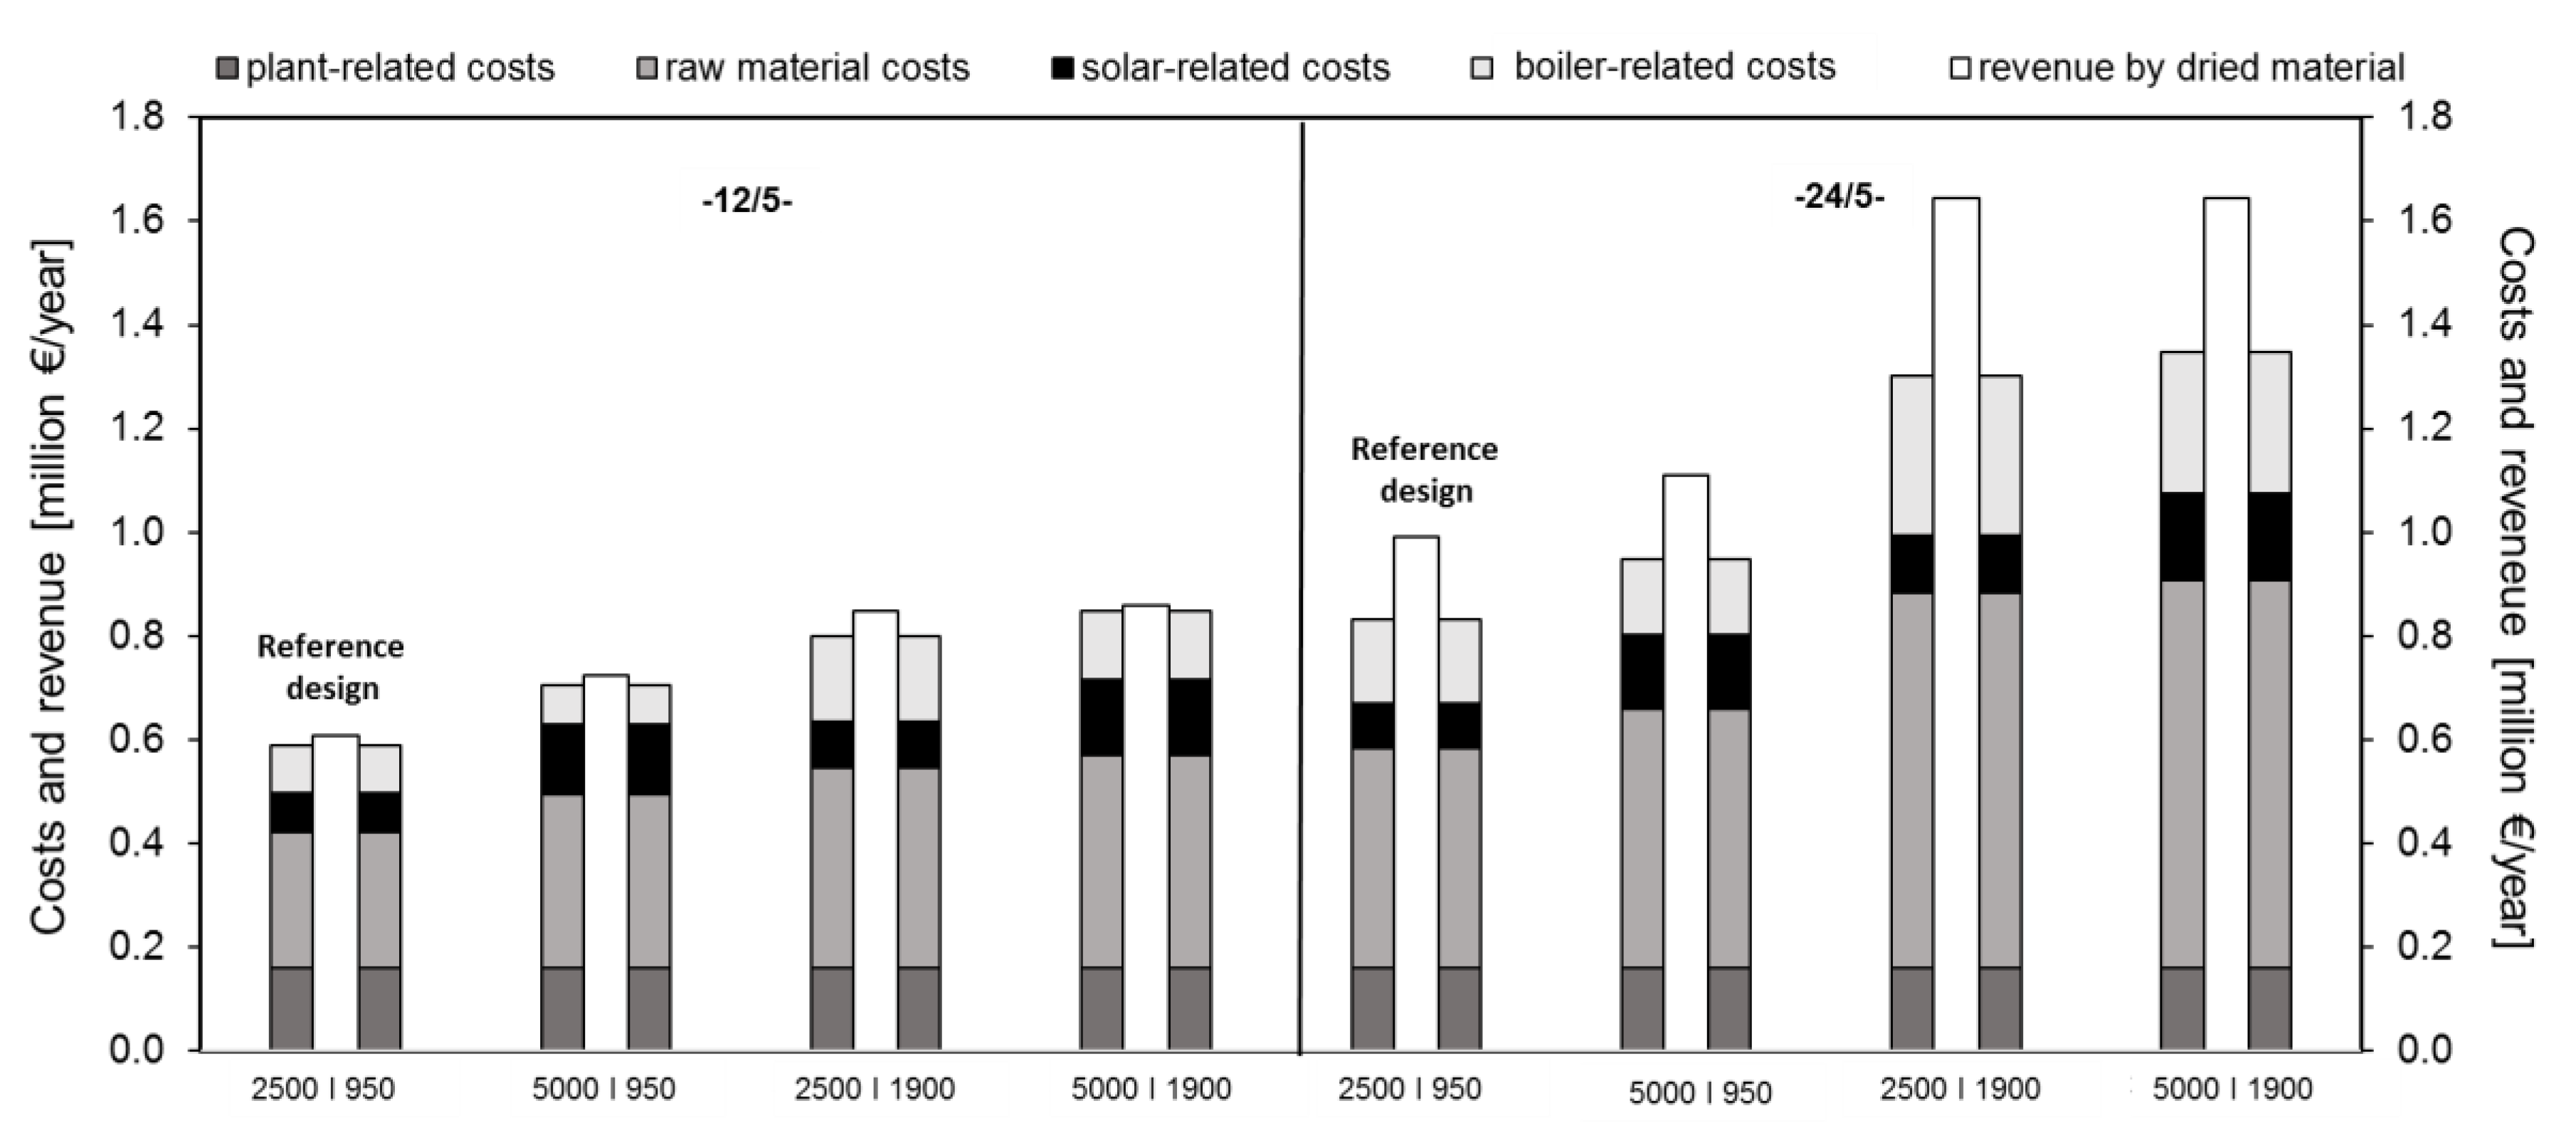
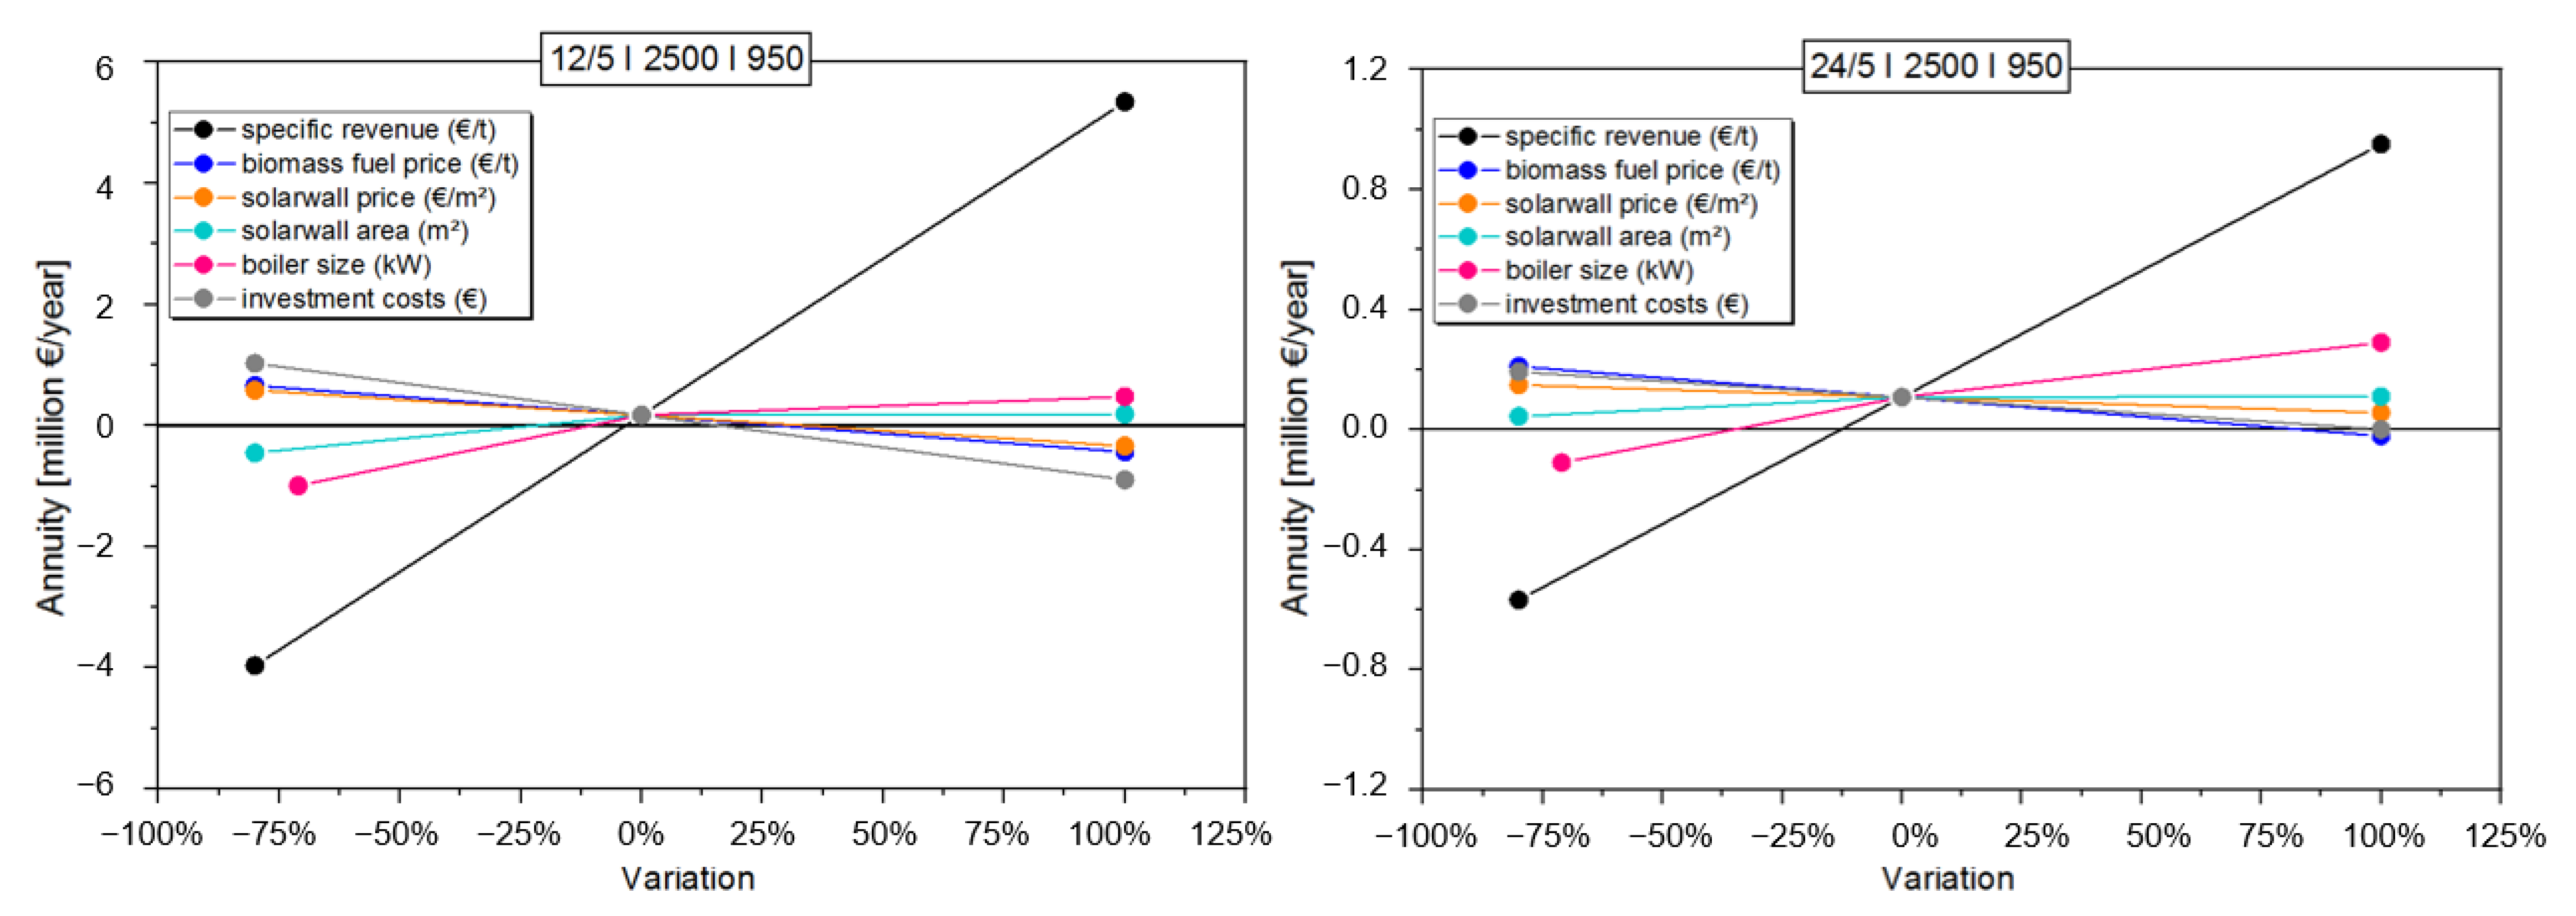
3.3. The Cost Optimization of the Renewable Drying Process

Cost optimization is important for economic plant operation and design at an industrial-scale. In this regard, several cost-related parameters were taken into account, and calculations were performed based on different plant capacities and operational strategies. In addition to the results summarized in Table 7, the costs and the revenue obtained from each plant configuration and operational strategy are presented in Figure 8. At this point, it is important to highlight the details of each cost for a better understanding. Briefly:
-
The raw material costs refer to BSG costs.
-
The plant-related costs include capital costs for the plant (dryer and other auxiliary units), personal costs as well as maintenance costs.
-
The solar-related costs refer to capital costs of SW, electricity costs for pumping air as well as maintenance costs.
-
Boiler-related costs refer to capital costs for the boiler, fuel costs, ash disposal costs, as well as maintenance costs.
As can be seen from Table 7, increased annual operational hours resulted in a higher annual income for all plant configurations. Although the plant configurations operating at 12/5 enabled feasible annuities, it is possible to make the drying process even more profitable by operating the plant with a higher capacity of 24/5. As can be seen from Figure 8, for operational strategy 12/5, the maximum revenue of 859,932 € could be achieved with plant configuration in which the capacities of both heat sources were doubled. Comparing the annual revenue obtained from increased capacities of the renewable heat sources individually from Figure 8, the plant with double boiler capacity resulted in around 123,779 € higher revenue compared to the plant with double SW capacity.
In the case of plant operation at 24/5, all examined configurations enabled higher annual profits compared to the configurations operating at 12/5. For this operational strategy, it was possible to profit up to ~1.65 million euros with a boiler capacity of 1900 kW and an SW area of 5000 m². Similar to the operational strategy 12/5, doubling boiler capacity resulted in 533,946 € higher revenue compared to doubled SW capacity, although the absolute BSG material costs were higher. The highest BSG material costs of 749,483 € were determined for the plant configuration, in which both SW and boiler capacities were doubled.
Additionally, the raw material costs were another important parameter because they directly influence the revenue. The raw material costs of the reference design showed an increase of 163,494 € as the operational strategy was changed from 12/5 to 24/5. On the other hand, as the capacity of the renewable heat sources doubled, the raw material costs increased in parallel since these configurations enabled the drying of more wet BSG material. In comparison with the reference plant design, double boiler and SW capacity resulted in higher raw material costs of 385,623 and 335,102 €, respectively, due to the difference in the amount of wet BSG material that could be dried annually. Consequently, the lower the raw materials costs, the more revenue can be achieved by the increased heat capacity of the plant.
In terms of boiler-related costs, fuel costs were one of the most influential cost parameters on the drying economics. For the reference plant design, it was found that the fuel costs were almost three and six times higher than the boiler capital costs for operational strategies of 12/5 and 24/5 over a time period of 20 years, respectively. For the configurations in which solely the boiler capacity was doubled, the highest fuel costs were determined as 104,832 for 12/5 and 245,271 € for 24/5. On the other hand, ash disposal costs were relatively lower, nearly negligible compared to the fuel and capital-related boiler costs.
With respect to the investment costs, the capital costs of the SW were two times higher than the capital costs of the biomass boiler. Therefore, the configurations with double SW capacity was more expensive than the plant configurations with doubled boiler capacity. Similar results were reported in [23] that an increase in the solar collector area has a negative impact on the profitability of a large-scale drying system. The authors reported that increasing the area of solar collectors is only convenient from an energy point of view since it enables higher primary energy savings. In this study, the specific solar price was found to be 451 and 448 €/MWh, while the specific boiler price was 139 and 66 €/MWh for the reference plant design operated at 12/5 and 24/5, respectively.
The electricity costs for air ventilation were another important parameter, which is included in the solar-related costs. It is mainly affected by the operational hours and the capacity of the heat sources. Accordingly, there was an increase of 37% in case the operational hours of the drying plant increased from 12/5 to 24/5. In case the capacity of the heat sources was doubled individually, the electricity costs for air ventilation were found to be higher due to increased air flow rate in all configurations compared to reference design. Di Fraia et al. also reported that increasing the capacity of the solar area caused an increase in the supplied fresh air [23].
In contrast, the plant-related costs did not significantly differ since the specific costs for the dryer and other sub-components of the plant (i.e., fans, pumps, silo, etc.) were nearly constant at ~159,253 € in all plant configurations. The maintenance costs of biomass boiler were higher than the maintenance costs of SW for all configurations except the configurations with double SW area. This was independent of the operational strategy.
Additionally, a sensitivity analysis was performed for the reference design based on the two operational strategies, and the results are displayed in Figure 9. The calculated results from this sensitivity analysis for the minimum, maximum, and break-even points (representing the point at which annuity was equal to “zero”) are also summarized in Table 8. Accordingly, the price of the dried BSG material (included in the specific revenue) had the highest impact on the annuity from the drying process (as indicated by the highest slope from all linear curves). Thus, for a feasible drying operation, the revenue obtained from the dried BSG material should be higher than 193 and 174 €/t for the operational strategies 12/5 and 24/5, respectively. The other parameter with the highest impact on the annuity for 12/5 was the capacity of the heat sources. As it can be seen from Figure 9, their capacity should be doubled either individually or in combination to achieve higher economical drying plant operation. For operational strategy 12/5, the capacities of the heat sources in reference design enable a profitable plant operation considering the minimum requirements of SW (3352 m2) and boiler (810 kW) summarized in Table 8. On the other hand, for the operational strategy 24/5, the capacity of the boiler was more influential than the other cost parameters, as can be seen from Figure 9. For this operational strategy, the drying process was found to be feasible with a minimum boiler capacity of 580 kW. As given in Table 8, the minimum requirements for an economically feasible plant operation were already enabled with respect to SW price and the total investment for both operational strategies. According to the sensitivity analysis, the easiest way to increase the annual revenue would be to purchase material to be dried at lower prices. Moreover, the minimum requirements presented in Table 8 should be taken into account to achieve economically feasible drying plant operation.
Finally, the annuity was analyzed by varying the capacity of the boiler and the SW simultaneously to get an insight into their influence on drying economics. The results showed that the highest annuity was achieved with the plant configuration in which heat production was provided all-day long and thus solely by the boiler with a capacity of 2500 kW. Yet, although this plant configuration with only a boiler seem to be profitable, there are some limitations that should be considered. Thus, larger boiler capacity means a significant increase in the amount of required fuel as well as fuel and boiler-related operating costs. Space requirements for implementing a continuous provision of considerably larger quantities of fuel will be one of the challenges to be handled in practice. Major practical limitations might be the purchase and handle of huge amounts of wet BSG material and the sale of higher amounts of dried products on the market.

4. Summary and Conclusions

In this paper, a low-temperature drying process based on a combination of solar and biomass energy was studied. To understand the thermodynamic limitations as well as the operational ranges of the system, a process model was developed in Aspen Plus. The simulation results showed that the inlet air and BSG flow rates have to be controlled properly to balance fluctuations in the heat production of the solar wall due to varying weather conditions. Based on the results from the selected reference days, the amount of wet BSG to be dried was lower than the yearly set target, except for the hot summer days. Considering the dried product has the potential to be sold as animal feed in the market, it was important in this process not only to preserve the nutrition of BSG but also to ensure the moisture within the desired range of 10–15%. The results showed that with the proposed convective dryer model, the simulation of the drying of BSG material with high moisture until the desired outlet BSG moisture is possible. However, operational ranges determined within this study are meaningful for the current plant configuration, and it is recommended to adapt the model parameters of the model in case of drying other materials with different drying characteristics.
To go a step further, the behavior of the drying process was analyzed based on a time-resolved calculation for one representative year. The calculations were carried out for two operational strategies, i.e., 12/5 and 24/5. The results showed that in the reference plant design, the boiler had to be fully operated to supply the base-load over the whole year. The operational window of the boiler can be reduced by increasing the capacity of the heat sources, especially for a certain period of time between March to October, depending on the plant configuration. However, for the reference plant operated at 12/5, the annually produced heat; therefore, the amount of dried wet BSG was lower. Thus, the plant should be operated at 24/5 and with higher heat source capacities to increase the amount of annual heat production and therefore the drying capacity.
An economic evaluation of the drying plant was conducted using the annuity method based on the results of the time-resolved thermodynamic calculations. Although the plant configurations operating at 12/5 enabled feasible annuities, higher profitability can be achieved by operating the plant at 24/5. For both operational strategies, the plant configurations with double boiler capacity enabled higher annuities due to the significant difference between specific solar and biomass boiler costs. It was found that specific solar costs were found to be 3.24 and 6.78 times higher than the specific biomass boiler costs for the reference plant design operating at 12/5 and 24/5, respectively. The revenue from the dried BSG material had the highest impact on the annuity based on sensitivity analysis.
In the future, simulations of the dynamic process behavior in Matlab/Simulink will be performed to develop a controller for the drying plant and its subsystems. The focus will be based on a detailed simulation of the rotary dryer and the integration of the plant capacities. The system controller will be able to adapt the supply of the drying air (i.e., flow rate and temperature), the wet BSG material as well as the residence time in the dryer with respect to the weather fluctuations. In the future, it is also planned to validate the obtained model results with the experimental data from the proposed drying plant.

Supplementary Materials

The following are available online at https://www.mdpi.com/1996-1073/14/3/561/s1. Table S1.Effect of inlet air flow rate on the outlet moisture content (Figure 3a), Table S2.Effect of inlet air flow rate on the outlet moisture content (Figure 3b), Table S3.Effect of absolute humidity of the inlet air flow rate of 110,260 kg/h on the outlet BSG moisture (Figure 4), Table S4.Effect of inlet BSG properties (Figure 5a), Table S5.Effect of BSG properties (Figure 5b).

Author Contributions

Conceptualization, Ö.Ç.M., S.T., D.B., and T.Z.; methodology, Ö.Ç.M., D.B., and S.T.; simulations, Ö.Ç.M. and D.B.; validation, Ö.Ç.M., D.B., and S.T.; formal analysis, D.B. and Ö.Ç.M.; investigation, Ö.Ç.M.; resources, Ö.Ç.M. and S.T.; data curation, Ö.Ç.M. and D.B.; writing—original draft preparation, Ö.Ç.M.; writing—review and editing, Ö.Ç.M., D.B., S.T., and T.Z.; visualization, Ö.Ç.M., D.B., and S.T.; supervision, T.Z. and D.B.; project administration, T.Z.; funding acquisition, T.Z. and D.B. All authors have read and agreed to the published version of the manuscript.

Funding

This research received financial support from the European Union’s Horizon 2020 research and innovation program within the framework of the project titled “DRALOD-Renewables-based drying technology for cost-effective valorization of waste from the food processing industry” under the grant agreement number 820554.

Institutional Review Board Statement

Not applicable.

Informed Consent Statement

Not applicable.

Data Availability Statement

Not applicable.

Acknowledgments

The support and contribution of the project partners PERNIA, ÖKOTHERM, and RISE are greatly acknowledged.

Conflicts of Interest

The authors declare no conflict of interest. The funders had no role in the design of the study; in the collection, analyses, or interpretation of data; in the writing of the manuscript, or in the decision to publish the results.

Abbreviations

a.r.As received
BSGBrewery spent grain
calc.Calculated
DDay
GHGGreenhouse gas emissions
NNight
NTUNumber of transfer units
PENG-ROBPeng–Robinson cubic equation of state
SWSolar wall
w.b.Wet basis
12/512 h per day, five days per week
24/524 h per day, five days per week
Nomenclature
TaCold air temperature, °C
RHAir humidity, %
ρ d r y ,   a i r Density of dry air, kg/m3
p v , s Saturation vapor pressure, kPa
p v , p Partial water vapor pressure
H A , m Absolute humidity, kgw/kga
H A , v Absolute humidity, kg w / m a 3
c p , a i r Heat capacity, kJ / ( kg · K )
h m o i s t Enthalpy of moist air, kJ/kg
I 0 Sloped radiation, W/m2
m ˙ a i r Mass flow, kg/h
P b o i l Required boiler heat, kW
PsolSolar power, kW
T a , s o l Hot air temperature, °C
m w   Removed water per kg of air, kgw/kga
m ˙ w Amount of evaporated water, kg w / h
m ˙ g Dried BSG material, kg g / h

References

  1. Goula, A.M.; Lazarides, H.N. Integrated processes can turn industrial food waste into valuable food by-products and/or ingredients: The cases of olive mill and pomegranate wastes. J. Food Eng. 2015, 167, 45–50. [Google Scholar] [CrossRef]
  2. European Commission. Food Waste. Available online: https://ec.europa.eu/food/safety/food_waste_en (accessed on 7 January 2020).
  3. Zabaniotou, A.; Kamaterou, P. Food waste valorization advocating Circular Bioeconomy—A critical review of potentialities and perspectives of spent coffee grounds biorefinery. J. Clean. Prod. 2019, 211, 1553–1566. [Google Scholar] [CrossRef]
  4. Mirabella, N.; Castellani, V.; Sala, S. Current options for the valorization of food manufacturing waste: A review. J. Clean. Prod. 2014, 65, 28–41. [Google Scholar] [CrossRef] [Green Version]
  5. Imbert, E. Food waste valorization options: Opportunities from the bioeconomy. Open Agric. 2017, 2, 195–204. [Google Scholar] [CrossRef]
  6. European Commission. Directive 2008/98/EC on Waste (Waste Framework Directive). Available online: https://ec.europa.eu/environment/waste/framework/ (accessed on 28 January 2020).
  7. European Commission. Internal Market, Industry, Entrepreneurship and SMEs: Food and Drink Industry. Available online: https://ec.europa.eu/growth/sectors/food_en (accessed on 19 May 2020).
  8. European Commission (EC). Closing the Loop—An EU Action Plan for the Circular Economy. 2015. Available online: https://eur-lex.europa.eu/resource.html?uri=cellar:8a8ef5e8-99a0-11e5-b3b7-01aa75ed71a1.0012.02/DOC_1&format=PDF (accessed on 19 May 2019).
  9. Hnin, K.K.; Zhang, M.; Mujumdar, A.S.; Zhu, Y. Emerging food drying technologies with energy-saving characteristics: A review. Dry. Technol. 2018, 37, 1465–1480. [Google Scholar] [CrossRef]
  10. Belessiotis, V.; Delyannis, E. Solar drying. Sol. Energy 2011, 85, 1665–1691. [Google Scholar] [CrossRef]
  11. Bassetti, M.C.; Consoli, D.; Manente, G.; Lazzaretto, A. Design and off-design models of a hybrid geothermal-solar power plant enhanced by a thermal storage. Renew. Energy 2018, 128, 460–472. [Google Scholar] [CrossRef]
  12. Yoo, J.Y.; Kim, H.J.; Woo, E.J.; Park, C.J. On Solar Energy Utilization for Drying Technology. Int. J. Environ. Sci. Dev. 2017, 8, 305–311. [Google Scholar] [CrossRef] [Green Version]
  13. Madhlopa, A.; Ngwalo, G. Solar dryer with thermal storage and biomass-backup heater. Sol. Energy 2007, 81, 449–462. [Google Scholar] [CrossRef] [Green Version]
  14. Okoroigwe, E.C.; Ndu, E.C. Comparative evaluation of the performance of an improved solar-biomass hybrid dryer. J. Energy South. Afr. 2017, 26, 38. [Google Scholar] [CrossRef] [Green Version]
  15. Amer, B.; Hossain, M.; Gottschalk, K. Design and performance evaluation of a new hybrid solar dryer for banana. Energy Convers. Manag. 2010, 51, 813–820. [Google Scholar] [CrossRef]
  16. Tonui, K.; Mutai, E.; Mutuli, D.; Mbuge, D.; Too, K. Design and Evaluation of Solar Grain Dryer with a Back-up Heater. Res. J. Appl. Sci. Eng. Technol. 2014, 7, 3036–3043. [Google Scholar] [CrossRef]
  17. Neba, F.A.; Nono, Y.J. Modeling and simulated design: A novel model and software of a solar-biomass hybrid dryer. Comput. Chem. Eng. 2017, 104, 128–140. [Google Scholar] [CrossRef]
  18. Sonthikun, S.; Chairat, P.; Fardsin, K.; Kirirat, P.; Kumar, A.; Tekasakul, P. Computational fluid dynamic analysis of innovative design of solar-biomass hybrid dryer: An experimental validation. Renew. Energy 2016, 92, 185–191. [Google Scholar] [CrossRef]
  19. Dhanushkodi, S.; Vincent, H.W.; Sudhakar, K. Design and thermal performance of the solar biomass hybrid dryer for cashew drying. Facta Univ. Ser. Mech. Eng. 2014, 12, 277–288. [Google Scholar]
  20. Hao, W.; Liu, S.; Mi, B.; Lai, Y. Mathematical Modeling and Performance Analysis of a New Hybrid Solar Dryer of Lemon Slices for Controlling Drying Temperature. Energies 2020, 13, 350. [Google Scholar] [CrossRef] [Green Version]
  21. Yuwana, Y.; Sidebang, B. Performance Testing of the Hybrid Solar-Biomass Per. J. Mod. Eng. Res. 2016, 6, 63–68. [Google Scholar]
  22. Genskow, L.R. Dryer scale-up methodology for the process industries. Dry. Technol. 1994, 12, 47–58. [Google Scholar] [CrossRef]
  23. Di Fraia, S.; Figaj, R.D.; Massarotti, N.; Vanoli, L. An integrated system for sewage sludge drying through solar energy and a combined heat and power unit fuelled by biogas. Energy Convers. Manag. 2018, 171, 587–603. [Google Scholar] [CrossRef]
  24. Çepelioğullar, M.Ö.; Zeng, T. Challenges and Opportunities of Modeling Biomass Gasification in Aspen Plus: A Review. Chem. Eng. Technol. 2020, 43, 1674–1689. [Google Scholar] [CrossRef]
  25. Aspen Technology Inc. Aspen Plus Physical Property System: Physical Property Models and Methods; Aspen Technology Inc.: Cambridge MA, USA, 2001. [Google Scholar]
  26. Meteotest, A.G. Meteonorm Features. Available online: https://meteonorm.com/en/meteonorm-features (accessed on 20 January 2021).
  27. Amos, W.A.; Report on Biomass Drying Technology. Natl. Renew. Energy Lab. 1998. Available online: https://www.nrel.gov/docs/fy99osti/25885.pdf (accessed on 20 January 2021).
  28. Hosseinabadi, H.Z.; Layeghi, M.; Berthold, D.; Doosthosseini, K.; Shahhosseini, S. Mathematical Modeling the Drying of Poplar Wood Particles in a Closed-Loop Triple Pass Rotary Dryer. Dry. Technol. 2013, 32, 55–67. [Google Scholar] [CrossRef]
  29. Han, J.; Choi, Y.; Kim, J. Development of the Process Model and Optimal Drying Conditions of Biomass Power Plants. ACS Omega 2020, 5, 2811–2818. [Google Scholar] [CrossRef] [PubMed]
  30. Mujumdar, A.S.; Devastin, S. Guide to Industrial Drying: Principles, Equipment and New Developments. Chapter 1: Fundamental Principles of Drying; Colour Publications Pvt. Limited: Mumbai, India, 2005. [Google Scholar]
  31. Texas AgriLife Research and Center. Equilibrium Moisture Content (EMC) Calculator. Available online: https://beaumont.tamu.edu/EMCCalculator/default.aspx.EMCCalculator (accessed on 2 November 2020).
  32. Aspen Plus Inc. Aspen Plus V 10.0-Help: Convective Dryer—Model; Aspen Technology Inc.: Cambridge, MA, USA.
  33. Delele, M.A.; Weigler, F.; Mellmann, J. Advances in the Application of a Rotary Dryer for Drying of Agricultural Products: A Review. Dry. Technol. 2014, 33, 541–558. [Google Scholar] [CrossRef]
  34. Land, C.M.V. Drying in the Process Industry; Wiley: Hoboken, NJ, USA, 2011. [Google Scholar]
  35. Perry, R.H.; Green, D.W.; Maloney, J.O. Perry’s Chemical Engineers’ Handbook, 7th ed.; McGraw-Hill: New York, NY, USA, 1984. [Google Scholar]
  36. Hui, H.Y.; Clary, C.; Frid, M.M.; Fasina, O.O.; Noomhorm, A.; Welti-Chanes, J. Food Drying Science and Technology. Microbiology, Chemistry, Applications; DEStech Publications Inc.: Lancaster, Pennsylvania, PA, USA, 2008. [Google Scholar]
  37. Verein Deutscher Ingeniure. VDI 2067—Economic Efficiency of Building Installations. Fundamentals and Economic Calculation; Verein Deutscher Ingeniure: Düsseldorf, Germany, 2012. [Google Scholar]
  38. Stroem, L.; Desai, D.; Hoadley, A. Superheated steam drying of Brewer’s spent grain in a rotary drum. Adv. Powder Technol. 2009, 20, 240–244. [Google Scholar] [CrossRef]
  39. Freire, F.B.; Vieira, G.N.A.; Freire, J.T.; Mujumdar, A.S. Trends in Modeling and Sensing Approaches for Drying Control. Dry. Technol. 2014, 32, 1524–1532. [Google Scholar] [CrossRef]
  40. Tsotsas, E.; Metzger, T.; Gnielinski, V.; Schlünder, E.U. Ullmann’s Encyclopedia of Industrial Chemistry. Drying of Solid Materials; Wiley-VCH Verlag GmbH & Co. KgaA: Weinheim, Germany, 2012. [Google Scholar]
  41. Slim, R.; Zoughaib, A.; Clodic, D. Modeling of a solar and heat pump sludge drying system. Int. J. Refrig. 2008, 31, 1156–1168. [Google Scholar] [CrossRef]
  42. Lamidi, R.O.; Jiang, L.; Pathare, P.B.; Wang, Y.; Roskilly, A. Recent advances in sustainable drying of agricultural produce: A review. Appl. Energy 2019, 367–385. [Google Scholar] [CrossRef] [Green Version]
  43. ÖKOTHERM Biomasse-Heizanlagen. Available online: https://www.oeko-therm.net/de/produkte-service-oekotherm/compact-biomasse-heizanlagen (accessed on 20 January 2021).
Figure 1. Aspen Plus process flowsheet of the low-temperature drying process. The areas indicated within dashed lines show the parts, which were modeled in Aspen Plus.
Energies 14 00561 g001
Figure 2. Monthly average temperature distribution of the ambient air and air after SW (bars indicating the minimum and maximum deviations).
Energies 14 00561 g002
Figure 3. Effect of inlet air flow rate on the outlet moisture of the BSG for (a) constant inlet BSG flow rate and (b) constant inlet air temperature. Data points presented can be found in the Supplementary Information (Table S1 and Table S2).
Energies 14 00561 g003
Figure 4. Effect of absolute humidity of the inlet air with a flow rate of 110,262 kg/h on the outlet BSG moisture. Data points presented can be found in the Supplementary Information (Table S3).
Energies 14 00561 g004
Figure 5. Effect of inlet BSG flow rate on the outlet moisture of BSG for (a) constant inlet air temperature and flow rate and (b) constant inlet air temperature as well as constant inlet air and BSG flow rates. Data points presented can be found in the Supplementary Information (Table S4 and Table S5).
Energies 14 00561 g005
Figure 6. The drying profile along the convective dryer, based on the Aspen Plus simulations for 1010D.
Energies 14 00561 g006
Figure 7. Heat production per calendar week from both renewable heat sources with varying capacities as well as operational strategies (a) 12/5 and (b) 24/5 (top left—reference design, top right—doubled SW area, bottom left—doubled boiler capacity, and bottom right—doubling of both heat sources).
Energies 14 00561 g007
Figure 8. Comparison of costs and revenue for different plant configurations and operational strategies, i.e., 12 h/d and five days per week (12/5) as well as 24 h/d and five days per week (24/5).
Energies 14 00561 g008
Figure 9. Results from the sensitivity analysis of the reference plant design for operational strategy 12/5 (12 h/d and five days per week, left) and 24/5 (24 h/d and five days per week, right).
Energies 14 00561 g009
Table 1. Characterization of brewery spent grains (BSG) and wood pellets (Fuel).
Proximate Analysis (Dry, wt.%)BSGFuel
Volatiles80.680
Ash4.40.6
Fixed C (by difference)15.319.4
Ultimate Analysis (Dry, wt.%)
C50.951
H6.56.3
O (by difference)38.442.5
N3.90.11
S0.30.008
Table 2. Summary of the low-temperature drying plant process specifications (reference design) used in Aspen Plus simulations.
Process Specifications in the Model
Total SW area (m2)2500
Max. humid air flow rate (m3/ h)180,000
Max. inlet air temperature (°C)75
Material to be dried (tons/year)~20,000
Inlet moisture of BSG (wt.%, a.r.)80
Outlet moisture of BSG (wt.%, w.b.)10–15
Inlet BSG temperature (°C)25
Each dryer length (m)9
Each dryer diameter (m)1.5
Total residence time of both passes (min)45
Xcr (kgwater/kgdry solid)0.8
Xequ (kgwater/kgdry solid)0.015
NTU (-)2
Thermal output boiler (kW)950
Physical property methodPENG-ROB
Dryer modelConvective
Heat exchanger modelShortcut
Heat exchanger typeWater-air
Boiler modelRYield, RGibbs and heater blocks
NTU: number of transfer units.
Table 3. Selected representative reference days for the Aspen Plus simulations together with ambient air temperatures and absolute humidity.
Reference DaysCodesAmbient Air Temperature (°C)Absolute Humidity (kg/kg)
9 January/night0901N2.80.0037
9 January/day0901D4.40.0039
11 July/night1107N22.00.0085
11 July/day1107D28.00.0086
10 October/night1010N16.60.0078
10 October/day1010D22.00.0090
Table 4. Summary of the input parameters and the equations used in time-resolved thermodynamic calculations (“calc.” refers to the calculated values).
DescriptionUnitNotes/EquationsNo.
Density   of   dry   air ,   ρ d r y ,   a i r kg / m ³ ρ d r y , a i r = 0.003973 · T a + 1.275833 (1)
Saturation vapor pressure, p v , s kPa p v , s = 611.2 · e 17.62 · T a 243.12 + T a (2)
Partial water vapor pressure, p v , p kPa p v , p = R H · p v , s 100 (3)
Absolute humidity, H A , m kgw/kga H A , m = 0.622 · R H · p v , s 101325 R H · p v , p (4)
Absolute humidity, H A , v kg w / m a 3 H A , v = H A , m · ρ d r y , a i r (5)
Heat capacity, c p , a i r kJ / ( kg · K ) c p , a i r = 0.00004 · T a + 1.0062 (6)
Enthalpy of moist air, h m o i s t kJ / kg h m o i s t = c p , a i r · T a + H A , m · ( 2500 + 1.86 · T a ) (7)
Required boiler heat, P b o i l kW P b o i l = 1.006 · m ˙ a i r · ( T s e t T a ) P s o l (8)
Solar power, P s o l kW P s o l = I 0 · A c o l l · η c o l l (9)
SW efficiency †)% η c o l l = 0.00000316 · m ˙ a i r + 0.16842105 (10)
Hot air temp., T a , s o l °C T a , s o l = T a + P s o l m ˙ a i r · c p , a i r (11)
Relative humidity of hot air, RH% R H = H A , m · 101325 p v , s · 287.1 461.5 + H A , m (12)
Removed water per kg of air, m w kg w / kg m w = H A , o u t H A , i n (13)
Evaporated water mass flow, m ˙ w kg w / h m ˙ w = m w · m ˙ a i r (14)
Dried BSG material, m ˙ g kg g / h m ˙ g = m ˙ w ( H A , r a w H A , d r y ) (15)
The used balancing function was developed using the Solar Keymark certificate of the SW.
Table 5. Parameters used in the cost calculations.
Cost ParametersUnitValueSpecific CostsUnitValue
Mixed interest rate, q%3.00Electricity price (net)ct/kWh12
Observation period, Tyears20Wet BSG material€/t35
Yearly price increase%2.00Biomass fuel price€/t70
Other ParametersUnitValueAsh disposal€/t8
Energy demand for fanskW/(m3/s)1.5Dried BSG material€/t235
Lower heating value of fuelMWh/tw.b.4.3Total investment costs *k€2800
* includes the investment costs of SW, boiler, dryer, and other sub-units.
Table 6. Effect of weather fluctuations on the drying process.
Reference DayHeat from the Biomass Boiler (kW)Heat from the SW (kW)AIR-103 (kg/h)WETBSG (kg/h)
0901N855042,148940
0901D85535360,8561340
1107N855057,4161199
1107D6622084180,0003734
1010N855052,1431084
1010D855782112,6002310
Table 7. The results obtained from different plant capacities and operational strategies 12/5 and 24/5.
Operational Strategy and Plant Design *Heat Provided by Boiler (MWh/a)Heat Provided by SW (MWh/a)Total Annual Heat [MWh/a]Solar Share (%)Annually Dried Wet BSG (t/a)Annual Operational Hours of the Boiler (h/a)Annual Operational Hours of the SW (h/a)Annual Income
(€/a)
12/5|2500|95024101552396239.162843012291217,452
12/5|5000|95018013482528365.980352416291219,012
12/5|2500|190041381976611432.392472973291248,016
12/5|5000|190028723883675557.498792351291210,838
24/5|2500|95050801564664423.510,20460243321160,786
24/5|5000|95044723507797844.011,97754283321163,451
24/5|2500|19009681199411,67517.117,38359853321342,815
24/5|5000|19008399392012,31931.817,97253723321294,869
* Operational strategy|SW area (m2)|boiler capacity (kW).
Table 8. Minimum, maximum, and break-even from the annuity calculation and sensitivity analysis of reference plant design (2500 m2, 950 kW) for both operational strategies 12/5 and 24/5.
Revenue from Dried BSG Material (€/t)Biomass Fuel Price (€/t)SW Price
(€/m2)
SW Area (m2)Boiler Capacity
(kW)
Total Investment Costs (€/a)
VariationsMin (−80%)401856500275 *300,000
Max (+100)400180560500019003,000,000
StandardStandard2007028025009501,500,000
Break-even point12/51939037533528101,745,052
24/517412987277895803,021,526
* Min at −71%, due to the minimum available biomass boiler capacity from the examined boiler product line [43].
Publisher’s Note: MDPI stays neutral with regard to jurisdictional claims in published maps and institutional affiliations.

