Pathways toward a Decarbonized Future—Impact on Security of Supply and System Stability in a Sustainable German Energy System

 ,
,  , , , , , , , , and
Abstract
1. Introduction
1.1. Motivation and Relevance
1.2. State of the Art and Related Work
1.3. Contribution and Structure
2. Materials and Methods
2.1. Assumptions and Scenarios
2.1.1. Base Scenarios
2.1.2. Further Sensitivities
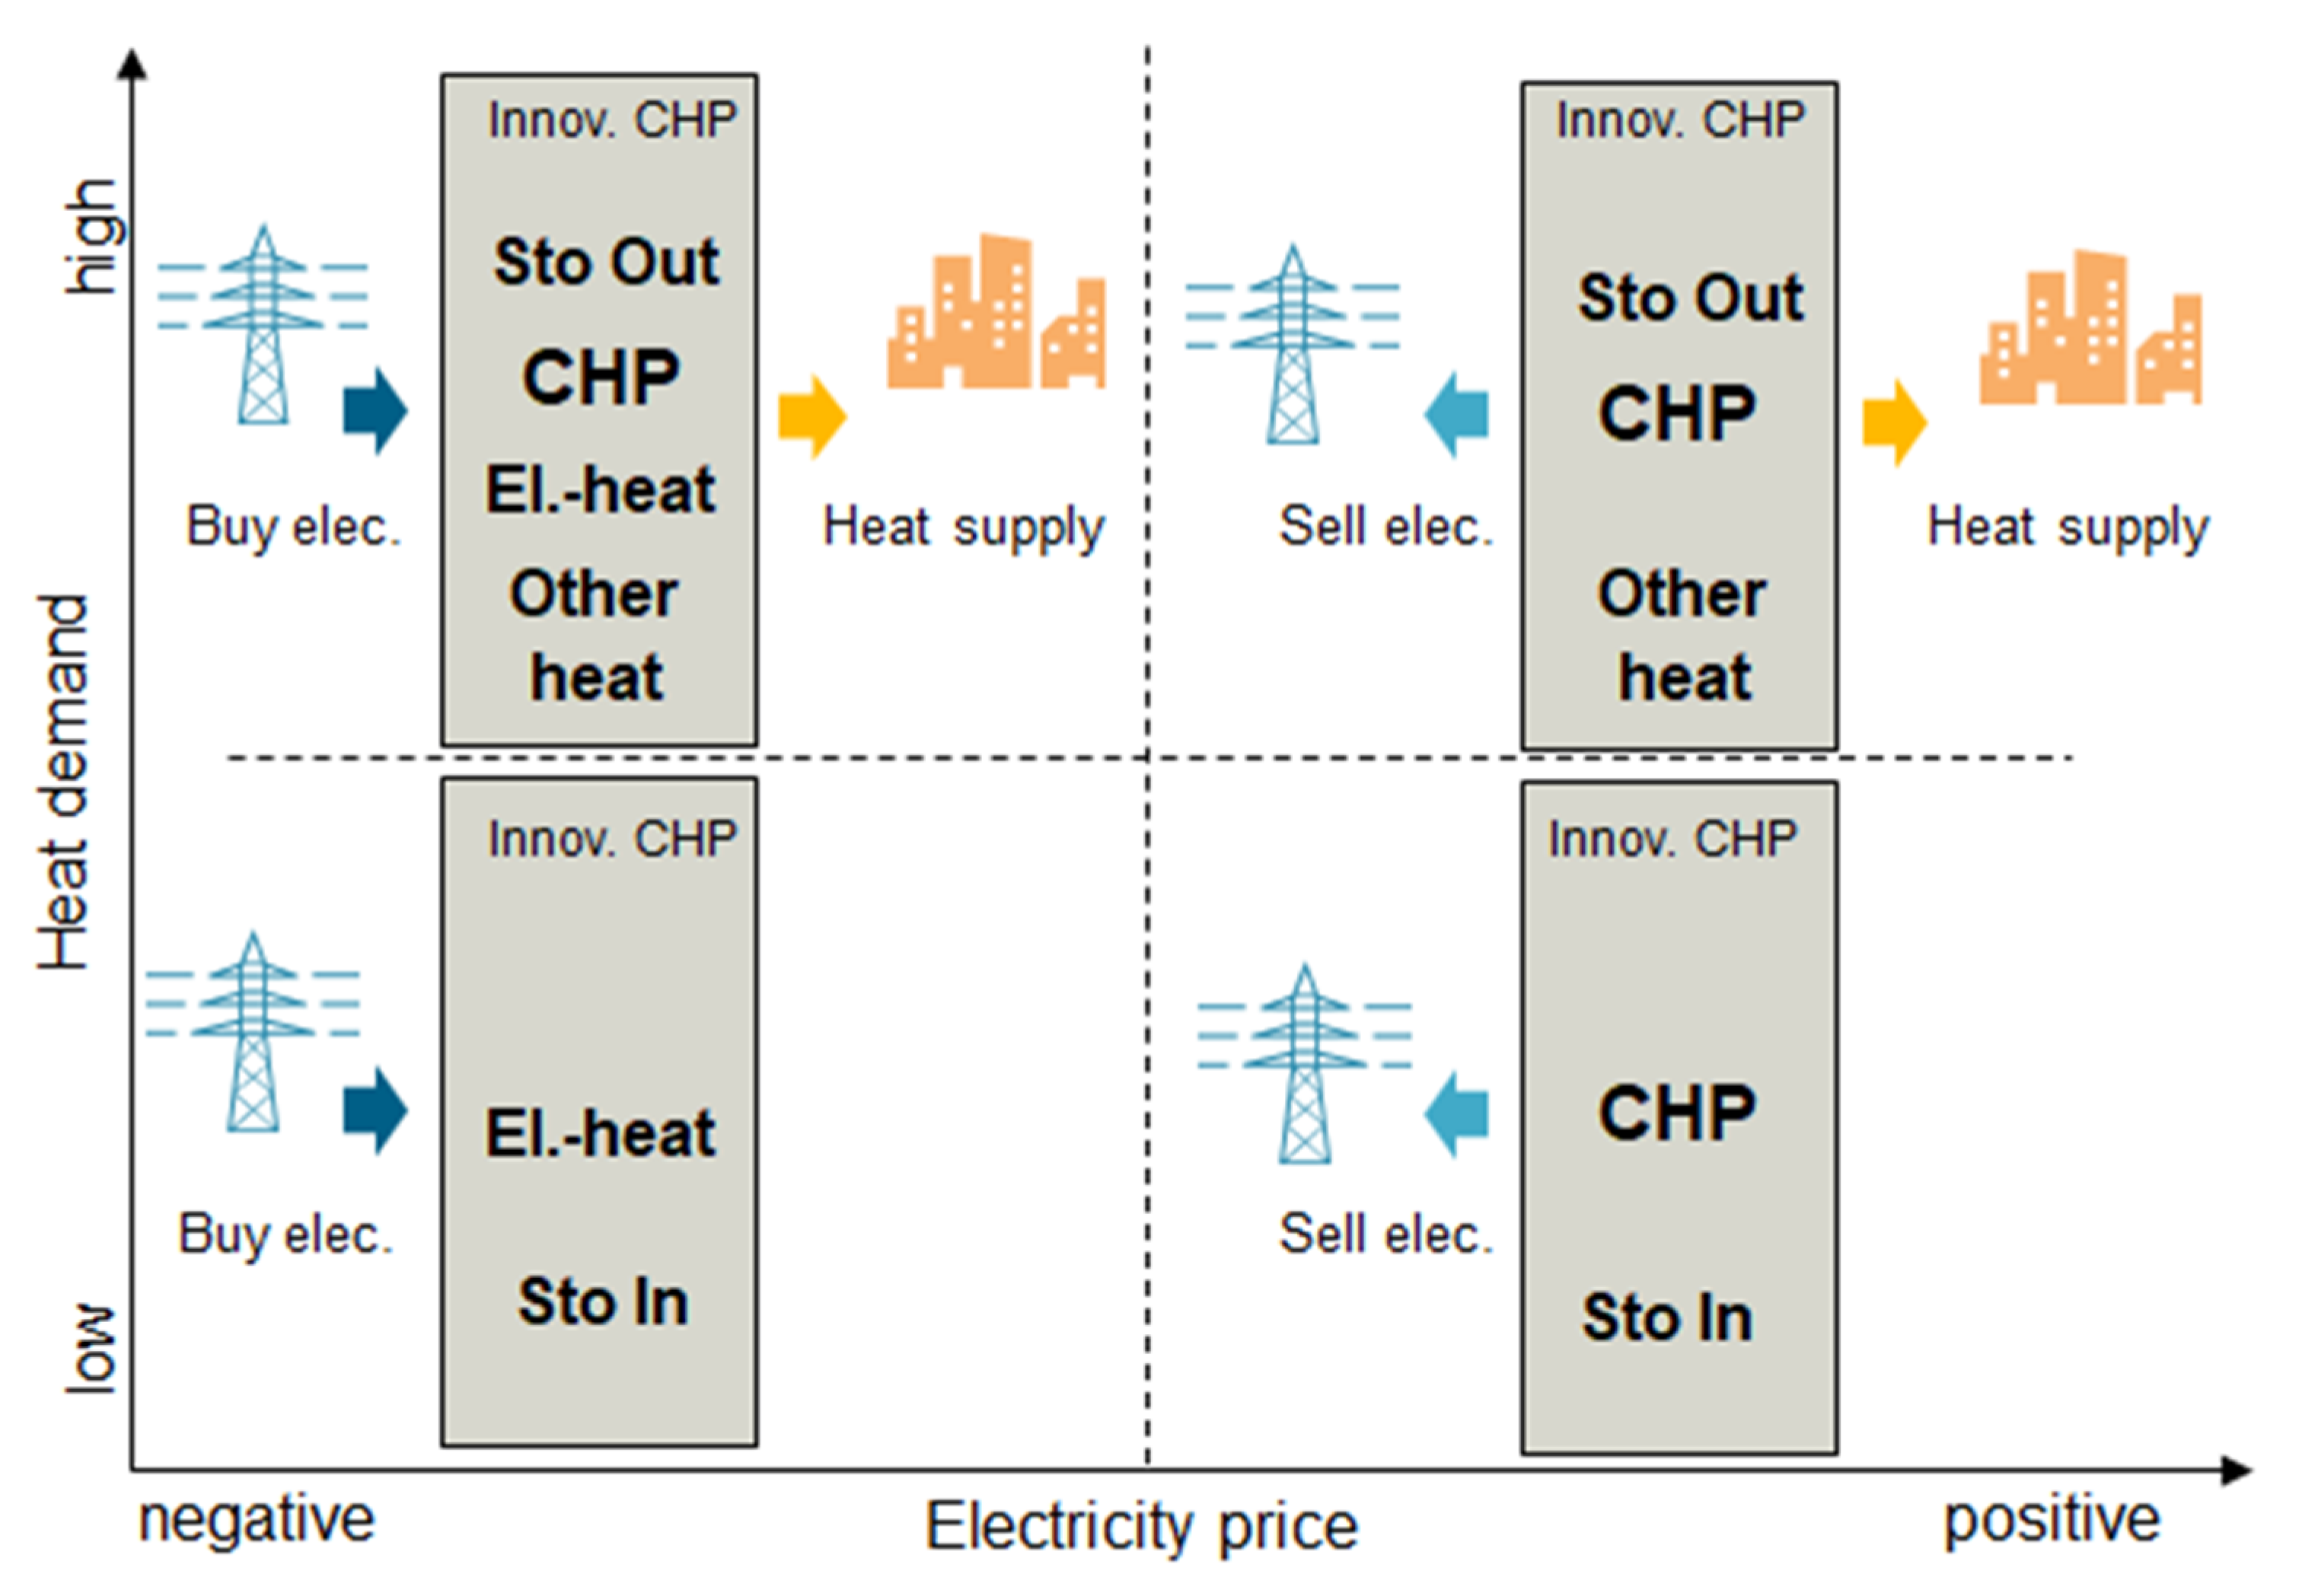
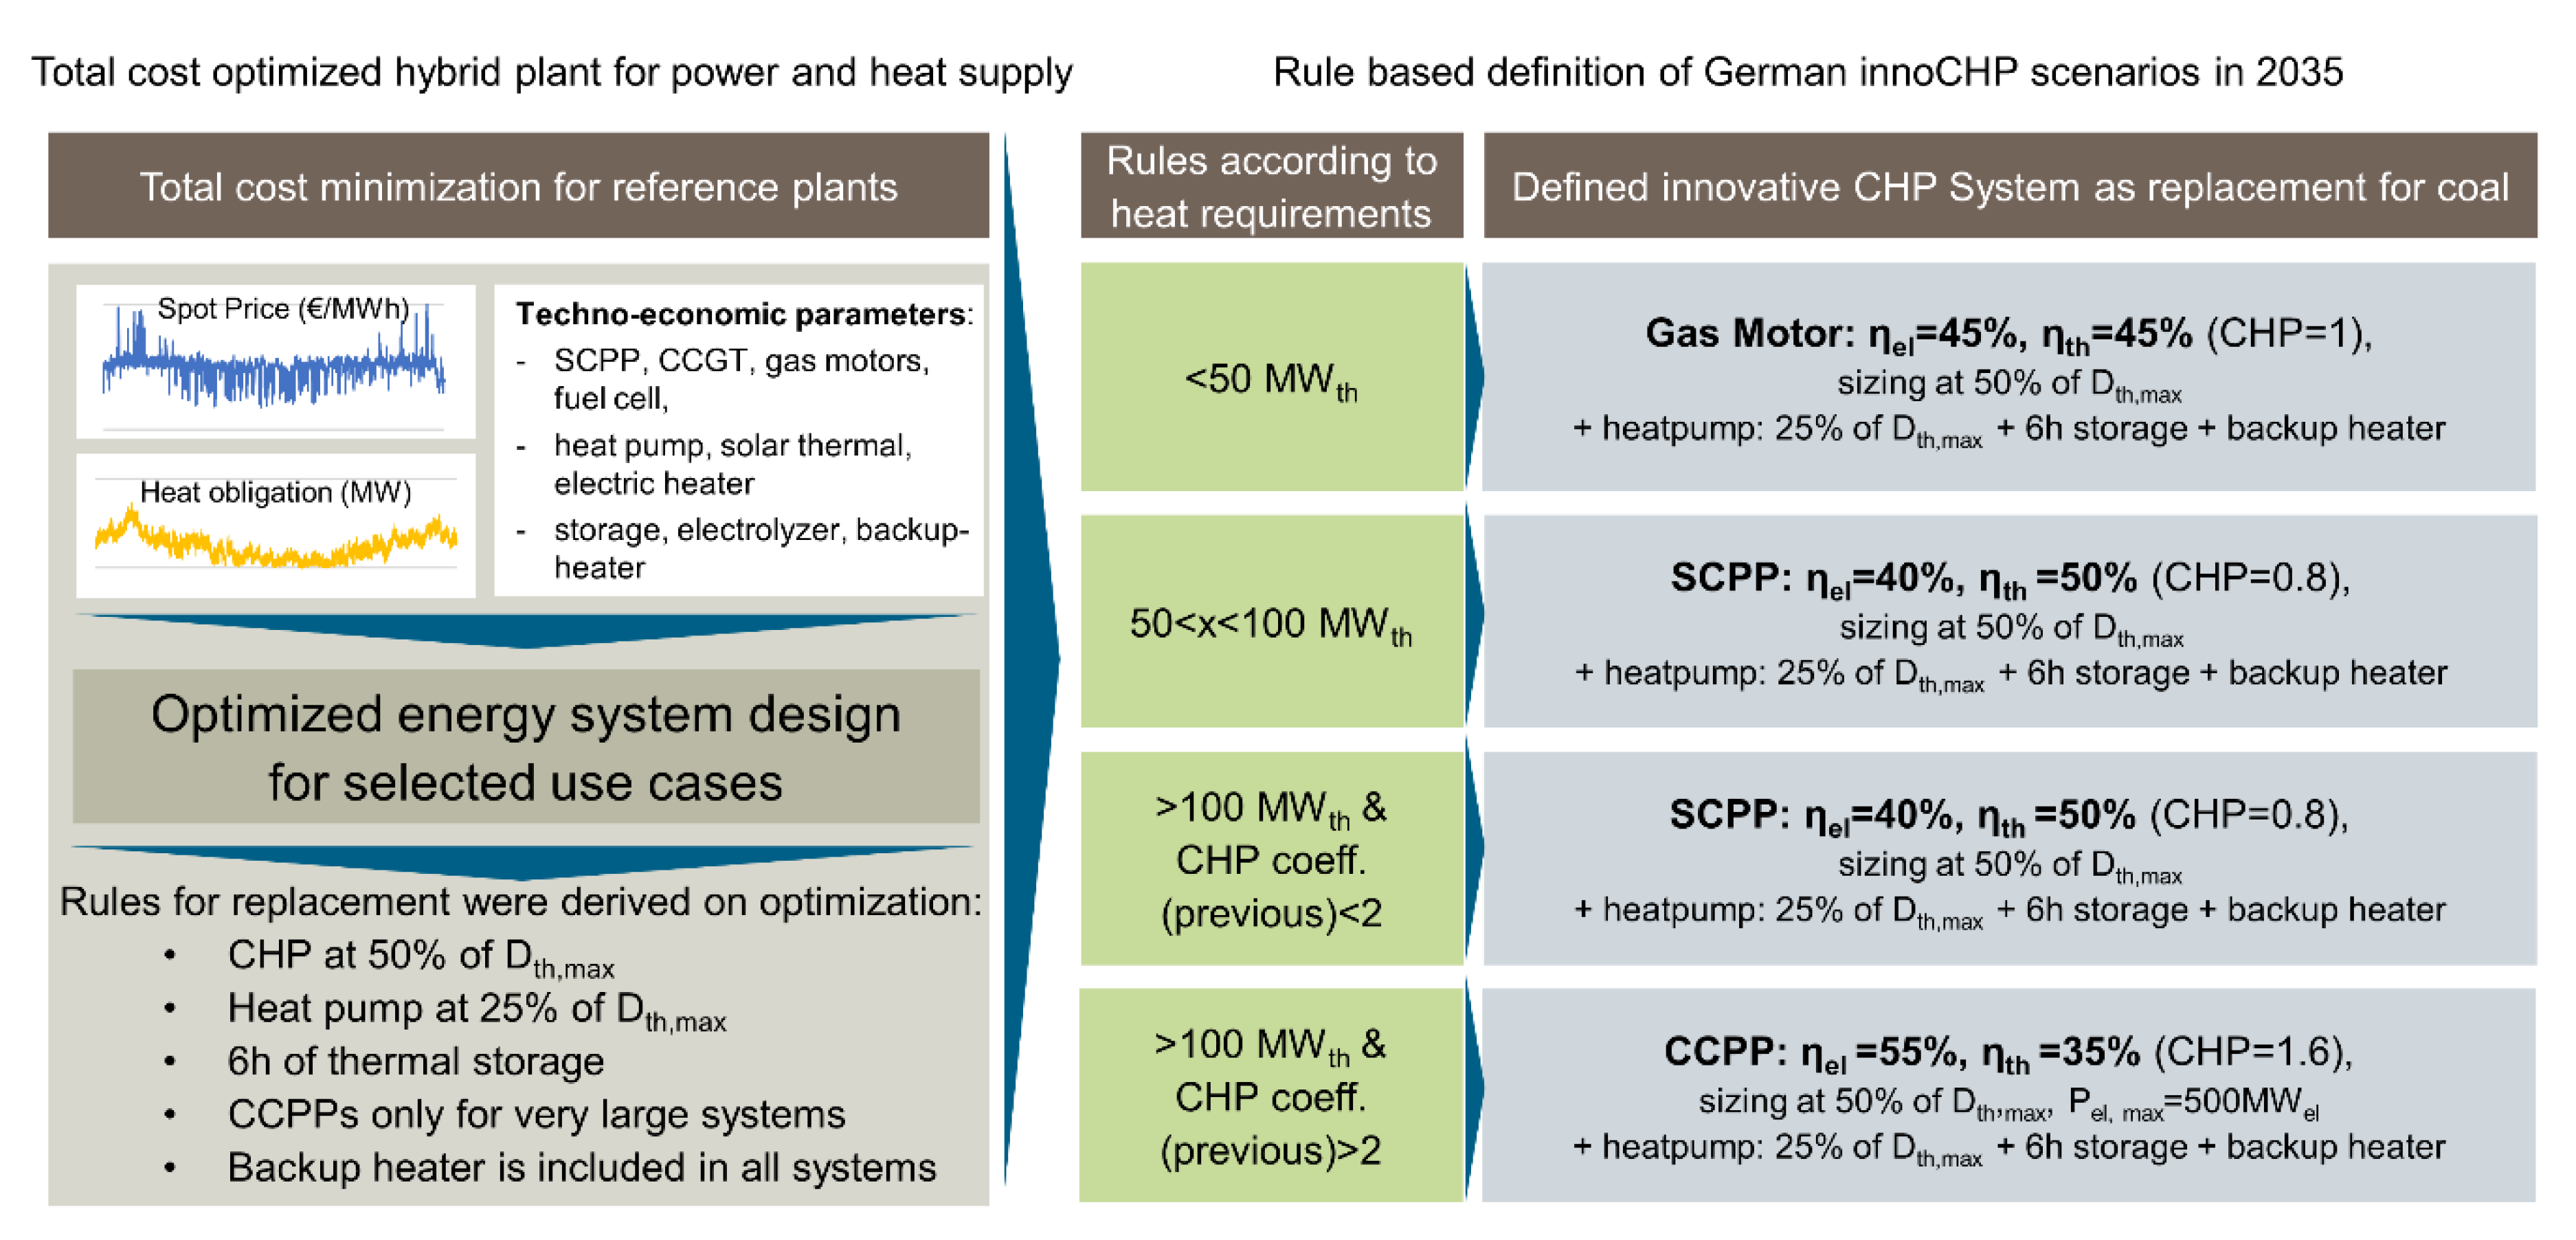
- InnoCHP (2023, 2035): The heat obligations of CHP power plants, which are shut down, are fulfilled by an optimized mix of innovative heat generation units. A detailed description of the optimization process to find these innovative units is described in Section 2.2.5. Calculation of InnoCHP Capacity Built up.
- CO2 price (2023, 2035): As the assumed CO2 prices are comparably low for the base scenarios, the impact of higher CO2 prices on the electricity market is another sensitivity. Therefore, the prices are increased to 40 EUR/t (2023) and 100 EUR/t (2035) [28].
- Grid 2023+ (2023): The grid sensitivity 2023+ describes the planned grid expansion status at the end of the year 2023. It differs significantly from the base scenario since, during the year 2023, for example, several phase shifting transformers (PSTs) and, with Ultranet, the first HVDC systems in the German electrical transmission grid are planned to be installed
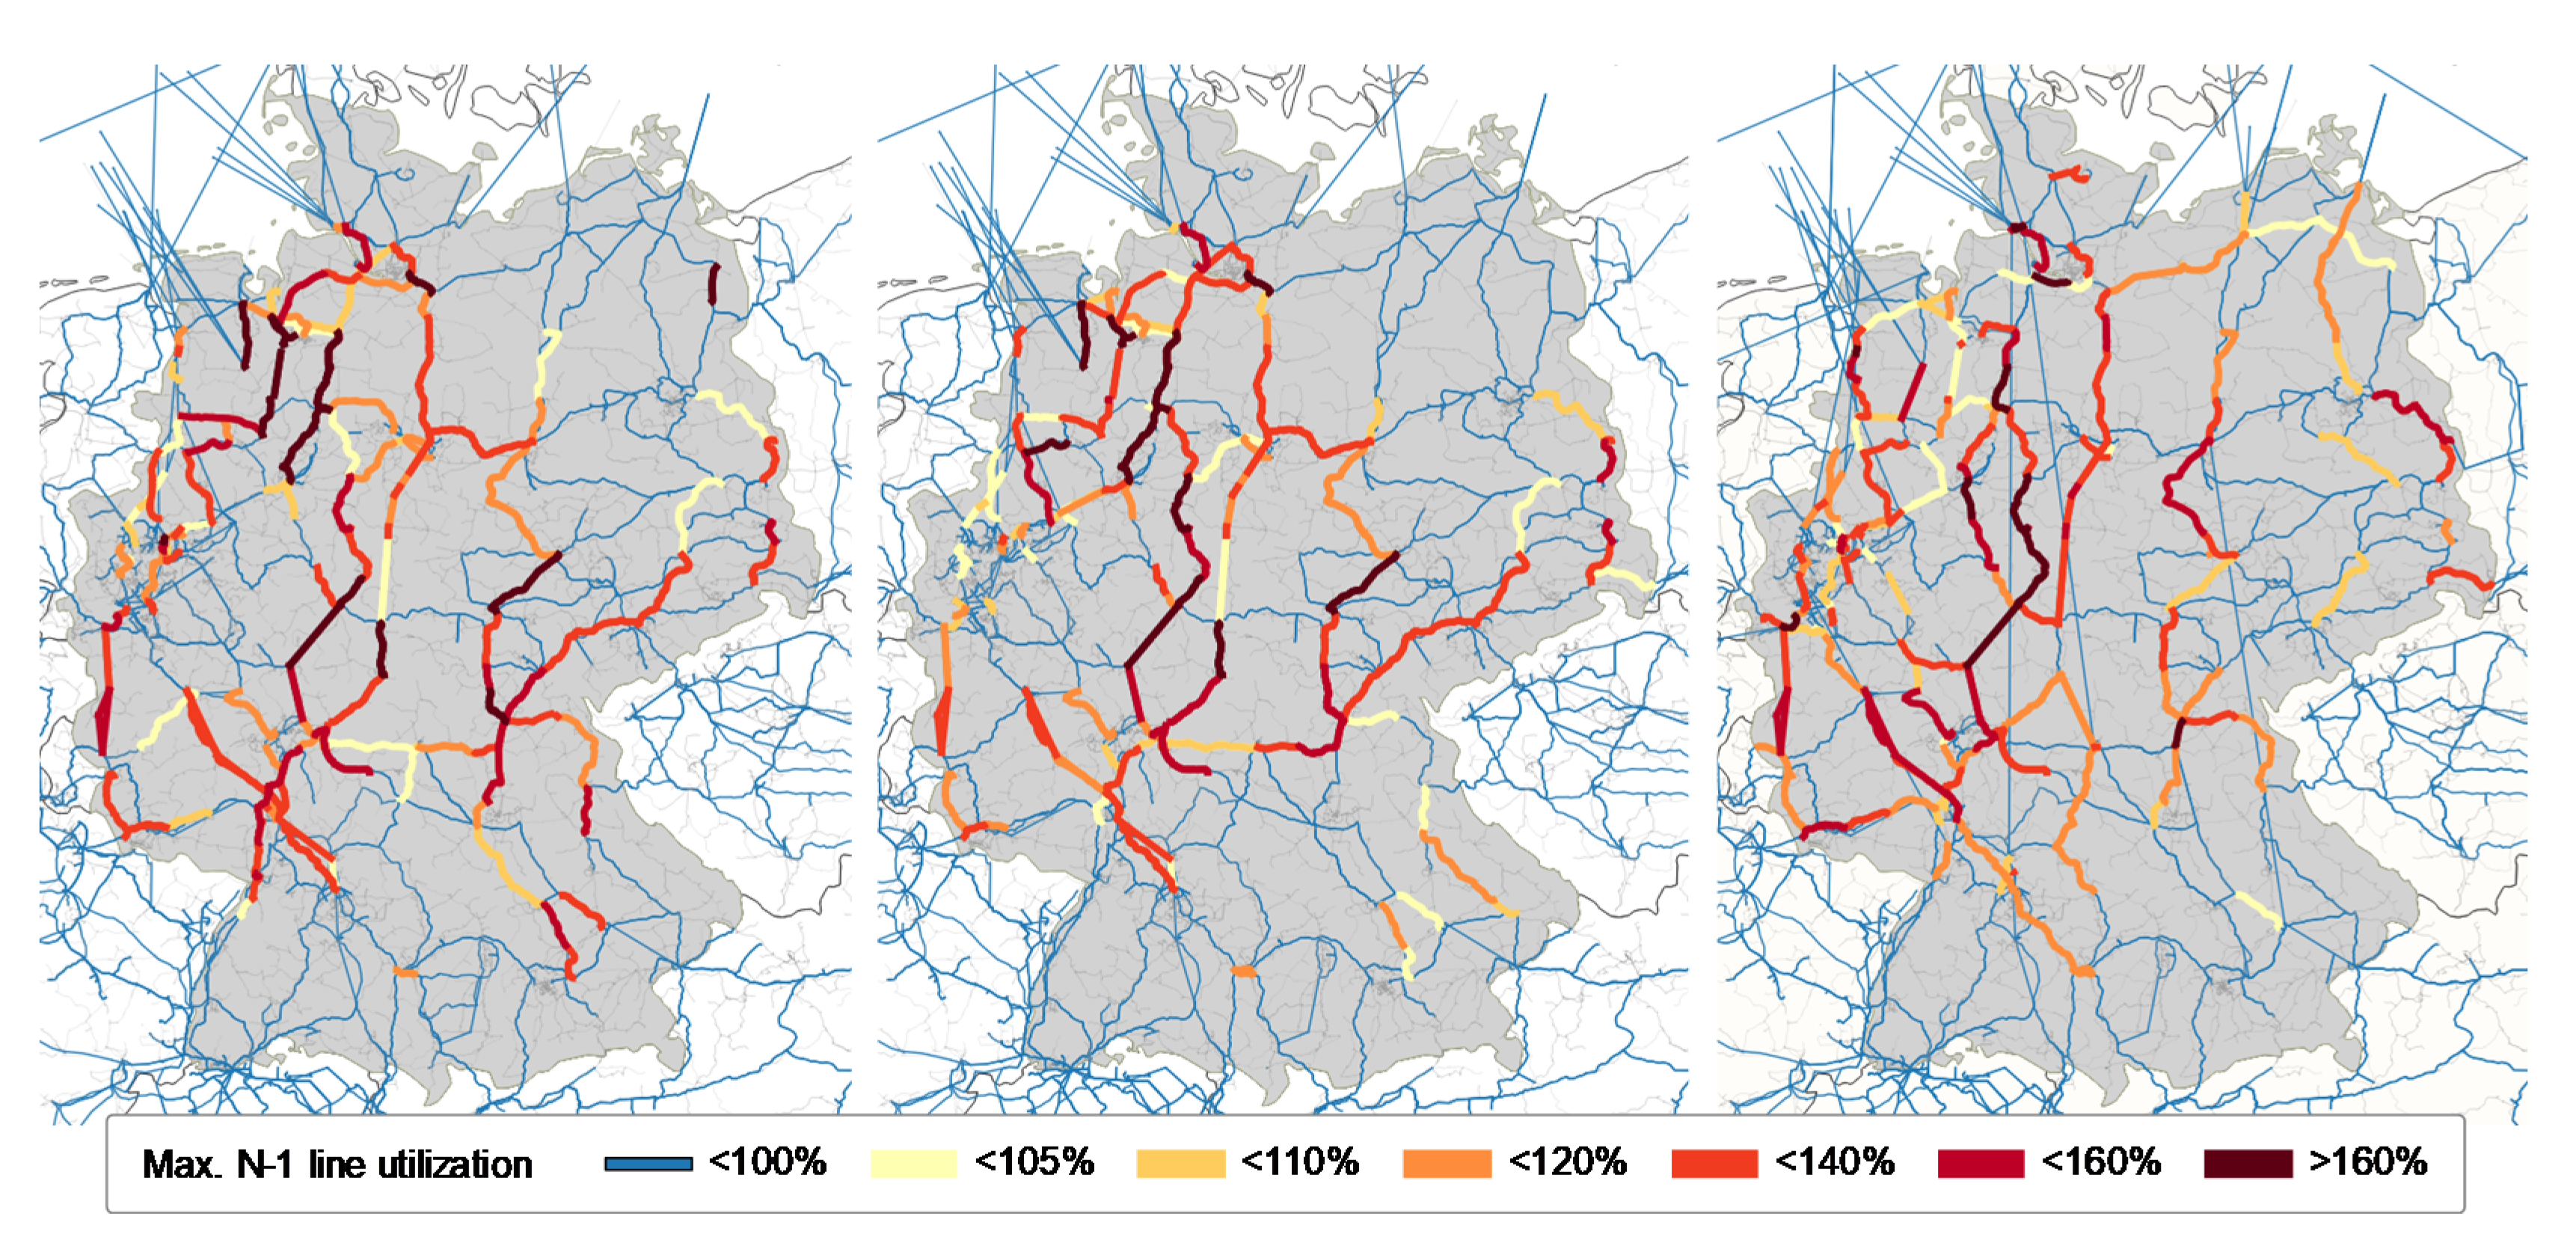
- GridFlex (2035): Reacting to the increasing amount of variable renewable energy sources in the grid, new concepts for grid operation are discussed. We assume in this sensitivity a preventive, as well as curative (i.e., curative, when a contingency occurs), grid operation and new technologies supporting the grid with ancillary services such as grid boosters. The sensitivity GridFlex is divided in three scenarios: the scenario GridFlex 1 contains 12 central grid boosters, the scenario GridFlex 2 focuses on decentral flexibility, and the scenario GridFlex 3 investigates the curative operation of HVDC systems and PSTs. In each scenario, a temporarily admissible transmission loading (TATL) of about 120% of the permanently admissible transmission loading (PATL) is taken into account [29]. Within the scenario GridFlex 3, it is assumed that the complete operating range of power flow controlling devices can be used for curative interventions.
- Onshore–Offshore Shift (2035): Since the expansion of onshore wind is lagging official plans [30], this scenario includes 10 GW additional offshore wind units compared to the NEP B 2035 scenario. The capacities, producing an equivalent annual amount of energy as this 10 GW, are then subtracted from the installed wind onshore capacity. The power-to-gas capacity is adjusted to 6 GW by a separate energy system optimization of the German electricity system described in Section 2.2.7.
- NoSuedOstLink (2035): Analyzing the urgency of HVDC systems within Germany, we define one scenario without the HVDC system SuedOstLink, one of the major planned DC links.
2.2. Modeling Approach
2.2.1. Overview
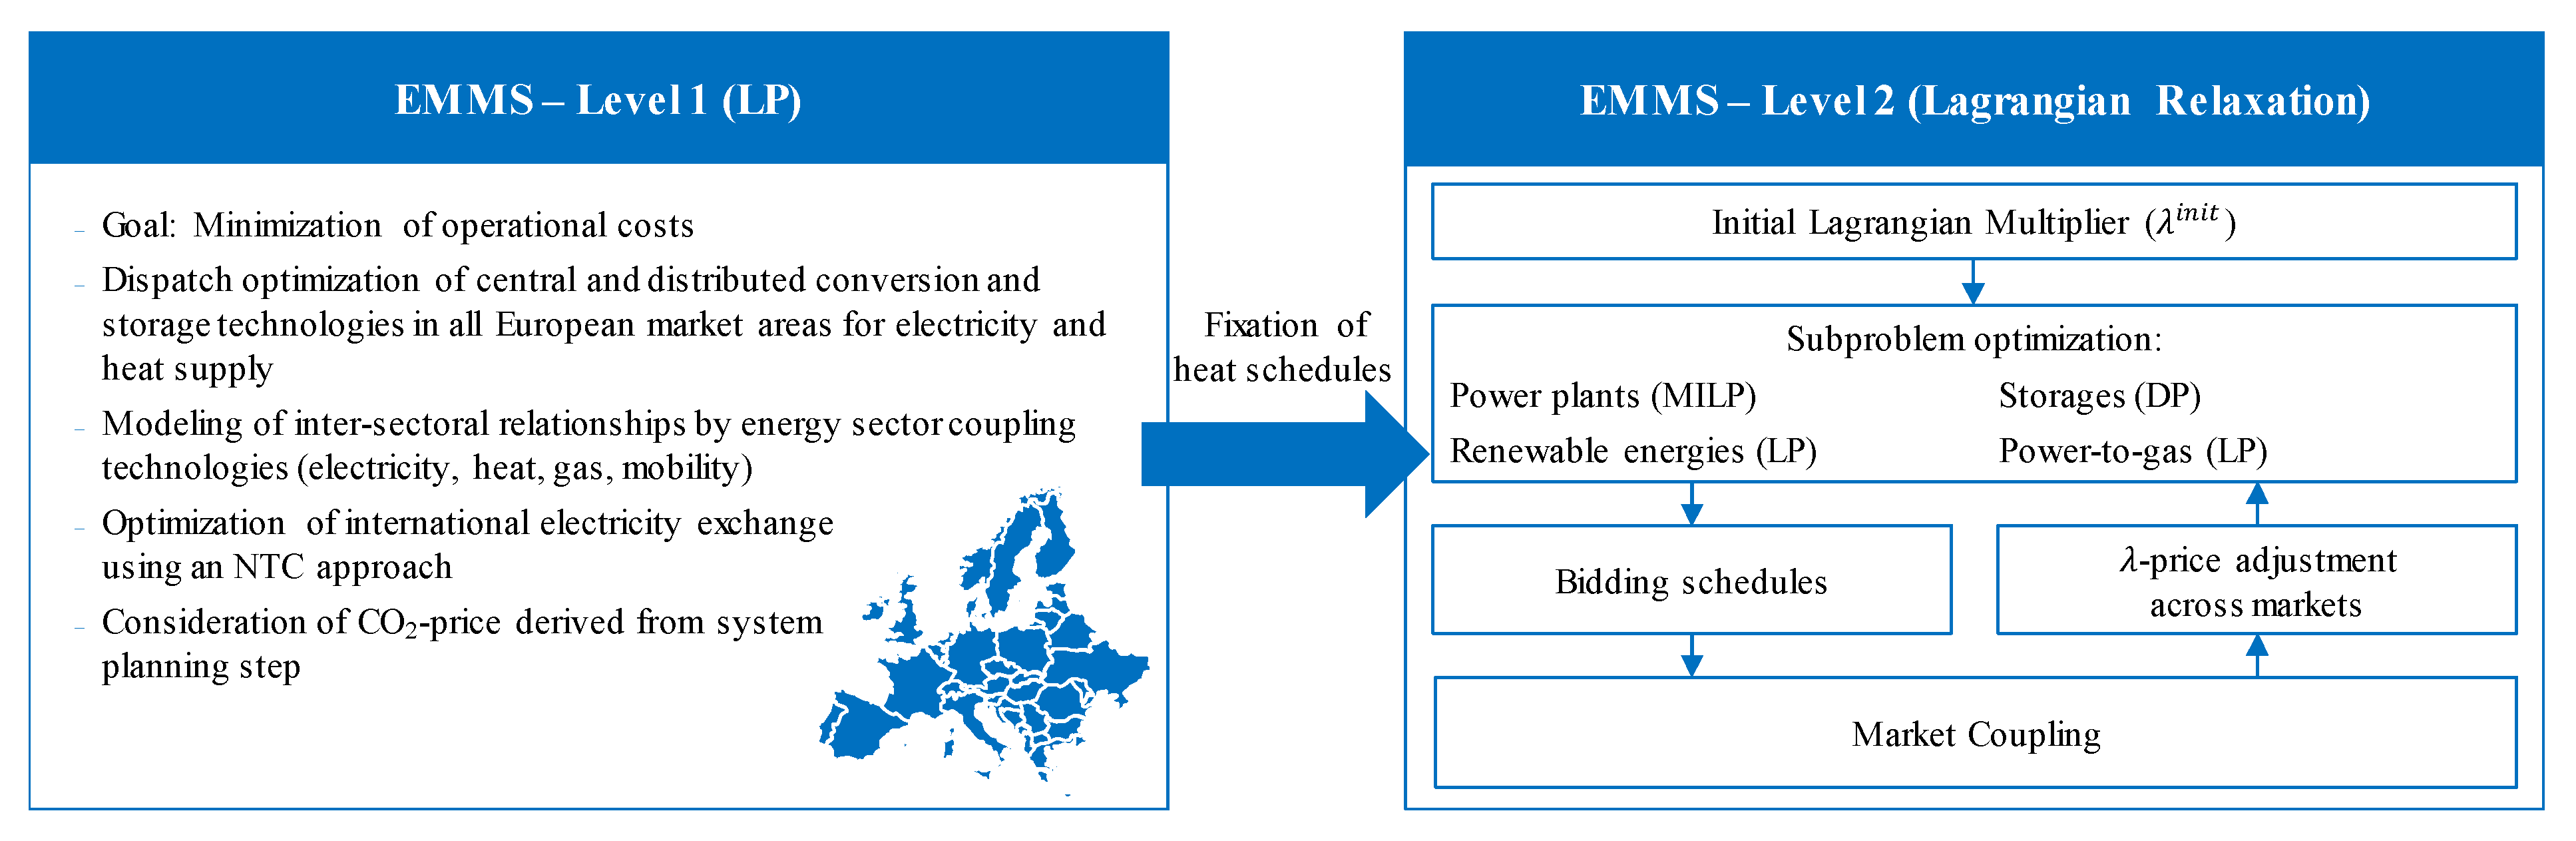
2.2.2. Market Model
2.2.3. Network Simulation and Preventive, as Well as Curative, Congestion Management
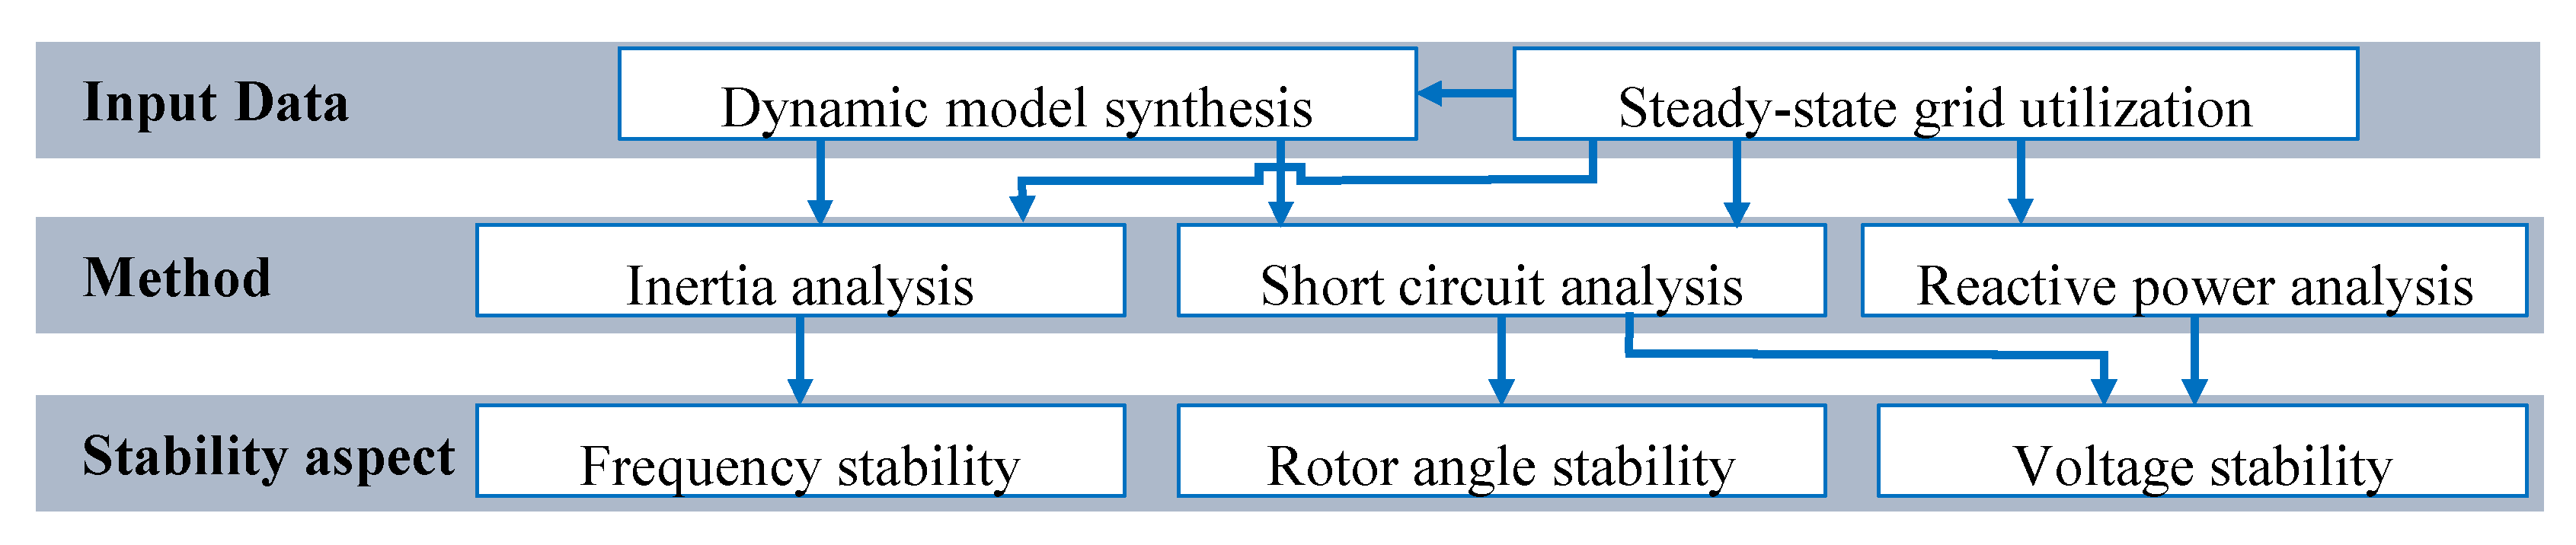
2.2.4. Stability Analyses
2.2.5. Calculation of InnoCHP Capacity Built Up
2.2.6. Industrial Green Hydrogen
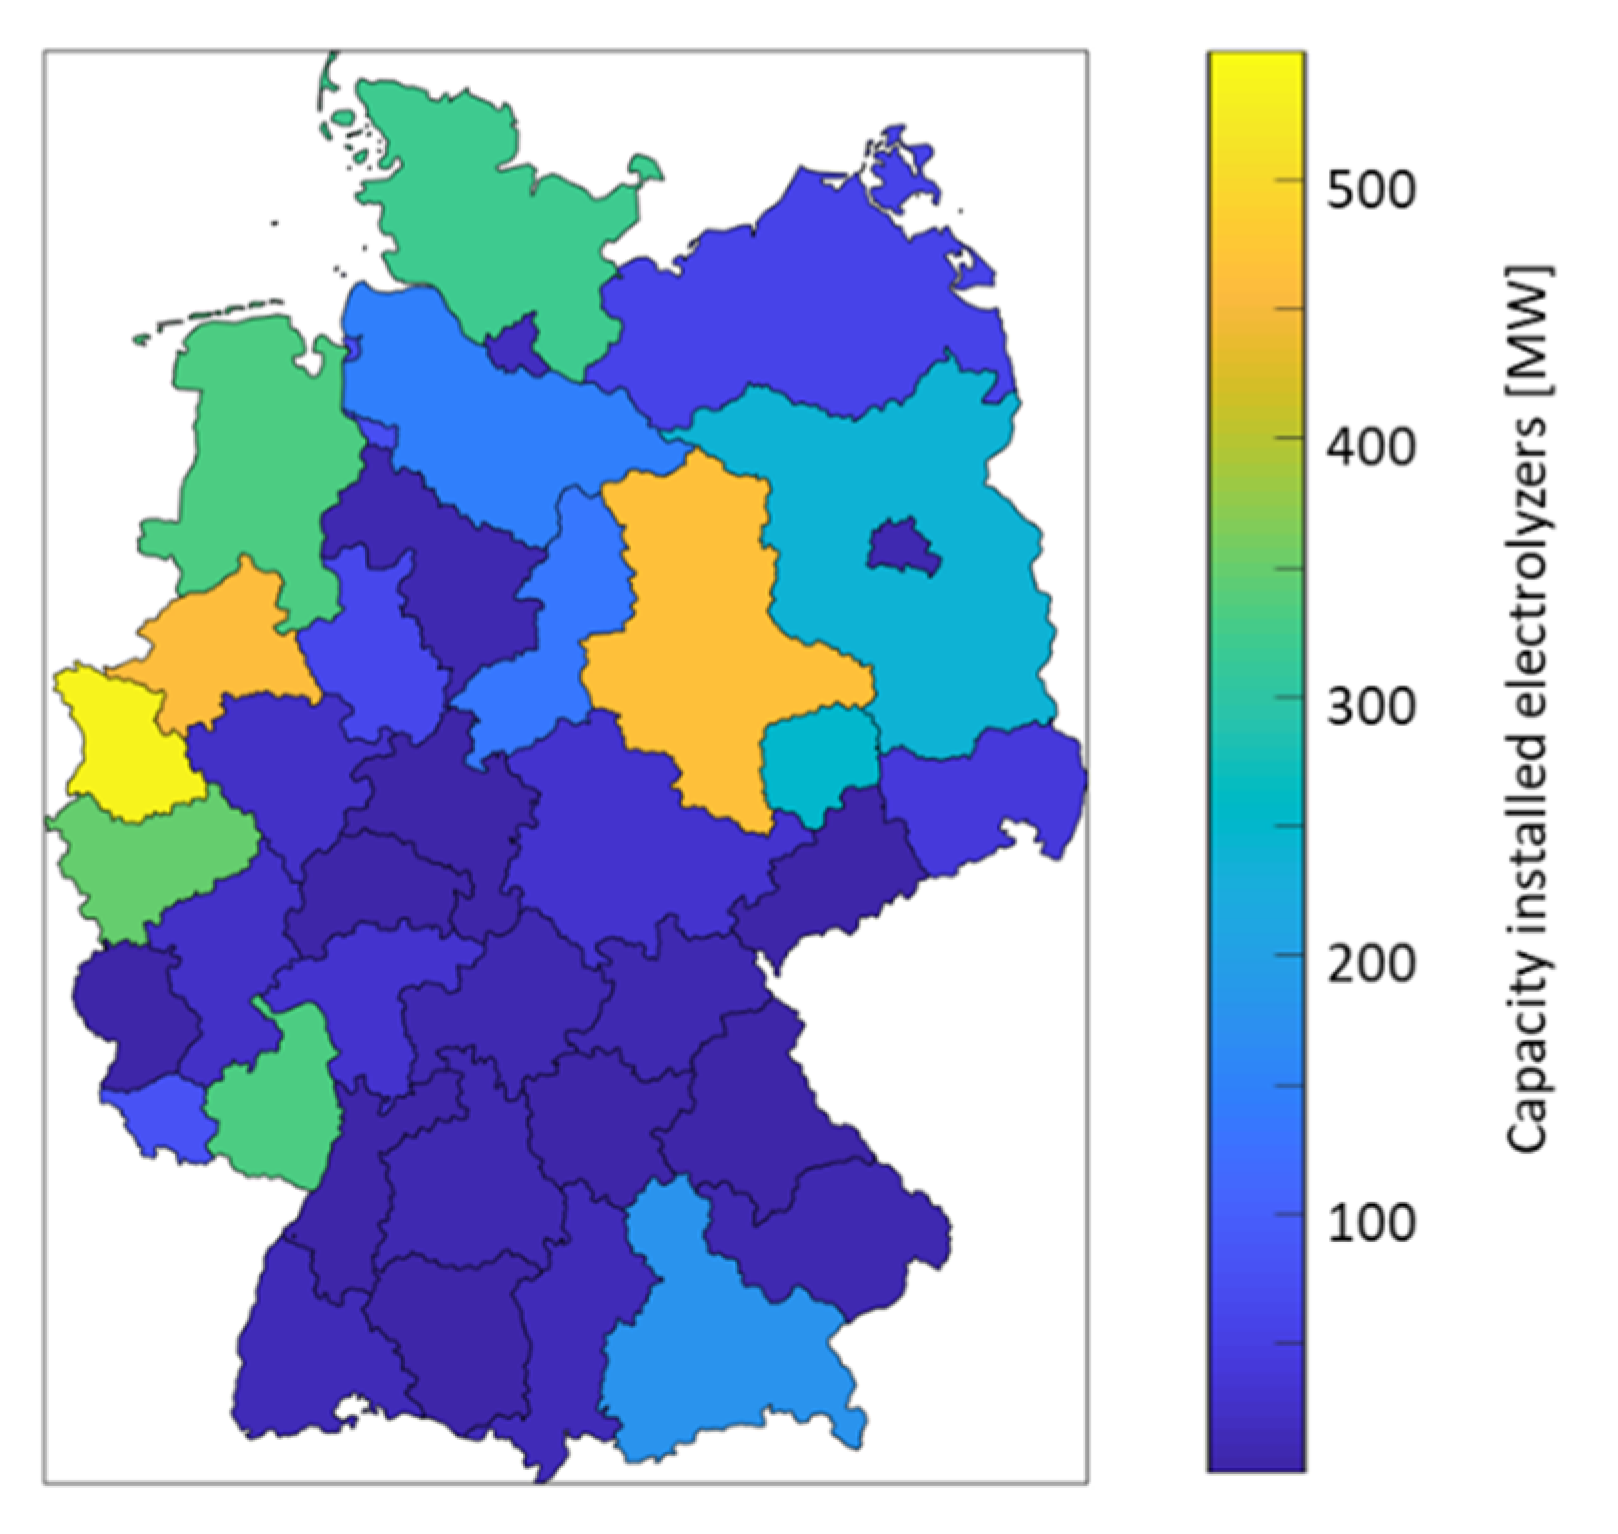
2.2.7. Optimization of Electrolyzer Capacities for Re-Electrification
3. Results
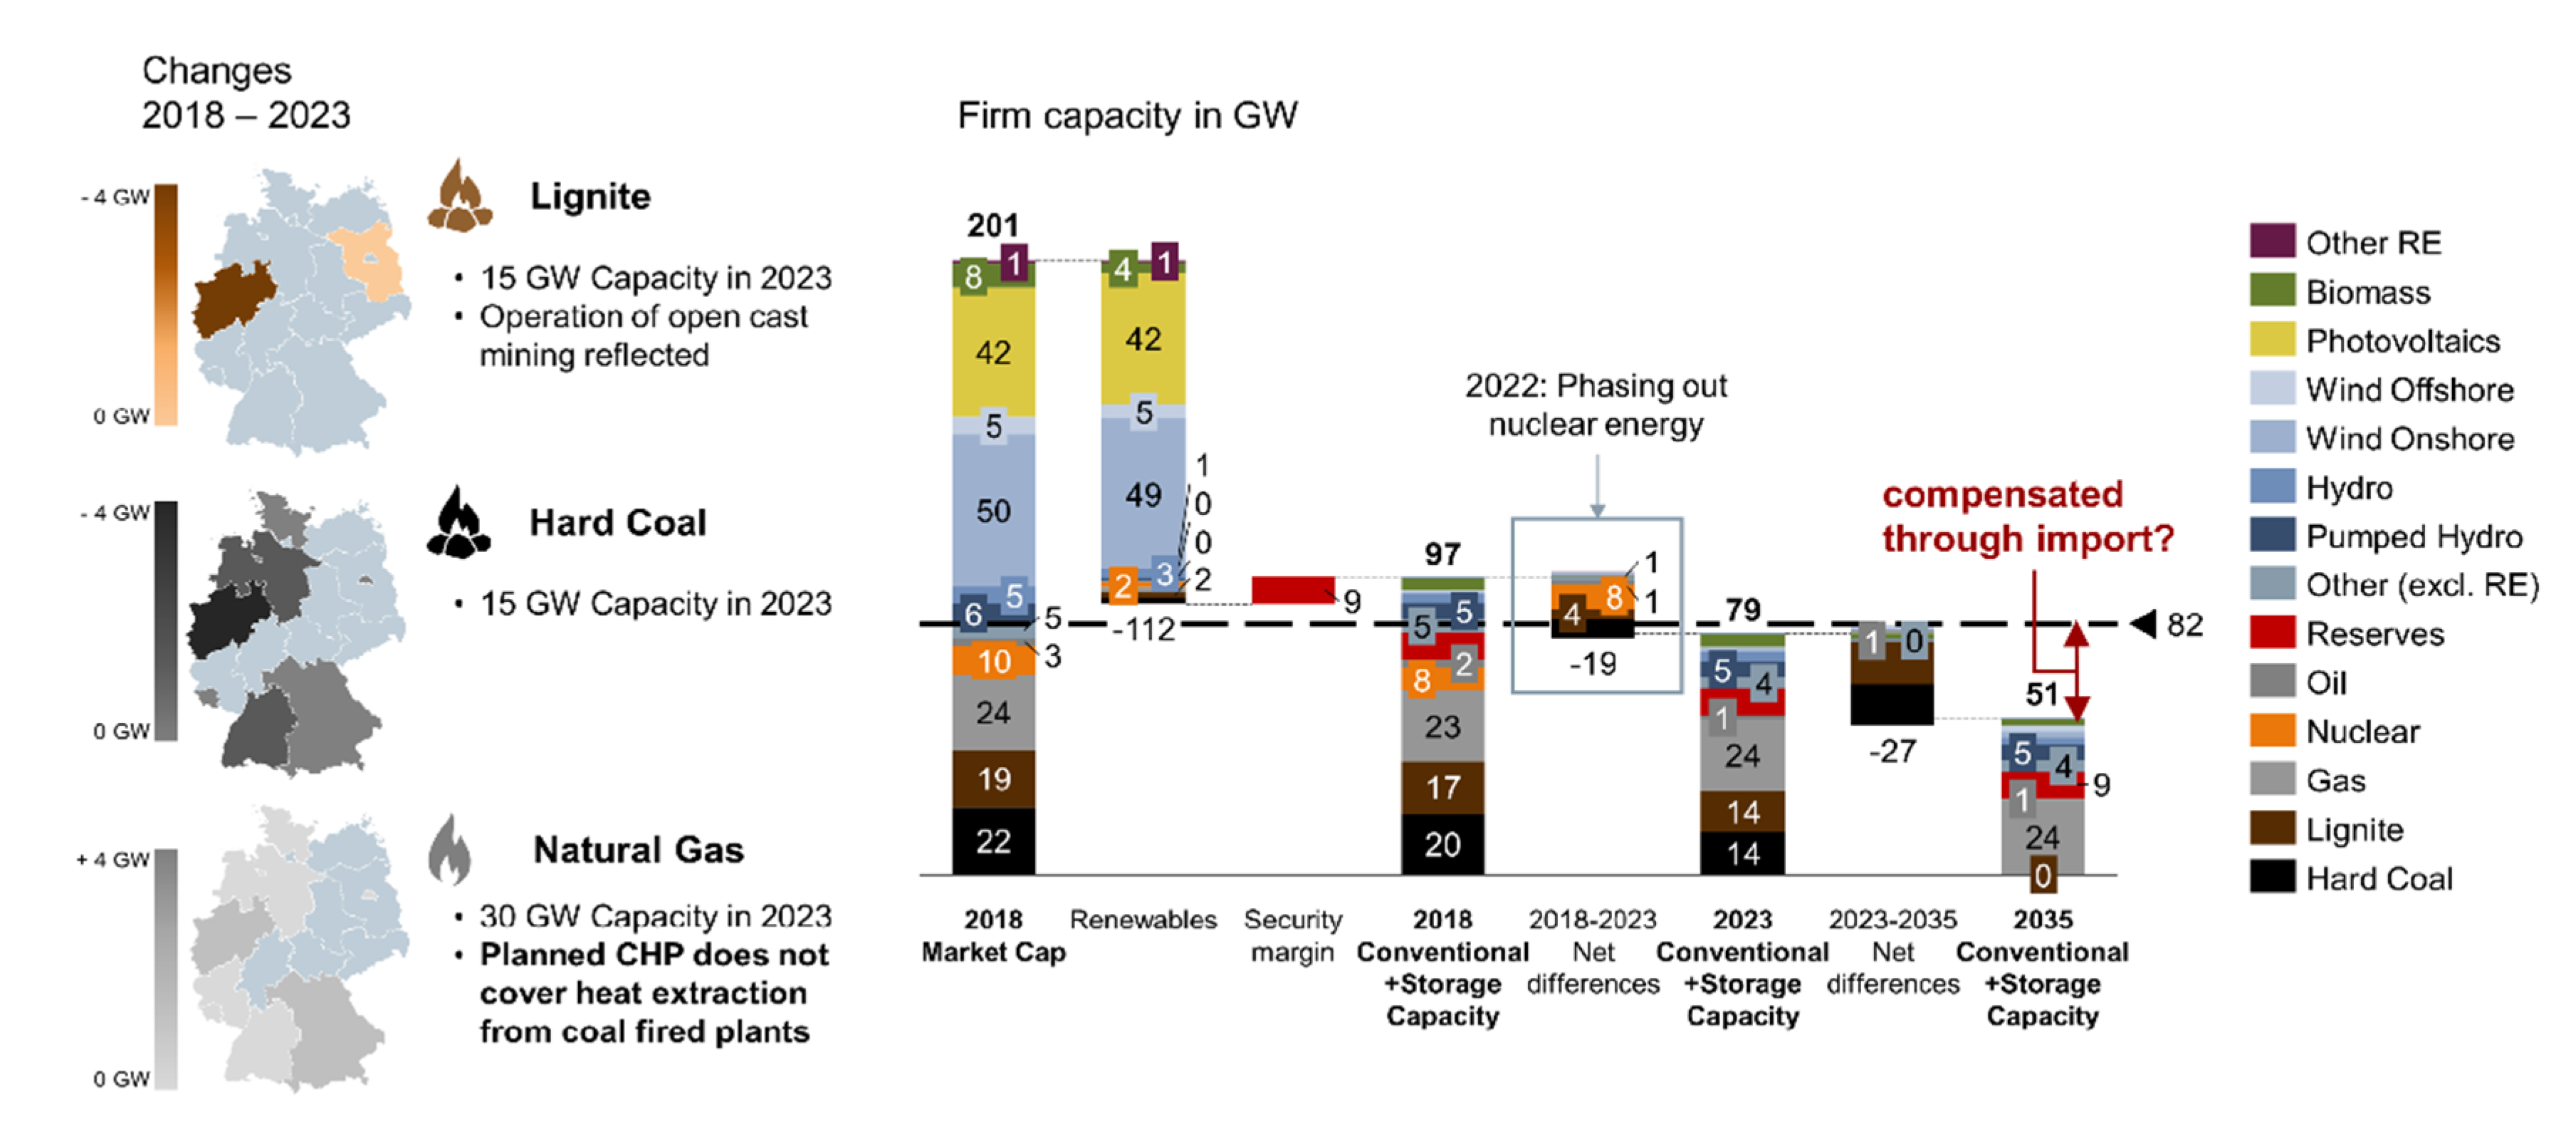
3.1. Security of Supply
3.1.1. Base Case
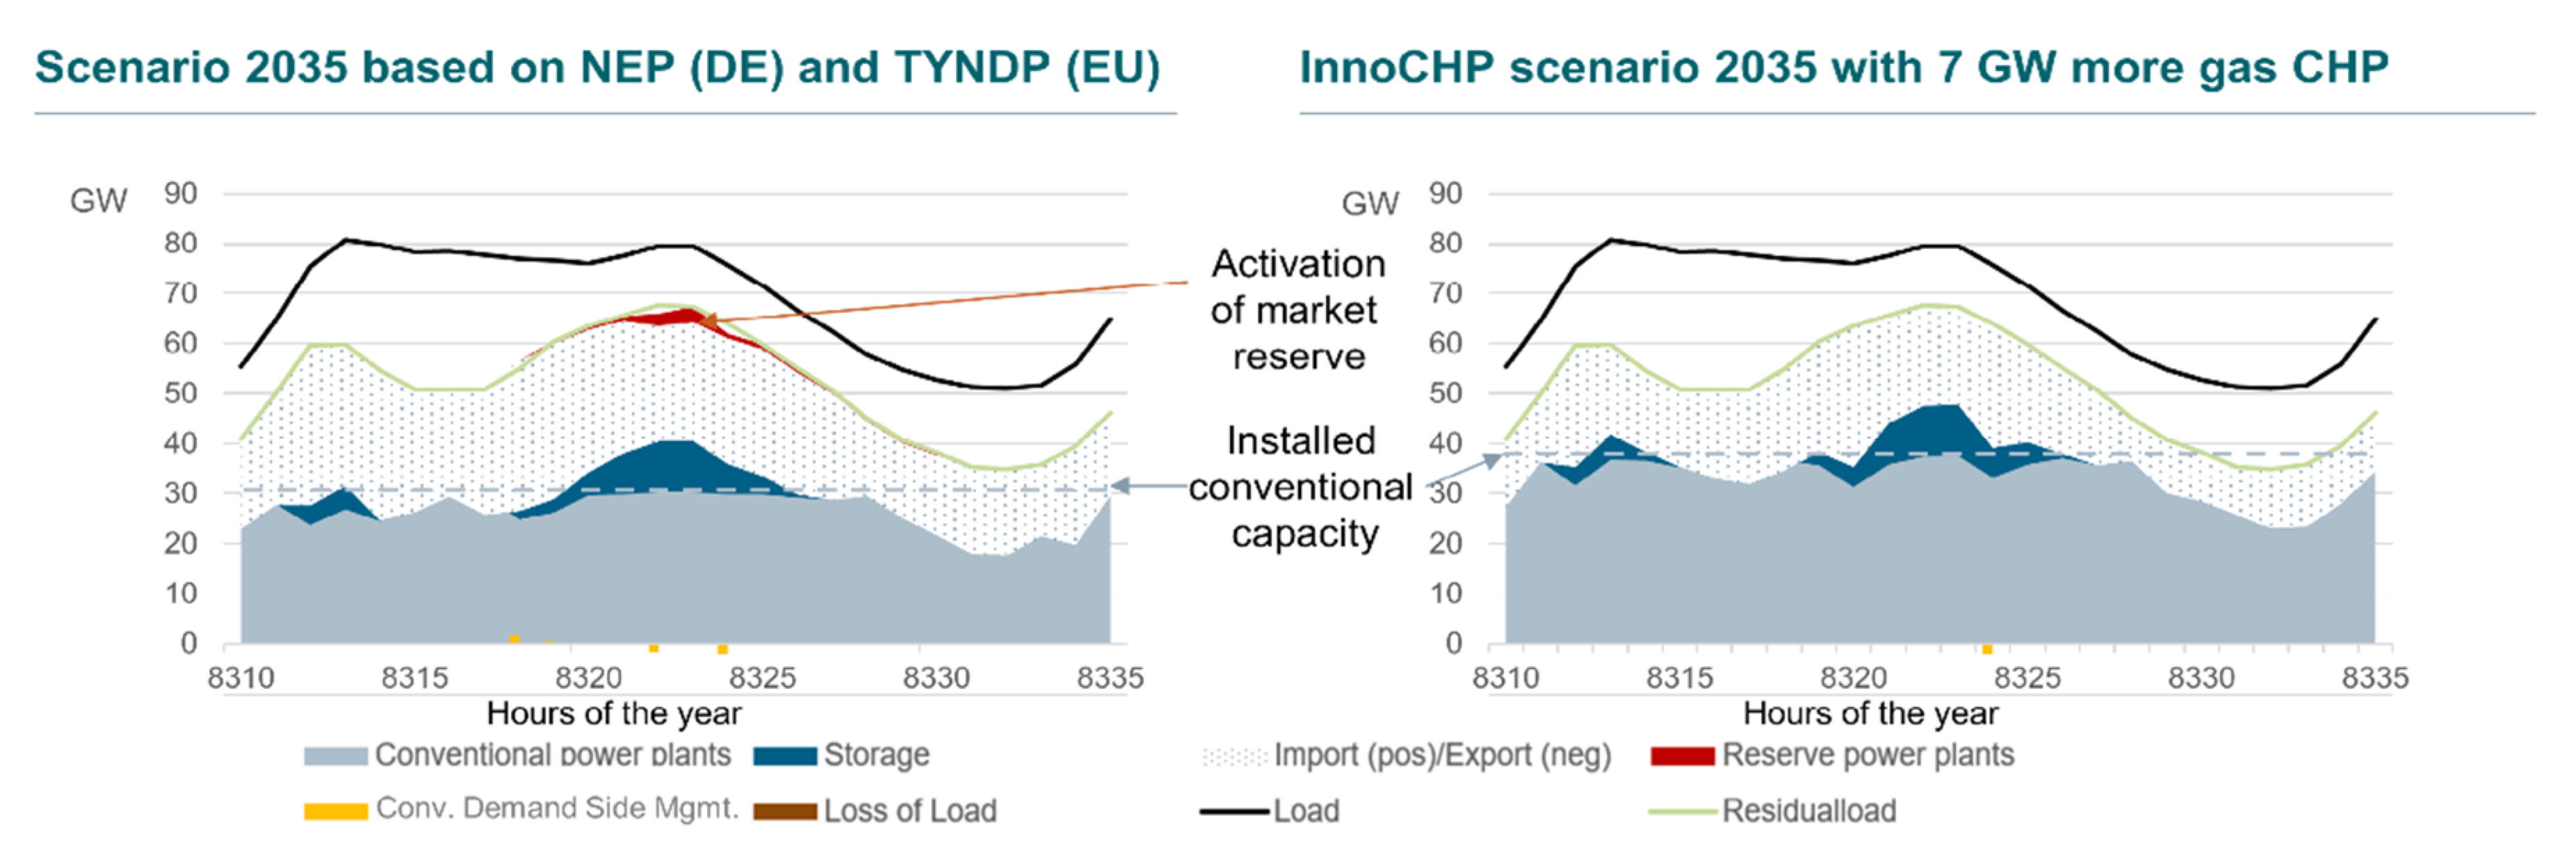
3.1.2. Increasing Security of Supply with Additional CHP Plants
Effects on Reserve Activation
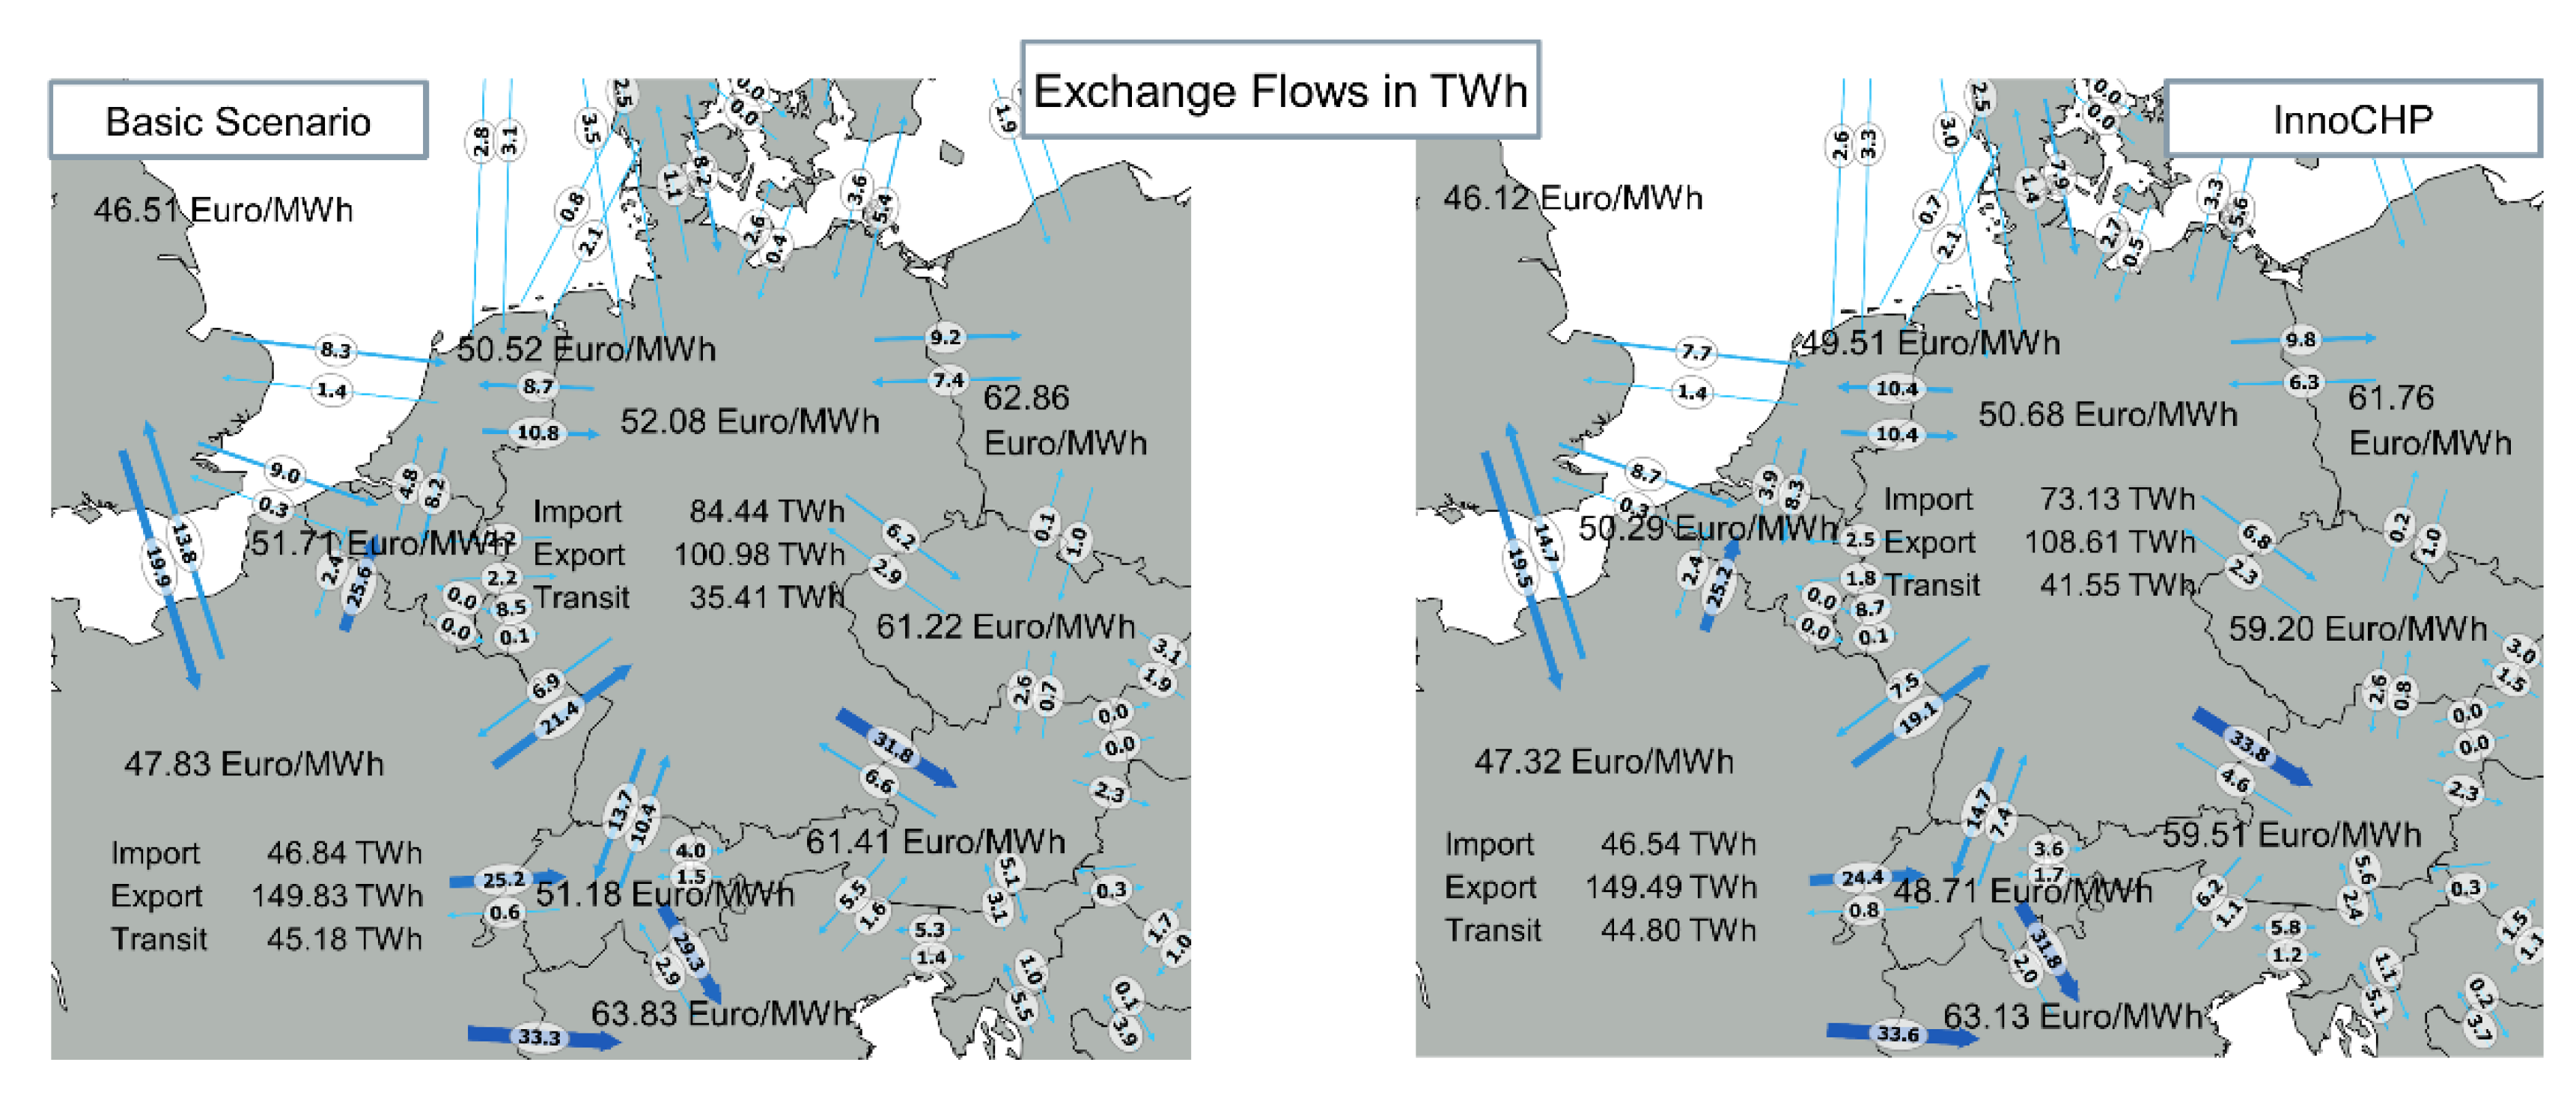
Effects on Imports and Exports
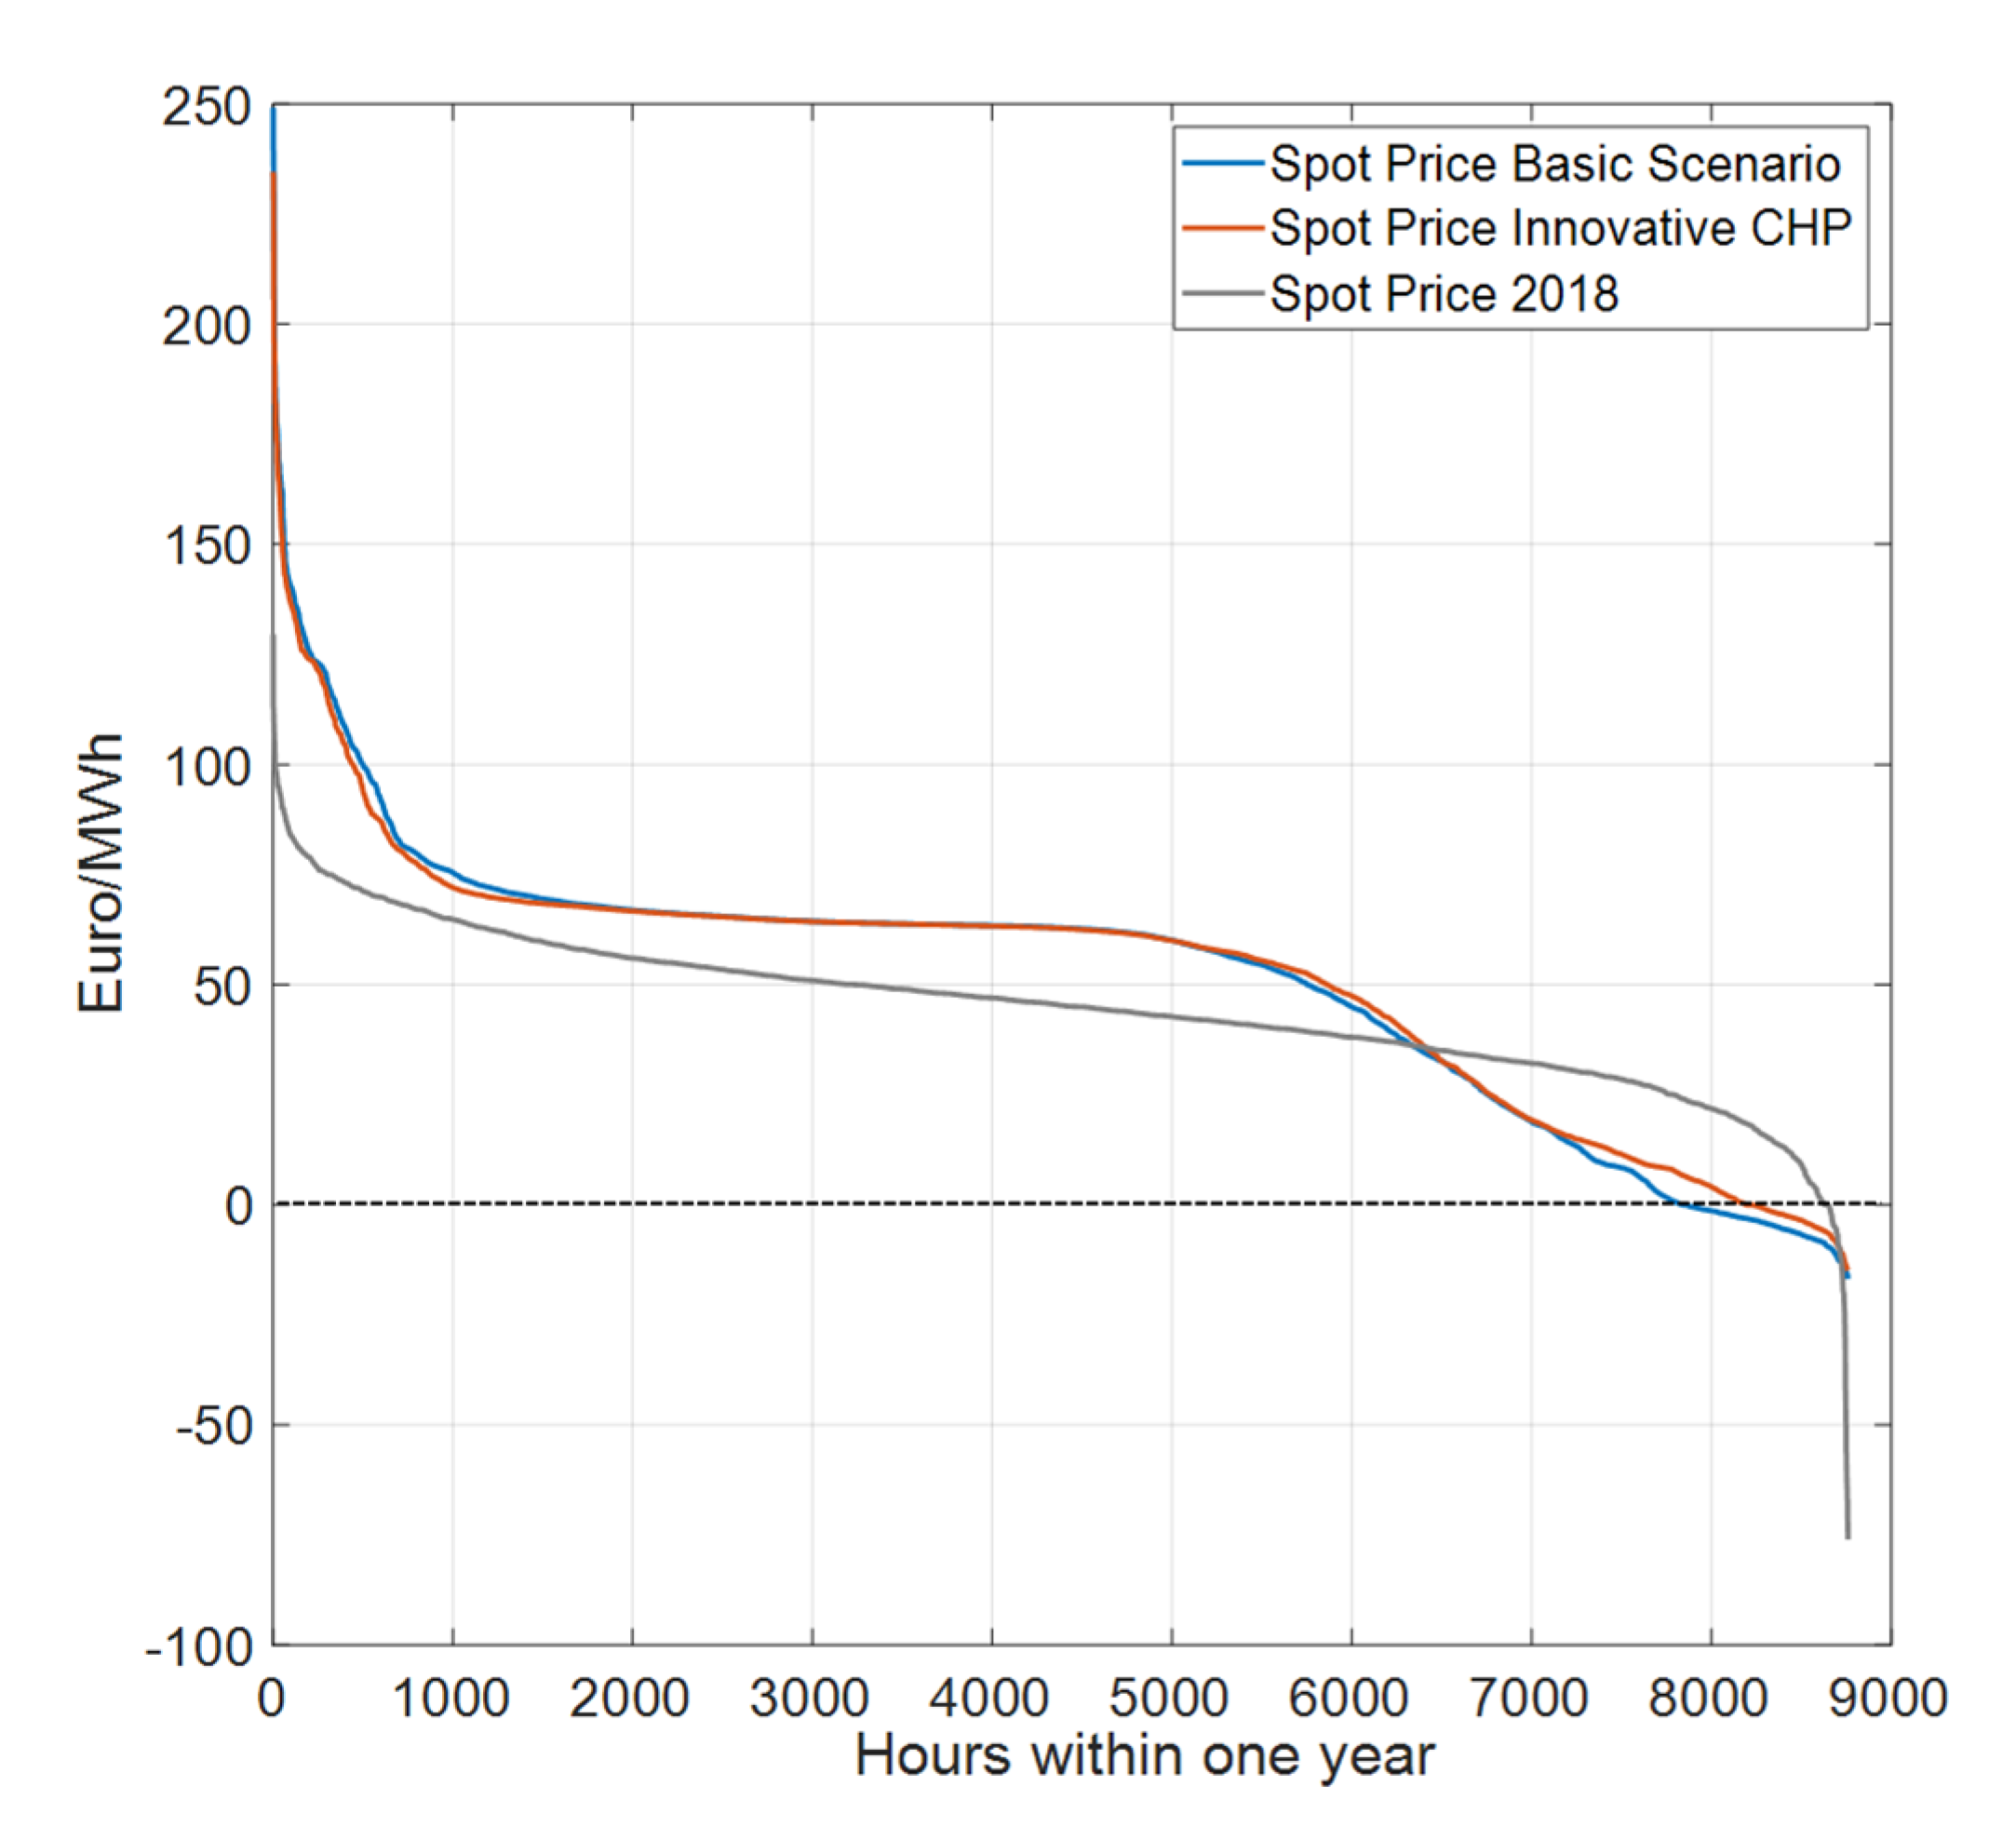
Effects on Electricity Prices
- -
- Adding CHP plants reduces the peak electricity prices; in particular, the hours with very high prices above 100 EUR/MWh are reduced significantly.
- -
- When it comes to very low and even negative prices, the effect is the other way around; the electric heaters that are installed consume electricity in times with very high renewable generation and, thus, dampen the price curve.
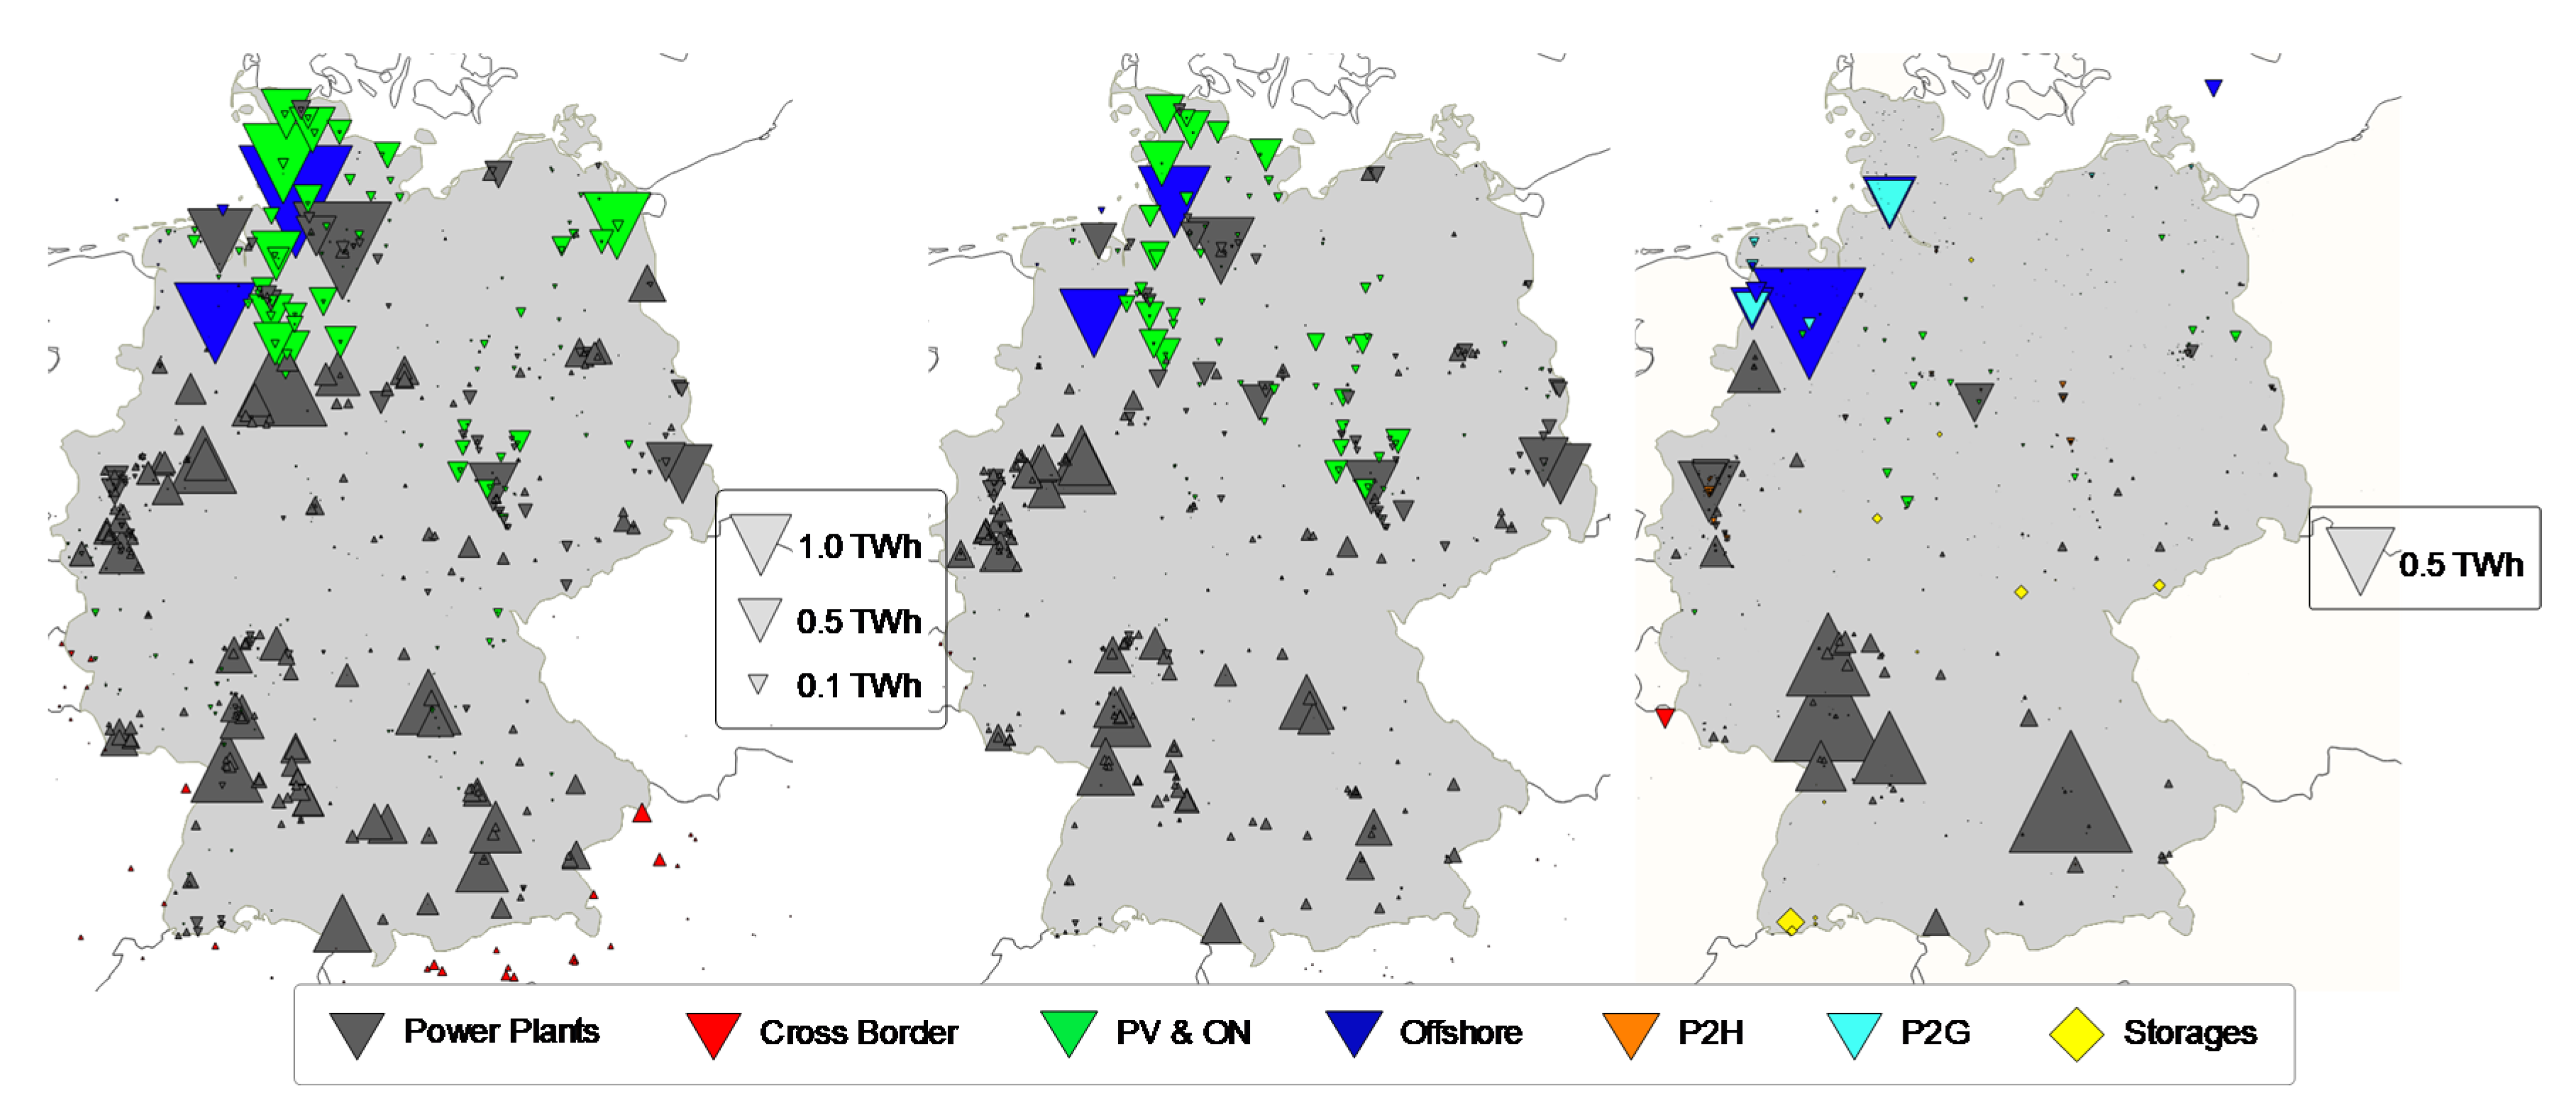
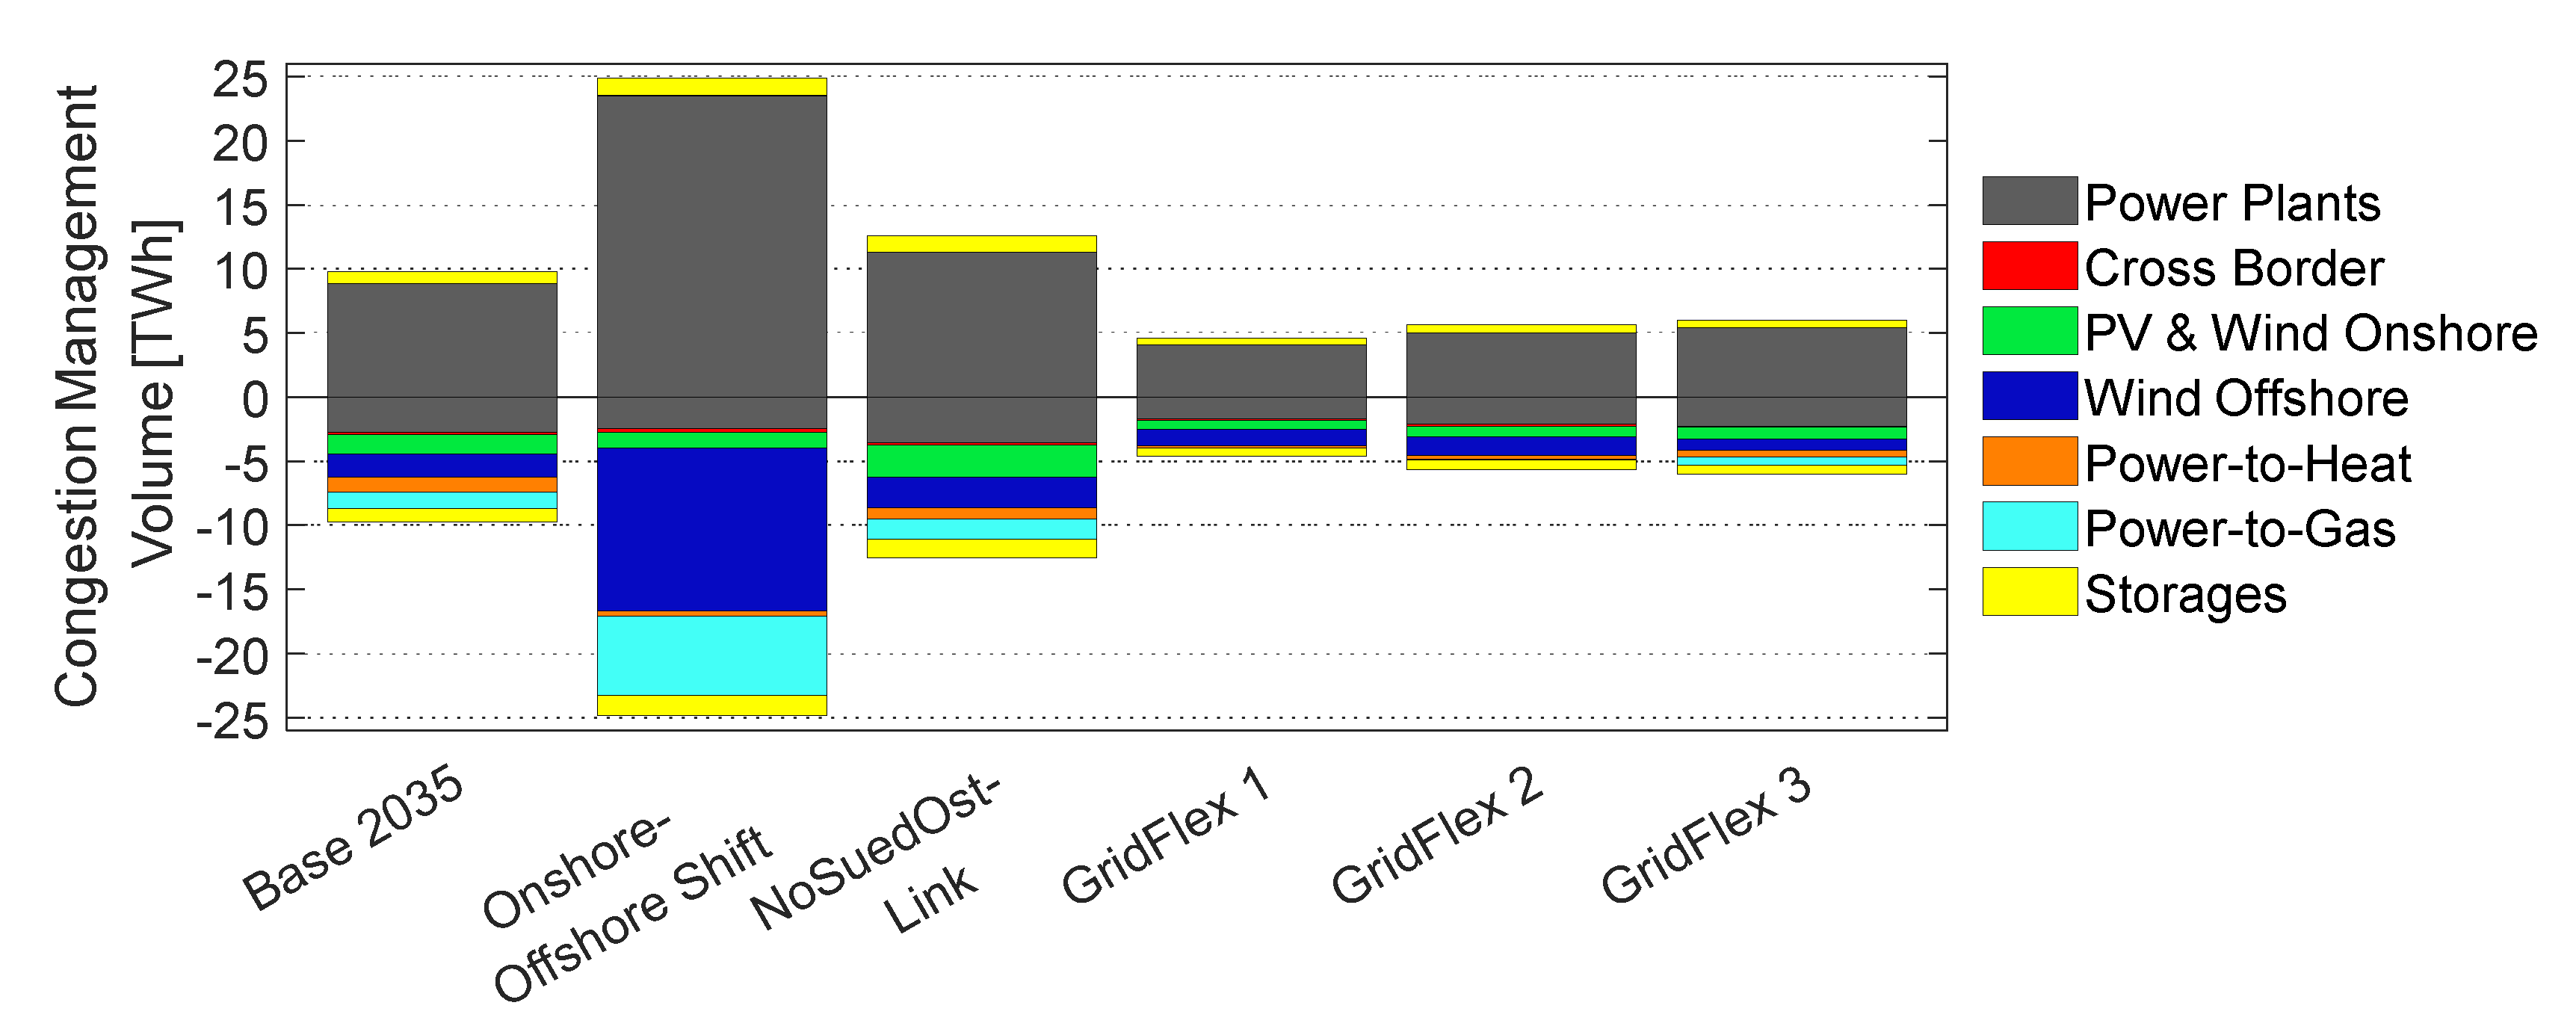
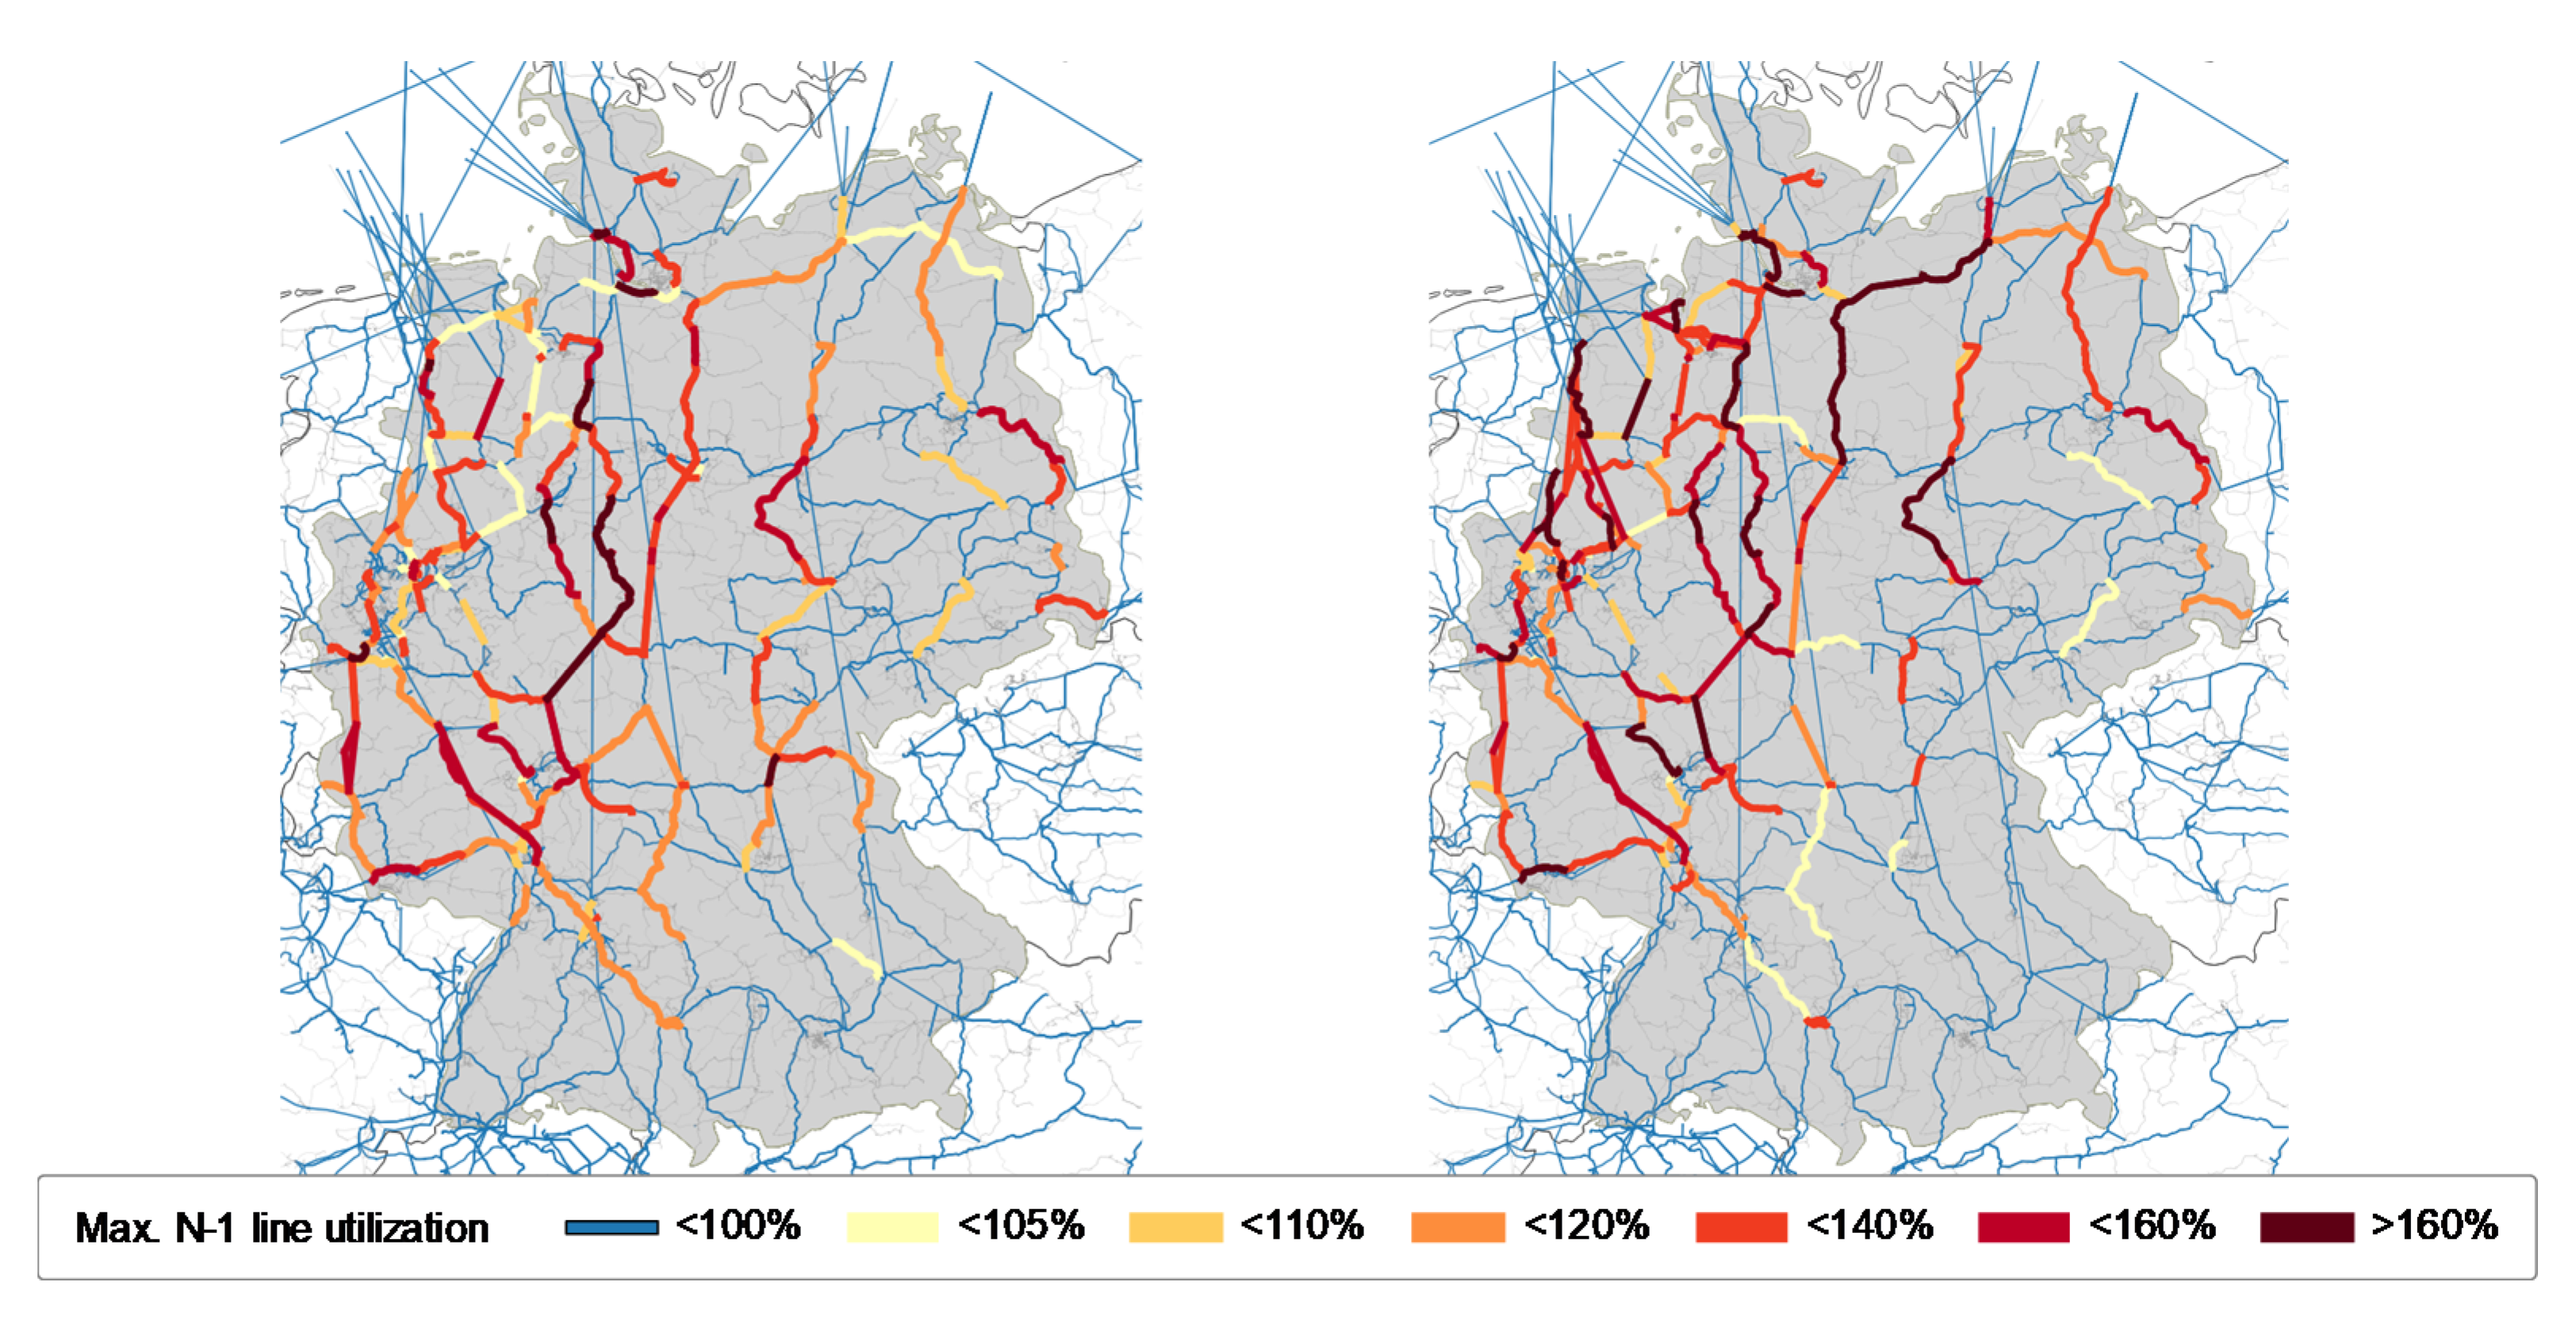
3.2. Renewable Integration: Congestion Management and Flexibilities
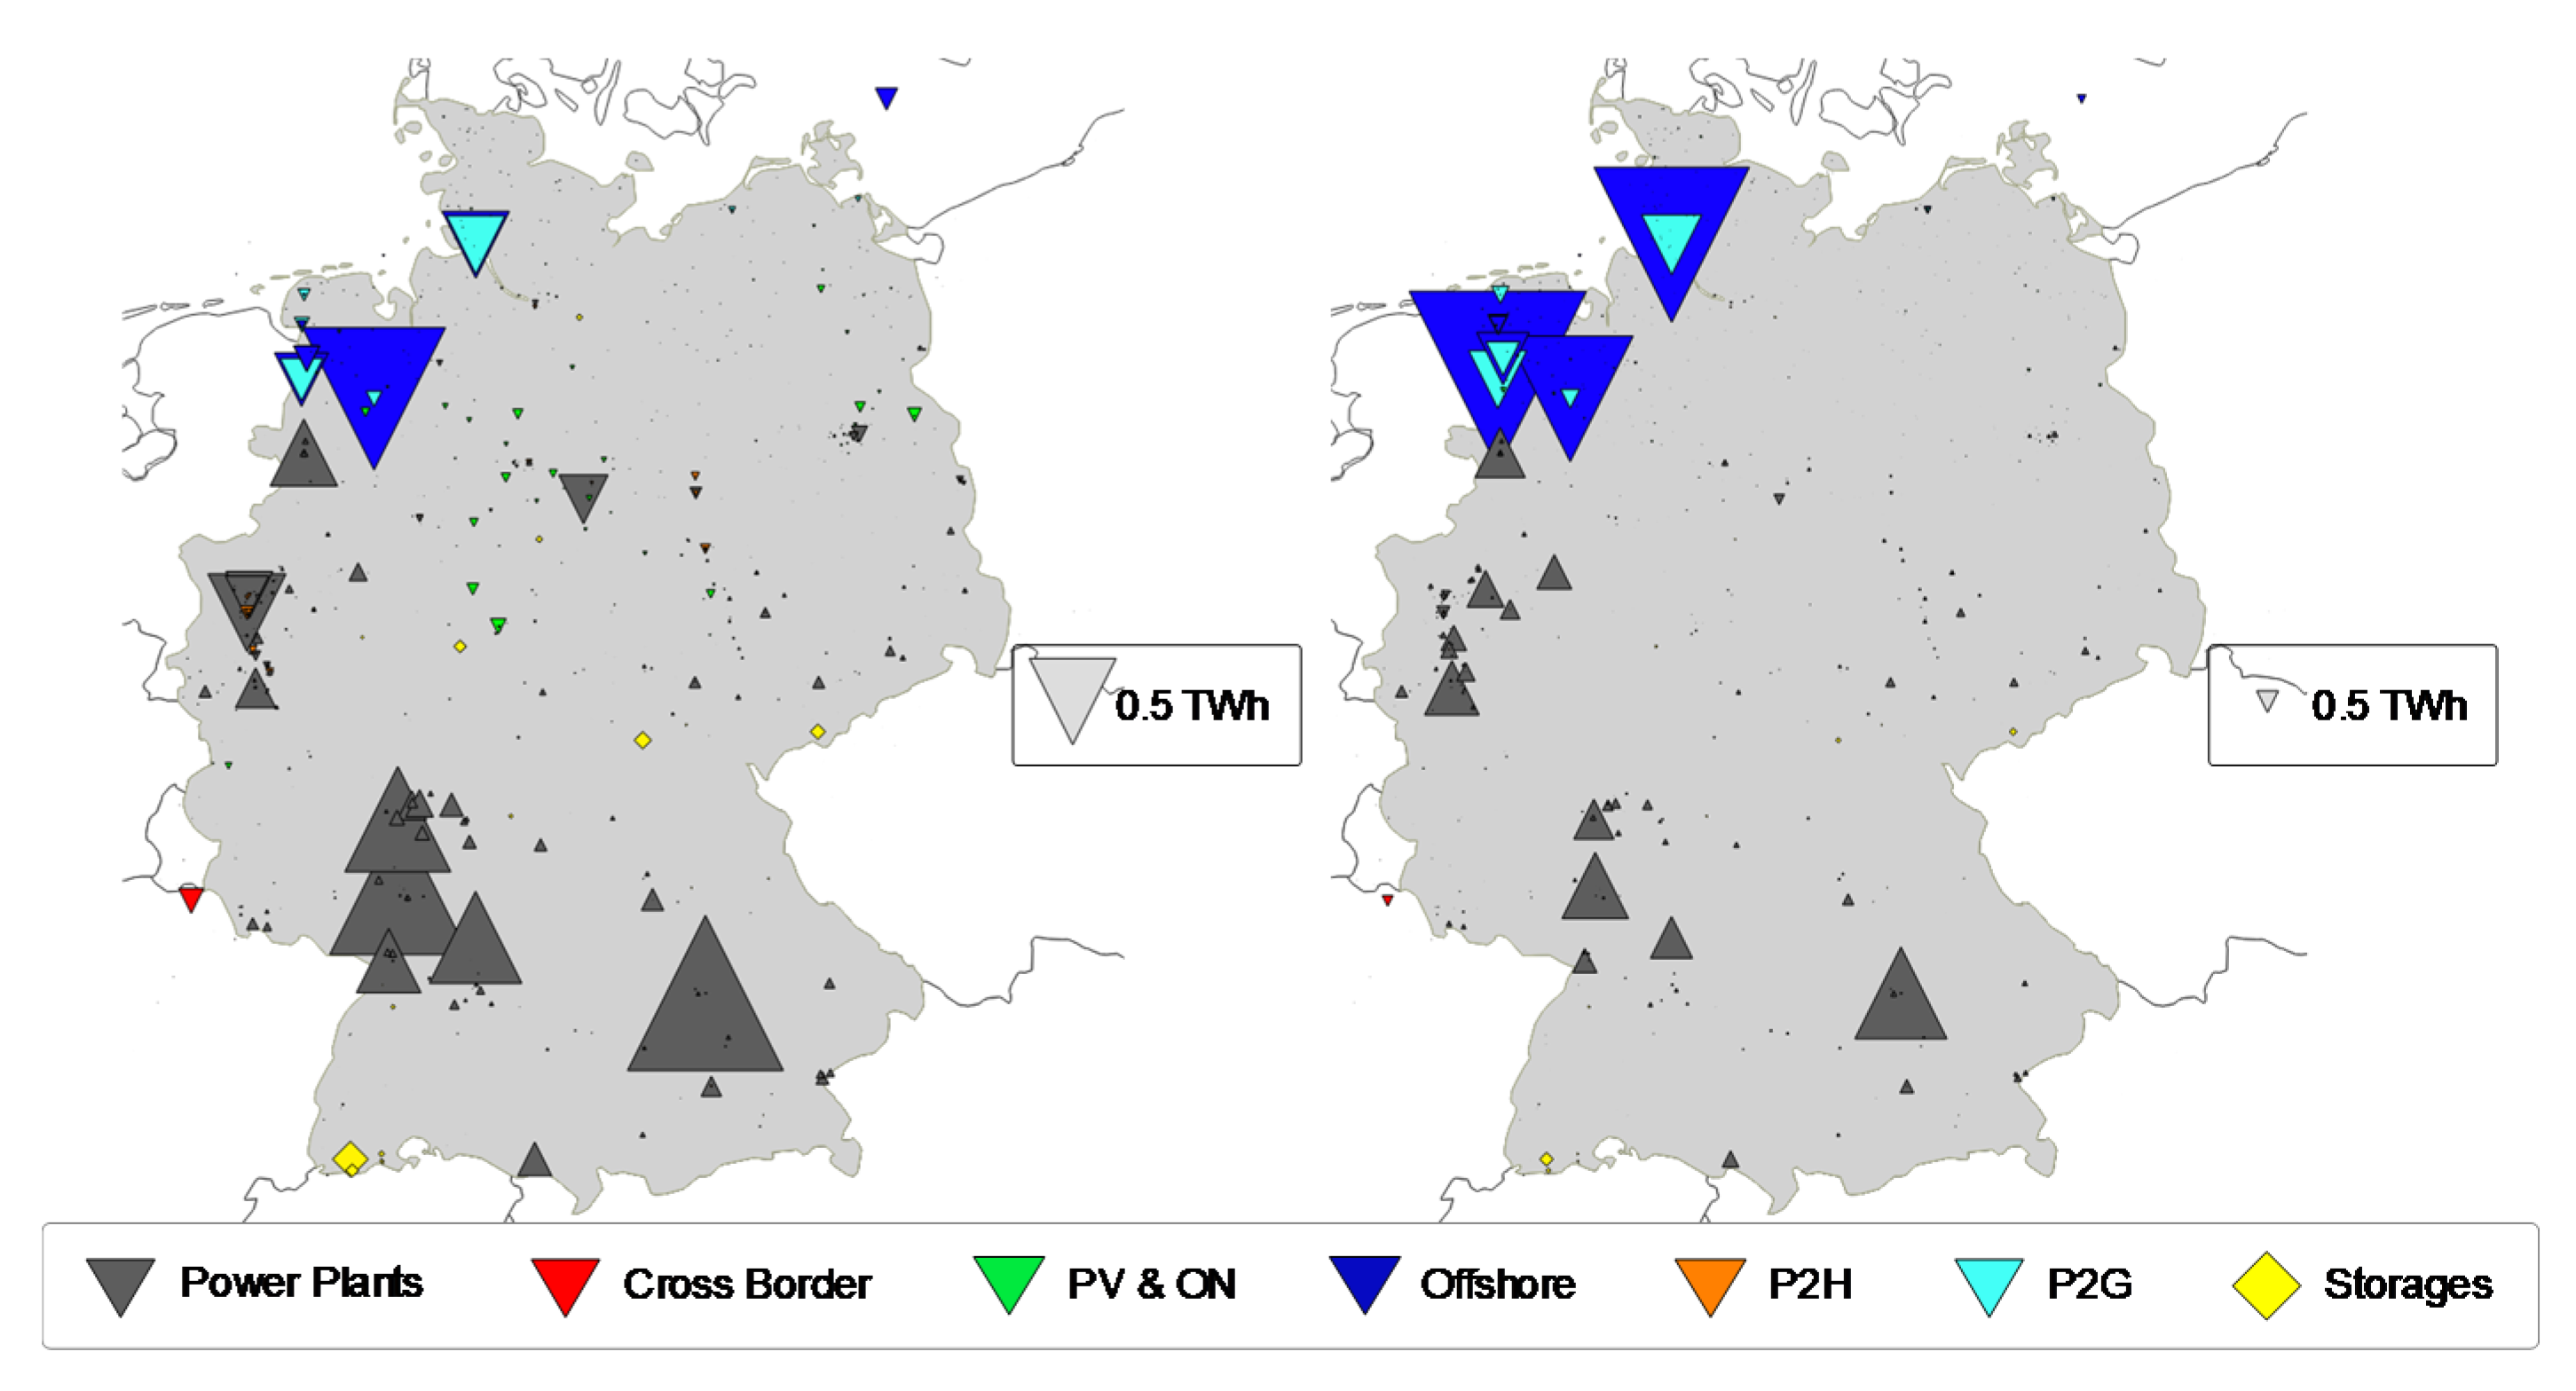
3.2.1. Sensitivity Onshore–Offshore Shift
3.2.2. Sensitivity NoSuedOstLink
3.2.3. Sensitivity GridFlex
- Increased congestion management volumes in scenarios 2023 and “NoSuedOstLink” compared to scenario 2023+ and scenario 2035 suggest the importance of a fast implementation of the planned grid expansion measures.
- A shift from onshore to offshore wind installations is possible but entails substantial renewable curtailments due to grid congestions.
- Admitting curative operation strategies helps to substantially reduce congestion management volumes (within the modeled scenario by 26% to 52%).
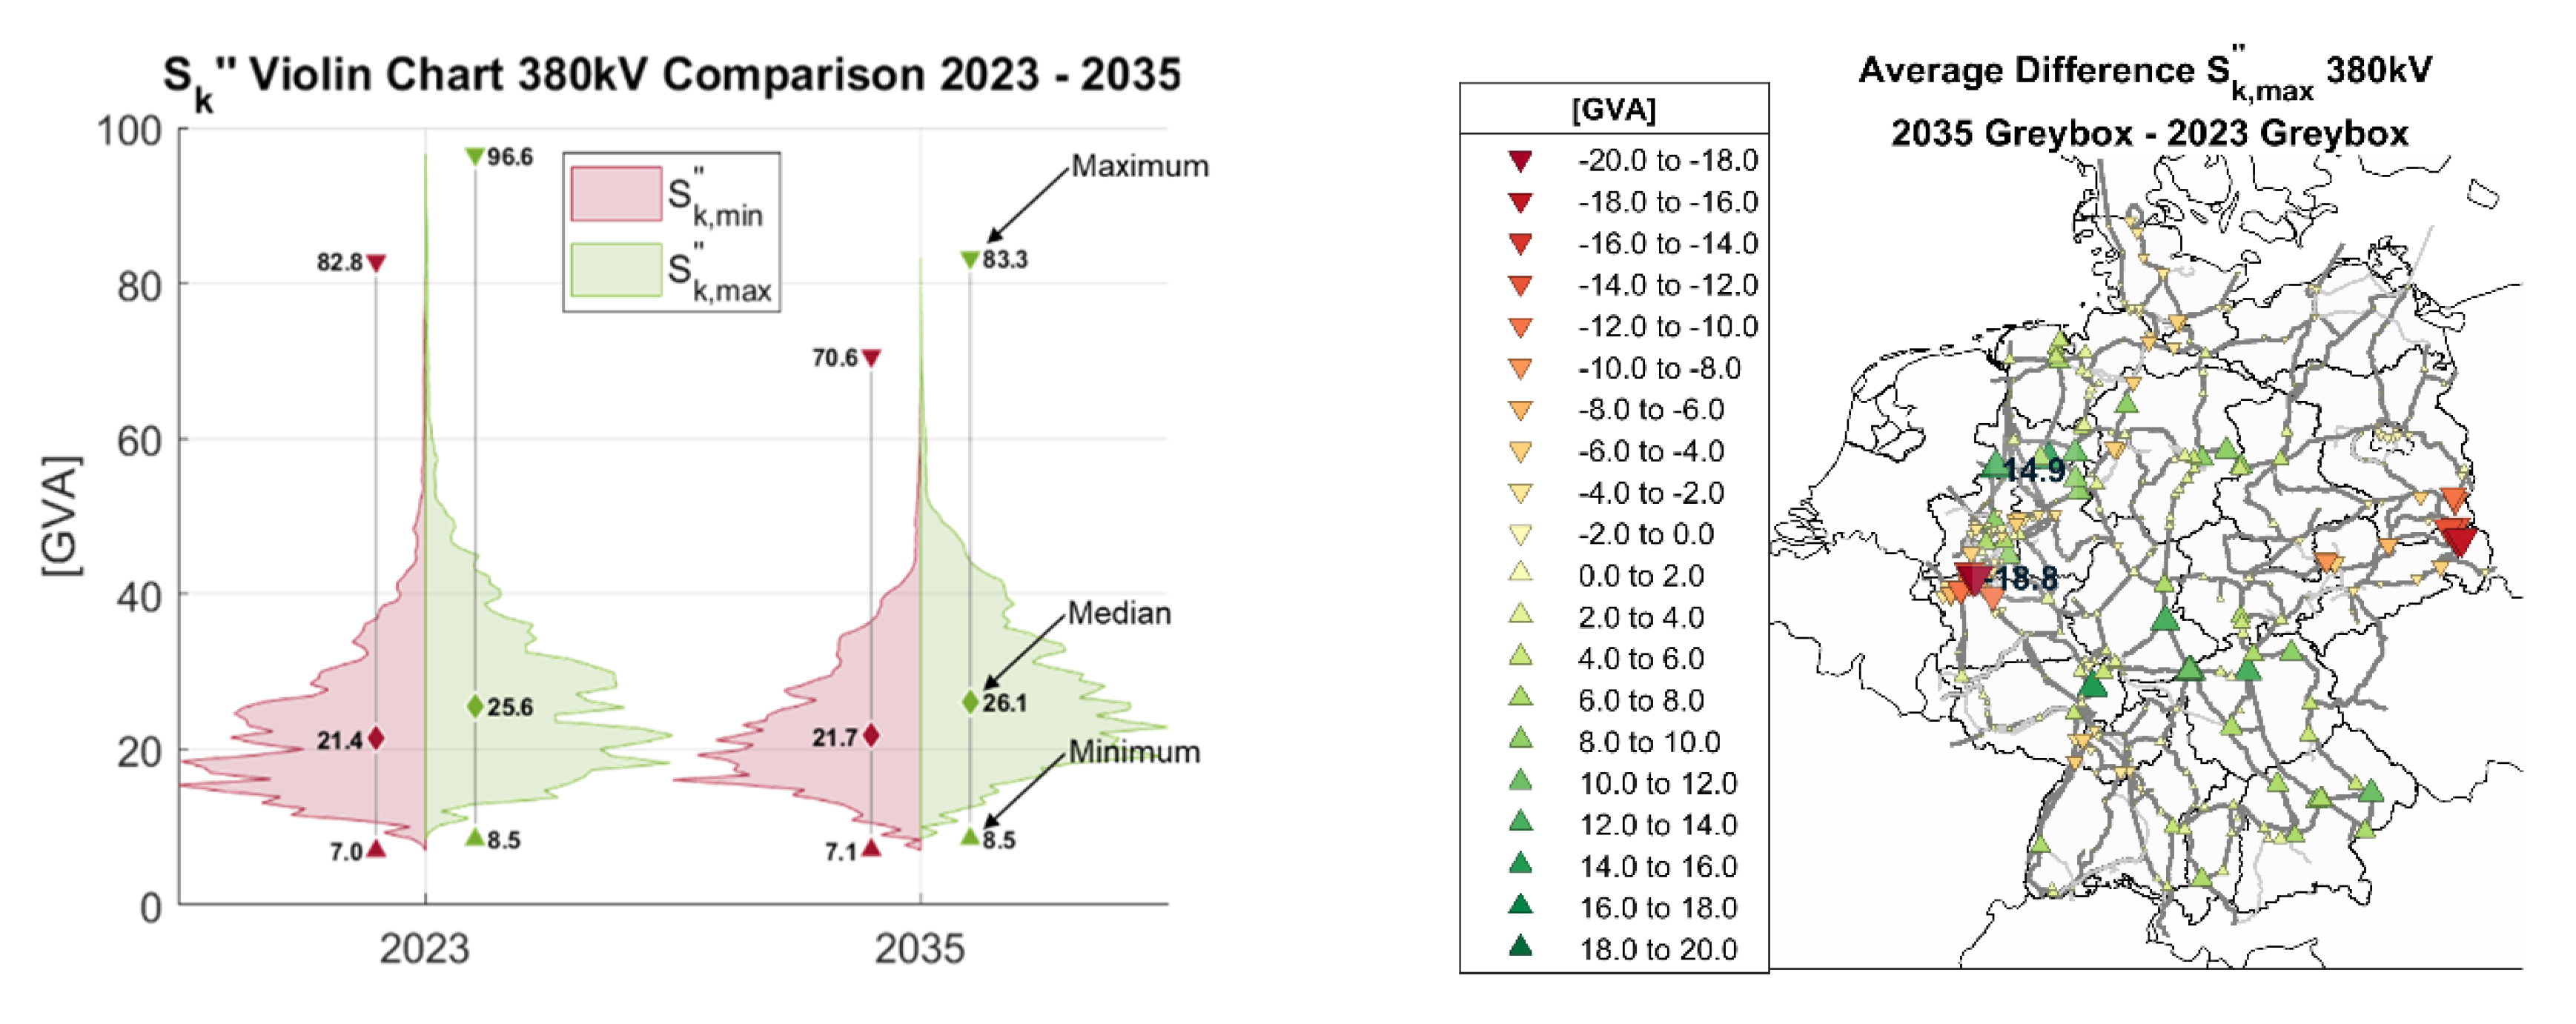
3.3. System Stability
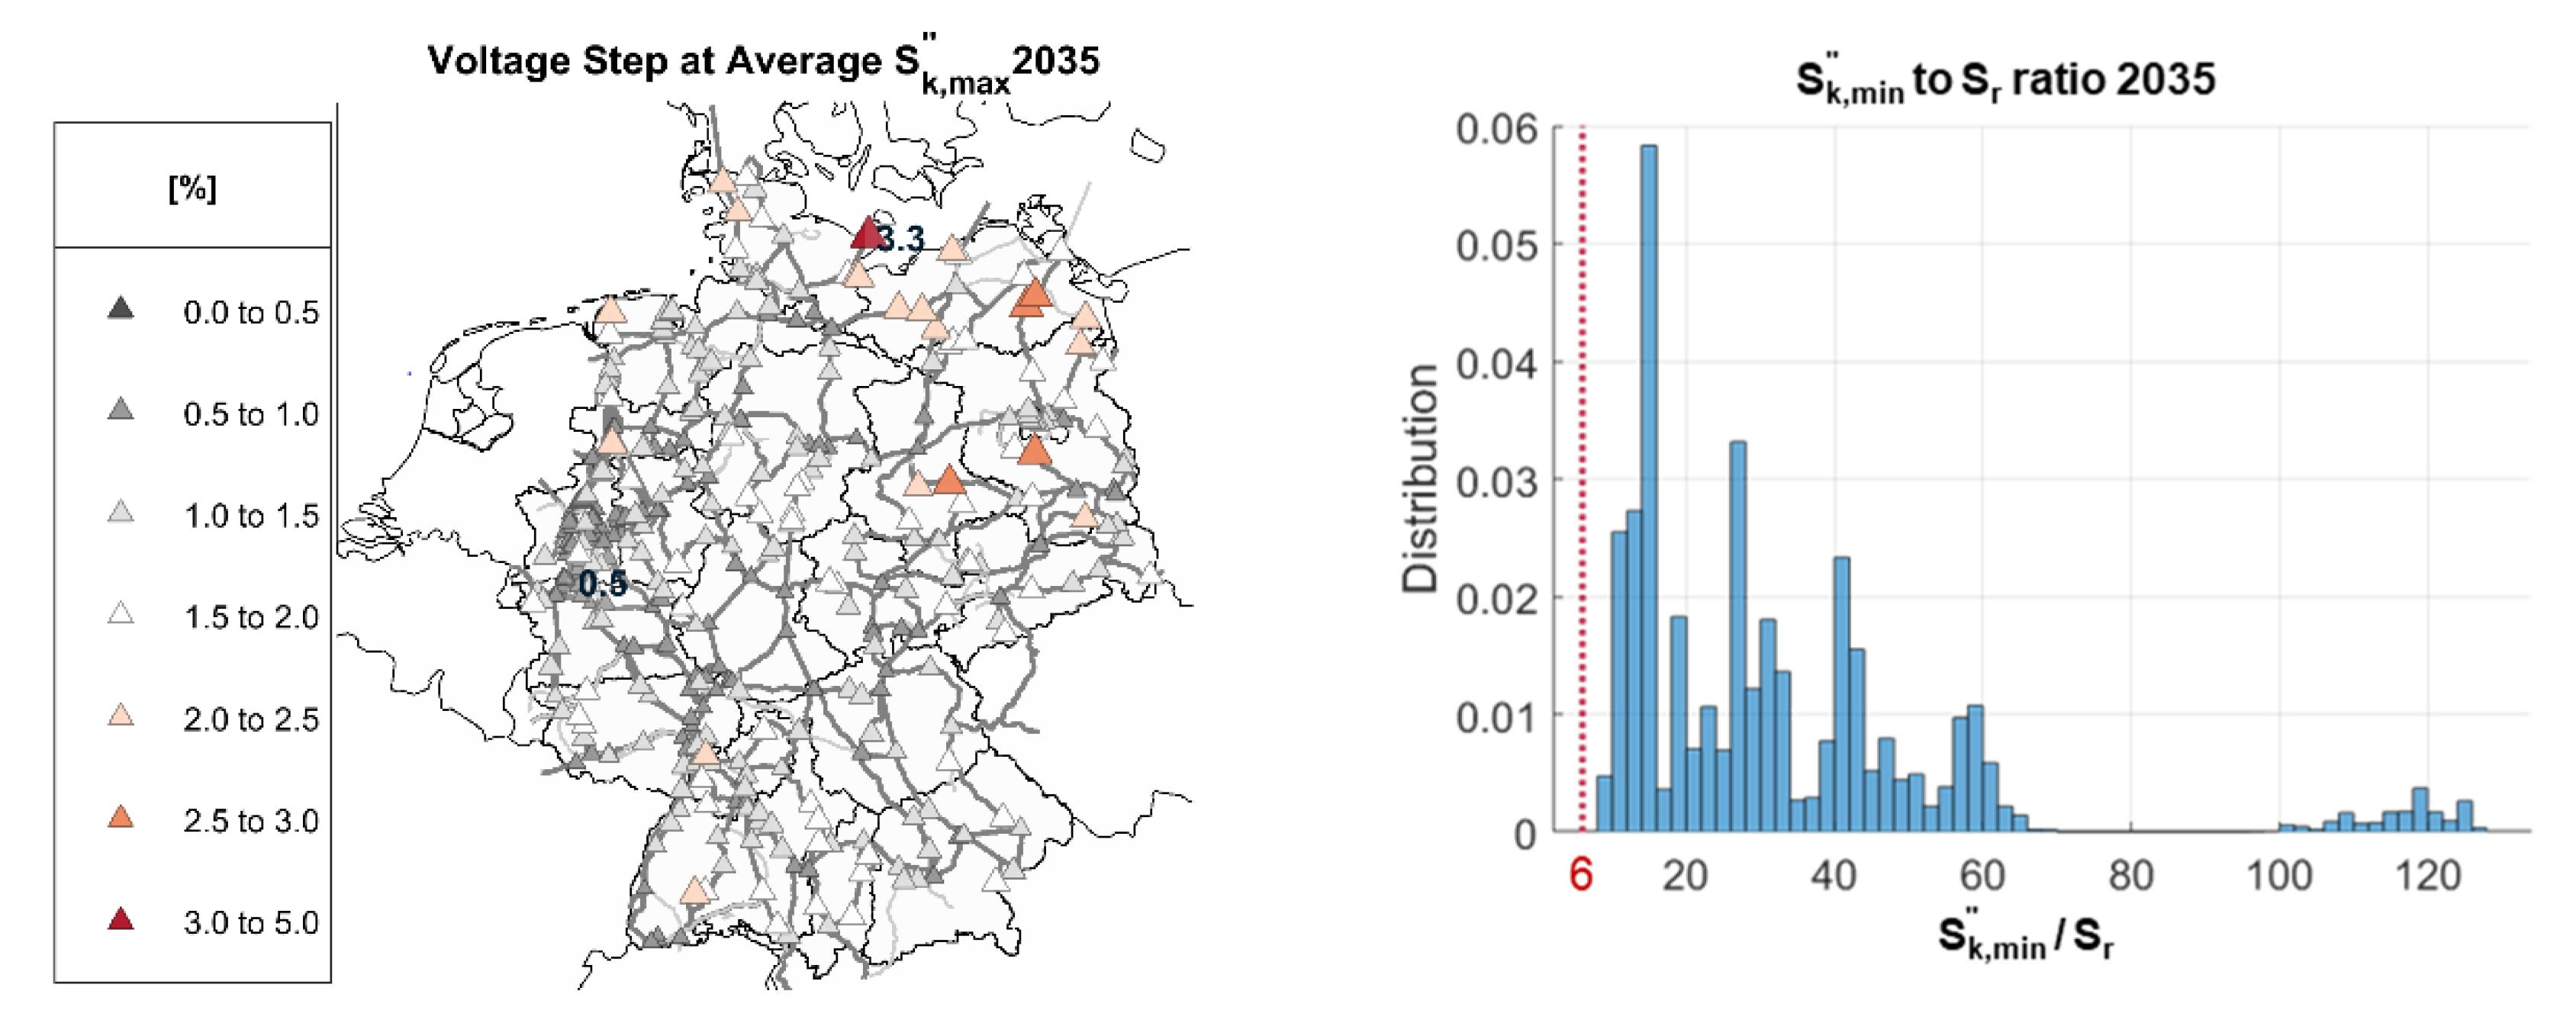
3.3.1. Short-Circuit Analysis
- The shutdown of lignite power plants reduces the short-circuit power in the western and eastern German lignite regions (Rhineland and Lausitz) by up to 18.8 GVA.
- The construction of HVDC connections increases the short-circuit power, particularly in northwest Germany, by up to 14.9 GVA.
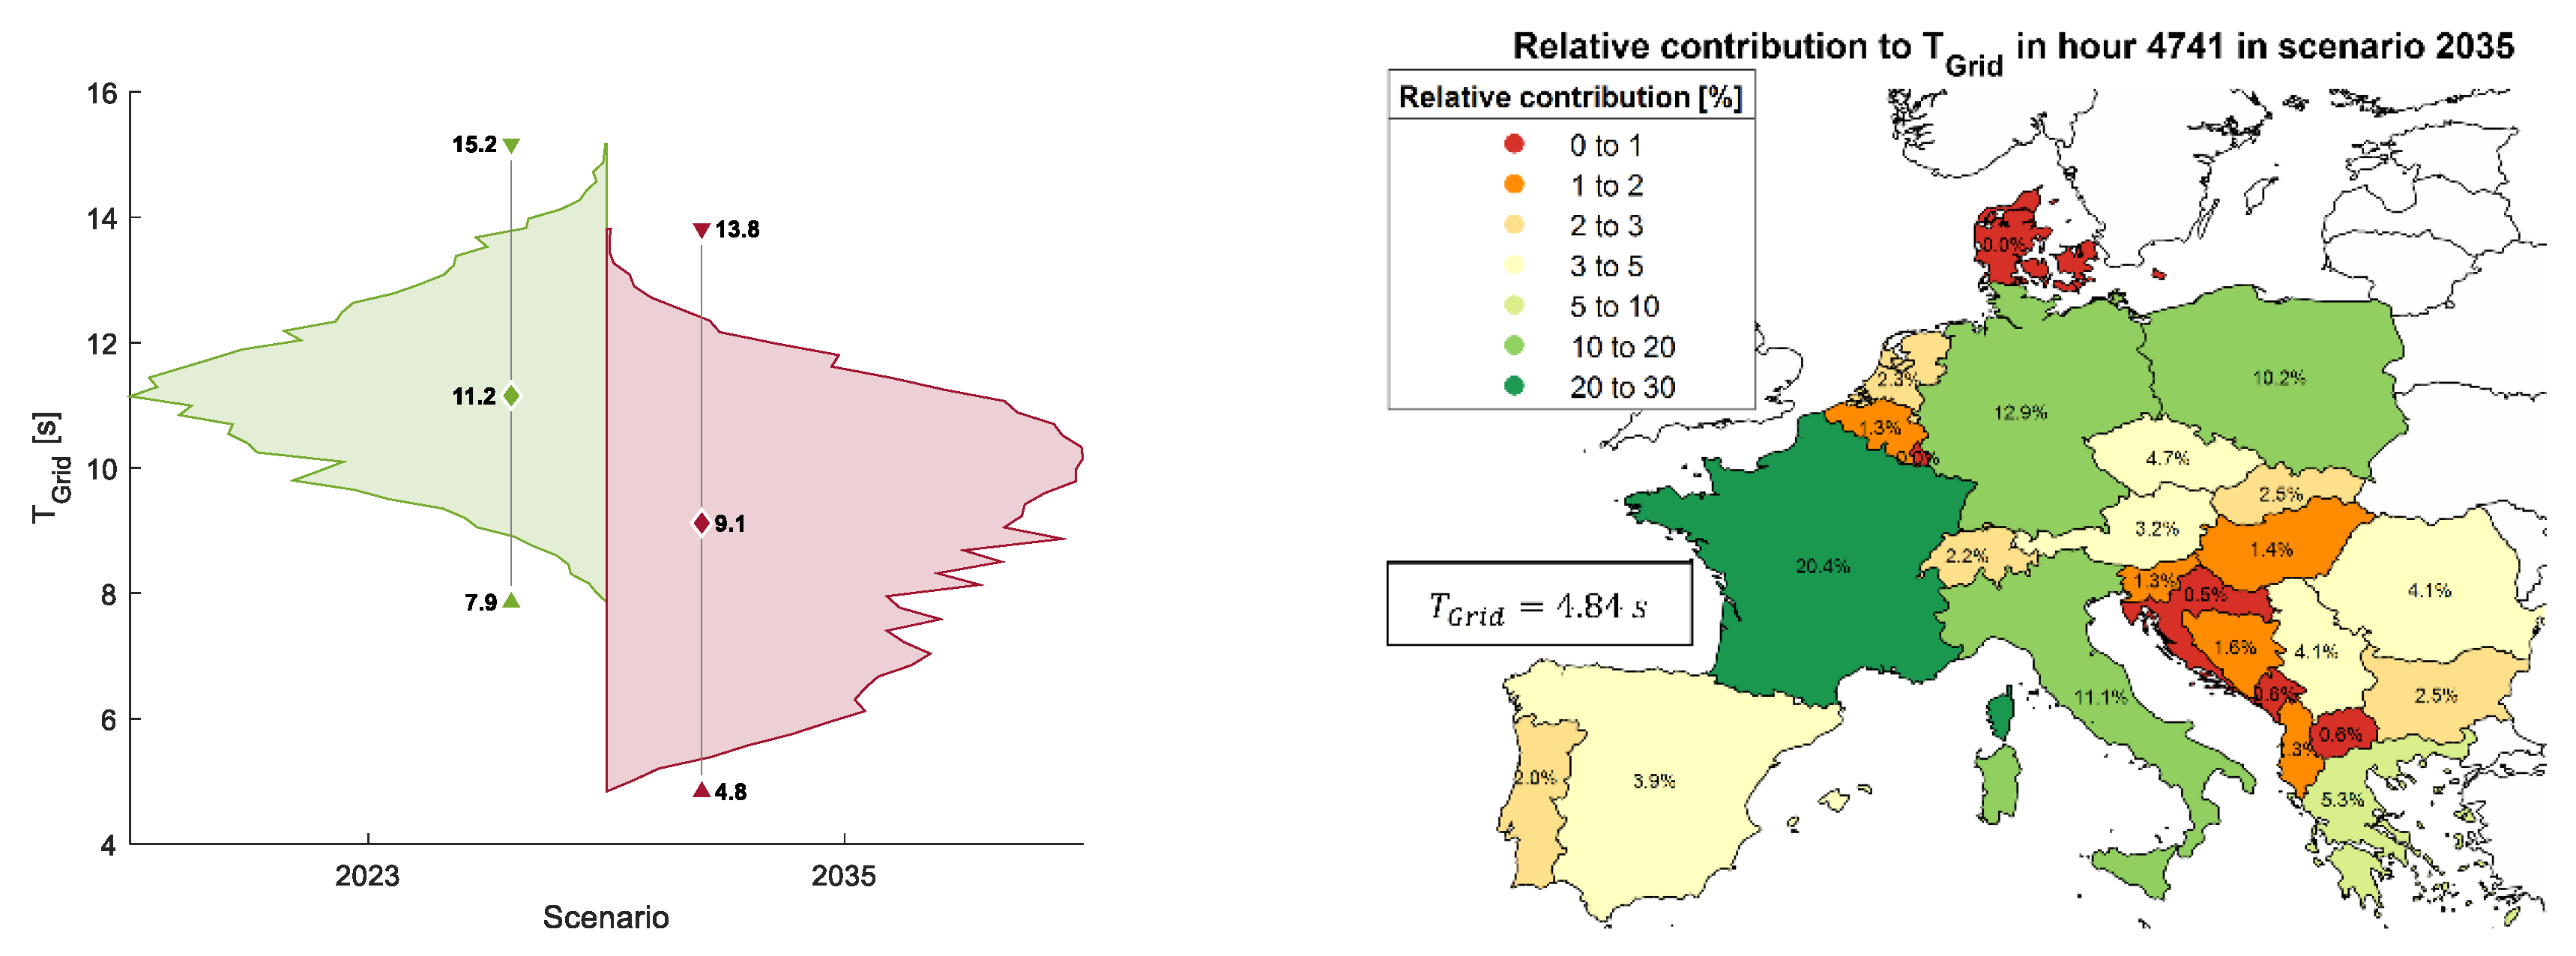
3.3.2. Inertia Analysis
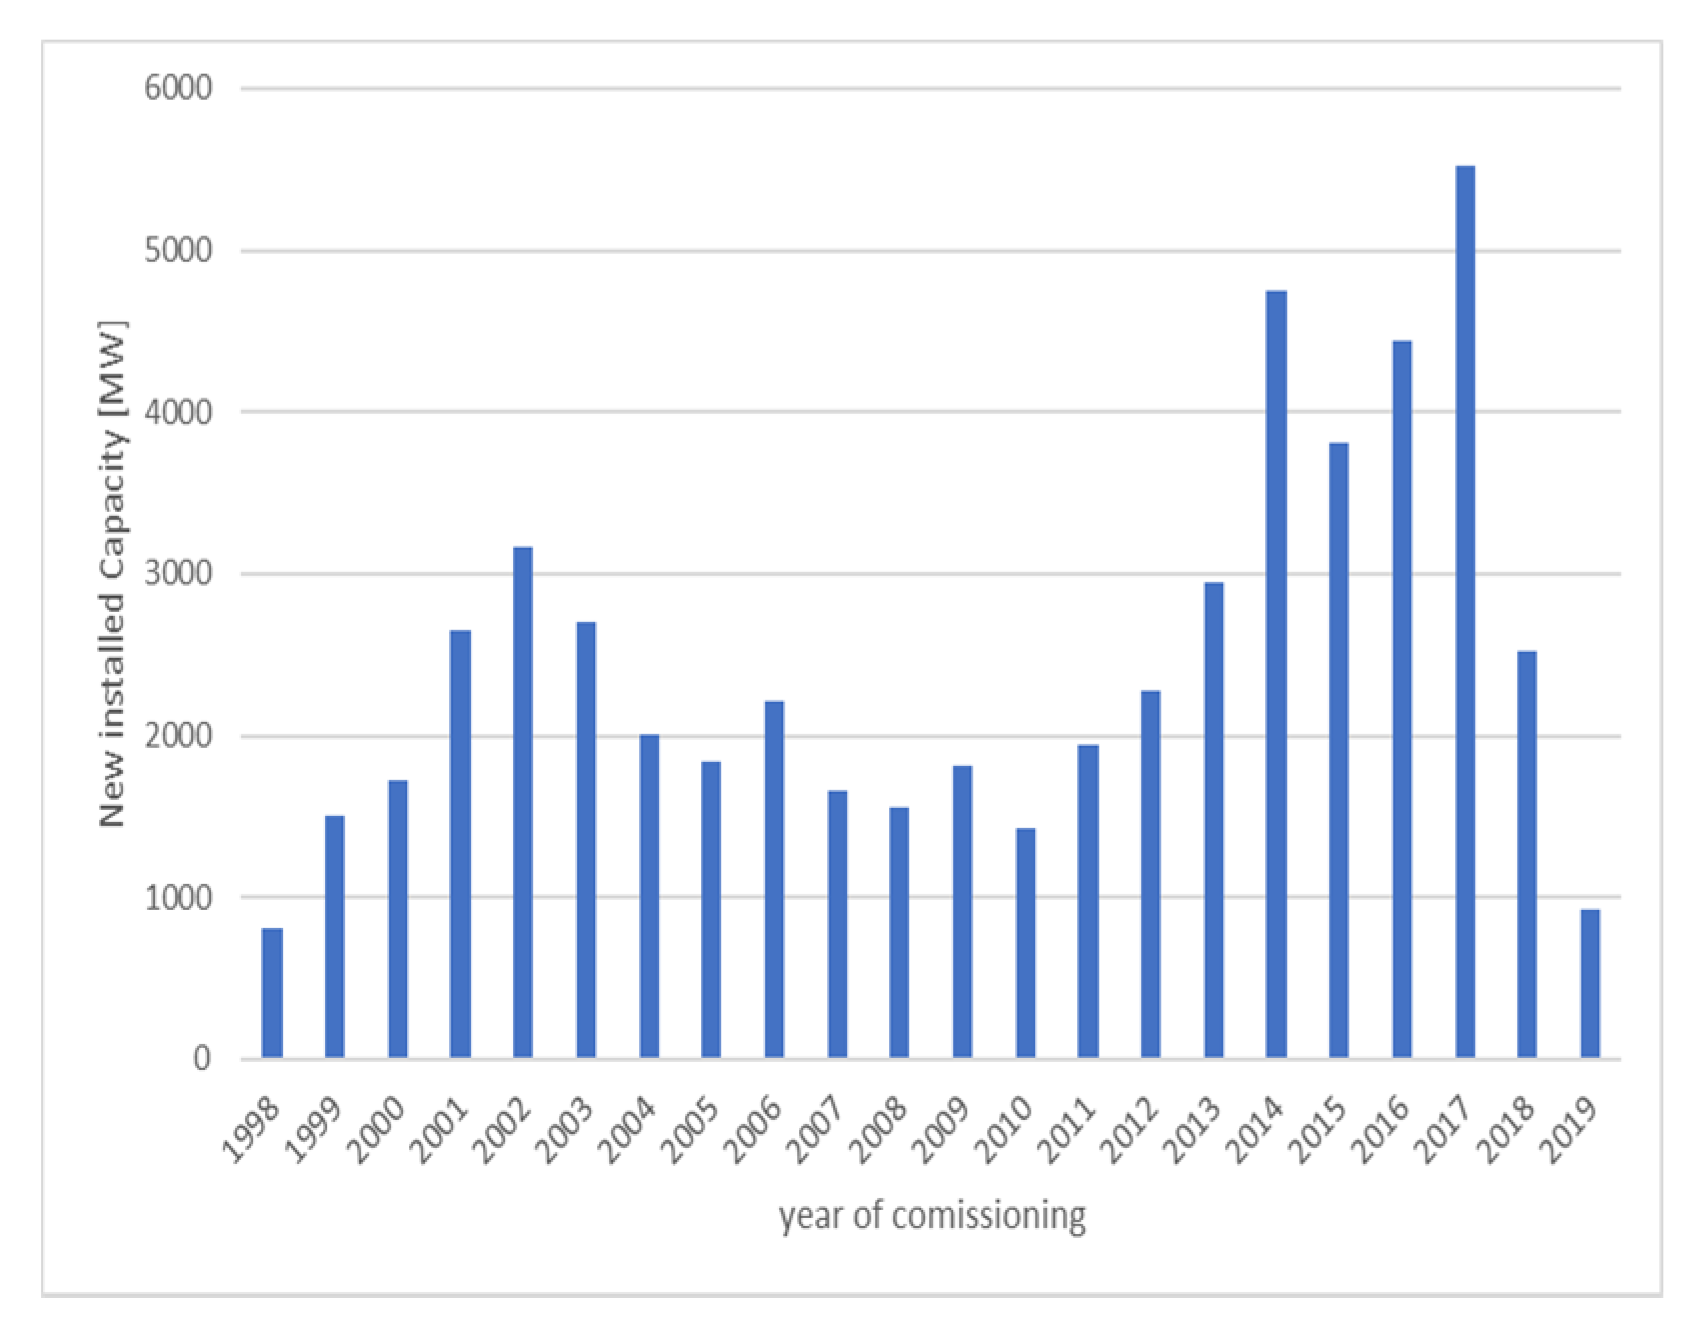
3.4. Renewable Extension in Germany
3.5. Defossilization of German Energy Sector
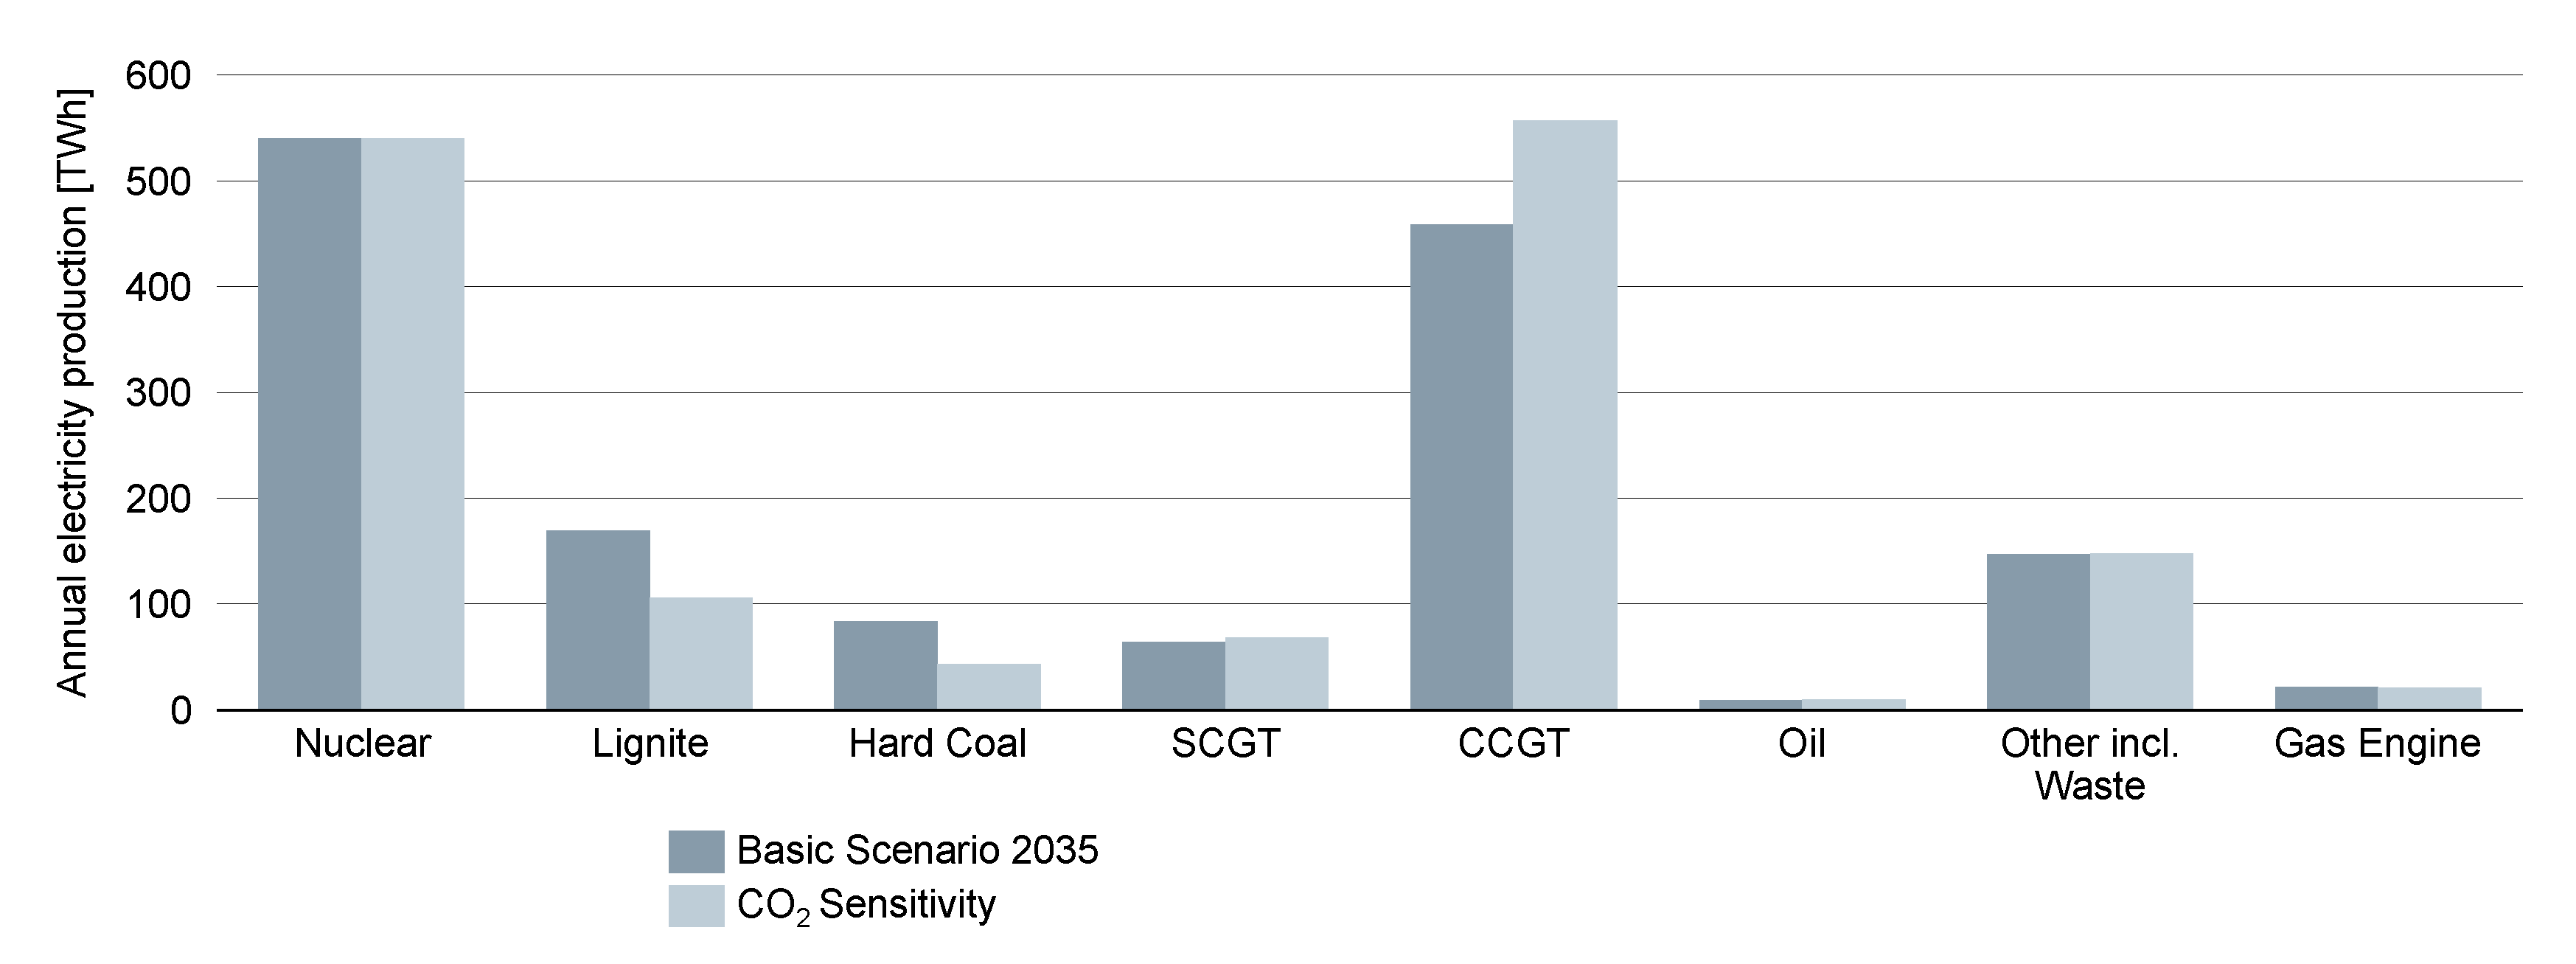
3.5.1. Impact of CO2 Pricing
3.5.2. Future Energy Region Lausitz in 2030
4. Summarizing Discussion of Results
5. Conclusions and Outlook
Author Contributions
Funding
Institutional Review Board Statement
Informed Consent Statement
Data Availability Statement
Conflicts of Interest
Abbreviations
| AC | Alternating current |
| BMWi | Bundesministerium für Wirtschaft und Energy (German Federal Ministry) |
| CE | Continental Europe |
| CHP | Combined heat and power |
| CO2 price | Scenario with higher CO2 prices |
| CTS | Commercial, trade, and services |
| DC | Direct current |
| DENA | Deutsche Energieagentur (German Energy Agency) |
| EEG | German Renewable Energy Sources Act |
| EMMS | European multimodal market simulation |
| ENTSO-E | European Network of Transmission System Operators for Electricity |
| ESDP | Energy System Development Planner |
| EWI | Energiewirtschaftliches Institut (Institute of Energy Economics) |
| GIS | Geographic Information System |
| Grid 2023+ | Scenario with grid projects planned until end 2023 |
| GridFlex | Scenario with flexible grid operation |
| GVA | Gigavolt-ampere |
| GW | Gigawatt |
| HVDC | High-voltage direct current |
| InnoCHP | Scenario with innovative CHP approach |
| LODF | Line outage distribution factors |
| MAF | Midterm Adequacy Forecast |
| MILP | Mixed-integer linear programming |
| MVA | Megavolt-ampere |
| Mvar | Megavolt-ampere reactive |
| MWh | Megawatt-hour |
| NEP | Netzentwicklungsplan (German grid development plan) |
| NoSuedOstLink | Scenario with delayed HVDC link in Germany |
| NTC | Net transfer capacity |
| NUTS | Nomenclature of Territorial Units for Statistics |
| PATL | Permanently admissible transmission loading |
| PSDF | Phase shifting distribution factors |
| PST | Phase shifting transformer |
| PTDF | Power transfer distribution factors |
| PV | Photovoltaics |
| RoCoF | Rate of change in frequency |
| RWTH | Rheinisch-Westfälische Technische Hochschule (Technical University) |
| STATCOM | Static synchronous compensator |
| SuedOstLink | HVDC link from north to southeast Germany |
| TATL | Temporarily admissible transmission loading |
| TWh | Terawatt-hour |
| TYDNP | Ten-Year Network Development Plan |
References
- 50Hertz Transmission, Amprion, TenneT TSO, TransnetBW. Netzentwicklungsplan Strom 2030, Version 2019. In Zweiter Entwurf der Übertragungsnetzbetreiber; 2019; Available online: https://www.netzentwicklungsplan.de/ (accessed on 21 January 2021).
- Bundesministerium für Wirtschaft und Energie. Kommission Wachstum, Strukturwandel und Beschäftigung. In Abschlussbericht; 2019; Available online: https://www.netzentwicklungsplan.de/ (accessed on 21 January 2021).
- European Comission. National Energy and Climate Plans (NECPs). Available online: https://ec.europa.eu/energy/topics/energy-strategy/national-energy-climate-plans_en (accessed on 22 March 2019).
- Deutsche Energie-Agentur. Dena-Studie Systemsicherheit 2050. Available online: https://www.dena.de/fileadmin/dena/Publikationen/PDFs/2020/dena_Systemsicherheit_2050_LANG_WEB.pdf (accessed on 21 January 2021).
- Umweltbundesamt. Datenbank Kraftwerke in Deutschland. Available online: https://www.umweltbundesamt.de/dokument/datenbank-kraftwerke-in-deutschland (accessed on 22 March 2019).
- Oei, P.-Y.; Kendziorski, M.; Herpich, P.; Kemfert, C.; von Hirschhausen, C. Klimaschutz statt Kohleschmutz: Woran es beim Kohleausstieg Hakt und Was zu Tun Ist; Bund für Umwelt und Naturschutz Deutschland (BUND): Berlin, Germany, 2020. [Google Scholar]
- Bartholdsen, H.-K.; Eidens, A.; Löffler, K.; Seehaus, F.; Wejda, F.; Burandt, T.; Oei, P.-Y.; Kemfert, C.; Hirschhausen, C. Pathways for Germany’s Low-Carbon Energy Transformation towards 2050. Energies 2019, 12, 2988. [Google Scholar] [CrossRef]
- Kittel, M.; Goeke, L.; Kemfert, C.; Oei, P.-Y.; von Hirschhausen, C. Scenarios for Coal-Exit in Germany—A Model-Based Analysis and Implications in the European Context. Energies 2020, 13, 2041. [Google Scholar] [CrossRef]
- Matthes, C.; Hermann, H.; Loreck, C.; Mendelevitch, R.; Cook, V. Die deutsche Kohle-Verstromung bis 2030. In Eine modellgestützte Analyse der Empfehlungen der Kommission, Wachstum, Strukturwandel und Beschäftigung; Öko-Institut e.V.: Berlin, Germany, 2019. [Google Scholar]
- EWI. Auswirkungen einer Beendigung der Kohleverstromung bis 2038 auf den Strommarkt, CO2-Emissionen und ausgewählte Industrien. Eine Analyse des Abschlussberichtsder WSB-Kommission. In Auftrag des Ministeriums für Wirtschaft, Innovation, Digitalisierung und Energie des Landes Nordrhein-Westfalen—Endbericht, August 2019, Überarbeitete Fassung, Mai 2020; EWI: Köln, Germany, 2020. [Google Scholar]
- Keles, D.; Yilmaz, H.Ü. Decarbonisation through coal phase-out in Germany and Europe—Impact on Emissions, electricity prices and power production. Energy Policy 2020, 141, 111472. [Google Scholar] [CrossRef]
- Oei, P.-Y.; Lorenz, C.; Schmalz, S.; Brauers, H.; Herpich, P.; von Hirschhausen, C.; Kemfert, C.; Dröschel, B.; Hildebrand, J.; Horst, J.; et al. Klimaschutz und Kohleausstieg: Politische Strategien und Maßnahmen bis 2030 und darüber hinaus. In Abschlussbericht; Umweltbundesamt: Dessau-Roßlau, Germany, 2019. [Google Scholar]
- EWI; ef.Ruhr GmbH. Entwicklung der Momentanreserve und Abschätzung des Bedarfes an Fast Frequency Response im Europäischen Verbundsystem. Studie im Auftrag der Siemens AG; EWI: Köln, Germany, 2020. [Google Scholar]
- Hladik, D.; Fraunholz, C.; Kühnbach, M.; Manz, P.; Kunze, R. Insights on Germany’s Future Congestion Management from a Multi-Model Approach. Energies 2020, 13, 4176. [Google Scholar] [CrossRef]
- Bundesnetzagentur. Kraftwerksliste. Available online: https://www.bundesnetzagentur.de/DE/Sachgebiete/ElektrizitaetundGas/Unternehmen_Institutionen/Versorgungssicherheit/Erzeugungskapazitaeten/Kraftwerksliste/kraftwerksliste-node.htm (accessed on 22 March 2019).
- Bundesministerium für Wirtschaft und Energie (BMWi). Kommission Wachstum, Strukturwandel und Beschäftigung—Abschlussbericht; Bundesministerium für Wirtschaft und Energie: Berlin, Germany, 2019. [Google Scholar]
- EWI; GWS; Prognos. Entwicklung der Energiemärkte—Energiereferenzprognose; Bundesministeriums für Wirtschaft und Technologie: Berlin, Germany, 2014. [Google Scholar]
- ENTSO-E. Mid-Term Adequacy Forecast 2018; ENTSO-E: Brussels, Belgium, 2018. [Google Scholar]
- ENTSO-E. Ten Year Network Development Plan (TYNDP) 2018; ENTSO-E: Brussels, Belgium, 2018. [Google Scholar]
- France Government. Programmations Pluriannuelles de L’énergie; France Government: Paris, France, 2019.
- ENTSO-E. Transparency Platform. Available online: https://transparency.entsoe.eu/ (accessed on 22 March 2019).
- IHS Markit. IHS Long-Term Planning and Energy Scenarios—IHS Energy Rivalry; IHS Markit: London, UK, 2018. [Google Scholar]
- 50Hertz Transmission, Amprion, TenneT TSO, TransnetBW. Netzentwicklungsplan Strom 2012; Zweiter Entwurf der Übertragungsnetzbetreiber, 2012; Available online: https://www.netzentwicklungsplan.de/ (accessed on 21 January 2021).
- 50Hertz Transmission, Amprion, TenneT TSO, TransnetBW. Netzentwicklungsplan Strom 2013; Zweiter Entwurf der Übertragungsnetzbetreiber, 2013; Available online: https://www.netzentwicklungsplan.de/ (accessed on 21 January 2021).
- 50Hertz Transmission, Amprion, TenneT TSO, TransnetBW. Netzentwicklungsplan Strom 2014; Zweiter Entwurf der Übertragungsnetzbetreiber, 2014; Available online: https://www.netzentwicklungsplan.de/ (accessed on 21 January 2021).
- 50Hertz Transmission, Amprion, TenneT TSO, TransnetBW. Netzentwicklungsplan Strom 2025; Zweiter Entwurf der Übertragungsnetzbetreiber, 2015; Available online: https://www.netzentwicklungsplan.de/ (accessed on 21 January 2021).
- 50Hertz Transmission, Amprion, TenneT TSO, TransnetBW. Netzentwicklungsplan Strom 2030, 2017; Zweiter Entwurf der Übertragungsnetzbetreiber, 2017; Available online: https://www.netzentwicklungsplan.de/ (accessed on 21 January 2021).
- High-Level Commission on Carbon Prices. Report of the High-Level Commission on Carbon Prices. 2017. Available online: https://www.carbonpricingleadership.org/report-of-the-highlevel-commission-on-carbon-prices (accessed on 22 September 2020).
- Kollenda, K.; Hoffrichter, A.; Schneider, M.; Moser, A. Planungsorientierte Simulation kurativer Maßnahmen im Deutschen Übertragungsnetz. In 16. Symposium Energieinnovation; pp. 1–12. Available online: https://www.tugraz.at/fileadmin/user_upload/tugrazExternal/4778f047-2e50-4e9e-b72d-e5af373f95a4/files/lf/Session_D1/415_LF_Kollenda.pdf (accessed on 7 October 2020).
- Bizz Energy. Abstand von der Energiewende. Available online: https://bizz-energy.com/abstand_von_der_energiewende (accessed on 18 June 2020).
- Müller, C.; Hoffrichter, A.; Wyrwoll, L.; Schmitt, C.; Trageser, M.; Kulms, T.; Beulertz, D.; Metzger, M.; Duckheim, M.; Huber, M.; et al. Modeling framework for planning and operation of multi-modal energy systems in the case of Germany. Appl. Energy 2019, 250, 1132–1146. [Google Scholar] [CrossRef]
- Raths, S.; Koopmann, S.; Müller, C.; Meinerzhagen, A.K.; Falke, T.; Cramer, M.; Kulms, T.; Beulertz, D.; Barrios, H.; Schnettler, A.; et al. The Energy System Development Plan (ESDP). In ETG Congress; VDE: Bonn, Germany, 2015. [Google Scholar]
- Raths, S. Marktsimulationsverfahren für Einen Dezentral Geprägten Strommarkt. Ph.D. Thesis, RWTH Aachen University, Aachen, Germany, October 2019. [Google Scholar]
- Natemeyer, H. Modellierung der Betriebsführung elektrischer Übertragungsnetze für Netzplanungsprozesse. Ph.D. Thesis, RWTH Aachen University, Aachen, Germany, March 2017. [Google Scholar]
- Hoffrichter, A.; Kollenda, K.; Schneider, M.; Puffer, R. Simulation of Curative Congestion Management in Large-Scale Transmission Grids. In Proceedings of the 54th International Universities Power Engineering Conference (UPEC), Bucharest, Romania, 3–6 September 2019. [Google Scholar]
- Kundur, P.; Paserba, J.; Ajjarapu, V.; Andersson, G.; Bose, A.; Canizares, C.; Hatziargyriou, N.; Hill, D.; Stankovic, A.; Taylor, C.; et al. Definition and classification of power system stability IEEE/CIGRE joint task force on stability terms and definitions. IEEE Trans. Power Syst. 2004, 19, 1387–1401. [Google Scholar] [CrossRef]
- ENTSO-E. Frequency Stability Evaluation Criteria for the Synchronous Zone of Continental Europe: Requirements and Impacting Factors. RG-CE SYSTEM Protection & Dynamics Sub Group. Available online: https://www.entsoe.eu/Documents/SOC%20documents/RGCE_SPD_frequency_stability_criteria_v10.pdf (accessed on 21 September 2020).
- ENTSO-E. Rate of Change of Frequency (RoCoF) Withstand Capability: ENTSO-E Guidance Document for National Implementation for Network Codes on Grid Connection. Available online: https://eepublicdownloads.azureedge.net/clean-documents/Network%20codes%20documents/NC%20RfG/IGD_RoCoF_withstand_capability_final.pdf (accessed on 21 September 2020).
- IEC. Part 0: Calculation of currents (60909-0:2016). In Short-Circuit Currents in Three-Phase a.c. Systems; IEC: Genève, Switzerland, 2016. [Google Scholar]
- 50Hertz Transmission GmbH; Amprion GmbH; Tennet TSO GmbH; TransnetBW GmbH. Grundsätze für Die Planung des Deutschen Übertragungsnetzes. Available online: https://www.amprion.net/Dokumente/Netzplanungsgrunds%C3%A4tze/2018.09.10_Update_%C3%9CNB-PlGrS_final_gesch%C3%BCtzt.pdf (accessed on 21 January 2021).
- Beer, M.; Huber, M.; Mauch, W. Flexible Operation of Cogeneration Plants—Chances for the Integration of Renewables. In Proceedings of the 11th IAEE Conference, Vilnius, Litauen; 2010. Available online: http://mediatum.ub.tum.de/doc/1210549/241380.pdf (accessed on 21 January 2021).
- Kryzia, D.; Kopacz, M.; Kryzia, K. The Valuation of the Operational Flexibility of the Energy Investment Project Based on a Gas-Fired Power Plant. Energies 2020, 13, 1567. [Google Scholar] [CrossRef]
- Klaus Stratmann. Energiewende—Lichtblicke für die Kohle-Reviere. Handelsblatt 2019, 25, 11. [Google Scholar]
- BMWi. Projektbericht, Erneuerbare Energien-Vorhaben in den Tagebauregionen. Available online: https://www.erneuerbare-energien.de/EE/Redaktion/DE/Downloads/Berichte/erneuerbare-energien-vorhaben-in-den-tagebauregionen.pdf?__blob=publicationFile&v=4 (accessed on 29 September 2020).
- Fraunhofer IEE. Windmonitor: Entwicklung der Onshore-Volllaststunden für Gesamtdeutschland. Available online: http://windmonitor.iee.fraunhofer.de/windmonitor_de/3_Onshore/5_betriebsergebnisse/1_volllaststunden/ (accessed on 29 September 2020).
- Brynolf, S.; Taljegard, M.; Grahn, M.; Hansson, J. Electrofuels for the transport sector: A review of production costs. Renew. Sustain. Energy Rev. 2018, 81, 1887–1905. [Google Scholar] [CrossRef]
- Tremel, A.; Wasserscheid, P.; Baldauf, M.; Hammer, T. Techno-economic analysis for the synthesis of liquid and gaseous fuels based on hydrogen production via electrolysis. Int. J. Hydrogen Energy 2015, 40, 11457–11464. [Google Scholar] [CrossRef]
- Fraunhofer ISE. Stromgestehungskosten für Erneuerbare Energien; Fraunhofer ISE: Freiburg im Breisgau, Germany, 2018. [Google Scholar]
- Joskow, P.L. Comparing the Costs of Intermittent and Dispatchable Electricity Generating Technologies. Am. Econ. Rev. 2011, 101, 238–241. [Google Scholar] [CrossRef]
- DLR. Langfristszenarien und Strategien für den Ausbau der Erneuerbaren Energien in Deutschland bei Berücksichtigung der Entwicklung in Europa und Global. Schlussbericht. 2012. Available online: https://www.dlr.de/dlr/Portaldata/1/Resources/bilder/portal/portal_2012_1/leitstudie2011_bf.pdf (accessed on 29 September 2020).
- Agora Energiewende. Die Ökostromlücke, ihre Effekte und Wie Sie Gestopft Werden Kann. Available online: https://www.agora-energiewende.de/presse/neuigkeiten-archiv/wie-die-oekostromluecke-gestopft-werden-kann/ (accessed on 21 January 2021).
- Bundesnetzagentur für Elektrizität, Gas, Telekommunikation, Post und Eisenbahnen. Quartalsbericht zu Netz- und Systemsicherheitsmaßnahmen Gesamtjahr und Viertes Quartal 2017. Available online: https://www.bundesnetzagentur.de/DE/Sachgebiete/ElektrizitaetundGas/Unternehmen_Institutionen/Versorgungssicherheit/Netz_Systemsicherheit/Netz_Systemsicherheit.html (accessed on 21 January 2021).
- Gasunie Deutschland and TenneT TSO GmbH. Phase 2—Pathways to 2050. Available online: https://www.tennet.eu/de/news/news/gasunie-und-tennet-klimapolitische-ziele-lassen-sich-nur-mit-einem-integrierten-europaeischen-energi/ (accessed on 21 January 2021).
- Kolster, T.; Krebs, R.; Niessen, S.; Duckheim, M. The contribution of distributed flexibility potentials to corrective transmission system operation for strongly renewable energy systems. Appl. Energy 2020, 279, 115870. [Google Scholar] [CrossRef]
- ENTSO-E. Statistical Fact Sheet 2018, Provisional Values as of 5 June 2019. Available online: https://docstore.entsoe.eu/Documents/Publications/Statistics/Factsheet/entsoe_sfs2018_web.pdf (accessed on 9 November 2020).
- IEA. Current Limits on Hydrogen Blending in Natural Gas Networks and Gas Demand per Capita in Selected Locations. Available online: https://www.iea.org/data-and-statistics/charts/current-limits-on-hydrogen-blending-in-natural-gas-networks-and-gas-demand-per-capita-in-selected-locations (accessed on 22 September 2020).
- Eickmann, J. Simulation der Engpassbehebung im Deutschen Übertragungsnetzbetrieb. Ph.D. Thesis, RWTH Aachen University, Aachen, Germany, September 2015. [Google Scholar]
- Charousset, S. Plan4res: Synergistic Approach of Multi-Energy Models for an European Optimal Energy System Management Tool. Available online: https://www.plan4res.eu/ (accessed on 13 December 2020).
- Beulertz, D.; Charousset, S.; Most, D.; Giannelos, S.; Yueksel-Erguen, I. Development of a Modular Framework for Future Energy System Analysis. In Proceedings of the 54th International Universities Power Engineering Conference (UPEC), Bucharest, Romania, 3–6 September 2019. [Google Scholar] [CrossRef]
- Most, D.; Giannelos, S.; Yueksel-Erguen, I.; Beulertz, D.; Haus, U.-U.; Charousset-Brignol, S.; Frangioni, A. A Novel Modular Optimization Framework for Modelling Investment and Operation of Energy Systems at European Level; ZIB-Report—20-08; Zuse Institute: Berlin, Germany, 2020. [Google Scholar]
- Beulertz, D.; Most, D.; Franken, M.; Oudjane, N.; van Ackooij, W.; Schweiger, J.; Konstantelos, I.; Djapic, P.; Pudjianto, D. Synergistic Approach of Multi-Energy Models for an European Optimal Energy System Management Tool: Deliverable D3.1: Description of model interconnections. Available online: https://www.plan4res.eu/wp-content/uploads/2019/02/D3.1-ModeslsInterconnections_Summary.pdf (accessed on 10 May 2020).


| Base Scenarios | |
|---|---|
| 2023 Base | 2035 Base |
| Based on NEP1, German coal phase-out, MAF2, TYNDP3, ENTSO-E4, national plans, IHS Markit | |
| Sensitivities | |
| InnoCHP: innovative CHP 5 approach as described in Section 2.2.5. Calculation of InnoCHP Capacity Built up | InnoCHP: innovative CHP approach as described in Section 2.2.5. Calculation of InnoCHP Capacity Built up |
| CO2 price: higher CO2 price (40 EUR/t instead of 20 EUR/t in base scenario) | CO2 price: higher CO2 price (100 EUR/t instead of 27 EUR/t in base scenario) |
| Grid 2023+: grid projects end 2023 including several transformers and project “Ultranet” | GridFlex: flexible grid operation (12 grid boosters, decentral flexibility, and curative operation) |
| Onshore–Offshore shift: expansion majorly in offshore wind (33 GW offshore/72 GW onshore instead of 23 GW/91 GW in base scenario) | |
| NoSuedOstLink: Delayed DC 6 link project “SuedOstLink” | |
Publisher’s Note: MDPI stays neutral with regard to jurisdictional claims in published maps and institutional affiliations. |
© 2021 by the authors. Licensee MDPI, Basel, Switzerland. This article is an open access article distributed under the terms and conditions of the Creative Commons Attribution (CC BY) license (http://creativecommons.org/licenses/by/4.0/).
Share and Cite
Metzger, M.; Duckheim, M.; Franken, M.; Heger, H.J.; Huber, M.; Knittel, M.; Kolster, T.; Kueppers, M.; Meier, C.; Most, D.; et al. Pathways toward a Decarbonized Future—Impact on Security of Supply and System Stability in a Sustainable German Energy System. Energies 2021, 14, 560. https://doi.org/10.3390/en14030560
Metzger M, Duckheim M, Franken M, Heger HJ, Huber M, Knittel M, Kolster T, Kueppers M, Meier C, Most D, et al. Pathways toward a Decarbonized Future—Impact on Security of Supply and System Stability in a Sustainable German Energy System. Energies. 2021; 14(3):560. https://doi.org/10.3390/en14030560
Chicago/Turabian StyleMetzger, Michael, Mathias Duckheim, Marco Franken, Hans Joerg Heger, Matthias Huber, Markus Knittel, Till Kolster, Martin Kueppers, Carola Meier, Dieter Most, and et al. 2021. "Pathways toward a Decarbonized Future—Impact on Security of Supply and System Stability in a Sustainable German Energy System" Energies 14, no. 3: 560. https://doi.org/10.3390/en14030560
APA StyleMetzger, M., Duckheim, M., Franken, M., Heger, H. J., Huber, M., Knittel, M., Kolster, T., Kueppers, M., Meier, C., Most, D., Paulus, S., Wyrwoll, L., Moser, A., & Niessen, S. (2021). Pathways toward a Decarbonized Future—Impact on Security of Supply and System Stability in a Sustainable German Energy System. Energies, 14(3), 560. https://doi.org/10.3390/en14030560