Article

Assessment of Cumulative Energy Needs for Chosen Technologies of Cattle Feeding in Barns with Conventional (CFS) and Automated Feeding Systems (AFS)

1
Institute of Wood Sciences and Furniture, Warsaw University of Life Sciences in Warsaw, 166 Nowoursynowska St., 02-787 Warsaw, Poland
2
Department of Rural Technical Infrastructure Systems, Institute of Technology and Life Sciences, Rakowiecka 32 Street, 02-532 Warsaw, Poland
3
Institute of Economics and Finance, Warsaw University of Life Sciences, Nowoursynowska Street 166, 02-787 Warsaw, Poland
4
Independent Researcher, 02-495 Warsaw, Poland
*
Author to whom correspondence should be addressed.
Energies 2021, 14(24), 8584; https://doi.org/10.3390/en14248584
Submission received: 16 October 2021 / Revised: 3 December 2021 / Accepted: 10 December 2021 / Published: 20 December 2021
(This article belongs to the Topic Exergy Analysis and Its Applications)

Abstract

:
The increasing popularity of automated systems and the increased market share of producers of robotic feeding equipment for cows causes the need for a deeper study of energy demand in such technologies. This article provides an analysis of the inputs of energy accumulated in conventional (CFS) and automated feeding systems (AFS) for cattle. The aim of this is to determine the impact of robotic technologies for the preparation and feeding of fodder on the cumulative energy inputs. The aim of this paper is to investigate the effect of machinery and the equipment applied to the cumulative energy intensity in cattle farming facilities. The cumulative energy consumption for four technologies of automated cattle feeding (AFS) was tested and compared to the energy consumption for six technologies with a conventional feeding system (CFS). The research involved nine cow barn facilities for dairy cows and one for beef cattle. An evaluation has been made for cattle farming structures (milk and meat production) with various mixing and feeding systems for feeds of various concentrations, and keeping system (tied system and free-stall). The cow barns differed in feed mixing, feeding machinery, and equipment. Measurements of live labor inputs and the consumption of electric and mechanical energy carriers were carried out, and the mass of various types of machines and devices with software was taken into account, which became the basis for calculating cumulative energy consumption for individual technologies. The obtained average of electric and mechanical energy inputs for robotic technologies of feeding fodder (AFS) was 0.60025 kWh∙day−1∙LU−1(where LU means Large Animal Unit 500 kg), and it was 39.3% lower than for conventional technologies (CFS) where it was 0.989052 kWh∙day−1∙LU−1. However, taking into account all components of cumulative energy consumption, the average for the group of robotic technologies (AFS) was higher by 35.18% than for conventional technologies (CFS).

1. Introduction

Dairy farms play an important role in shaping energy footprints at a global scale [1,2]. In 2019, EU-27 produced 158.2 million tons of raw milk and the average apparent milk yield per cow across the EU-27 was 7346 kg [3]. Polish farmers account for supplying 8% of the total EU milk production. Sustainable development should include all the branches of economy, including agriculture. The principles of sustainable development in agriculture cover the following elements to be addressed: social, economic, and welfare [4]. These factors share a common goal—to minimise negative environmental impacts [5,6]. The plant production sector can alleviate climate change when sustainable land-use methods are applied [7]. In plant production, precision farming guarantees a sustainable use of resources (Colaço et al., 2020). However, in animal production, adequate natural fertilizer management, through the use of the fertilizer for biogas and energy production, is one of the ways of ensuring sustainable production [8]. Increasing agricultural production in the European Union countries comes with the growing energy and fuel demands of agricultural machinery and tractors, which result in an increase in CO2 emissions [1,9,10]. According to Wójcicki [11], converted into energy units, the value of the final agricultural production in Poland was 900 m GJ of cumulative energy, or 435 m GJ when the energy value was considered. The cumulative material and energy inputs were estimated (together with labor) in Poland to be 1288 m GJ, including 550 m GJ for plant production and 738 m GJ for animal production [11]. Producing a high-quality milk, meat, or eggs, requires considerable mechanical and electrical energy inputs. In the structure of energy costs for animal production, the largest components are milking, milk cooling, feed preparation and feeding, so it is important to look for ways to reduce them.
The aim of this study is to develop cattle farming livestock facilities (milk and meat production) with various feed preparation and feeding systems with varied concentrations, and keeping systems (tied-up and free-stall). This paper presents the technological characteristics of the facilities and the machinery and equipment applied for feed mixing and feeding. The characteristics of the facilities (cow barns) were provided in terms of real labor, electrical, and mechanical energy inputs, as well as in terms of the technological and process parameters for the buildings and mechanization systems. The facilities demonstrated a high level of mechanization; the daily unitary labor inputs were below 2 min·day−1·LU−1 for mechanization level IV and below 1 min.·day−1·LU−1 for mechanization level V. The process and technical parameters provided the grounds for determining the cumulative energy inputs for feeding expressed in MJ⋅LU−1 as well as per 1 L of milk (in MJ⋅L−1). The statistical dependencies were calculated between the energy of machinery, human labor, diesel oil, and electrical energy consumed.
The automated feed mixing and feeding systems researched in this article are becoming more and more popular, next to milking robotization. Globally, according to estimates, in 2018, there were more than 1250 automated feeding systems (AFS) in operation [12,13].
Aiming for the most effective milk production is possible thanks to the application of the TMR, a system which is effective in terms of minimizing energy inputs, and which guarantees a high production potential [13,14].
The TMR (Total Mixed Ratio) also provides other benefits, e.g., a decrease in labor inputs and a decrease in milk production costs. A further decrease in production costs is guaranteed with feed mixing and feeding mechanization and automation. The application of sensors and computers equipped with dairy herd barn-management software facilitates a feeding system evolution towards implementing equipment which would be more reliable, animal-friendly, and which would decrease the farmer’s labor inputs. The feed mixing and feeding actions (currently performed by the farmer) upon the development of electronic equipment and entire computer-controlled lines, can be now replaced with fully-robotized equipment [4].
Depending on the level of complexity of the feeding line applied, in the feed selection, mixing and feeding in cattle, the action can be divided into three categories:
  • Mixing cattle feed ingredients in a stationary mixer, robot feeding and feed pushing to make it better accessible to animals;
  • Filling the loading devices with fodder, mixing, feeding the animals with a robot. The robot runs along a rail along the feed corridor and moves the forage towards the animals.
Feeding is performed with a TMR robot sliding on a rail along the feed passage. The robot collects the feed components from loading devices, and then it mixes them and feeds them to the feed passage.
III.
Transporting silage and loading the “feed kitchen”; filling the robot with feed, mixing in the robot, feeding with the robot, and feed pushing [13].
The third feeding automation level is the most advanced system in feed mixing and feeding; it includes a fully-automated cattle-feeding line, which starts from the collection of the silage from silos and then feeding to the feed passage. Silage is transported with the feeders directly from silos to the mixing-dosing robot.
Depending on the farm, robotic mixing and feeding is carried out using advanced drive systems. The greatest drive diversity is found in rail supplying systems. Rail-sliding robots can be power-supplied with electricity, or with battery-supplied electrical engines. Belt conveyers, on the other hand, are only supplied with electrical engines. Feed mixing and feeding equipment drives have both advantages and disadvantages. Table 1 provides the characteristics of different drive variants for rail-sliding robots.
The factors affecting the energy consumption during feed mixing and feeding are the feeding system and the feeding schedule and frequency [15,16]. Feeding frequency is closely related to the mixer wagon capacity. The recommended mixer wagon capacity depends on the cow stocking density and it ranges from 7 m3 for a stocking density of 74, to 20 m3 for a stocking density of 214 animals [17].
In 2010, Grothmann and Nydegger investigated 18 dairy farms with a herd size of 60–120 cows in Denmark, Germany, Holland, and Switzerland. Modeling of working hours showed that a farm with 60 LU and equipped with AFS had to allocate 50.6 min/day, and 120 animals—65.2 min/day. This includes the working time required to prepare the feed ration, daily filling of storage bins and daily cleaning of the feed alley. Providing the same herd with a fodder wagon with feed and feeding the feed three times a day would require 71.3 min/day for 60 LU and 202.8 min/day for 120 LU [18]. This means working time savings of 29.0% for the herd of 60 LU and 67.8% for the herd of 120 LU. The same authors in 2013 investigated three free-stall barns with stocking densities of 30, 50, and 80 LU which were equipped with an automated feed mixing and feeding line, including a stationary TMR feed mixer and a feeding robot. The study covered the investment costs, the period of use, and the operation time of the entirety of the feed mixing and feeding lines in the respective barns (Table 2). The feeding line use period was determined from the barn stocking density and the operation time, ranging from 10 to 17 years, whereas the daily line operation time depended on the animal stocking density, ranging from 33 to 88 min [19].
The current state of knowledge of comparative cattle feeding systems in robotized barns is still insufficient, which justifies the applicability of the topic covered in this article. There are no studies in the literature assessing the total energy consumption of robotic feeding systems, taking into account all the elements that make up the energy intensity. This article attempts to assess the energy consumption of highly robotized feed systems, taking into account not only direct energy consumption (electrical and mechanical), but also human labor inputs and the types of machines and devices used with software.

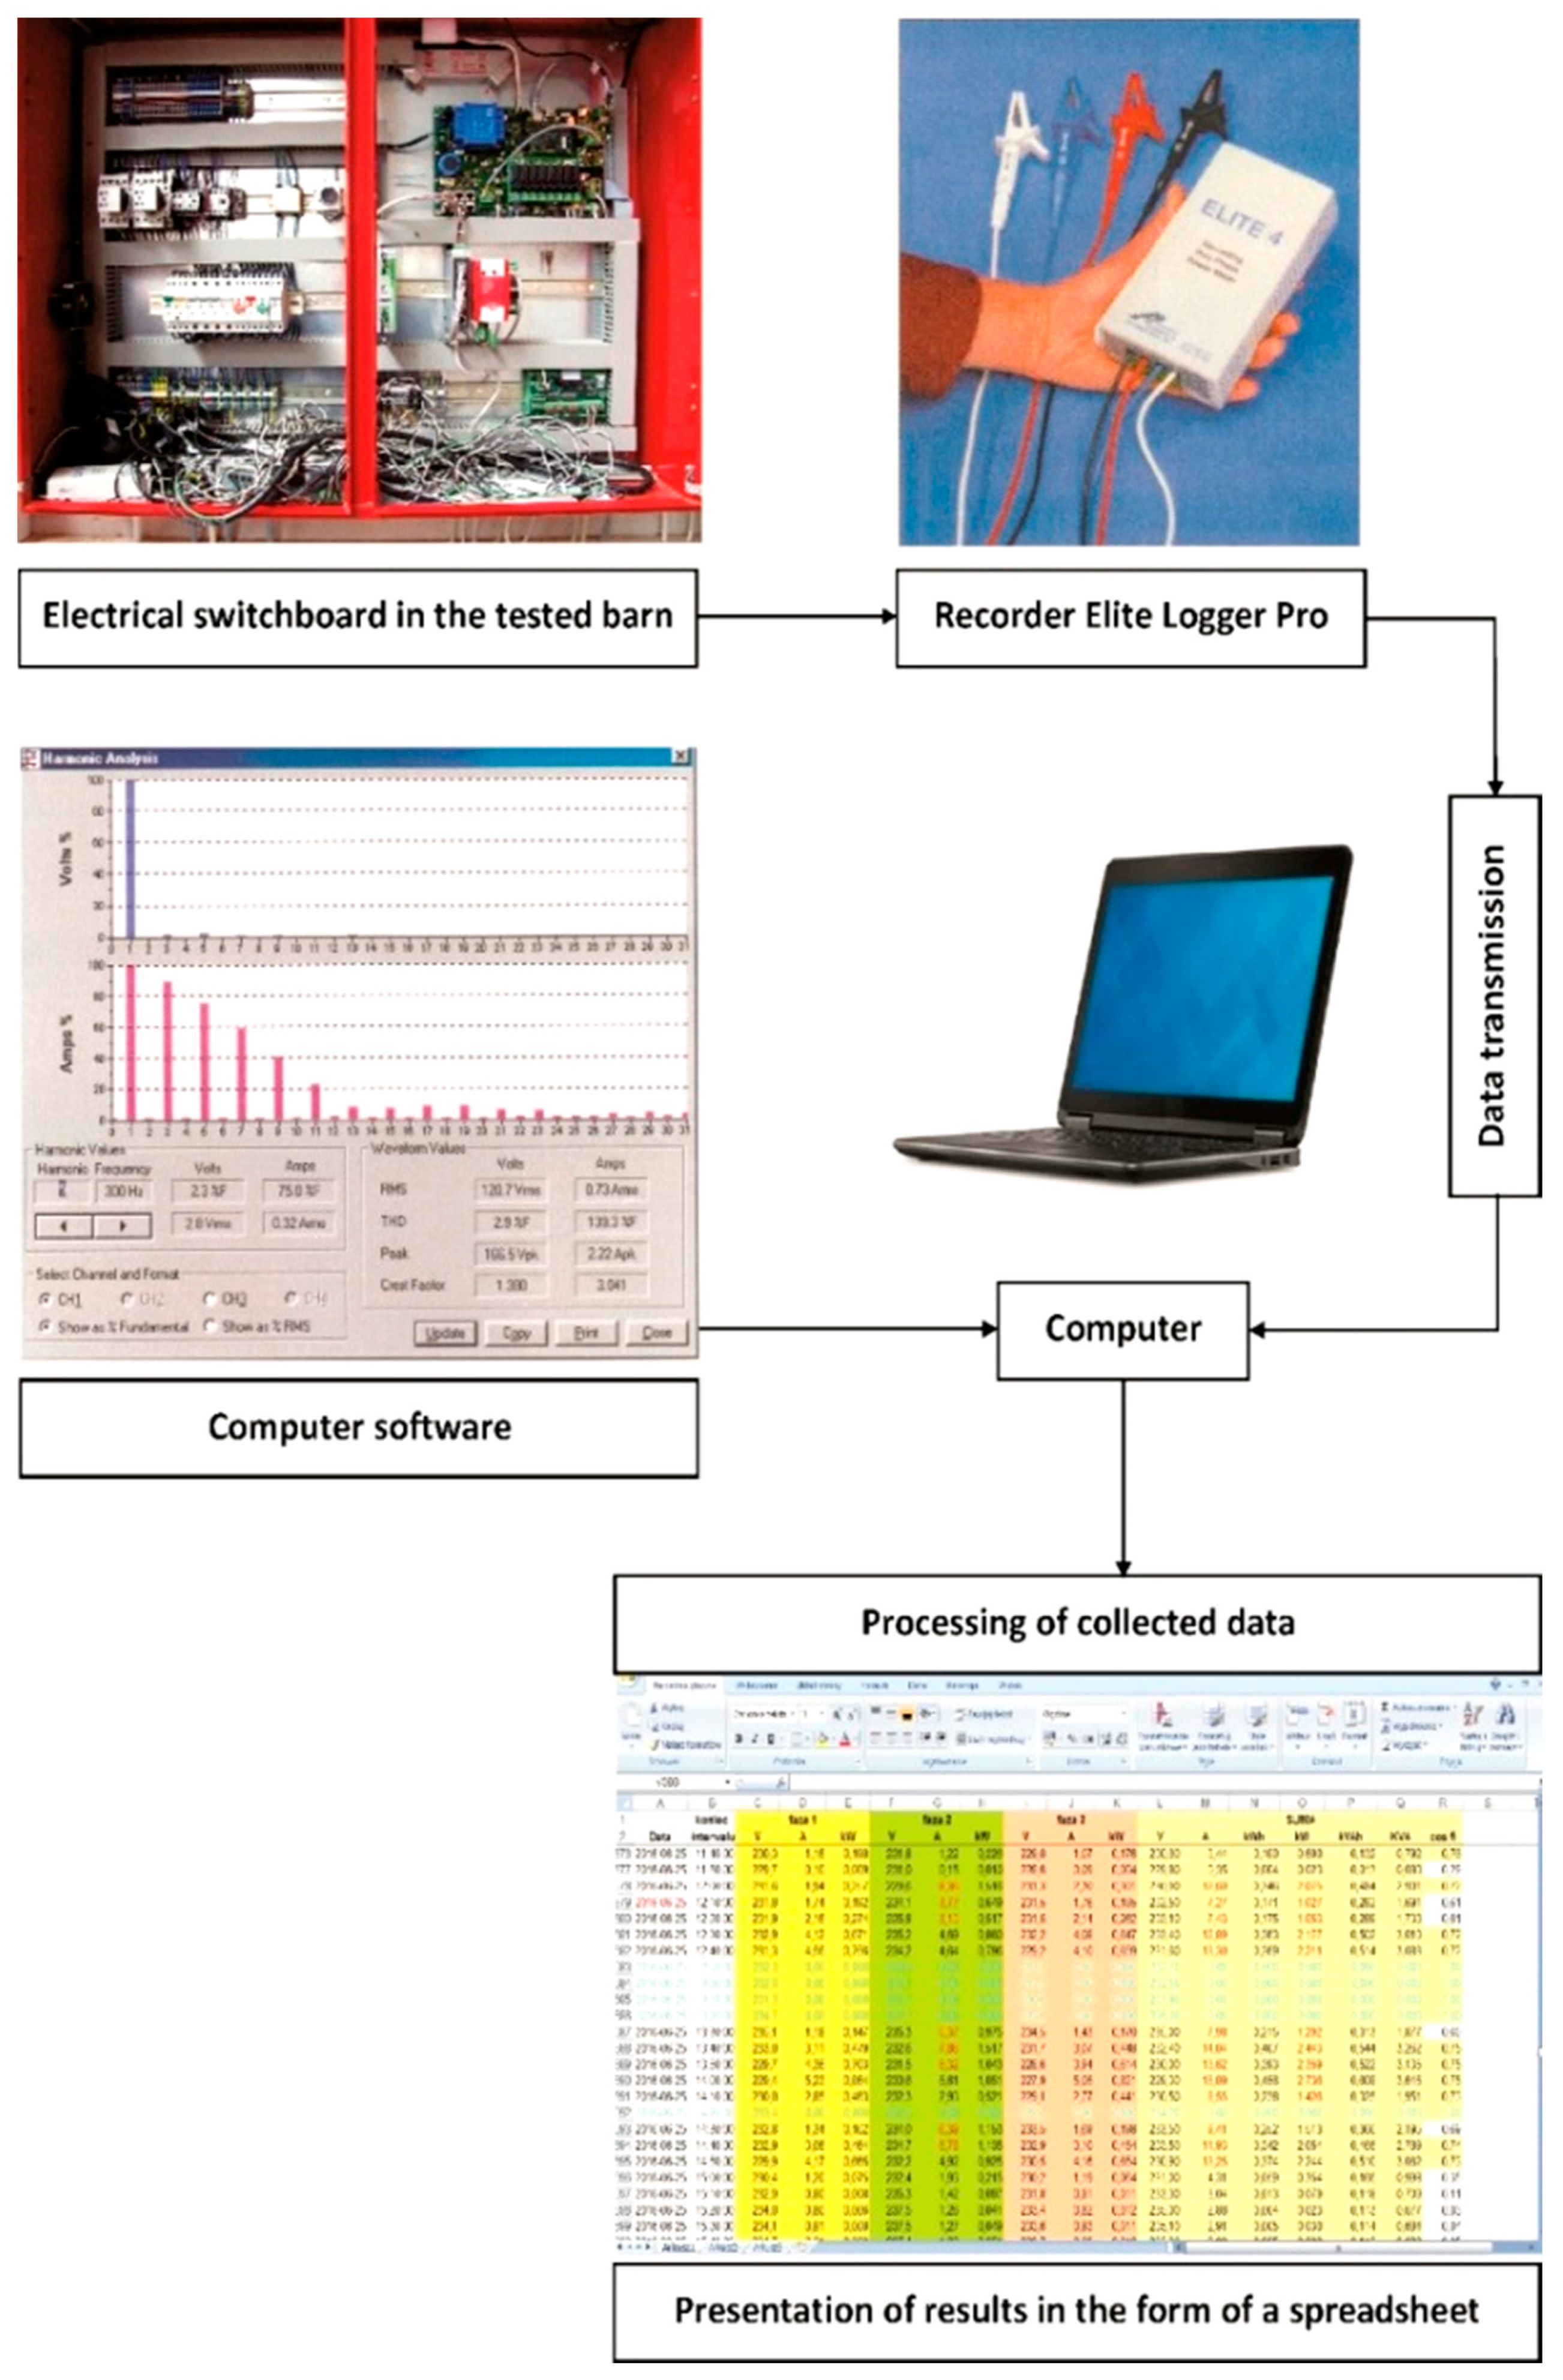
2. Materials and Methods

The study involved a selection of barns with a high level of feeding mechanization with stocking densities from 45 to 320 LU of cattle (HF) breed cows. Nine farms were involved in dairy farming, mostly Friesian-Holstein breed, while one farm was involved in meat cattle farming. The criteria applied for selecting the facilities included:
1. Self-propelled robot feed working cycle; 2. Level IV—daily labor inputs per 1 LU: 1–2 min; feeding with mechanical means of transport with a possibility of silage loading and unloading from bunker silos; 3. Level V—daily inputs per 1 LU: 0.5–1 min; animal feeding is fully mechanized.
Electrical energy consumption measurements for machinery and equipment were taken with a mobile 3-phase recorder; Elite Logger Pro was presented on the diagram in Figure 1.

Cumulative Energy Intensity Calculation

Cumulative energy intensities, more specifically material and energy inputs, were analyzed in four energy fluxes, such as: (1) in tractors, machinery, and means of transport; (2) in spare parts and materials used for repairs; (3) in a direct energy carrier (fuel and electrical energy); (4) in consumables and raw materials; as well as in human labor [9,10,20]. Energy intensities accumulated for the practices undergoing study have been calculated from the following formula:
ETech = ELab + EEF + EEq
where:
ETech—energy intensity of the technology under study, [MJ⋅LU−1⋅year−1];
ELab—total human labor energy intensity [MJ⋅LU−1⋅year−1];
EEF—total consumed fuel and electrical energy intensity [MJ⋅LU−1⋅year−1];
EEq—total machinery and equipment energy intensity [MJ⋅LU−1⋅year−1].
The results were statistically verified with the use of Statistica. The tables present some selected values of the coefficient of correlation and the figures—selected dependencies.
The costs of electrical energy C ee urz consumed by the machinery and equipment were calculated from the formula:
C ee urz = i = 1 n N ei   P kWh   [ PLN year 1 ]
where:
Nei—electrical energy inputs for feed mixing and feeding machinery and equipment [kWh⋅year−1];
PkWh—electrical energy unit price [PLN⋅kWh−1].
The coefficient values for calculating the cumulative energy are presented in Table 3 from the source literature. Table 3 was based on Romaniuk et al. [21].

3. Results

A description of the farms under study is provided in Table 4, whereas Table 5 breaks down the technical characteristics of the facility, including feeding practice. Table 6 provides a breakdown of the machinery and equipment, covering feed mixing and feeding technologies. The data provided in Table 5 and Table 6 were used to calculate the cumulative energy inputs for feeding, and the results have been broken down for feeding and provided in Table 7, with characteristic items, e.g., electrical and mechanical electrical energy inputs and labor inputs, i.e., machinery, equipment, and human working time, as well as cumulative energy intensity.
Table 8 presents cumulative energy intensity y4 for machinery and equipment involved in feeding practice broken down into actions: loading (y4a) and mixing, as well as feeding to the feed passage (y4b).
The dependence of electrical energy consumption on the 1 LU may show the economic approach of energy consumption in cattle breeding. According to the above, the statistical analysis [22] of the factors was supported by a post-hoc test (e.g., Duncan test), which allows for more advanced conclusions. To illustrate the occurring dependencies of the analyzed factors, the LU number was divided into three ranges (I, II, and III). In the first range (I) density values were below >100 LU, in the second (II) density values were between <100 and 200>, and the last range (III) contained LU numbers that were over <200. The obtained results were analyzed statistically. The significance level in the dependence test of the electrical energy consumption of the LU number was low and under 0.05 for the statistical empirical value: F(2, 27) = 34.679. Vertical bars represent 0.95 confidence intervals. The average values of the dependence of the electrical energy consumption on the LU number was presented in Figure 2.
The established significance level in impact measurements of the electrical energy consumption concerning the tested density level (LU range) was less than 0.05, therefore, as a rule, Duncan′s statistical test was performed to determine homogeneous groups. Homogeneous groups defining the belonging of particular groups of groups (I, II, and III) to electrical energy consumption. The results are presented in Table 9.
In addition, besides the correlation of electrical energy consumption on the LU number provided above, the dependence of the cumulative energy intensity was also statistically measured. In this case, the significance level in the dependence test of the cumulative energy intensity for various feed mixing and feeding technologies on the LU number was higher than previously for the statistical empirical value F(2, 7) = 0.08670. The average values of the dependence of cumulative energy intensity for various feed mixing and feeding technologies on the LU number were presented in Figure 3.
It was statistically found that in the tested range the cumulative energy intensity for various feed mixing and feeding technologies had no effect on the LU number. The significance level of p = 0.91792 was higher than the adopted significance level of 0.05. The homogeneous groups were not presented because they are in one group, as evidenced by the adopted significance level that was above the border level. The selected values of the coefficient of regression for the variables under study were presented in Table 10.

4. Discussion

The cumulative labor energy intensities in a group of barns with robotized feed mixing and feeding line (AFS) were 94% lower than in the group of barns with wagon-coupled-with-a-tractor feeding (CFS). Tangorra and Calcante reported on a considerable human labor input reduction. With robotization applied in cattle feeding, human labor is limited to filling silos with the concentrated feed and roughage, to loading equipment [12,23]. Our study notes over 5.59 times higher electricity consumption due to robotization compared to the traditional method of mechanization of feeding. Tangorra and Calcante also reported on lowered electrical energy inputs for the AFS, which resulted in a 33% decrease in daily production cost compared with the CFS; however, there were 40% higher initial investment costs (the daily cost was 33% lower than the TMR wagon-coupled-with-a-tractor feeding, despite the investment required to purchase the AFS, was more than 40% higher than that required for the CFS [12]).
In 2016, Mantoam reports that a heavier tractor requires 70.6% less energy per unit of power than a 3 times lighter tractor [24].
The application of cattle feeding robotization can lead to an increase in electrical energy consumption, while feeding with a mixing feed wagon is related to diesel oil consumption. A comparison of the present results with those reported by Oberschätzl, Haidn, Neiber, and Neser [15] in a group of robotized barns (technologies AFS1 to AFS4), shows the daily unitary mechanical energy inputs to be 87.7% lower compared with the mean value for the group of farms CF1 to CF6 of 0.9755 [kWh∙day−1∙LU−1]; an almost six-fold increase in electrical energy consumption for the group of AFS-equipped farms.
The daily electrical energy inputs in a group of automated technologies ranged from 0.9 to 7.56 kWh for the semi-automated system to 31.04 kWh for the fully-automated system (technology AFS4). Reports by Oberschätzl et al. 2015, on the other hand, for four dairy barns with the semi-automated and fully-automated feed mixing and feeding systems, demonstrated the daily electrical energy consumption on those farms to be 8.8 kWh with the semi-automated feeding system, and up to 52.6 kWh for the fully-automated system. It was found that the key diesel oil consumers are loaders for selecting and transporting feeds from bunker silos to mixers, while the key electrical energy consumers are the mixers that the feed is mixed in [15].
Automatic feeding systems have a number of advantages, including the social aspects related to the reduction of the workload of the operators; they also contribute to the reduction of greenhouse gas emissions through the reduced unit inputs of electrical and mechanical energy.
However, in some cases, especially for the third stage of robotization, we are dealing with higher energy consumption resulting from the need to use a large number of machines and devices with complex structures and considerable weight, which increase the power demand for propulsion, and thus have a negative impact on the environment. For such a high level of automation to remain cost effective, it can only be introduced into herds with a sufficiently high livestock density.
An example is the examined AFS4 technology, in which practically all the activities that make up the procedure of preparing and feeding the feed are robotic, with a high density of animals (320 LU). The energy intensity in this facility was lower than the highest of the results obtained for the conventional CFS4 technology, where the number of animals was lowest.

5. Conclusions

  • The automated feed mixing and feeding technologies recorded the lowest cumulative human labor energy intensities compared with conventional mixing and feeding technologies (CFS1 to CFS2);
  • The high level of automation of the preparation and feeding of fodder for four technologies in the nutrition of both dairy and beef cattle guarantees low labor demand, which is of key importance for agricultural producers due to the increasing labor costs and difficulties in finding labor;
  • The lowest energy inputs were found in a group of farms equipped with automated feed mixing and feeding equipment (from AFS1 to ASF4), but which, when combined with a high cumulative energy intensity of machinery and equipment, resulted in the total highest value of cumulative energy intensity for feed mixing and feeding in that technology group;
  • A practical conclusion for scientists and agricultural producers, resulting from the research on cumulative energy consumption, is much lower (39.3%) total electric and mechanical energy inputs for robotic feed preparation and feeding technologies compared to simple conventional technologies;
  • Carrying out an LCA in the longer term will allow for a comprehensive assessment of the impact of modern technologies on cattle nutrition, which will contribute to future articles;
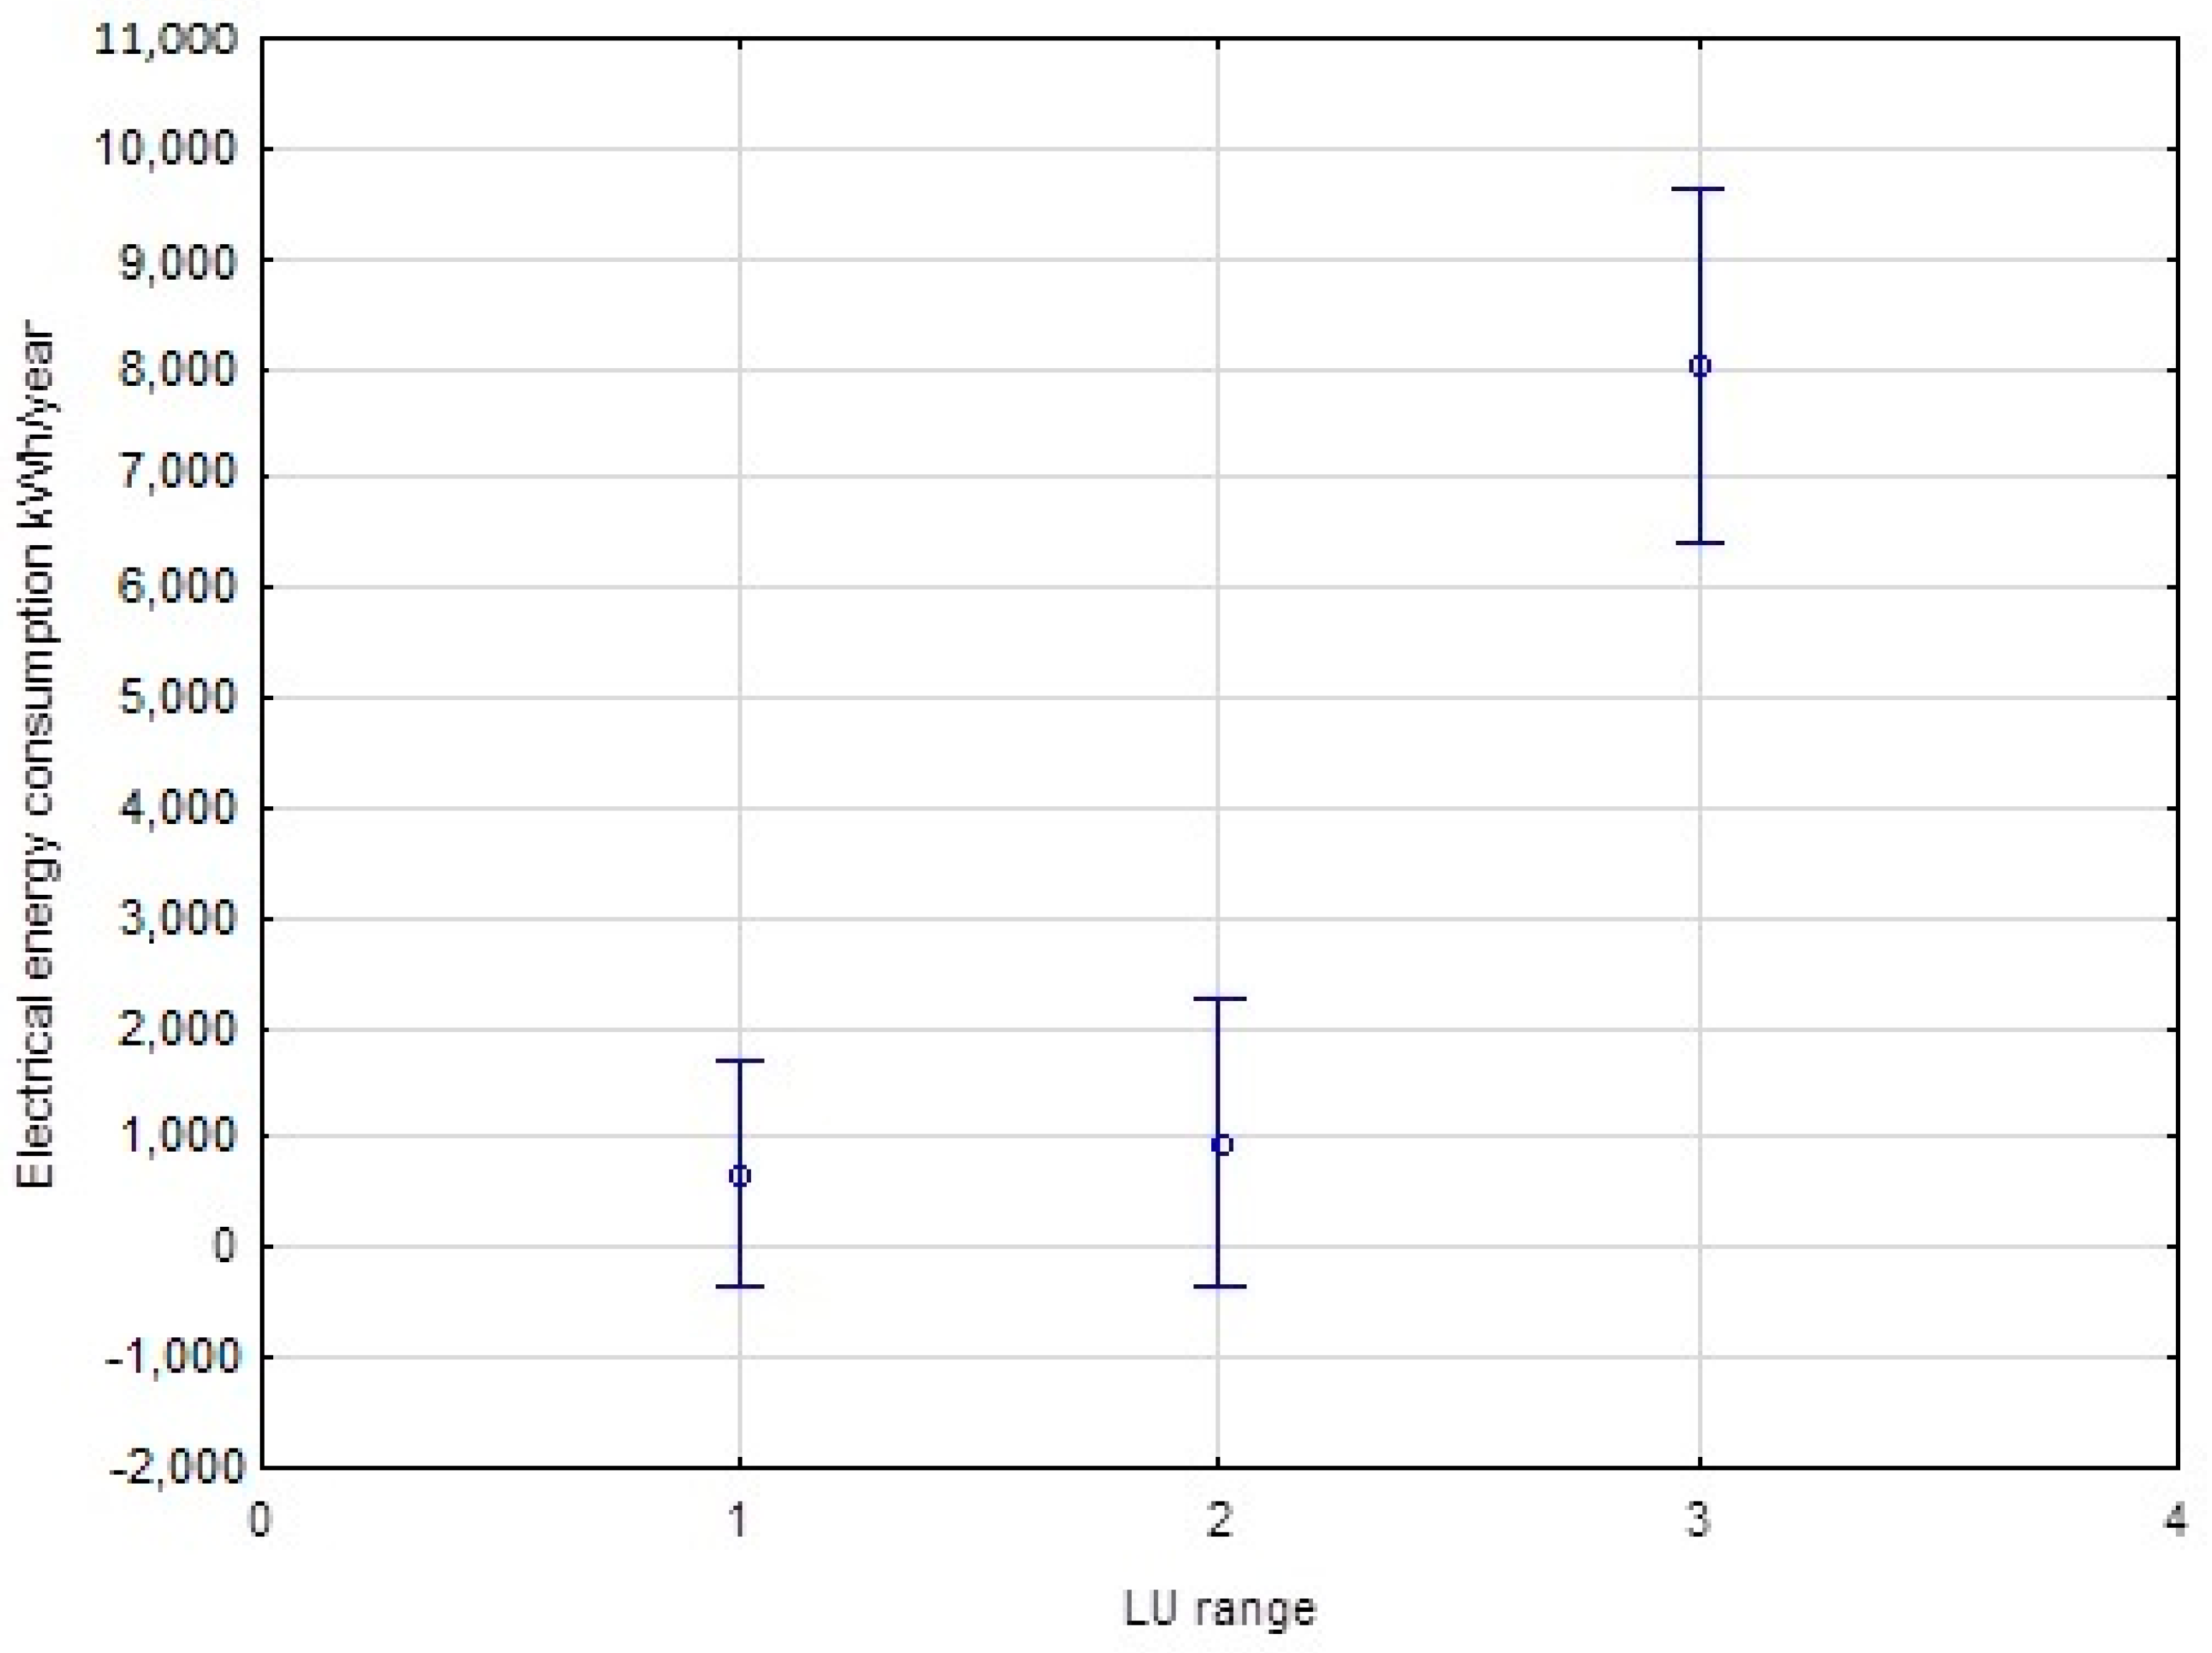
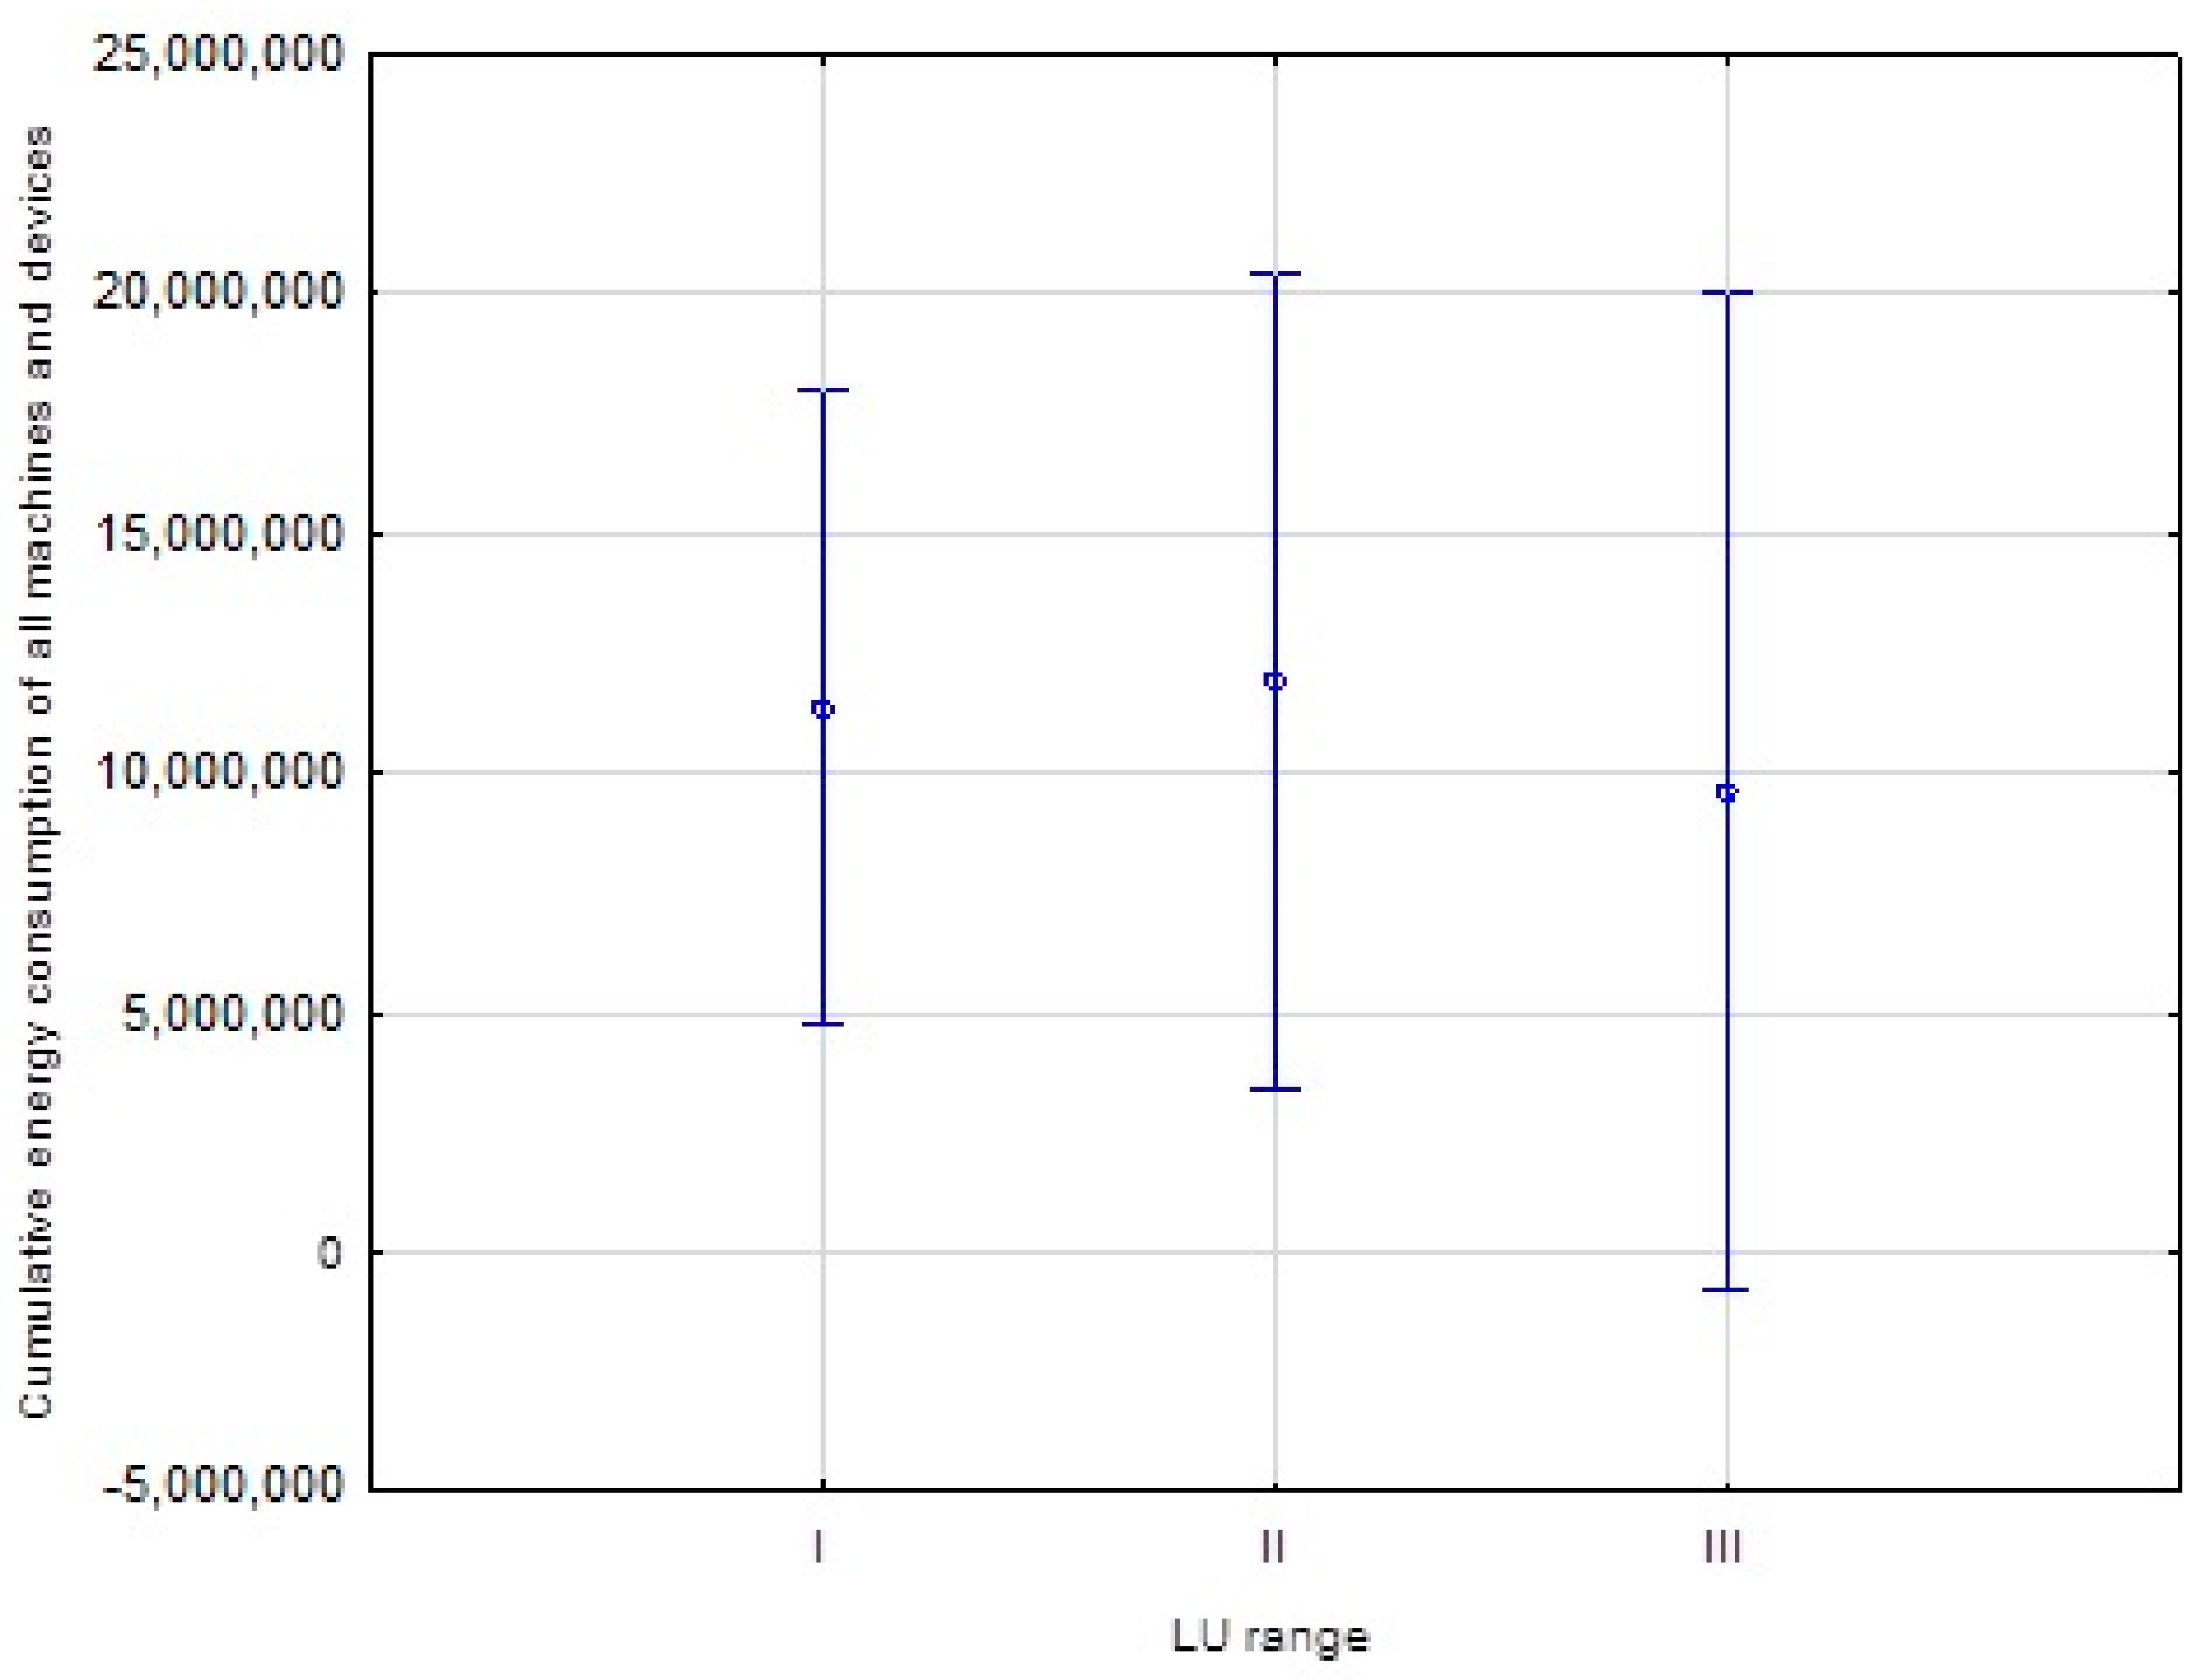
  • The dependence of electrical energy consumption on the LU density may show the economic approach of energy consumption in cattle breeding. According to the statistical analysis supported by a post-hoc test (e.g., Duncan), it turned out that the significance level in the dependence test was low—under 0.05. Three groups were presented, in which groups I and II, LU numbers were the same, in distinction to group III. The cases of the dependence of cumulative energy intensities for various feed mixing and feeding technologies on LU numbers had no differences in all of the homogenous groups.

Author Contributions

Conceptualization, W.J.W., K.E.M., K.R., M.R. and M.M.; methodology, W.J.W., K.E.M., K.R., M.R. and M.M.; software, W.J.W., K.R. and M.R.; validation, K.E.M., K.R. and M.R.; formal analysis, W.J.W., K.E.M., K.R., M.R. and M.M.; investigation, W.J.W., K.E.M., K.R. and M.M.; resources, W.J.W., K.E.M., K.R. and M.R.; data curation, W.J.W., K.E.M., K.R. and M.R.; writing—original draft preparation, W.J.W., K.E.M., K.R., M.R. and M.M.; writing—review and editing, W.J.W., K.E.M., K.R., M.R. and M.M.; visualization, W.J.W., K.E.M., K.R. and M.R.; supervision, W.J.W., K.E.M., K.R. and M.R.; project administration, W.J.W., K.E.M., K.R. and M.R.; funding acquisition, W.J.W., K.E.M., K.R. and M.R. All authors have read and agreed to the published version of the manuscript.

Funding

This research was funded by the National Centre for Research and Development, grant number BIOSTRATEG1/269056/5/NCBR/2015.

Institutional Review Board Statement

Not applicable.

Informed Consent Statement

Not applicable.

Conflicts of Interest

The authors declare no conflict of interest. The funders had no role in the design of the study; in the collection, analyses, or interpretation of data; in the writing of the manuscript, or in the decision to publish the results.

References

  1. Todde, G.; Murgia, L.; Caria, M.; Pazzona, A. A Comprehensive Energy Analysis and Related Carbon Footprint of Dairy Farms. Part 1: Direct Energy Requirements. Energies 2018, 11, 451. [Google Scholar] [CrossRef] [Green Version]
  2. Todde, G.; Caria., M.; Gambella., F.; Pazzona., A. Energy and Carbon Impact of Precision Livestock Farming Technologies Implementation in the Milk Chain: From Dairy Farm to Cheese Factory. Agriculture 2017, 7, 79. [Google Scholar] [CrossRef] [Green Version]
  3. Eurostat 2020. Available online: https://ec.europa.eu/eurostat/statistics-explained/index.php?title=Milk_and_milk_product_statistics (accessed on 12 August 2021).
  4. Borusiewicz, A.; Majchrzak, M.; Romaniuk, W. Monograph. In Robotization of Cattle Feeding Taking into Account Energy Expenditure and Renewable Energy Sources in Modern Cowsheds; Higher School of Agribusiness in Lomza: Lomza, Poland, 2018; p. 171. ISBN 978-83-947669-3-1. [Google Scholar]
  5. Berebeć, A.K.; Feledyn-Szewczyk, B.; Thalmann, C.; Wyss, R.; Grenz, J.; Kopiński, J.; Stalenga, J.; Radzikowski, P. Assessing the Sustainability Performance of Organic and Low-Input Conventional Farms from Eastern Poland with the RISE Indicator System. Sustainability 2018, 10, 1792. [Google Scholar] [CrossRef] [Green Version]
  6. Rokochinskiy, A.; Frolenkova, N.; Turcheniuk, V.; Volk, P.; Prykhodko, N.; Tykhenko, R.; Openko, I. The variability of natural and climatic conditions in investment projects in the field of nature management. J. Water Land Dev. 2021, 4, 48–54. [Google Scholar]
  7. Maria, V.C.; Riccardo, V. A land-based approach for climate change mitigation in the livestock sector. J. Clean. Prod. 2021, 283, 124622. [Google Scholar] [CrossRef]
  8. Wałowski, G. Multi-phase flow assessment for the fermentation process in mono-substrate reactor with skeleton bed. J. Water Land Dev. 2019, 42, 150–156. [Google Scholar] [CrossRef] [Green Version]
  9. Konieczna, A.; Kamil, R.; Monika, R.; Damian, Ś.; Michał, R. Energy Efficiency of Maize Production Technology: Evidence from Polish Farms. Energies 2021, 14, 170. [Google Scholar] [CrossRef]
  10. Konieczna, A.; Kamil, R.; Kinga, B.; Emilia, G. GHG and NH3 Emissions vs. Energy Efficiency of Maize Production Technology: Evidence from Polish Farms: A Further Study. Energies 2021, 14, 5574. [Google Scholar] [CrossRef]
  11. Wójcicki, Z. Metodyka badania energochłonności produkcji rolniczej. Problemy Inżynierii Rolniczej. Z. 2015, 4, 17–29. [Google Scholar]
  12. Tangorra, F.M.; Calcante, A. Energy consumption and technical-economic analysis of an automatic feeding system for dairy farms: Results from a field test. J. Agric. Eng. 2018, 49, 228–232. [Google Scholar] [CrossRef]
  13. Oberschätzl-Kopp, R.; Haidn, B. Automatische Fütterungssysteme für Rinder—Technik, Leistung, Planungshinweise; DLG-Merkblatt 398; DLG International: Cherry Hill, NJ, USA; Frankfurt am Main, Germany, 2018; p. 20. Available online: https://www.dlg.org/fileadmin/downloads/landwirtschaft/themen/publikationen/merkblaetter/dlg-merkblatt_398.pdf (accessed on 5 December 2021).
  14. Belle, Z.; Andre, G.; Pompe, J.C.A.M. Effect of automatic feeding of total mixed rations on the diurnal visiting pattern of dairy cows to an automatic milking system. Biosyst. Eng. 2012, 111, 33–39. [Google Scholar] [CrossRef]
  15. Oberschätzl, R.; Haidn, B.; Neiber, J.; Neser, S. Automatic feeding systems for cattle—A study of the energy consumption of the techniques. Environmentally Friendly Agriculture and Forestry for Future Generations. In Proceedings of the XXXVI CIOSTA & CIGR Section V Conference, Saint Petersburg, Russia, 26–28 May 2015; p. 966. [Google Scholar]
  16. Calcante, A.; Oberti, R. A Technical-Economic Comparison between Conventional Tillage and Conservative Techniques in Paddy-Rice Production Practice in Northern Italy. Agronomy 2019, 9, 886. [Google Scholar] [CrossRef] [Green Version]
  17. Muzalewski. Zasady Doboru Maszyn Rolniczych. Kryteria Oceny Racjonalności Doboru oraz Wykorzystania Wybranych Maszyn i Urządzeń Rolniczych w Ramach Programu Rozwoju Obszarów Wiejskich (PROW 2007–2013) Pod Kątem Działania Modernizacja Gospodarstw Rolnych; Instytut Technologiczno-Przyrodniczy: Warsaw, Poland, 2008; p. 92. ISBN 978-83-89806-21-5. [Google Scholar]
  18. Grothmann, A.; Nydegger, F. Landtechnik im Alpenraum. Available online: https://docplayer.org/113517161-Landtechnik-im-alpenraum.html (accessed on 5 December 2021).
  19. Grothmann, A.; Nydegger, F. Robotertechnik für den Füttertisch. Available online: https://docplayer.org/20426533-Robotertechnik-fuer-den-futtertisch.html (accessed on 5 December 2021).
  20. Dobek, T.; Inżynieria, R. Energy Effectiveness of Edible Potato Production in the Selected Farmsteads. Inżynieria Rol. 2006, 10, 239–246. [Google Scholar]
  21. Romaniuk, W.; Borek, K.; Borusiewicz, A.; Mazur, K.; Wardal, W. Analysis of Technological Solutions for Stanchion Barns for Dairy Cattle; High School of Agribusiness in Lomza: Łomża, Poland, 2018; p. 260. ISBN 978-83-947669-4-8. [Google Scholar]
  22. Roman, K.; Michał, R.; Dominika, S.; Jan, S.; Emilia, G. Evaluation of Physical and Chemical Parameters According to Energetic Willow (Salix viminalis L.) Cultivation. Energies 2021, 14, 2968. [Google Scholar] [CrossRef]
  23. Vaculík, P.; Smejtkova, A. Assessment of selected parameters of automatic and conventional equipment used in cattle feeding. Agron. Res. 2019, 17, 879–889. [Google Scholar] [CrossRef]
  24. Mantoam, E.J.; Romanelli, T.L.; Gimenez, L.M. Energy demand and greenhouse gases emissions in the life cycle of tractors. Biosyst. Eng. 2016, 151, 158–170. [Google Scholar] [CrossRef]
Figure 1. Diagram of the research stand for recording the electrical energy consumption during feed mixing and feeding in the barns.
Energies 14 08584 g001
Figure 2. Dependence of electrical energy consumption on the LU number.
Energies 14 08584 g002
Figure 3. Dependence of cumulative energy intensities for various feed mixing and feeding technologies on the LU number.
Energies 14 08584 g003
Table 1. Characteristics of different drive variants for rail-sliding robots.
Power Supply MethodVoltageEquipment RequirementsAdvantagesDisadvantages
Conducting bus bar48 V and 400 VWater splash protectionSafe power supply from the rail, can be easily expanded, can overcome inclinationsCostly rail power-supply technology
Power-supply wire400 V-Safe device power-supply with electrical energyLimited robot mobility on curves
Battery12 VBattery charging time about 6 h·day−1High battery capacity, simple technologyLong battery charging time
Table 2. Analysis of investment costs, use period, and feed mixing and feeding line operation time in barns with stocking densities of 30, 50, and 80 LU.
Number of LUInvestmentsBlock Cutter Feed Selector with a DispenserMixer UnitSelf-Propelled Feed Selector Robot
1234567
30Investment costs (EUR)7000 10,000 30,000 35,000 125,000
Period of use (years)17 17 17 12 17
Daily operation time (min)33 57 78 18 42
50Investment costs
(EUR)
7000 15,000 35,000 35,000 125,000
Period of use
(years)
15 15 15 10 15
Daily operation time (min) 55 85 104 30 52
80Investment costs
(EUR)
7000 20,000 40,000 35,000 125,000
Period of use
(years)
10 10 10 7 12
Daily operation time (min)88 127 143 48 67
Table 3. Selected values of cumulative energy intensities assumed for calculations according to the research methodology and operation.
ParameterCoefficientUnit
Human labor 40.00 MJ/mh
Fuels and energy carriers
Electrical energy 13.60MJ/kwh
Diesel oil 53.20MJ/kg
Petrol 55.40MJ/kg
Black coal 27.30MJ/kg
Liquid gas 54.90MJ/kg
Others
Buildings and structures 100.00MJ/m2
Machinery and equipment 110.00MJ/kg
Spare parts 80.00MJ/kg
Table 4. Farm characteristics.
TechnologyAFS1AFS2AFS3AFS4CF1CF2CF3CF4CF5CF6
ProvinceŁódzkieMazowieckieMazowieckieDolnośląskieŁódzkieMazowieckieMazowieckieŁódzkieŚląskieMazowieckie
Farm area
(ha)
657036320705514548291570
Number of Livestock Units (LU) 10016840320608317045200154
Housing systemsFree-stall, boxed
without litter
Free-stall, boxed
%with litter
Stanchion, shallow bedding Free-stall, boxed
shallow bedding
Tied-up
shallow bedding
Tied-up
shallow bedding
Free-stall, boxed
without litter
Tied-up,
shallow bedding
Free-stall, boxed
shallow bedding
Free-stall, boxed
without litter
Feeding systemTMR feed robot TMR feed robot TMR feed robot TMR robot Feed robot and a feed wagon coupled
with a tractor
Feed robot and a feed wagon coupled
with a tractor
Feed wagon coupled
with a tractor
Feed wagon coupled with a tractor Self-propelled feed wagon Feed wagon coupled with a tractor
Barn size/Cubic capacity [m3⋅LU−1]19.7992.4748.4088.6371.1422.3270.6448.9370.6845.71
Building development area [m2∙LU−1]6.2413.059.4313.0014.126.1212.4313.0610.9711.72
Feeding passage width (m)2.782.501.504.004.504.765.004.804.5 and 3.005.5 and 2.00
Feeding passage area [m2∙LU−1]1.981.381.541.433.212.092.264.482.252.65
Milk yield [L∙LU−1∙year−1]Beef cattle10,500950011,400770075008500700095008200
Table 5. Values of technical parameters for the barns under study.
Cattle Barn Number Parameter
x1x2x3x4x5x6x7x8
119.796.243.591.981.310.2022.000.48
292.4713.053.001.381.020.1316.001.00
348.409.432.101.541.300.6227.501.54
488.6313.003.061.430.500.6237.501.15
571.1414.122.103.211.360.2520.00-
622.326.122.162.090.990.2416.26-
770.6412.434.202.260.790.2018.82-
848.9313.062.184.481.560.5415.55-
970.6810.974.072.250.900.1513.50-
1045.7111.724.132.651.000.2314.28-
Source: own elaboration. x1—barn’s unitary cubic capacity [m3 ∙LU−1]; x2—building development’s unitary area [m2∙LU−1]; x3—bedding’s unitary area [m2∙LU−1]; x4—feeding passage’s unitary area [m2∙LU−1]; x5—unitary dimension of access to feed (manger) [m∙LU−1]; x6—unitary concentrated feed storage capacity [m3∙LU−1]; x7—unitary roughage storage area [m2∙LU−1]; and x8—unitary feed room area [m2∙LU−1].
Table 6. Breakdown of feeding machinery and equipment for mechanization and automation in barns.
Type of SystemFeeding Line Tractor/Feed Wagon Capacity [m3]Tractor + Silage Selector or Self-Propelled Loader Bowl Drinkers/
Chamber Drinkers/Calf Drink Dispensing Stations/Feed Stations
AFS1AFS Robot TMR Pellon Vol. 5 m3. Loader stations Pellon 2 × 8 m3, “Michał” concentrated feed silo 20 m3, liquid feed silo 3 m3), screw conveyer 8 m ø150, 3 kW, 16 t/hTractor/feed wagon capacity [m3]Tractor + silage selector or self-propelled loader Bowl drinkers/
chamber drinkers/calf drink dispensing stations/feed stations
AFS2AFS Robot TMR Pellon vol. 5 m3. Loading equipment 2 × 13 m3 and 1 × 8 m3, belt conveyer, 8 mineral-vitamin feed dispensers, “Michał” silos 2 × 8 m3 and 1 × 5 m3
Screw conveyer 8 m ø150. 3 kW. 16 t/h
N/A Telehandler Deutz Fahr 75 kW15 bowl drinkers/calf drink dispensing station
AFS3AFS Robot TMR vol. 5 m3 of roughage mixer. Concentrated feed hopper, belt conveyor; “Michał” 25 m3 silo; screw conveyer 8 m ø150, 3 kW, 16 t/hN/ATelehandler JCB 55 kW8 chamber drinkers
AFS4AFS Robot Lely Vector TMR vol. 2 m3; 2 mineral-vitamin feed hoppers; roughage loading crane; 3 BIN 48 m3 silos with a bucket conveyor. 2 BIN 27 m3 silos; Pneumatic conveyer T420 15 kW 14 t/hN/A Tractor Valtra 65 kW
Silage selector Strautmann Hydrofox
40 bowl drinkers
CFS1Robot DeLaval FW200 for concentrated feeds for concentrated feeds. 15 m3 silo, screw conveyer 8 m, ø110. 1.5 kW. 7 t/hN/A Telehandler Manitou Maniscopic MLT1035L-LSU 74.5 kW4 bowl drinkers/10 chamber drinkers;
2 feed stations Lely
Cosmix
CFS2Concentrated feed robot. Bin 2 × 7.5 m3 and 5 m3 silos; Screw conveyer 2.2 kW 8 m. ø140. 13 t/hMassey Ferguson 3095 74.9 kW/vol. 9 m3 Sgariboldi Tractor Ursus C 360 35 kW
Front loader T261
32 bowl drinkers
CFS3Feed pusher robot Lely Juno 15, concentrated feed line: “Michał” silo, 14 m3 and 20 m3. Screw conveyer 1.5 kW with a charging hopper 4 m, ø16, 24 t/hZetor Proxima 60.3 kW/vol. 6 m3 WP6 Tractor Farmtrac 675 DT 54 kW
Jaw-type cutter WK085
99 bowl drinkers
CFS4Feeding with concentrated feeds: Silo Bin 12 m3, screw conveyer 2.2 kW with a charging hopper 4 m, ø140, 12 t/hZetor Proxima Plus 105. 74.3 kW/vol. 14 m3 RMH Telehandler 55 kW JCB 525-60 7 bowl drinkers/4 chamber drinkers
CFS5Feeding with concentrated feeds: Silo DeLaval 12 m3 and 18 m, screw conveyer 1.5 kW with a charging hopper 6 m, ø160, 24 t/hFendt 308 C. 63 kW/vol. 6 m3 BEL-MIX T659 Tractor Farmtrac 665 DT, 43 kW/
+ silage jaw-type selector T385
31 bowl drinkers
CFS6Feeding with concentrated feeds: screw conveyer with a charging hopper 5, ø160, 1.5 kW, 24 t/h, Silos BIN 18 m3Self-propelled feed wagon R.M.H. Vol. 14 m3 with a milled selector VSL14 N/A7 bowl drinkers/8 chamber drinkers
4 feed stations
New Holland T6.175. 128 kW
/20 m3 Samasz Duo 2000
Telehandler 54 kW Case FARMLIFT 525 17 bowl drinkers/2 chamber drinkers
Table 7. Values of process parameters for the barns under study, including labor inputs, electrical energy consumption, and cumulative energy intensity per feeding practice.
TechnologyParameter
y1y2y3y4y5y6y7
AFS10.4900.0090.63631,350.0004.1060.32931,354.435
AFS20.3500.0450.25458,829.8642.3430.23758,832.444
AFS30.8100.1720.83936,049.0157.4530.54136,057.009
AFS40.3000.0970.34934,336.6703.5710.20534,340.446
CFS11.3300.0090.85017,218.91810.3560.89317,230.167
CFS20.7800.0080.72222,448.9505.2260.52622,454.702
CFS30.4200.000470.45917,836.3763.1730.28417,839.833
CFS42.2700.000642.01753,321.87213.9241.51353,337.309
CFS50.4600.0631.14019,224.9116.4340.30719,231.652
CFS60.4630.00020.66518,670.0594.3120.30918,674.68
y1—nrp—daily unitary labor inputs per feeding practice [min∙day−1∙LU−1]; y2—neep—unitary electrical energy consumption per feeding practice [kWh∙day−1∙LU−1]; y3—nemp—unitary mechanical energy consumption per feeding practice [kWh∙day−1∙LU−1]; y4—unitary cumulative energy intensity for machinery and equipment operation [MJ∙day−1∙LU−1]; y5—unitary cumulative energy intensity for energy carriers [MJ∙day−1 LU−1]; y6—unitary cumulative human labor energy intensity [MJ∙day−1 LU−1]; and y7—unitary cumulative energy intensity per feeding practice [MJ∙day−1 LU−1].
Table 8. Cumulative energy intensities for machinery and equipment.
Technology No Cumulative Energy Intensity
y4a y4b y4
AFS113,019.17818,330.82231,350.000
AFS25596.86953,232.99558,829.864
AFS315,625.02920,423.98636,049.015
AFS41670.48432,666.18634,336.670
CFS13765.61613,453.30117,218.918
CFS27436.35215,012.59822,448.950
CFS33280.98714,555.38917,836.376
CFS410,747.68642,574.18653,321.872
CFS50.00019,224.91119,224.911
CFS62400.00016,270.05918,670.059
Table 9. Average values of electrical energy consumption divided into homogeneous groups according to LU range.
LU RangeAverage Value of Electrical Energy ConsumptionHomogeneous Groups
III
I673.936X
II950.825X
III8028.783 X
Table 10. Selected statistical dependencies based on linear regression.
Regression Equation t-Student ValueLevel of Probability Coefficient of Regression rCoefficient of Determination r2
Rzee = 33.18∙LU − 2222.293.76α < 0.010.800.64
Rnr = 0.014∙Rkzpp + 222.343.43α < 0.010.770.60
ETech = 11,730,000 − 39203.30α < 0.010.060.01
Rzee—annual electrical energy consumption [MJ·LU−1]; Rnr—annual labor inputs [mh·LU−1]; Rkzpp—annual costs of consumption of liquid fuels [PLN·LU−1·year−1]; and ETech—annual cumulative energy intensity for feed mixing and feeding technology [MJ·LU−1 ·year−1].
Publisher’s Note: MDPI stays neutral with regard to jurisdictional claims in published maps and institutional affiliations.

