Abstract
Schools play an important role in achieving climate protection goals, because they lay the foundation of knowledge for a responsible next generation. Therefore, schools as institutions have a special role model function. Enabling schools to become aware of their own carbon footprint (CF) is an important prerequisite for being able to tap the substantial CO2 reduction potential. Aiming at the direct involvement of students in the assessment process, a new assessment tool was developed within the Schools4Future project that gives students the opportunity to determine their own school’s CF. With this instrument the CO2 emissions caused by mobility, heating and electricity consumption as well as for food in the school canteen and for consumables (paper) can be recorded. It also takes into account existing renewable energy sources. Through the development of the tool, not only a monitoring instrument was established but also a concrete starting point from which students could take actions to reduce Greenhouse Gas (GHG) emissions. This paper presents the tool and its methods used to calculate the CF and compares it with existing approaches. A comparative case study of four pilot schools in Germany demonstrates the practicability of the tool and reveals fundamental differences between the GHG emissions.
1. Introduction
Reducing carbon footprints (CF) is a key aspect of sustainable development. To respond to anthropogenic impacts on the global climate system, more and more public institutions as well as private companies are assessing their GHG emissions and are aiming to reduce them [1]. Assessing emissions using a carbon footprint is an established method. It plays an important role in raising awareness about (reducing) GHG emissions and in developing measures to protect the climate [2]. Carbon footprints are used for numerous sectors, such as products [3], companies [4], municipalities [5] and lifestyles [6]. According to Minx et al. [7] it has become a catchphrase in the discussion on combating climate change. This article focuses on the carbon footprint assessment of municipalities, and schools in particular.
2. Background
In order to understand the background that plays an important role in connection with the creation of CO2 footprints of schools, we will provide detailed information as follows. Some of the aspects presented below are typical and characteristic for Germany, but other aspects are also of universal validity. For a better understanding of our research design, we will provide background information, which we consider highly relevant. Three central aspects should be considered in the context of carbon footprint assessment in schools:
- The relevance of municipalities and schools regarding climate protection;
- The relevance of self-efficacy for climate protection activities; and
- The relevance of carbon footprints as approach to reduce GHG emissions in schools.
In the following, we will present these aspects in more detail.
2.1. Relevance of Municipalities and Schools Regarding Climate Protection
Considering the numerous applications of CF, municipalities play a special role as their activities are associated with high emissions (e.g., public transport, public buildings), they act as a role model and they have the opportunity to set ambitious climate targets [8,9]. All over the world, there are municipalities that are implementing good examples, setting ambitious climate protection goals, making voluntary commitments to climate protection, hiring their own climate protection managers and consistently working on the implementation of their climate protection concepts [10]. The increasing importance of energy communes, Community-owned energy companies and energy cooperatives worldwide are visible evidence of this phenomenon [11]. The new paradigm of the climate-friendly city has replaced the old paradigm of the car-friendly city from the 1960s and 1970s [12].
Municipalities that renovate their own public buildings to make them more energy-efficient can permanently reduce energy costs, which relieves the burden on the municipal budget. Many climate protection measures make valuable contributions to regional value creation or improve the quality of life of the people in the community [13]. The multiple benefits of energy efficiency are well analyzed and can be seen in climate change mitigation, energy security and in the reduction of health damage resulting from air pollution as well as in economic benefits [14]. However, there is a considerable problem with implementation in Germany: The policy of neoliberalism and austerity pursued in Germany for many years has often been carried out at the expense of the municipalities [15]. This has consequences because the construction, equipping and ongoing maintenance of schools are core tasks of municipal school authorities. The austerity policy has led to the municipalities in Germany being structurally poorly equipped financially. According to information from the German Association of Cities, there is a renovation backlog of 46 billion euros at schools [16]. This makes it obvious that even in a strong economy like Germany, great efforts are needed to enable substantial climate protection effort in public schools.
Against this background that municipalities increasingly focus on climate protection, schools play a particularly important role, because as in general, schools make up the largest share of the municipal building stock and have the most public traffic. This means that no other public buildings are used as intensively by the population as schools. Large schools in Germany are visited by more than 1000 students every day. This does not even include the other people who work there, like teachers, caretakers and so forth. Parents and grandparents of the students also regularly visit the schools (school events etc.). The multiplier effect of schools is therefore particularly high, and so is its importance as a role model. With this in mind, committed teachers are calling for two things that can significantly change everyday school life: 1. school must become a place where young people are extensively informed about and made aware of the topic of climate change/climate protection and 2. school must provide alternatives for action in the private sphere, but above all also in their own school and in the political sphere [17]. In Germany, there are already efforts to implement climate protection measures in schools. One example is the program “Klimaschutz macht Schule” (Climate Protection by Schools), where, among other things, efficient lighting, replacement of air conditioning or the modernization of building and building control systems are financed by the German Government [18].
However, not only municipalities have recognized the special role and relevance of schools. They have also received special attention for years through the Fridays for Future movement. Schools can thus become a central place for a societal transformation process [19], which on the one hand transforms itself and on the other hand becomes the nucleus of an engagement taking place on a collective level. For young climate activists like Greta Thunberg, the ecological crisis is as depressing as it is an occasion for a common social project. It is the basis for a global climate movement that is initiated and supported primarily by students.
One reason for the success of the Friday for Future movement is that when it comes to climate protection, people act themselves to prevent problems by taking direct action. Like the energy cooperatives and energy communities mentioned above, schools can make an important contribution to a bottom-up development that emphasizes civic engagement. It can be proven that Fridays for Future are opinion-based groups that contribute to the formation of a collective identity [19]. This in turn creates a positive momentum that can be used for climate change education. When the school community acts collectively, this can also increase the perceived collective effectiveness [20].
2.2. Relevance of Self-Efficacy for Climate Protection Activities
The concept of self-efficacy was first introduced by Bandura [21]. Bandura uses it to describe an aspect of social-cognitive learning theory. It is about the strength of one’s belief in one’s own ability to perform a certain task or achieve a certain result. Thus, the assessment of self-efficacy is less about what skills and abilities the individual possesses and more about what they believe they can do with the skills and abilities they possess.
Notwithstanding the collective effectiveness, climate mitigation efforts often lead to frustration, because individual successes are too small to be visible. In the buzz of a community, however, measurable successes can be achieved. For example, if a student makes sure that the classroom light is turned off after class, the reduction in electricity consumption is so small that it has no effect on the school’s annual consumption. However, if this behavior is shown by all students, it can become visible. The personal judgement of how well one can effectively influence the course of a development is commonly referred to as self-efficacy [19,22]. In the past years, many researchers have studied questions surrounding self-efficacy whereby in schools not only the self-efficacy of students plays a role, but also that of teachers [23]. A good review of studies addressing the relationship between climate change, anxiety and self-efficacy among students has been compiled by Maran and Begotti [24]. Recent research shows that climate change-focused communication and teaching approaches that increase students’ self-efficacy and perceived benefits of sustainable energy behavior can contribute to students’ commitment regarding sustainable energy [25]. By fostering the feeling of self-efficacy, the motivation to substantially contribute to climate protection can be significantly improved.
2.3. The Relevance of Carbon Footprint as Approach to Reduce GHG Emissions in Schools
One possible way to increase self-efficacy is by providing means to give regular feedback on how one’s own efforts is being effective [22,26]. The method of assessing the own Carbon Footprint is fulfilling exactly this purpose. Thus, measuring the school’s CF and observing how it reduces after climate mitigation is a valuable instrument to give feedback to the students.
There are several tools and approaches available to assess the CF of buildings and institutions although they differ significantly with regard to the areas analyzed, the data input, the methods, emission factors and so forth. [2,27,28]. Most of the existing tools and methods to calculate the GHG emissions focus on the energy consumption. The methods range from very simple assessments based on the electricity consumption, the lighting and the heating system. However, there are also more complex tools and methods available that conduct a comprehensive assessment (see e.g., [2,29]).
Although the range of approaches and methods is very large, there are only limited tools that focus on carbon assessment of schools. In Germany, there are some programs and initiatives that begin with a simple CF assessment in their first phase. Examples are the initiatives “fifty/fifty”, “Energie gewinnt” and “Klimaschulen Hamburg” [30,31]. However, they only focus on the energy consumption, neglecting the fields mobility and school canteen.
Two examples for a more comprehensive analysis of CO2 emissions in schools was made by Gamarra et al., who published the analysis of a comprehensive sustainability performance of a high school student [32] as well as the life-cycle assessment of five schools in Spain and Portugal [33]. An analysis of the energy consumption in schools in over 20 countries is provided by Dias Pereira et al. [34], which attempts to derive a benchmark based on a literature review. More recently, a tool developed by Greenpeace (Germany) has been introduced in the context of the “Schools for Earth” project. It provides an easy-to-use online interface where the data needed to calculate the emissions can simply be inserted [35].
Due to the limited tools focusing on schools, looking for carbon accounting tools and carbon footprints for universities (also educational institutions) is somewhat more fruitful. In Austria, for example, a methodology has been developed for calculating the GHG emissions of universities (ClimCalc). All Scope 1–3 emissions are covered. The areas include energy, mobility, material use (paper, refrigerants, IT equipment), and nutrition (beef, pork, poultry meat, fish, fats and oils). The areas of water and paper were below the threshold at less than 1% and were therefore not considered further [36]. Other examples of analyses of GHG emissions from universities are Yañez et al. [37], Larsen et al. [38], Pérez-Neira et al. (with a focus on university commuting) [39] and Vásquez et al. [40].
2.4. Research Gap and Overcoming Deficits of Other Tools
In previous research on climate protection in schools, students have always been as part of the school, rather than as drivers in the efforts towards climate friendly schools. It has not yet been researched if and to what extend students have the capacity to support the transformation of their school towards climate neutrality and in particular whether students, with the support of teachers, can draw up a carbon footprint of their school themselves. Our hypothesis is that if schools are able to do this, they will be able to gain knowledge from it that will help them to find effective measures for climate protection at school and to give municipalities/school boards advice on building renovation.
We have developed the following method and calculation tool to help overcome the aforementioned obstacles and problems. Our aim is to provide school authorities, especially local authorities, with important information on how they can achieve a climate protection effect even with small investments. Students should be able to recognize that they are increasing their self-efficacy and are becoming qualified in the use of a widely used office program. Above all, we want to show that determining one’s own carbon footprint is a good starting point for promoting the reduction of GHG emissions in schools.
Because of the restricted approaches for schools, an Excel-based carbon accounting tool was developed within the Schools4Future project. This is intended to complement and extend existing approaches and deepen the discussion on how CO2 emissions can be measured in schools. In the case, special emphasis was placed (compared to other approaches) on the factor that the tool can be used by students themselves. That is why this paper examines the question how a CO2-assessment tool must be structured in order to guarantee intuitive operation, whether students can be motivated by the tool to commit themselves to climate protection and whether self-efficacy can be experienced by using the tool. However, this question should not neglect the well-founded scientific design of the tool and the comprehensive approach to record the GHG emissions.
Therefore, not only energy consumption of schools was considered, but also transport, food, procurement and the availability of renewable energies (photovoltaic systems). Furthermore, a high degree of transparency should be guaranteed by making all calculations and emission factors visible. This distinguishes the tool inter alia from the Schools for Earth project, which has a good approach to incorporate emissions related to nutrition and mobility in addition to those generated by energy consumption, but it is lacking transparency with regard to methods.
In the following chapters, the tool and its methods are presented and case studies are used to show how it was applied in four pilot schools. A comparative analysis of the results shows why there are differences in the carbon footprints of schools.
3. Materials and Methods
The development of a CO2 balancing tool for schools was conducted within Schools4Future project. Within the three years of the project timeline, the project aims to sensitize schools to climate protection measures, to show options for GHG reductions and to implement concrete measures. To do all this, the first step is to know and analyze the CO2 emissions of the schools.
The CO2- assessment tool is based on the widely used Office program for calculating spreadsheets Excel. Initial tests show that the tool also works with the open source spreadsheet program LibreOffice. This offers optimal conditions for carrying out complex calculations and at the same time enables intuitive operation. Especially for the target group, students, it was important that the tool can be easily used at the respective school and that the handling is easy. For the CF of the school, three key areas were identified:
- mobility,
- heating and electricity, as well as
- food in the school canteen and consumables (paper).
The emissions deriving from water sewage and waste disposal have not been taken into account because the relevance of emission reduction through water sewage and waste reduction is considered low. For a comprehensive life cycle assessment of schools, we recommend Gamarra et al., (2021) [33].
Before the Excel tool is filled with data, it must be considered from where which data can be obtained. It is not possible to make a general statement on this because school boards have not regulated this in a uniform way. To obtain the consumption data for electricity, gas and other energy sources, the students depend on the support of the school authorities, school board or school custodian. The tool allows entering the consumption data in different units and for different time intervals, as obtained by the students. The school caretakers can fulfil an important function by assisting the students and by pointing them into the right direction of where to obtain the required data. Information on school trips can usually be obtained from the school secretariats, as every school trip must be approved beforehand. However, there are also other ways how students can compile a list of school trips on their own. Data regarding food and the number of meals sold can usually be provided by the cook of the canteen. Overcoming the challenges of data collection is the first step towards increasing the students self-efficacy, but students need to be supported by teachers. Furthermore, it is helpful if the school directors support the project and help to overcome any problems.
3.1. The Excel Tool
The Excel tool was developed to be used primarily by students to assess the CF of their school. It has been taken into account that (younger) students who have no or only little experience with the Excel program have the chance to use the tool autonomously. With this in mind, an easy to use and at the time appealing interface was developed. Care was also taken to ensure that the students can try out the tool without fear of destroying basic functions and basic calculations. Therefore, calculation fields were locked for changes. However, students can create small “scenarios” by seeing, for example, how the CF would change if a different energy source were used (for example, wood pellets instead of oil). The playful approach has proven to be useful as it helps to ensure that students are not overwhelmed. Furthermore, the individual steps necessary for a CF assessment are described within the tool in a student-adequate language. In addition, many calculations (e.g., the conversion of kilowatt hours to CO2 emissions) are done automatically, so that the advantages of Excel are fully exploited here. Many descriptive figures, which are created automatically when entering the data, have also been integrated. For each of the analyzed areas (heating system, electricity consumption, existing photovoltaic system, commuter traffic, school trips and student exchanges, canteen and procurement) individual sheets were developed. The procedure was chosen to create clarity and to allow students to work in subgroups. Each area has a different color that is also attributed to the respective sheets (see Figure 1). For the purpose of this paper, parts of the tool have been translated into English. Due to the target group (students in Germany) and the fact that the tool should be particularly user-friendly, it was written in German. Country-specific characteristics, especially the emission factors, are related to Germany. Without adaptation, the tool can therefore only be used in Germany. However, it is easily possible to change the country-specific emission factors in order to use this tool in schools in other countries as well.
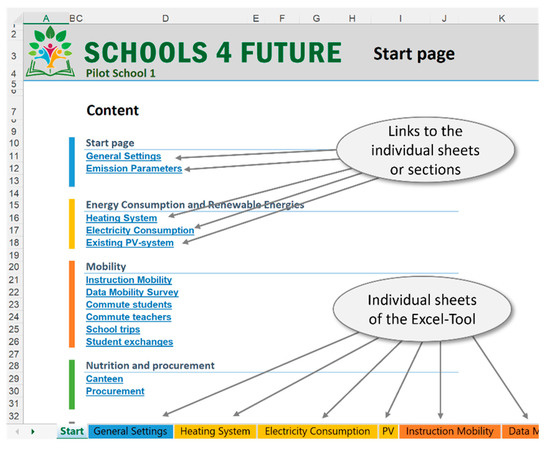
Figure 1.
Start page of the Excel-based tool.
The first sheet serves as an introduction and overview of the Excel tool. Here, a general guide is presented on how to use the tool. The sheet “General Settings” is used to define all general parameters of the school, such as type of school, floor space, number of students/teachers and whether the school is part of a school complex or an individual school. Further, this sheet gives a summary of all emission factors used in the tool and offers the option to manually overwrite emission factors if necessary (e.g., if specific emission factors of district heating is known). This makes the freely available tool also usable for schools in other countries. Individual sheets are available for the areas mentioned before:
- Heating System: The CF of the heating system is based on the amount and type of energy used. The billing period can be specified variable.
- Electricity Consumption: The electricity sheet allows the user to directly enter the base period and electricity consumption from the electricity bill.
- Existing Photovoltaic (PV) System: In Germany, many schools are (already) equipped with a PV system. The tool can either calculate or estimate the electricity consumption from existing PV-systems at the school. If the performance of the existing system is known, it can be entered directly into the tool. Alternatively, it can be estimated based on the size, orientation to the sun and other factors. Here, the incorporation/subtraction of the electricity generated by the existing PV system is done.
- Commuter Traffic: Because there is usually no standardized data on commuter traffic in schools available, data first needs to be collected. The students are invited to conduct a survey on how the students and teachers commute to school. To this end, they can either choose to print and distribute the survey or follow the instruction in the tool to create a digitalized survey which collected the data via QR code. Subsequently, the data can be processed automatically. The results of the survey are added up in the tool and multiplied by the emission factors.
- School Trips: The sheet provides a framework to calculate the CF of school trips, based on the choice of transportation, distance and number of participants.
- Student Exchange: The sheet provides a framework to calculate the CF of student exchanges, largely analogue to the school trips.
- Canteen: For this category, the students are asked to find out the main ingredients of five meals that are typically served on a day. For a number of ingredients, specific emission factors are available.
- Procurement/Paper: The tool takes into account copy paper, paper towels and toilet paper. For all kinds of paper, there are several options of specifying the amount: by the number of single sheets or packages (500 sheets) or per kilogram. The user can also enter whether the paper is from fresh fibers or from recycled paper/
In an extra sheet, all results of the single areas are summarized. In addition, the total emissions per school and per student are illustrated. The tool also automatically generates the results in pie charts and bar charts.
3.2. Scope and Emission Factors
The tool treats indirect emissions deriving from the upstream chain equally to direct emissions (those directly emitted by the combustion of gas for example). Accordingly, emissions related to the generation of electricity in a power plant is equally considered in the assessment.
Regarding energy and transport the emission factors used are based on the values defined by the Oeko-Institut (Freiburg, Germany) [41,42], the Federal Environment Agency (Dessau-Roßlau, Germany) [43], Wuppertal Institute (Wuppertal, Germany) [44] and Ifeu (Heidelberg, Germany) [45]. All these data are based on the computer model GEMIS (Global Emissions Model of Integrated Systems), a database for the assessment of environmental costs deriving from energy, material and transport with an experience dating back to 1989. The CF determined is expressed in CO2 equivalent (CO2e) emissions. For all energy sources from Germany and abroad, representative supply mixes (share of production regions) were applied for Germany, from which typical supply mixes for the domestic use of the energy sources were determined.
The GHG emission factors taken into account relate to CO2, CH4 and N2O and the CO2 equivalents determined from them. They comprise the direct emissions from the use of these energy sources and also include the entire upstream chain for the provision of the energy sources.
In Germany, there has been an intensive discussion on greenhouse gas data of fossil energy pre-chains in the last decades. GEMIS has established itself as a standard in this context and is widely accepted in science, politics and administration. In Germany, GEMIS data are therefore often the basis for various funding instruments of the federal and state governments in the field of energy. All data are contained in the GEMIS database in a transparent and disaggregated way. The GEMIS database contains the basic information for the model and includes more than 10,000 processes in over 30 countries.
In simplified terms, the GHG emissions in CO2 equivalents (CO2e) for each source were calculated using the following formula:
here, ES is the energy source and GHGef are greenhouse gas emission factors. Thus, the GHG emissions caused by a given source are quantified by multiplying it by its respective GHG emission factor.
The emission factors for the specific GHG emissions were taken from various sources, all based on (the above-mentioned) GEMIS. The assessment is categorized by the following scopes: Scope 1 comprises the direct GHG emissions resulting from applications that can be located at the school site, such as the heating system. The respective amount of GHG emissions largely depend on the type of heating system the school is running. Scope 2 identifies also those GHG emissions deriving from the upstream chains, namely the generation of the electricity consumed.
The emission values from 2019 are selected for all areas. The reason for this decision is the special situation due to the COVID-19 pandemic. In 2020 and 2021, students in Germany were temporarily taught via computer and/or by their parents at home. During this time, the values resulting from electricity consumption, for example, deviate greatly from the usual values.
Regarding the electricity consumption and the electricity produced in school buildings, the emission factor was set to the carbon intensity of the German electricity mix in 2019 at 0.401 kgCO2/kWh [43]. Finally, scope 3 assesses indirect GHG emissions resulting directly from the operation of the schools while their origin lies outside of the school. That is true for the following three areas: procurement (specifically of paper), the food supply of the school canteen and the means of transport that students and teachers are using to commute to school or for school trips. Emission values from the Oeko-Institut and Reinhardt et al. were used for school meals [42,46]. In order to ensure the usability of the tool, emission factors were only added for key categories (e.g., fresh vegetables). Due to the fact that emissions other than CO2 are also relevant in the area of food, in the tool, the emissions are calculated as CO2 equivalents in grams per kilogram of ingredient. The tool differentiates between conventionally produced food and organically produced food and calculates different emission values based on the Oeko-Institut [42]. Organic food performs usually 5 to 25 percent better. Regional products are also rated with a better climate balance in the tool. Since it is difficult to compare a regional product with a non-regional product (Where was the alternative product produced? Is it transported by ship or plane?), a fixed emission discount of 10% is granted here. In the area of procurement, only paper consumption (copy paper, toilet paper, paper towels) is taken into account. An emission factor of 1.06 CO2 per kg of paper is used for fresh fiber paper and a factor of 0.886 kg CO2 per kg for recycled paper [45].
The tool also includes the effect of a potentially existing photovoltaic system. In this case, the emissions that do not arise because electricity from the school’s own PV system is used, are credited. The emission factor of the 2019 electricity mix is used for the credit.

Table 1.
Emission factors for different energy sources and units.
Table 2.
Emission factors for different mobility options per km.
The overall CF is reflecting the sum of all applications considered relevant. It is ex-pressed in ton CO2. In order to compare schools, a specific CF can be identified. The CF per students of a school is such an indicator and can be calculated as follows:
3.3. Case Study
The Excel tool was developed within the Schools4Future project aiming at raising awareness of the GHG reduction potentials at schools. To this end, twelve secondary schools in Germany have been selected as pilot schools to test the CO2 balancing tool. The schools were selected based on different criteria: the geographical diversity, the school type, the social milieu and generally apparent need for renovation. The CO2 reduction potential also played an important role.
In mid-2020, the schools were selected and since then the implementation of the project has been taking place at the schools. Due to the COVID-19 situation and school-specific conditions, the schools are at different stages of the implementation. Until now, four schools have already completed the CF calculations, making it an ideal time to take stock.
Some characteristics of the four schools are:
- School 1 is a school located in the southwestern state Baden-Württemberg. At the school, a special learning program was implemented in a grade 8 class, where the school’s carbon footprint was analyzed. The class was supervised by the class teacher and accompanied by scientists.
- School 2 is a private school in Southern Germany. Due to the pandemic, the contact to the students at school solely took place in online sessions in which the tool was introduced by the project team.
- School 3 is a school located in North Rhine-Westphalia in Germany. At this school, the project was realized by a group of students from different ages (ranging from 12 to 18) interested in climate protection and thus committing their free/leisure time tor the project. Prior to the carbon footprint assessment, they split up into four groups discussing different aspect of climate protection in the school context. Committed teachers supported the group in their work.
- School 4 is located in the center of the city of Wuppertal in North Rhine-Westphalia. Even before the project launch, a number of students and teachers established the “Else for future” group to get engaged voluntarily in climate protection. “Else” is a term used internally by the school and a common abbreviation for the complete school name. Similar to School 3, the students worked on the CF assessment in different groups.
The students were supported by the Schools4Future project team, that is, scientists with many years of experience in carbon footprints and carbon assessments. During the implementation of the project, the researchers observed the students and teachers regularly and analyzed whether the user-friendliness of the assessment tool is given and whether self-efficacy and a “call to action” was experienced by using the CO2-assessment tool. The scientists also made a first inspection at the four schools to reveal differences concerning the conditions of the school and the GHG emissions they cause. The following table (Table 3) sums up some central conditions that are important to consider before assessing the GHG emissions:
Table 3.
Overview of the central data of the schools studied.
The table shows that the schools differ regarding their size and location. The first two schools are significantly smaller than the other schools. It also shows that each school uses a different heating system ranging from conventional fossil fuel-based systems (School 1) over district heating (School 4) and wood chipping (School 3) to integrated systems such as CHP (School 2). What all the schools have in common is the presence of a photovoltaic system (5–35 kWp).
The average commuting distance of the students account for 5.5 km with the average commuting distance of the rather rural School 1 being particularly long (7.8 km) and the one of the centrally located School 4 being particularly short (3.6 km).
With regard to the school food, most school canteens somewhat take into consideration aspects such as regional and organic food. They also mostly offer vegetarian alternatives. However, the low number of meals sold per day (except school 3) reveal that less than half of the students and teachers actually make use of the offer.
4. Results
4.1. Comparison of the Carbon Footprints
The CF assessment at the four schools show different results concerning the GHG emissions they cause (Figure 2). This is not unusual, as schools have different preconditions and circumstances. In particular, the size of the school and the number of students and teachers have a significant influence on CO2 emissions. The age of the building (and the time the building was last refurbished) also leads to high or low GHG emissions.
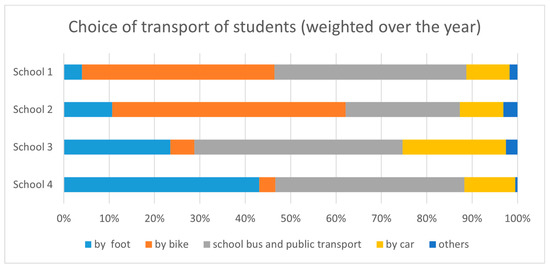
Figure 2.
Students’ choice of transport.
In terms of energy consumption, the CO2 balance strongly depends on the school’s heating system. The best climate balance is achieved by School 4, which primarily obtains district heating by the (local) community’s waste incineration plant and thus uses an energy source that causes particularly low emissions. Due to the size of the school and the fact that it is an old and unrenovated building (with insufficient isolation), this value is particularly noteworthy. A particularity of School 3 is the wood chipping heating system, backed up by a conventional oil heater. The latter considerably deteriorates the overall GHG emission. The oil heating results in School 3 having the worst value of the four schools. A good practice example is School 2, which was (partly) refurbished energetically in the last years and is now equipped with a combined heat and power plant (CHP).
Electricity demand accounts for a much smaller share (apart from School 4). The lowest value comes from School 1, the highest value from School 3, which is partly due to an inefficient lighting system that has only been partially converted to LED.
Since all schools have a PV system, they are also credited with a value towards their carbon footprint. Depending on the size of the system, the value is higher or lower. The largest system is installed at School 2. Here, more than 14,000 kg of CO2 emissions could be credited in 2019.
In order to measure the emissions of the mobility sector, surveys were conducted in all schools. The students actively participated in the development of the survey which was then accessible either as printed version or via a QR code. Within the survey the students and teachers were asked which distance they commute to school and which mode of transport they choose for their commute. A difference was made between the cold winter months and the summer months. The participation rates ranged from about 20% to almost 90% at School 1. For all schools, emissions of about 60,000 kg to 70,000 kg CO2 per school were determined for the commuter traffic. Only School 3 has significantly higher emissions, with almost 150,000 kg CO2. This is due to the school’s large catchment area and its location on a hillside. Here, a considerable proportion of 26% travel to school by car (own car or parents’ car). The proportion of cyclists (with zero emissions) at School 1 and School 2 is also remarkable. Due to the cycle-friendly location of the schools, about 50% of the students cycle to school. Since Wuppertal is located on a hillside, public transport and walking are predominant here. At School 4, over 40% go to school by foot. Another result of the survey was the model split of the students in relation to the season. Taking School 1 as an example, while around 50% of the students ride their bike to school in spring, it is only 24% in winter.
In addition to the commuter traffic of students, the teachers’ trip to school was also surveyed. The per person emissions here are significantly higher than the emissions of the students. This is due to the choice of transport. Teachers come to school significantly more often by car. An example is School 4, where 66% of the teachers commute by car.
Furthermore, the CO2-carbon assessment tool also identifies school trips and student exchange program such as the Erasmus program, an EU program for education, training, youth and sport. It turns out that the trips by plane are particularly significant. School 2 stands out here because many trips were made to foreign long-distant countries. With almost 200 tons of CO2 emissions, it is by far the highest value and clearly exceeds the emissions caused by travelling to school every day. Regarding the mobility sector, School 1 has the lowest emissions with only about 7 tons of CO2 for school trips.
Another area where greenhouse gas emissions occur at schools is the canteen. All four schools have canteens that serve meals to students and teachers. The CO2-assessment tool only records the meals that are actually sold. Unlike in the area of mobility, where the emissions are extrapolated to all students and teachers, only a very rough calculation of the actual emissions can be made here. In the tool, meals were entered for a typical day and then extrapolated to a year. At all schools, the share of emissions generated in the canteen is the smallest compared to the other areas. The scale is between 13 tons and 52 tons CO2 eq. The reasons for this are the number of meals sold and the proportion of vegetarian products. These have a lower CO2 balance. Organic and regional products also have a positive effect on the CO2 balance.
The last area covered by the CO2-assessment tool is paper consumption. Here, copy paper, toilet paper and paper towels are analyzed. At the schools, it has been found that all schools use recycled paper and on average 2–3 tons of CO2 are generated by paper consumption. An exception is School 4, which causes 8 tons CO2 with its paper consumption. Among other things, this is due to the fact that the school uses 1.4 million sheets of copy paper per year.
The next figure compares the overall GHG emissions of all pilot schools (Figure 3). It illustrates that the GHG emissions deriving from energy consumption significantly influences the overall result of the CF assessment. School 3 emits the highest emissions for the heating system, despite relying partly on wood chip heating. When looking at the GHG emissions per kWh heating energy, School 3 ranges in the middle. The high heating demand can partly be attributed to the variant numbers of students, the respective school size and a significant lack of proper insulation that had been detected at School 3 in the course of the school inspection. More importantly, however, the inspection of the school revealed a significant lack of proper insulation. The latter leads to excessive energy consumption that can only to a small degree be reduced via behavioral changes.
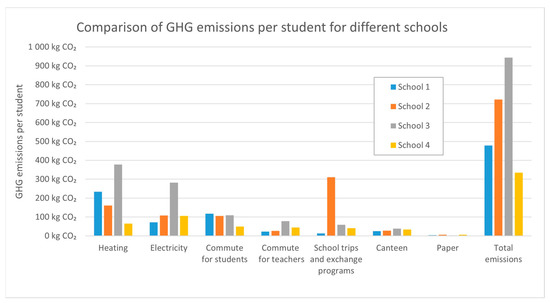
Figure 3.
Comparison of GHG emissions for different schools.
The second largest share of GHG emissions falls on mobility. Within mobility, we looked at the three categories commute for students, commute for teachers and school trips and exchange programs, as shown in the figure above (Figure 3). Here, particularly the long-distant flights related to school trips and exchange programs deteriorate the CF assessment in some schools. While the GHG emissions related to energy clearly exceeds the ones deriving from mobility at School 1, the opposite is the case for School 3 at which GHG emissions related to mobility outnumbers the ones deriving from energy use. As mentioned above, these differences can in parts be attributed to the progressive heating system of School 3. However, the large amount of emissions related to school trips underscores the reduction potential in that area. Moreover, in contrast to the emissions deriving from the school’s energy system, reductions based on behavioral change can more easily be achieved. The next figures (Figure 4, Figure 5, Figure 6 and Figure 7) give a complete overview of the detailed results in the various GHG-relevant fields.
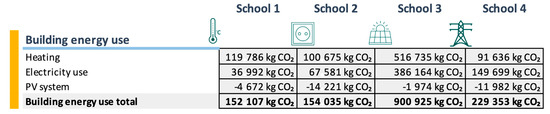
Figure 4.
Results of the CO2 balances in the field of building energy.
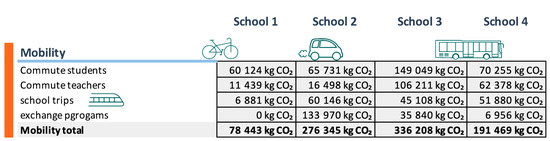
Figure 5.
Results of the CO2 balances in the field of mobility.
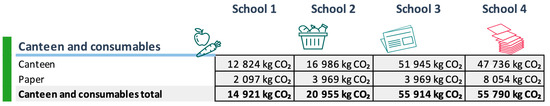
Figure 6.
Results of the CO2 balances in the field of canteen and consumables.
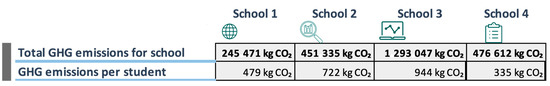
Figure 7.
Results of the CO2 balances as the sum of all fields.
The next figure (Figure 8) compares the overall GHG emissions of all four pilot schools per student. This diagram makes it more visible that School 3 (gray) clearly stands out as Figure 7, while School 4 (yellow) accounts for the lowest GHG emissions per student.
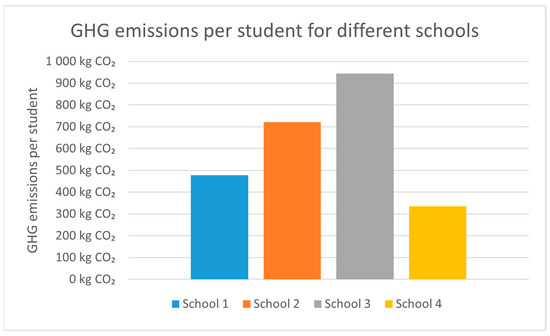
Figure 8.
CO2-emissions per student in different schools.
4.2. Analysis of the Tool’s Practicability and Activism of Self-Efficacy
In order to examine the question of how the tool enables students (and teachers) to experience self-efficacy and motivates them to implement climate protection measures, the Schools4Future project also closely observed the students’ and teachers’ feedback as well as the produced outcome reflected in the climate protection measures developed following the CF assessment.
One finding was that almost all the students were highly motivated to carry out a concrete project and to determine the current status quo of the school with regard to climate protection; not only talking theoretically about climate change and climate protection, but becoming practically active had this motivating effect. Despite the difficult situation caused by the COVID-19 pandemic (in some schools it was only possible to communicate with the students via video conferences for months), the CO2-assessment tool was completed in all four schools. However, it can be stated, that the motivation to fulfil the tool is higher when the students participate voluntarily.
Thanks to the tool, emissions did not remain abstract, but became tangible and directly led to discussions on how to reduce this value. Already during the work on the CO2 balance, the students enthusiastically got engaged in collecting ideas for the reduction of GHG emissions.
In addition, a number of discussions took place with different actors, like the school management, the canteen operators, the caretakers and others. Learning through research: the students have learned a lot about emissions and climate protection during the project. This can be verified by the fact that the students presented the results of the CO2 balance to the school public, the press or local politicians without significant support from the teachers or scientists. A highlight was the organization of a summit in September 2021 by School 3. Here, representatives from the local politics as well as stakeholders from the school authority and building management discussed possible measures with the students in the course of a panel discussion. The students also created a short video explaining the school’s CF balance, indicating the perceived relevance of the tool among the student. The relevance of students’ active engagement is also confirmed by other researchers. Garmarra (2021) [33] did not have a specific focus on student self-efficacy and yet argues that the active participation of students and others in the school environment supports data collection and thus enables detailed and robust analysis.
All in all, it can be stated as a result that the schools’ self-efficacy has increased through their own recording of greenhouse gas emissions. The students were able to acquire new competencies and use them in discussions with decision-makers as well as in their own everyday school life. On the one hand, they were able to develop their own possibilities for action, for example, by making decisions at the schools to no longer use airplanes for school trips in the future. On an individual level, it became clear that many individual decisions have an effect on the school’s overall CO2 balance. If many teachers and students come by bicycle, this noticeably reduces the school’s CO2 emissions. On the other hand, the results presented were able to trigger considerable pressure for action among the cities’ decision-makers. There have already been several follow-up meetings in which assurances were given that some of the measures presented by the students will be implemented. At one school, a hydraulic balancing of the heating system is to be carried out this year and new bicycle parking facilities are to be built. At another school, an engineering firm was commissioned to work out a renovation concept together with teachers and students. The fact that measures are already being implemented after such a short time proves the great importance of the increased self-efficacy that was achieved through the qualification in the context of the own recording of greenhouse gas emissions.
5. Discussion
A central precondition for the use of the tool is that there is access to the required data. Section 2 outlines how different people from the school context (caretakers, canteen staff, school authorities, school directors and teachers) are involved in the process of data assessment. In practice, it has been proven that people who perform important services in the operation of a school are happy to respond to requests, especially caretakers and kitchen staff. Presumably, such contact with the student makes them feel appreciated by the students. All schools succeeded in obtaining the necessary data, but the time required for this varied greatly.
In addition to the assessment of GHG and the development of climate protection measures, the project also organizes peer-to-peer-meetings of the students. This allows them to exchange their ideas and thoroughly understand the reasons behind the emissions. As a by-product, the students might also develop a sense of unity combined with the motivation to improve the school’s performance.
One considerable challenge the tool has been facing concerns the fact that the on-going COVID-19-pandemic renders it almost impossible to introduce the tool to the classes at place. While this proved to be a challenge in the first place, further optimization now allows collaborative assessment for teachers and students even if they need to conduct the meetings remotely from home. It also led to a sudden increase of integrating digital tools and platforms in the school context which encouraged students at some schools to conduct additional surveys to assess data on the school canteen’s food and possible climate protection measures.
Other challenges concern the assessment of emissions related to nutrition: Many students struggled with the selection of ingredients as, logically, not all ingredients can be incorporated. The tool has already been improved by adding and specifying ingredients accordingly. While this will reduce the inaccuracy, it will naturally never be complete. Another problem related to nutrition is that students in Germany can freely choose whether they eat at the school canteen. Most schools in Germany are placed in central locations where the students can easily buy snacks in the nearby supermarkets, bakeries and the like. This leads to the dilemma, that students eating outside the school or bringing their own food are not included in this CF assessment. Therefore, a school may score poorly in this area in comparison because the food is particularly popular based on the number of students eating at the canteen.
However, the foremost goal of the tool is not accuracy but accessibility, which is sufficiently fulfilled as its practical relevance to the reality of students’ lives can contribute to closing the knowledge-awareness-action gaps of existing climate protection learning settings to some extent. Based on the CF assessment the students become aware of the school’s emissions and can then develop measures to reduce them. Once counter actions are put in place the tool supports the students to monitor the development, ideally reduction, of the school’s carbon footprint. This in turn can increase the self-efficacy of the students.
Once put into place, it would be valuable to analyze whether the assessment of GHG at one school effectively leads to (significant) reduction measures at the same. In this context, school comparison should also be shed light on. Does the tool and its assessment explain the source of emissions to such an extent that students can learn from each other. To this end, the project foresees peer-to-peer-learning-events amongst the schools to encourage reciprocal learning. In addition, the uploaded data might serve as trigger to increase efforts if one school performs particularly good in one area A (mobility) while performing bad in another area B (nutrition). In that case, comparison possibly induces competition which in turn improves the overall climate change mitigation efforts of all participating schools. To this end, it would be advisable to facilitate comparison through an online tool which automatically mirrors the emissions of different schools for different sectors. After completion of the CO2 balances, discussions can take place in the schools about the areas in which climate protection measures can be taken to reduce the CO2 footprint. For example, many schools underestimated how high the CO2 emissions are for school trips if airplanes are used for this purpose. The carbon footprint is the first step to plan climate protection measures in a targeted way and it is a good instrument to quantify the effect of implemented measures and thus function as a feedback loop that helps to motivate for further climate protection activities.
The subject of further research could also be to determine the multiplier effect. The main question here is whether the students use the knowledge gained to encourage climate-friendly behavior and investments in climate protection in their families as well. Only then can we speak of substantial changes towards significant climate protection within the society as a whole.
While the testing at various other schools in Germany is still underway, prospective research could focus on the question whether the data assessed qualify for comparative analysis of different school-based climate protection approaches within Germany and beyond. Accordingly, it is recommended to attentively follow the development of other tools around the world, compare them and make adjustments (i.e., adjusting the emission factors) wherever necessary—based on the findings. To this end, the project team considers developing a tool which can be applied throughout Europe to enable comparison between schools of different European/EU countries.
Finally, the best tools and approaches only serve little as long as funding is limited to short-term projects lasting no longer than two to three years. In order to make substantial progress long-term perspectives are needed. It enables schools to regularly check on their improvements. Long-term financing also allows continuous improvement of the tool itself, such as the tool’s adaptation to an online application, which guides the users step by step through the assessment.
6. Conclusions
The CO2-assessment tool presented here allows students to calculate and assess the CF of their school by themselves instead of letting it be done by professionals which can be considered a valuable contribution to citizen science. Given the direct involvement of students in the process of data assessment, they are able to learn from a true-to-life example, for what and how much CO2 is emitted, enabling them to “explore the nature of the problem themselves” [19]. This in turn is likely to stimulate reflections upon the main sources of GHG at their school, including their individual behavior and can eventually lead to collective discussions and debate about appropriate measures to be taken.
The instructions of the tool combined with the appealing and user-friendly interface empower students and teachers alike to handle the CF. Not only does this allow us to better understand which part of the school life is particularly harmful for the climate. It also enables the students and teachers to follow up the development of the school’s CF and by that obtain the necessary feedback that encourages further actions [26].
The summary of the school’s emissions has two important advantages: It shows which area produces most GHG emissions while also calculating the CF per student. The latter mainly enables a comparison of schools among each other and helps the students to directly identify with the problem issue. Through the assessment the students can easily grasp the reduction potential at their schools. The comparison with other schools can be an additional incentive to improve in climate protection. Moreover, when comparing with other schools, they can see at what point their own school already performs well.
It could also be interesting to further investigate whether the identification of the students with the school corelate depending on the distance the students commute to school. In case of pilot school 4 the students live within a radius of 3.6 km. This suggests that the direct environment of the school is also part of their environment apart from school life. This in turn potentially evokes a stronger desire to contribute to the transformation of the environment rather than for a school that is located 10–20 km apart from one’s one house.
Given the user-friendliness of the tool, it could motivate other schools, in Germany and beyond, to assess their own CF and by that multiply the suggested effect of increasing climate protection efforts in schools, municipalities or even businesses. For instance, more and more companies assess their carbon footprint and formulate targets to reduce the emissions, for example, to become climate neutral by a certain time. In this regard, students can use the knowledge about carbon assessment and transfer it on to other areas. Not only for future professions, but also to interpret and analyze the data (e.g., from one’s own company), the knowledge about carbon footprints can be further used.
To further examine the tool’s potential to stimulate self-efficacy among students the continuation of the project needs to be followed closely. To find out whether the tool is also used and adopted independently without intervention by the researchers, the project will be continued for another two years. Then it will also be possible to determine whether the students actively make use of the tool to identify progress the schools have made due to climate protection measures implemented.
The first results of the project are very promising and encourage to also investigate the aspect of citizen science in the future. It is believed that the development of school climate protection concepts fits very well with this concept. The project team shares the view that public involvement can drive energy research and development quite significantly by producing results that are more in line with society’s views and demands [48]. In the case of the Schools4Future project, the stakeholders consist of students and teachers from the schools, who were able to carry out important research tasks by contributing their own skills. They have carried out their own measurements, researched various options for action and improvement, analyzed data and published these in their own school climate protection concepts.
Author Contributions
Conceptualization, O.W., L.T.; methodology, S.A.-S.; software, S.A.-S.; validation, S.A.-S., L.T., L.N. and O.W.; writing—original draft preparation, O.W., L.T., L.N. and S.A.-S.; visualization, S.A.-S., L.N. and O.W.; supervision, O.W.; project administration, O.W. and S.A.-S.; funding acquisition, O.W. and S.A.-S. All authors have read and agreed to the published version of the manuscript.
Funding
This research was conducted as part of the Schools4Future project, which is supported by the German Federal Ministry for Economic Affairs and Energy under grant no. 03EI5211. The responsibility for the contents lies solely with the authors.
Data Availability Statement
The Excel tool is available free of charge for non-commercial use either directly from the authors or as download from the project webpage schools4future.de. We encourage the translation and adaptation of the tool for specific requirements in other countries.
Acknowledgments
The authors would like to thank the participating schools. The great commitment of the students and teachers of the schools participating in our project has contributed significantly to the success of the project and the further development of the tool. We would like to express our particular thanks to the four pilot-schools of which we discussed the finalized CF assessment, namely: Realschule am Giersberg Kirchzarten, Freie Waldorfschule St. Georgen Freiburg, Erich-Fried-Gesamtschule Wuppertal-Ronsdorf, Else-Lasker-Schüler Gesamtschule Wuppertal-Elberfeld. We would also like to thank all our colleagues in the Schools4Future project. In particular, we would like to mention: Dieter Seifried, Kurt Berlo and Jana Rasch. Finally, we would like to mention the commitment of our students and interns, who also deserve thanks: Amelie Strassen, Amelie Vogler and Luisa Bischoff.
Conflicts of Interest
The authors declare no conflict of interest.
References
- Jones, C.M.; Kammen, D.M. Quantifying Carbon Footprint Reduction Opportunities for U.S. Households and Communities. Environ. Sci. Technol. 2011, 45, 4088–4095. [Google Scholar] [CrossRef]
- Jurić, Ž.; Ljubas, D. Comparative Assessment of Carbon Footprints of Selected Organizations: The Application of the Enhanced Bilan Carbone Model. Sustainability 2020, 12, 9618. [Google Scholar] [CrossRef]
- Mugnier, E.; Mairet, A.; Boucher, J. European Commission. Product Carbon Footprint—A Study on Methodologies and Initiatives; European Commission: Brussels, Belgium, 2010. [Google Scholar]
- World Business Council for Sustainable Development; World Resources Institute. A Corporate Accounting and Reporting Standard; World Resources Institute: Washington, DC, USA, 2004. [Google Scholar]
- Fong, W.K.; Sotos, M.; Doust, M.; Schultz, S.; Marques, A.; Deng-Beck, C. Global Protocol for Community-Scale Greenhouse Gas Emission Inventories. An Accounting and Reporting Standard for Cities; World Resources Institute: Washington, DC, USA, 2015. [Google Scholar]
- Federal Environmental Agency. CO2 Calculator of the Federal Environment Agency (in German: CO2-Rechner Des Umweltbundesamtes). Available online: https://uba.co2-rechner.de/de_DE/ (accessed on 20 October 2021).
- Minx, J.C.; Wiedmann, T.; Wood, R.; Peters, G.P.; Lenzen, M.; Owen, A.; Scott, K.; Barrett, J.; Hubacek, K.; Baiocchi, G.; et al. Input-Output Analysis and Carbon Footprinting: An Overview of Applications. Econ. Syst. Res. 2009, 21, 187–216. [Google Scholar] [CrossRef]
- Berlo, K.; Wagner, O.; Heenen, M. The Incumbents’ Conservation Strategies in the German Energy Regime as an Impediment to Re-Municipalization—An Analysis Guided by the Multi-Level Perspective. Sustainability 2016, 9, 53. [Google Scholar] [CrossRef] [Green Version]
- Wagner, O.; Berlo, K. Remunicipalisation and Foundation of Municipal Utilities in the German Energy Sector: Details about Newly Established Enterprises. J. Sustain. Dev. Energy Water Environ. Syst. 2017, 5, 396–407. [Google Scholar] [CrossRef] [Green Version]
- Kona, A.; Bertoldi, P.; Kılkış, Ş. Covenant of Mayors: Local Energy Generation, Methodology, Policies and Good Practice Examples. Energies 2019, 12, 985. [Google Scholar] [CrossRef] [Green Version]
- Wagner, O.; Venjakob, M.; Schröder, J. The Growing Impact of Decentralised Actors in Power Generation: A Comparative Analysis of the Energy Transition in Germany and Japan. J. Sustain. Dev. Energy Water Environ. Syst. 2021, 9, 1080334. [Google Scholar] [CrossRef]
- Wagner, O.; Tholen, L.; Jansen, U. Municipality in its role as a model and role model (in German: Kommune in ihrer Vor- und Leitbildfunktion). In Die Kommunale Klimaschutzpraxis: Städte und Gemeinden Gestalten den Wandel; Wagner, O., Ed.; WEKA Media: Kissing, Germany, 2020; pp. 159–203. ISBN 978-3-81115-112-3. [Google Scholar]
- Diekelmann, P.; Deutsches Institut für Urbanistik, Institut für Energie- und Umweltforschung, Klima-Bündnis Europäischer Städte mit den Indigenen Völkern der Regenwälder zum Erhalt der Erdatmosphäre (Eds.) Climate Protection in Municipalities: Practical Guide (in German: Klimaschutz in Kommunen: Praxisleitfaden); Service & Kompetenzzentrum Kommunaler Klimaschutz, SK:KK, 3. Aktualisierte und Erweiterte Auflage; Deutsches Institut für Urbanistik gGmbH: Berlin, Germany, 2018; ISBN 978-3-88118-585-1. [Google Scholar]
- Thema, J.; Suerkemper, F.; Couder, J.; Mzavanadze, N.; Chatterjee, S.; Teubler, J.; Thomas, S.; Ürge-Vorsatz, D.; Hansen, M.B.; Bouzarovski, S.; et al. The Multiple Benefits of the 2030 EU Energy Efficiency Potential. Energies 2019, 12, 2798. [Google Scholar] [CrossRef] [Green Version]
- Kallert, A.; Belina, B.; Miessner, M.; Naumann, M. The Cultural Political Economy of Rural Governance: Regional Development in Hesse (Germany). J. Rural. Stud. 2021, 87, 327–337. [Google Scholar] [CrossRef]
- Deutscher Städtetag (Ed.) Educational Policy Positions Discussion Paper of the German Association of Cities. Position Paper of the German Association of Cities—Adopted by the Presidium on 28 September 2021 in Heidelberg (In German: “Bildungspolitische Positionen Diskussionspapier des Deutschen Städtetages. Positionspapier Des Deutschen Städtetages—Beschlossen Vom Präsidium Am 28. September 2021 in Heidelberg”); German Association of Cities: Berlin/Cologne, Germany, 2021; ISBN 978-3-88082-362-4. [Google Scholar]
- Schnack, J.; Zankel, S. (Eds.) Climate Protection in Schools (in German: Klimaschutz in der Schule); Pädagogik; Verlagsgruppe Beltz: Weinheim, Germany, 2021; ISBN 978-3-407-47058-4. [Google Scholar]
- National Climate Protection Initiative of the Federal Environment Ministry Climate Protection in Schools: Federal Environment Ministry Supports Day-Care Centres and Schools with Funding via the Municipal Guideline. Available online: https://www.klimaschutz.de/service/meldung/klimaschutz-macht-schule-bmu-unterst%C3%BCtzt-kitas-und-schulen-mit-f%C3%B6rdermitteln (accessed on 20 October 2021).
- Deisenrieder, V.; Kubisch, S.; Keller, L.; Stötter, J. Bridging the Action Gap by Democratizing Climate Change Education—The Case of k.i.d.Z.21 in the Context of Fridays for Future. Sustainability 2020, 12, 1748. [Google Scholar] [CrossRef] [Green Version]
- Heald, S. Climate Silence, Moral Disengagement, and Self-Efficacy: How Albert Bandura’s Theories Inform Our Climate-Change Predicament. Environ. Sci. Policy Sustain. Dev. 2017, 59, 4–15. [Google Scholar] [CrossRef]
- Bandura, A. Social Foundations of Thought and Action: A Social Cognitive Theory; Prentice-Hall Series in Social Learning Theory; Prentice-Hall: Englewood Cliffs, NJ, USA, 1986; ISBN 978-0-13-815614-5. [Google Scholar]
- Hamann, K.; Baumann, A.; Löschinger, D. Psychology in Environmental Protection: Handbook for Promoting Sustainable Action (in German: Psychologie im Umweltschutz: Handbuch zur Förderung nachhaltigen Handelns); Oekom: München, Germany, 2016; ISBN 978-3-86581-799-0. [Google Scholar]
- Hilfert-Rüppell, D.; Meier, M.; Horn, D.; Höner, K. Professional Knowledge and Self-Efficacy Expectations of Pre-Service Teachers Regarding Scientific Reasoning and Diagnostics. Educ. Sci. 2021, 11, 629. [Google Scholar] [CrossRef]
- Maran, D.A.; Begotti, T. Media Exposure to Climate Change, Anxiety, and Efficacy Beliefs in a Sample of Italian University Students. Int. J. Environ. Res. Public Health 2021, 18, 9358. [Google Scholar] [CrossRef]
- Janmaimool, P.; Chontanawat, J. Do University Students Base Decisions to Engage in Sustainable Energy Behaviors on Affective or Cognitive Attitudes? Sustainability 2021, 13, 10883. [Google Scholar] [CrossRef]
- Brahm, T.; Euler, D. Resilience Promotion as a Contribution to Personality Development in the Transition to Training and Work (in German: Resilienzförderung Als Beitrag Zur Persönlichkeitsentwicklung Im Übergang in Ausbildung Und Beruf). BWP 2013, 24, 19. [Google Scholar]
- Padgett, J.P.; Steinemann, A.C.; Clarke, J.H.; Vandenbergh, M.P. A Comparison of Carbon Calculators. Environ. Impact Assess. Rev. 2008, 28, 106–115. [Google Scholar] [CrossRef]
- Kenny, T.; Gray, N.F. Comparative Performance of Six Carbon Footprint Models for Use in Ireland. Environ. Impact Assess. Rev. 2009, 29, 1–6. [Google Scholar] [CrossRef]
- Lizana, J.; Serrano-Jimenez, A.; Ortiz, C.; Becerra, J.A.; Chacartegui, R. Energy Assessment Method towards Low-Carbon Energy Schools. Energy 2018, 159, 310–326. [Google Scholar] [CrossRef]
- Fifty Fifty—Energy Savings in Schools (in German: Energiesparen an Schulen). Available online: https://www.fifty-fifty.eu/ (accessed on 20 October 2021).
- Landesinstitut Hamburg. Practical Guide for Climate Protection in Schools (in German: Praxisleitfaden Für Klimaschutz an Schulen); Landesinstitut Hamburg: Hamburg, Germany, 2012. [Google Scholar]
- Gamarra, A.R.; Herrera, I.; Lechón, Y. Assessing Sustainability Performance in the Educational Sector. A High School Case Study. Sci. Total Environ. 2019, 692, 465–478. [Google Scholar] [CrossRef]
- Gamarra, A.R.; Lago, C.; Herrera-Orozco, I.; Lechón, Y.; Almeida, S.M.; Lage, J.; Silva, F. Low-Carbon Economy in Schools: Environmental Footprint and Associated Externalities of Five Schools in Southwestern Europe. Energies 2021, 14, 6238. [Google Scholar] [CrossRef]
- Dias Pereira, L.; Raimondo, D.; Corgnati, S.P.; Gameiro da Silva, M. Energy Consumption in Schools—A Review Paper. Renew. Sustain. Energy Rev. 2014, 40, 911–922. [Google Scholar] [CrossRef]
- Greenpeace. Schools For Earth Schools and Their Students on the Path towards Climate Neutrality and Sustainability (in German: Schulen Machen Sich Gemeinsam Mit Schüler:Innen Auf Den Weg Richtung Klimaneutralität Und Nachhaltigkeit). Available online: https://www.greenpeace.de/schoolsforearth (accessed on 14 November 2021).
- Universität für Bodenkultur Wien; Alpen-Adria Universität; Umweltbundesamt; Ecoinvent Centre. User Manual. Open Source Tool for Accounting Greenhouse Gas Emissions at Educational Institutions (In German: Benutzerhandbuch. Open Source Tool zur Bilanzierung von Treibhausgasemissionenan Bildungseinrichtungen); Universität für Bodenkultur Wien: Wien, Austria, 2017. [Google Scholar]
- Yañez, P.; Sinha, A.; Vásquez, M. Carbon Footprint Estimation in a University Campus: Evaluation and Insights. Sustainability 2020, 12, 181. [Google Scholar] [CrossRef] [Green Version]
- Larsen, H.N.; Pettersen, J.; Solli, C.; Hertwich, E.G. Investigating the Carbon Footprint of a University—The Case of NTNU. J. Clean. Prod. 2013, 48, 39–47. [Google Scholar] [CrossRef]
- Pérez-Neira, D.; Rodríguez-Fernández, M.P.; Hidalgo-González, C. The Greenhouse Gas Mitigation Potential of University Commuting: A Case Study of the University of León (Spain). J. Transp. Geogr. 2020, 82, 102550. [Google Scholar] [CrossRef]
- Vásquez, L.; Iriarte, A.; Almeida, M.; Villalobos, P. Evaluation of Greenhouse Gas Emissions and Proposals for Their Reduction at a University Campus in Chile. J. Clean. Prod. 2015, 108, 924–930. [Google Scholar] [CrossRef]
- Fritsche, U. Final Energy-Related Total Emissions for Greenhouse Gases from Fossil Fuels, Including Supply Chains (in German: Endenergiebezogene Gesamtemissionen Für Treibhausgase Aus Fossilen Energieträgern Unter Einbeziehung Der Bereitstellungsvorketten); Öko-Institut: Darmstadt, Germany, 2007. [Google Scholar]
- Öko-Institut. Greenhouse Gas Emissions from Food Production and Distribution—Working Paper (in German: Treibhausgasemissionen Durch Erzeuger Und Verabreitung von Lebensmitteln—Arbeitspapier); Öko-Institut: Darmstadt, Germany, 2007. [Google Scholar]
- Federal Environmental Agency. Development of Specific Carbon Dioxide Emissions of the German Electricity Mix in the Years 1990–2019 (in German: Entwicklung Der Spezifischen Kohlendioxid-Emissionen Des Deutschen Strommix in Den Jahren 1990–2019); Climate Change 13/2020; Umweltbundesamt: Dessau-Roßlau, 2020. [Google Scholar]
- Schallaböck, K.O.; Carpantier, R. Environmental Research for Passenger Cars and Light Commercial Vehicles: Selection of Comparison Vehicles (in German: Umweltbegleitforschung Für PKW Und Leichte Nutzfahrzeuge: Auswahl Der Vergleichsfahrzeuge); Wuppertal Institut: Wuppertal, Germany, 2012. [Google Scholar]
- Gromke, U.; Detzel, A. Ecological Comparison of Office Papers Depending on Fiber Raw Material (in German: Ökologischer Vergleich von Büropapieren in Abhängigkeit Vom Faserrohstoff); IFEU Heidelberg: Heidelberg, Germany, 2006. [Google Scholar]
- Reinhardt, G.; Gärtner, S.; Wagner, T. Ökologische Fußabdruücke von Lebensmitteln Und Gerichten in Deutschland; IFEU—Institut für Energie- und Umweltforschung: Heidelberg, Germany, 2020. [Google Scholar]
- Federal Environmental Agency. Comparison of the Average Emissions of Individual Means of Passenger Transport in Germany—Reference Year 201 (in German: Vergleich Der Durchschnittlichen Emissionen Einzelner Verkehrsmittel Im Personenverkehr in Deutschland—Bezugsjahr 2019). Available online: https://www.umweltbundesamt.de/bild/vergleich-der-durchschnittlichen-emissionen-0 (accessed on 16 December 2021).
- Jellema, J.; Mulder, H. Public Engagement in Energy Research. Energies 2016, 9, 125. [Google Scholar] [CrossRef] [Green Version]
Publisher’s Note: MDPI stays neutral with regard to jurisdictional claims in published maps and institutional affiliations. |
© 2021 by the authors. Licensee MDPI, Basel, Switzerland. This article is an open access article distributed under the terms and conditions of the Creative Commons Attribution (CC BY) license (https://creativecommons.org/licenses/by/4.0/).