Abstract
Fabrication tolerances, as well as uncertainties of other kinds, e.g., concerning material parameters or operating conditions, are detrimental to the performance of microwave circuits. Mitigating their impact requires accounting for possible parameter deviations already at the design stage. This involves optimization of appropriately defined statistical figures of merit such as yield. Although important, robust (or tolerance-aware) design is an intricate endeavor because manufacturing inaccuracies are normally described using probability distributions, and their quantification has to be based on statistical analysis. The major bottleneck here is high computational cost: for reliability reasons, miniaturized microwave components are evaluated using full-wave electromagnetic (EM) models, whereas conventionally utilized analysis methods (e.g., Monte Carlo simulation) are associated with massive circuit evaluations. A practical approach that allows for circumventing the aforementioned obstacles offers surrogate modeling techniques, which have been a dominant trend over the recent years. Notwithstanding, a construction of accurate metamodels may require considerable computational investments, especially for higher-dimensional cases. This paper brings in a novel design-centering approach, which assembles forward surrogates founded at the level of response features and trust-region framework for direct optimization of the system yield. Formulating the problem with the use of characteristic points of the system response alleviates the issues related to response nonlinearities. At the same time, as the surrogate is a linear regression model, a rapid yield estimation is possible through numerical integration of the input probability distributions. As a result, expenditures related to design centering equal merely few dozens of EM analyses. The introduced technique is demonstrated using three microstrip couplers. It is compared to recently reported techniques, and its reliability is corroborated using EM-based Monte Carlo analysis.
1. Introduction
Microwave design workflows, including optimization procedures, are most often concerned with nominal designs, where possible uncertainties of geometry and material parameters are not accounted for. At the same time, fabrication tolerances, incomplete knowledge of material characteristics (e.g., dielectric permittivity of the substrate) or operating conditions (temperature, geometrical distortions, input signal power), might all alter the electrical performance parameters of the system [1,2]. Fabrication tolerances result from from manufacturing inaccuracies (e.g., chemical etching in the case of microstrip components), and its quantification can be performed using probability distribution, e.g., uniform or Gaussian, with a given maximum deviation or variance, respectively. Tolerance-based parameter deviations may hamper fulfilling the assumed performance specifications by the system under design. Therefore, the assessment of their effects on the circuit characteristics is of practical importance. The same can be said about making the design more robust, which involves a reduction of appropriately defined statistical figures of merit [3]. Because microwave design tasks are often formulated using minimax type of specifications (e.g., lower or upper bounds for return loss, transmission, power split, etc., over certain frequency ranges), the most appropriate metric is a yield [4]. The second type of the aforementioned uncertainties (often referred to as epistemic ones [5]) is normally tackled by making sure that the system works properly for the assumed range of operating conditions (e.g., the temperature, input signal power) [6].
Quantification of uncertainties is associated with statistical analysis [7], which—when carried out directly using electromagnetic (EM) simulation models—is impractically expensive. For example, estimation of the yield using Monte Carlo simulation typically requires hundreds of circuit evaluations because the process is slowly convergent [8]. On the other hand, utilization of EM analysis is mandatory for reliability reasons. This is particularly the case for miniaturized devices featuring strong EM cross-couplings (e.g., due to transmission line folding [9] or incorporation of compact microstrip cells [10]). For such circuits, equivalent network or analytical models are simply too inaccurate. Acceleration of uncertainty quantification procedures can be accomplished in various ways, including simplification of the problem. A representative example is worst-case analysis [11], which is, however, of limited accuracy (i.e., leading to pessimistic estimations of the circuit performance). Undeniably, the most widespread approaches today are surrogate-assisted methods, where statistical analysis or yield optimization are carried out using a fast replacement model (e.g., neural networks [12], response surface approximation [13], polynomial chaos expansion, PCE [14,15,16]). A practical limitation is the dimensionality of the parameter space, i.e., the number of training data samples (translating into a computational cost of its acquisition) required for a construction of a reliable surrogate quickly increases with the number of the circuit parameters (also called the curse of dimensionality [17]). Available mitigation techniques include diminishing a number of directly handled dimensions [18], the usage of advanced modeling techniques (e.g., PC kriging, in which traditional trend functions, such as polynomials of low order, are substituted with PCE [19]), incorporation of model order reduction [20], as well as variable-resolution methods (co-kriging [21], space mapping [22]).
Understanding (and being able to quantify) how uncertainties affect the electrical characteristics, and the performance of circuits, is important, yet making the designs immune to tolerances is even more crucial. Increasing the likelihood of satisfying specifications under parameter deviations is known as robust design, yield-driven design, design centering or tolerance-aware design [23,24,25]. Its practical realization requires maximization of relevant statistical performance metrics (e.g., yield). Alternatively, in design centering, the aim is to allocate the design as much as possible in the center of the feasible region (i.e., possibly away from the feasible region boundary). Because evaluation of the performance metric (e.g., yield) has to be executed at all stages of the robust design process, its computational cost is substantial. As a matter of fact, straightforward EM-driven yield optimization is normally prohibitive. Utilization of surrogate modeling techniques is a practical workaround [26,27,28], with neural networks [29], polynomial chaos expansion [30,31], and space mapping [32] being the most popular approaches. Here also, the bottleneck is an expected high cost of surrogate model construction, especially that the domain of the model is larger due to expected design relocation across the optimization path. Sequential approximate optimization (SAO) [33] can be used to mitigate this problem by creating a sequence of surrogates rendered over smaller domains, which are moved along the optimization path. Although the model has to be constructed repeatedly, the cost of acquiring training data within each domain is significantly lower than in the larger one. Yet another approach is utilization of response feature technology [34]. Here, the surrogate only models the coordinates of apposite characteristic points of the system responses (the ones that permit assessment of satisfying/violating, given design specs). Since characteristic points are in nearly linear relationship with the circuit dimensions, the metamodel can be obtained using sparse training data sets [35].
Here, we propose a novel framework for expedited design centering of microwave components. Our methodology employs forward surrogate models constructed at the level of response features corresponding to the performance figures of interest (bandwidth, power split ratio), as well as trust-region framework for direct maximization of the surrogate-estimated circuit yield. Reformulating the uncertainty quantification task in the context of response features mitigates the dimensionality and nonlinearity-related issues. Furthermore, as the surrogate itself is a linear regression model, numerical evaluation of the yield is straightforward and fast through numerical integration of the input probability distributions. The presented technique has been demonstrated using three microstrip couplers, two single- and a dual-band one. For all structures, the cost of design centering was remarkably low, below forty EM analyses of the respective circuit, which is considerably less than for the state-of-the-art surrogate-based methods employed as benchmark. The yield estimation reliability is confirmed using direct EM-based Monte Carlo analysis.
2. Microwave Design Centering by Response Features and Trust Regions
This section formulates the introduced design centering procedure. We start by formulating the design centering task (Section 2.1), whereas Section 2.2 discusses response features in the context of microwave couplers, which are used here for demonstrating the methodology. Yield maximization using feature-based forward regression surrogates and trust regions is described in Section 2.3. Numerical verification of the framework involving three microstrip couplers will be provided in the next section.
2.1. Formulation of Design Centering Problem
For the sake of illustration, this work focuses on compact microstrip couplers, where effects of the manufacturing tolerances are primarily visible through alterations of the power split ratios as well as the shifts of the operating frequencies. The goal of design centering is to increase the likelihood that the specs will be fulfilled given the tolerances. The specifications are formulated here for a general case of multi-band coupler, where x refers to a vector of designable parameters, fL.k and fR.k stand for the lower and upper ends of the kth operating band, k = 1, …, N, whereas Dk are maximum allowed power split errors for the kth operating frequency f0.k = [fR.k − fL.k]/2, with Sk being the respective target power split ratios. The circuit at the design x is said to satisfy the specifications if
For simplicity of notation, whenever |Sj1(x,f)| is used, it is understood as dB-valued entity. In particular, the left-hand sides of Equations (1)–(3) contain logarithms of the respective circuit responses, whereas the entities of the right-hand sides of the said equations (i.e., the threshold Smax, and the power split error Dk) are also expressed in dB. Here, Smax is the acceptance threshold for the matching and isolation characteristics, e.g., Smax = −20 dB. The scattering parameters in (1)–(3) are marked as explicitly dependent on parameters x and frequency f. If the aforementioned conditions are satisfied, the circuit features a sufficient bandwidth (at the Smax level) and realizes a required power split (within the assumed tolerances Dk) at all operating frequencies simultaneously.
In the following, x(0) refers to the nominal design. It is a design obtained without accounting for manufacturing tolerances, so that the circuit matching |S11| and isolation |S41| are improved as much as possible within the target frequency ranges, while maintaining the required power split ratios. This design can be found by solving the constrained minimax task of the form
with equality constraints
In practice, the constraints can be handled using a penalty function approach because they are expensive to evaluate [36]. The solution of (4), (5) features the best achievable matching and isolation in the frequency bands of interest as well as target power split ratios at the respective centre frequencies.
For the purpose of design centering, we will denote by dx the vector of parameter deviations from nominal values, resulting from fabrication tolerances characterized by probability distributions, specific to a given manufacturing technology, e.g., joint Gaussian G (0,σ), or uniform of maximum deviation dmax. As mentioned before, one of the most popular statistical performance metrics is yield Y [37], described as
In (6), p(x,x(0)) stands for a joint probability density function describing statistical variations of the design x w.r.t. the nominal design x(0). Further, Xf is the feasible space, i.e., the set of designs conforming to the assumed performance requirements (e.g., in the form of (1)–(3) for the case of a multi-band coupler). Evaluation of the yield requires numerical integration of (6), which, in practice, can be realized using Monte Carlo simulation. Therein, Y is estimated as
where dx(k), k = 1, …, Nr, are random deviation vectors following the probability distribution p(.). The function H(x) in (7) is defined to assume a value of one if the condition (1)–(3) is satisfied; otherwise, H(x) is set to zero. Having (7), the maximum-yield design is defined as
Note that optimization of the yield requires evaluation of (7) throughout the process, which is a computationally expensive task. As mentioned in Section 1, it is often accelerated using surrogate modeling techniques, where Y is estimated using a fast replacement model of EM-simulated system characteristics. At the same time, construction of the surrogate may be an expensive procedure by itself, in particular, for higher-dimensional parameter spaces. Here, we use feature-based surrogates (cf. Section 2.2), which allow for reliable estimation of yield using only a handful of data samples.
2.2. Design Specifications Verification Using Response Features
In this work, design centering is realized as an iterative process. The underlying algorithm is gradient search [38], in which estimation of the yield is realized using forward surrogate models established at the level of appositely appointed response features. Figure 1 shows responses of an exemplary microwave circuit with the response features defined to account for the design specifications formulated in (1)–(3).
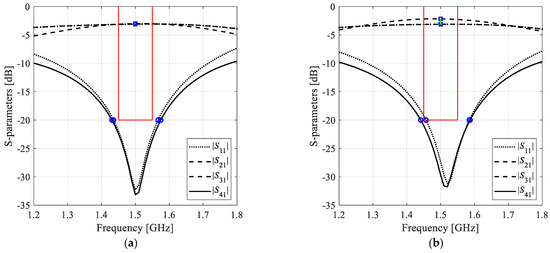
Figure 1.
Scattering parameters of an exemplary microwave coupler along with the response features corresponding to –20 dB level of matching (|S11|) and isolation (|S41|) characteristics (o) and transmission (|S21|, |S31|) at the target operating frequency of 1.5 GHz (□). The feature points allow for determining satisfaction of the performance requirements (here, the matching/isolation bandwidth of 1.45 GHz to 1.55 GHz, and maximum power split error of 0.5 dB at 1.5 GHz): (a) design satisfying specifications, (b) design violating both bandwidth and power split requirements.
It can be observed that for certain points, specifically those corresponding to −20 dB levels of matching and isolation response, we are only interested in the frequency coordinates, whereas for others (here, those corresponding to transmission responses) we only need the level coordinates. The aggregated feature vector can be therefore written as
where f1 and f2 are the frequencies corresponding to –20 dB level of |S11|, f3 and f4 are the frequencies corresponding to −20 dB level of |S41|, and l1 and l2 are the levels of |S21| and |S31|, respectively, at the target operating frequency of the coupler. For a multi-band coupler, we will have
where the second subscript indicates the operating band (from 1 to N). Clearly, a particular definition of the vector P depends on the design specifications. The feature points themselves are readily derived from EM-simulated circuit characteristics.
Using the feature vector P, the design specification conditions (1)–(3) can be reformulated as
The primary advantage of working at the level of response features rather than the entire circuit responses is weakly-nonlinear dependence of the feature points on geometry parameters of the system, which allows for constructing accurate surrogates using smaller training data sets. In the case of design centering, this would translate into improved reliability of the optimization process as well as its computational efficiency.
2.3. Design Centering by Means of Feature-Based Surrogates and Trust Regions
The proposed design centering procedure solves the yield maximization problem (8) using a trust-region (TR)-based algorithm that renders approximations x(i), i = 0, 1, …, to x* [38]. In each iteration, the new approximation x(i+1) is obtained by solving
where the predicted yield YP is obtained from the conditions (11)–(13) evaluated using the auxiliary linear regression model L(i) of the feature vector P(x)
in which the Jacobian matrix JP is defined as
The partial derivatives in (16) can be computed based on the sensitivities of the circuit S-parameters which, in turn, are obtained using finite differentiation at the cost of n additional EM simulations of the circuit under optimization (n being the number of independent parameters). The vector x(i+1) is accepted if the gain ratio, computed as r = [YP#(x(i+1)) − YP(x(i))]/[YP(x(i+1)) −YP(x(i))], is positive. Here, YP# is computed using a linear model similar to (15) but with P(x(i)) replaced by P(x(i+1)) extracted from EM-simulated circuit response at x(i+1). It should be noted that the employment of YP# is a computationally efficient way of validating the candidate design (at the cost of only one EM analysis of the circuit at hand), and it assumes that the feature point sensitivities do not alter considerably while relocating the design from x(i) to x(i+1). This assumption is reasonable as the expected relocations are small in the norm sense (i.e., ||x(i+1) − x(i)||), more specifically, comparable to dmax. The trust region size is updated after each iteration using standard rules [38], i.e., the TR region size is increased if the gain ratio is sufficiently large (e.g., r > 0.75), and decreased if it is too small (e.g., r < 0.25). Additionally, as previously mentioned, the candidate design is only accepted if the gain ratio r > 0. If this is not the case, the iteration is repeated with a reduced trust region.
Estimation of the yield using the feature-based regression model L(i) is carried out through Monte Carlo integration [39] of (6). It is arranged using a large number of random samples (in our numerical experiments, 100,000) generated according to the joint probability distribution p(). For each sample xr, the regression model response L(i)(xr) is tested against the conditions (11)–(13). The process is vectorized to ensure rapid evaluation of (6) (a typical evaluation time is 40 ms in Matlab, which is negligible compared to EM simulation time of the circuit). At the same time, using a large random set leads to a very small variance of yield estimation (less than 0.1%).
2.4. Complete Algorithm
Figure 2 shows the flow diagram of the proposed design centering procedure. The input parameter is the nominal design x(0). In the first two steps, the EM analysis of the circuit is performed along with estimation of its response sensitivities, followed by extraction of the feature vectors and construction of the feature-based regression model. The latter is then applied to render a candidate design x(i+1), which is accepted if it leads to a positive gain ratio. At the same time, the trust region size is adjusted as well. Termination condition is based on convergence in argument ||x(i+1) − x(i)|| < ε or shrinking the trust region size beyond the termination threshold d(i+1) < ε. In the numerical experiments of Section 3, we use ε = 10−3.
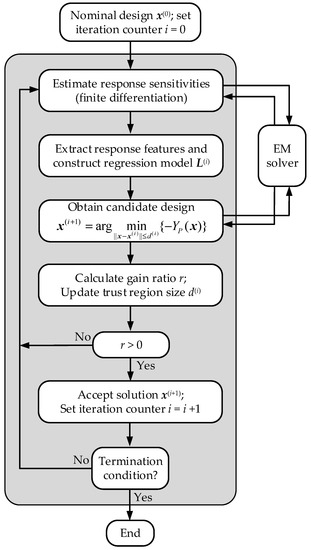
Figure 2.
Operating flow of the proposed design centering algorithm.
3. Numerical Verification
This section provides numerical verification of the proposed design centering procedure using three examples of microstrip couplers, including two single-band structures, and a dual-band one. The computational efficiency of our technique is compared to several surrogate-based yield optimization methods. Furthermore, direct EM-based Monte Carlo analysis is employed to validate reliability of yield estimation using feature-based regression model at both the nominal and optimized designs.
3.1. Case Studies
The proposed design centering procedure is validated using three microstrip circuits, a compact rat-race coupler, RRC (Circuit I) [40] shown in Figure 3a, a miniaturized branch-line coupler, BLC (Circuit II) [41] shown in Figure 3b, and a dual-band branch-line coupler (Circuit III) [42], shown in Figure 3c. The relevant information concerning the three structures, including the substrate parameters, geometry parameters, nominal design, and performance requirements, can be found in Table 1. The EM-simulation models are implemented in CST Microwave Studio and evaluated using the time-domain solver. Design centering is carried out assuming that geometry parameter deviations follow independent Gaussian probability distribution with variance 0.017 mm with maximum deviations limited to 0.05 mm (about triple variance).
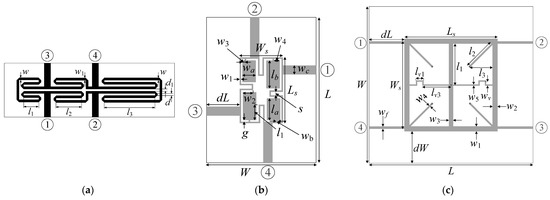
Figure 3.
Microwave structures employed for validation of the proposed design centering algorithm: (a) compact rat-race coupler (Circuit I) [40], (b) miniaturized branch-line coupler (Circuit II) [41], (c) dual-band branch-line coupler (Circuit III) [42].

Table 1.
Validation circuits.
3.2. Reference Algorithms
For the sake of benchmarking, the yield optimization results obtained using the proposed procedure are compared to those produced by several surrogate-based methods. The reference techniques are briefly characterized in the remaining part of this section.
Reference algorithm 1: This is a surrogate-assisted approach incorporating a metamodel established in a relatively large vicinity of the nominal design to enable sufficient relocation of the design during yield optimization. The problem (8) is solved using local optimization algorithm. Here, the metamodel is constructed using kriging interpolation [43], whereas the domain is defined as an interval [x(0) − d, x(0) + d]. The entries of the size vector d = [d1 … dn]T are set to dk = 10dmax, k = 1, …, n (recall that dmax is the maximum parameter deviation, which, in our experiments is 0.05 mm). This size of domain normally creates a sufficient room for design relocation in the yield maximization process. The advantage of this procedure is implementation simplicity. The drawback is a potentially high cost of training data acquisition, which is especially troublesome to structures described by larger numbers of geometry parameters.
Reference algorithm 2: This procedure adopts the sequential approximate optimization (SAO) approach [33], in which the original problem (8) is solved iteratively as
where x(i), i = 0, 1, …, are approximations to the optimum design x*. The yield estimated in the ith iteration, Ys(i), is computed based on the surrogate model established in the current domain being the interval [x(i) — dl, x(i) — dl], with x(i) = [x1(i) … xn(i)]T, i.e., the domain is always centred at the current iteration point. Because the surrogate models are constructed along the optimization path, their domains can be considerably smaller than for the first reference algorithm (here, dl = [dl.1 … dl.n]T is set to dl.k = 3dmax, k = 1, …, n).
The problem (17) is constrained to satisfy xk(i) − dl.k + dmax ≤ xk ≤ xk(i) + dl.k − dmax, k = 1, …, n, which ensures that the solution is located in the domain interior and at the distance at least dmax from its boundary. The latter allows researchers to carry out Monte Carlo simulation within the region of validity of the metamodel. The advantage of this procedure is a lower cost of setting up the surrogate as compared to the previous method. However, several iterations are normally required to approach the optimum solution.
Reference algorithm 3: This procedure incorporates the performance-drive modeling concept [44]. It relies on a single metamodel. The latter is rendered in the domain spanned by the most relevant directions within the parameter space, specifically those that affect the likelihood of satisfying the assumed design requirements in the most significant manner. The relevant directions are found through auxiliary local optimizations [45]. The principal advantage of this method is the low volume of the surrogate model domain, which is however of sufficient size wherever necessary. Consequently, the third algorithm effectively combines the advantages of the first and the second reference methods. The conceptual illustration of the metamodel domain definition can be found in Figure 4.

Figure 4.
Yield optimization using performance-driven surrogate modeling concept [45]: (a) S-parameters of a microwave coupler at the nominal design x(0), design x(1) (spoiled power split), and design x(2) (improved −20 dB bandwidth); only the selected S-parameters are shown for x(1) (|S21|, |S31|) and x(2) (|S11|, |S41|) for clarity. The designs x(1) and x(2) determine the important directions from the point of view of yield manipulation; (b) Designs x(0), x(1), and x(2) form surface S(t) parameterized by vector t = [t1 t2]T. The union of intervals SI(t) for −1 ≤ t1, t2 ≤ 1 becomes the domain XS of the surrogate model.
3.3. Results and Discussion
The numerical results obtained using the proposed design centering approach as well as the reference algorithms outlined in Section 3.2 have been gathered in Table 2 through 4 for Circuit I, II, and III, respectively. The following final (yield-optimized) designs were obtained:

Table 2.
Design centering results for Circuit I (Figure 3a).
- Circuit I: x* = [4.65 11.22 21.73 0.73 0.94 0.86]T;
- Circuit II: x* = [0.64 5.50 9.27 12.49 1.27 2.06 1.05 0.32 2.85 0.24]T;
- Circuit III: x* = [25.16 0.80 0.77 1.89 1.25 0.42 0.75 0.30 0.30]T.
The computational cost of the design centering process was very low and corresponded to only 25, 37, and 32 EM simulations of Circuit I, II, and III, respectively. It can be observed that this cost is considerably lower than that required by the reference algorithms. In particular, the average computational savings over the reference algorithm 1 are as high as 95 percent, 89 percent over the reference algorithm 2, and about 68 percent over the reference algorithm 3. The improvements in terms of computational efficiency are primarily due to the usage of response features and incorporation of a simple (here, linear) surrogate. The accuracy of the latter is a result of constructing the metamodel at the level of feature point coordinates, which, as previously mentioned, are in weakly-nonlinear relationship with the geometry parameters of the circuit (as compared to that of the entire circuit responses), which allows for constructing accurate surrogates using smaller training data sets. At the same time, as the surrogate is a linear regression model, a rapid yield estimation is possible through numerical integration of the input probability distributions. As a result, expenditures related to design centering equal merely a few dozen EM analyses. Observe also, that embedding the yield maximization process in the trust-region framework ensures convergence of the entire process.
The quality of the designs obtained using the proposed approach regarding the final yield values are similar to those produced by other methods. On the other hand, the predictions of the feature-based surrogate are comparable or better than those of the reference algorithms. This is corroborated through direct EM-driven Monte Carlo (MC) simulations at the nominal and the yield-optimized designs as indicated in Figure 5, Figure 6 and Figure 7. Limited predictive power is particularly pertinent to the reference Algorithm 1: although the surrogate models, therein, were constructed using a relatively large number of samples (400 for Circuit I and 800 for Circuits II and III), the relative RMS error of the metamodels is about 3.5% (Circuits I and II) and 6.1% (Circuit III), which is insufficient to render accurate yield estimation.
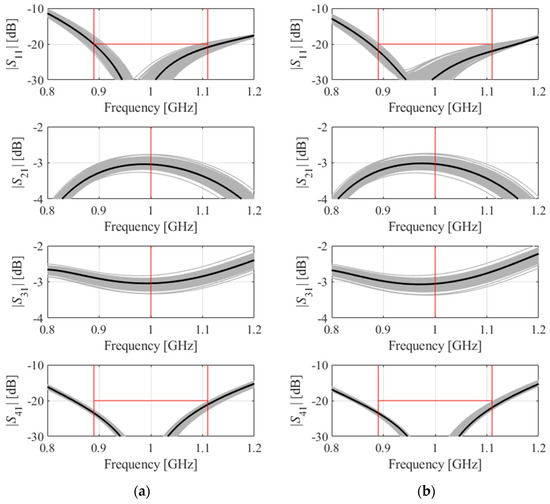
Figure 5.
EM-driven Monte Carlo simulation of Circuit I (Figure 3a) at (a) the nominal design, and (b) the final design obtained using the proposed algorithm. MC carried out using 500 random samples. EM simulation data shown as gray curves. Black plots show the circuit responses at the nominal (a) and the optimized design (b).
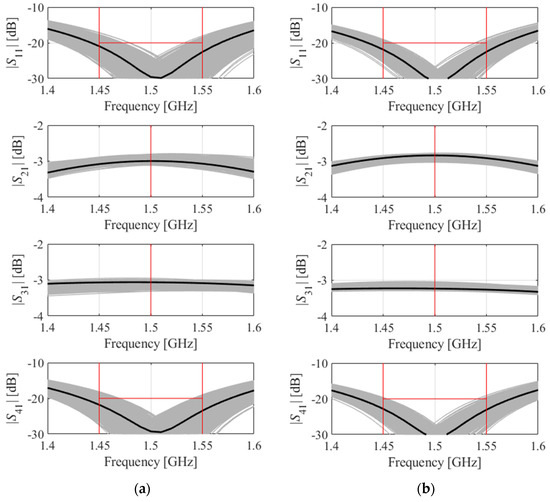
Figure 6.
EM-driven Monte Carlo simulation of Circuit II (Figure 3b) at (a) the nominal design, and (b) the final design obtained using the proposed algorithm. MC carried out using 500 random samples. EM simulation data shown as gray curves. Black plots show the circuit responses at the nominal (a) and the optimized design (b).
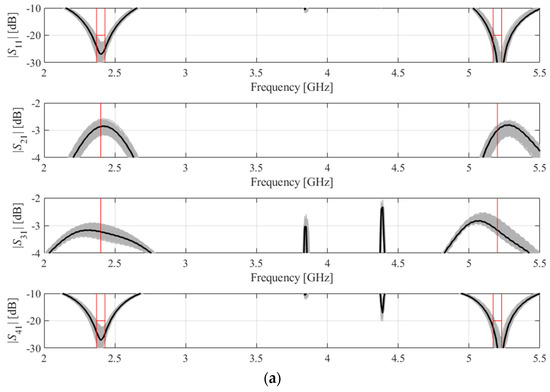
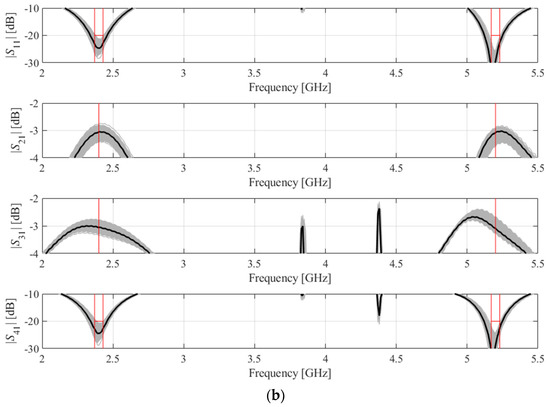
Figure 7.
EM-driven Monte Carlo simulation of Circuit III (Figure 3c) at (a) the nominal design, and (b) the final design obtained using the proposed algorithm. MC carried out using 500 random samples. EM simulation data shown as gray curves. Black plots show the circuit responses at the nominal (a) and the optimized design (b).
At the same time, it can be noticed that the accuracy of yield estimation using a feature-based surrogate is not as good as for other techniques for Circuit III. This indicates that the relationships between the geometry parameters of this circuit and response feature coordinates are more nonlinear than for other considered structures. This does lead to slightly inferior results in terms of the final yield (as confirmed by EM-driven Monte Carlo simulation), and further improvements are needed, which will be addressed in the future work. Graphical illustrations of EM-driven MC for the nominal and yield-optimized designs can be found in Table 2, Table 3 and Table 4 for Circuit I, II, and III, respectively. The analysis has been performed using 500 random samples. A comparison between the left- and the right-hand-side panels indicates a noticeable increase in the number of samples satisfying the prescribed specifications at the optimized design as compared to the nominal one.

Table 3.
Design centering results for Circuit II (Figure 3b).

Table 4.
Design centering results for Circuit III (Figure 3c).
4. Conclusions
This paper presented a novel technique for low-cost design centering of microwave components. Our methodology involves feature-based forward regression surrogates, which allow for accurate prediction of the fabrication yield under the assumed parameter deviation, as well as facilitate numerical integration of the corresponding probability density functions. The yield maximization process is embedded in the trust-region framework to ensure convergence of the process. The proposed approach has been demonstrated using three microstrip couplers, including single-band rat-race and branch-line coupler, as well as dual-band branch-line coupler. The accuracy and computational efficiency has been benchmarked against three state-of-the-art surrogate-assisted algorithms. CPU savings of up to 95 percent have been demonstrated while maintaining yield prediction reliability. In absolute terms, the cost of design centering procedure is as low as the cost of a few dozen EM analyses of the respective circuit (25 EM simulations for the compact rat-race coupler, 37 simulations for the single-band branch-line coupler, and 32 simulations for the dual-band BLC). Additional advantage of the presented approach is simple implementation. The presented design centering framework may be considered an attractive alternative to existing (especially conventional) uncertainty quantification methods, especially when rapid yield improvement is of concern. The proposed technique may be applied for EM-driven design centering of other microstrip high-frequency structures (such as antennas or filters). The example structures presented in the manuscript (i.e., the couplers and power dividers) have served merely as case studies, and were applied to demonstrate the proposed technique.
Author Contributions
Conceptualization, A.P.-D. and S.K.; methodology, A.P.-D. and S.K.; software, A.P.-D. and S.K.; validation, A.P.-D. and S.K.; formal analysis, S.K.; investigation, A.P.-D. and S.K.; resources, S.K.; data curation, A.P.-D. and S.K.; writing—original draft preparation, A.P.-D. and S.K.; writing—review and editing, S.K.; visualization, A.P.-D. and S.K.; supervision, S.K.; project administration, S.K.; funding acquisition, S.K. All authors have read and agreed to the published version of the manuscript.
Funding
This work was supported in part by the Icelandic Centre for Research (RANNIS) Grant 217771, and by National Science Centre of Poland Grant 2018/31/B/ST7/02369.
Acknowledgments
The authors thank Dassault Systemes, France, for making CST Microwave Studio available.
Conflicts of Interest
The authors declare no conflict of interest. The funders had no role in the design of the study; in the collection, analyses, or interpretation of data; in the writing of the manuscript, or in the decision to publish the results.
References
- Teberio, F.; Soto, P.; Arregui, I.; Lopetegi, T.; Cogollos, S.; Arnedo, I.; Martin-Iglesias, P.; Boria, V.E.; Laso, M.A.G. Waveguide band-pass filter with reduced sensitivity to fabrication tolerances for Q-band payloads. In Proceedings of the 2017 IEEE MTT-S International Microwave Symposium (IMS), Honolulu, HI, USA, 4–9 June 2017; pp. 1464–1467. [Google Scholar]
- Martinez-Mendoza, M.; Ernst, C.; Lorente, J.A.; Alvarez-Melcon, A.; Seyfert, F. On the relation between stored energy and fabrication tolerances in microwave filters. IEEE Trans. Microw. Theory Technol. 2012, 60, 2131–2141. [Google Scholar] [CrossRef]
- Chen, Z.; Xu, Y.; Wang, C.; Wen, Z.; Wu, Y.; Xu, R. A large-signal statistical model and yield estimation of GaN HEMTs based on response surface methodology. IEEE Microw. Wirel. Comp. Lett. 2016, 26, 690–692. [Google Scholar] [CrossRef]
- Zhang, J.; Feng, F.; Na, W.; Yan, S.; Zhang, Q. Parallel space-mapping based yield-driven EM optimization incorporating trust region algorithm and polynomial chaos expansion. IEEE Access 2019, 7, 143673–143683. [Google Scholar] [CrossRef]
- Kapse, I.; Prasad, A.K.; Roy, S. Analyzing impact of epistemic uncertainty in high-speed circuit simulation using fuzzy variables and global polynomial chaos surrogates. In Proceedings of the 2017 IEEE MTT-S International Conference on Numerical Electromagnetic and Multiphysics Modeling and Optimization for RF, Microwave, and Terahertz Applications (NEMO), Seville, Spain, 17–19 May 2017; pp. 320–322. [Google Scholar]
- Zeng, Z.; Kang, R.; Wen, M.; Zio, E. A model-based reliability metric considering aleatory and epistemic uncertainty. IEEE Access 2017, 5, 15505–15515. [Google Scholar] [CrossRef]
- Rayas-Sanchez, J.E.; Koziel, S.; Bandler, J.W. Advanced RF and microwave design optimization: A journey and a vision of future trends. IEEE J. Microw. 2021, 1, 481–493. [Google Scholar] [CrossRef]
- Rayas-Sanchez, J.E.; Gutierrez-Ayala, V. EM-based Monte Carlo analysis and yield prediction of microwave circuits using linear-input neural-output space mapping. IEEE Trans. Microw. Theory Technol. 2006, 54, 4528–4537. [Google Scholar] [CrossRef]
- Firmansyah, T.; Alaydrus, M.; Wahyu, Y.; Rahardjo, E.T.; Wibisono, G. A highly independent multiband bandpass filter using a multi-coupled line stub-SIR with folding structure. IEEE Access 2020, 8, 83009–83026. [Google Scholar] [CrossRef]
- Chen, S.; Guo, M.; Xu, K.; Zhao, P.; Dong, L.; Wang, G. A frequency synthesizer based microwave permittivity sensor using CMRC structure. IEEE Access 2018, 6, 8556–8563. [Google Scholar] [CrossRef]
- Sengupta, M.; Saxena, S.; Daldoss, L.; Kramer, G.; Minehane, S.; Cheng, J. Application-specific worst case corners using response surfaces and statistical models. IEEE Trans. Comput.-Aided Des. Integr. Circuits Syst. 2005, 24, 1372–1380. [Google Scholar] [CrossRef]
- Zhang, J.; Feng, F.; Zhang, Q.-J. Rapid yield estimation of microwave passive components using model-order reduction based neuro-transfer function models. IEEE Microw. Wirel. Comp. Lett. 2021, 31, 333–336. [Google Scholar] [CrossRef]
- Matoglu, E.; Pham, N.; De Araujo, D.; Cases, M.; Swaminathan, M. Statistical signal integrity analysis and diagnosis methodology for high-speed systems. IEEE Trans. Adv. Packag. 2004, 27, 611–629. [Google Scholar] [CrossRef]
- Prasad, A.K.; Roy, S. Reduced dimensional Chebyshev-polynomial chaos approach for fast mixed epistemic-aleatory uncertainty quantification of transmission line networks. IEEE Trans. Comp. Packag. Manuf. Technol. 2019, 9, 1119–1132. [Google Scholar] [CrossRef]
- Du, J.; Roblin, C. Statistical modeling of disturbed antennas based on the polynomial chaos expansion. IEEE Ant. Wirel. Prop. Lett. 2017, 16, 1843–1847. [Google Scholar] [CrossRef]
- Kersaudy, P.; Mostarshedi, S.; Sudret, B.; Picon, O.; Wiart, J. Stochastic analysis of scattered field by building facades using polynomial chaos. IEEE Trans. Ant. Propag. 2014, 62, 6382–6393. [Google Scholar] [CrossRef]
- Koziel, S.; Mahouti, P.; Calik, N.; Belen, M.A.; Szczepanski, S. Improved modeling of miniaturized microwave structures using performance-driven fully-connected regression surrogate. IEEE Access 2021, 9, 71470–71481. [Google Scholar] [CrossRef]
- Ochoa, J.S.; Cangellaris, A.C. Random-space dimensionality reduction for expedient yield estimation of passive microwave structures. IEEE Trans. Microw. Theory Technol. 2013, 61, 4313–4321. [Google Scholar] [CrossRef]
- Leifsson, L.; Du, X.; Koziel, S. Efficient yield estimation of multi-band patch antennas by polynomial chaos-based kriging. Int. J. Numer. Modeling 2020, 33, e2722. [Google Scholar] [CrossRef]
- Spina, D.; Ferranti, F.; Antonini, G.; Dhaene, T.; Knockaert, L. Efficient variability analysis of electromagnetic systems via polynomial chaos and model order reduction. IEEE Trans. Comp. Packag. Manuf. Technol. 2014, 4, 1038–1051. [Google Scholar] [CrossRef][Green Version]
- Kennedy, M.C.; O’Hagan, A. Predicting the output from complex computer code when fast approximations are available. Biometrika 2000, 87, 1–13. [Google Scholar] [CrossRef]
- Abdel-Malek, H.L.; Hassan, A.S.O.; Soliman, E.A.; Dakroury, S.A. The ellipsoidal technique for design centering of microwave circuits exploiting space-mapping interpolating surrogates. IEEE Trans. Microw. Theory Technol. 2006, 54, 3731–3738. [Google Scholar] [CrossRef]
- Biernacki, R.; Chen, S.; Estep, G.; Rousset, J.; Sifri, J. Statistical analysis and yield optimization in practical RF and microwave systems. In Proceedings of the IEEE MTT-S International Microwave Symposium digest. IEEE MTT-S International Microwave Symposium, Montreal, QC, Canada, 17–22 June 2012; pp. 1–3. Available online: https://ieeexplore.ieee.org/document/6259360 (accessed on 17 November 2021).
- Scotti, G.; Tommasino, P.; Trifiletti, A. MMIC yield optimization by design centering and off-chip controllers. IET Proc.-Circuits Devices Syst. 2005, 152, 54–60. [Google Scholar] [CrossRef]
- Ma, B.; Lei, G.; Liu, C.; Zhu, J.; Guo, Y. Robust tolerance design optimization of a PM claw pole motor with soft magnetic composite cores. IEEE Trans. Magn. 2018, 54, 8102404. [Google Scholar] [CrossRef]
- Li, Y.; Ding, Y.; Zio, E. Random fuzzy extension of the universal generating function approach for the reliability assessment of multi-state systems under aleatory and epistemic uncertainties. IEEE Trans. Reliab. 2014, 63, 13–25. [Google Scholar] [CrossRef]
- Easum, J.A.; Nagar, J.; Werner, P.L.; Werner, D.H. Efficient multiobjective antenna optimization with tolerance analysis through the use of surrogate models. IEEE Trans. Ant. Propag. 2018, 66, 6706–6715. [Google Scholar] [CrossRef]
- Rossi, M.; Dierck, A.; Rogier, H.; Vande Ginste, D. A stochastic framework for the variability analysis of textile antennas. IEEE Trans. Ant. Prop. 2014, 62, 6510–6514. [Google Scholar] [CrossRef]
- Zhang, J.; Zhang, C.; Feng, F.; Zhang, W.; Ma, J.; Zhang, Q.J. Polynomial chaos-based approach to yield-driven EM optimization. IEEE Trans. Microw. Theory Technol. 2018, 66, 3186–3199. [Google Scholar] [CrossRef]
- Du, J.; Roblin, C. Stochastic surrogate models of deformable antennas based on vector spherical harmonics and polynomial chaos expansions: Application to textile antennas. IEEE Trans. Ant. Propag. 2018, 66, 3610–3622. [Google Scholar] [CrossRef]
- Tomy, G.J.K.; Vinoy, K.J. A fast polynomial chaos expansion for uncertainty quantification in stochastic electromagnetic problems. IEEE Ant. Wirel. Propag. Lett. 2019, 18, 2120–2124. [Google Scholar] [CrossRef]
- Zhang, J.; Feng, F.; Jin, J.; Zhang, Q.-J. Efficient yield estimation of microwave structures using mesh deformation-incorporated space mapping surrogates. IEEE Microw. Wirel. Comp. Lett. 2020, 30, 937–940. [Google Scholar] [CrossRef]
- Koziel, S.; Bekasiewicz, A. Sequential approximate optimization for statistical analysis and yield optimization of circularly polarized antennas. IET Microw. Ant. Prop. 2018, 12, 2060–2064. [Google Scholar] [CrossRef]
- Koziel, S. Fast simulation-driven antenna design using response-feature surrogates. Int. J. RF Microw. CAE 2015, 25, 394–402. [Google Scholar] [CrossRef]
- Koziel, S.; Bandler, J.W. Rapid yield estimation and optimization of microwave structures exploiting feature-based statistical analysis. IEEE Trans. Microw. Theory Technol. 2015, 63, 107–114. [Google Scholar] [CrossRef]
- Pietrenko-Dabrowska, A.; Koziel, S. Numerically efficient algorithm for compact microwave device optimization with flexible sensitivity updating scheme. Int. J. RF Microw. CAE 2019, 29, e21714. [Google Scholar] [CrossRef]
- Kim, D.; Kim, M.; Kim, W. Wafer edge yield prediction using a combined long short-term memory and feed- forward neural network model for semiconductor manufacturing. IEEE Access 2020, 8, 215125–215132. [Google Scholar] [CrossRef]
- Conn, A.R.; Gould, N.I.M.; Toint, P.L. Trust Region Methods; MPS-SIAM: Philadelphia, PA, USA, 2000. [Google Scholar]
- Robert, C.P.; Casella, G. Monte Carlo Statistical Methods, 2nd ed.; Springer: New York, NY, USA, 2004. [Google Scholar]
- Koziel, S.; Pietrenko-Dabrowska, A. Reduced-cost surrogate modeling of compact microwave components by two-level kriging interpolation. Eng. Opt. 2019, 52, 960–972. [Google Scholar] [CrossRef]
- Tseng, C.; Chang, C. A rigorous design methodology for compact planar branch-line and rat-race couplers with asymmetrical T-structures. IEEE Trans. Microw. Theory Technol. 2012, 60, 2085–2092. [Google Scholar] [CrossRef]
- Xia, L.; Li, J.; Twumasi, B.A.; Liu, P.; Gao, S. Planar dual-band branch-line coupler with large frequency ratio. IEEE Access 2020, 8, 33188–33195. [Google Scholar] [CrossRef]
- Queipo, N.V.; Haftka, R.T.; Shyy, W.; Goel, T.; Vaidynathan, R.; Tucker, P.K. Surrogate-based analysis and optimization. Prog. Aerosp. Sci. 2005, 41, 1–28. [Google Scholar] [CrossRef]
- Koziel, S.; Pietrenko-Dabrowska, A. Performance-Driven Surrogate Modeling of High-Frequency Structures; Springer: New York, NY, USA, 2020. [Google Scholar]
- Pietrenko-Dabrowska, A. Rapid tolerance-aware design of miniaturized microwave passives by means of confined-domain surrogates. Int. J. Numer. Modeling 2021, 33, e2779. [Google Scholar]
Publisher’s Note: MDPI stays neutral with regard to jurisdictional claims in published maps and institutional affiliations. |
© 2021 by the authors. Licensee MDPI, Basel, Switzerland. This article is an open access article distributed under the terms and conditions of the Creative Commons Attribution (CC BY) license (https://creativecommons.org/licenses/by/4.0/).