Article

Analysis of the Results from In Situ Testing of a Sensor In-Stalled on a Powered Roof Support, Developed by KOMAG, Measuring the Tip to Face Distance

KOMAG Institute of Mining Technology, Pszczyńska 37, 44-101 Gliwice, Poland
*
Author to whom correspondence should be addressed.
Energies 2021, 14(24), 8541; https://doi.org/10.3390/en14248541
Submission received: 23 November 2021 / Revised: 8 December 2021 / Accepted: 16 December 2021 / Published: 17 December 2021
(This article belongs to the Special Issue The KOMTECH-IMTech 2021 Mining Technologies Future)

Abstract

:
Mining in underground plants is associated with high risk. Improving work safety and increasing the productivity of longwall systems in the mining industry is a problem considering many criteria. Safety aspects concern both the crew and the machinery. The KOMAG Institute of Mining Technology designed and manufactured a geometry monitoring system based on inclinometers that meet the requirements of the ATEX directive. Monitoring of the roof support geometry is used for the prevention of loss of roof stability: roof fall or/and cave-in. The system was tested on a real object in real conditions.

1. Introduction

The longwall system is one of the basic and highly advanced mining systems in the hard coal mining industry. In this system, the mining process is realized by cooperation of three main machines: a roof support, a shearer, and an armoured face conveyor (AFC). The basic function of a roof support is to protect the crew working there and machines [1,2,3]. Mining in underground plants is associated with high risk. Improving work safety and increasing the productivity of longwall systems is a problem in the mining industry considering many criteria.
Safety aspects concern both the crew and technical safety of the machinery. Machine breakdowns and uncontrolled rock mass behaviour pose a serious threat to human life and health. Technical safety of machinery and equipment is also very important as improper operation may lead to damage or complete destruction of the machinery. Technical safety is influenced, among other things, by the mining technology, which is adjusted to the mining and geological conditions. Machines used in longwall systems are selected in accordance with the currently used methodology [4,5]. After the selection of technology and the installation and start-up of the longwall system, the next step is mining the deposit and control of parameters resulting from the cooperation of the roof support with the rock mass.
In longwall systems, pressure monitoring in the hydraulic system of a roof support is commonly used [6,7]. Information about the pressure in legs is used to predict the behaviour of the rock mass in contact with the powered roof support. The authors of [8] present an algorithm for predicting the behaviour of a powered roof support based on the pressure in the hydraulic cylinders and the position of the plow in the coal plow system. Roof behaviour is most often predicted on the basis of pressure changes in hydraulic cylinders caused by the nature of the powered roof support operation and the impact of the rock mass. So far, the process has not taken into account the tip to face distance and the geometry of the roof support. An example of the results of pressure change analysis for coal seams in the Shendong basin, located in the north-west part of China, is presented in [9]. Monitoring the geometry of the roof support has already been developed and implemented [10,11]. Monitoring of shield support geometry is connected with the prevention of loss of roof stability, both roof fall or/and cave-in. The position of the powered roof support in the longwall panel and the pressure in the hydraulic system has a direct impact on the stability of the roof [12].
The authors of [13] present the SSRI software package for analysing pressure monitoring data in the legs of a roof support. The authors of [7] present the use of artificial neural networks to determine the required pressure in hydraulic legs. The interaction of the powered roof support with the rock mass has been the subject of many analyses [14] and their results have been used in the process of selection of the support to specific mining and geological conditions. The results of these analyses are not taken into account in the machine control process.

2. Materials and Methods

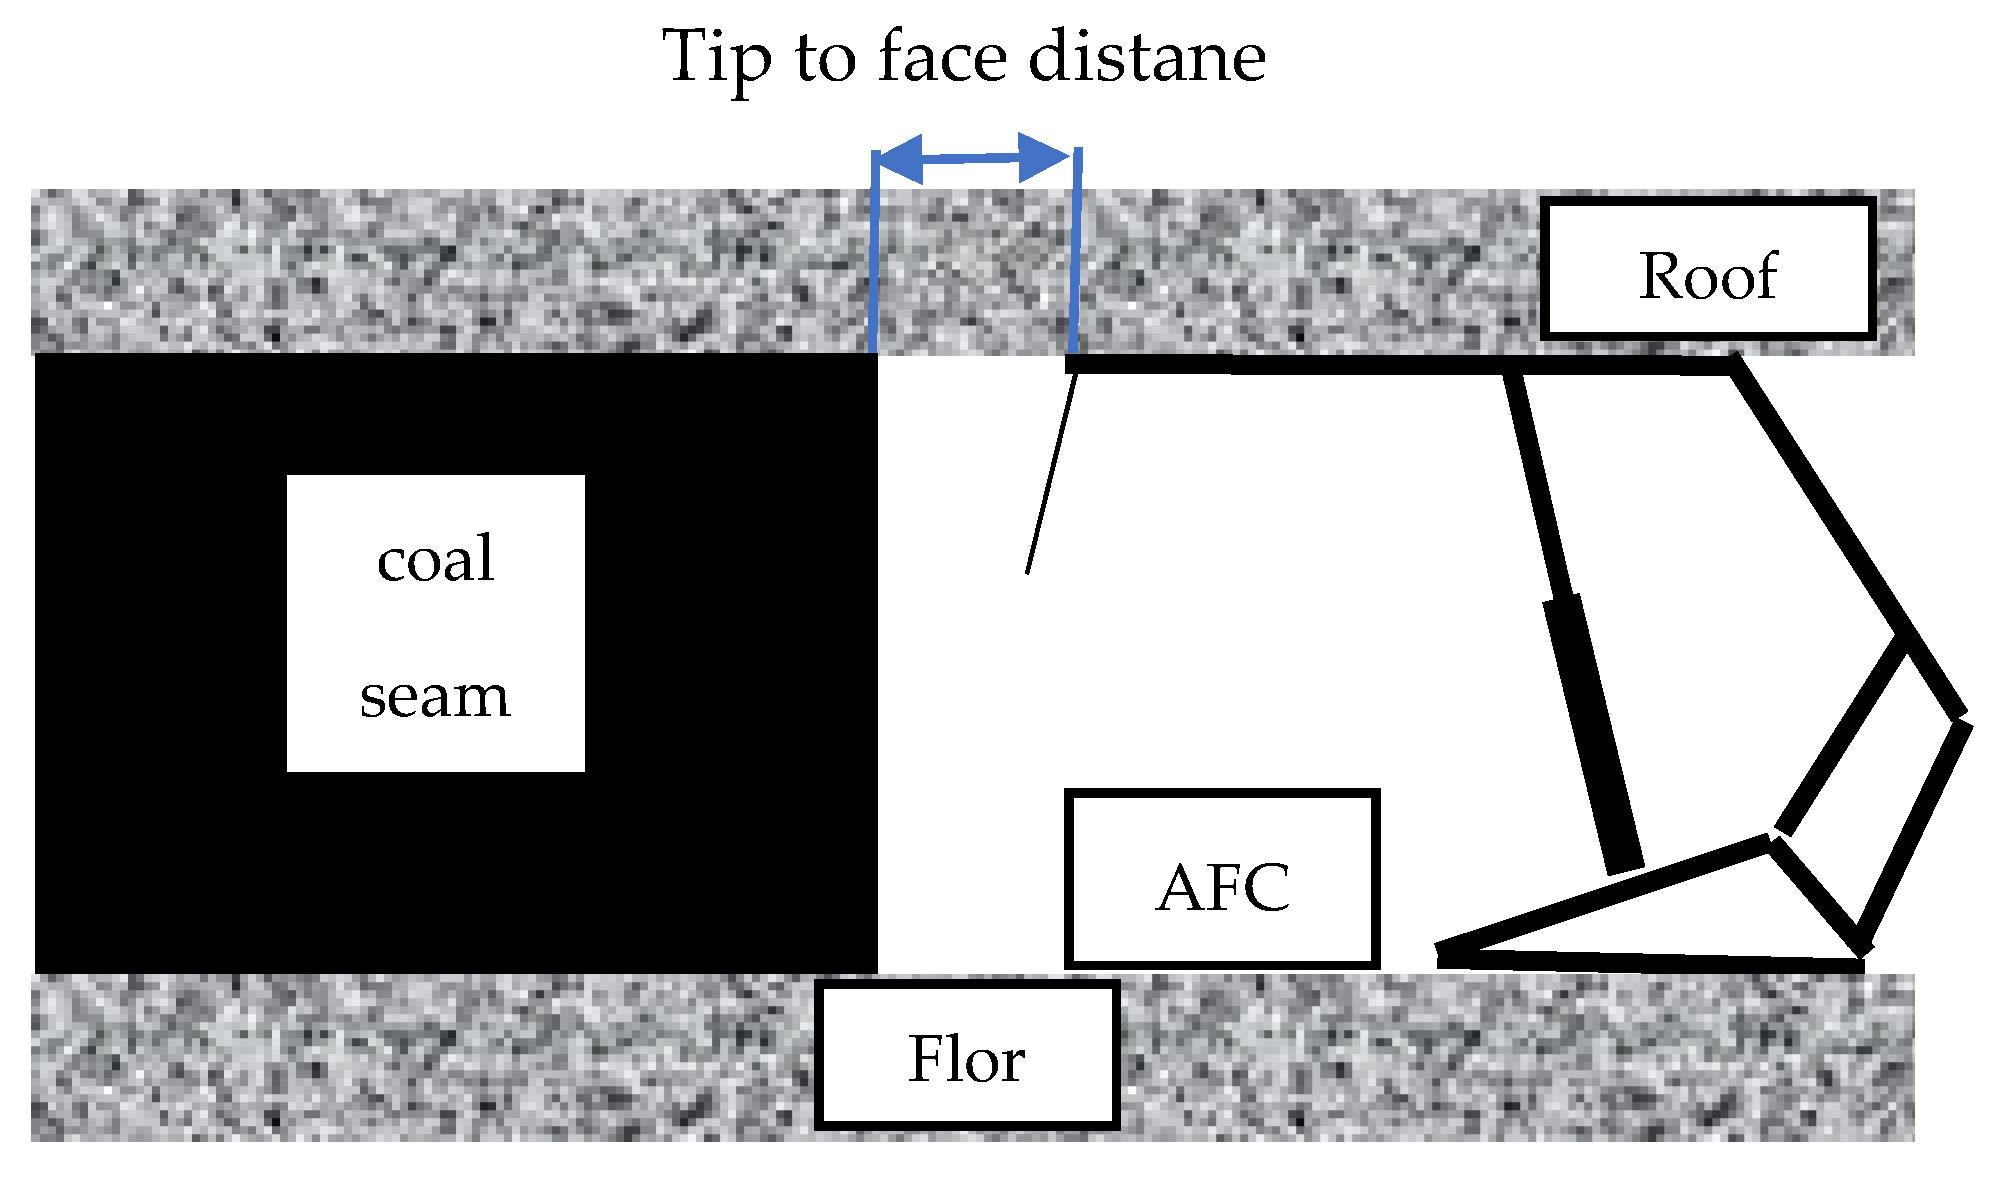
2.1. Tip to Face Distance

The tip to face distance is defined as the distance from the end of the canopy of the shield support to the longwall face (Figure 1). This distance is defined in the mining technology and is most often a direct result of the technological conditions: the roof support design, the width of the AFC, and the width of the shearer’s drums. Efforts are made to keep this distance as small as possible: most often, it is about 500 mm. This distance increases after the shearer has passed by the thickness of the cut. In practice, the tip to face distance increases during rockfall.
During mining, monitoring of the tip to face distance is important for detection of roof falls within the longwall or coal fall from the face of the longwall. This information together with information about the pressure in the hydraulic system and the roof support geometry will allow prediction of the hazards resulting from the interaction of the roof support with the rock mass.
According to [15], there is a critical distance between the canopy tip and the coal face (tip to face distance), called by authors TFcrit. This distance is predictable and is corelated with the thickness of the first layer of the roof and its uniaxial compressive strength. Tip to face distance should be less than the TFcrit in general. There is a dengures of roof fall in situation when tip to face distance is longer then TFcrit.
Measurement of the distance between the canopy’s end and the face of the longwall is a difficult task due to the conditions existing there and the specific location of the installation, in the area of roof supports. In this place, there is a lot of dust generated by mining operations, which together with water mist from spraying systems causes the sensor contamination. The sensor is mounted at the end of the roof support, where some parts of the support obscure the measuring path leading to the longwall face. Part of the canopy extends and at its end there is a hinged shield, which covers the longwall face. When the shearer passes through, it is retracted. In the normal position, it is lowered to protect the longwall machines and the crew from a possible rock fall from the longwall face. Specific application of the sensor makes it impossible to use a market-ready solution for this purpose, mainly due to the required ATEX certificate, susceptibility to contamination, adjustment to the communication protocol, format of the data transmission, as well as its own power supply and energy efficiency.

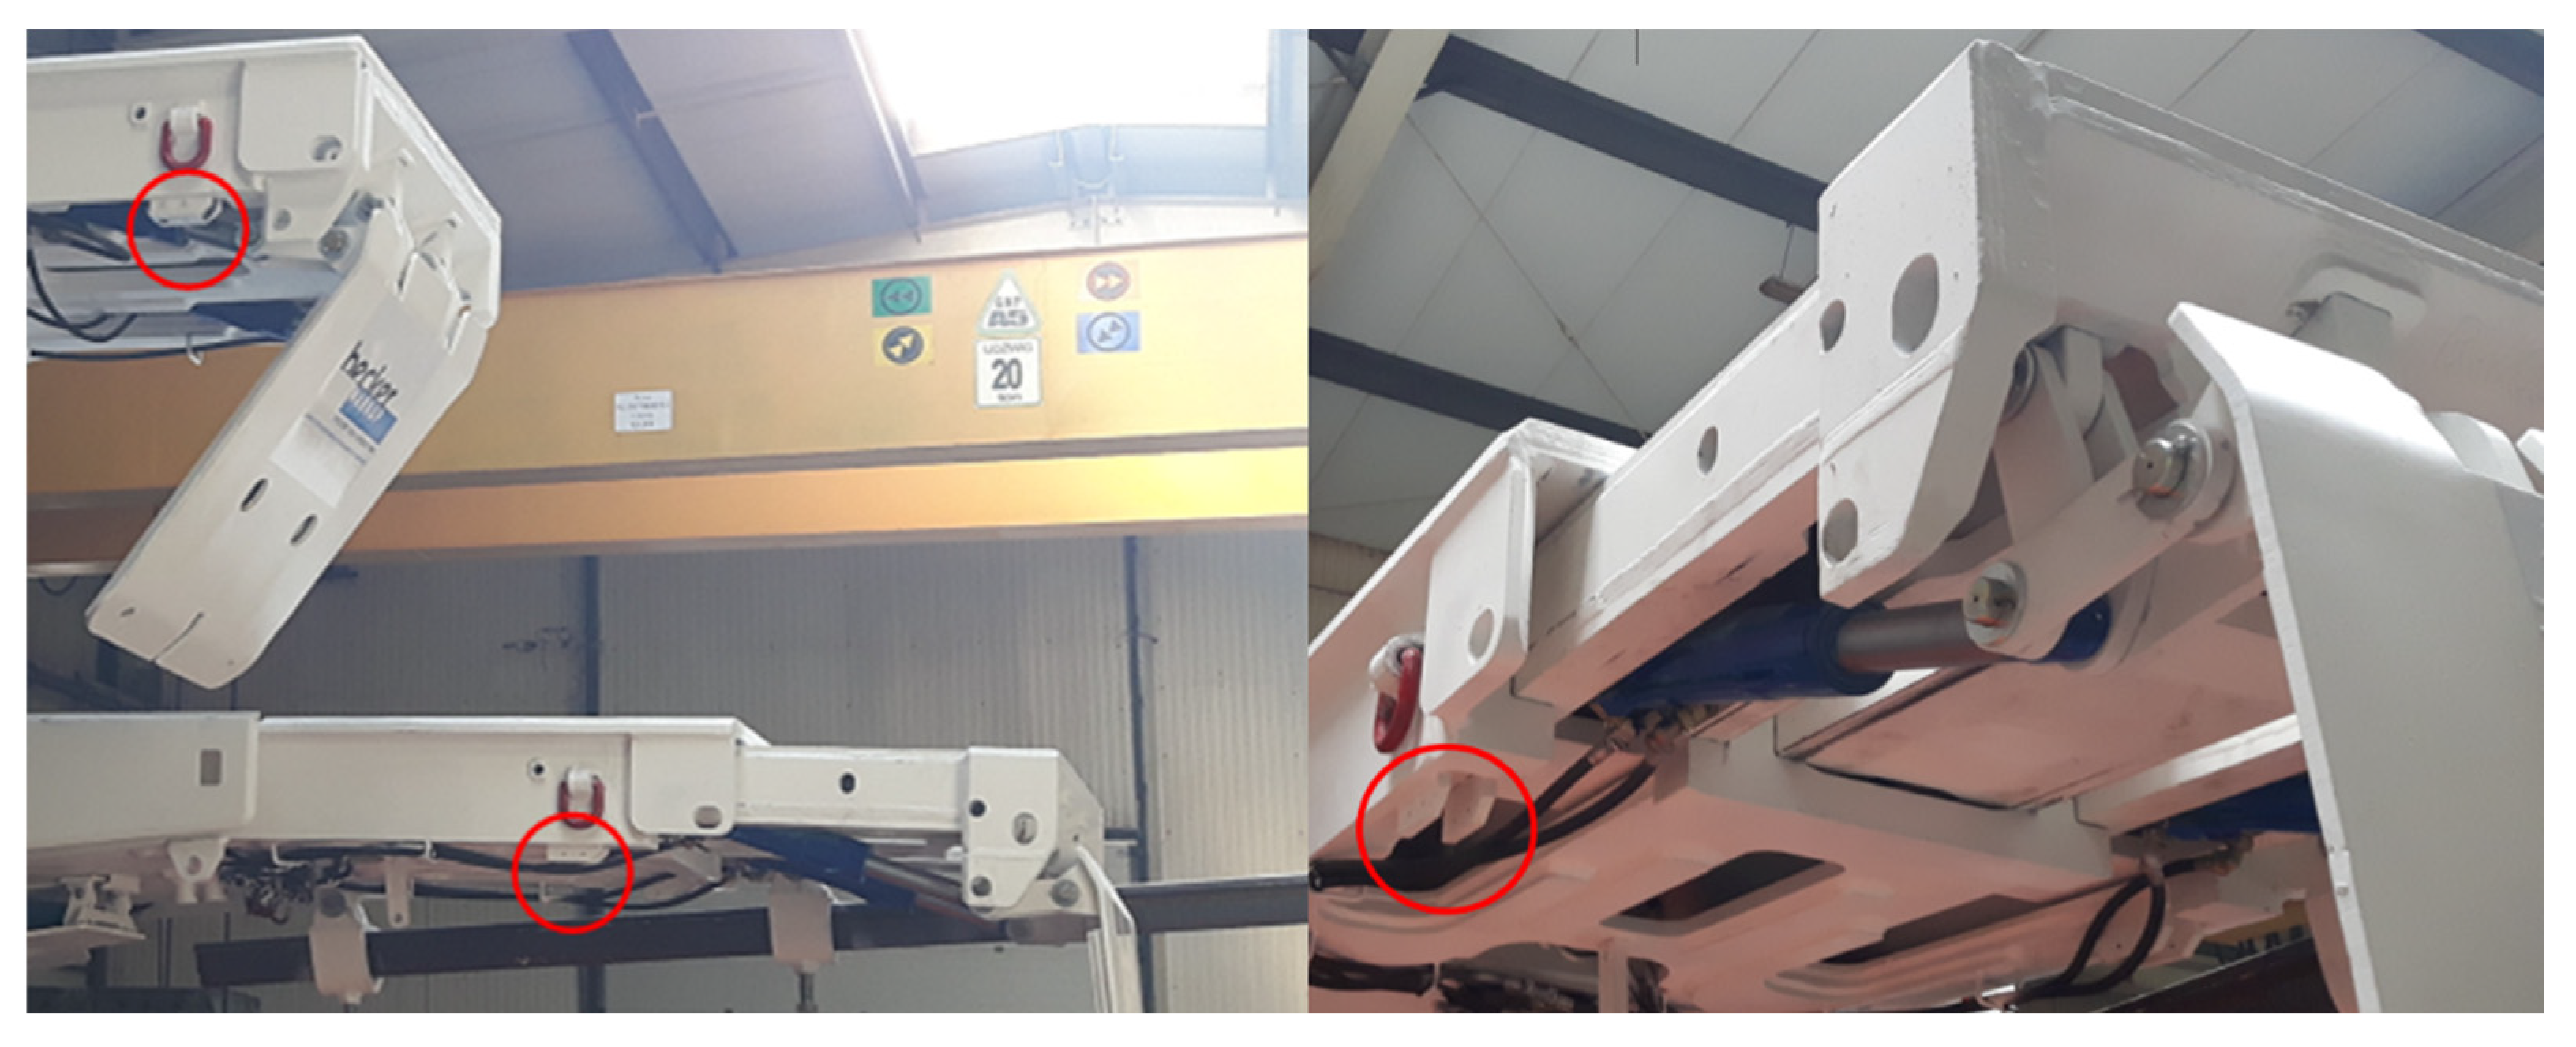
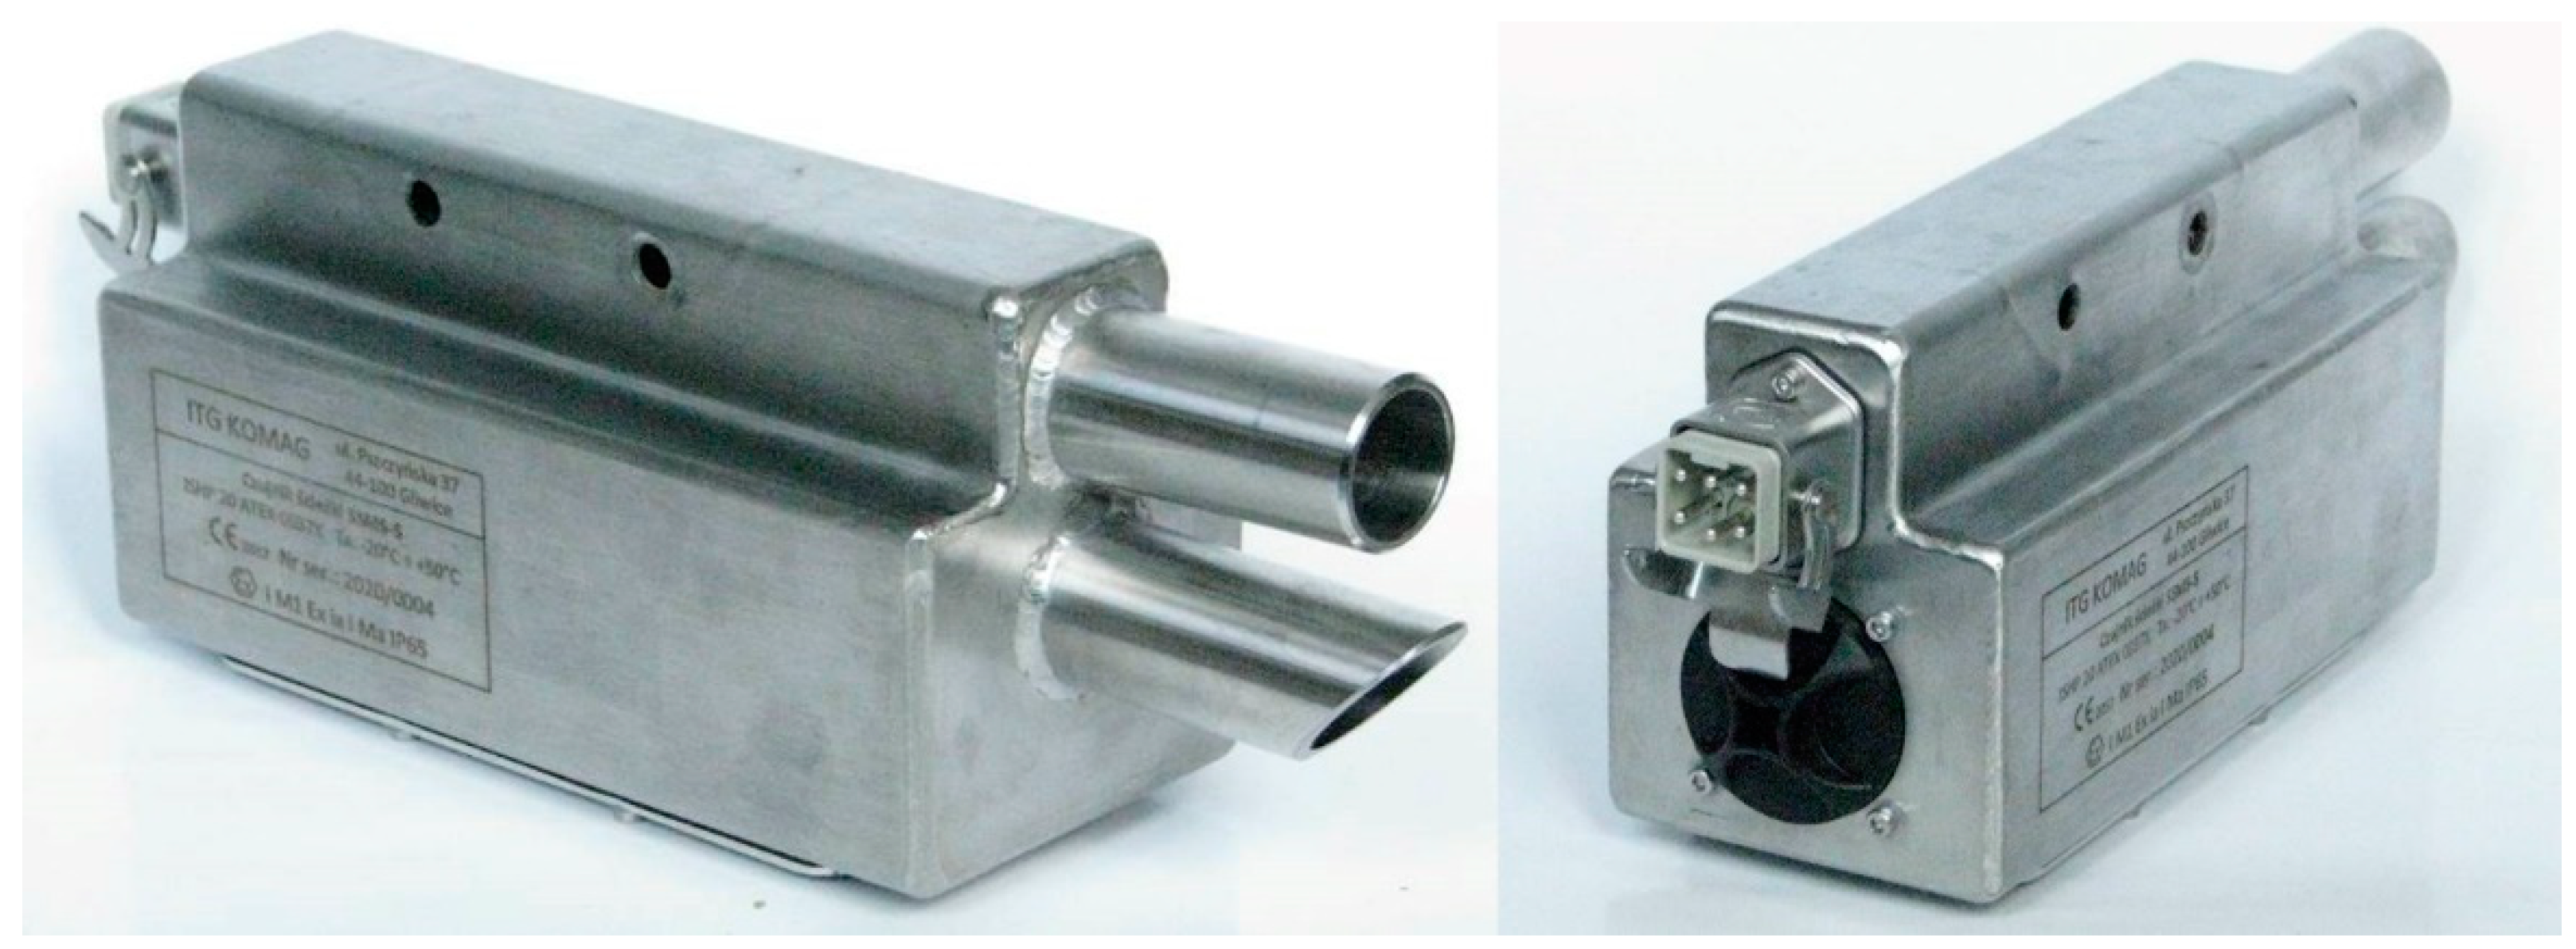
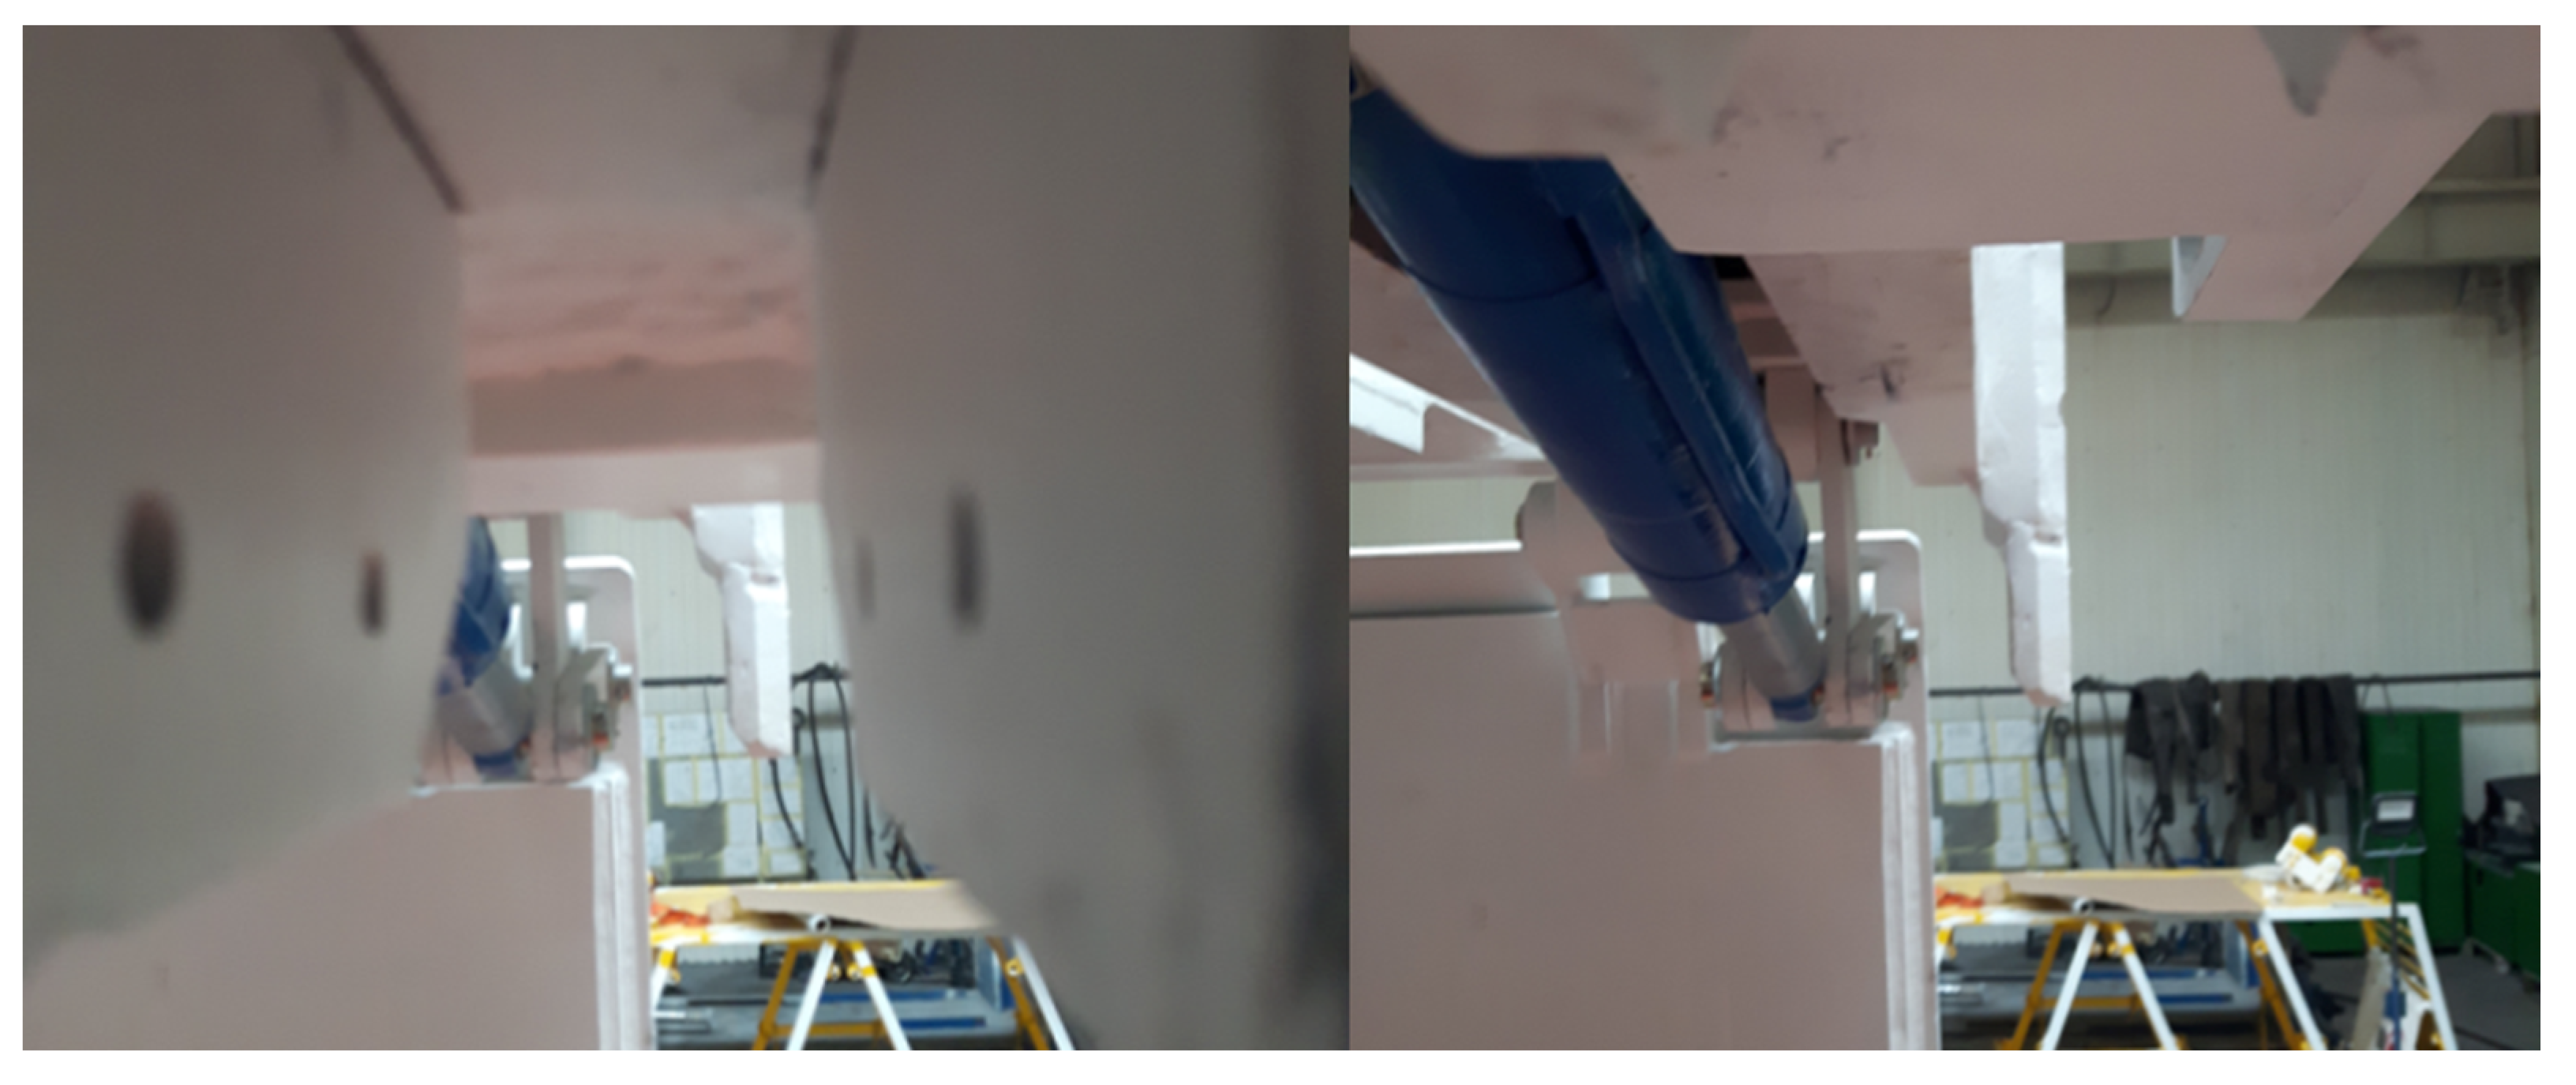
2.2. Tip to Face Distance Sensor SSMS-S

The tip to face sensor SSMS-S (Figure 2) was developed in the PRASS III project and is part of the SSMS system that monitors the operational parameters of longwall roof support [16]. The sensor uses an ultrasonic distance measuring technology. The issues related to the development of the sensor, the selection of the measuring technology, and testing the ultrasonic transducers are described in detail in [17].
The sensor uses two separate components, an ultrasonic transmitter and receiver, which are placed in the wave direction tubes. The frequency of the generated ultrasonic waves is 32.5 kHz. The tubes amplify the signal reflected from the obstacle ahead of the sensor, in this case from the front of the wall. This makes it possible to identify the correct echo of the signal and to reduce interference, i.e., false signals coming from reflections of waves from the canopy components surrounding the measuring track. The measuring range of the sensor is 5 m. It is powered by two 17 Ah batteries. Energy-efficient operation is an important aspect, as it is designed to operate without changing the batteries for at least 1 year. Measurement data are sent via a serial bus with the MODBUS RTU protocol to the SSMS-C central unit (planed in the future to replace the cable connection with a wireless link operating in a mesh network [18]). The sensor has an intrinsically safe design and has an ATEX certificate: I M1 Ex ia I Ma, which means that it can operate in coal mines with a potentially explosive atmosphere. According to the assumptions of the PRASS III project, in situ tests of the SSMS-S sensor and the whole SSMS system were planned at the Budryk mine, where the BW 24/44 POz roof support was used [19]. The longwall is situated in seam 405/1 at a depth of about 1260 m. Figure 3 shows the location of the sensor installation on the BW 24/44 POz roof support.
The end part of the canopy is extendable while the sensor is installed at the end of its fixed part. This makes an additional problem in terms of correct sensor readings. The sensor may misinterpret waves reflected from the transverse surfaces of components located at the end of the canopy as echo reflected from the longwall face. Figure 4 shows a view from the sensor’s installation place. There is only a small space through which the waves will propagate towards the longwall face and back after reflection from it. The mobility of the end part of the canopy makes it impossible to extend the sensor’s dead zone beyond the range of its components, which would solve the problem of interference in the form of waves reflected from those components.
The sensor uses the author’s algorithm considering the weight of each parameter [17] that identifies the correct wave reflected from the longwall face rock. In situ tests were part of the project and were intended to answer the question whether the developed sensor takes measurements properly in the conditions of longwall mining operation. However, before the sensor was mounted in a dedicated powered roof support, preliminary tests were carried out in the Pniówek mine in a longwall complex located in seam 404/1 at a depth of approximately 860 m.

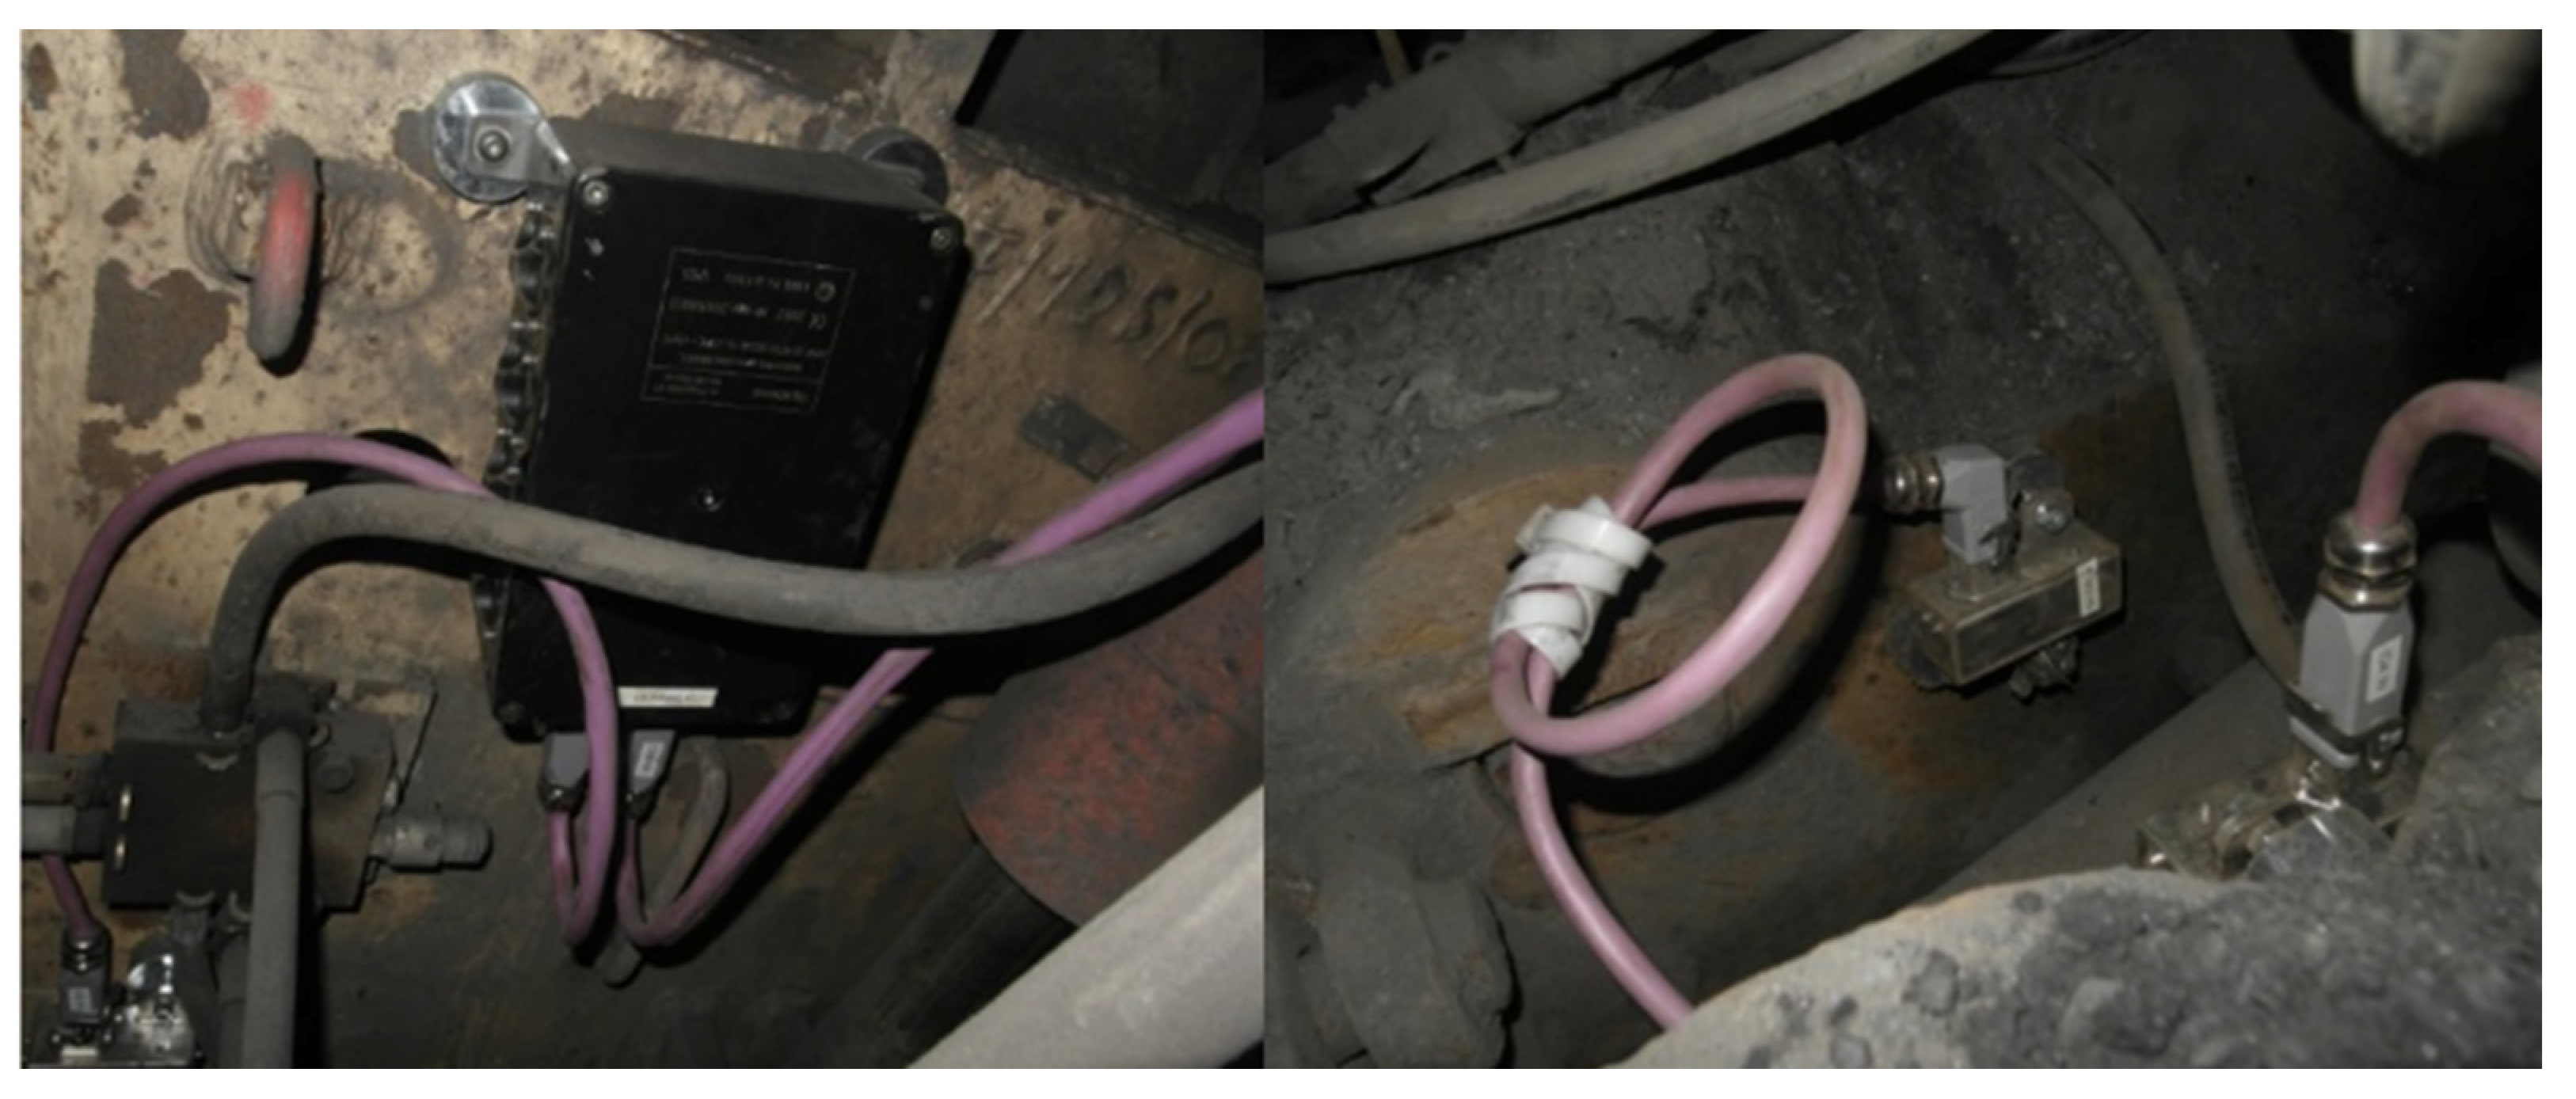
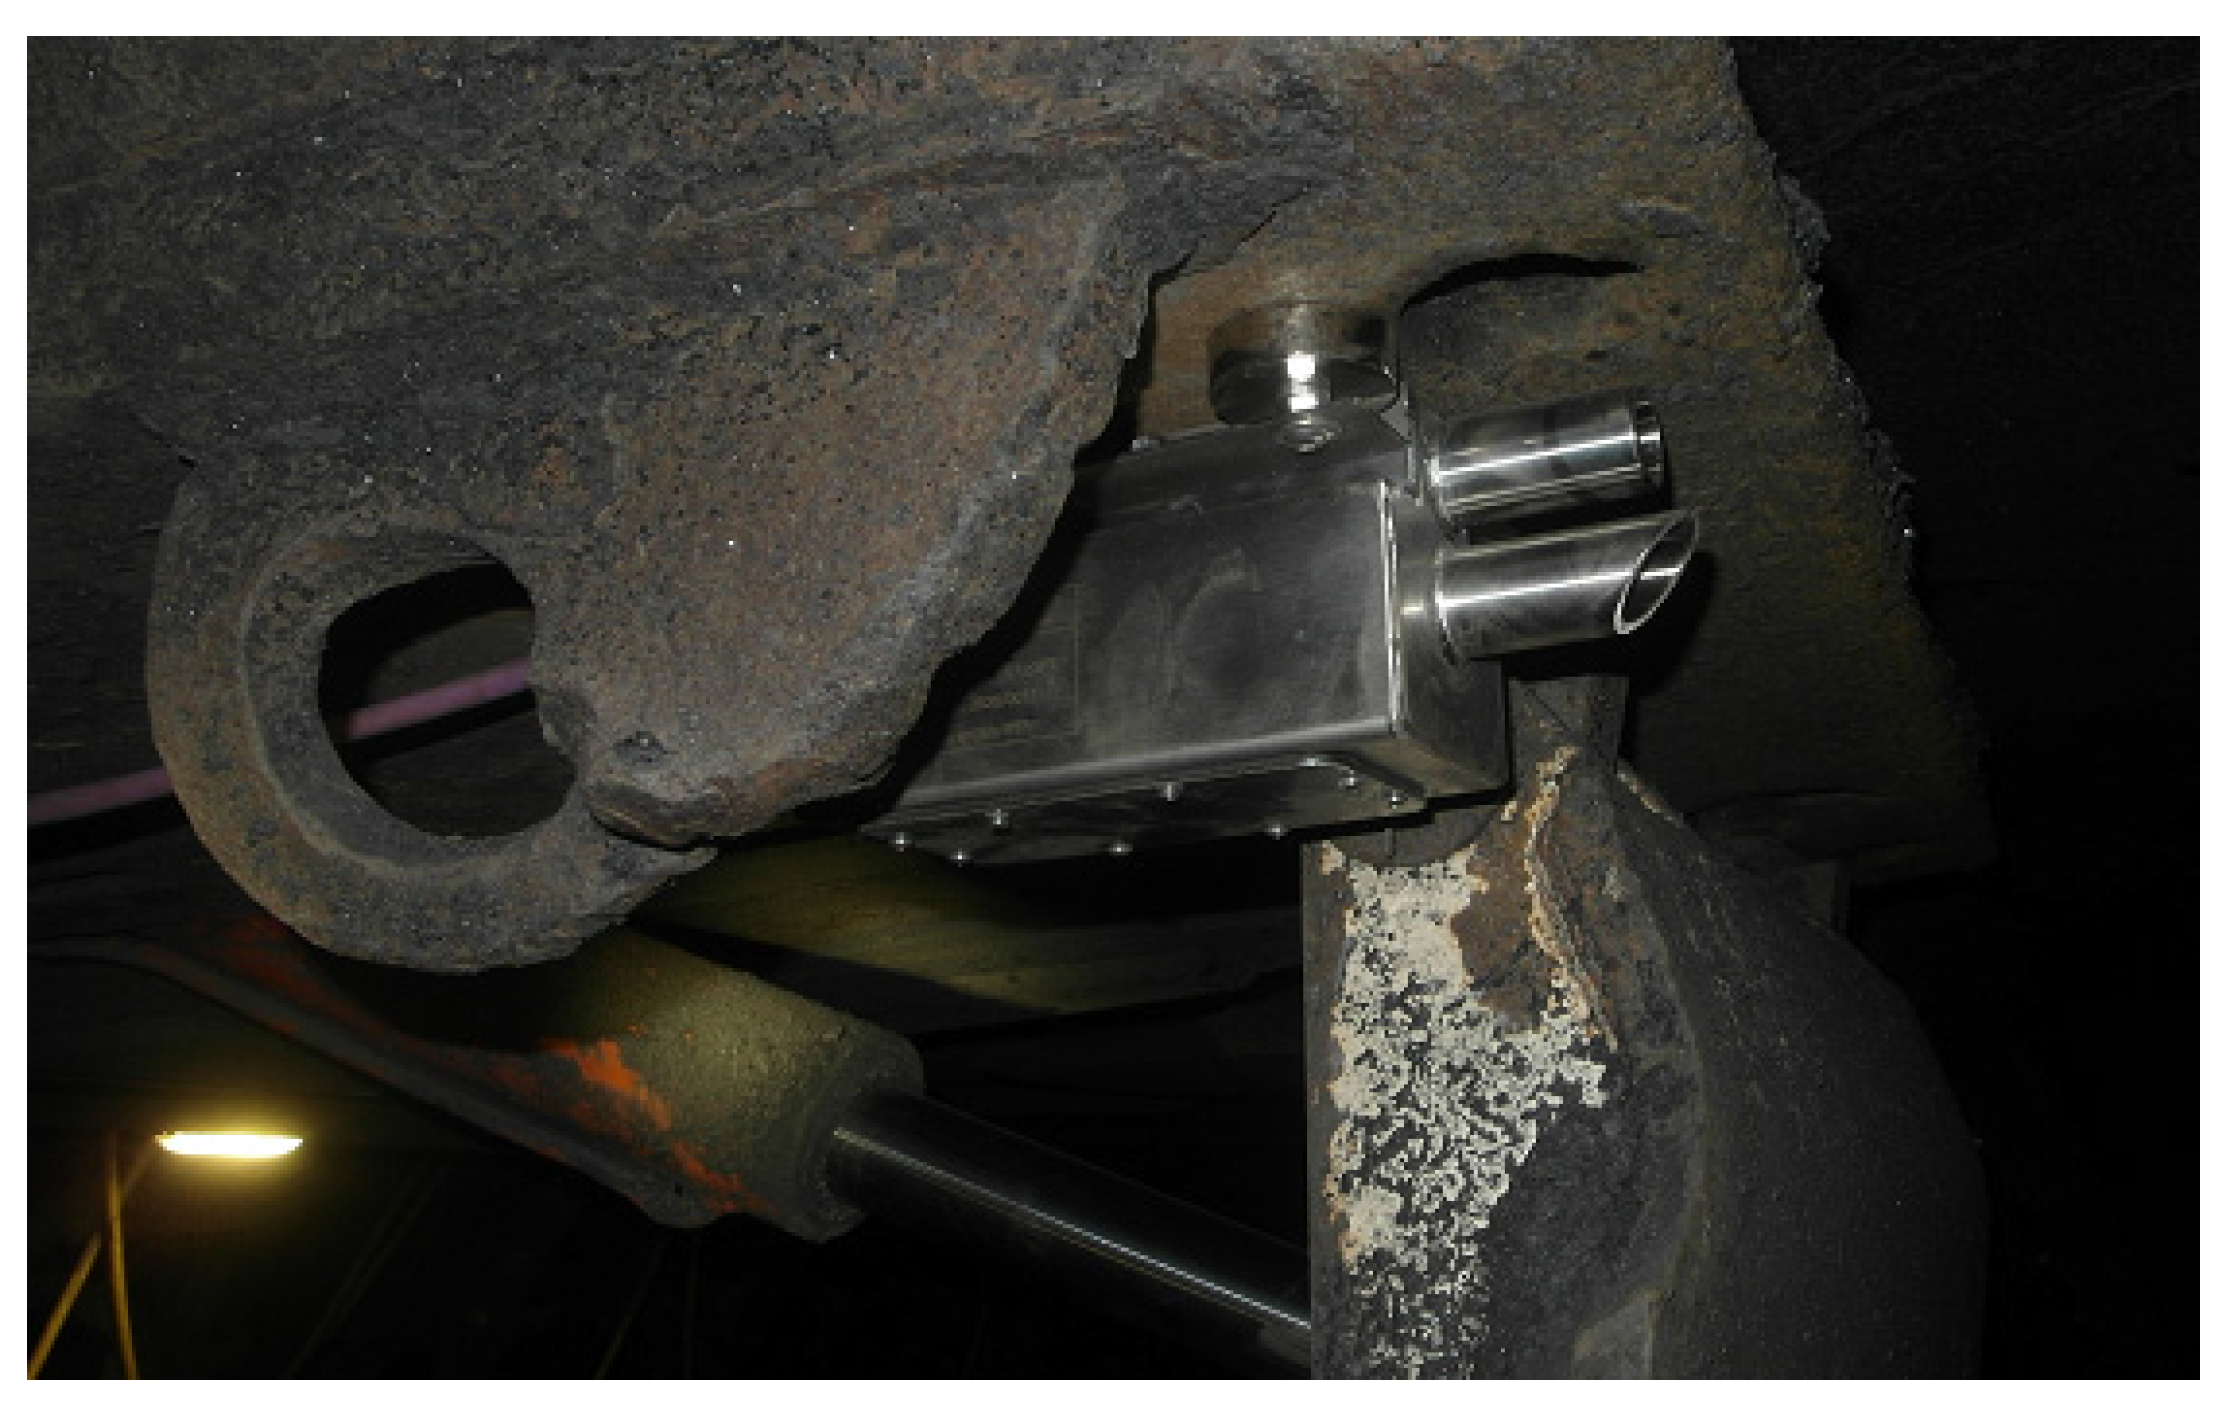
2.3. Field Test of SMMS at JSW Pniówek Mine

In Pniówek mine, the SSMS system was installed on a part of a longwall complex equipped with FRS-13/29-PO roof supports. Central units of SSMS-C sensors, measuring the geometry of roof support parts SSMS-I, and wireless sensors measuring the pressure in the hydraulic legs were installed on 10 roof supports (Figure 5). The SSMS-S tip to face sensors were installed on 6 canopies. Magnetic connections were used to fix them. In this case, installation of the sensor at the very end of the canopy was the only possibility. Moving the sensor further into the canopy, where it could be more protected from damage and dirt, risked damaging the sensor by face sprag.
Figure 6 shows the other parts of the SSMS system, including the central unit SSMS-C, which reads data from the SSMS-S sensor and transmits it via radio to the pressure sensors. Wireless pressure sensors represent a network of the mesh topology. The data was transferred between each pressure sensor, and the next step was then to send them to a database server connected to the mine’s local network, making it accessible from the surface.
After a few days of operation, the sensors were covered with a layer of dirt. This was caused by dust, rock throw, and spraying systems of the shearer’s cutter drums during the mining process. Dirt was also deposited in the ultrasonic tubes, as can be seen in Figure 7. The layer of dirt disturbed the measurements, which was reflected in the measurements shown in the figures below. For this reason, their correct interpretation required the application of additional filtration, which is described later in this article.
The data on the tip-to-face distance were successfully gathered as presented in Figure 8.

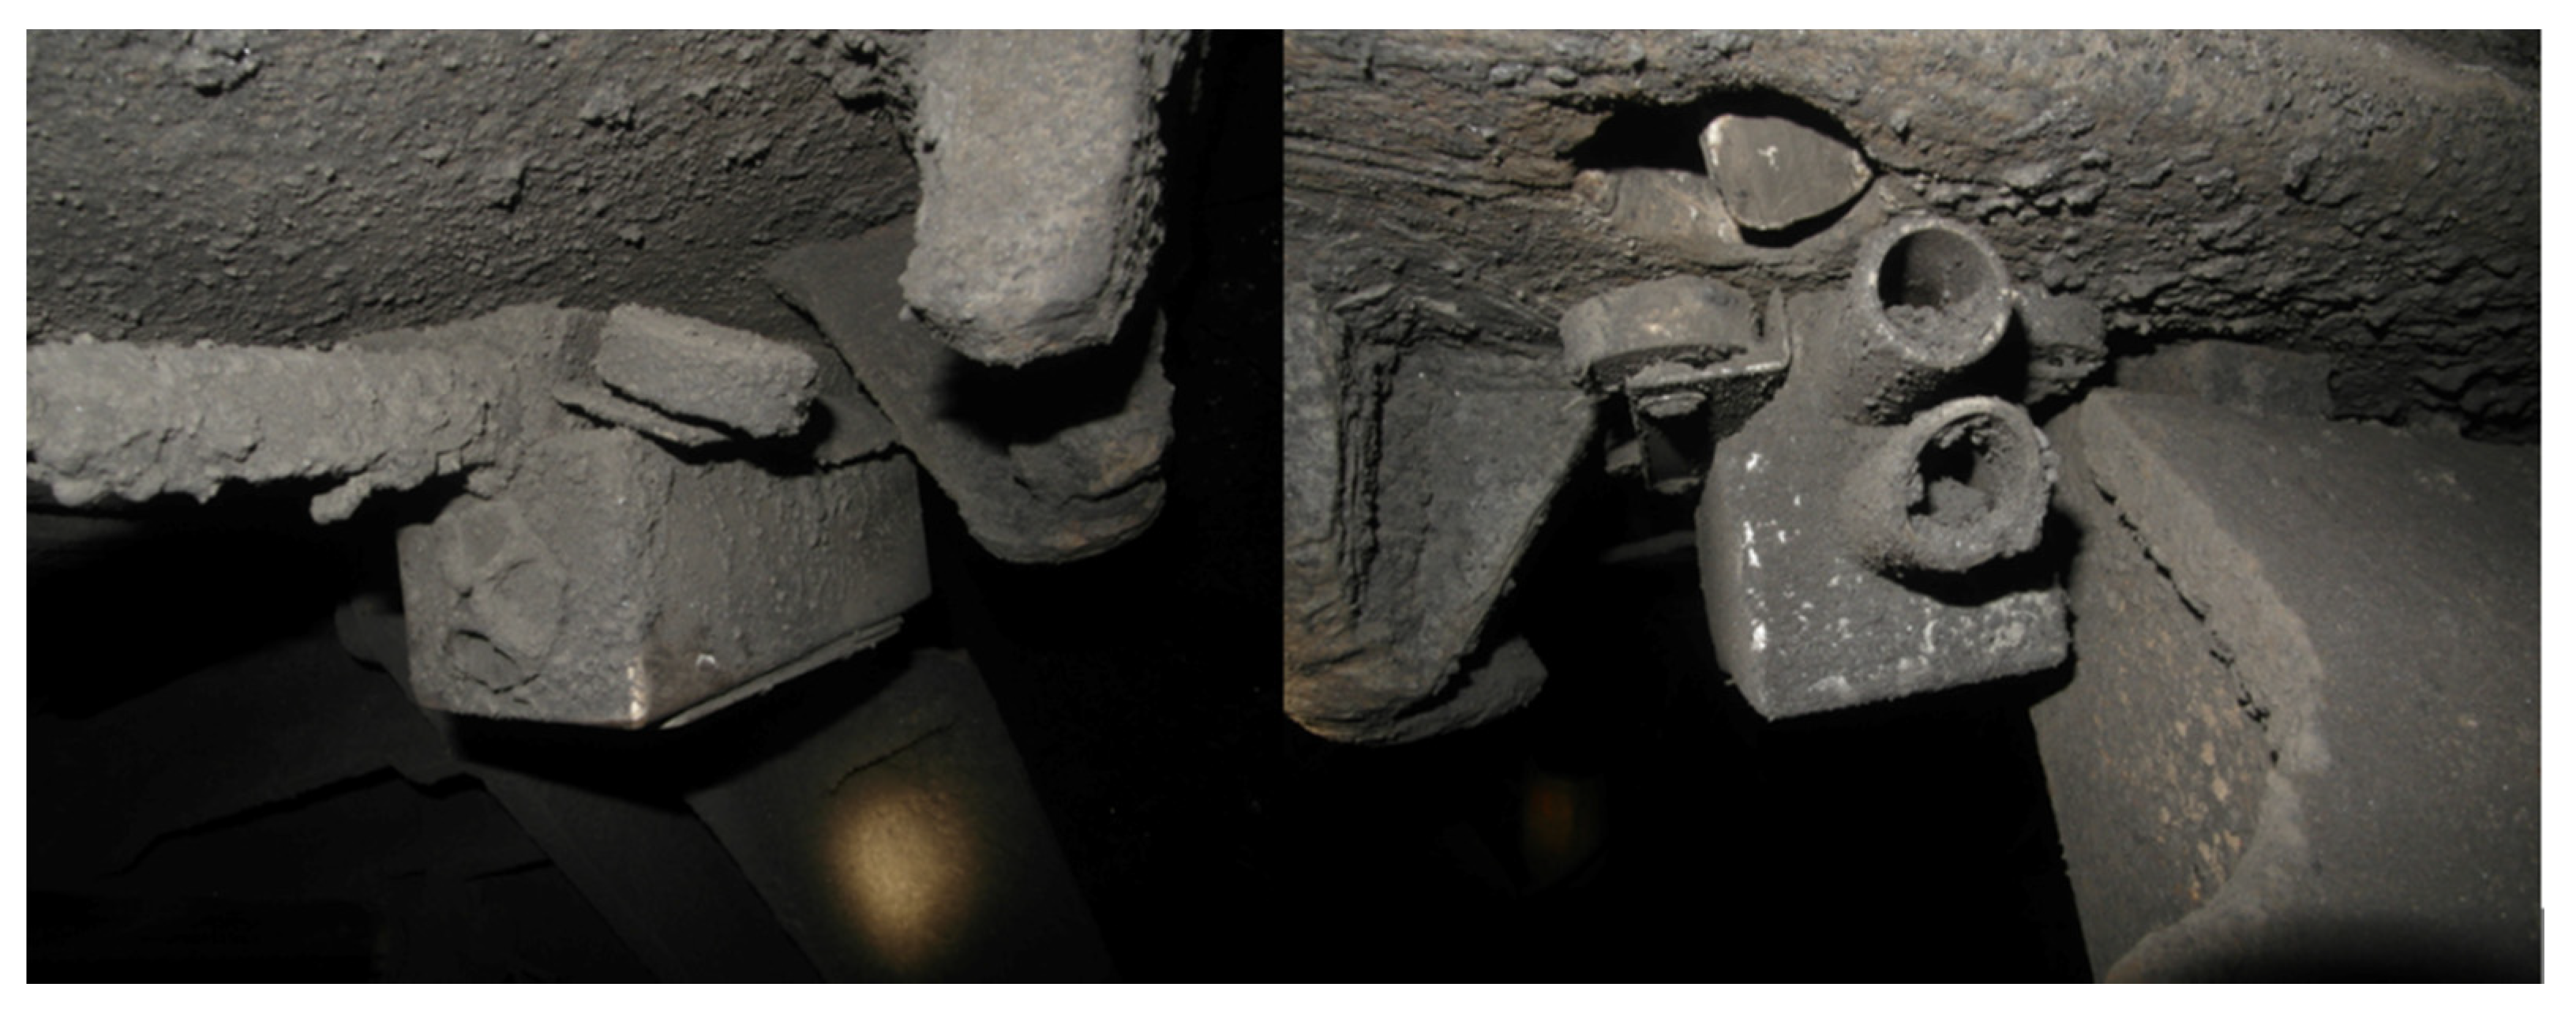
2.4. Field Test of SMMS at JSW Budryk Mine
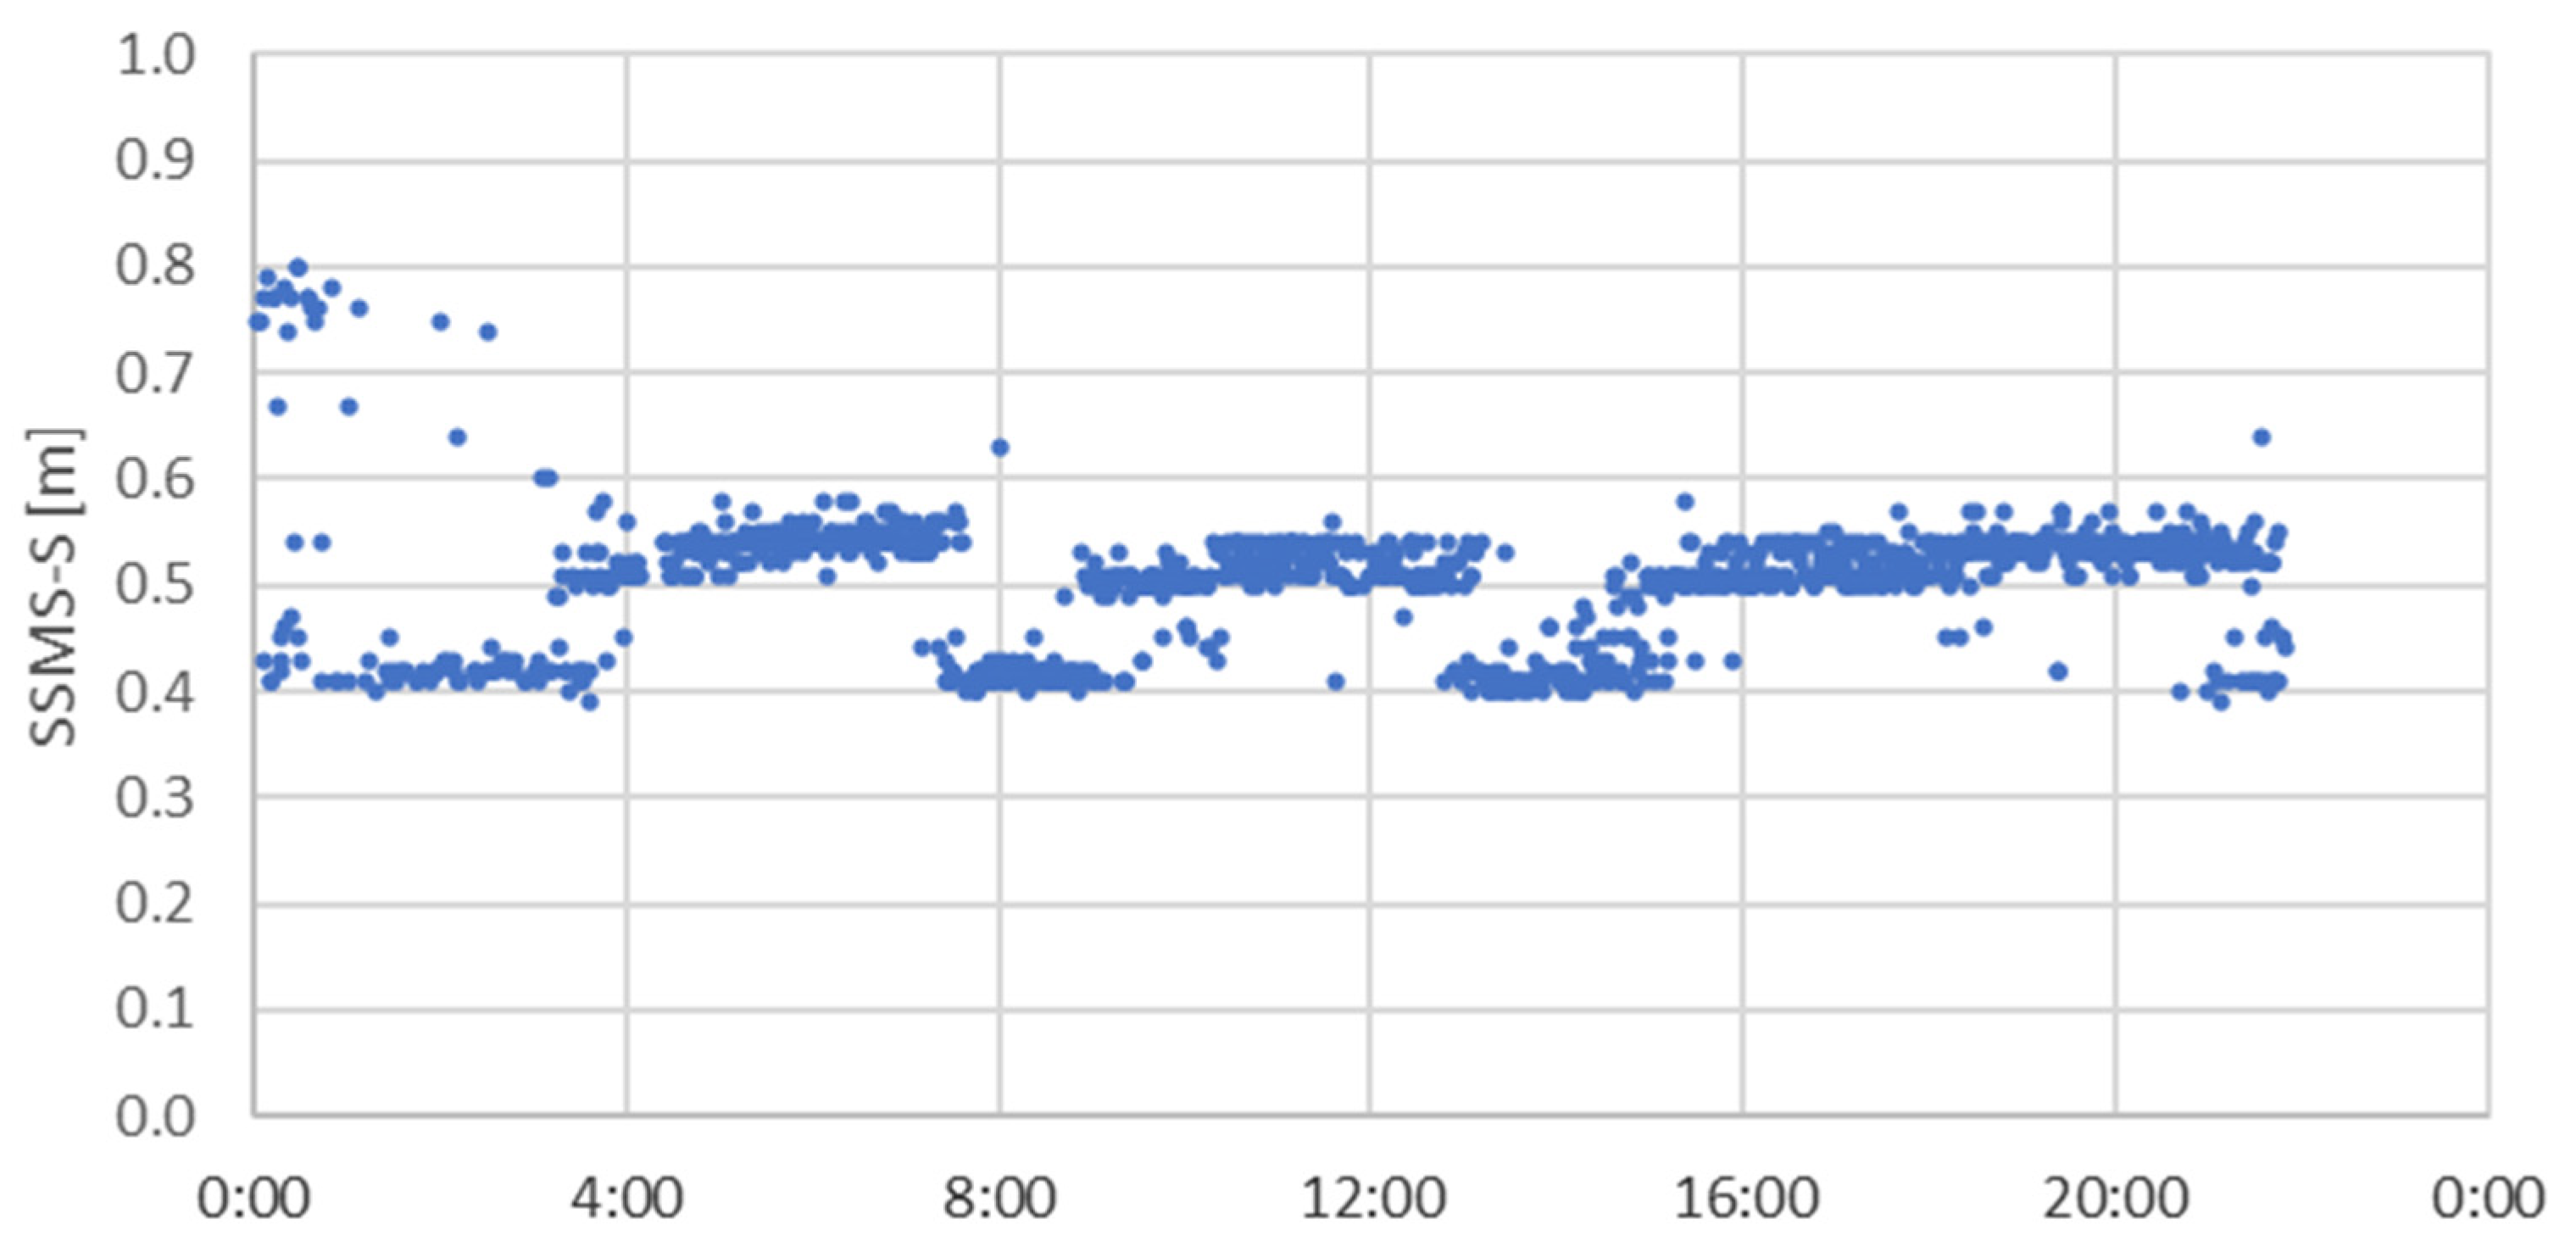
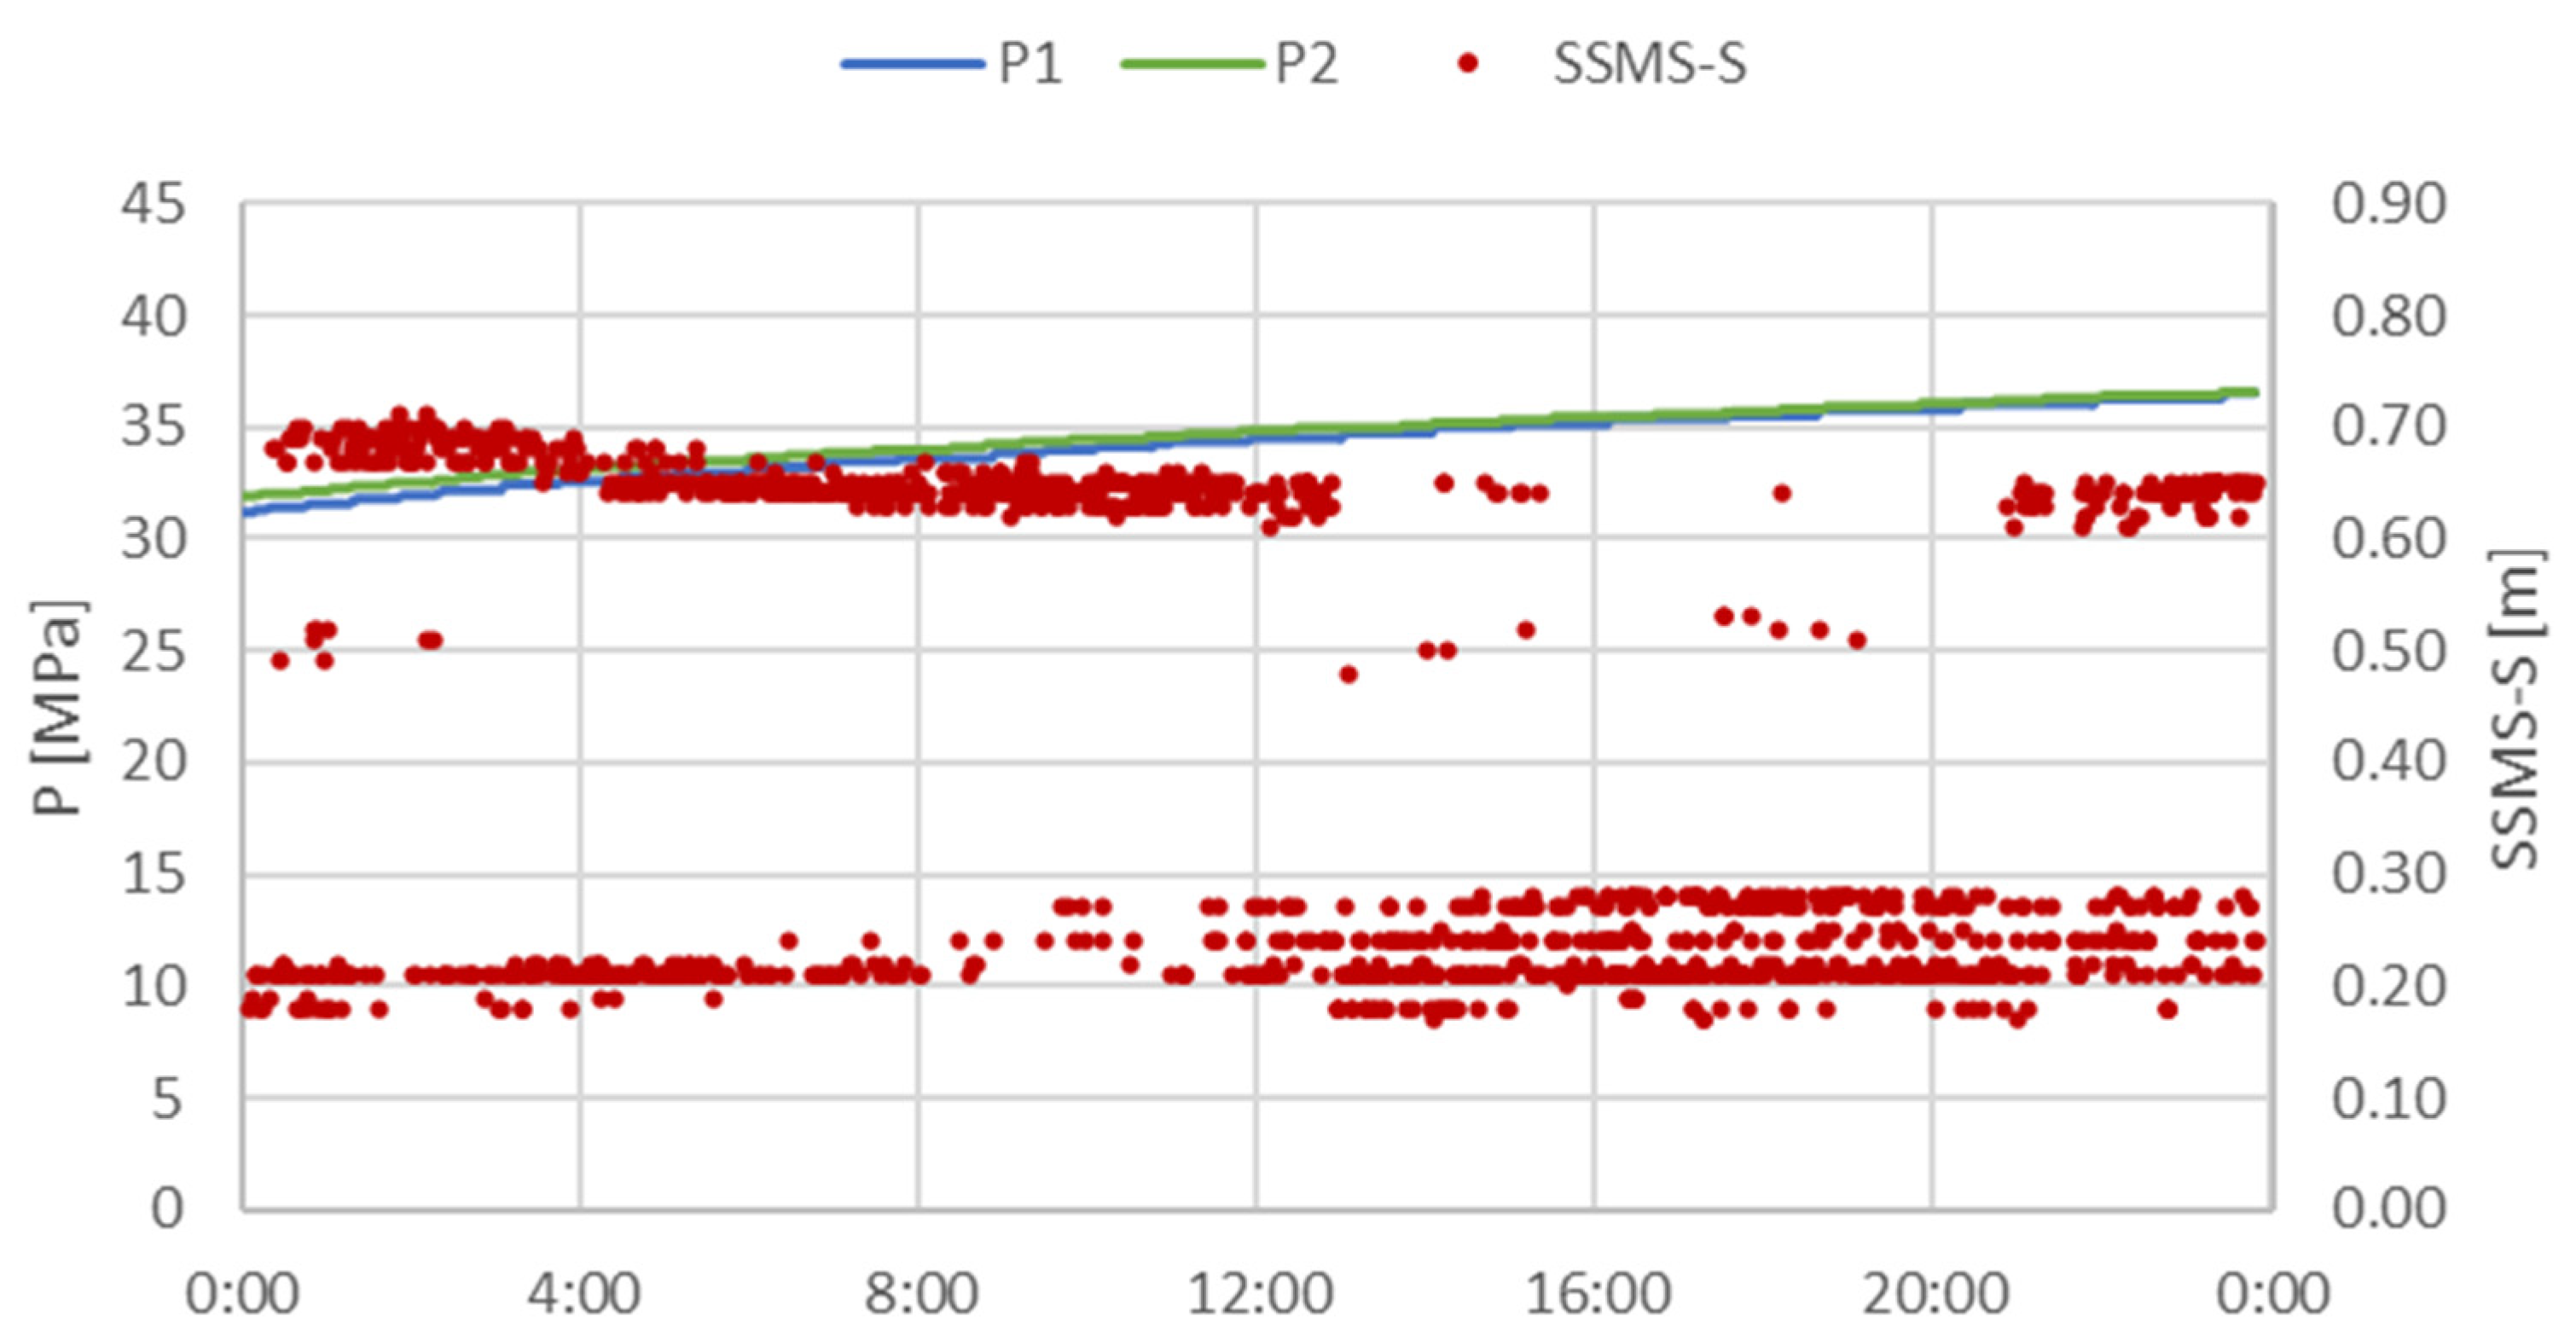
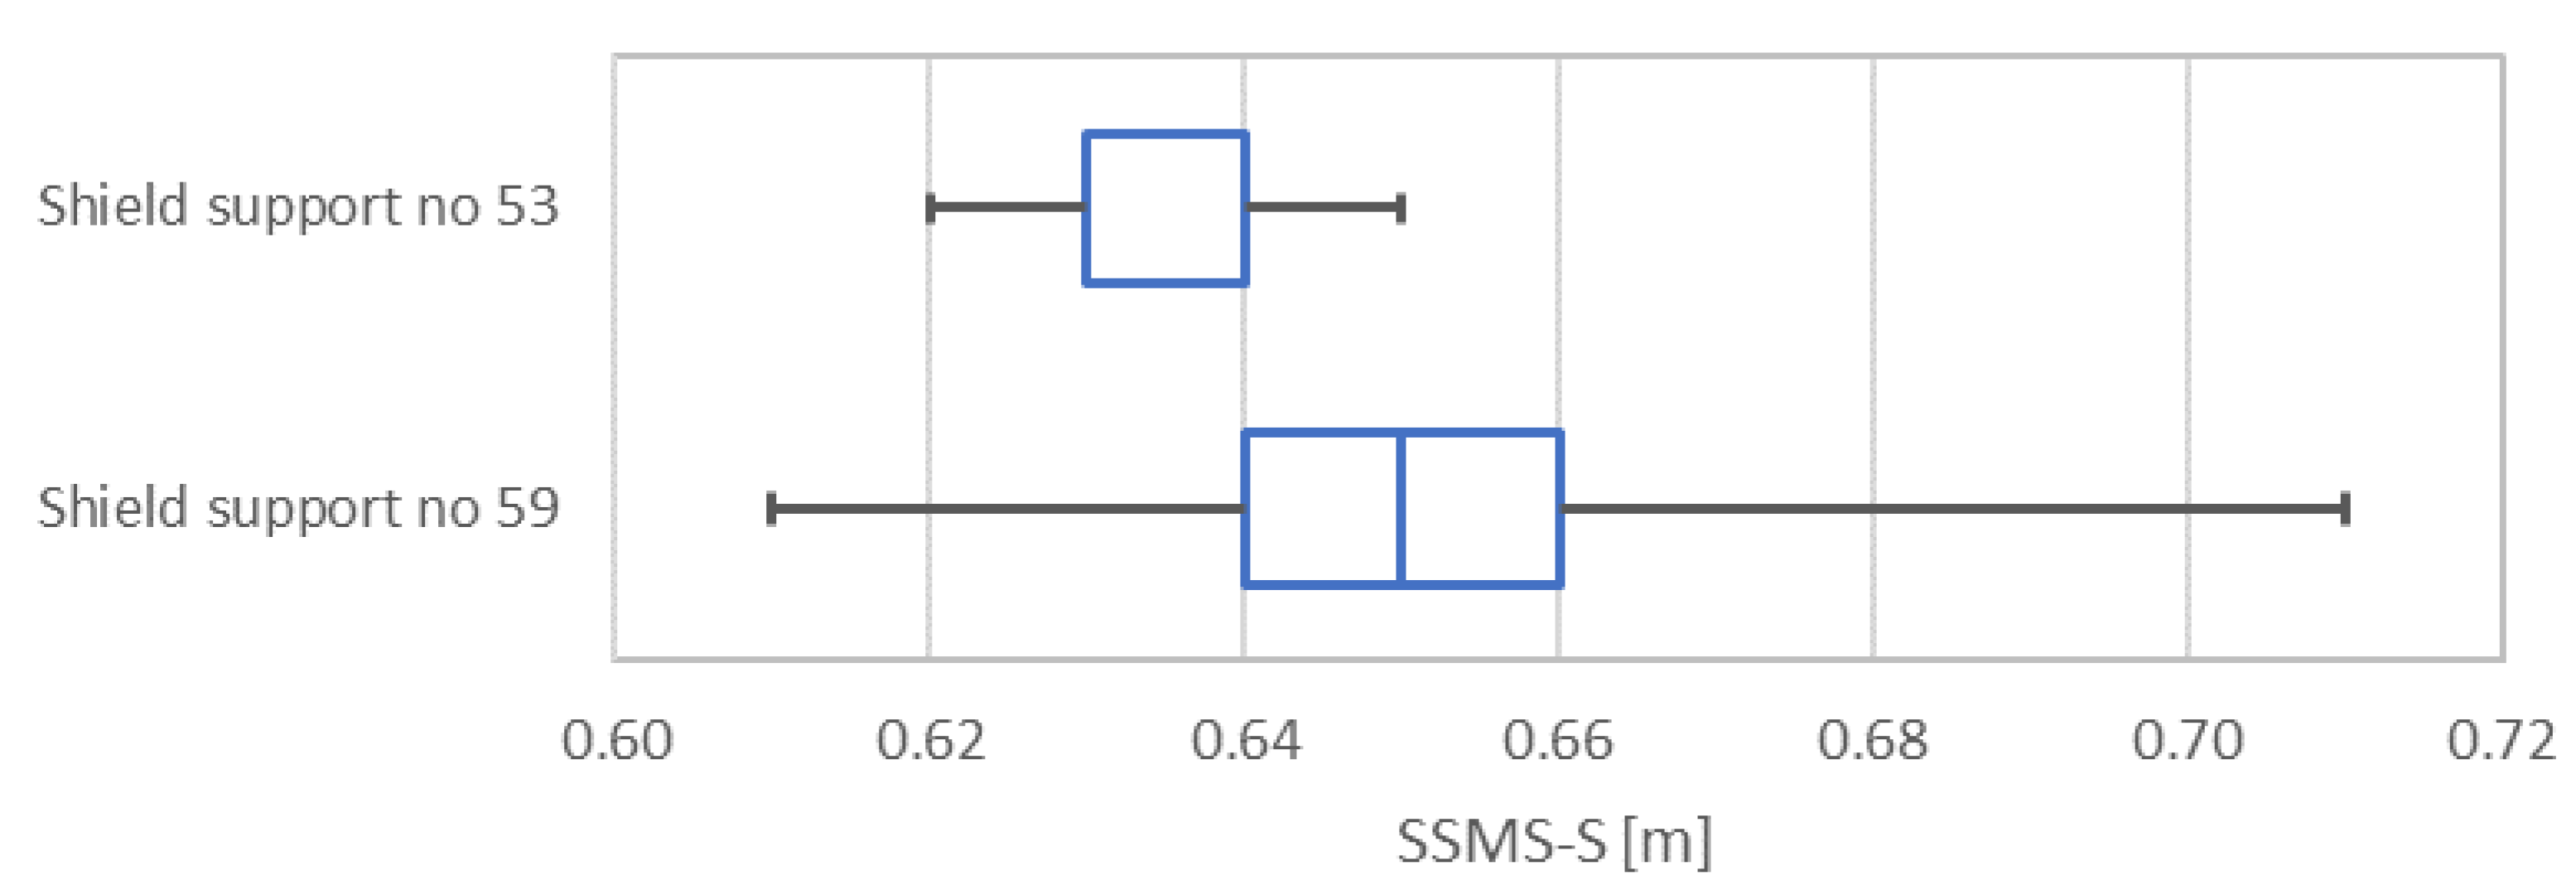
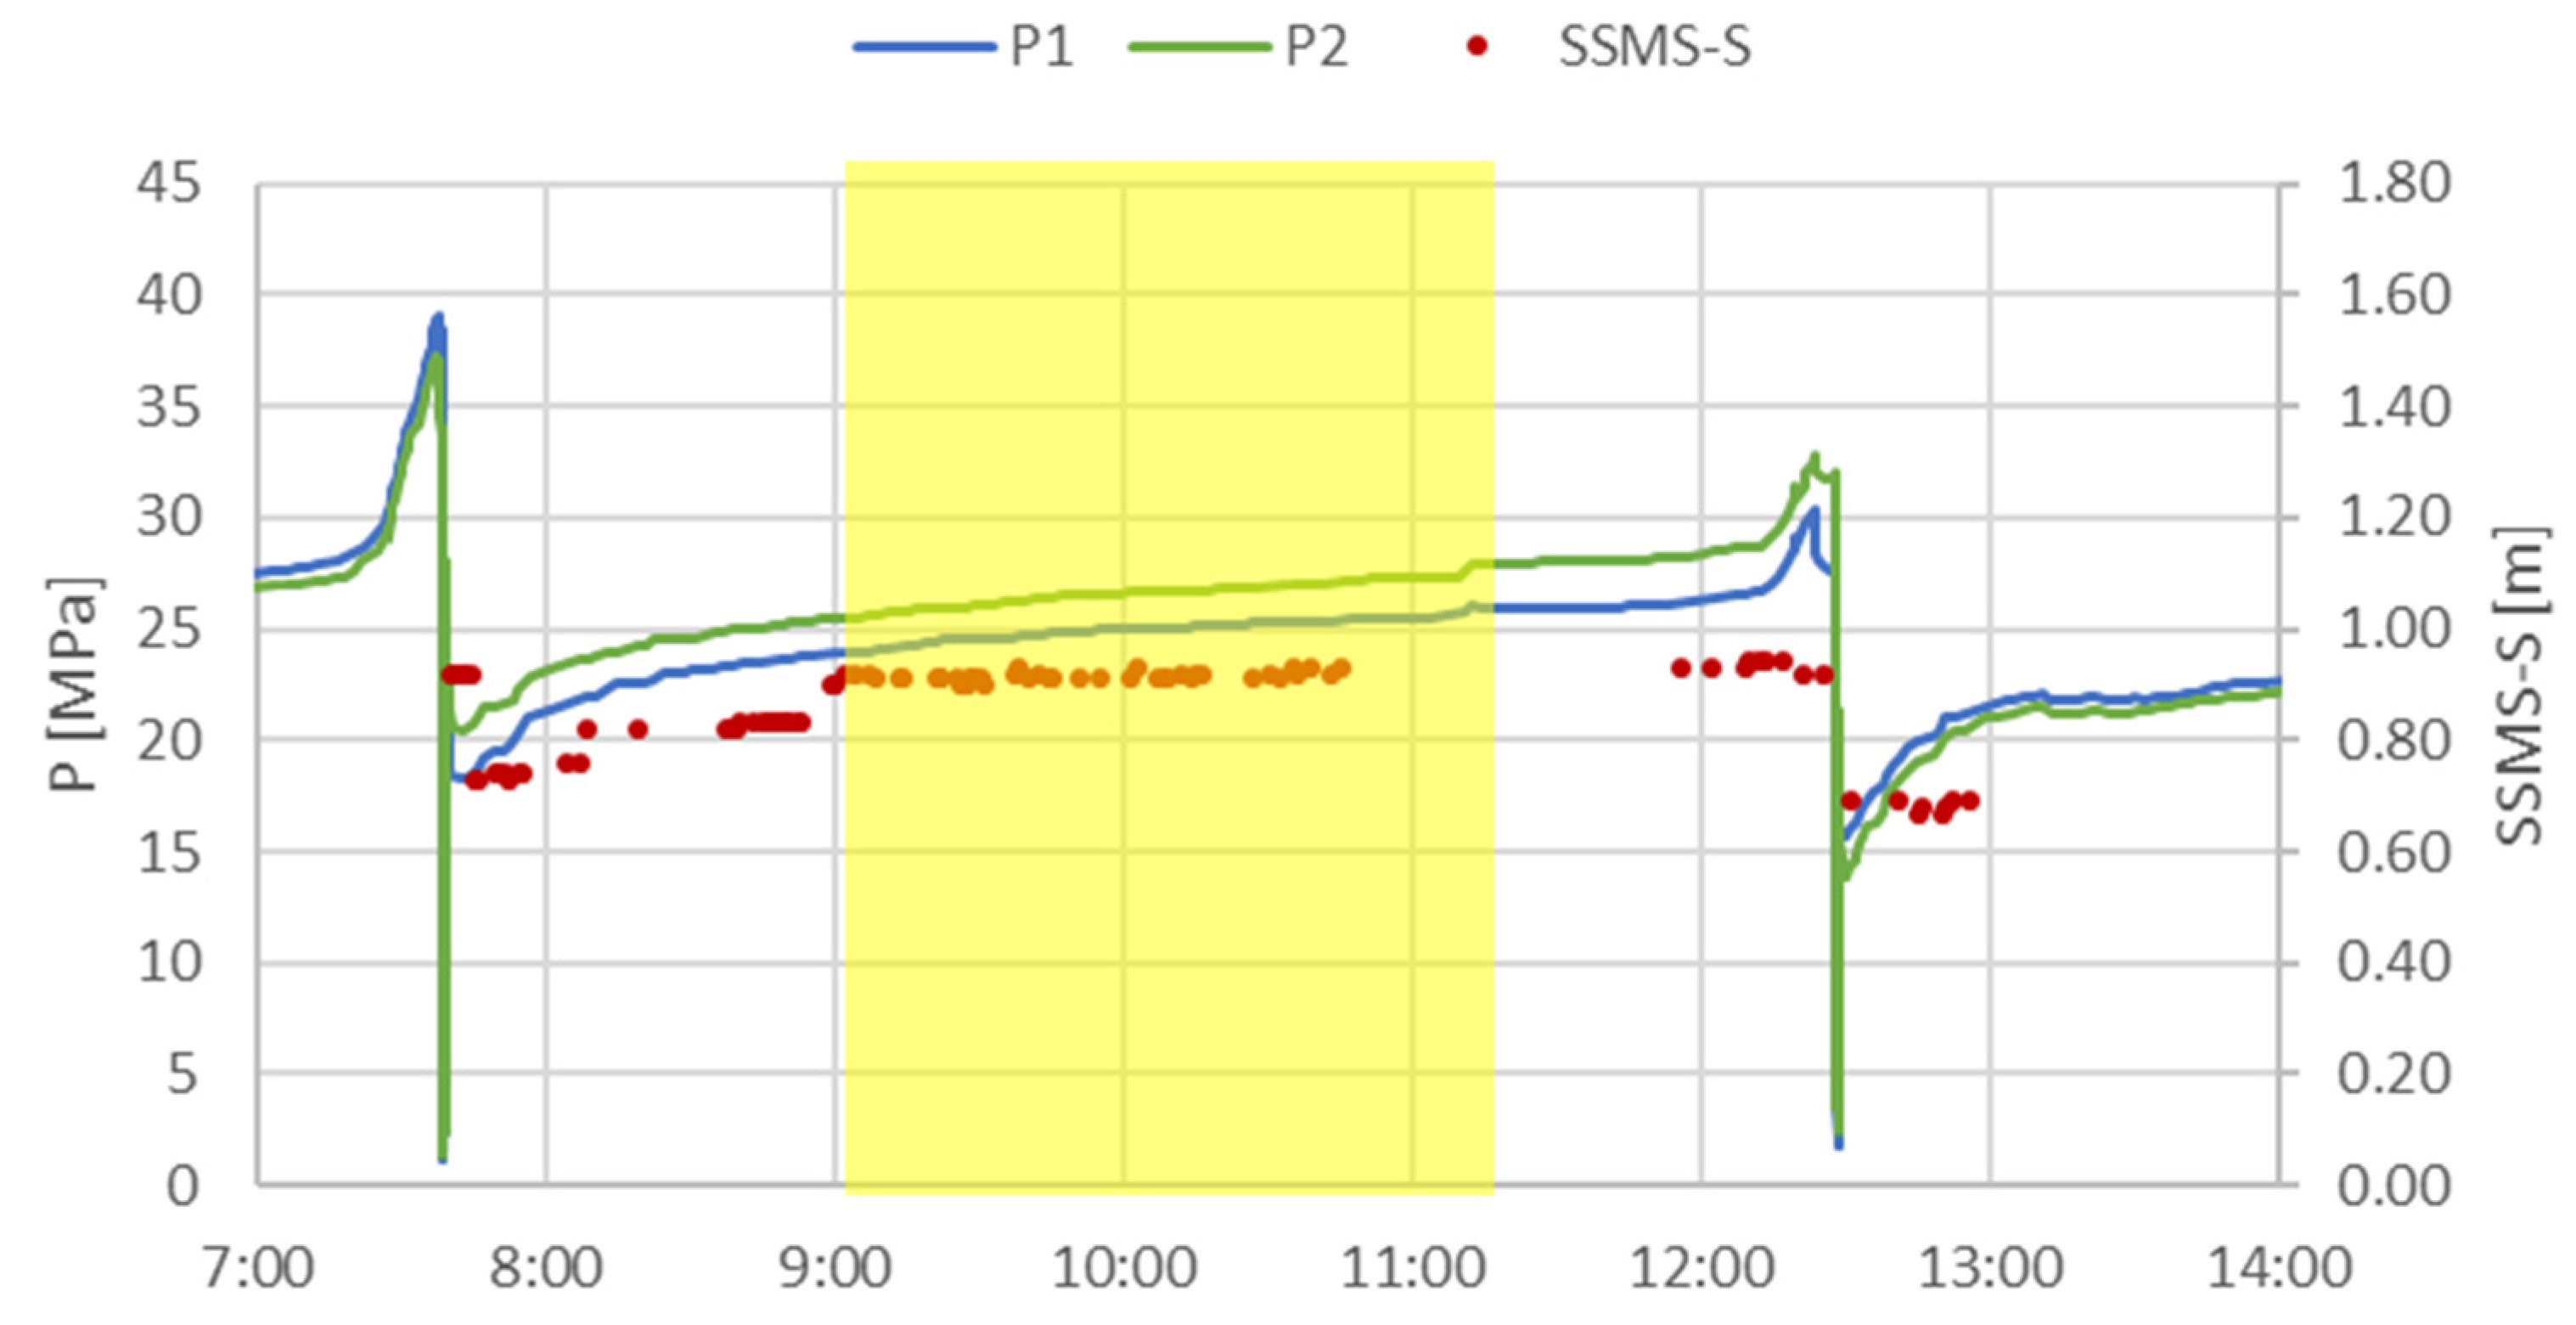
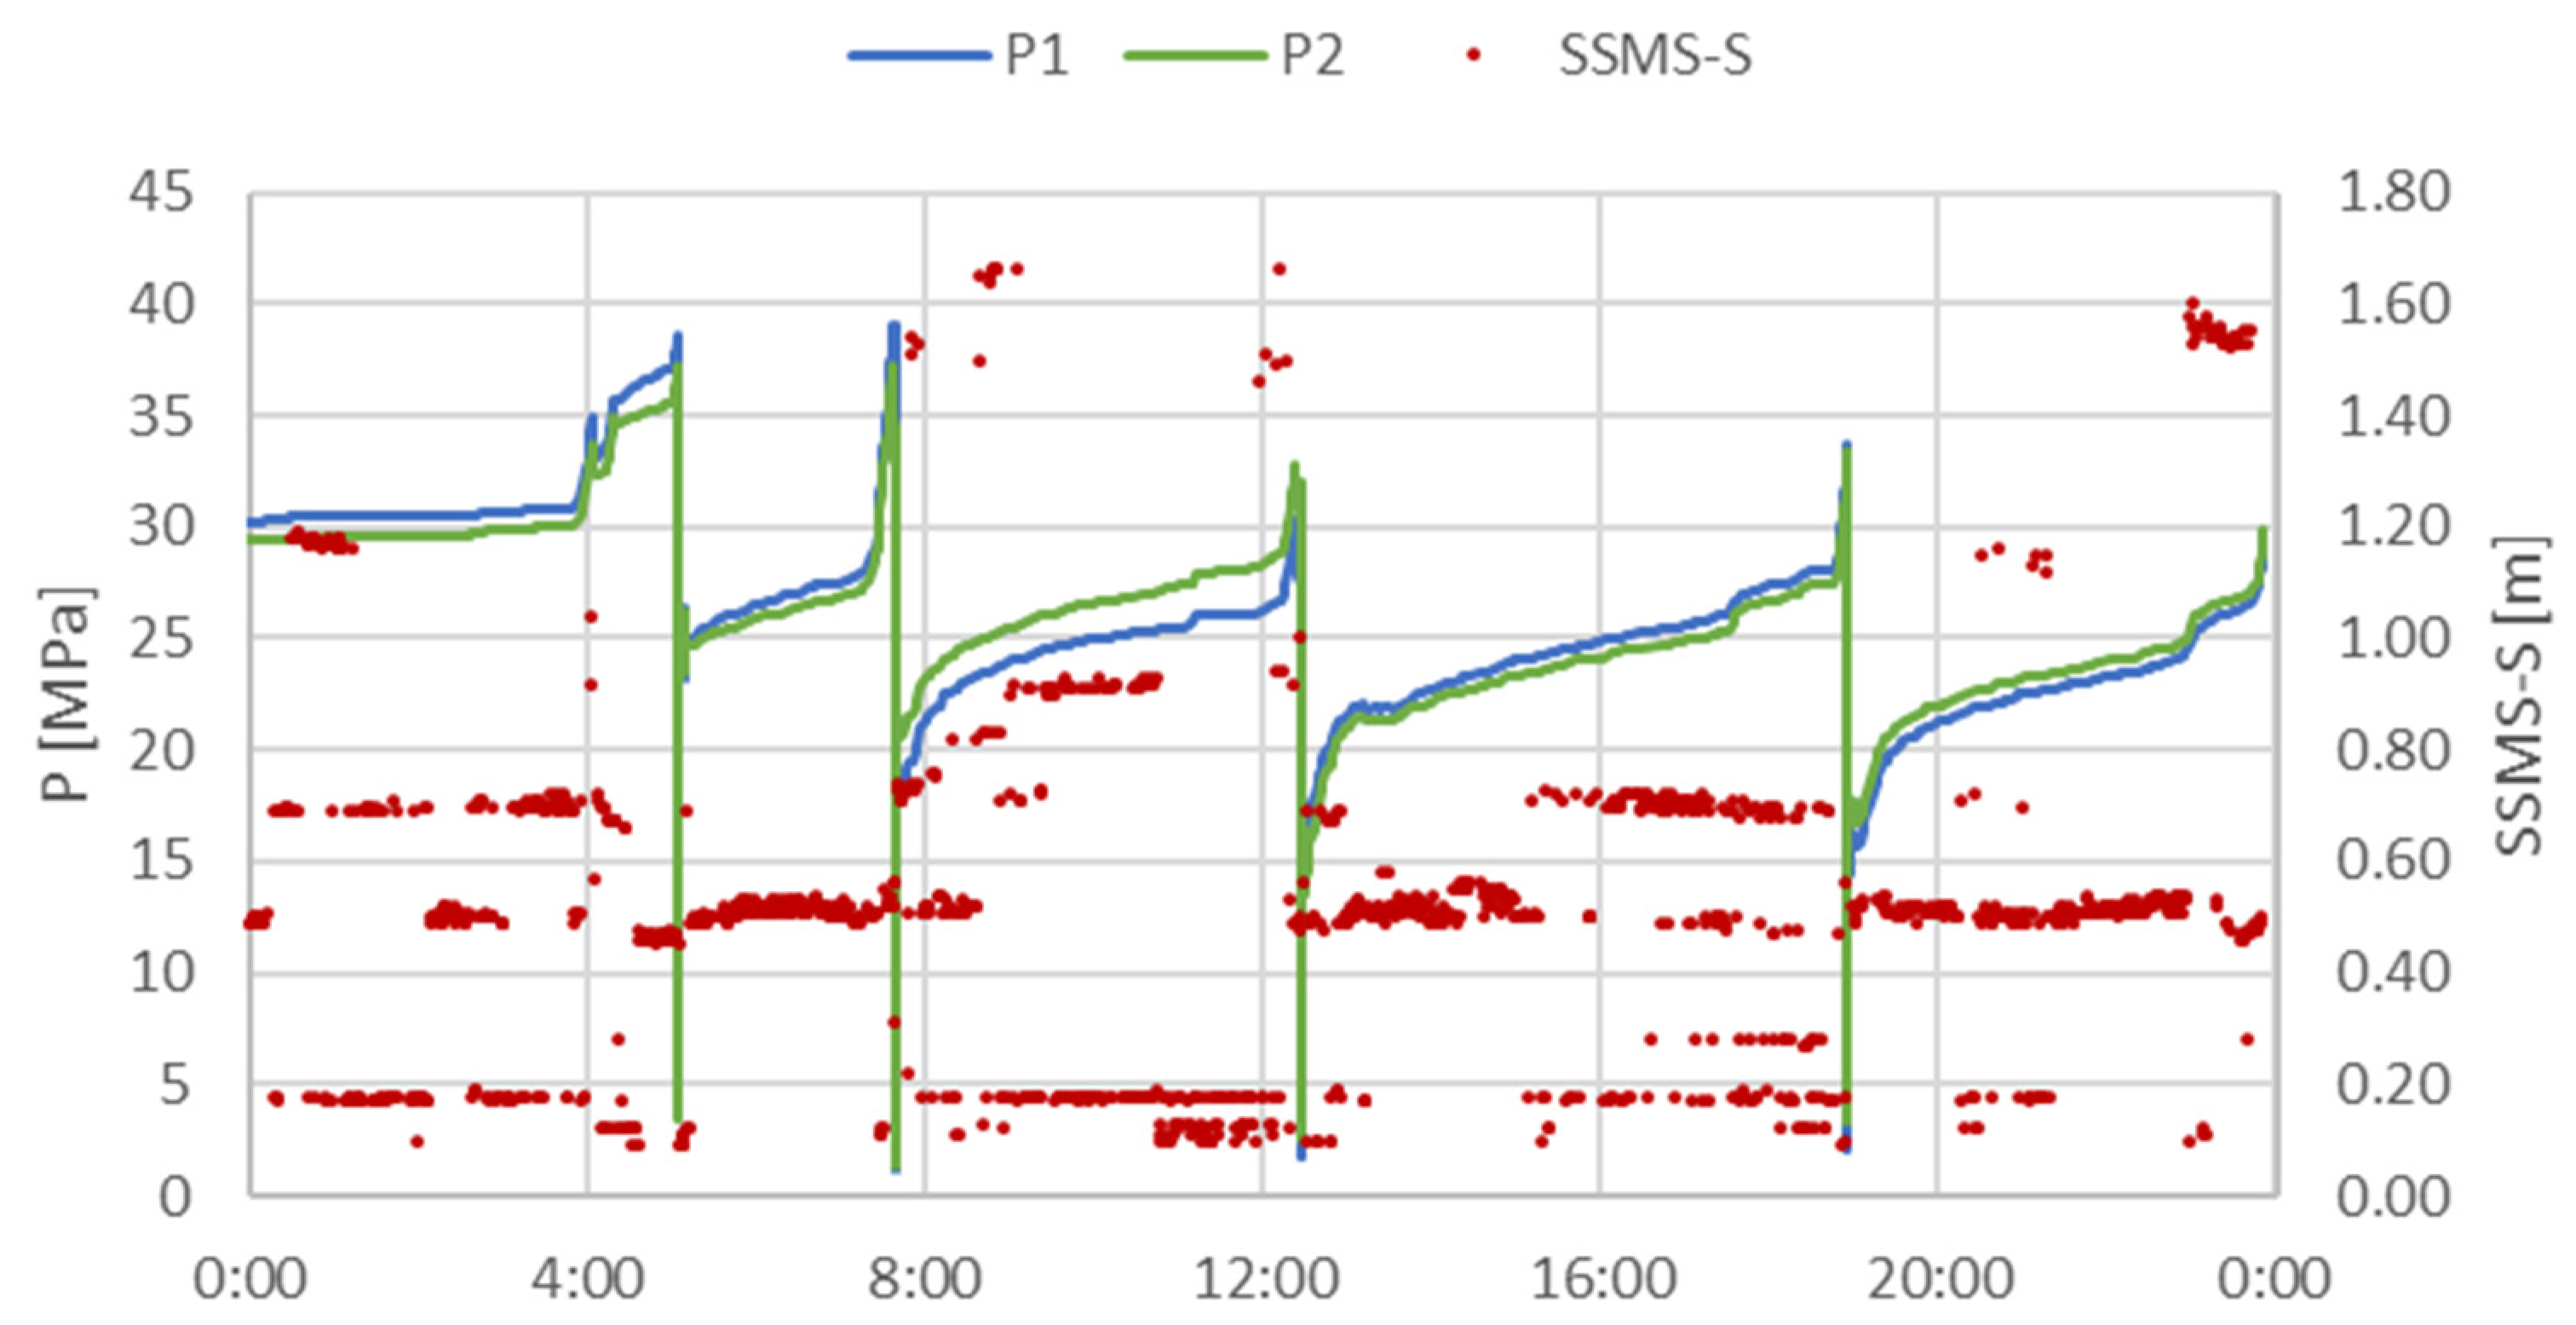
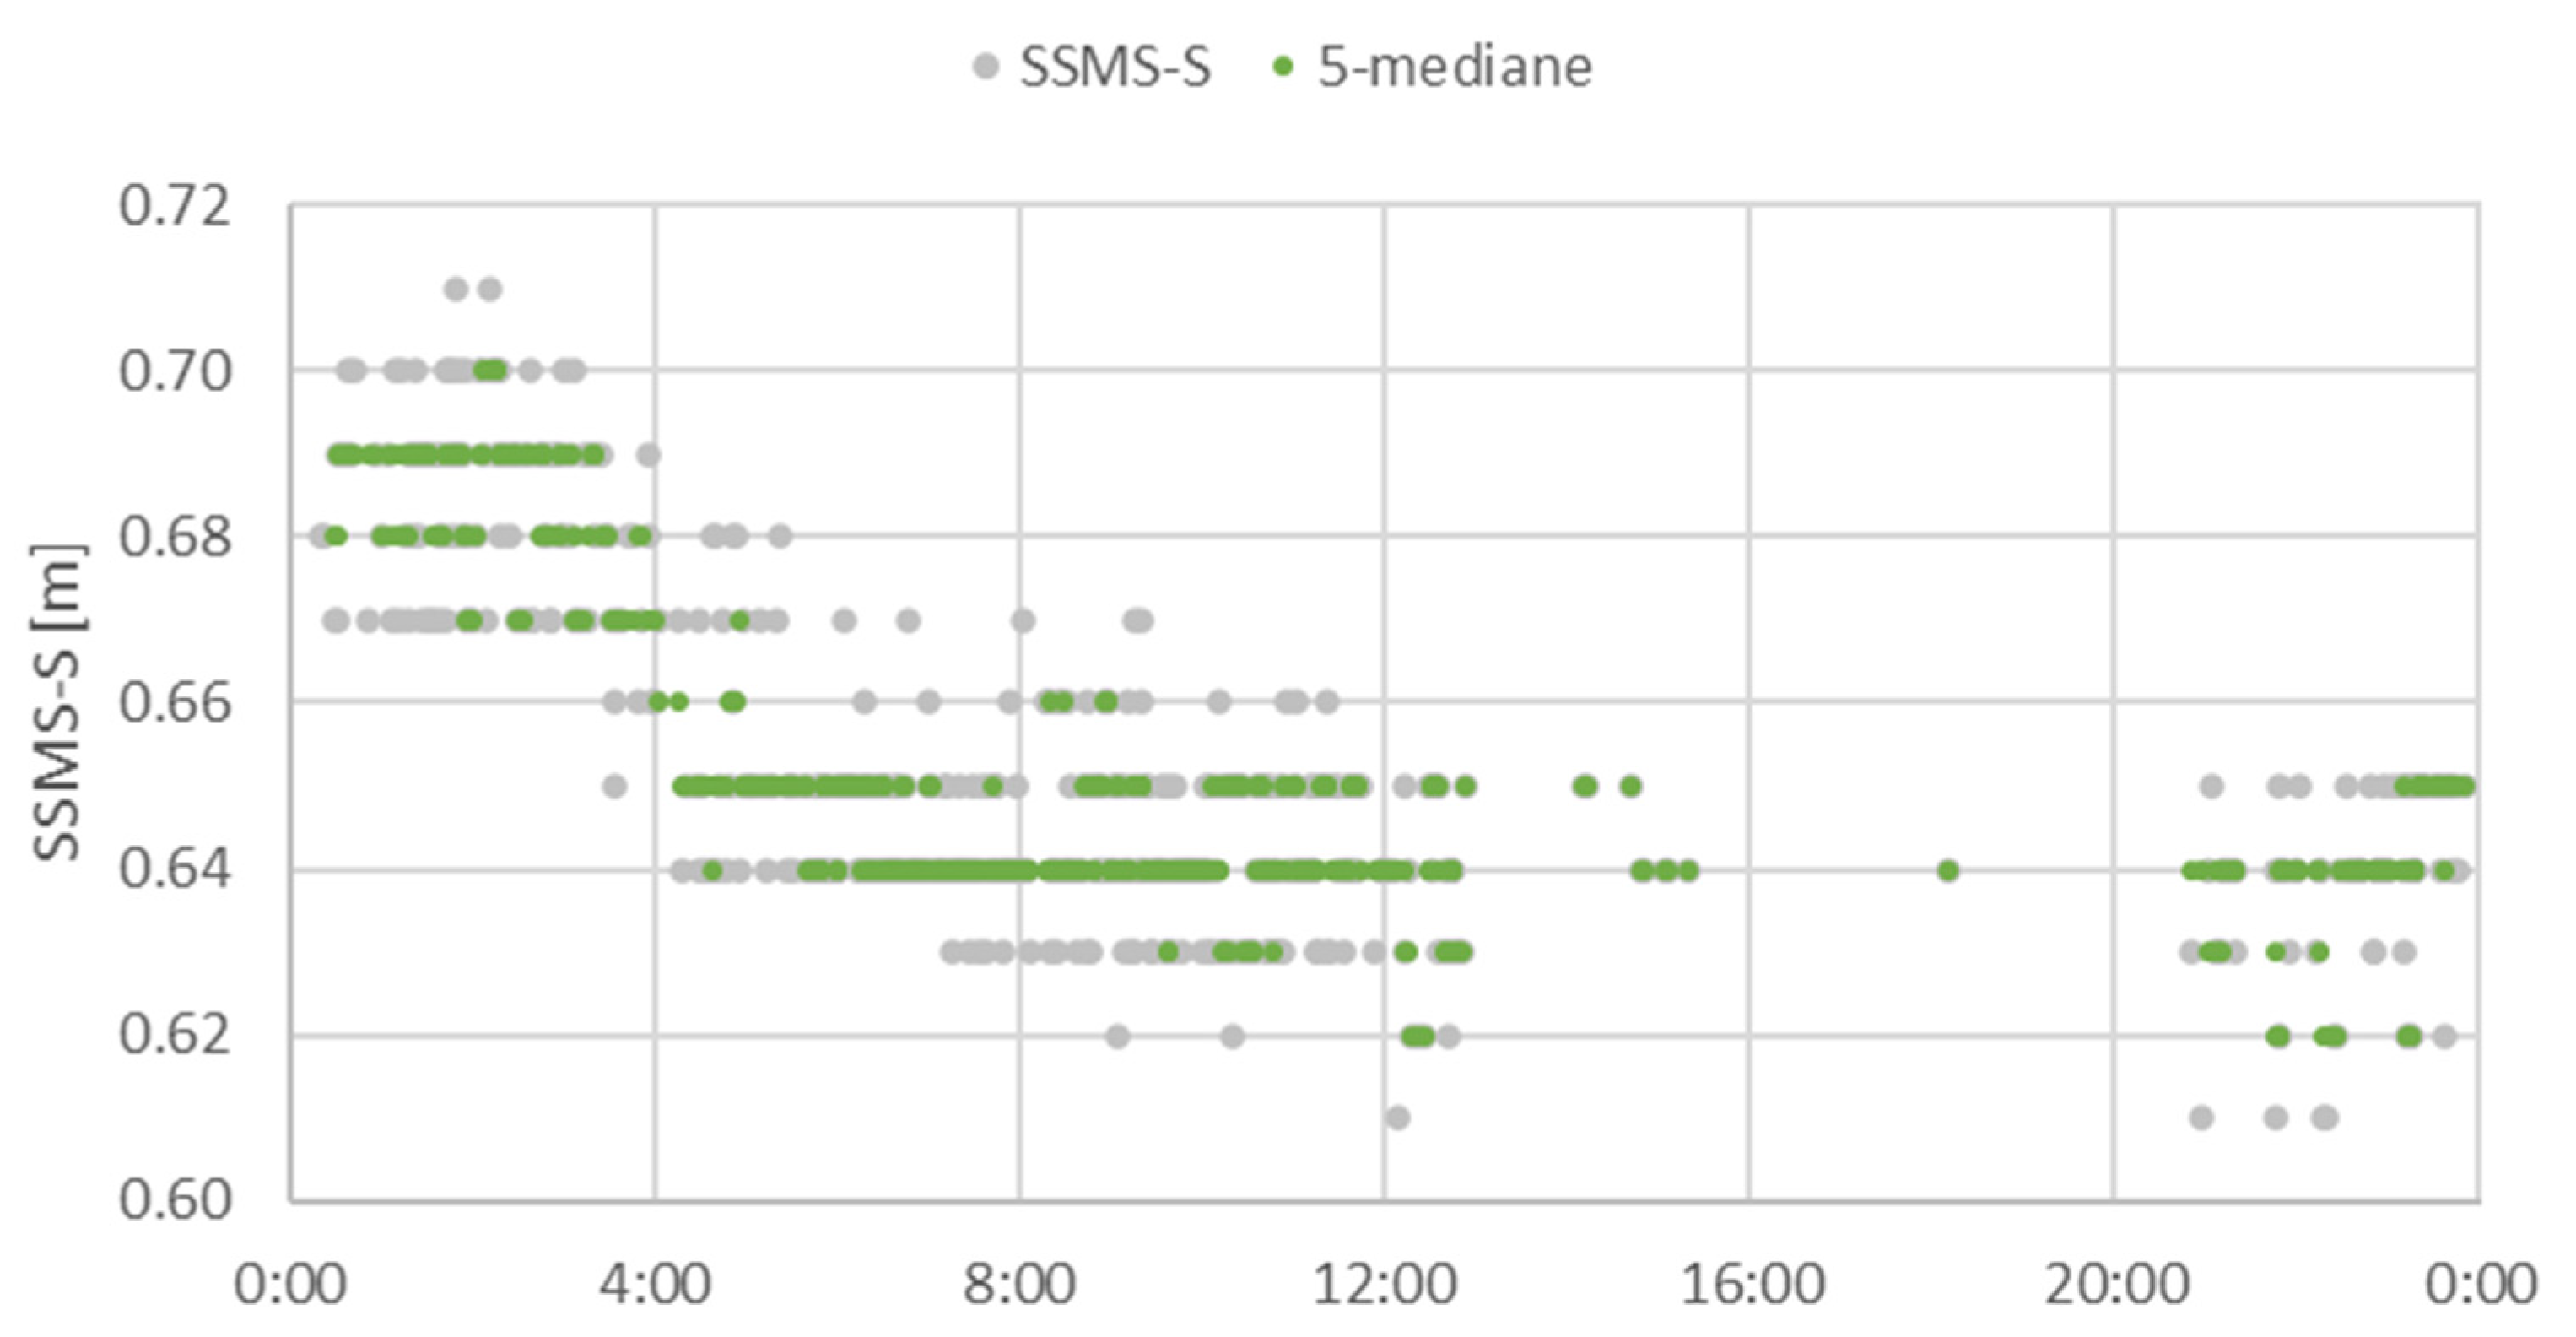
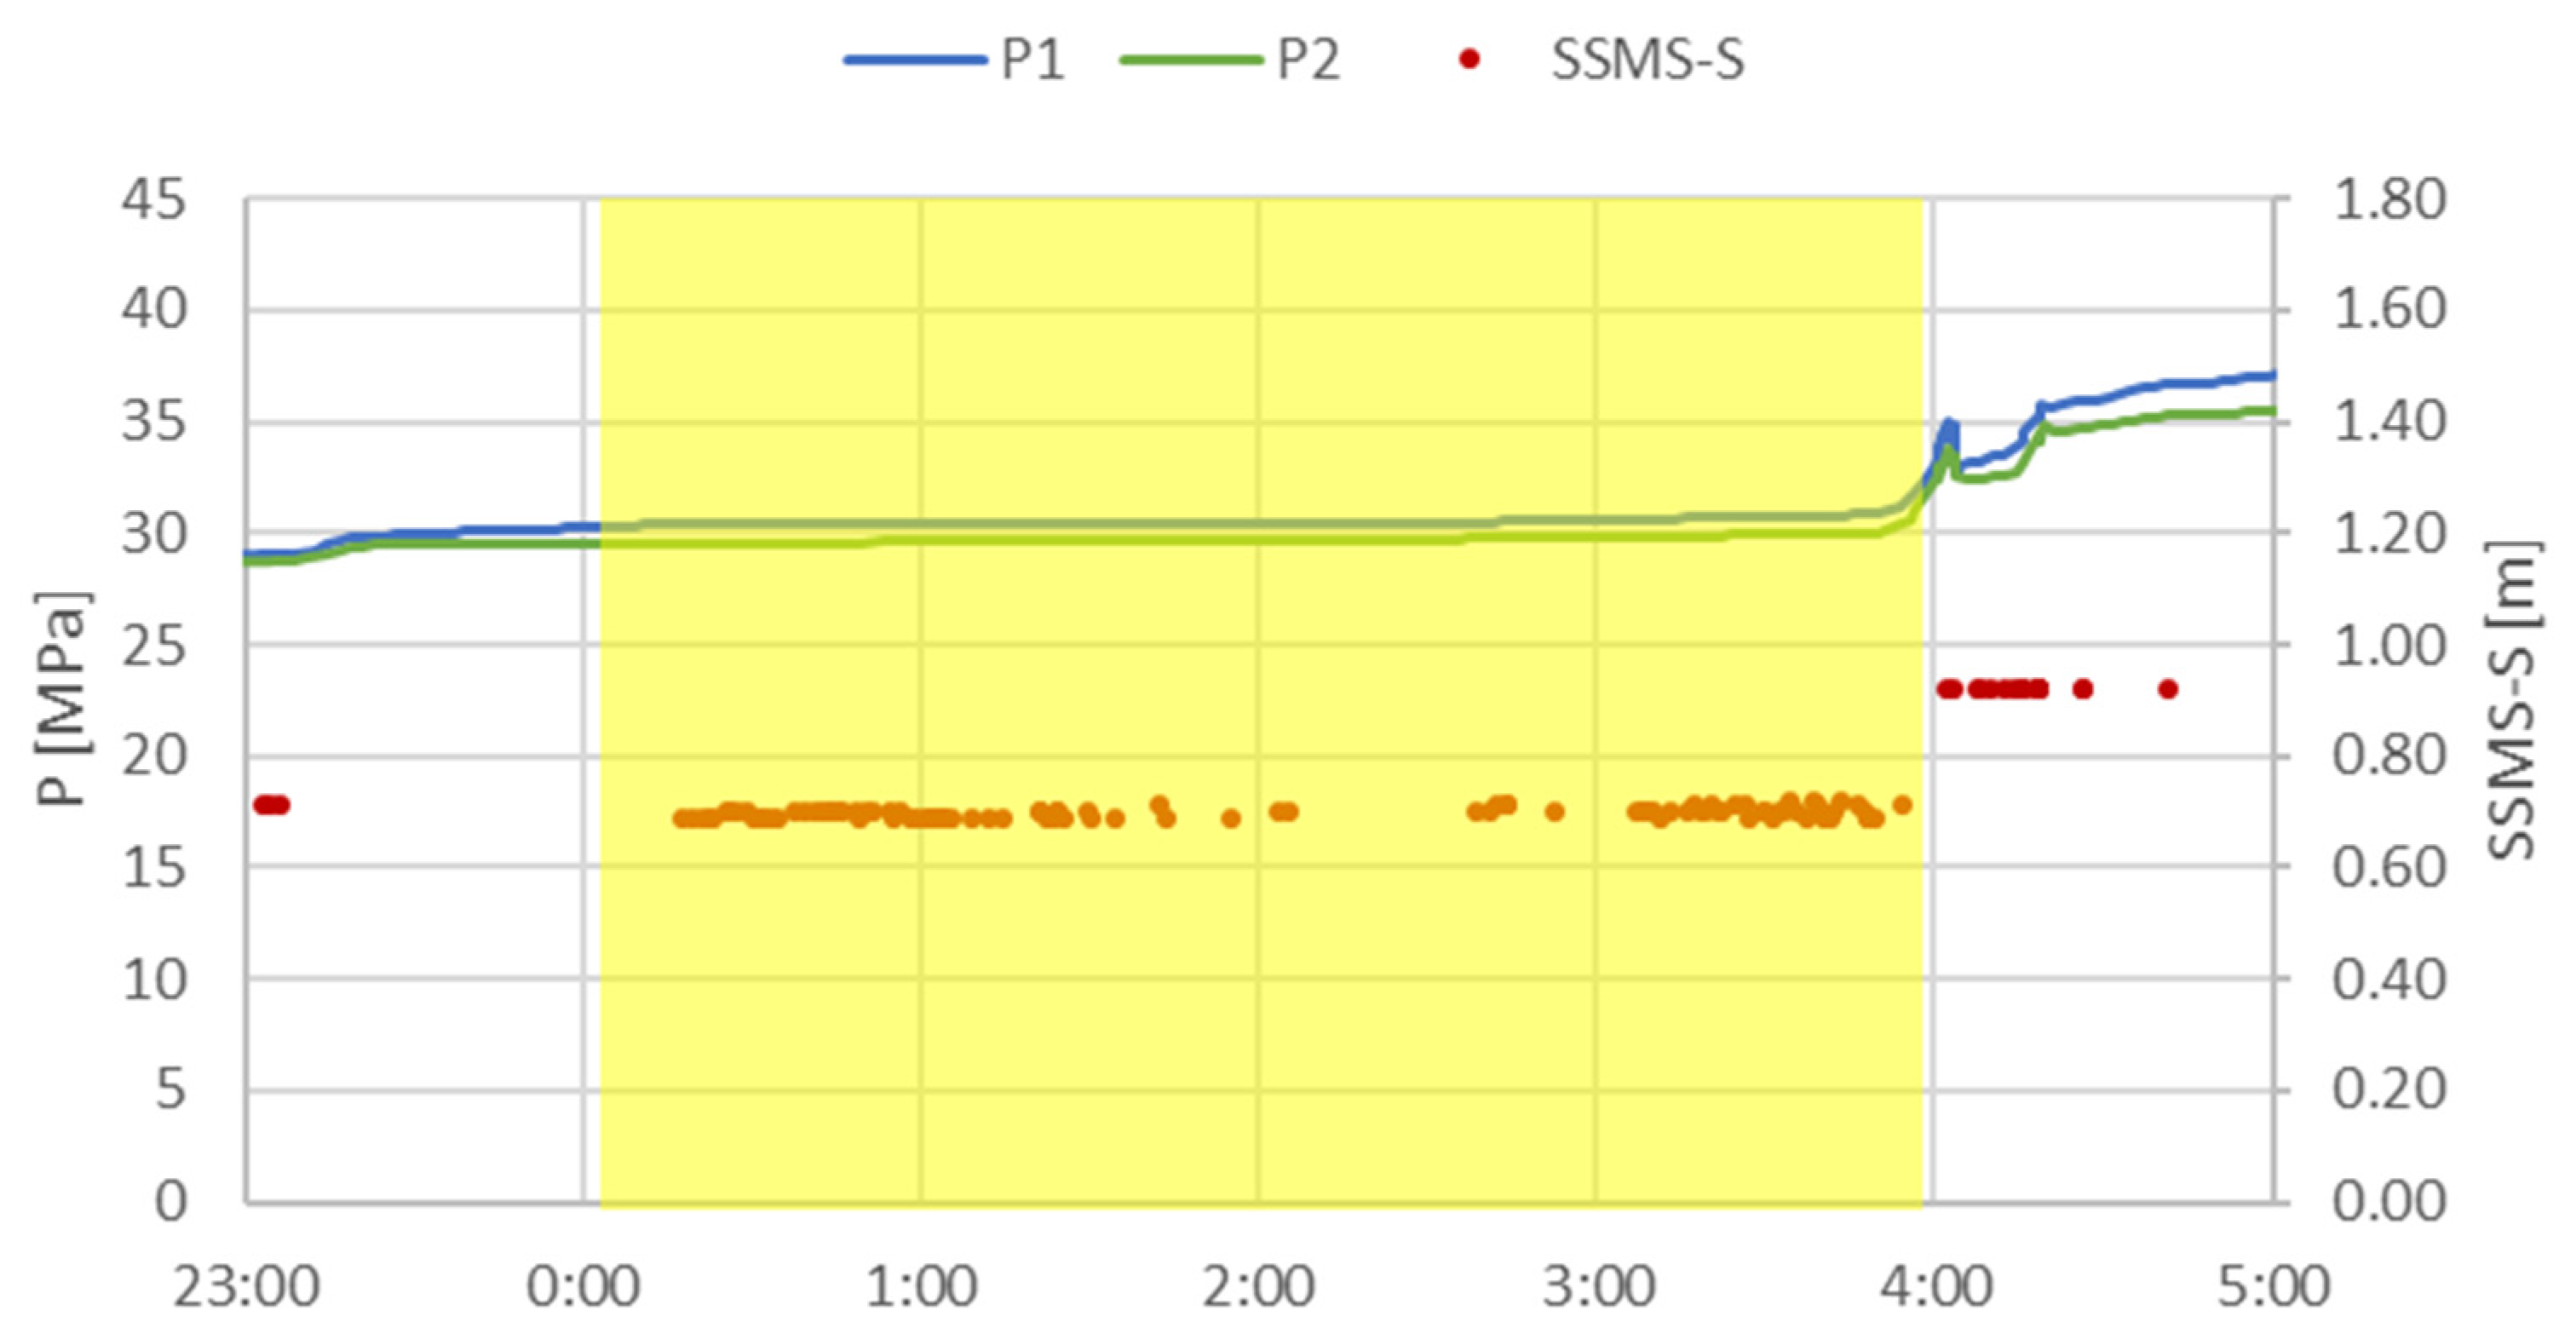
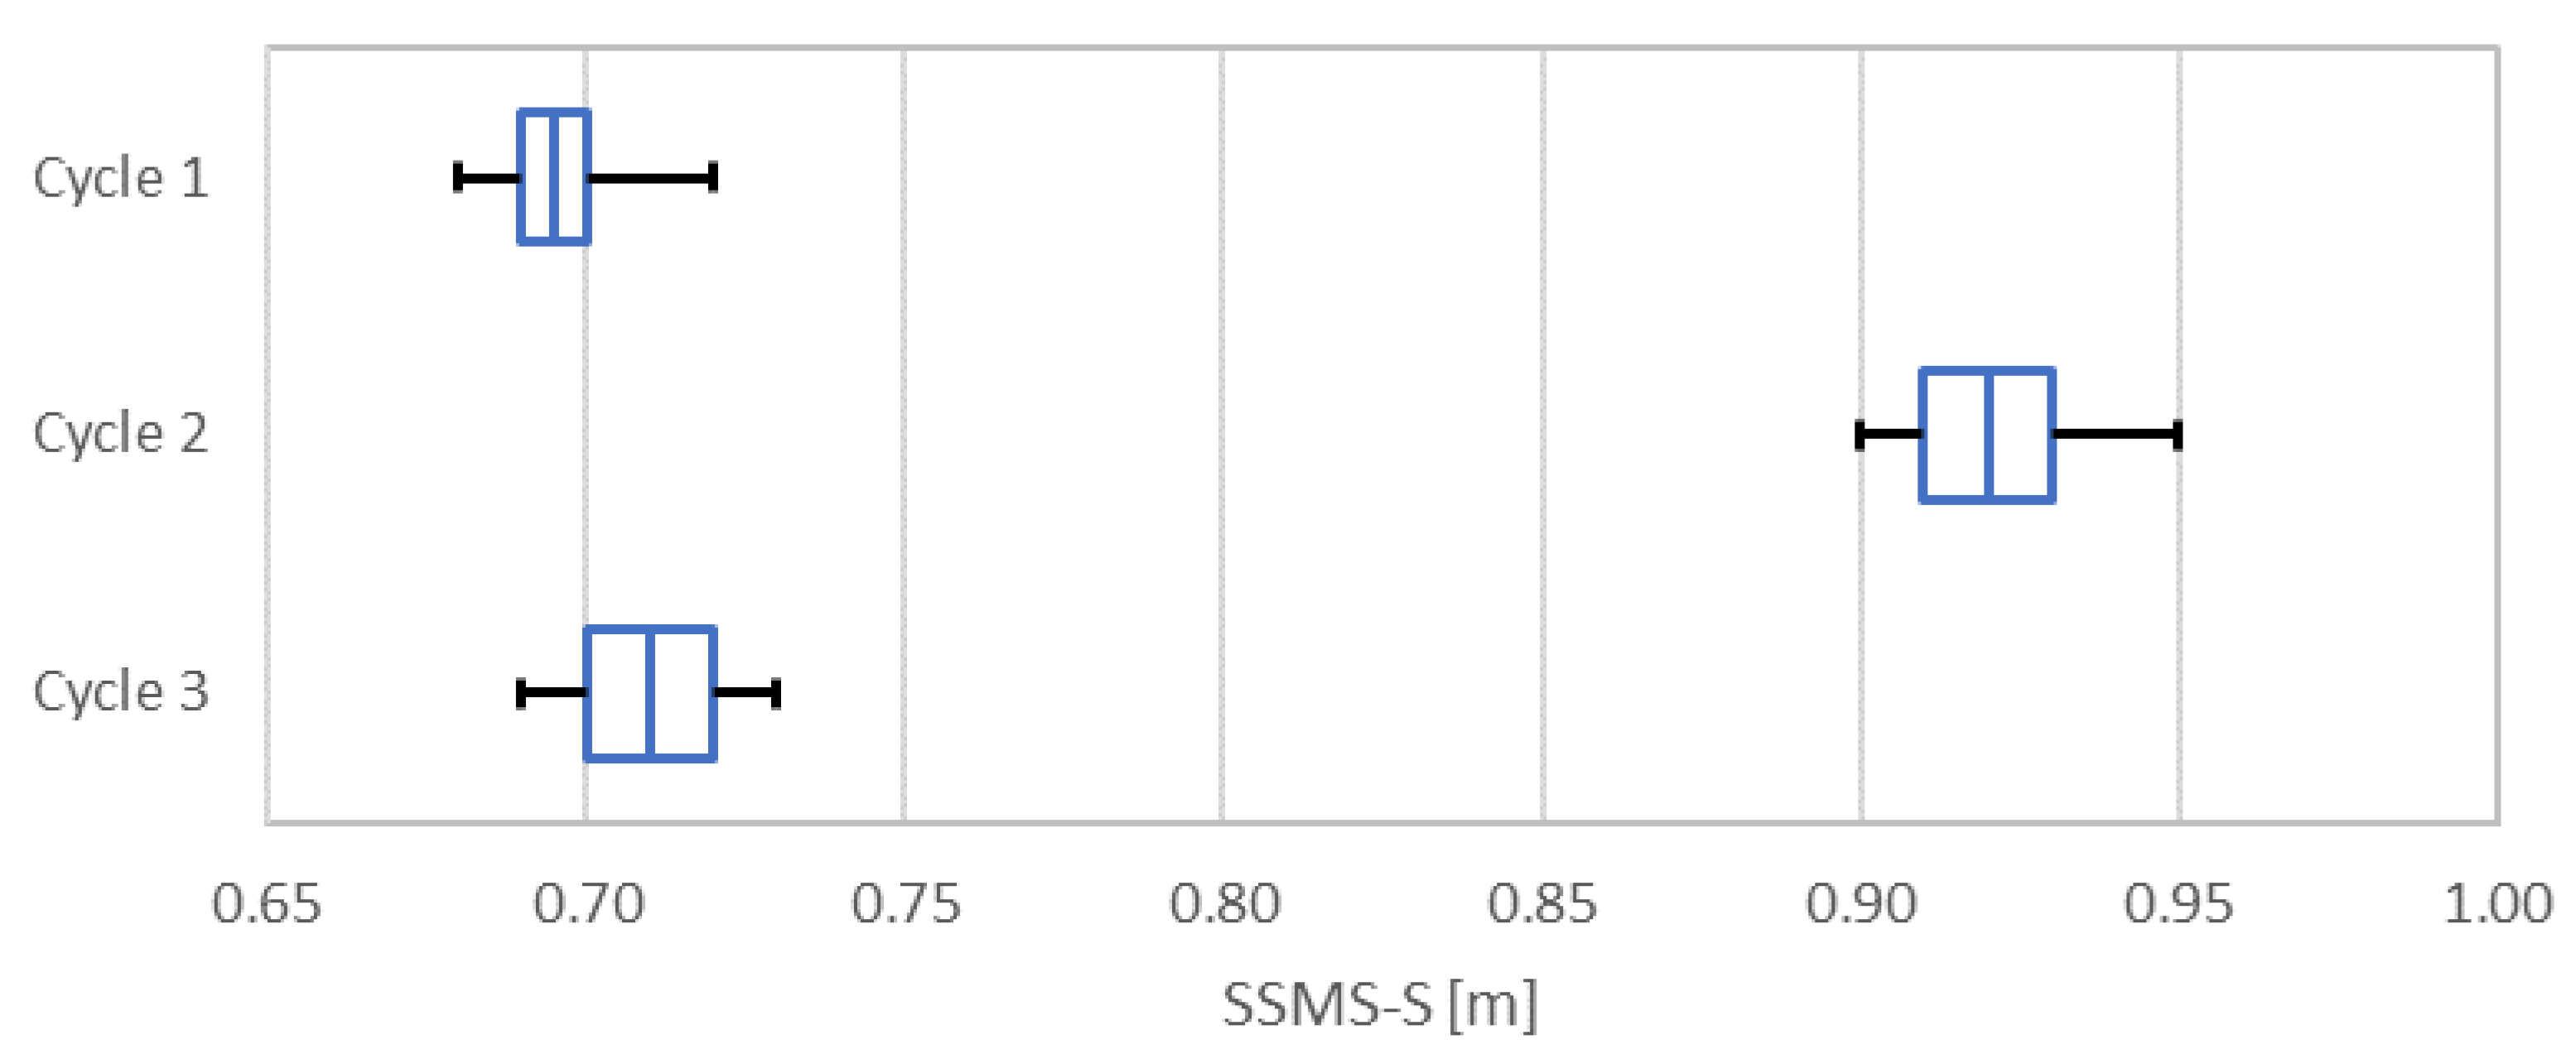
The full testing programme was finally realized at Budryk Mine (Figure 9). For technical reasons, it was not possible to take a photo of the sensor during testing at the mine.
During tests, KOMAG developed the visualization module especially dedicated for presentation of the geometry and pressure monitoring data. The measurement results are shown in Figure 10 and Figure 11. The figures show the corrupted tip-to face distance data. The value cannot change in such a way in work cycles of a roof support. It was necessary to use filtering algorithms for further analysis.

3. Results

These tests delivered a huge amount of monitoring data to be analysed. Data visualization and analyses were time consuming and required special data filtering and processing.
In order to assess the quality of the collected measurements and to analyse the accuracy of the measuring equipment, developed at KOMAG, data from the days when there was no mining activity were selected for further statistical analyses. On these days, pressure in the hydraulic system increased due to an increase in the rock mass pressure, as presented in Figure 12.
The above figures show that the sensors for some time misinterpreted the waves reflected from the transverse surfaces of the components at the end of the roof support as echo reflected from the longwall. In order to filter out erroneous data, the author’s algorithm was used to identify the correct wave reflected from the longwall face (Figure 13). The use of the author’s algorithm at this step was aimed at eliminating the blunders resulting from the fact of incorrect interpretation of the reflected wave, as well as from dirty sensors. In the algorithm used by the authors, data related to the geometry of the section, as well as those resulting from the place and method of installation (e.g., at a certain angle) are used for pre-filtering of the data.
Figure 14 shows the box-and-whisker plot. It contains information on the location, scatter, and shape of the distribution of the analysed data, the tip-to-face distance, in the selected period of time, when there was no mining activity [20,21]. The following information can be read from the charts of this type, also called box-and-whisker plots:
  • Position of outliers;
  • Position of untypical values;
  • Position of the highest and lowest values (or the highest and lowest values not deviating from others);
  • Position of quartiles.
A quartile is one measure of the position of an observation, the value of a characteristic in an ordered statistical series below which n k W   statistical units are located, while the values of the remaining n n k W   units are not less than this value. The difference between the third and the first quartile is the so-called quartile range while its half is the quartile deviation [21,22,23,24,25]. It is denoted as:
  • Q 1 : the first quartile, divides a frequency distribution in the ratio 25%:75%;
  • Q 2 : the second quartile or median, divides a frequency distribution in the ratio 50%:50%;
  • Q 3 : the third quartile, divides a frequency distribution in the ratio 75%:25%.
The interquartile range (IQR) is defined as follows:
I Q R = Q 3 Q 1
The length of the box is equal to the quartile range. The minimum and maximum values are marked by characteristic lines, the so-called whiskers. Inside the box, a new line marks the median value. If the median is in the middle of the box, we can conclude that the distribution of a given characteristic is symmetric. If the median divides the box into two unequal parts and the whiskers are of different lengths, we may be dealing with an asymmetric distribution, which means that the results of a given variable are not arranged symmetrically around the mean. Depending on the length of the whiskers—larger on the right or left side—this results in right or left asymmetry, respectively [20,22,23,24].
Measures of central tendency (medians) and measures of variability (min-max values, quartiles) were calculated for each variable, and the selected values are presented on the chart as error bars. In 2W bar charts (a concept first used by Tukey, 1970), ranges of values of selected variables were plotted separately for groups of cases defined by the values of the categorising (grouping) variable, the shield support numbers. Central tendency (median) and scatter statistics (quartiles, min-max values) were calculated for each case group and are presented in Table 1 [22,23,24].
Calculating the median and quartiles for a distribution series:
M e = x 1 M e + ( 1 2 n i = 1 m n i ) · c n M E
Q 1 = x 1 Q 1 + ( 1 4 n i = 1 m n i ) · c n Q 1
Q 3 = x 1 Q 3 + ( 3 4 n i = 1 m n i ) · c n Q 3
where:
x 1 M e : the lower bound of the interval containing the median (or quartile);
m : the number of intervals preceding the interval with the median (quartile);
c : the length of the interval in which the median (quartile) is found;
n M e : the size of the interval in which the median (quartile) is found.
The length of each whisker is equal to 1.5 I Q R , unless:
  • The maximum value is less than Q 3 + 1.5 I Q R ;
  • The minimum value is greater than Q 1 1.5 I Q R .
In this case, the length of the whisker is determined by the maximum or minimum value, respectively. Observations outside the three times IQR are outliers [24].
The standard deviation is a measure of variability and, alongside the arithmetic mean, is the most commonly used statistical concept. The standard deviation represents how widely the values of a quantity are scattered around its mean. The smaller the value of the deviation, the more the observations are clustered around the mean [22,23,24].
For finite populations, the deviation is the mean squared of the differences between the values of a variable and their arithmetic mean. The standard deviation can be calculated from the following formula:
σ = i = 1 N ( x i μ ) 2 N = i = 1 N x i 2 N μ 2
where:
xi: each value of the population;
μ: expected value;
N: total number of values.
The second equation is true only for a finite population, and is not true for the sample standard deviation, where the sample arithmetic mean must be used instead of μ (the expected value) [22,23,24].
In the case of shield support No. 59, the value of the standard deviation is larger than in the case of shield support No. 53. This indicates a slightly greater dispersion of data in this case. This may be due to the fact that, after filtering out misinterpreted data, a longer period of data collection was analysed for roof support No. 59.
Values of excess kurtosis and skewness other than zero mean that it is not the normal distribution. A distribution with excess kurtosis less than zero (roof support No. 53, kurtosis = −0.763) is called platykurtic. Compared to a normal distribution, its tails are shorter and thinner, and central peak is lower and broader. A distribution with excess kurtosis greater than zero (roof support No. 59, kurtosis = 0.099) is called leptokurtic. Compared to a normal distribution, its tails are longer and fatter, and the central peak is higher and sharper. The skewness for shield support No. 53 (skewness = 0.114) and No. 59 (skewness = 0.882) is greater than zero. This indicates that the distribution is not symmetric and is not a normal distribution for which the skewness is zero. Positive values for the skewness indicate data that are skewed right.
The values of the coefficient of variation are lower than 10%, which allows us to assume that the data set does not show much differentiation and that the data can be considered homogeneous.
In the next step, signal smoothing methods used to compensate for periodic disturbances were analysed. Savitzky–Golay smoothing and moving average and median methods were used to smooth the data and eliminate erroneous data (Figure 15, Figure 16 and Figure 17) [22,23,24].
From the figures above, it can be seen that the best smoothing results were obtained for the moving median.
In order to assess the accuracy of the KOMAG-developed equipment and the measurements taken during operation of the longwall face, fragments of the working cycle of the roof support in which the pressure in the hydraulic system increases only due to rising pressure in the rock mass were selected for further analysis (Figure 18 and Figure 19) [25,26,27].
Figure 20 shows a box-and-whisker plot. It contains information on the position, dispersion, and shape of the distribution of the analysed data, thetip-to-face distance, over a selected period of time during mining when the shield support did not change its position. Central tendency (median) and scatter statistics (quartiles, min-max values) were calculated for each case group and are presented in Table 2.
Based on the calculations shown in Table 2, the data do not have a normal distribution. Values of excess kurtosis and skewness are other than zero. A distribution for cycle No. 1 is leptokurtic, but for cycles No. 2 and 3, it is platykurtic. Positive values for the skewness indicate data that are skewed right and negative values for the skewness indicate data that are skewed left. By skewed right, we mean that the right tail is longer than the left tail. Similarly, skewed left means that the left tail is long relative to the right tail.
The values of the coefficient of variation are slightly above 1%, which allows for the conclusion that the data set does not show much differentiation and that the data can be considered homogeneous.

4. Conclusions

The aim of the conducted research was both to assess the correctness and accuracy of the made measurement apparatus and the influence of the operating conditions on the usability of the system. Existing roof supports were tested. In the case of the Pniówek mine, this was a longwall complex, which was already in operation. In the case of the Budryk coalmine, it was a longwall complex, which was just beginning its operation, although at the time the project was being carried out, the supports were already in production, and it was not possible to interfere with their construction; the only possibility was to add additional clamps. In the case of the path sensor, the only possibility was to use existing holders. In order to increase the sensor’s effectiveness, it is necessary to provide for a mounting location at the design stage of the new housing, preferably just below the covers face of the longwall. An area in the cover through which the ultrasonic waves would be emitted can simply be cut out.
These tests covering the monitoring of a huge amount of data to be analysed constitute a considerable issue. Data visualization and analyses were time consuming and required special attention for data filtering and processing. In order to assess the quality of the collected measurements and to analyse the accuracy of the measuring equipment developed at KOMAG, a statistical analysis was conducted of data from days when there were no mining activities and from those periods of the section’s operation when the pressure in the hydraulic system increases only as a result of a rise in the pressure of the rock mass. As a result of the analysis, it was noticed that for some time, the sensors mistakenly interpreted waves reflected from the transverse surfaces of elements located at the end of the casing as echoes reflected from the wall surface. In order to filter out erroneous data, an authorial algorithm was developed to identify the correct wave reflected from the wall face case. The algorithm used by the authors to pre-filter the data uses data related to the geometry of the shield support, as well as the location and method of mounting (e.g., at a specific angle). The signal smoothing methods used to compensate for periodic disturbances were then analysed. The presented data prove their low scattering and the high accuracy of the sensors.
The analysis of the results in terms of detecting potential rockfalls that may have occurred during the tests is treated as a separate research issue. We plan to describe this in the next article. However, it requires proper interpretation of the results obtained from the developed sensors, which is described in the submitted manuscript.

Author Contributions

Conceptualization, S.B., D.J., K.T., M.S. and J.J.; methodology, D.J., J.J., K.T. and M.S.; validation, S.B., D.J. and J.R.-R.; formal analysis, J.R.-R.; writing—original draft preparation, J.R.-R. and S.B. All authors have read and agreed to the published version of the manuscript.

Funding

The research work undertaken in PRASS III (Productivity and safety of shield support), grant 752504 (2017) was supported by EU Research Fund for Coal and Steel (RFCS) as well as the Ministry of Science and Higher Education.

Institutional Review Board Statement

Not applicable.

Informed Consent Statement

Not applicable.

Data Availability Statement

Not applicable.

Conflicts of Interest

The authors declare no conflict of interest.

References

  1. Trueman, R.; Thomas, R.; Hoyer, D. Understanding the causes of roof control problems on a longwall face from shield monitoring data—A case study. In Proceedings of the Underground Coal Operators’ Conference, Wollongong, Australia, 10–11 February 2011; pp. 40–47. [Google Scholar]
  2. Jasiulek, D.; Bartoszek, S.; Lubryka, J. Productivity and safety of shield support—PRASS III. Masz. Górnicze 2019, 1, 73–79. [Google Scholar]
  3. Jasiulek, D. Monitoring of the mining powered roof support geometry. J. Mach. Constr. Maint. 2019, 3, 73–79. [Google Scholar] [CrossRef]
  4. Biliński, A. Metoda Doboru Obudowy Ścianowych Wyrobisk Wybierkowych i Chodnikowych do Warunków Pola Eksploatacyjnego; CMG KOMAG: Gliwice, Poland, 2005. [Google Scholar]
  5. Galvin, J.M. Ground Engineering. Principles and Practices for Underground Coal Mining; Springer: Cham, Switzerland, 2016. [Google Scholar]
  6. Shi, W.; Yin, Z.; Li, Y.; Chang, J.; Miao, X. Influence Characteristics of Double-Stratum Hard Roof Movement in a Fully Mechanized Top Coal Caving on the Working Resistance of Supports. J. Eng. Sci. Technol. Rev. 2020, 13, 57–66. [Google Scholar] [CrossRef]
  7. Verma, A.K.; Kishore, K.; Chatterjee, S. Prediction Model of Longwall Powered Support Capacity Using Field Monitored Data of a Longwall Panel and Uncertainty-Based Neural Network. Geotech. Geol. Eng. 2016, 34, 2033–2052. [Google Scholar] [CrossRef]
  8. Herezy, Ł.; Janik, D.; Skrzypkowski, K. Powered Roof Support—Rock Strata Interactions on the Example of an Automated Coal Plough System. Studia Geotech. Mech. 2018, 40, 46–55. [Google Scholar] [CrossRef] [Green Version]
  9. Wang, J.; Ning, J.; Jiang, L.; Jiang, J.-Q.; Bu, T. Structural characteristics of strata overlying of a fully mechanized longwall face: A case study. J. S. Afr. Inst. Min. Metall. 2018, 118, 1195–1204. [Google Scholar] [CrossRef] [Green Version]
  10. Jasiulek, D.; Bartoszek, S.; Perůtka, K.; Korshunov, A.; Jagoda, J.; Płonka, M. Shield Support Monitoring System—Operation during the support setting. Acta Montan. Slovaca 2019, 24, 391–401. [Google Scholar]
  11. Szurgacz, D.; Brodny, J. Tests of Geometry of the Powered Roof Support Section. Energies 2019, 12, 3945. [Google Scholar] [CrossRef] [Green Version]
  12. Rajwa, S. The influence of the geometrical construction of the powered roof support on the loss of a longwall working stability based on the practical experience. Arch. Min. Sci. 2020, 65, 511–529. [Google Scholar]
  13. Cheng, J.; Wan, Z.; Ji, Y. Shield-Roof Interaction in Longwall Panels: Insights from Field Data and Their Application to Ground Control. Adv. Civ. Eng. 2018, 2018, 3031714. [Google Scholar] [CrossRef]
  14. Yang, J.X.; Liu, C.Y.; Yu, B. The interaction between face support and surrounding rock and its rib weakening mechanism in hard coal seam. Acta Montan. Slovaca 2017, 22, 67–78. [Google Scholar]
  15. Langosch, U.; Ruppel, U.; Wyink, U. Longwall roof control by calculation of the shield support requirements. In Proceedings of the 2003 Coal Operators’ Conference, Wollongong, Australia, 12–14 February 2003. [Google Scholar]
  16. PRASS III Website. Available online: http://prass3.komag.eu (accessed on 20 September 2021).
  17. Bartoszek, S.; Jendrysik, S.; Rogala-Rojek, J.; Woszczyński, M.; Krauze, K.; Joostberens, J. State-of-the-artultrasonic sensor designed to improvelongwall production rates and operation safety. Acta Montan. Slovaca 2021, 26, 149–160. [Google Scholar]
  18. Stankiewicz, K.; Jagoda, J.; Tonkins, M. Intelligent algorithms for routing sensory networks operating in explosion hazard zones. Min. Sci. 2021, 28, 103–115. [Google Scholar] [CrossRef]
  19. Becker Mining Systems. Available online: https://www.becker-mining.com.pl/en/face-equipment/ (accessed on 24 September 2021).
  20. Data Science Textbook. Available online: https://docs.tibco.com/data-science/textbook (accessed on 27 September 2021).
  21. Create a Box and Whisker Chart. Available online: https://support.microsoft.com/en-us/office/create-a-box-and-whisker-chart-62f4219f-db4b-4754-aca8-4743f6190f0d (accessed on 27 September 2021).
  22. Ott, R.L.; Longnecker, M.T. An Introduction to Statistical Methods and Data Analysis; Brooks/Cole, Cengage Learning: Belmont, MA, USA, 2010. [Google Scholar]
  23. Heumann, C.; Schomaker, M. Introduction to Statistics and Data Analysis: With Exercises, Solutions and Applications in R; Springer: Cham, Switzerland, 2018. [Google Scholar]
  24. Kurkiewicz, J.; Stonawski, M. Podstawy Statystyki; Krakowskie Towarzystwo Edukacyjne sp. z o.o.: Kraków, Poland, 2005. [Google Scholar]
  25. Pawlikowski, A. Przyczyny asymetrii podporności stojaków sekcji obudowy zmechanizowanej w świetle badań dołowych. Masz. Górnicze 2017, 1, 45–54. [Google Scholar]
  26. Rajwa, S.; Lubosik, Z.; Płonka, M. Safety of longwall mining with caving in the light of data from monitoring systems. IOP Conf. Ser. Mater. Sci. Eng. 2019, 679, 012021. [Google Scholar] [CrossRef]
  27. Rajwa, S.; Lubosik, Z.; Płonka, M. Bezpieczeństwo eksploatacji ścian zawałowych w świetle danych z systemów monitoringu. Masz. Górnicze 2019, 4, 24–34. [Google Scholar]
Figure 1. Tip to face distance.
Energies 14 08541 g001
Figure 2. Tip to face distance sensor SSMS-S [16,17].
Energies 14 08541 g002
Figure 3. The BW 24/44 POz shield support with marked space for the SSMS-S sensor.
Energies 14 08541 g003
Figure 4. View from SSMS-S sensor located on the BW 24/44 POz roof support.
Energies 14 08541 g004
Figure 5. Tip to face distance sensor SSMS-S.
Energies 14 08541 g005
Figure 6. SSMS system components: Central unit SSMS-C and Inclinometer SSMS-I mounted on the shield support.
Energies 14 08541 g006
Figure 7. SSMS-S sensor in operation: harsh conditions.
Energies 14 08541 g007
Figure 8. SSMS-S 23 August 2020 roof support No. 116.
Energies 14 08541 g008
Figure 9. Model of the SSMS-S sensor installed on the BW 24/44 POz roof support canopy during preparatory work for the mining process, at the manufacturer’s site.
Energies 14 08541 g009
Figure 10. Roof support No. 59 pressure and tip-to face distance (12 February 2021).
Energies 14 08541 g010
Figure 11. Roof support No. 59 pressure and tip-to face distance (15 February 2021).
Energies 14 08541 g011
Figure 12. Roof support No. 59 pressure and tip-to face distance (14 February 2021).
Energies 14 08541 g012
Figure 13. Shield support No. 59 pressure and tip-to face distance (filtered data) (14 February 2021).
Energies 14 08541 g013
Figure 14. Box-and-whisker plot (scatter and shape of analysed data): tip-to face distance, shield support No. 53 and 59.
Energies 14 08541 g014
Figure 15. Roof support No. 59 pressure and tip to face distance (Savitzky–Golay method).
Energies 14 08541 g015
Figure 16. Roof support No. 59 pressure and tip to face distance (moving average of 5 values).
Energies 14 08541 g016
Figure 17. Roof support No. 59 pressure and tip to face distance (moving median of 5 values).
Energies 14 08541 g017
Figure 18. Fragment of the roof support work cycle (cycle No. 1).
Energies 14 08541 g018
Figure 19. Fragment of the roof support work cycle (cycle No. 2).
Energies 14 08541 g019
Figure 20. Box-and-whisker plot (scatter and shape of analysed data): tip-to face distance, cycle No. 1, 2 and 3.
Energies 14 08541 g020
Table 1. Summary of the calculations used to present a box-and-whisker diagram for the tip-to face distance.
NameRoof Support No. 53Roof Support No. 59
Average0.6340.652
Standard error0.0010.001
Standard deviation0.0090.020
Minimum0.6200.610
Maximum0.6500.710
Range0.0300.100
Median0.6300.650
Dominant0.6300.640
Quartile Q10.6300.640
Quartile Q30.6300.640
Median-Q10.6400.660
Q3-Median0.0000.010
Kurtosis−0.7630.099
Skewness0.1140.882
Confidence level (95%)0.001460.00164
Coefficient of variation1.434%3.081%
Table 2. Summary of the calculations used to present a box-and-whisker diagram for the tip-to face distance.
NameCycle 1Cycle 2Cycle 3
Average0.7670.9180.709
Standard error0.0010.0020.001
Standard deviation0.0080.0140.010
Minimum0.6800.9000.690
Maximum0.7200.9500.730
Range0.0400.0500.040
Median0.6950.9200.710
Dominant0.6900.9100.710
Quartile Q10.6900.9100.710
Quartile Q30.6900.9100.700
Median-Q10.7000.9300.720
Q3-Median0.0050.0100.010
Kurtosis1.066−0.429−0.586
Skewness0.8440.627−0.173
Confidence level (95%)0.002790.004450.00279
Coefficient of variation1.047%1.574%1.370%
Publisher’s Note: MDPI stays neutral with regard to jurisdictional claims in published maps and institutional affiliations.

