1. Introduction
The ever-increasing cost of hydrocarbons and stringent anti-pollution regulations are driving worldwide governments towards innovative mobility solutions capable of guaranteeing fuel economy and respect for the environment. Aiming to limit global warming to below 2 °C [
1], governments and nations are encouraging the adoption of adequate measures to strongly reduce the consumption of oil-derived fuels. The most recent data provided by the European Environment Agency (EEA) show that the transport sector is responsible for about 32% of the total CO
2 emissions in the European Union [
2]. In September 2020, the European Commission presented the ambitious proposal to cut greenhouse gas emissions by 55% by 2030. This goal represents the first step towards the wider project that aims to make Europe the first climate-neutral continent by 2050 (European Green Deal) [
3].
Among the most interesting and short-term solutions, hybrid electric vehicles (HEVs) certainly represent a valid alternative compared to traditional internal combustion engine vehicles (ICEVs), given the significant fuel savings achieved, especially in urban areas; although good technological levels have already been reached, their development is relatively recent, which is why there is still plenty of room for improvement. In a hybrid thermal-electric architecture, a possible development area is represented undoubtedly by the internal combustion engine, which produces the energy necessary for vehicle traction and battery charging; a significant increase in the engine efficiency may produce considerable improvements in the efficiency of the entire propulsion system.
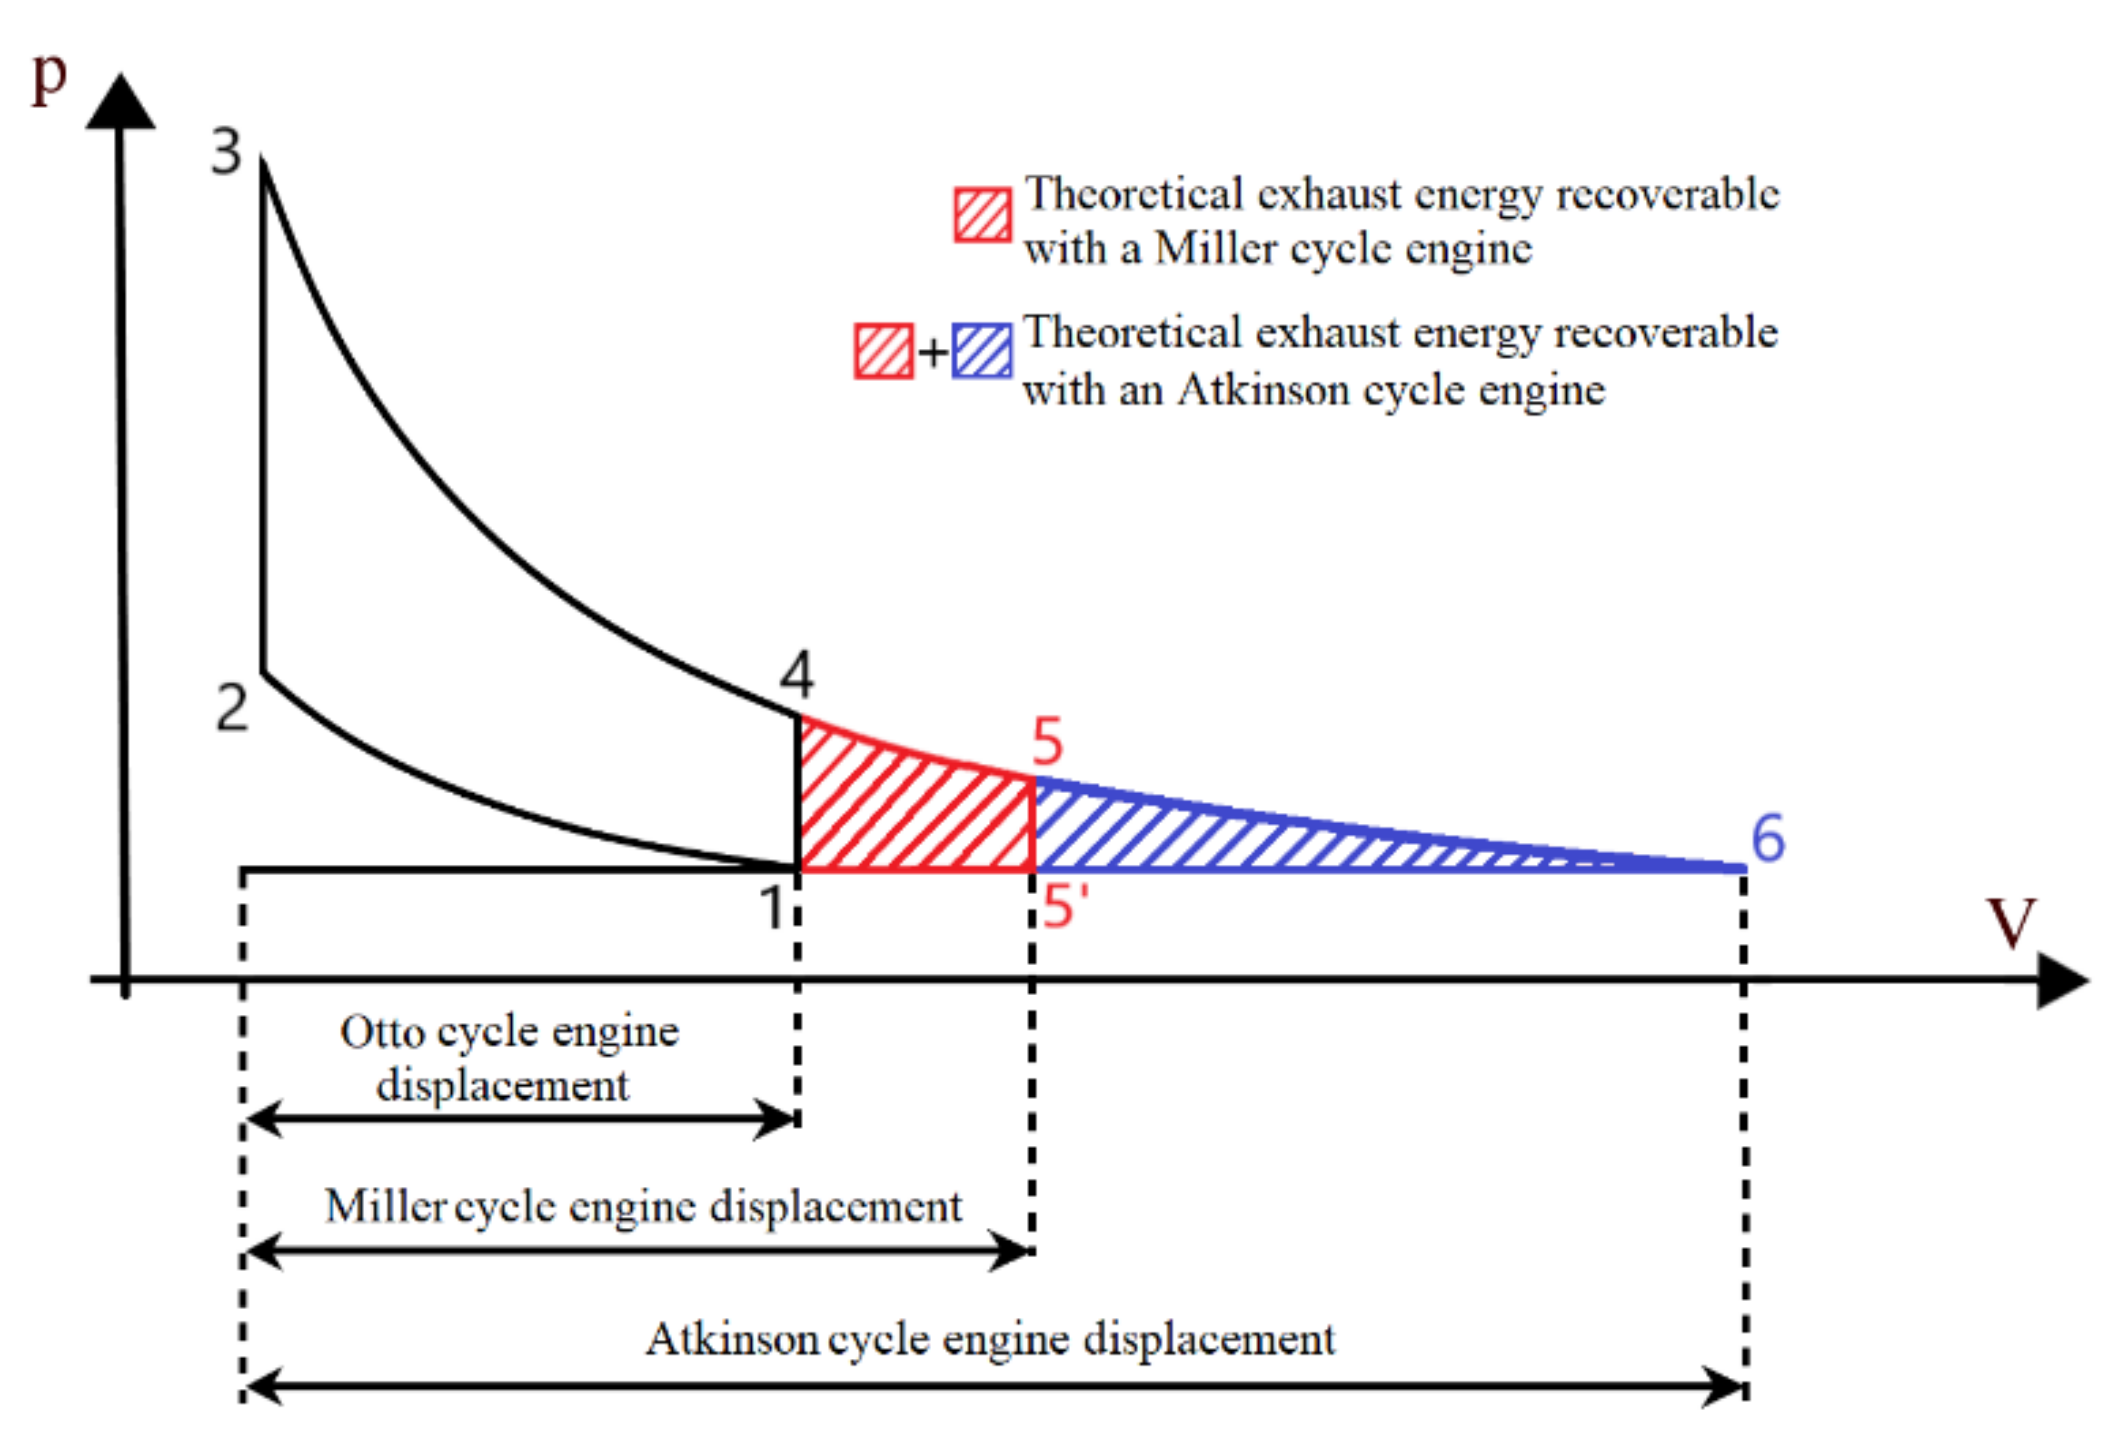
As is well-known, internal combustion engines based on Otto or diesel cycles cannot complete the expansion process of the gas inside the cylinder, thus losing a significant proportion of the energy content, in the order of 20% of the total energy content (represented by the two dashed areas in
Figure 1).
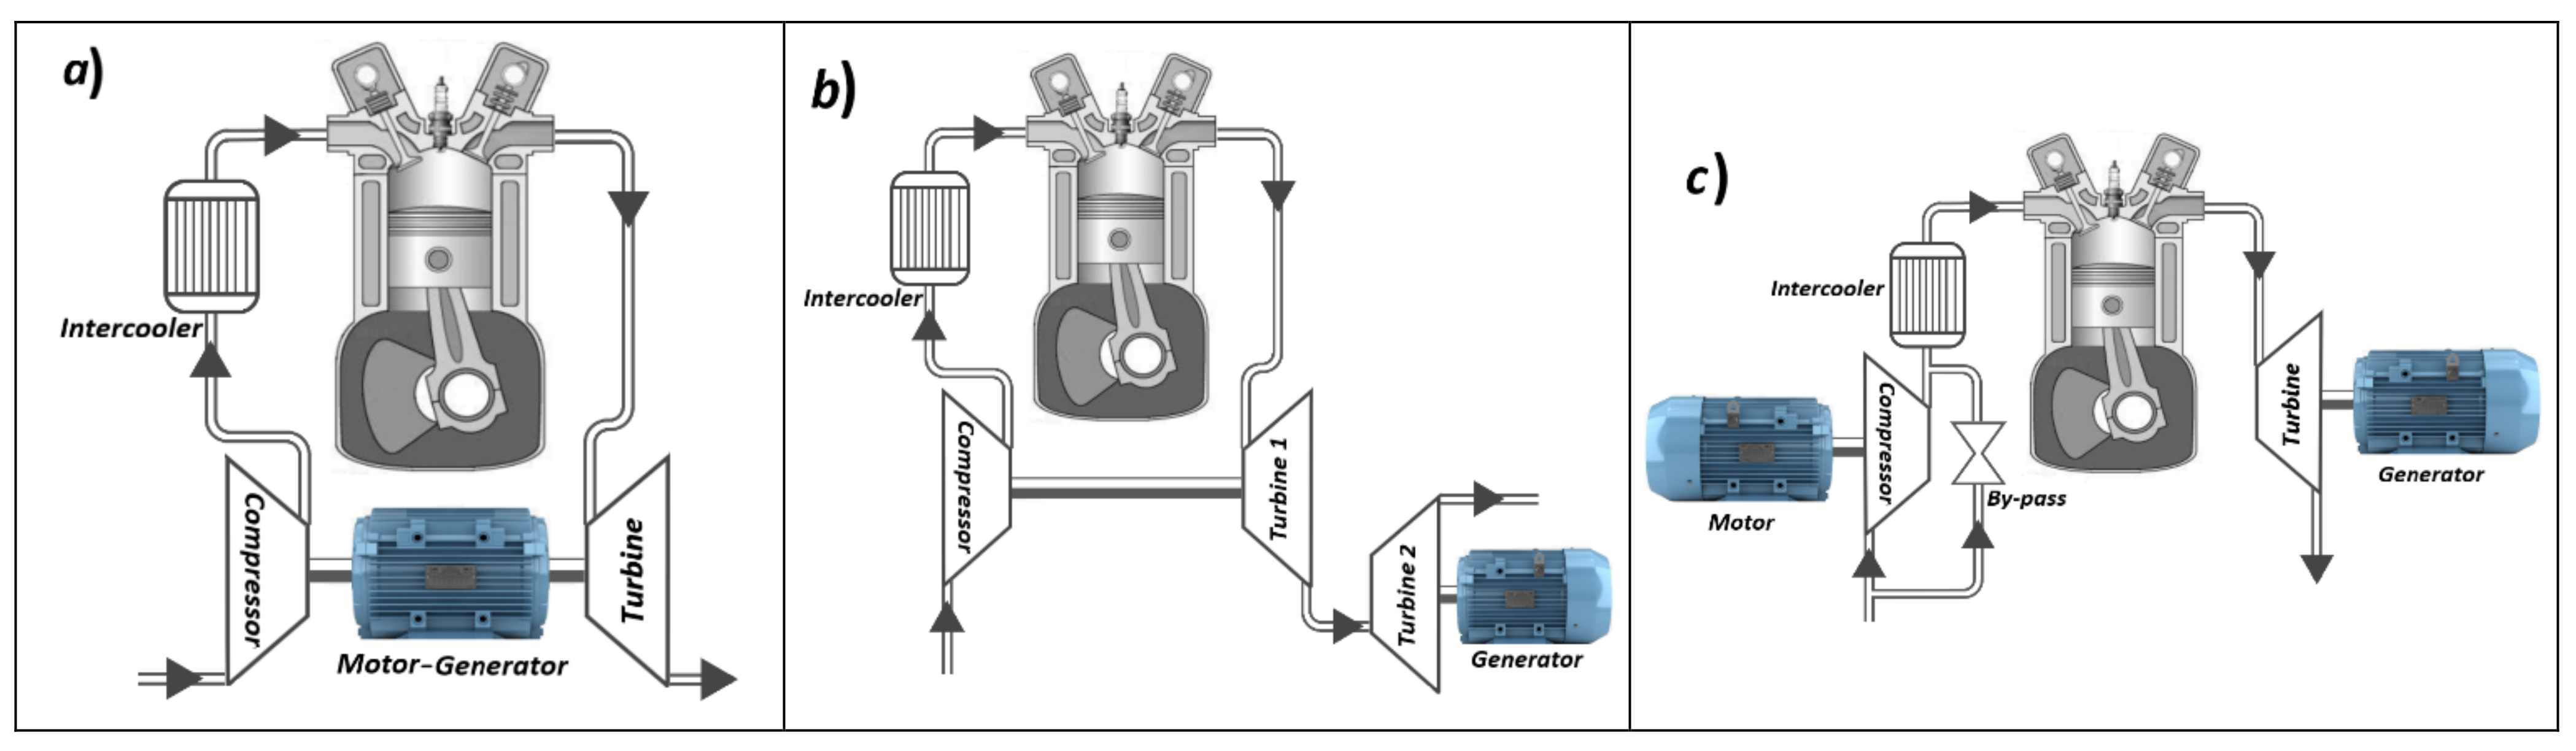
As regards the exploitation of the exhaust gas energy, the best-known system is certainly represented by the exhaust gas turbine used for turbocharging purposes. In this case, the turbine only has the function of providing the mechanical power required by the turbocompressor, thus limiting the amount of recoverable energy from exhaust gas. Several other systems for internal combustion engine exhaust energy recovery can be traced in the scientific literature [
4,
5]. Many systems focus on recovering the surplus power produced by the turbine and not required by the turbocompressor through the use of an electric generator installed on the turbocharger shaft [
6,
7,
8,
9] (
Figure 2a); another kind of turbo-compound system involves the installation of a second turbine generator downstream of the first turbine in order to recover the exhaust energy not yet exploited (
Figure 2b). The first solution (
Figure 2a) achieves maximum overall efficiency improvements in the order of 6%, while the second solution (
Figure 2b) achieves efficiency improvements of 4% [
10,
11]. In the naval industry, the second solution (
Figure 2b) has been widely adopted, with a second turbine downstream of the first, whose output power is directly added as mechanical power to the propeller shaft. In [
12,
13], on the other hand, the use of a second turbine in parallel to the first (used for supercharging) was considered, and in both cases the use of both a fixed and a variable geometry turbine was hypothesized. With this type of turbo-compound system, efficiency improvements of up to 9% were observed. Another solution for a better completion of in-cylinder gas expansion is represented by over-expanded cycles, such as Atkinson and Miller cycles [
14]. In an Atkinson cycle, the expansion stroke should be extended up to atmospheric pressure [
15,
16,
17]; this could be achieved through the use of adequate intake valve timing in a properly designed engine. As can be seen from
Figure 1 (curve 1-2-3-6-1), the Atkinson cycle allows one to recover both the blue and red area, allowing a theoretical efficiency increase of about 20% compared to the Otto cycle. This would imply, however, an impracticable too large in-cylinder volume, about four times the corresponding volume of the Otto cycle engine. This implies a strong decrease in the engine power density (in the order of −72%).
In the Miller cycle, on the other hand, the gas expands down to the pressure
p5 which is significantly higher than the atmospheric pressure [
18], thus maintaining plausible in-cylinder volumes. A Miller cycle engine can be practically developed by adopting a high engine geometrical compression ratio (GCR) and early (or late) intake valve closure (IVC). In this way, the compression stroke is limited (avoiding dangerous knocking phenomena), while the expansion stroke can be better exploited [
13]: adopting a geometrical compression ratio (GCR) of 14, an 8% theoretical efficiency increment can be obtained with respect to the Otto cycle, to the detriment of the power density, which is reduced by about 25%. A practical application of a Miller cycle engine was made by Toyota in the Prius hybrid vehicle, in which an engine with a geometrical compression ratio of 13 was adopted: through this application, it was possible to obtain an improvement in fuel economy of 8.5% [
19]. Although the implementation of a Miller cycle can bring about an improvement in fuel consumption, the resulting power density reduction still represents a crucial drawback which limits its advantages [
20].
In this paper, the authors analyze the energetic advantages of a compound system (
Figure 2c) composed of an electric supercharged CNG spark ignition engine endowed with a dedicated exhaust gas turbine generator with the aim of recovering the unexpanded exhaust gas energy. The turbine is directly linked to a suitable electric generator, while the compressor is driven by an electric motor. Unlike the compound systems already studied (
Figure 2a,b), in this work, the two thermal machines (the compressor and turbine) are disconnected, thus working independently of each other. In turn, each thermal machine is connected to its own electric machine, thus ensuring a more flexible and extensive regulation of the entire system [
4]. In the system here proposed, the turbine has the task of recovering as much energy as possible from the exhaust gas, which is converted into electrical energy by the connected electrical generator. The separated electric turbo-compound system is particularly suitable for hybrid propulsion vehicles [
21], where the electricity produced by the turbine generator group can be stored in the on-board storage system and then used for vehicle traction. It is important to note that in a hybrid propulsion system, the operating conditions of the thermal engine do not vary as widely and rapidly as in a traditional vehicle; for this reason, the turbine of the compound engine could work in quasi-steady conditions; for this reason, the turbine considered for this application will certainly have a higher efficiency than a traditional turbocharging turbine.
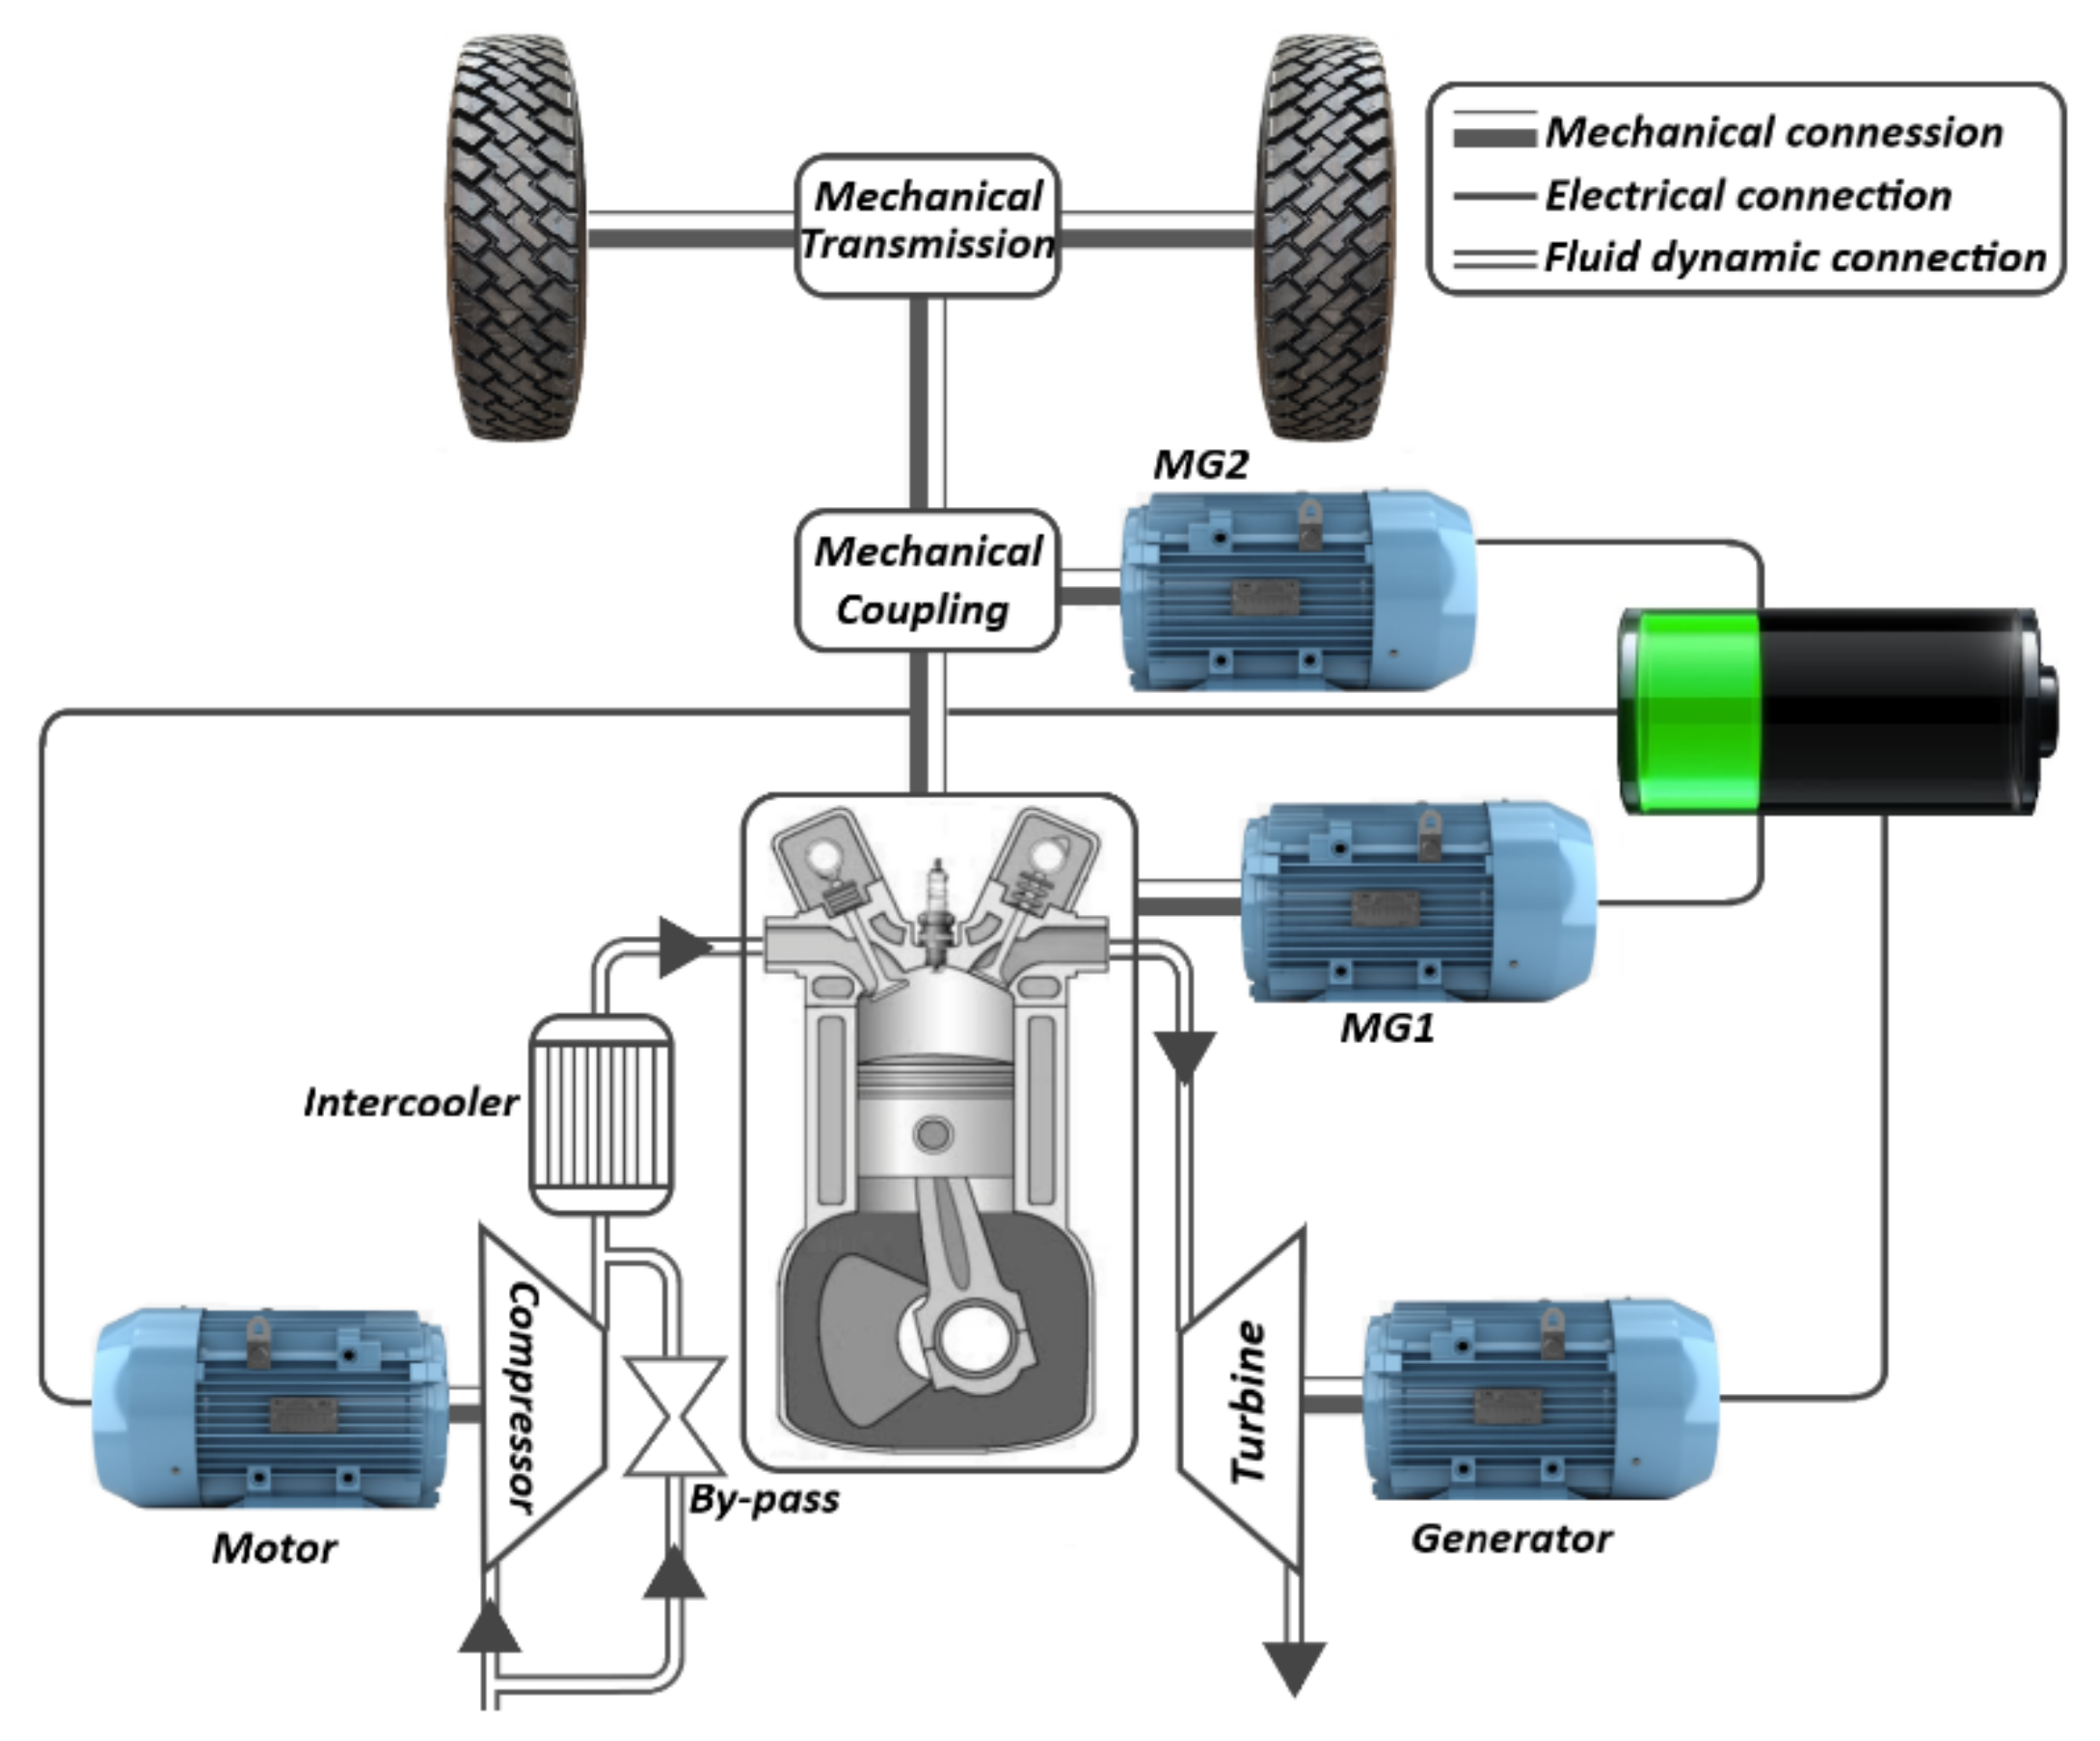
Figure 3 shows a possible hybrid vehicle architecture equipped with the electric compound engine proposed in this paper: as is shown, the electric power produced by the turbine generator, together with the power delivered by the motor-generator MG1, is directly stored in the vehicle’s storage system, which, in turn, supplies the second electric motor MG2 and the motor-compressor employed for supercharging purposes. It is worth pointing out that the only previous work dealing with the same propulsion system was presented at the 2020 Conference on Sustainable Mobility [
22] by the same authors: however, as will be clarified later, many and substantial differences have been introduced in the present paper.
In this paper, the steady state performances of the proposed separated electric compound engine are evaluated and compared with the performances of a traditional reference turbocharged engine on an equal power basis, i.e., each propulsion unit was sized to deliver the same continuous maximum power of 73.5 kW (100 HP). Each power unit was also developed starting from the same reference naturally aspirated engine, whose performance evaluation is carried out in the next section. The whole analysis was carried out through a simple modelling approach, mainly based on mass flow and power balance equations, properly accompanied by simplifying assumptions and relations; the theoretical approach was also supported by experimental data derived from the relevant scientific literature or directly measured through experimental tests carried out by the same authors.
2. Baseline Naturally Aspirated Engine
As a first step, the authors developed the steady state performances of the baseline naturally aspirated engine. Starting from the characteristics and the specific performances of this common baseline naturally aspirated engine, the performances of both the separated electric turbo-compound unit and the reference turbocharged engine were obtained. For the development of the baseline naturally aspirated engine model, the authors employed the experimental data of the gasoline VVT spark ignition engine reported in [
23]. The system analyzed in the present paper was conceived for a European Type C–Medium hybrid vehicle, which is why the engine performances reported in [
23] were remodeled and adapted to a mid-level passenger car engine through a normalization process. For this purpose, the normalized mean piston speed
u was employed:
- (1)
Brake mean effective pressure (BMEP)
- (2)
Indicated mean effective pressure (IMEP)
- (3)
Relative air–fuel ratio (λ)
- (4)
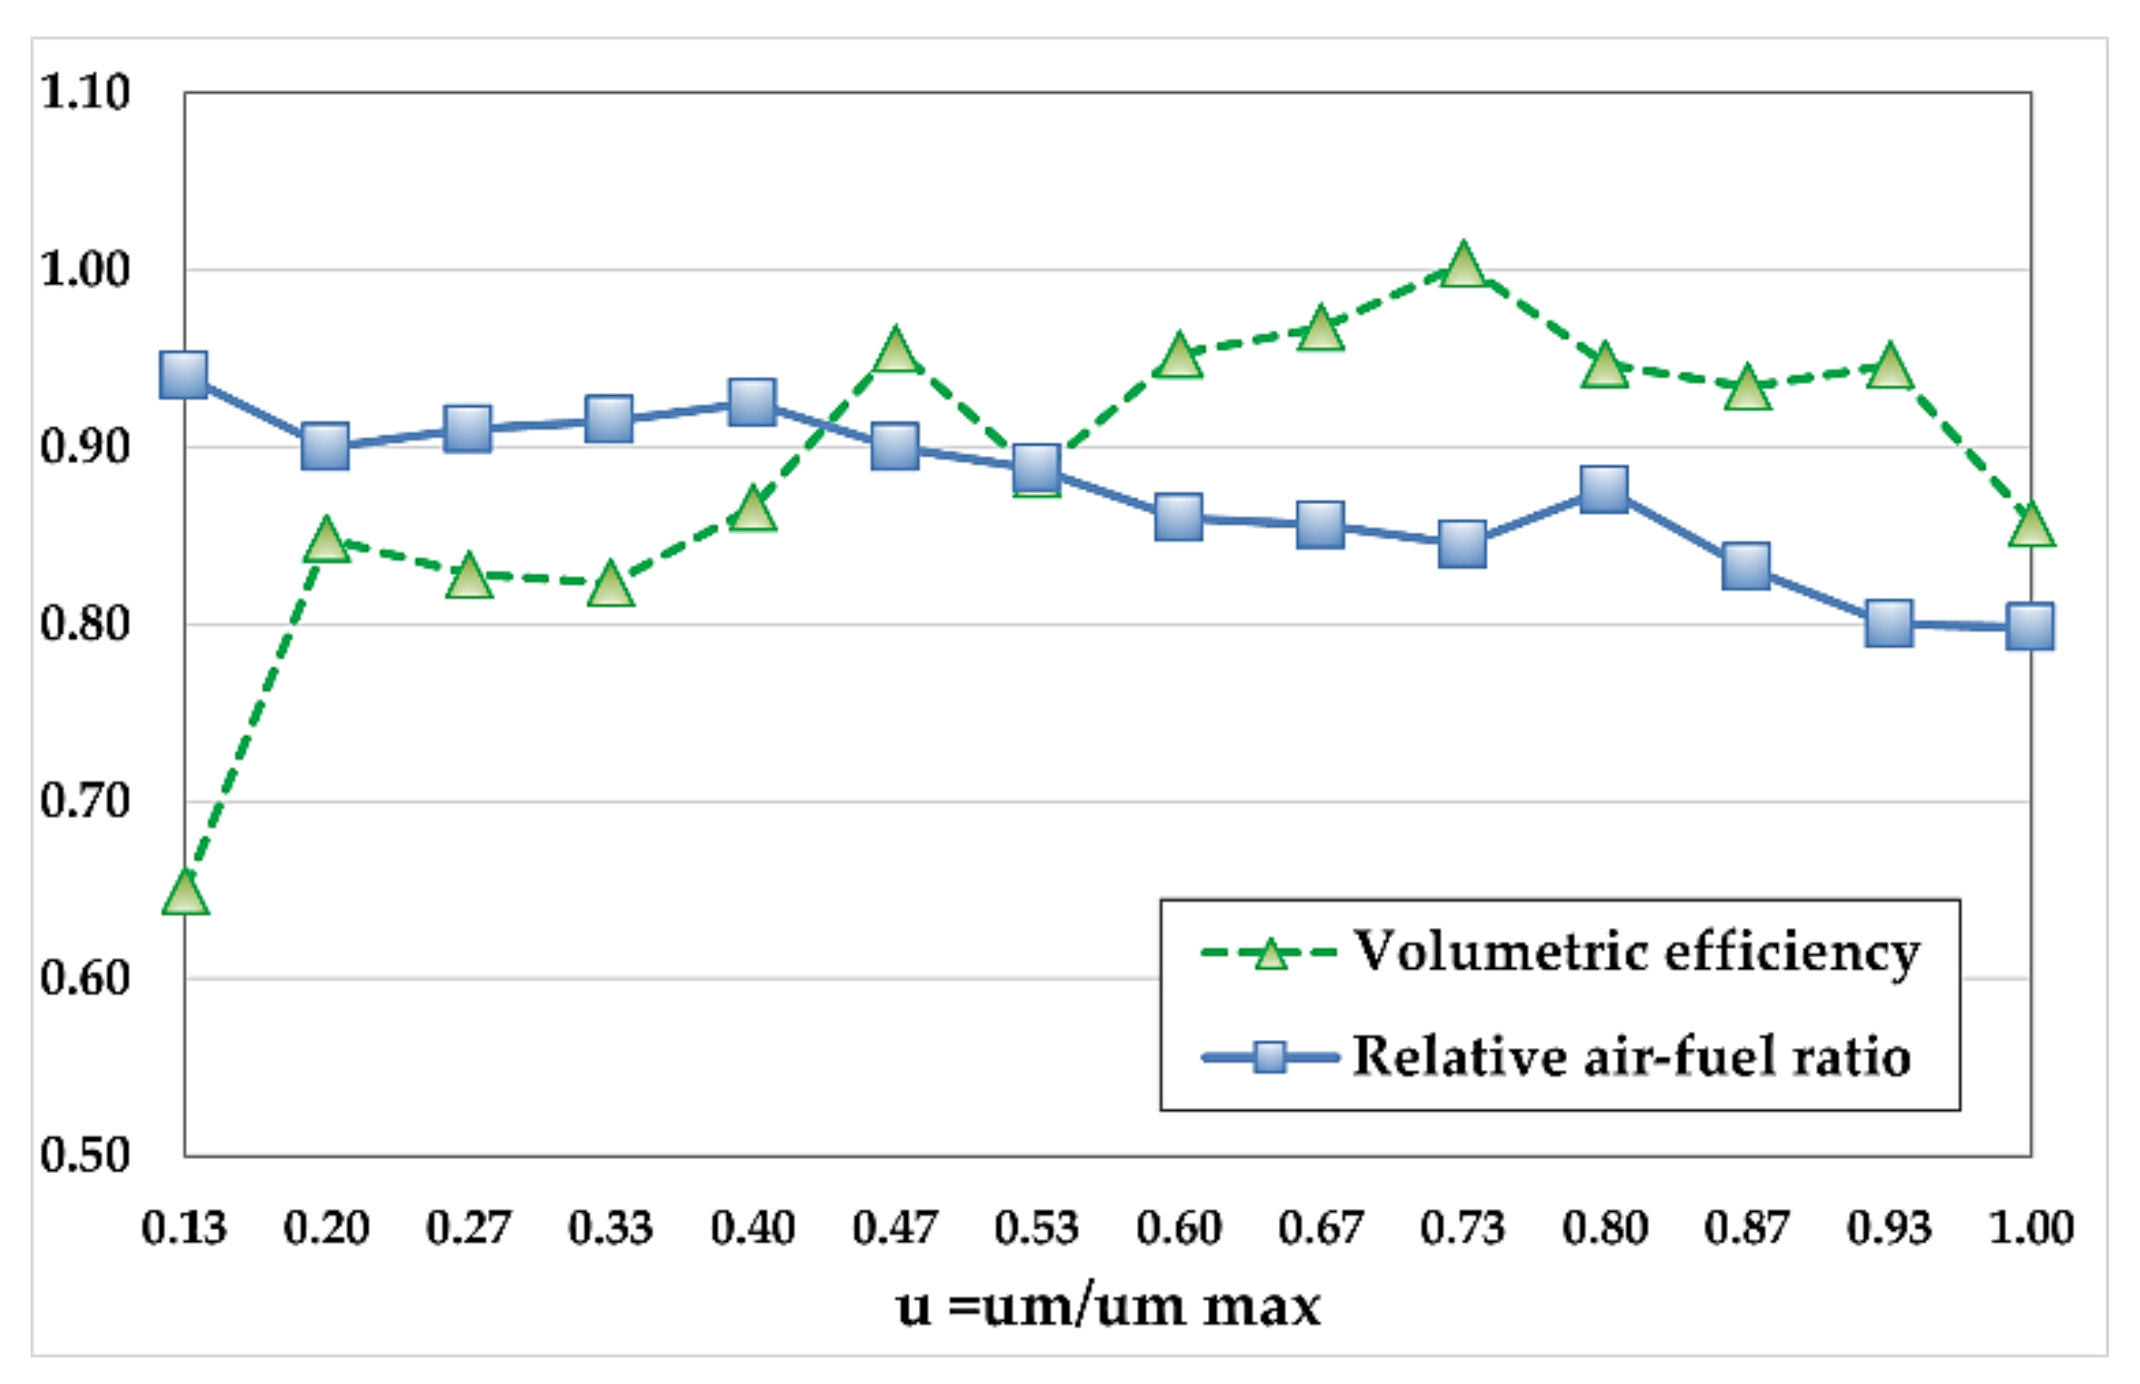
Volumetric efficiency (λV)
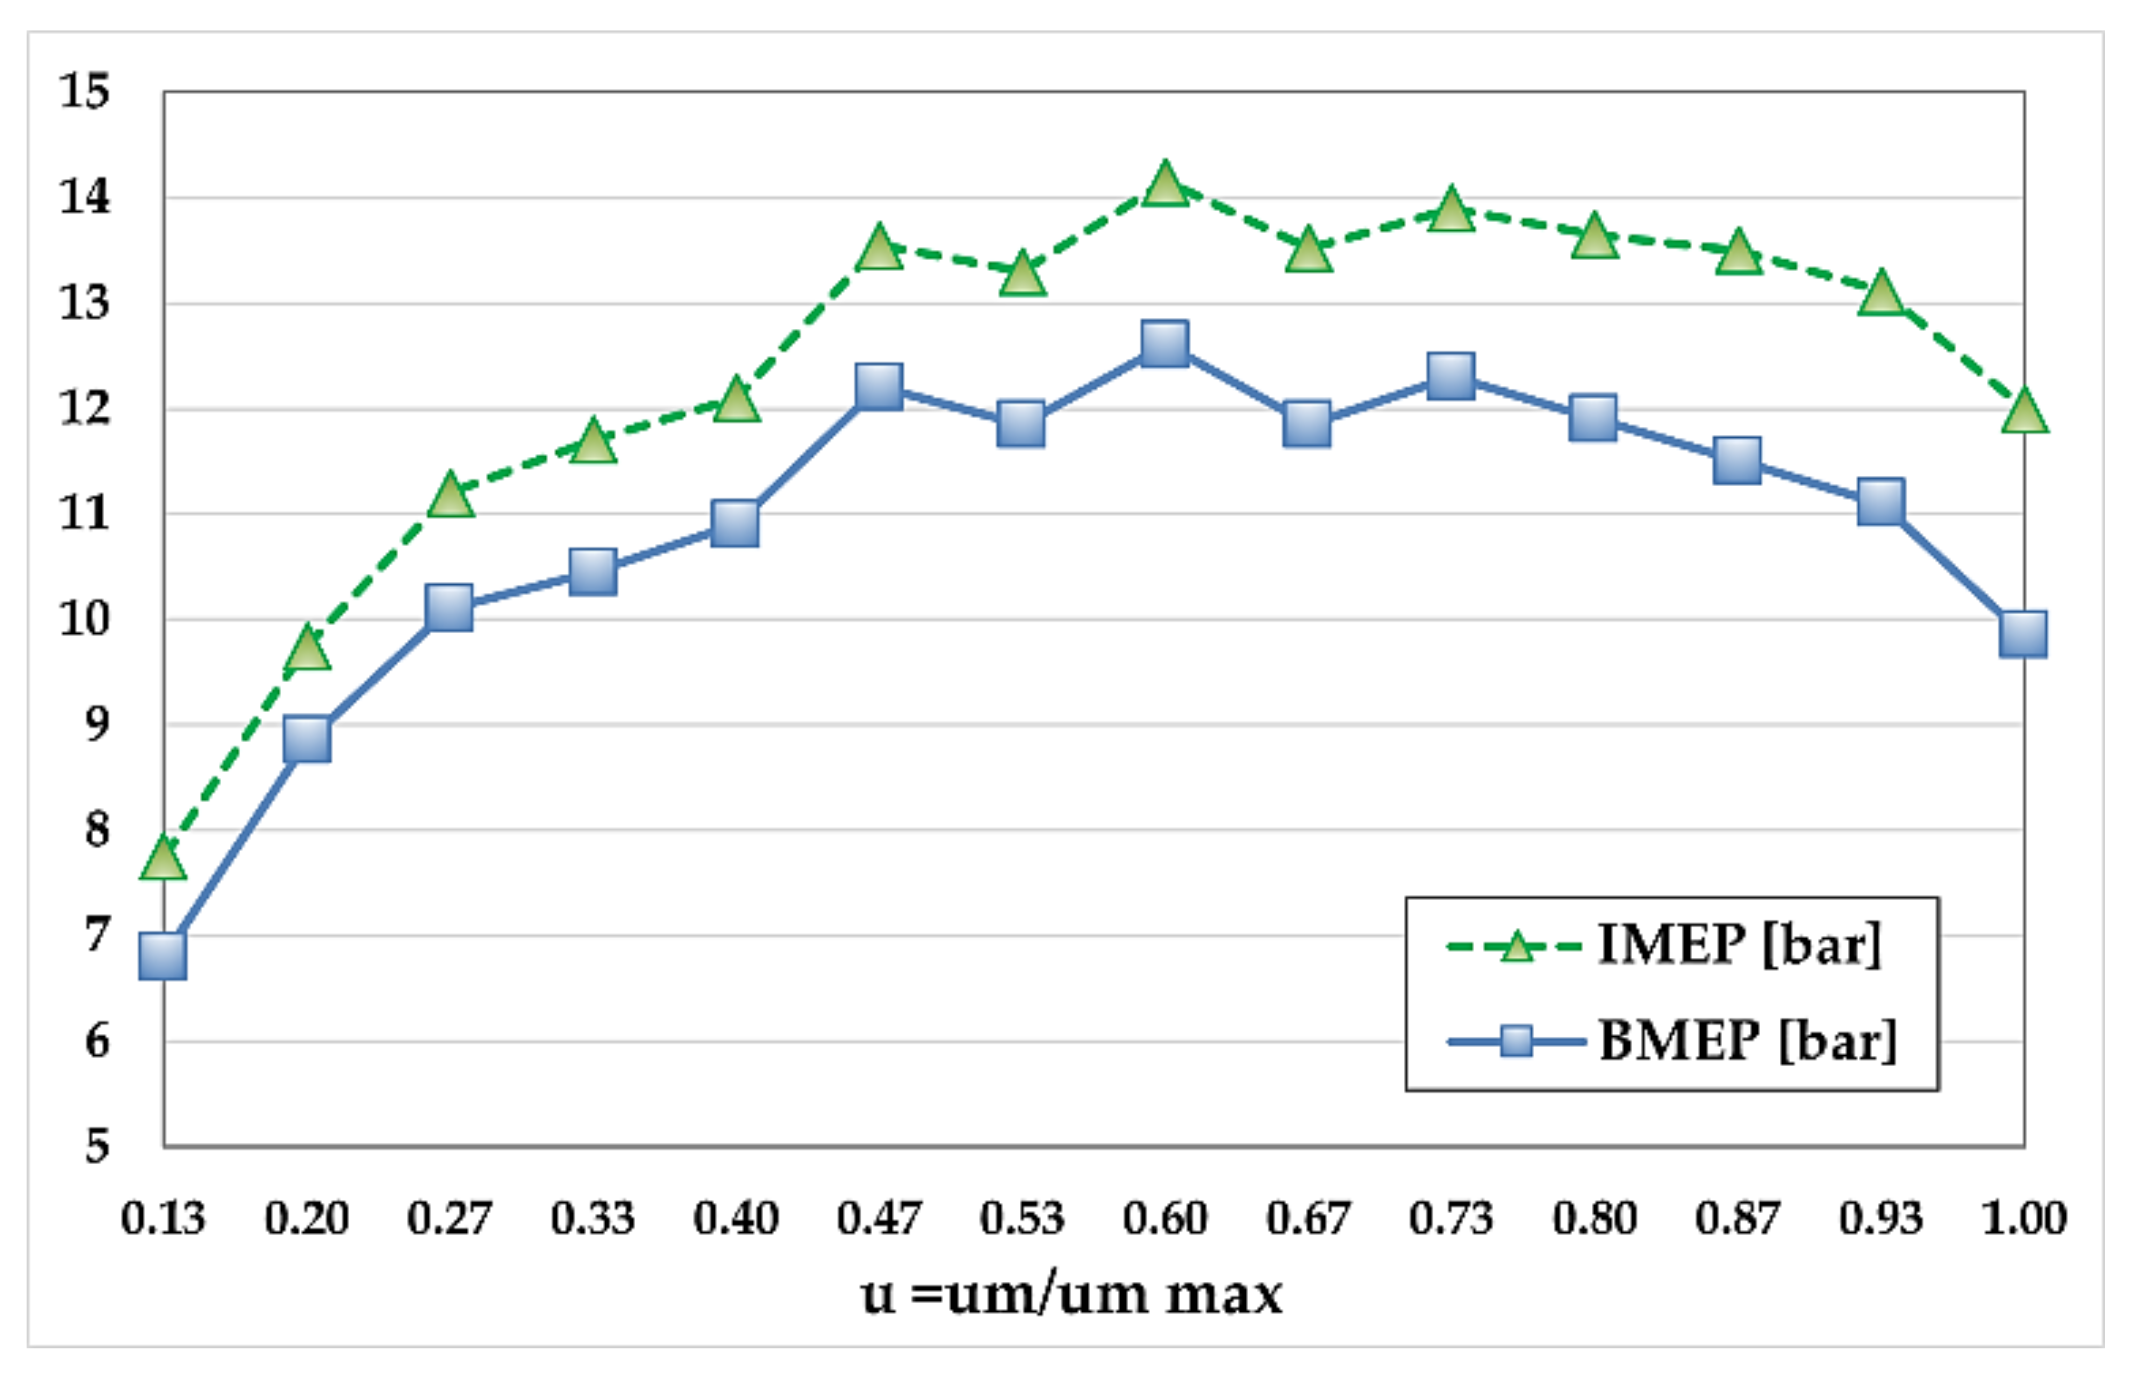
as functions of the normalized mean piston speed and for the full load condition (or wide-open throttle, WOT), while
Figure 6 shows the BMEP as a function of the manifold absolute pressure (MAP) for a fixed normalized mean piston speed (
u = 0.267).
In this work, a modified version of the Chen–Flynn model [
24] was adopted for the calculation of the friction mean effective pressure (
FMEP); in this modified version, the normalized mean piston speed
u was adopted instead of engine speed, and the indicated mean effective pressure IMEP was considered as a pressure load-related variable instead of the maximum in-cylinder pressure:
Through a least squares regression process performed on the experimental
BMEP and
IMEP data shown in
Figure 4 and
Figure 6, the values of the four parameters (
A,
B,
C and
D) were obtained (reported in
Table 1).
Once the parameters of the
FMEP model were determined, the authors adopted the experimental
IMEPexp values shown in
Figure 4 for the gasoline-fueled reference engine, while the
BMEP values were obtained, for each speed and load, by means of the application of the
FMEP model:
As regards the air–fuel ratio, the values shown in
Figure 5 were adopted for the full load conditions (i.e.,
MAP = 1 bar), while a stoichiometric mixture (i.e., λ = 1) was assumed for
MAP values lower than 0.9 bar, as the stoichiometric air-fuel ratio
αst = 14.7 for gasoline. For the intermediate operating points with
MAP between 0.9 and 1 bar, a linear variation of the air–fuel ratio was assumed. The engine indicated efficiency was evaluated starting from the relation between
IMEP and the engine operating parameters:
where
LHV is the gasoline lower heating value (assumed 43 MJ/kg),
ηi is the indicated engine efficiency,
δA is the air density in the manifold and
δ’ is the relative fuel density, i.e., the ratio between fuel and air density:
For a multi-point indirect gasoline injection, it is plausible to assume that 40% of the fuel evaporates before entering the cylinder, and thus the average fuel density
δF is:
where
δF,L and
δF,V are the fuel density of the liquid and vapor phase, respectively. The vapor fuel density was evaluated assuming the perfect gas law with a gasoline molecular mass of 100 g/mol [
25].
The gross indicated mean effective pressure
IMEPg,gasoline of the gasoline-fueled engine was hence calculated on the basis of the
IMEPexp values:
where the pumping mean effective pressure
PMEP was simply assumed as:
The term
pS0 represents the in-cylinder pressure during the exhaust stroke of the baseline naturally aspirated engine; here,
p0is considered as 1.10 to account for the pressure drop in the exhaust pipe. The gross indicated efficiency of the gasoline naturally aspirated engine was hence calculated from the gross indicated mean effective pressure:
According to the simple approach followed in this analysis, the modeling of the CNG-fueled naturally aspirated engine was performed assuming the same gross indicated efficiency of the gasoline-fueled engine for the same operating points (i.e., the same
MAP level and engine speed). According to this simplifying assumption, the gross indicated efficiency of the
CNG-fueled engine
ηig,CNG was determined starting from the gross indicated efficiency
ηig,gasoline of the gasoline-fueled engine:
Considering the volumetric efficiency of the engine expressed as the ratio between the mass of the fuel–air mixture
mm (= mair + mfuel) actually introduced in the engine at each cycle and the theoretical mass
(V·δm):
another plausible assumption was made on the volumetric efficiency of the
CNG engine supposedly equal to the gasoline-fueled engine:
It is worth noting that the assumption made does not imply that the same amount of air enters both CNG and gasoline-fueled engine, due to the very different relative density δ’ of the two fuels.
The gross indicated mean effective pressure of the
CNG-fueled naturally aspirated engine was then determined as:
Given the very high knock resistance of natural gas, and adopting the same volumetric compression ratio of the gasoline baseline engine, the
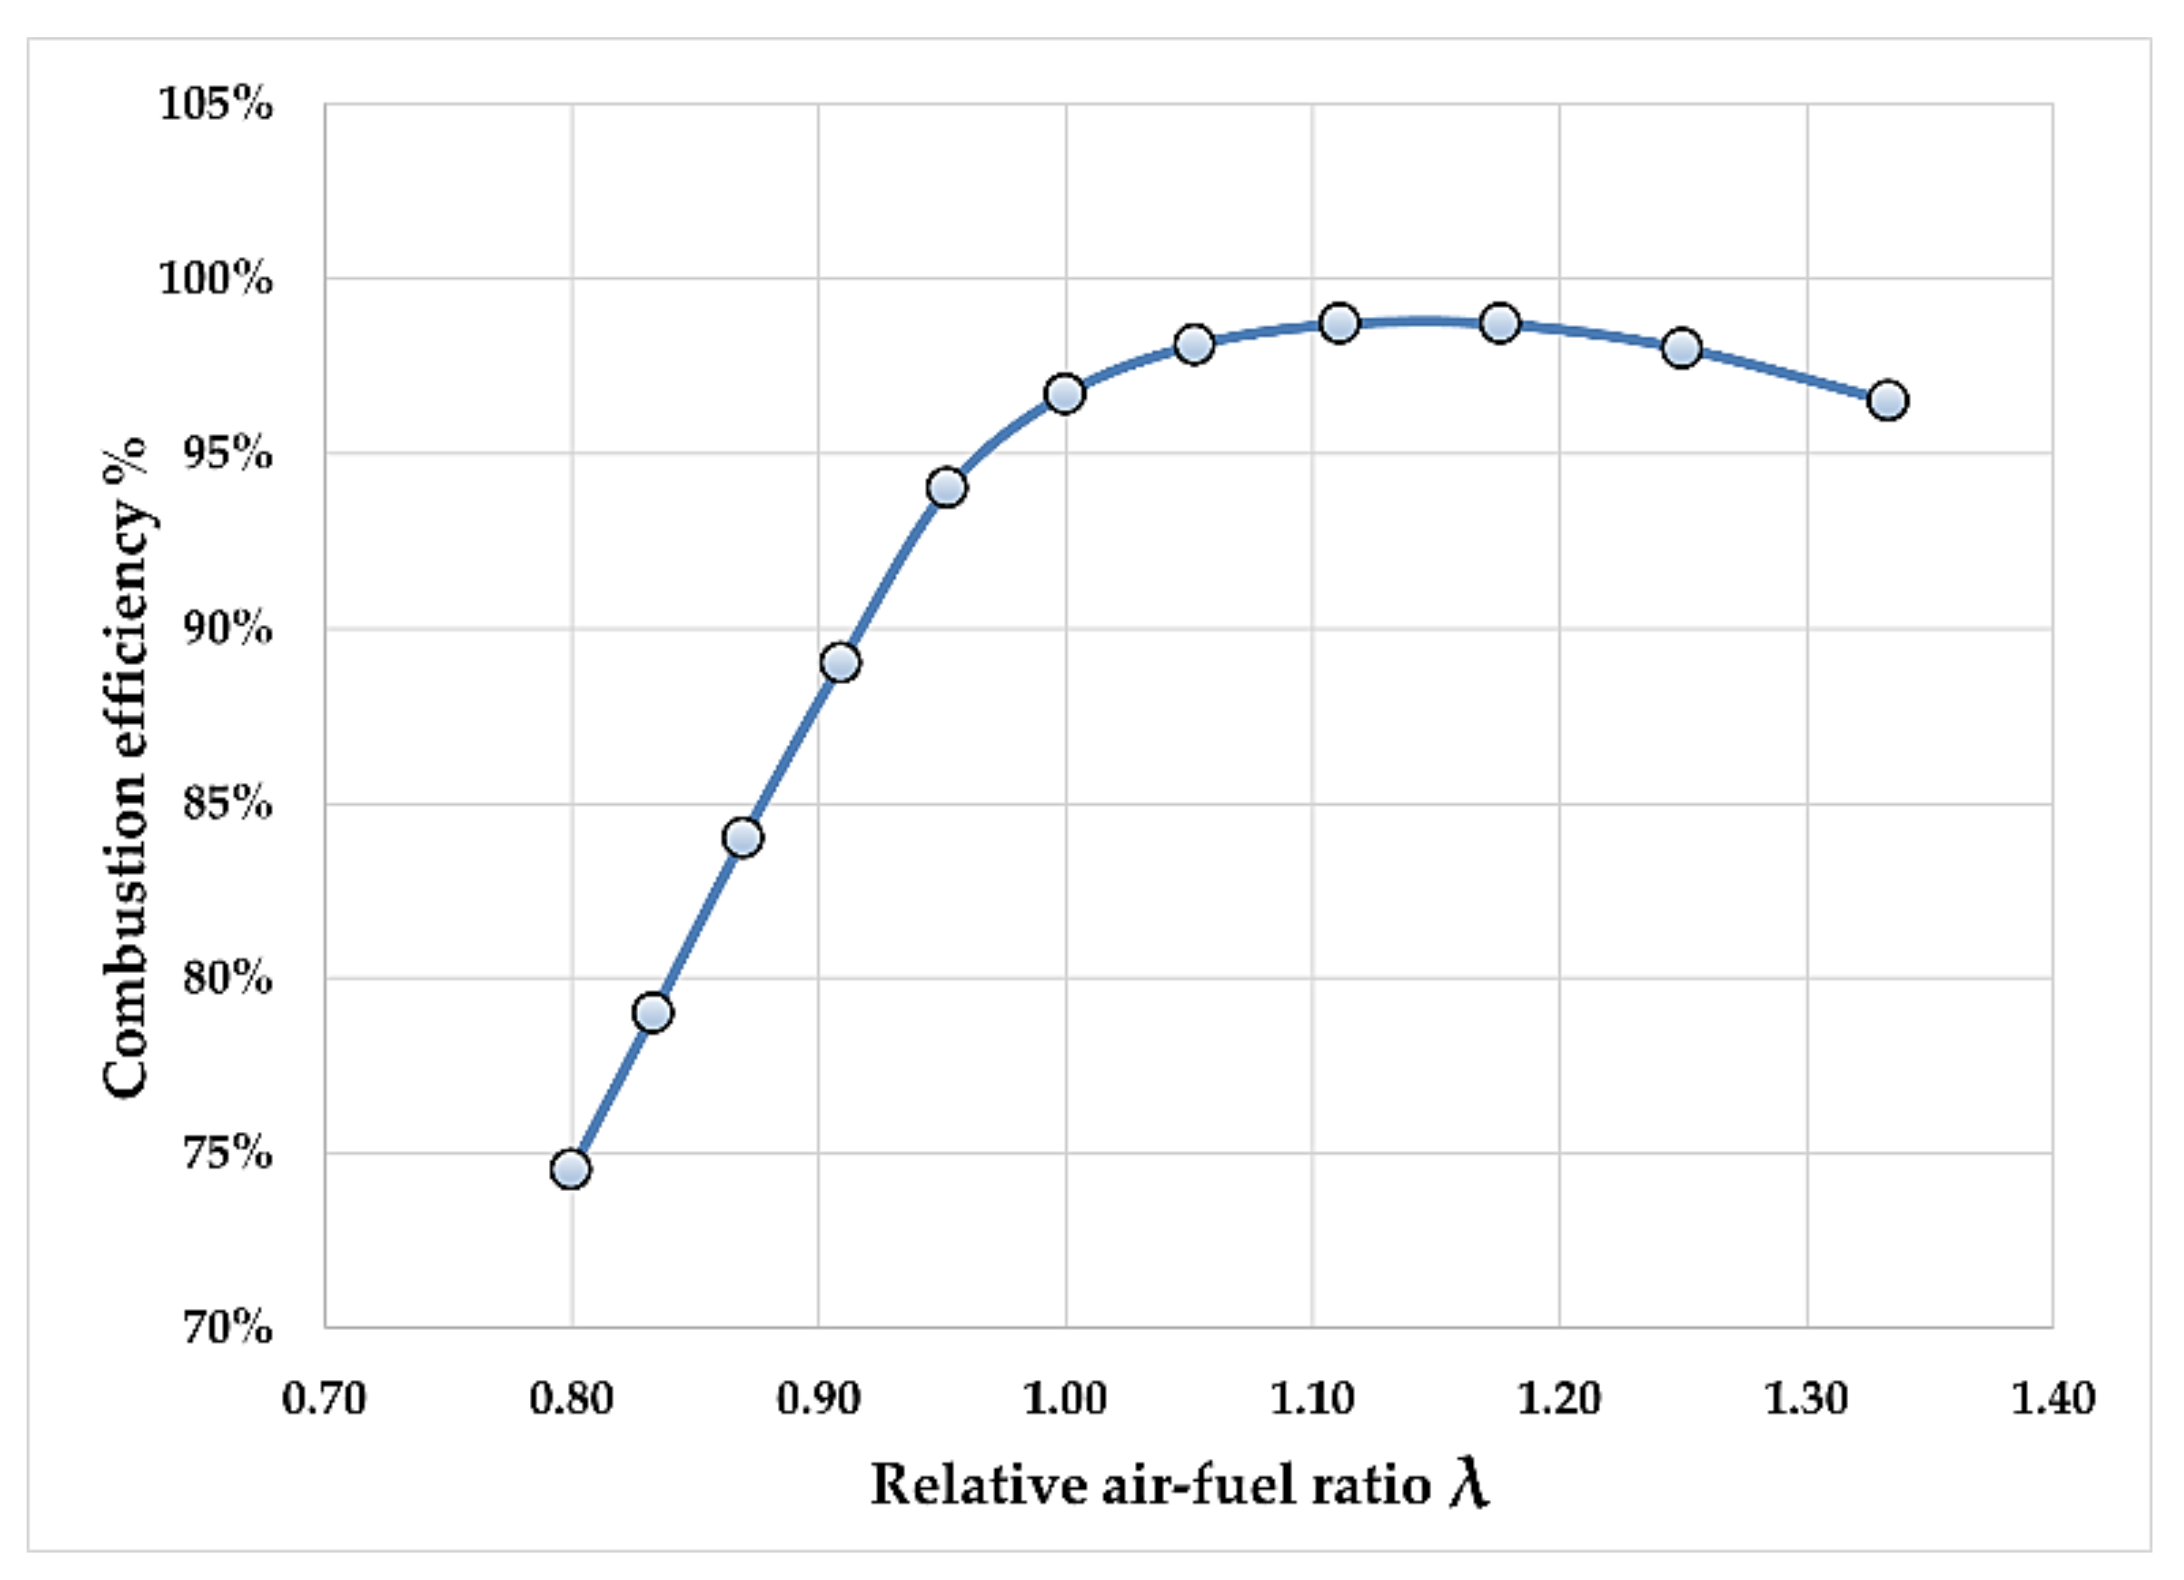
CNG-powered engine was assumed to run always with a stoichiometric air–fuel ratio (i.e., λ = 1). Considering that rich mixtures cause low combustion (and hence indicated) efficiency, to account for the different mixture strengths adopted with the two fuels, the authors corrected the indicated efficiency of the
CNG-powered engine, employing as the correction factor the combustion efficiency published in [
24] and reported in the diagram of
Figure 7, thus obtaining the indicated gross efficiency of the
CNG-fueled engine operating at a stoichiometric air–fuel ratio:
where
ηcomb(λgasoline) is the combustion efficiency related to the gasoline relative air–fuel ratio
λ.
For the determination of the chemical-physical properties of the natural gas, the authors employed the data provided by a local natural gas supplier (see
Table 2). The data shown in
Table 2 allow us to calculate the
CNG relative fuel density (
δ’ = 0.64), and hence the gross indicated mean effective pressure of the
CNG-fueled engine, for each operating condition.
The indicated mean effective pressure of the baseline
CNG engine could then be evaluated through the
PMEP of Equation (8):
Since it is realistic to assume that the constants
A,
B,
C and
D of the
FMEP model remain unchanged when changing the kind of fuel, the
FMEPCNG was evaluated on the basis of the
IMEPCNG through Equation (2). The
BMEPCNG could be hence calculated as:
and the resultant brake thermal efficiency, as well as brake specific fuel consumption, could be calculated as:
With the aim being to pass from the normalized mean piston speed u to the effective mean piston speed um coherently with the technological level considered for the baseline naturally aspirated engine (European Type C–Medium vehicle), a maximum reference value of um(max) = 17 m/s was assumed.
As a final result,
Figure 8 shows the
BSFC contour map obtained for the baseline
CNG spark ignition engine as a function of the mean piston speed
um and
BMEP. The same figure also shows the full load
BMEP of the
CNG-fueled naturally aspirated engine. As already mentioned, each engine considered in this study was sized to provide the target maximum output power of 73.5 kW (100 HP); given the full load
BMEP values of
Figure 8, the necessary engine displacement
VA of the
CNG-fueled naturally aspirated engine was 1610 cc:
Table 3 resumes the whole specifications of the baseline
CNG spark ignition engine.
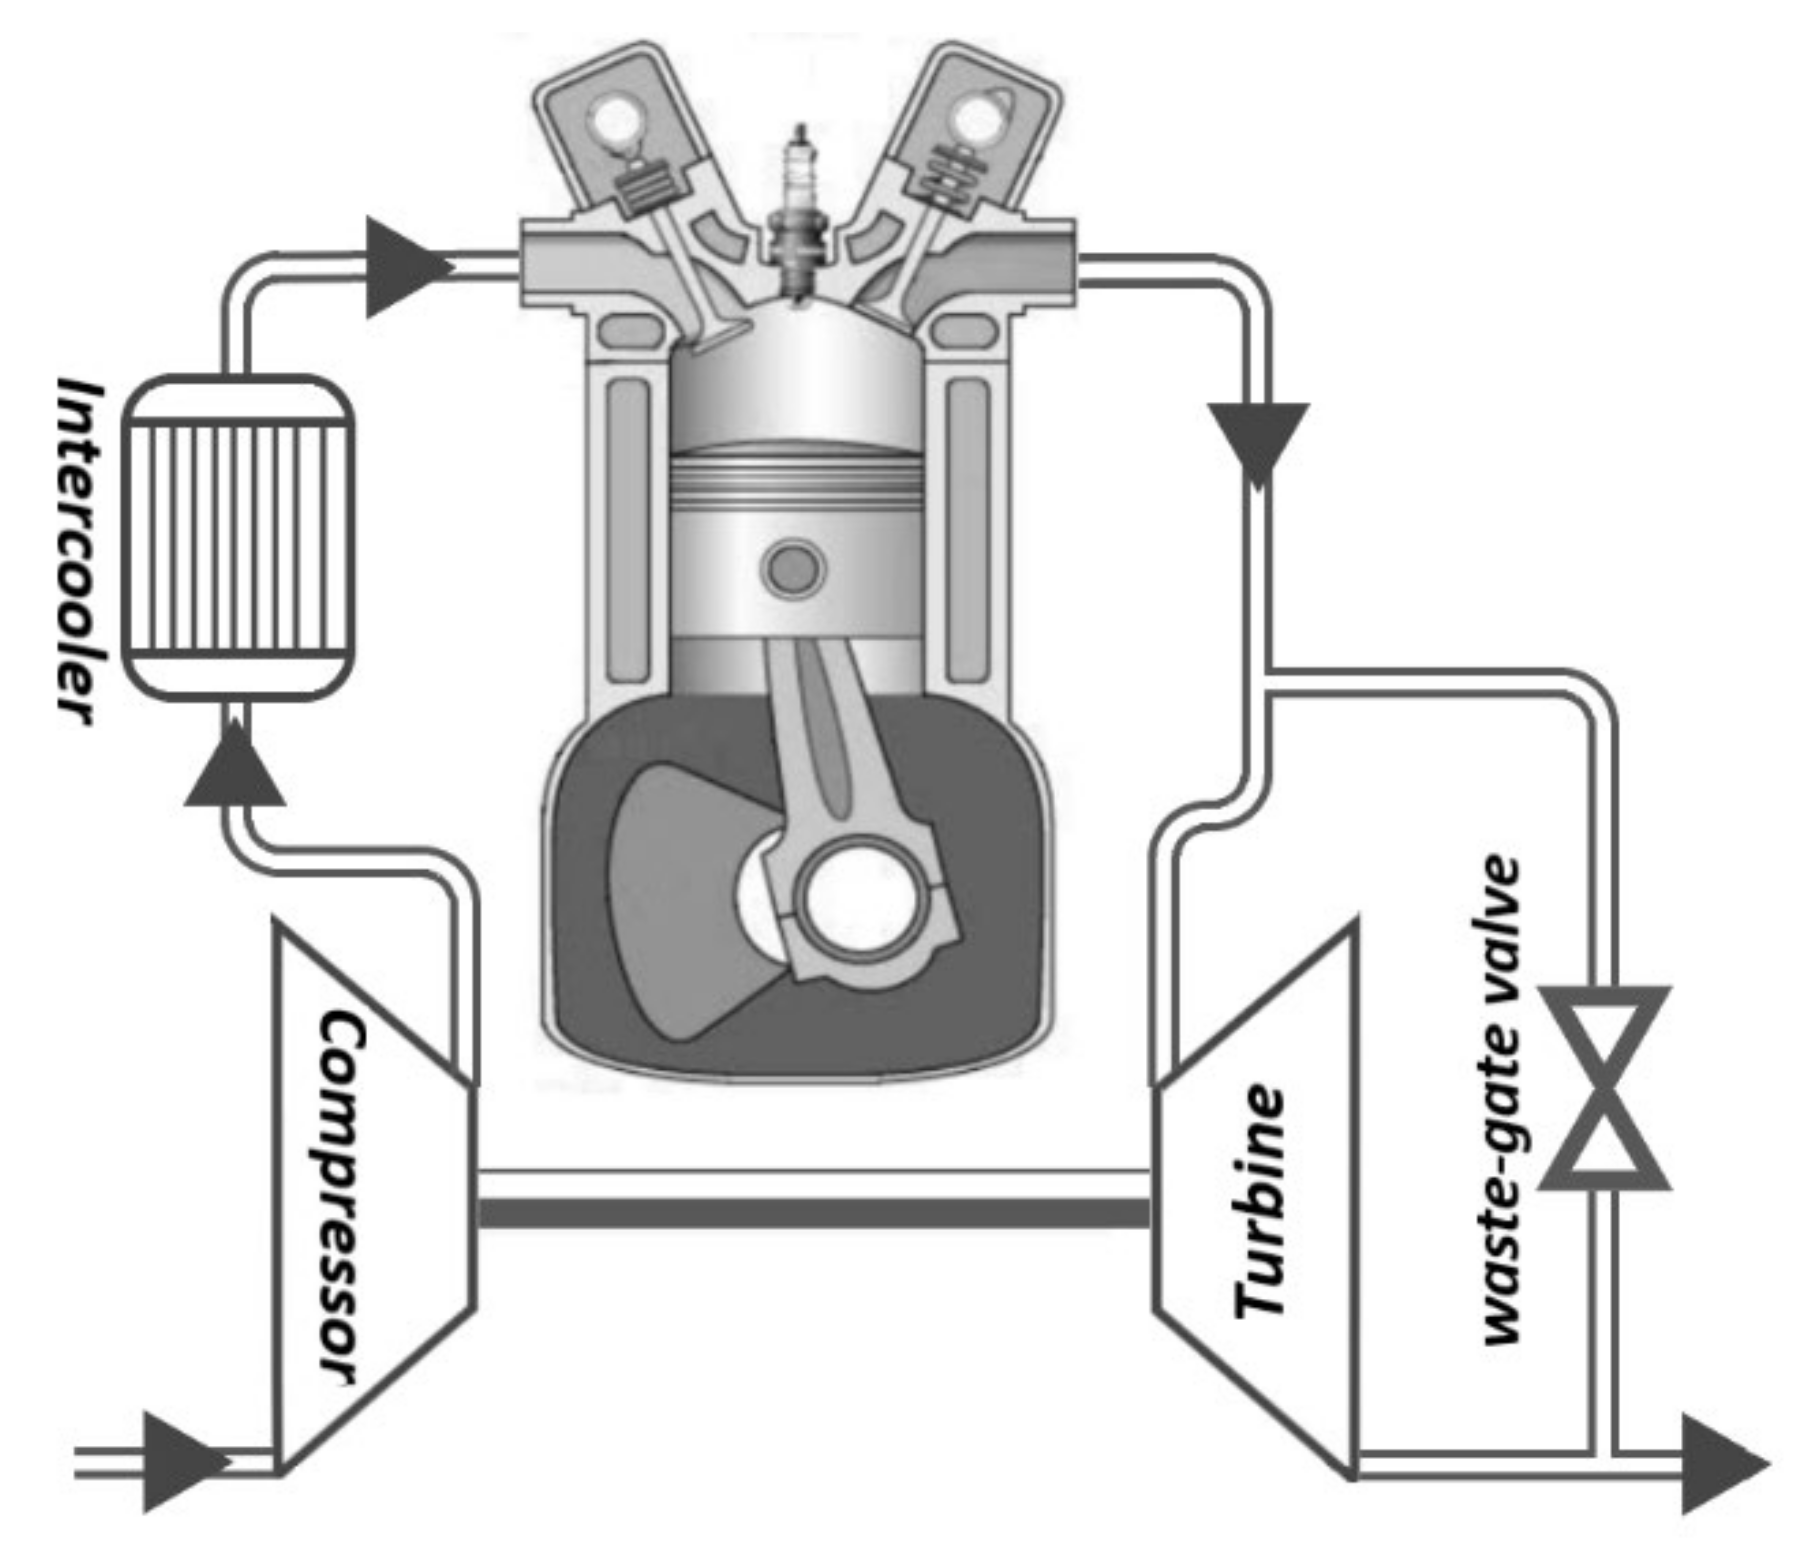
3. Reference Turbocharged CNG Engine
As already mentioned, the advantages connected to the implementation of the separated electric compound SI
CNG engine were compared with a reference traditional turbocharged
CNG engine, whose performance is evaluated in this section. The scheme of the reference turbocharged
CNG engine is represented in
Figure 9: the turbocharger is composed of a turbine and a turbocompressor which are mechanically linked to each other, and both are fluid-dynamically connected to the engine.
Figure 9 also shows the presence of a waste-gate valve for the turbine bypass, and an intercooler between the engine and the compressor for cooling down the air charge. Given the high knock resistance of natural gas [
27,
28] and the relatively low engine compression ratio adopted (i.e., 11), for the
CNG-fueled turbocharged engine, a maximum boost pressure of 1.85 bar was assumed. Based on the specific parameters of the baseline
CNG naturally aspirated engine, the performances of the turbocharged engine were then determined.
As a first step, the authors calculated the air mass flow to the engine, which, for each
MAP and mean piston speed
um, is:
where
VT is the turbocharged engine displacement,
n is the speed of rotation,
λV,T is the volumetric efficiency, and
δT is the air density at the engine inlet, evaluated through the ideal gas law:
which in turns depends on the intercooler outlet temperature
TT and on the manifold absolute pressure
MAP. The compressor outlet temperature was estimated as:
where
ηC is the compressor adiabatic efficiency (whose evaluation is described further on),
βC = pC/p0 is the compression ratio, and
kC is the isentropic coefficient. Assuming a plausible intercooler efficiency value
RINT equal to 0.7, it was possible to determine the temperature of the air inlet to the engine:
The volumetric efficiency of the turbocharged
CNG engine
λV,T was evaluated from the volumetric efficiency of the naturally aspirated
CNG engine
λV0 for each mean piston speed
um and corrected through two factors. The first correction considers the variation of the pressure difference between the engine inlet and exhaust, while the second is instead linked to the increased inlet temperature to the engine (which, as is known, increases the volumetric efficiency) due to the compression from the ambient to the turbocharging pressure. For the evaluation of the first correction factor, a simple approach usually adopted in academic courses was followed:
Obviously, this correction factor is unitary when no pressure difference exists between the inlet and the exhaust. Considering that the exhaust back pressure
pS0 of the baseline naturally aspirated engine was assumed to be higher than the atmospheric pressure (
pS0 = 1.1
p0, as mentioned before), to take into account the variation of the difference between the inlet and exhaust pressure due to both
MAP and
pS variation, the authors employed Equation (23) as follows:
where, as already mentioned, the volumetric efficiency
λV0 of the baseline naturally aspirated engine was considered at the exhaust pressure
pS0 and at the manifold pressure
p0. As regards the second correction factor, which accounts for the increased inlet temperature due to compression, the authors adopted the classical relation:
Therefore, combining Equations (24) and (25), the volumetric efficiency
λV,T of the turbocharged engine was evaluated:
In a turbocharged engine, as shown in
Figure 9, the power required by the compressor
Pcomp to compress the air mass flow
GT is supplied by the turbine, whose power output is
Pturb. The power balance is hence:
The power required by the turbocompressor is:
Additionally, the turbine output-power is:
where
T0 and
TS are the gas temperature at compressor and turbine inlet, respectively,
cpC and
cpS are the specific heat at a constant pressure of fresh air and exhaust gas, respectively,
ηS is the efficiency of the turbine (whose calculation procedure is described below),
GS is the turbine mass flow and
βS is the turbine pressure ratio. It is worth pointing out that the turbine pressure ratio
βS is defined as:
where
pS is the in-cylinder gas pressure during exhaust stroke, Δ
p1 is the pressure drop in the turbine inlet, and Δ
p2 is the pressure drop between the turbine outlet and ambient pressure
p0; hence, the overall exhaust pressure drop from the cylinder to the ambient pressure is:
In this paper, for simplicity purposes, the overall exhaust pressure drop was considered unchanged with respect to the baseline engine, and was composed of two equal parts, thus obtaining:
Focusing on the turbocharger, the turbine mass flow
GS and the compressor mass flow
GT are connected through the relationship:
where the term
is the fuel mass flow (which is added to the air mass flow downstream the compressor), while Ω represents the portion of exhaust mass flow that is not bypassed by the waste-gate valve (common values of Ω lie between 1 and 0.4). According to the power balance of Equation (27), the turbocharging compression ratio can be expressed as:
In the calculations performed, the parameter Ω related to the waste-gate opening was adaptively reduced to prohibit exceeding the maximum allowed value of compression ratio
βC (i.e., 1.85). For the evaluation of the exhaust gas temperature at the pressure
pS, another simple equation usually adopted in academic courses was adopted:
where
T1 represents the inlet temperature at intake valve closure (IVC) of the turbocharged engine, whose value is assumed as being equal to the gas temperature at the intercooler outlet
TT, while
T4 is the in-cylinder gas temperature at the exhaust valve opening (EVO) and
kS is the isentropic coefficient of the exhaust gas. The experimental data and scientific literature report, for a spark ignition engine, values of the ratio
T4/T1 ranging from 3.5 to 4.5, depending on the particular engine and on the operating condition. In this work, the temperature ratio
T4/T1 was assumed to remain constant, separate from engine load and speed. However, with the aim of investigating the effects of its variation on the performance of the whole system, three different values were selected, i.e.,
T4/T1 = 3.5, 4.0 and 4.5, and the entire calculation procedure was repeated for each of the three values.
The isentropic coefficient
kS was evaluated according to the perfect gas hypothesis:
where
RS’ is the burned gas constant and
cv,S is the constant volume specific heat (evaluated at the exhaust gas temperature
TS). Obviously, the thermochemical properties of the burned gas were calculated as weighted averages on the basis of the chemical composition, i.e.,
where
x is the mass fraction of each chemical species in the burned gas: for this purpose, the combustion of a hydrocarbon with H/C = 3.78 was considered for the calculation of each mass concentration (see
Table 2). It is worth noting that in both Equations (38) and (39), no carbon monoxide is considered, due to the assumption that the
CNG-powered engine was never fueled with rich air–fuel mixtures. The constant-pressure specific heat of each chemical species in the burned gas was evaluated as a function of the exhaust gas temperature
TS through the Shomate equations and the coefficients available on the NIST Chemistry WebBook [
29].
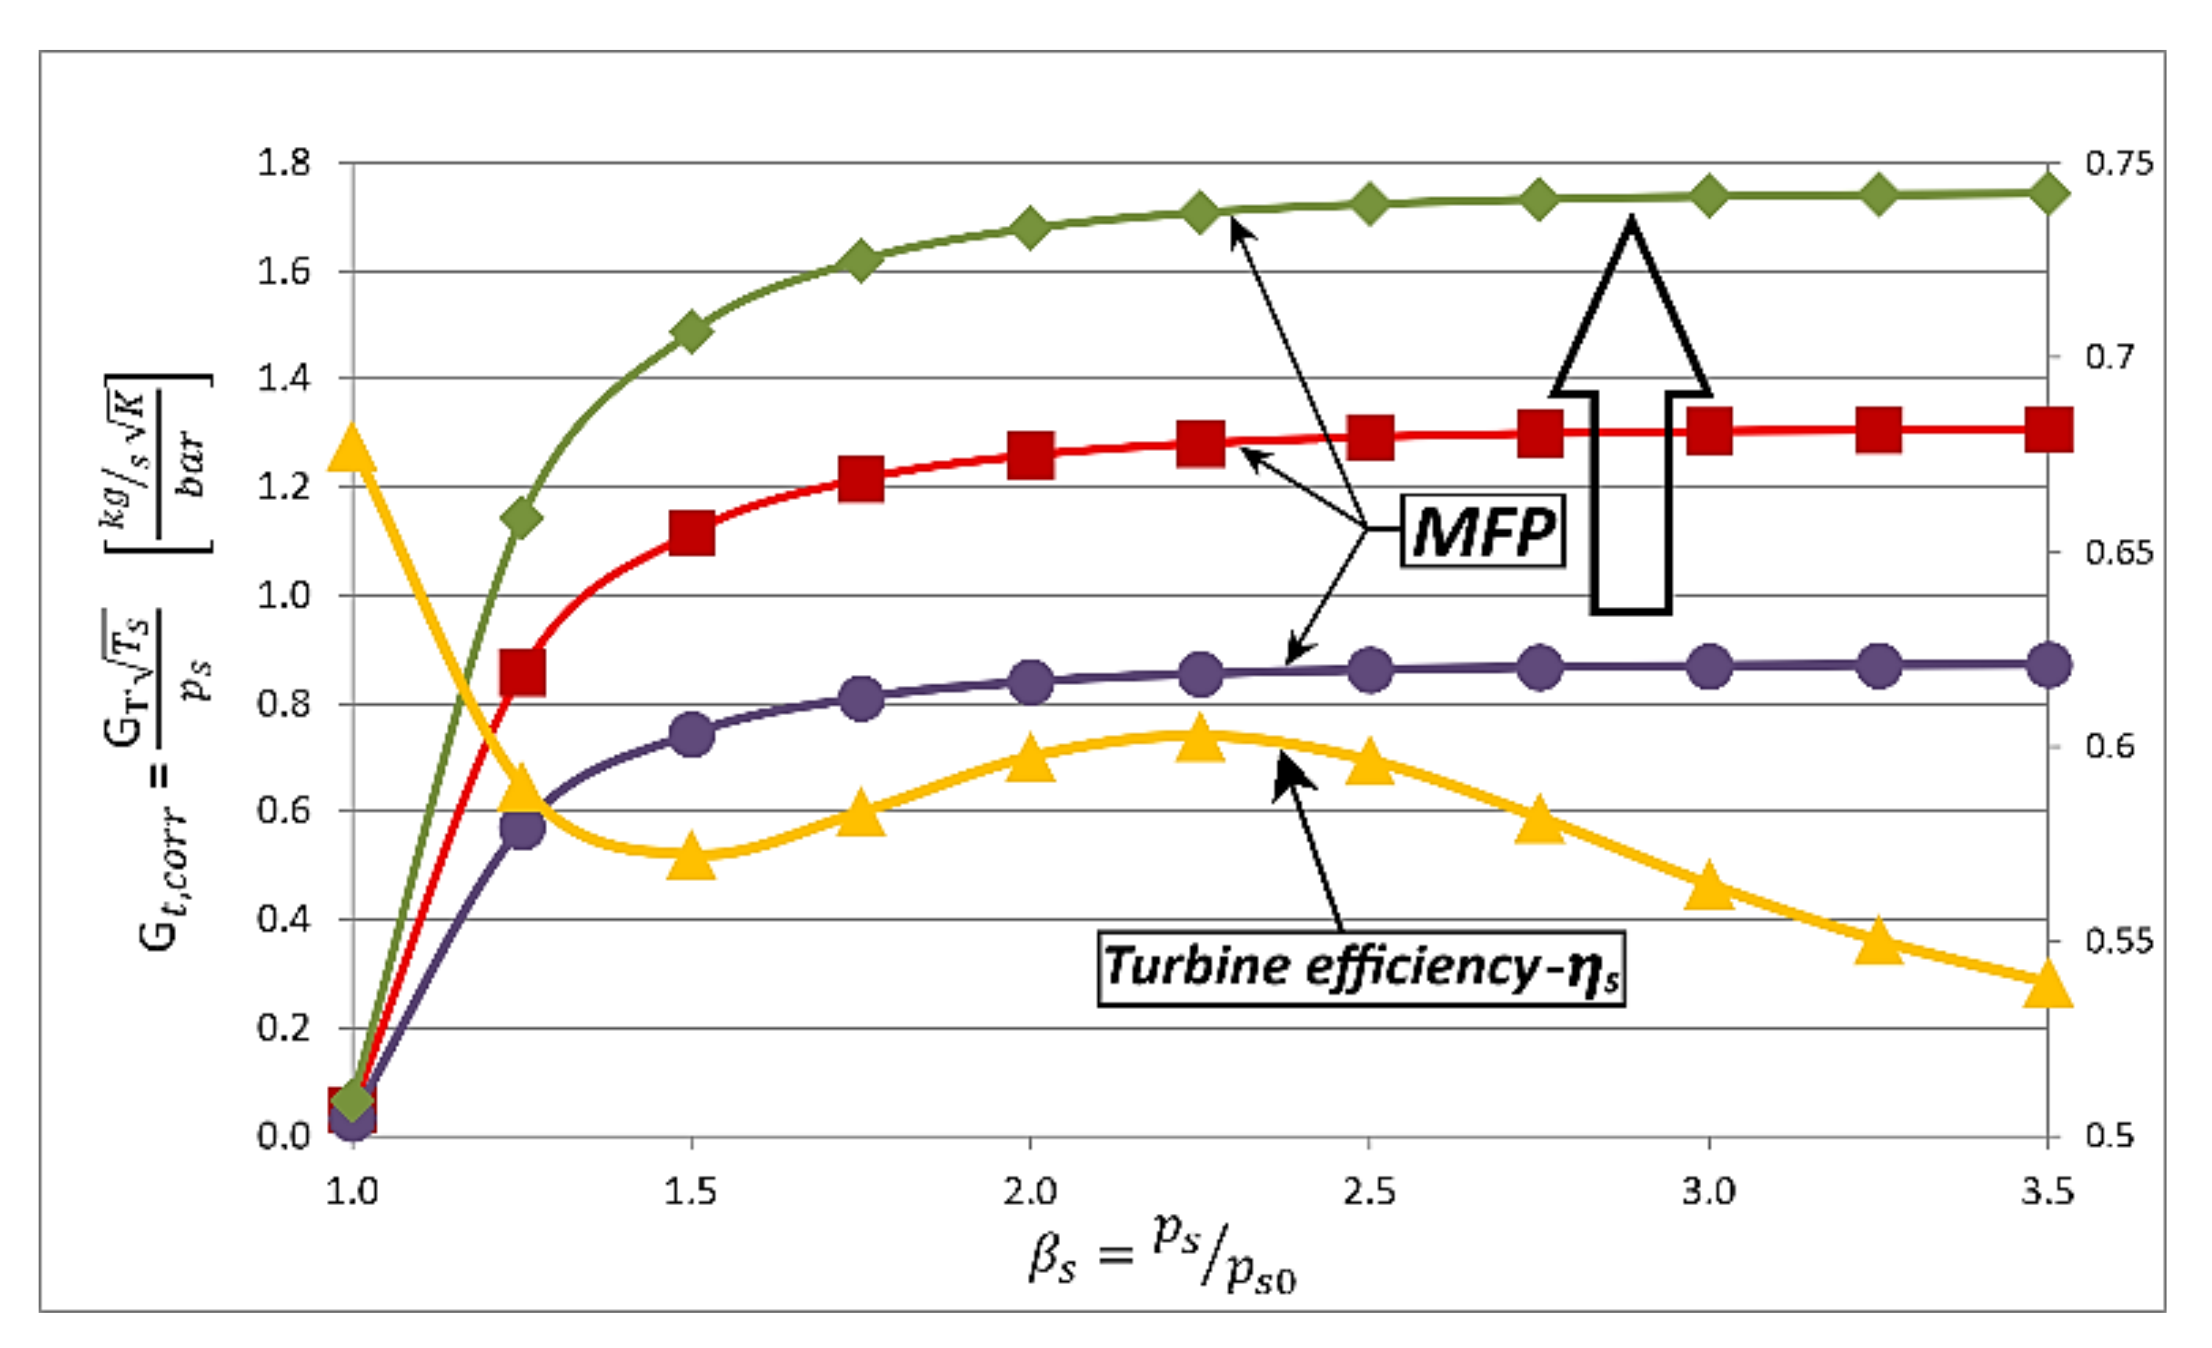
The calculation of the power produced by the turbine requires the turbine characteristic curves correlating the pressure ratio to the gas mass flow for each speed of rotation. According to the simple approach followed in this model, a single fitting curve was adopted to describe the turbine mass flow parameter MFP as a function of the pressure ratio
βS, whose mathematical expression is:
The values of the function parameters
a,
b,
c and
d were obtained by means of a least square regression procedure performed on the performance data of a market available product (IHI RHF3). The turbine mass flow
GS could then be obtained from the
MFP:
Since, in the calculations performed, the engine size was iteratively determined on the basis of the specific performance obtained, the
MFP curve of Equation (40) was amplified or reduced in order to adapt the turbine size and swallowing capacity to the displacement and performance of the engine under analysis: as an example,
Figure 10 shows the
MFP curves related to three different turbine sizes. The data available on the mentioned commercial product also allowed us to express the turbine efficiency as a function of the pressure ratio
βS by means of the polynomial function:
The resulting efficiency curve
ηS is also reported in
Figure 10.
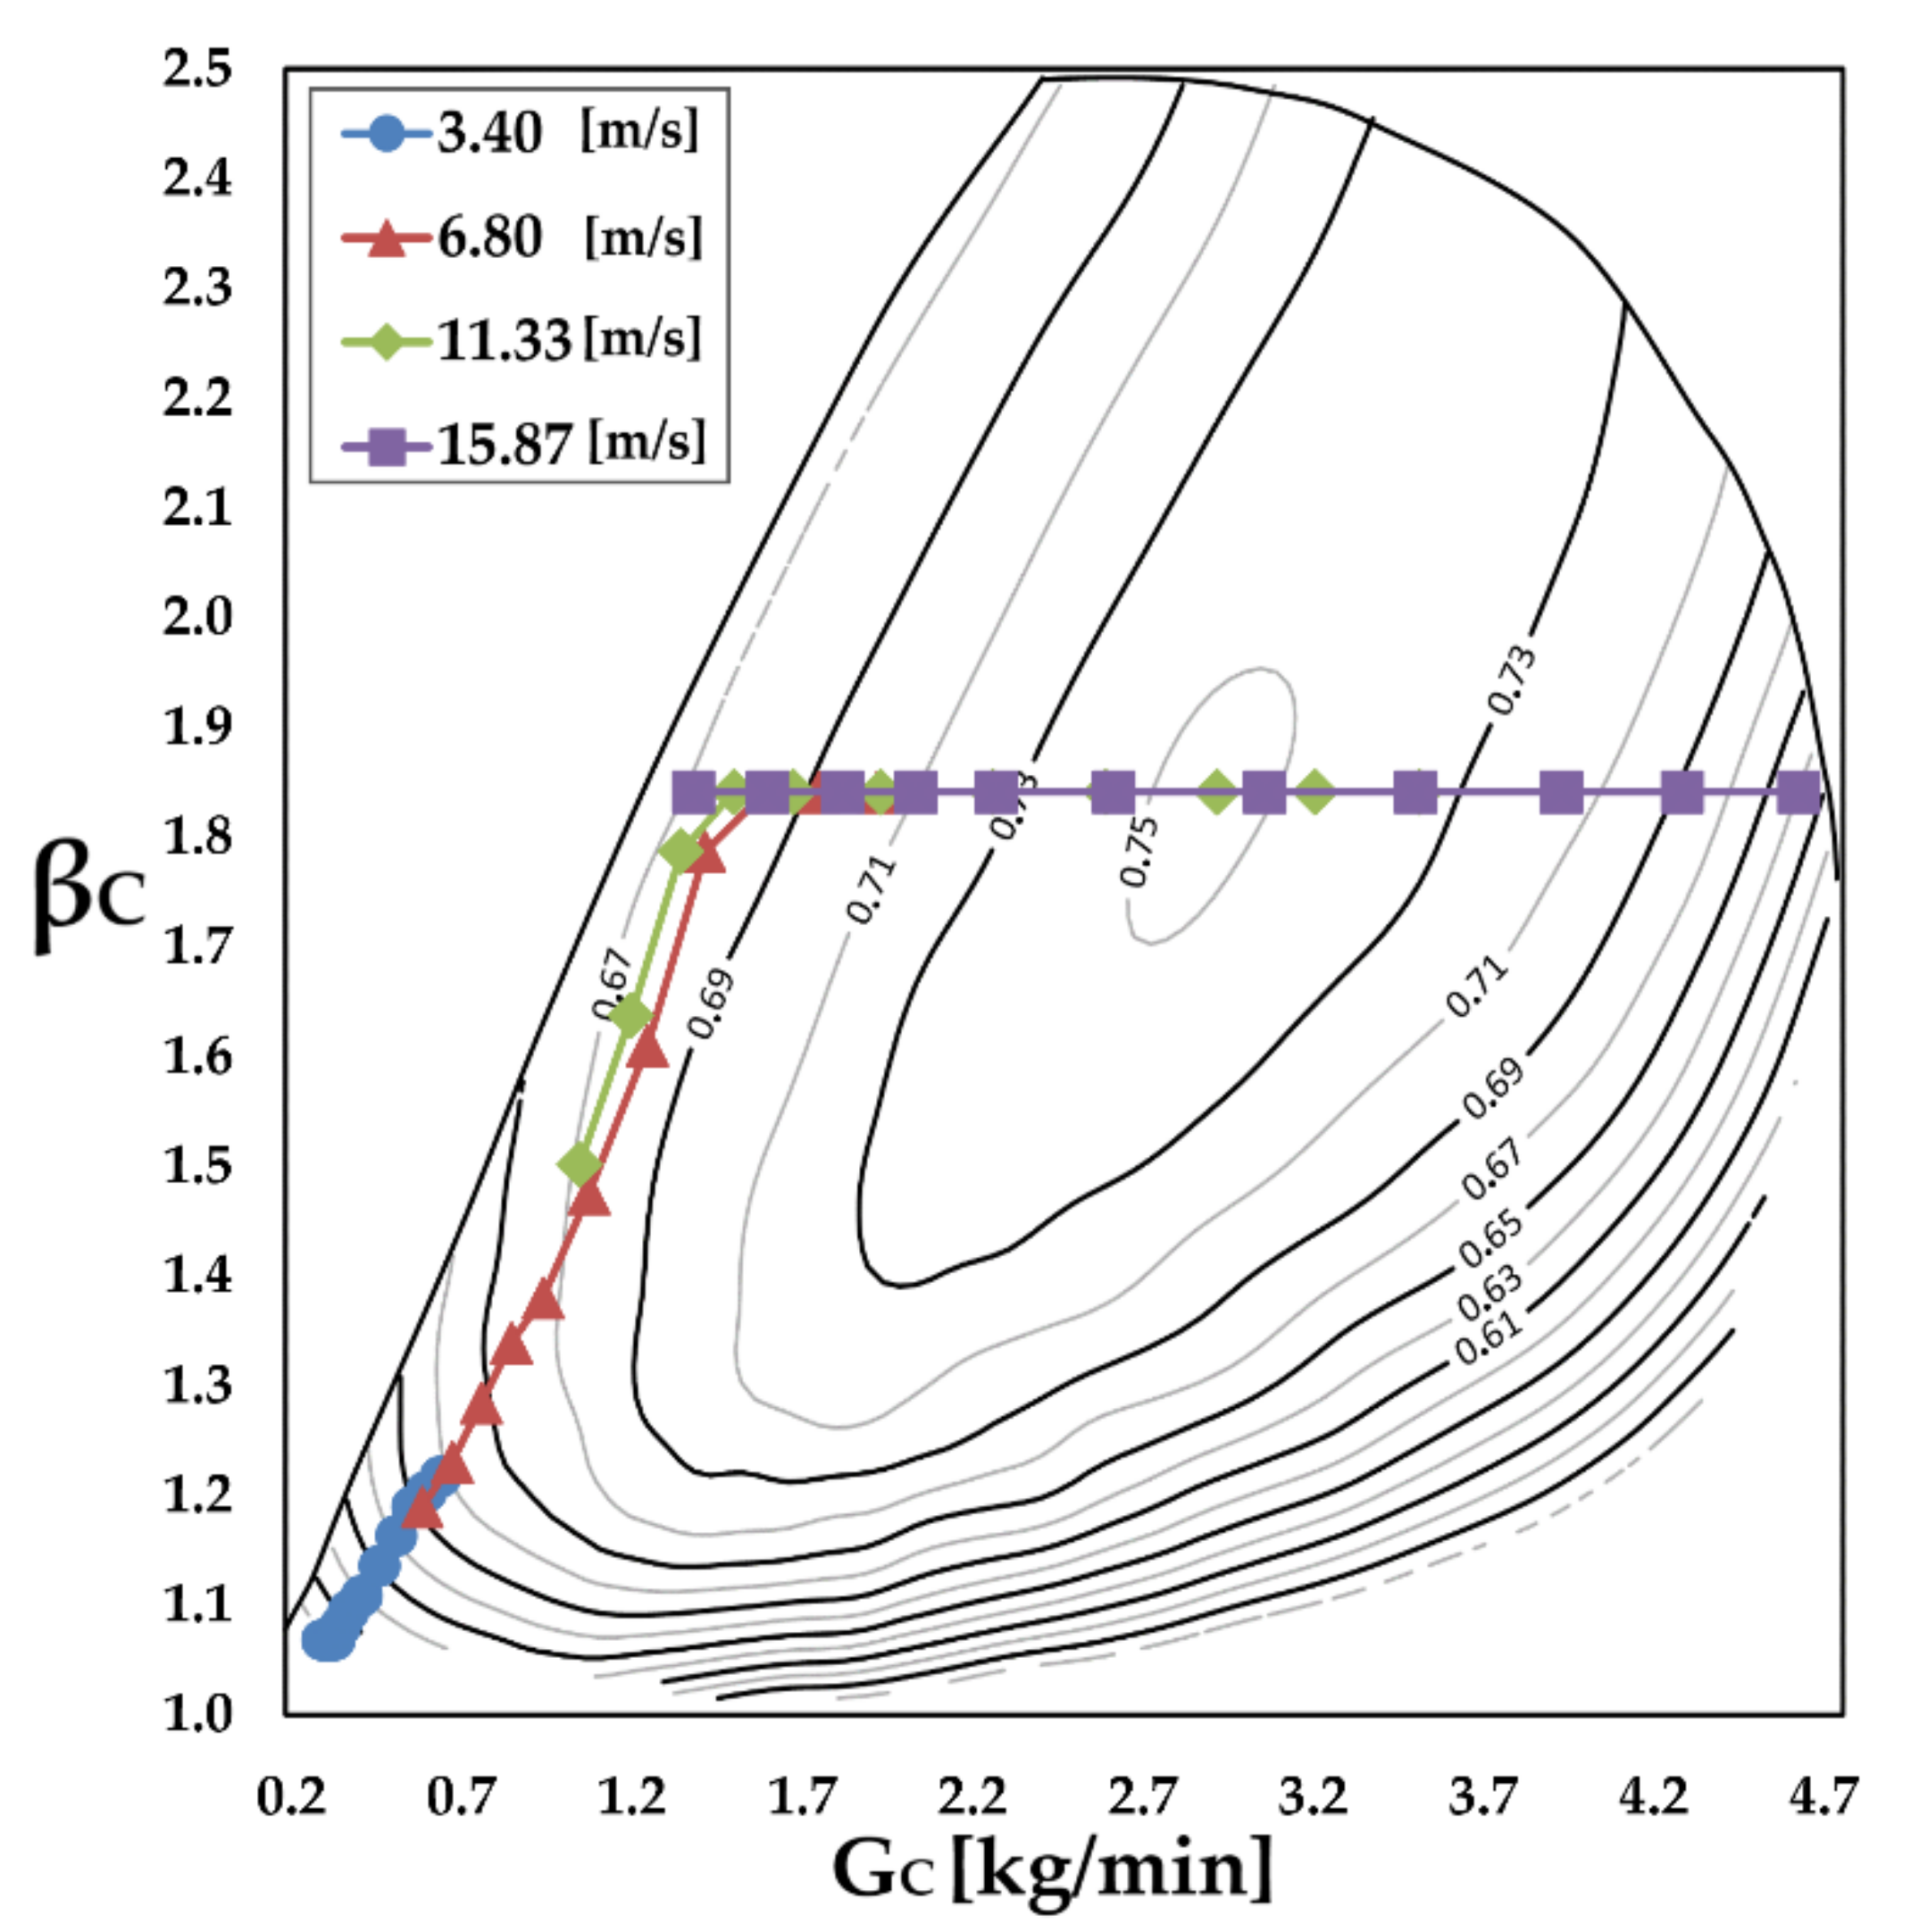
The performance map of the IHI RHF3 series turbocharger was also used for the evaluation of the compressor efficiency
ηC. As performed for the turbine, an iterative resizing procedure was also carried out to best adapt the compressor size to the engine. For this aim, the turbocharger map was recursively adapted by modifying the minimum and maximum values on both axes (
βC,
GT), thus maintaining the compressor operating points within the scaled map, as shown in
Figure 11. The calculation of the operating parameters of the turbocharger thus requires, for each mean piston speed
um (from 2.3 to 17.0 m/s) and
MAP (from 0.78 bar up to 1.85 bar), the recursive solution of Equations (23)–(42). Once the system of equations is solved, the conditions of the gas at the engine inlet and outlet are known, and then the performance of the turbocharged engine may be evaluated. The described iterative adaptation of the turbocharger size represents the procedure usually employed when selecting and matching a turbocharger to a specific engine.
As a starting hypothesis for the mathematical modeling of the turbocharged engine, the authors assumed that the same gross indicated efficiency is obtained at the same normalized MAP and mean piston speed, even with different absolute manifold pressures. This is obviously a simplified assumption which underestimates the efficiency of the turbocharged engine, which should instead be slightly higher with respect to the naturally aspirated version.
Defining the normalized
MAP as:
according to the hypothesis made, the gross indicated efficiency of the turbocharged engine
ηig,T was determined starting from the gross indicated efficiency of the naturally aspirated engine
ηig,CNG:
Once we established the gross indicated efficiency for each operating point, it was possible to obtain the gross indicated mean effective pressure
IMEPg,T of the turbocharged engine as:
In turn, the net indicated mean effective pressure
IMEPT was calculated as:
while the pumping mean effective pressure
PMEPT was simply calculated as:
With the friction mean effective pressure still being represented by Equation (2) adopted for the naturally aspirated engine, the authors determined the brake mean effective pressure
BMEPT of the turbocharged engine:
and the corresponding brake specific fuel consumption
BSFCT:
As performed in the case of the naturally aspirated engine, the full load
BMEPT values were used to size the displacement
VT of the turbocharged engine necessary to develop the maximum target output power of 73.5 kW. As already pointed out, the entire calculation procedure described in this paragraph was repeated for each assumed value of the temperature ratio
T4/T1 (i.e., 3.5, 4.0 and 4.5).
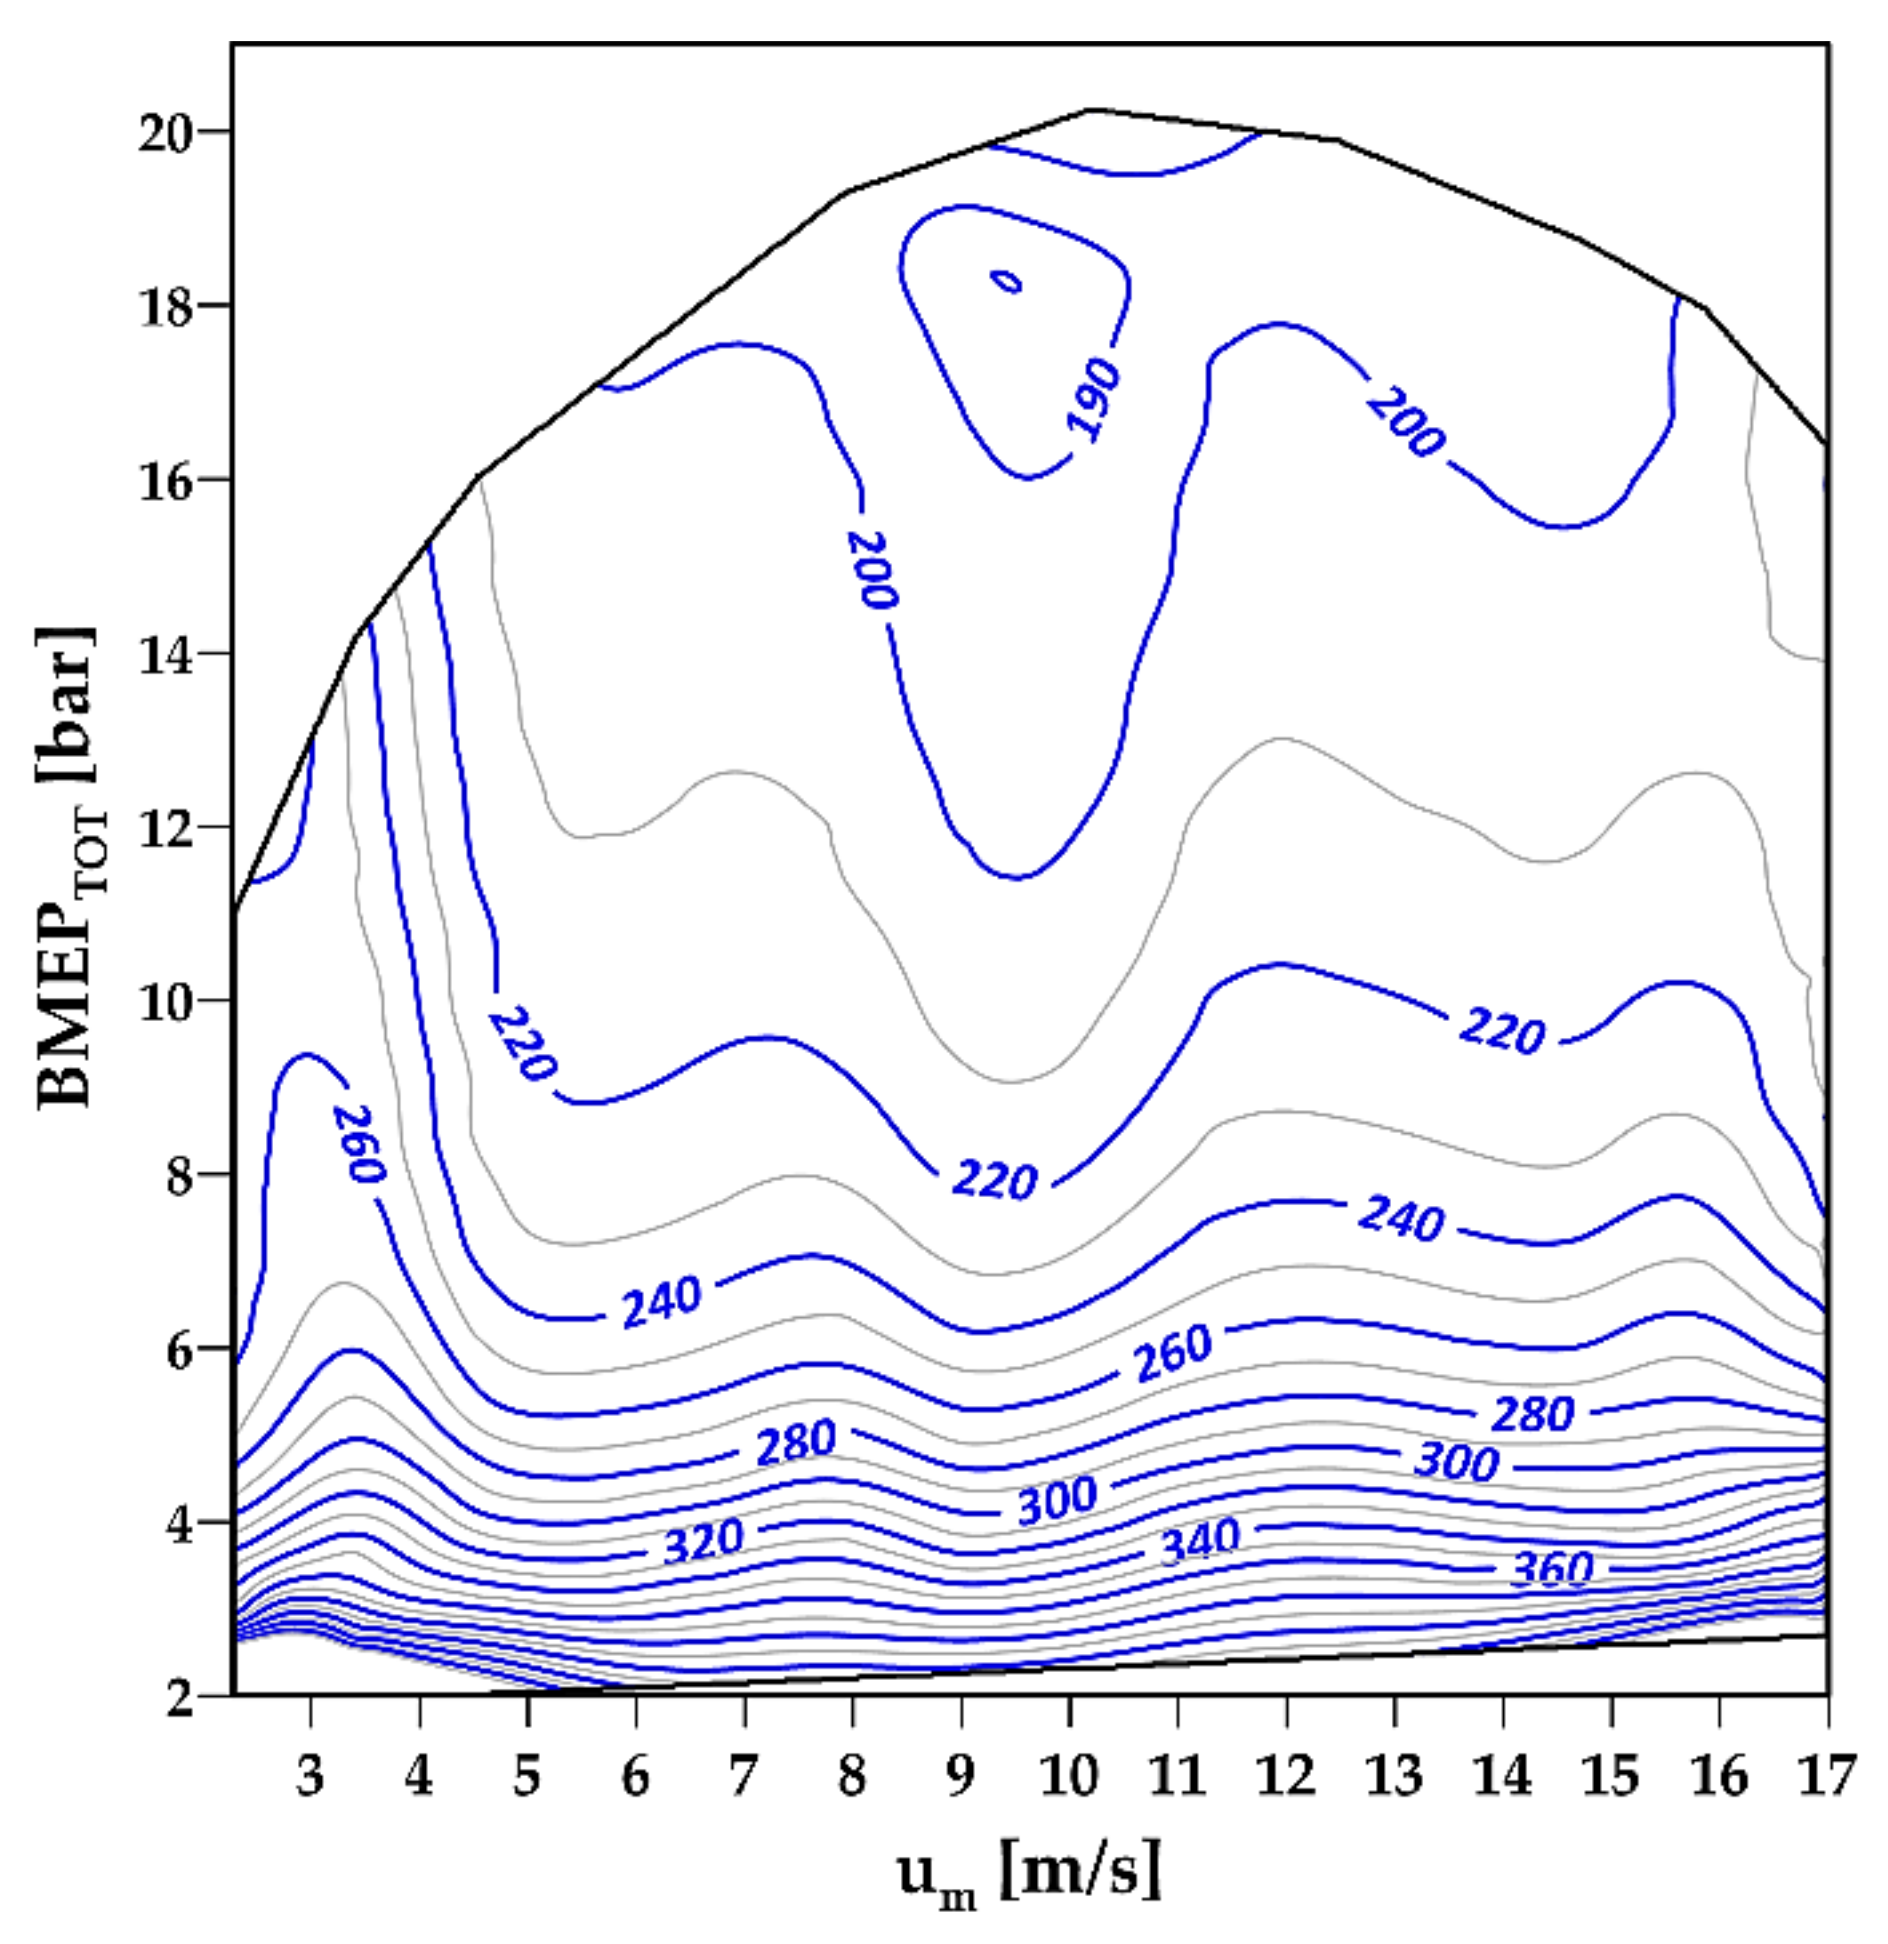
Table 4 reports the main characteristics and performances determined for the turbocharged
CNG-fueled engine according to the three temperature ratios
T4/T1. A contour map of the brake specific fuel consumption obtained for the intermediate case of
T4/T1 = 4 is reported in
Figure 12.
4. Separated Electric Compound Spark Ignition Engine
This section describes the calculation algorithm developed to evaluate the performance of the proposed compound engine, which will finally be compared with the reference turbocharged engine developed in the previous section.
Figure 2c shows the schematic representation of the compound system proposed in this work, composed of a spark ignition engine supercharged by an electrically powered turbocompressor, and endowed with a turbine generator group dedicated to recovering the unexpanded gas energy of the exhaust gas;
Figure 3, meanwhile, reports a possible hybrid architecture endowed with the compound engine: as already clarified, in the system conceived in this paper, the energy recovered by the turbine generator is stored in the energy storage system of the vehicle and used for vehicle propulsion. As can also be noted in
Figure 2c, a bypass valve between the compressor inlet and outlet allows us to power off the compressor in the part load operation, when an
MAP lower than 1 bar is required, thus reducing the power absorption of the supercharging system. As already pointed out, the turbine generator group is instead considered to operate permanently, in order to recover as much energy as possible from the exhaust gas. As regards the sizing of the turbocompressor, the authors followed the same procedure and calculation algorithm already described in the previous section for the reference turbocharged engine. It is worth noting that the authors hypothesized the use of a turbocompressor, it being the most commonly used tool of its kind in the automotive field; however, nothing prevents the adoption of a different machine, such as a Roots type or a screw compressor. It must be also pointed out that the turbine considered for this application substantially differs from the turbines commonly employed for turbocharging purposes, which only provide the power necessary to drive the compressor and are designed to comply with wide variations of speed and mass flow, thus not being optimized for steady state operation. For this reason, the turbines developed for turbocharging application are low-inertia single-radial stage machines, with conversion efficiencies far below the values reached by turbines used in stationary systems. As will be shown later on, the turbine considered in this work will have to deliver powers up to 23 kW, which is why it should be composed of more than a single stage (two or more), in order to recover the exhaust energy content with higher efficiency than common turbocharging turbines. Moreover, as already mentioned, the exhaust gas turbine employed in a hybrid propulsion system should work under almost steady state conditions, which is why a torque/current control on the generator would allow the machine to operate at its best efficiency speed ratio, regardless of the power produced. The only turbine generator products present on the market or studied until now are composed of a radial turbine for turbocharging applications connected to an electric generator [
30,
31,
32], and are designed exclusively to supply the vehicle’s electric accessories, thus producing a very limited power output (i.e., 6 kW). Due to the lack of adequate products both in the literature and on the market, and according to the previous considerations, the authors assumed that in the compound engine, the turbine works with an almost constant speed ratio, regardless of the power produced, and hence with an almost constant efficiency
ηT. Given the lack of previous studies, it was not possible to exactly predict the effective efficiency of the exhaust gas turbine: on account of this, the authors decided to consider two different efficiency levels, thus assessing the effect of this parameter on the overall energetic performance of the entire compound system. In detail, the two levels of efficiency considered for the compound engine turbine are
ηT = 0.70 and
ηT = 0.75. As already mentioned, the two efficiency values of the exhaust gas turbine are substantially higher than a common turbocharging turbine, due to the dedicated and optimized design for steady state power production.
As already conducted in the case of the reference turbocharged engine, the performances of the compound engine were evaluated for each
MAP (from 0.78 bar to the maximum allowed 1.85 bar) and mean piston speed
um (from 2.3 to 17.0 m/s). The gross indicated mean effective pressure of the compound engine was evaluated as:
where the inlet air density
δCOMP of the compound engine was evaluated by means of Equations (20)–(22). For the evaluation of both the indicated gross efficiency
ηig,COMP and the volumetric efficiency
λV,COMP, some observations are necessary, considering that the exhaust gas turbine will produce an increase in the exhaust gas back pressure
pS. Differing from a traditional turbocharged engine, the effect of the increased exhaust back pressure will certainly be stronger in the compound engine for two main reasons: firstly, because unlike the traditional system, in the proposed compound system, the exhaust gas turbine works with the whole exhaust mass flow with a relatively high pressure ratio
βS = pS/pS0 (as will be shown later). Secondly, the expander-generator unit is considered to remain permanently active, i.e., also for the partial load operation, when the engine
MAP is lower than 1 bar. As is widely known, an increase in the engine exhaust back pressure affects both the indicated gross efficiency and the volumetric efficiency. As concerns the volumetric efficiency, a higher exhaust back pressure causes a higher residual gas mass inside the cylinder, thus limiting the amount of fresh mass that can be introduced during the intake phase. This phenomenon was taken into consideration by means of Equation (26), which correlates the volumetric efficiency to the pressure difference between intake and exhaust. Alternatively, as regards the indicated engine efficiency, it is known that a higher in-cylinder residual gas fraction (
RGF) will certainly slow down the flame propagation speed and worsen the combustion efficiency; however, no useful mathematical expressions were found in the scientific literature to represent the indicated efficiency deterioration as a function of the exhaust back pressure: on account of this lack of mathematical expressions, the authors performed a dedicated series of experimental tests on a bench test (whose detailed description may be found in [
33,
34]) equipped with a 1.242 L port injected spark ignition engine fueled with
CNG and connected to a Schenck W130 eddy current dynamometer; a throttle valve installed in the exhaust pipe was used to modulate the exhaust back pressure, and an AVL GU13X piezoelectric pressure sensor flush mounted in the engine combustion chamber was employed for the in-cylinder pressure measurement, performed with a sample resolution of 1 CAD through the use of a 360 ppr optical encoder connected to the engine crankshaft. The exhaust pressure was evaluated as the average in-cylinder pressure during the exhaust stroke, excluding the blowdown period. The air mass flow was measured by means of an FCI ST75 mass flow meter, while natural gas mass flow measurement was performed using an Endress + Hauser Coriolis effect PROMASS 80A; an ECM AFRecorder 2400 module was employed to measure both the manifold absolute pressure and engine speed.
Table 5 resumes the operating condition of the test: as is shown, for each engine speed, the exhaust pressure was increased with steps of 0.1 bar until the occurrence of heavy combustion instability (identified by misfires occurrence), and without exceeding the maximum level of 2 bar.
Table 6 instead reports the measurement accuracy of the instrumentation employed in the experimental test.
The experimental measurements showed that there is a correlation between the increase in the residual gas fraction (defined as the ratio between the residual gas mass and the total in-cylinder mass of gas) and the decrease in the gross indicated efficiency, whose best fit was obtained by the equation:
where
is the ratio between the indicated gross efficiencies measured with and without exhaust throttling, while
x = RGF/RGF0 is the ratio between the residual gas fractions detected with and without exhaust throttling; the parameters
b and
γ are correlated with the mean piston speed, which, as shown in
Figure 13, has a strong influence on the efficiency variation.
Each residual gas fraction
RGF was estimated through the procedure described in
Appendix A.
With the same approach followed for the reference turbocharged engine, it was assumed that the gross indicated efficiency is the same for the same engine and the same conditions of normalized
MAP ϕ and mean piston speed
um. According to this assumption, the reference gross indicated efficiency of the compound engine
ηi,g,COMP,0 (i.e., without exhaust throttling) was evaluated as:
The residual gas fraction
RGF and the resulting gross indicated efficiency
ηi,g,COMP of the supercharged compound engine could hence be determined for each
MAP and mean piston speed on the basis of the exhaust gas back pressure
pS through Equations (51)–(53). The gross indicated mean effective pressure could be then calculated using Equation (50), which, in turn, allowed us to evaluate the compound engine net indicated mean effective pressure
IMEPCOMP:
with the pumping mean effective pressure
PMEPCOMP being estimated through Equation (47), as in the case of the reference turbocharged engine. Equation (2) was then employed to evaluate the
FMEPCOMP, and hence the engine
BMEPCOMP was obtained from Equation (48).
Unlike the previous cases, however, in the compound system, the exhaust gas turbine actively contributes to the energy production, and so the total output power results from the sum of the engine and the turbine contributions. The overall brake mean effective pressure of the whole compound system
BMEPTOT can hence be obtained as:
where
RMEP is the recovery mean effective pressure of the exhaust gas turbine and
CMEP is the compression mean effective pressure, derived from the power required by the motor-compressor. The recovery mean effective pressure
RMEP was estimated as:
where
Ptur is the power produced by the exhaust gas turbine,
VCOMP is the displacement of the compound engine and
ε is the number of engine revolutions per cycle (two in a four-stroke engine). Analogously, the compression mean effective pressure was calculated as:
where
Pcomp is the power required by the compressor and
ηEM is the electric motor efficiency. As can be noted, the efficiency of the electric motor driving the compressor was considered, the motor-compressor group being an auxiliary device which affects the system energy balance; the efficiency of the turbine electric generator was not considered in the
RMEP (Equation (57)) with the calculation performed for the output power from the internal combustion engine, which was not reduced by the efficiency of the connected electric generator (MG1 in
Figure 3).
The power required by the compressor and the power produced by the turbine were evaluated as in the previous paragraph:
With the exception being that the intake air mass flow of the compound engine is now GCOMP, while the exhaust gas turbine efficiency is indicated with ηT, all the other parameters (e.g., TS, α, βS, βC, kS, kC, cpC, cpS, etc.) have the same meaning as in the previous paragraph (Equations (28) and (29)). It is worth noting that, as in this case the expander is supposed to permanently work with the entire exhaust gas mass flow, no bypass exists, and hence the term Ω is considered to equal 1.
The engine intake air mass flow is:
The specific performance parameters
RMEP and
CMEP hence become:
After determining the overall brake specific performance
BMEPTOT for each operating condition of
MAP and mean piston speed
um, the overall brake thermal efficiency
ηbTOT of the compound system can be calculated as:
Hence, the related overall brake specific fuel consumption
BSFCTOT is:
It must be pointed out that if, on the one hand, a higher discharge pressure increases the recovery mean effective pressure RMEP, on the other hand, it also increases the pumping mean effective pressure PMEPC (Equation (47)) and worsens the gross indicated thermal efficiency, due to the increased amount of residual gas (Equation (51)); it is therefore evident that, for each engine load (MAP) and mean piston speed (um), there will be a compromise solution between the advantages and disadvantages resulting from increasing the exhaust back pressure pS: in other words, for each operating point of the engine, an optimum exhaust pressure exists which maximizes the overall brake thermal efficiency ηbTOT of the compound system.
In their calculations, the authors thus carried out an optimization process, searching, for each operating point of the engine, for the best exhaust back pressure
pS by maximizing the overall brake thermal efficiency
ηbTOT; since the latter is not a linear or polynomial function of the exhaust pressure, a genetic algorithm was employed for system efficiency optimization. As already done in the case of the turbocharged engine, the entire calculation procedure was repeated for each value of the temperature ratio
T4/T1 (namely 3.5, 4.0 and 4.5) and, in addition, for each value of the exhaust gas turbine efficiency
ηT considered (i.e., 0.70 and 0.75). It is worth highlighting that, differing from the present paper, in the preliminary work [
22], the authors limited their investigation to a single
T4/
T1 ratio and a single turbine efficiency value.
Figure 14 reports the contour maps of the optimal exhaust pressure levels determined for each overall load
BMEPTOT and mean piston speed
um, considering the case of
T4/T1 = 4.5,
ηT = 0.75.
As is shown, higher exhaust back pressures were obtained for the medium to higher loads, where the higher in-cylinder pressures make the recovery of the unexpanded gas energy easier. As can also be observed, optimal exhaust pressures up to 4.4 bar were determined for the extreme case of
T4/T1 = 4.5 and
ηT = 0.75, while in the extreme opposite case (
T4/T1 = 3.5,
ηT = 0.70), optimal exhaust pressures up to 3.4 bar were reached; both scenarios, however, revealed exhaust pressure values significantly higher than in a traditional turbocharged engine: these conditions must be adequately considered for the future optimal design of the exhaust gas turbine dedicated to the unexpanded gas energy recovery. The optimization process led to the determination of the maximum
BMEPTOT levels for each design case, and, as a consequence, of the compound engine displacement
VCOMP necessary to develop the maximum target power of 73.5 kW. The resulting main characteristics of the compound engine for each of the three temperature ratios
T4/T1 considered are summarized in
Table 7 for case study
ηT = 0.7, and in
Table 8 for the case study
ηT = 0.75. The comparison of these results with the performance obtained by the traditional turbocharged engine (see
Table 4) allows us to observe that the minimum fuel consumption is always lower in the electric compound engine.
In greater detail, a reduction in the minimum brake specific fuel consumption of between 6.33% (in the worst case
T4/T1 = 3.5 and
ηT = 0.7) and 12.32% (in the best solution case
T4/T1 = 4.5 and
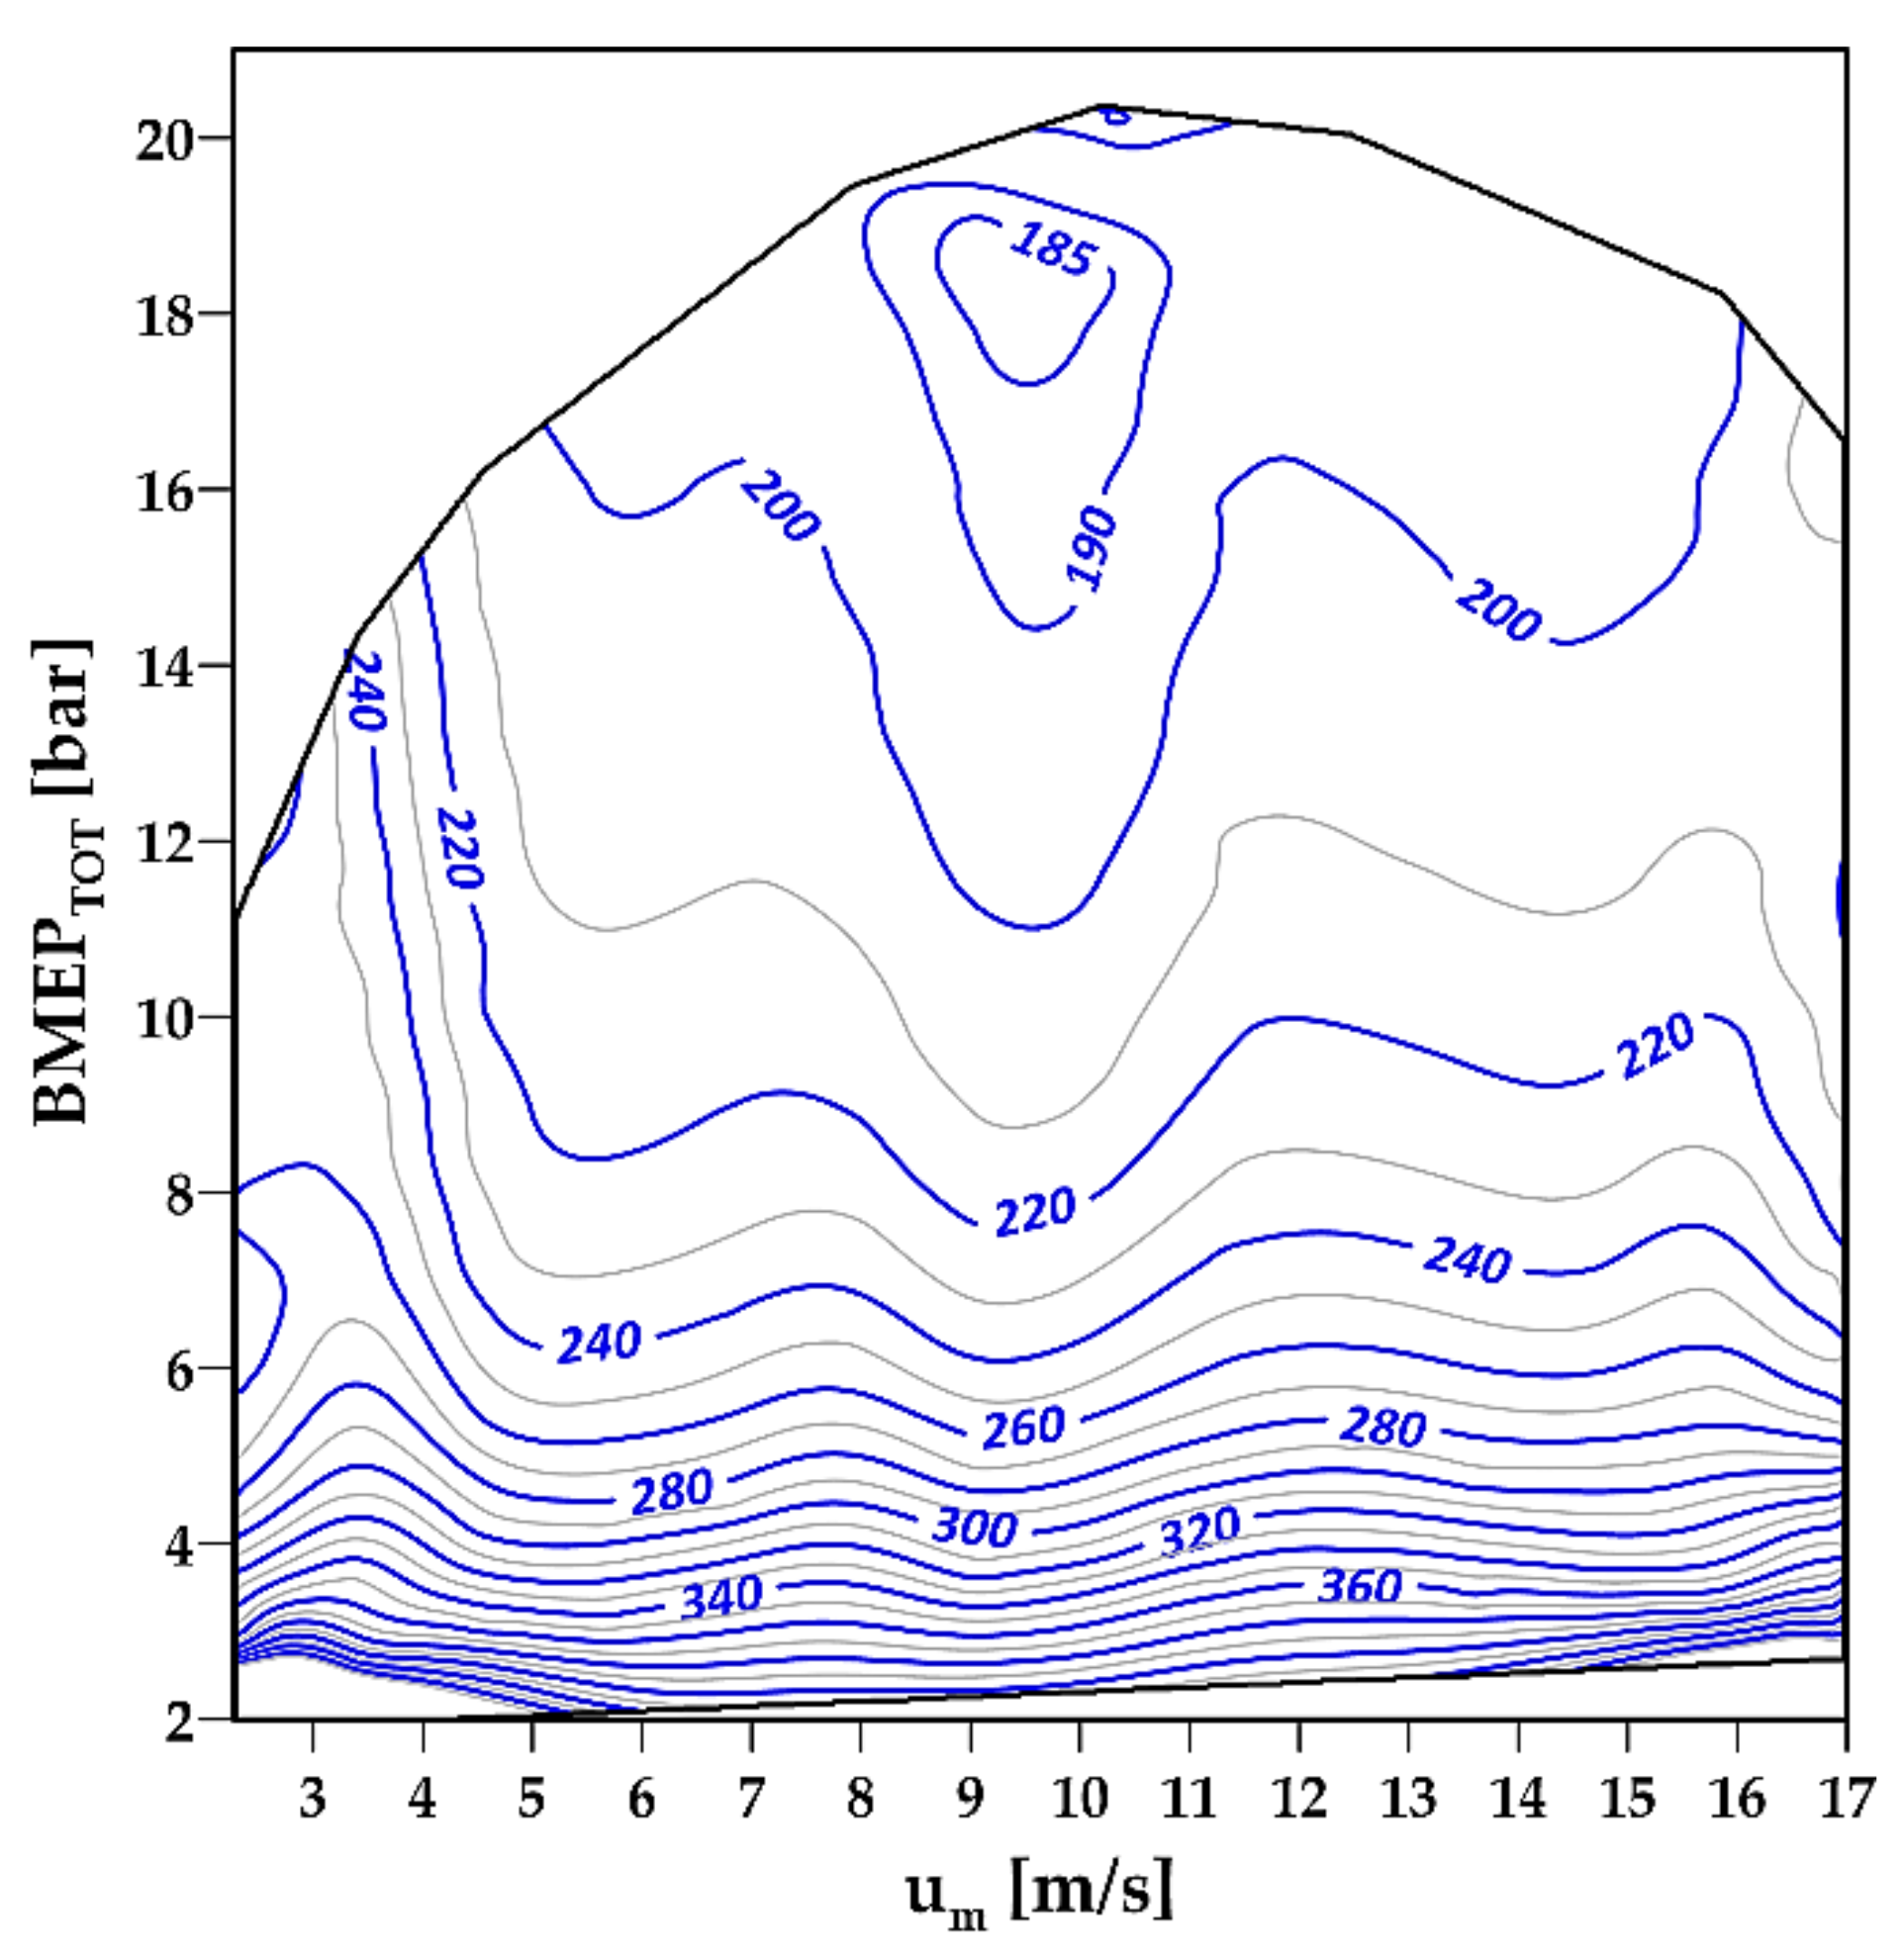
ηT = 0.75) can be noted. The contour maps of the overall specific fuel consumption
BSFCTOT obtained for the two intermediate cases with
T4/T1 = 4.0,
ηT = 0.7 and
T4/T1 = 4.0,
ηT = 0.75 are shown in
Figure 15 and
Figure 16, respectively. As obviously expected, the two diagrams confirm that the overall fuel consumption of the compound system benefits from a higher turbine efficiency. Comparison between the maps in
Figure 15 and
Figure 16 with the fuel consumption map of the reference turbocharged engine (
Figure 12) also allows us to observe that both propulsion solutions show similar
BMEP values, but the compound system always exhibits a better fuel economy compared to the reference traditional turbocharged system.
Table 7 and
Table 8 also show the percentage contribution of the exhaust gas turbine to the overall output power of the compound system, revealing a maximum power share from 24.2% to 42.9%, with the higher results being obtained with the better efficiency turbine (
ηT = 0.75): according to the modelling approach followed, the power contribution of the exhaust gas turbine to the vehicle propulsion would hence be relevant; as can also be observed in
Table 7 and
Table 8, in the optimized system, maximum recovery mean effective pressures between 4.18 and 6.59 bar were determined, and the maximum power delivered by the exhaust gas turbine was calculated as being between 15.16 and 23.30 kW: once again, the higher values were obtained when the best-efficiency turbine (
ηT = 0.75) was considered. All these results confirm that, if adequately recovered, the unexpanded exhaust gas energy may constitute a relevant part of the whole propulsion energy, thus helping to reduce both vehicle fuel consumption and related emissions.
The comparison based only on the minimum specific fuel consumption of the system is not exhaustive and provides a limited representation of the real beneficial effects of the separated electric compound propulsion system. Considering that in a hybrid propulsion system, the thermal unit is dedicated to producing the power required for both the vehicle traction and battery charging, the two propulsive solutions should be compared on an equal output power basis. For this purpose, the authors evaluated the overall efficiency improvement of the compound system with respect to the reference turbocharged engine for the same power output and the same mean piston speed;
Figure 17 and
Figure 18 show the results obtained for the two extreme cases (
T4/T1 = 3.5,
ηT = 0.70 and
T4/T1 = 4.5,
ηT = 0.75). As can be seen, the major energetic benefits of the electric compound system are obtained in the high-load/speed regions; this can be easily explained considering that higher engine power implies higher in-cylinder pressures and exhaust mass flows: in these conditions, the turbine can provide a greater contribution to the overall output power of the system without compromising the engine’s indicated efficiency, leading to greater exhaust gas energy recovery.
At partial load, meanwhile, the recovery of the exhaust gas energy may not be energetically convenient; in these conditions, differing from a traditional turbocharged engine endowed with a waste-gate valve, the compound system can theoretically decrease the exhaust pressure down to the ambient pressure through an appropriate control in the turbine generator system. In greater detail, the efficiency improved by between 3% and 7% for the minimum power levels, reaching a maximum of about 12.5% in the case of
Figure 17 (
T4/T1 = 3.5,
ηT = 0.70) and 15.5% in
Figure 18 (
T4/T1 = 4.5,
ηT = 0.75) for the maximum power output levels. As can be expected, the best efficiency improvements were obtained with better turbine efficiency (
ηT = 0.75) and a higher temperature ratio (
T4/T1 = 4.5). For this reason, a correct study and optimization of the whole compound engine should be carried out with the aim to maximize the energetic advantages. The authors consider the results obtained to be very encouraging, especially if it is noted that the effect of the increased exhaust back pressure was not accounted for in the evaluation of the gross indicated efficiency of the reference turbocharged engine.
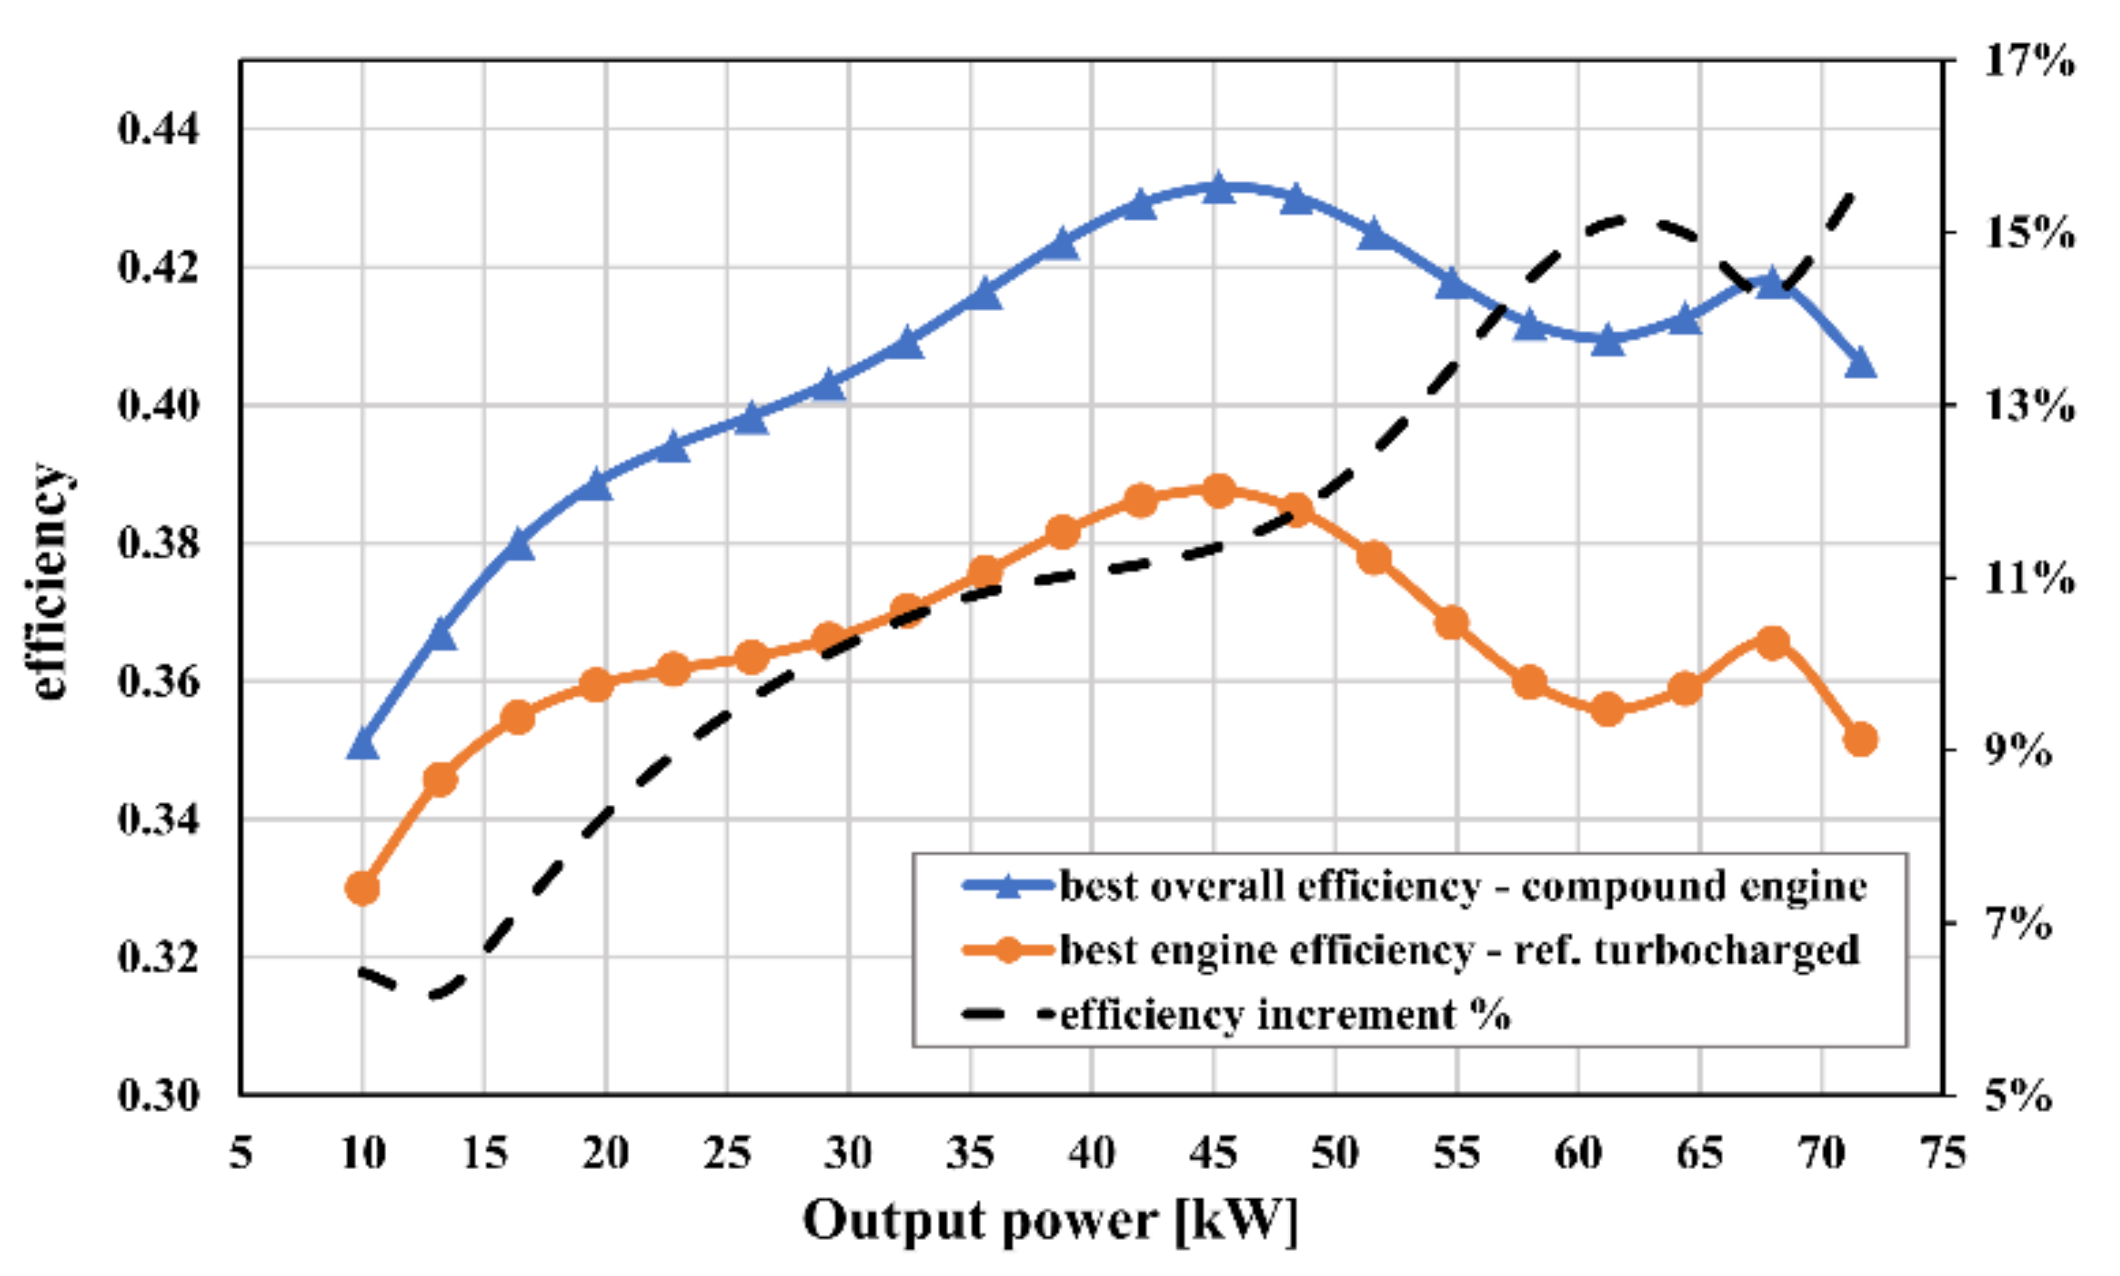
In a hybrid propulsion system, the operating point of the thermal unit is usually close to the best efficiency curve, i.e., the curve connecting the operating conditions which ensure, for each power request, the maximum efficiency; on account of this consideration, the authors carried out a further, and fairer, comparison, based on the best efficiency curves of both the compound engine and the reference turbocharged engine. For this purpose, for each power output, the authors evaluated the best operating conditions (i.e., with best efficiency) of load and speed, for each of the propulsive systems. The results of this further comparison are reported in
Figure 19 and
Figure 20 for the two extreme cases (
T4/T1 = 3.5;
ηT = 0.70) and (
T4/T1 = 4.5;
ηT = 0.75), respectively. As is shown, the best efficiency curves of the compound system are always higher than the respective curves of the reference turbocharged engine, with efficiency improvement up to 10.9% in the first case (
Figure 19) and up to 15.6% in the second case (
Figure 20). Aiming to obtain an average evaluation of the benefit connected with the adoption of the compound system in a hybrid architecture vehicle, from
Figure 19 and
Figure 20 it can be observed that the average efficiency increments, evaluated on the whole power range, are 6.1% in the case of
T4/T1 = 3.5 and
ηT = 0.70 and 11.2% in the case of
T4/T1 = 4.5 and
ηT = 0.75.
According to the result obtained by this comparison, it can be concluded that the compound system revealed good potential for fuel economy improvement and related emission savings in hybrid vehicles, and that it is worth the effort related to further and deeper investigations. The priority for future developments is certainly the turbine generator design, whose performance greatly influences the advantages obtainable from the whole compound system. In addition, further studies should concentrate on the optimization of thermal–electric machine interactions in order to obtain the maximum energetic advantage from the whole hybrid system.
5. Conclusions
This paper deals with the energetic advantages related to the adoption of a separated electric turbo-compound propulsion unit for CNG-powered hybrid vehicles. The proposed compound system is composed of a supercharged CNG-fueled spark ignition engine equipped with an exhaust gas turbine generator dedicated to the unexpanded gas energy recovery. The supercharger is powered by an electric motor only when necessary (i.e., for manifold pressure higher than 1 bar), while the turbine generator is always active, continuously recovering energy from the whole exhaust gas mass flow. The system is particularly suitable for electric hybrid vehicle architectures in which the electric energy produced by the turbine generator can be stored on the vehicle storage system and hence profitably employed for vehicle propulsion.
The benefits connected to the implementation of the compound unit were evaluated with respect to a traditional CNG-fueled turbocharged reference engine, from the perspective of hybrid applications; for this purpose, a simple model was implemented by the authors, mainly based on power and mass flow balances, sometimes integrated by experimental data. With the aim being to perform a fair and reasonable comparison, both the compound engine and the turbocharged reference engine were calculated starting from the same baseline naturally aspirated CNG engine. As described in the paper, the results obtained are influenced by a characteristic temperature ratio (T4/T1)—that is the ratio between the in-cylinder gas temperature when the exhaust valve opens (T4) and the in-cylinder gas temperature when the inlet valve closes (T1); this temperature ratio plays an important role, since it directly influences the temperature of the gas entering the turbine of both the turbocharged engine and the compound engine: it mainly depends on the particular engine and on the operating condition, and may assume values between 3.5 and 4.5. In order to provide the results with a general validity, three different values of this temperature ratio were considered in this paper, namely 3.5, 4.0 and 4.5. As also explained in the paper, the turbine considered for the compound engine substantially differs from common turbines employed for turbocharging purposes, with regards to both the high pressure ratios and the quasi steady operating conditions that characterize its application: for these reasons, with the aim being to ascertain the significance of the turbine efficiency in the compound engine performances, two plausible values were considered, i.e., ηT = 0.70 and ηT = 0.75. The effect of the exhaust back pressure increment on both the compound engine volumetric efficiency and the indicated efficiency was also taken into account: for each operating condition of the compound engine, the optimal exhaust pressure was hence determined by maximizing the compound system’s overall efficiency.
Compared to the turbocharged reference engine, the compound propulsion unit revealed a lower brake specific fuel consumption, with a reduction of between 6.33% and 12.32%, depending on the temperature ratio T4/T1 and on the turbine efficiency ηT. The contribution of the turbine generator to the overall power produced by the compound system revealed maximum shares between 24.2% and 42.9%, with a maximum power output of between 15.2 and 23.3 kW: these results confirm that, if adequately recovered, the unexpanded exhaust gas energy may constitute a relevant part of the whole propulsion energy, and may significantly contribute to lowering both the vehicle fuel consumption and related emissions.
Considering the application to hybrid vehicles, a second comparison was carried out on an equal output power basis: the separated electric compound engine revealed efficiency increments, with respect to the reference turbocharged engine, of up to 12.5% when the lower efficiency turbine was assumed (i.e., ηT = 0.70), and up to 15.5% with the higher efficiency turbine (i.e., ηT = 0.75.), and, as discussed in the paper, the advantage associated with the exhaust gas energy recovery grows with the engine output power.
Considering that in hybrid propulsion vehicles, the internal combustion engine is usually employed in operating conditions close to the best efficiency curve, the authors also carried out a further comparison based on the best efficiency curves of both the compound engine and the turbocharged engine. This last comparison revealed that the compound propulsion unit could allow average efficiency improvement (i.e., on the whole output power range) of between 6.1% and 11.2%, depending on the temperature ratio and the turbine efficiency, with maximum benefits of 15.6% in the best case (T4/T1 = 4.5; ηT = 0.75).
The best efficiency improvements were obtained in the high-load/speed engine regions, with temperatures at the turbine inlet between 800 and 1000 °C, and maximum exhaust back pressures between 3.4 and 4.4 bar: these are not common conditions for traditional turbines used for turbocharging, and hence a dedicated study would be necessary for the development of the turbine generator, which could be represented by a multi-stage radial-axial turbine. Given the sensitivity of the overall efficiency of the compound system to the temperature ratio T4/T1 and to the turbine efficiency ηT, it follows that the best results can only be reached through an optimized design of the entire separated electric turbo-compound engine.


