1. Introduction
The diesel engine has always played a central role in the energy and transportation sectors. However, in recent years, a number of limitations related to exhaust emissions have made it the subject of debate. Indeed, diesel engine reliability and low consumption have led the academic and industrial world to offer alternatives with new fuel blends as well as innovative injection and combustion techniques to comply with current emission regulations. The dual fuel diesel engine still represents a valid alternative to the traditional engine, especially for the reduction of carbon dioxide. Nonetheless, a typical drawback of this new strategy is the employment of a fuel for which the engine setup is not optimized. Therefore, a deep investigation is needed to outline the processes that characterize the conversion of the chemical energy of a fuel source into mechanical work.
In this work, the authors, who have already been involved in the study of dual fuel for several years [
1,
2,
3,
4,
5,
6,
7,
8], present a computational fluid dynamics (CFD) application to investigate the phenomenon of combustion of the two fuels used in dual fuel engines (diesel and natural gas/methane). In a dual fuel engine, diesel fuel is injected in minimal quantities to facilitate the ignition of the mixture in the cylinder consisting of air and natural gas that have been premixed in the intake duct.
The formation of numerous flame nuclei scattered in the combustion chamber leads to a complex ignition phenomenon that is difficult to characterize. A proper experimental activity supported by three-dimensional modelling can make an interpretation of the phenomenon possible. The purpose of this CFD study is in fact to prove the transferability of the experimental results to real diesel engines operating in dual fuel mode and to obtain more detailed information on the phenomena characterizing the dual fuel combustion.
Interest in this topic is demonstrated by the presence of many researchers in the scientific literature who have been studying the dual fuel engine to deepen knowledge of the combustion phenomenon and look for suitable injection strategies and methane rates, making use of numerical methodologies and advanced schemes of chemical kinetics.
The authors in [
9,
10,
11] developed a multi-zone model to predict the combustion process with a detailed kinetic scheme that describes the partial oxidation of the gaseous fuel during the compression and the expansion processes. They also addressed the study of the processes that occur during the ignition delay since the introduction of the mixture reduces the presence of oxygen in the cylinder, reducing the temperature and delaying the combustion compared to a traditional diesel engine.
The evaluation of emissions whose reduction represents the primary target of this technology is very important [
12,
13], as emphasized at the beginning and shown in the next sections.
In particular, in [
12], the authors analyzed the performance and the emissions in steady state condition, improving the combustion and referring to the New European Driving Cycle.
The pilot diesel fuel quantity and the pilot injection timing in dual fuel mode, influences highly the evolution of combustion and pollutant formation, as described in [
14], where the resulting carbon monoxide (CO) emission levels were higher than those under normal diesel operation modes that were also at high load. On the other hand, the nitrogen oxide (NO
x) emissions decrease by 30% due to a major part of the fuel being burned under lean premixed conditions with a lower local temperature.
The authors of [
3] investigated the injection timing as well, emphasizing the influence on the combustion development as well as on the total hydrocarbons (THC) and the production of NO
x fractions and the reduction of carbon dioxide (CO
2).
In paper [
15], Mancaruso et al. showed that dual-fuel combustion reduces the number of soot particles, and the size is dependent on the combustion evolution. The diameter of the particles is higher with respect to conventional diesel operation at low speed, while at high speed, there is a high formation of particles of a smaller size. Another critical operating condition of a dual fuel engine is the part load, as demonstrated by the authors themselves in [
2] and by others in [
16,
17]. An increase in pollutants can be due to a low penetration of the diesel liquid droplets that evaporate late; this problem could be overcome by increasing the quantity of diesel fuel, as demonstrated in [
18].
As previously mentioned, CFD simulation is an important tool for the development and optimization of dual fuel engines. Through CFD, numerous tests can be performed to simulate a wide range of engine loads, variation the injection timing, and the amount of natural gas. Efficient calculation models capable of reproducing experimental cases and anticipating new combustion strategies are therefore necessary. An appropriate chemical scheme has to be implemented for an accurate description of the combustion process. In [
18], Hockett et al. presented a chemical kinetic mechanism that consisted of 141 species and 709 reactions in order to simulate the combustion of both fuels (n-heptane and natural gas), while a simpler mechanism of 42 species and 57 reactions is shown in [
19].
In recent papers [
7,
8], CFD results are achieved by using a new kinetic scheme by adding 5 new species and 9 reactions for the autoignition of methane with the KIVA-3V solver for a three-dimensional domain to the ‘one step’ model.
Since the authors have already investigated different operating conditions by varying the load level, the start of injection, and the amount of methane introduced to the cylinder [
2,
3,
6], this work is mainly focused on the effect of engine speed on dual fuel combustion development. Results showed that increasing the rotational speed can exert a relevant influence on a number of time-dependent processes such as liquid fuel injection and atomization, the mixing of reactant species, and chemical kinetics; therefore, a proper choice in the injection setting can help to achieve ignition in each zone of the combustion chamber. In this way, it is possible to obtain an efficient use of the chemical and energetic contents of the fuel, with a consequent reduction of the emissions of unburned hydrocarbons in the exhaust.
Such effects are analyzed via a CFD based approach aiming at the comparison between two different engine regimes. Furthermore, an experimental validation is also attained through the comparison of numerical results with experimental tests conducted on a single-cylinder research engine.
2. CFD Methodology
As stated above, the computational activities described in this work were conducted with the purpose of analyzing the effect of rotational speed on the phenomena that characterize dual fuel combustion. This objective is pursued by means of a well-established methodology that was defined in previous work conducted by multiple authors that is briefly recalled in the following paragraphs.
The models used for these calculations have already proven to be suitable for the prediction of dual fuel operating conditions [
7,
8] in terms of pressure, combustion timing, and especially methane ignition. In addition, in this work, the availability of in-cylinder visualizations can represent an important validation tool for the assessment of the reliability of these models and for the description of 3D species distributions.
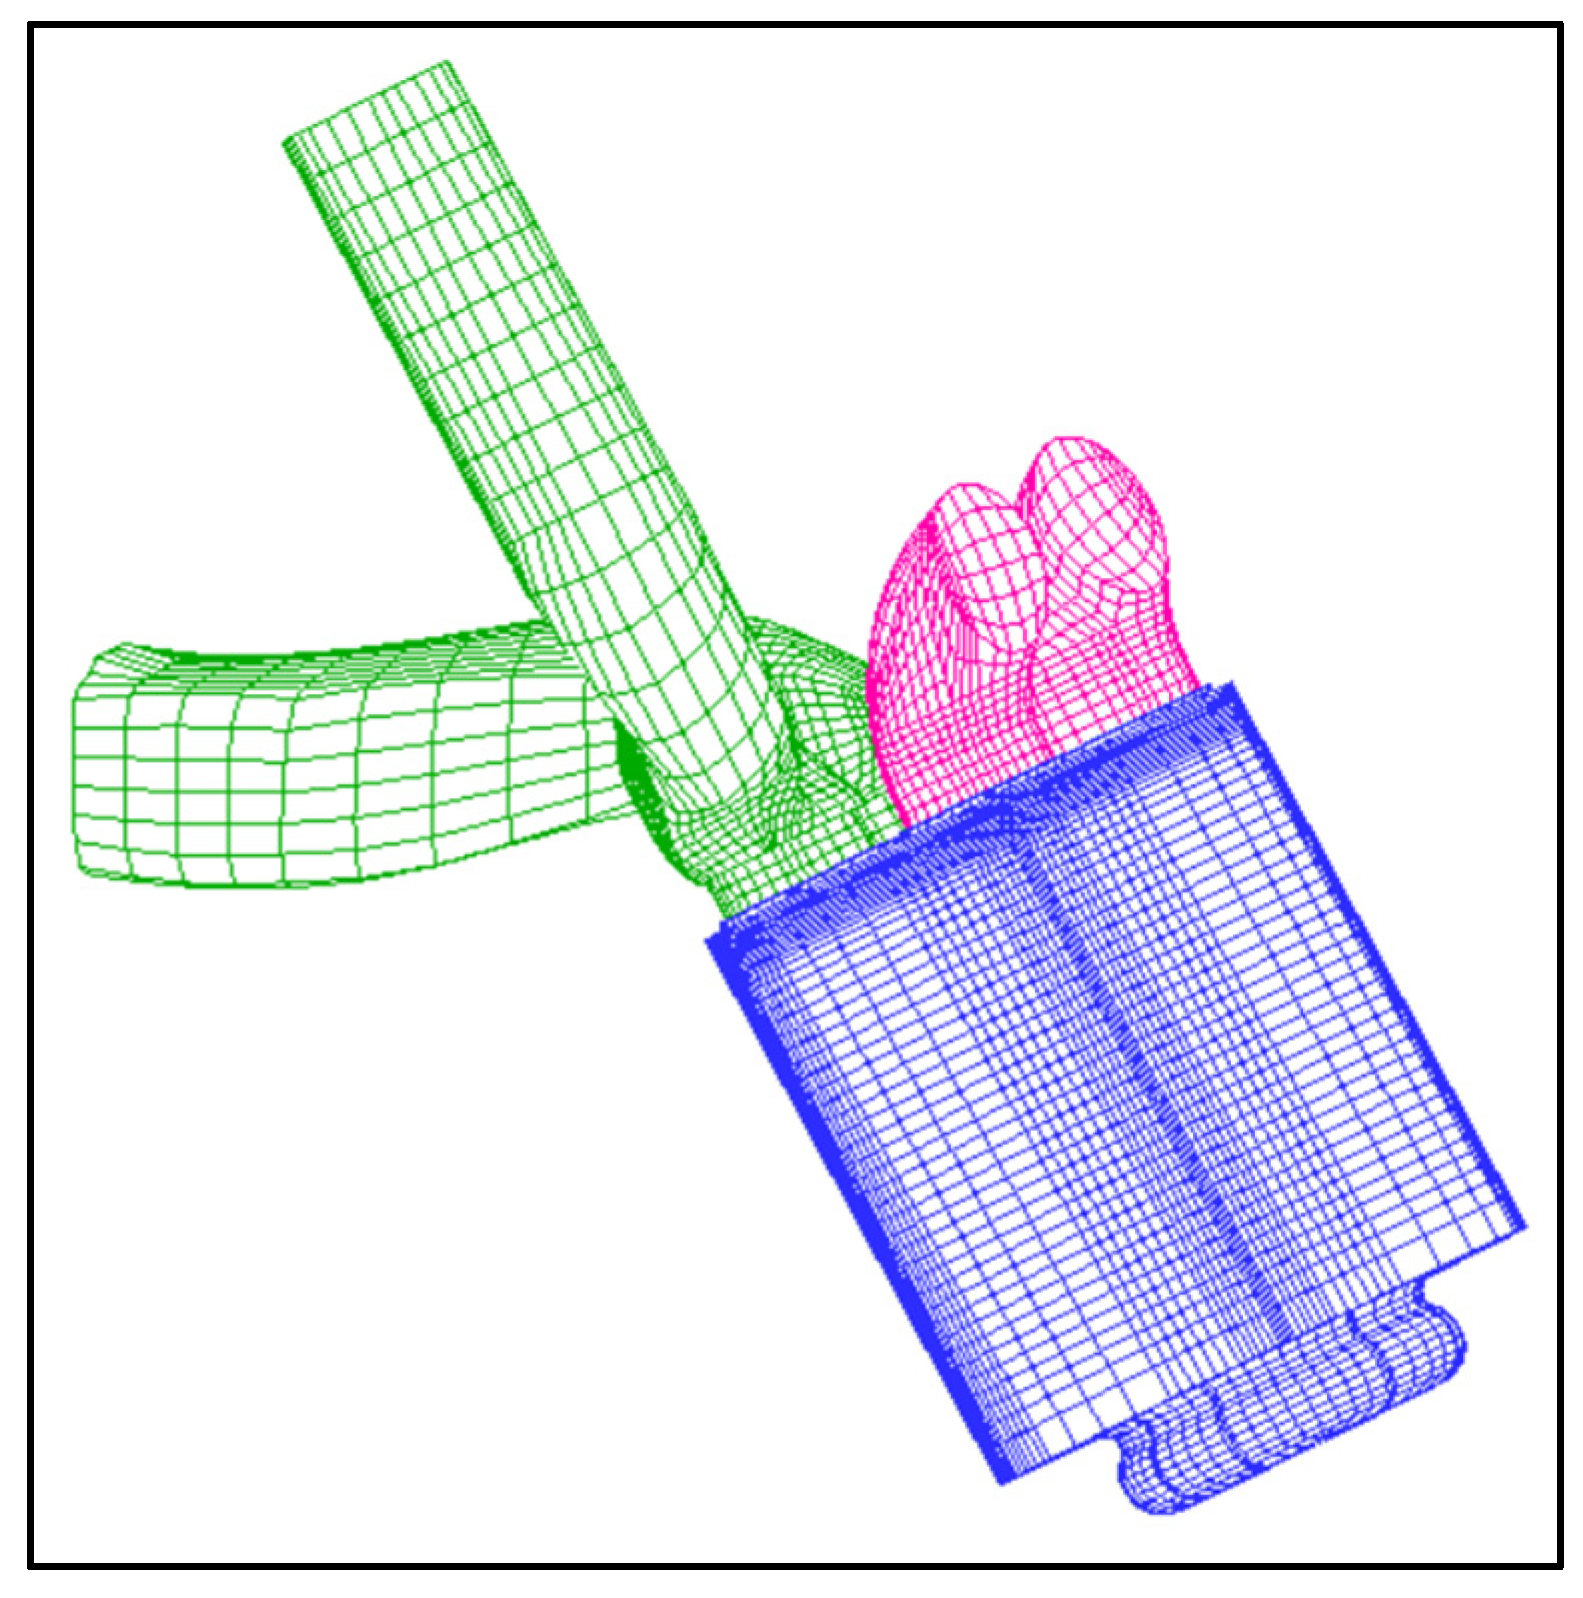
Simulations are performed with the KIVA-3V code [
20] on a computational domain consisting of the in-cylinder volume, the external ducts, and the valve lift laws, as illustrated in
Figure 1. It is important to mention that the geometry of the CFD domain is similar but not identical to the one of the single-cylinder research engine employed for the experiments. The dimensions of the computed engine are reported in
Table 1. As a matter of fact, the main difference between the two engines (real and simulated) is the bowl shape. The domain used for the numerical calculations is derived from a commercial six-cylinder engine; therefore, this methodology can allow the extension of the experimental results to practical applications. Hence, while the simulated engine is in the shape of a classic Mexican hat bowl, the research optical engine has a flat bowl shape due to the presence of the sapphire window.
The presence of the gas exchange phase resulting from the open valve periods requires the calculation of multiple engine cycles to achieve the numerical convergence to the periodic regime and longer computational time. On the other hand, it allows for the correct estimation of (I) the turbulence flow field, (II) the homogenous charge formation, (III) the volumetric efficiency, and (IV) the amount of residual gases in the cylinder.
The multi-block structured Cartesian mesh was obtained by using the ICEM meshing tool. The cylinder and bowl volume discretization are composed of nearly 58,000 and 5000 cells, respectively.
The kinetic mechanism consists of 18 species (
Table 2) and 12 reactions (
Table 3). Dodecane (C
12H
26) is used as a diesel oil surrogate, and its oxidation is represented by a one-step reaction (RR1). The natural gas composition is assumed to be 100% methane, the oxidation of which occurs following two parallel paths represented by low temperature reactions (from RR3 to RR11 in
Table 3) and the traction of the RR12 activated below and above the threshold value of 1300 K, respectively. In both cases, oxidation is completed through the reaction of RR2.
It is important to highlight that the group of 9 reactions from RR3 to RR11 is a part of the mechanism presented by Li and Williams [
21], which consists of 127 reactions and 31 species. It is capable of predicting methane ignition in dual fuel conditions for temperatures between 1000 K and 2000 K, pressures between 1 bar and 150 bar, and equivalence ratios between 0.4 and 3. However, below 1300 K, only the 9 reactions listed can be considered enabled. Moreover, while the temperature and pressure ranges of this mechanism are compatible with those of a high compression ratio diesel engine, the methane–air equivalence ratio can fall outside the validity limits of the model at engine part loads. However, earlier diesel fuel combustion can increase the local equivalence ratio by consuming the oxygen inside the cylinder.
As already stated, computations aim at providing a more comprehensive interpretation of the tests and completing the experimental information. To this purpose, a kinetic mechanism including important species such as the OH radical is necessary to assess how they can affect the overall oxidation process. In this regard, trends and distributions of the OH radical produced by the experimental activity has been an important validation tool for numerical models. In fact, this species represents a significant signal of combustion activity since its formation occurs in the areas characterized by a high level of combustion intensity.
In addition, the well-established set of reactions for the prediction of NO
x formation introduced by Zel’dovich [
22] and six equilibrium reactions (
Table 4) are elaborated in the CFD code.
The low equivalence ratios of the test cases that locate the mixture outside the flammability limits prevent an efficient flame propagation and then lead to a combustion model with reactions through a turbulent kinetic interaction, such as the Finite Rate–Eddy Dissipation (FRED) model, for the description of the combustion process.
The Finite Rate–Eddy Dissipation model compares the kinetic with the turbulent reaction rate, and only the smallest one is chosen as the governing factor of combustion. In the KIVA-3V code, the kinetic constant is calculated via the Arrhenius correlation as follows:
where
A is the pre-exponential factor,
n is temperature exponent, and
Ta is the activation temperature. The related values are provided by Li and Williams as shown in
Table 5.
Alongside this, the turbulent reaction rate is expressed according to the Magnussen and Hjertager correlation [
23]:
where
and
are the mass fractions of fuel and oxygen,
the turbulent kinetic energy,
the turbulent dissipation rate, and
is the proportional factor that depends on both the flow conditions and the fuel composition. However, due to the premixing of the methane with air, for the reactions from 3 to 12 in
Table 3, only the kinetic rate is considered. Consequently, the methane ignition time delay, which is based on a chain of kinetic equations, may result in different angular intervals depending on engine rotational speed. On the other hand, the turbulent governed combustion processes (Equation (2)) are strictly dependent on the specific dissipation rate,
. As such, the different engine regimes could imply changes in the characteristic times of RR1 and RR2 reactions.
Clearly, diesel vapour ignition, and, consequently, methane ignition are influenced by the liquid spray distribution and the atomization of the diesel droplets that are responsible for the flame cores. The breakup of the fuel jet was simulated through the WAVE since this model has demonstrated in previous works [
3,
24] to be reliable for the simulation of this process.
3. Numerical Test Cases
Based on the available experimental data discussed in the next sections, numerical tests were performed at two engine speeds, 1500 and 2000 rpm. The experiments were selected to evaluate the influence of methane presence on the combustion characteristics of an automotive diesel engine operating in dual fuel mode. The methane contribution is defined in terms of energy supply ratio of methane to total energy. It corresponds to the premixing level (Premixed Ratio—
RP) quantified according to the following relationship:
where
mp and
md are premixed (methane) and directly injected (diesel) fuels mass flow rates, respectively, whereas
and
are the lower heating values of the methane and diesel fuels. Hence, the premixed ratio equal to zero represents normal diesel operation and an
RP greater than zero represents dual fuel operation.
The engine operating data used in this work for the calculations and the related boundary conditions are listed in
Table 6. It is worth noting that for each test case, the operating conditions are significantly far from the usual load levels of a diesel engine, as demonstrated by the low values of thermal power and indicated mean effective pressure (IMEP).
In previous works [
6,
8], the case of
RP = 22% at 1500 rpm was widely investigated. Results demonstrated that the numerical models were fully capable of reproducing the experimentally detected phenomena and adding important information to the knowledge of methane ignition. Therefore, a second case with the same premixed ratio (22%) but at 2000 rpm was performed in order to investigate the effects of the engine speed on combustion. Moreover, a third case at 2000 rpm and with a reduced premixed ratio (18%) was compared with the second one to test the sensitivity of the Li and Williams mechanism with different methane/air equivalence ratios. For all of the investigated strategies, the same amount of diesel fuel was injected by means of a single main injection that had the same duration and injection pressure but a different start in order to compensate for the effect of the changes in engine speed.
Methane was injected at 5 bar in the intake manifold with both the intake and exhaust valves closed. This means that the premixed ratio of the intake charge depended solely on the amount of the injected methane. From the values of them measured air and fuel masses during the experiments, it was possible to obtain the mass fraction of methane, since in the KIVA code, this parameter is required to set the inflow from the intake ducts. The mixture composition inside the cylinder was calculated by the code itself thanks to the presence of the gas exchange phase. Boundary conditions at open boundaries, such as pressure and temperature, allowed for the calculation of mass and energy flows for the next computational cycles.
3.1. Case#1: RP = 22% 1500 vs. 2000 rpm
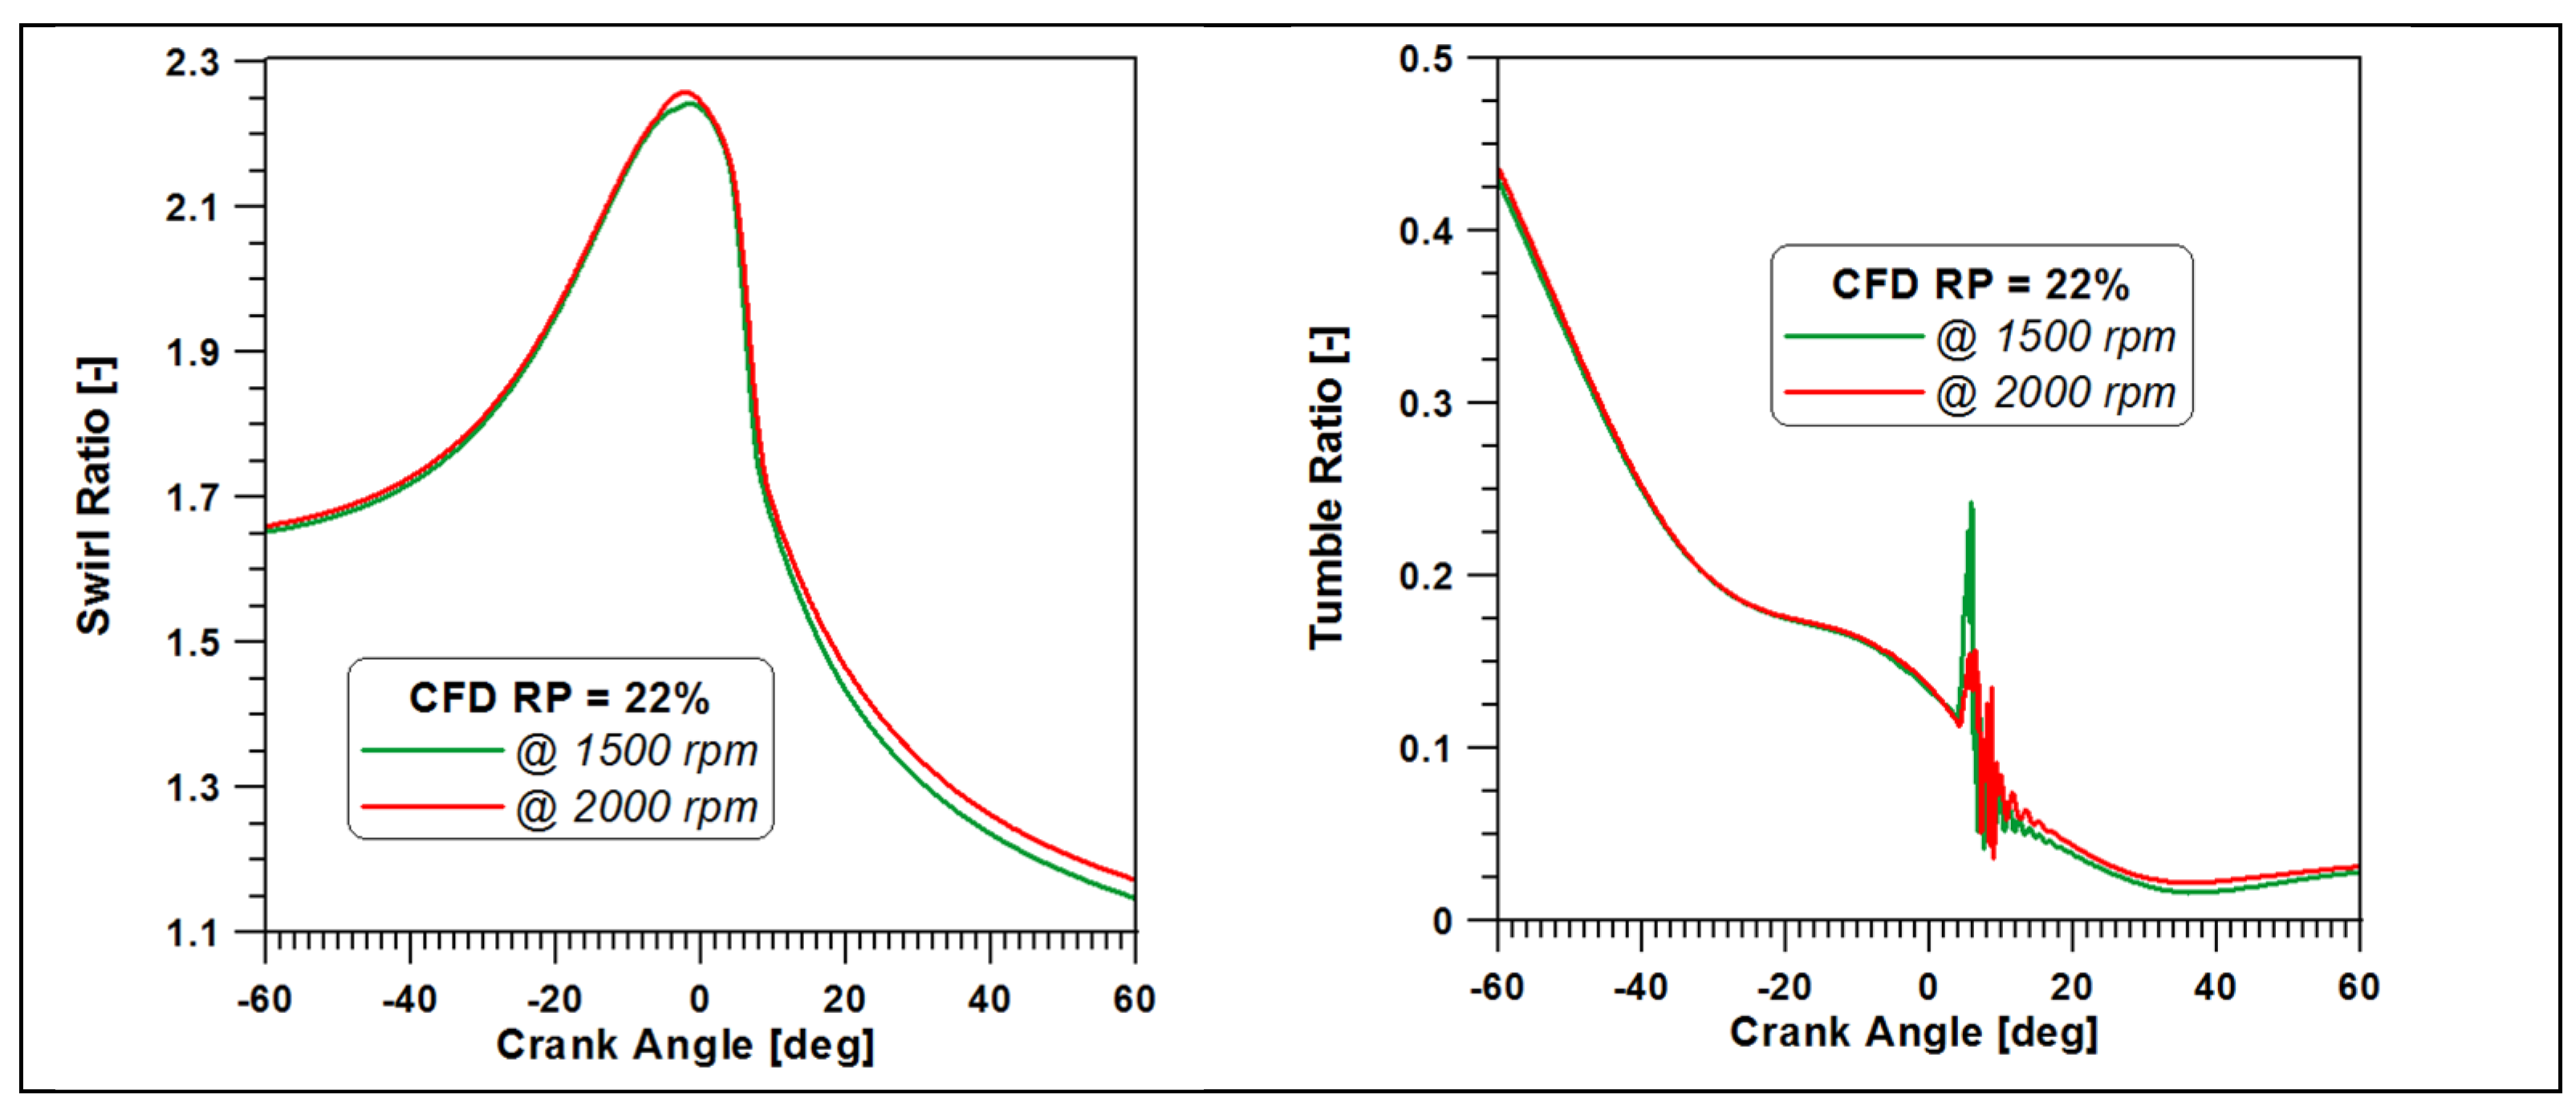
The two cases that are analyzed in this section are characterized by the same relative amount of methane introduced into the intake manifold, which means the same premixed ratio (22%) and difference in the engine speed of 1500 and 2000 rpm, respectively. As anticipated, the engine speed variation induced changes in the interaction between chemistry and in-cylinder fluid-dynamics. In particular,
Figure 2 shows that swirl and tumble ratios were substantially unchanged, and this means that the real swirl and tumble intensities increased by a 1.33 times at 2000 rpm. Similarly, the specific dissipation rate that strongly affects the turbulence = chemistry interaction appears to be higher in the crank angle interval close to the top dead center in the 2000 rpm case (
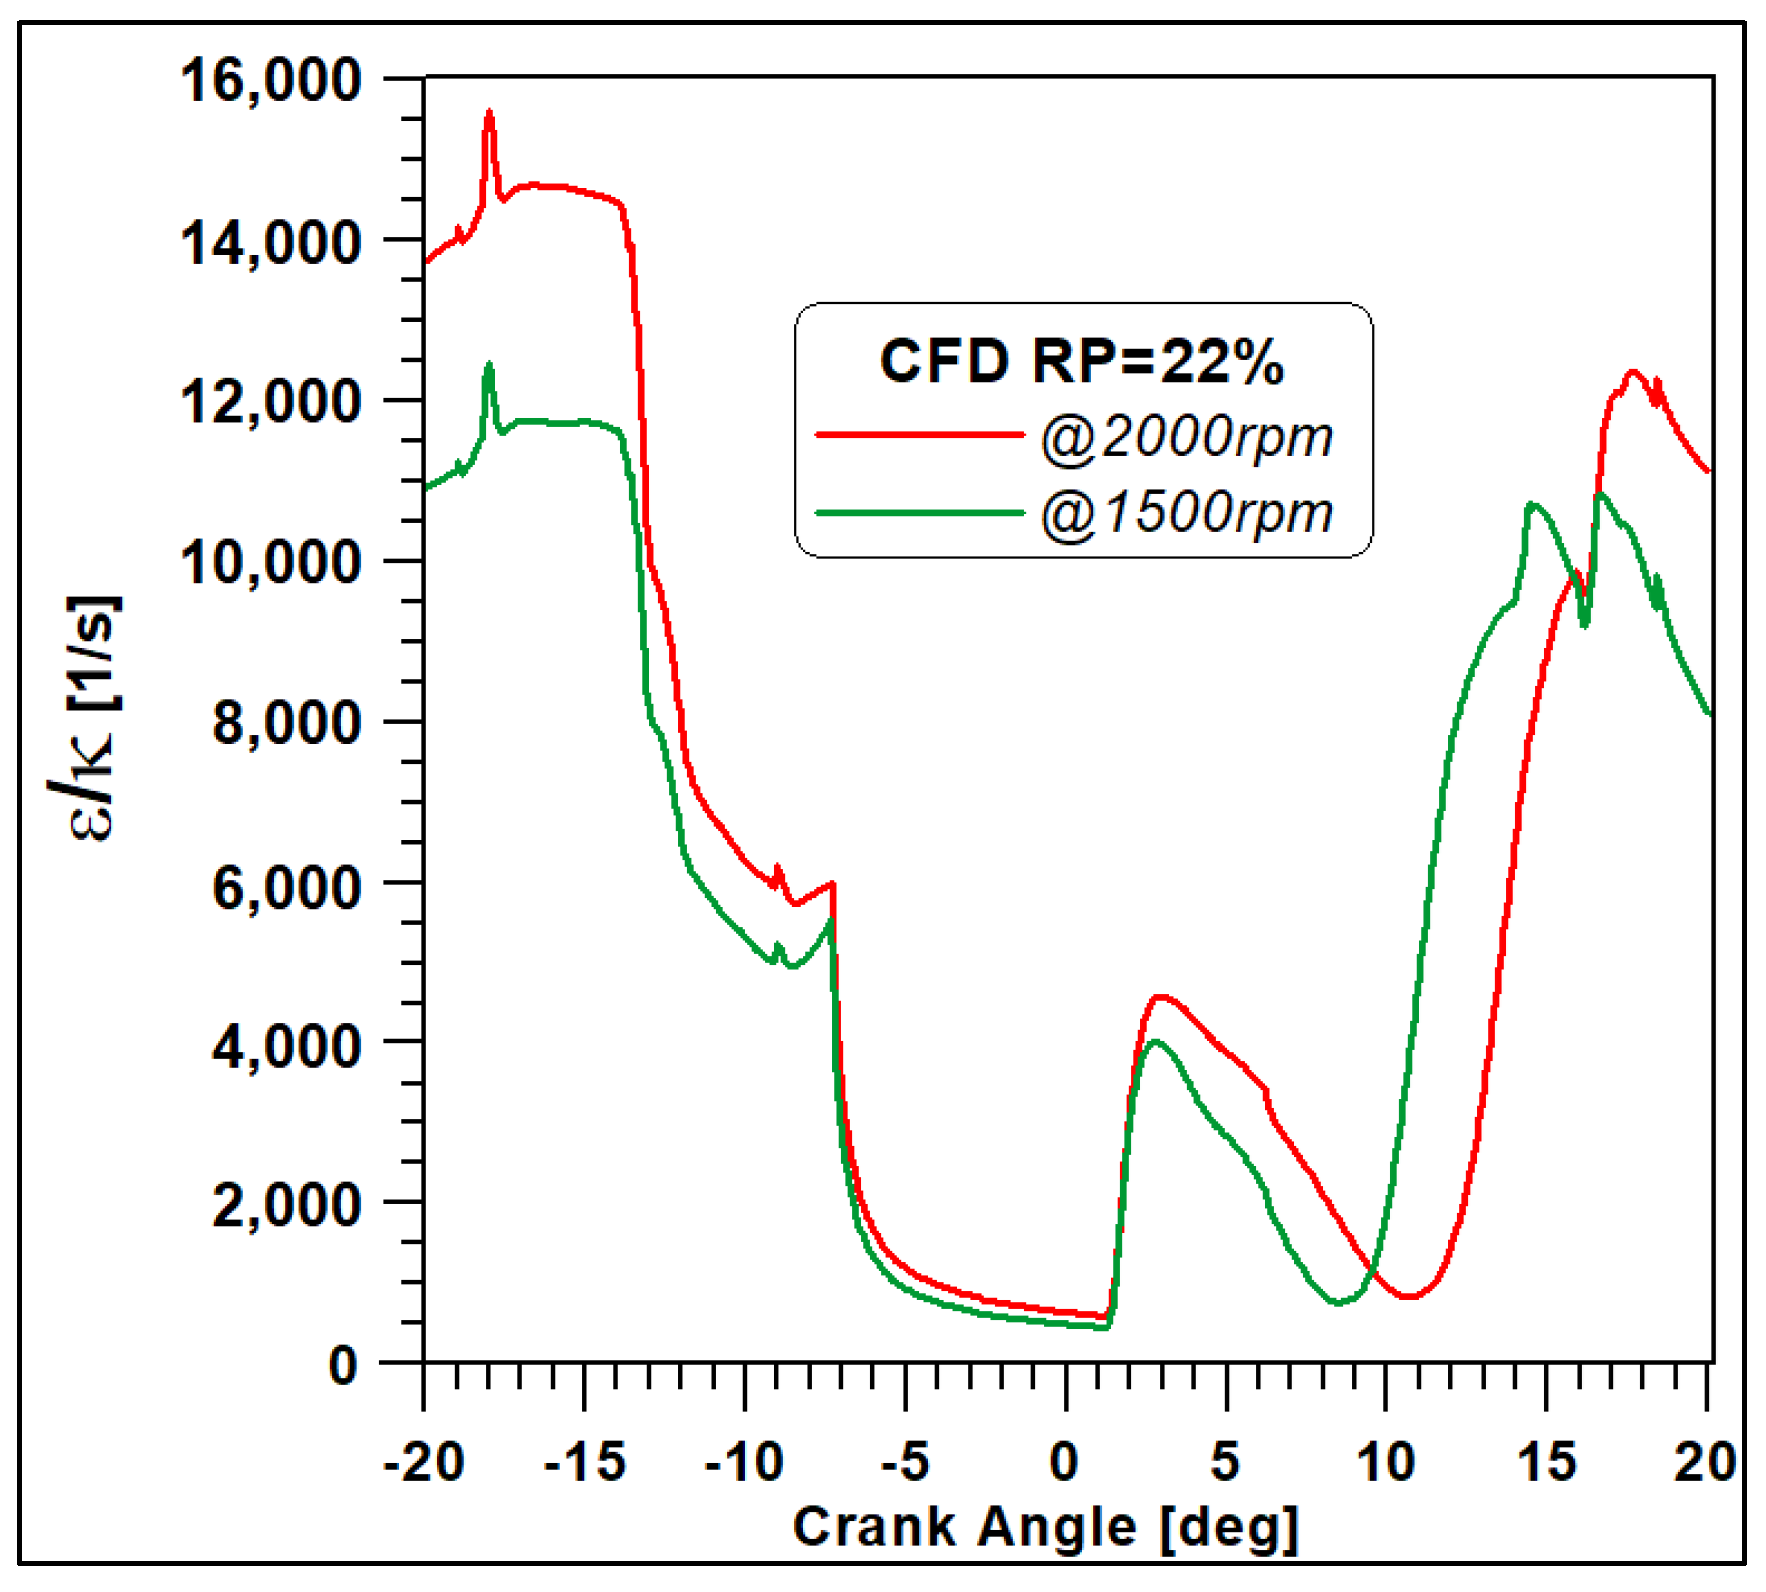
Figure 3). Consequently, an acceleration in both reactant mixing rate and the early phases of combustion can be expected.
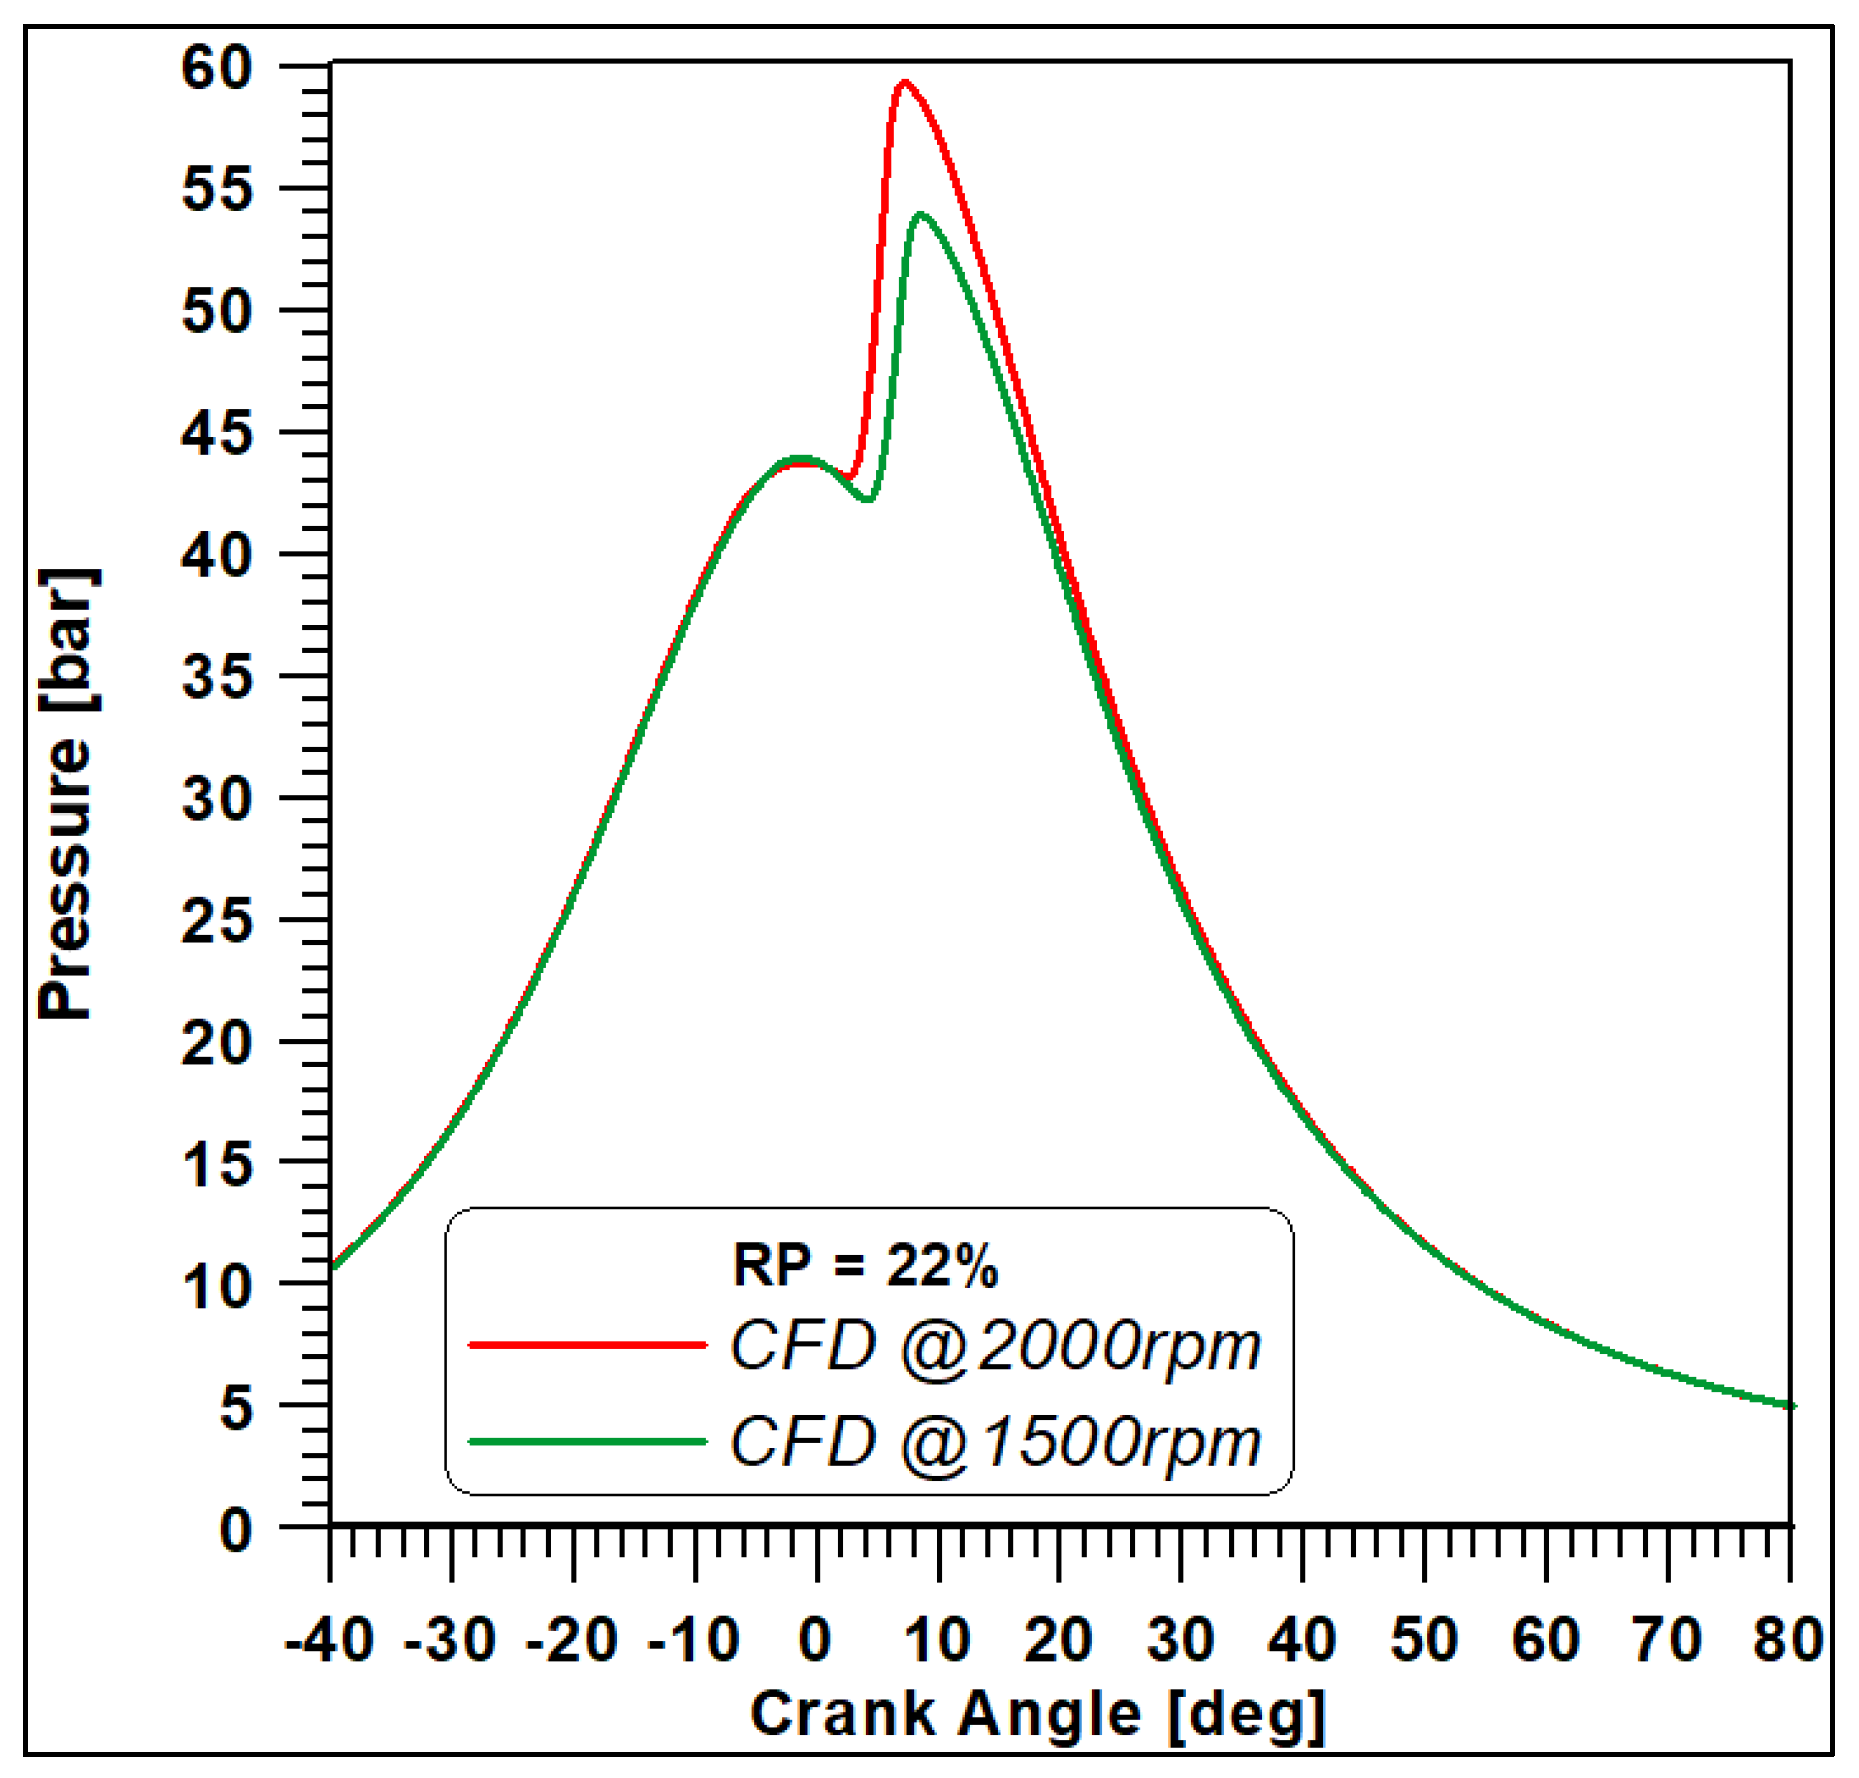
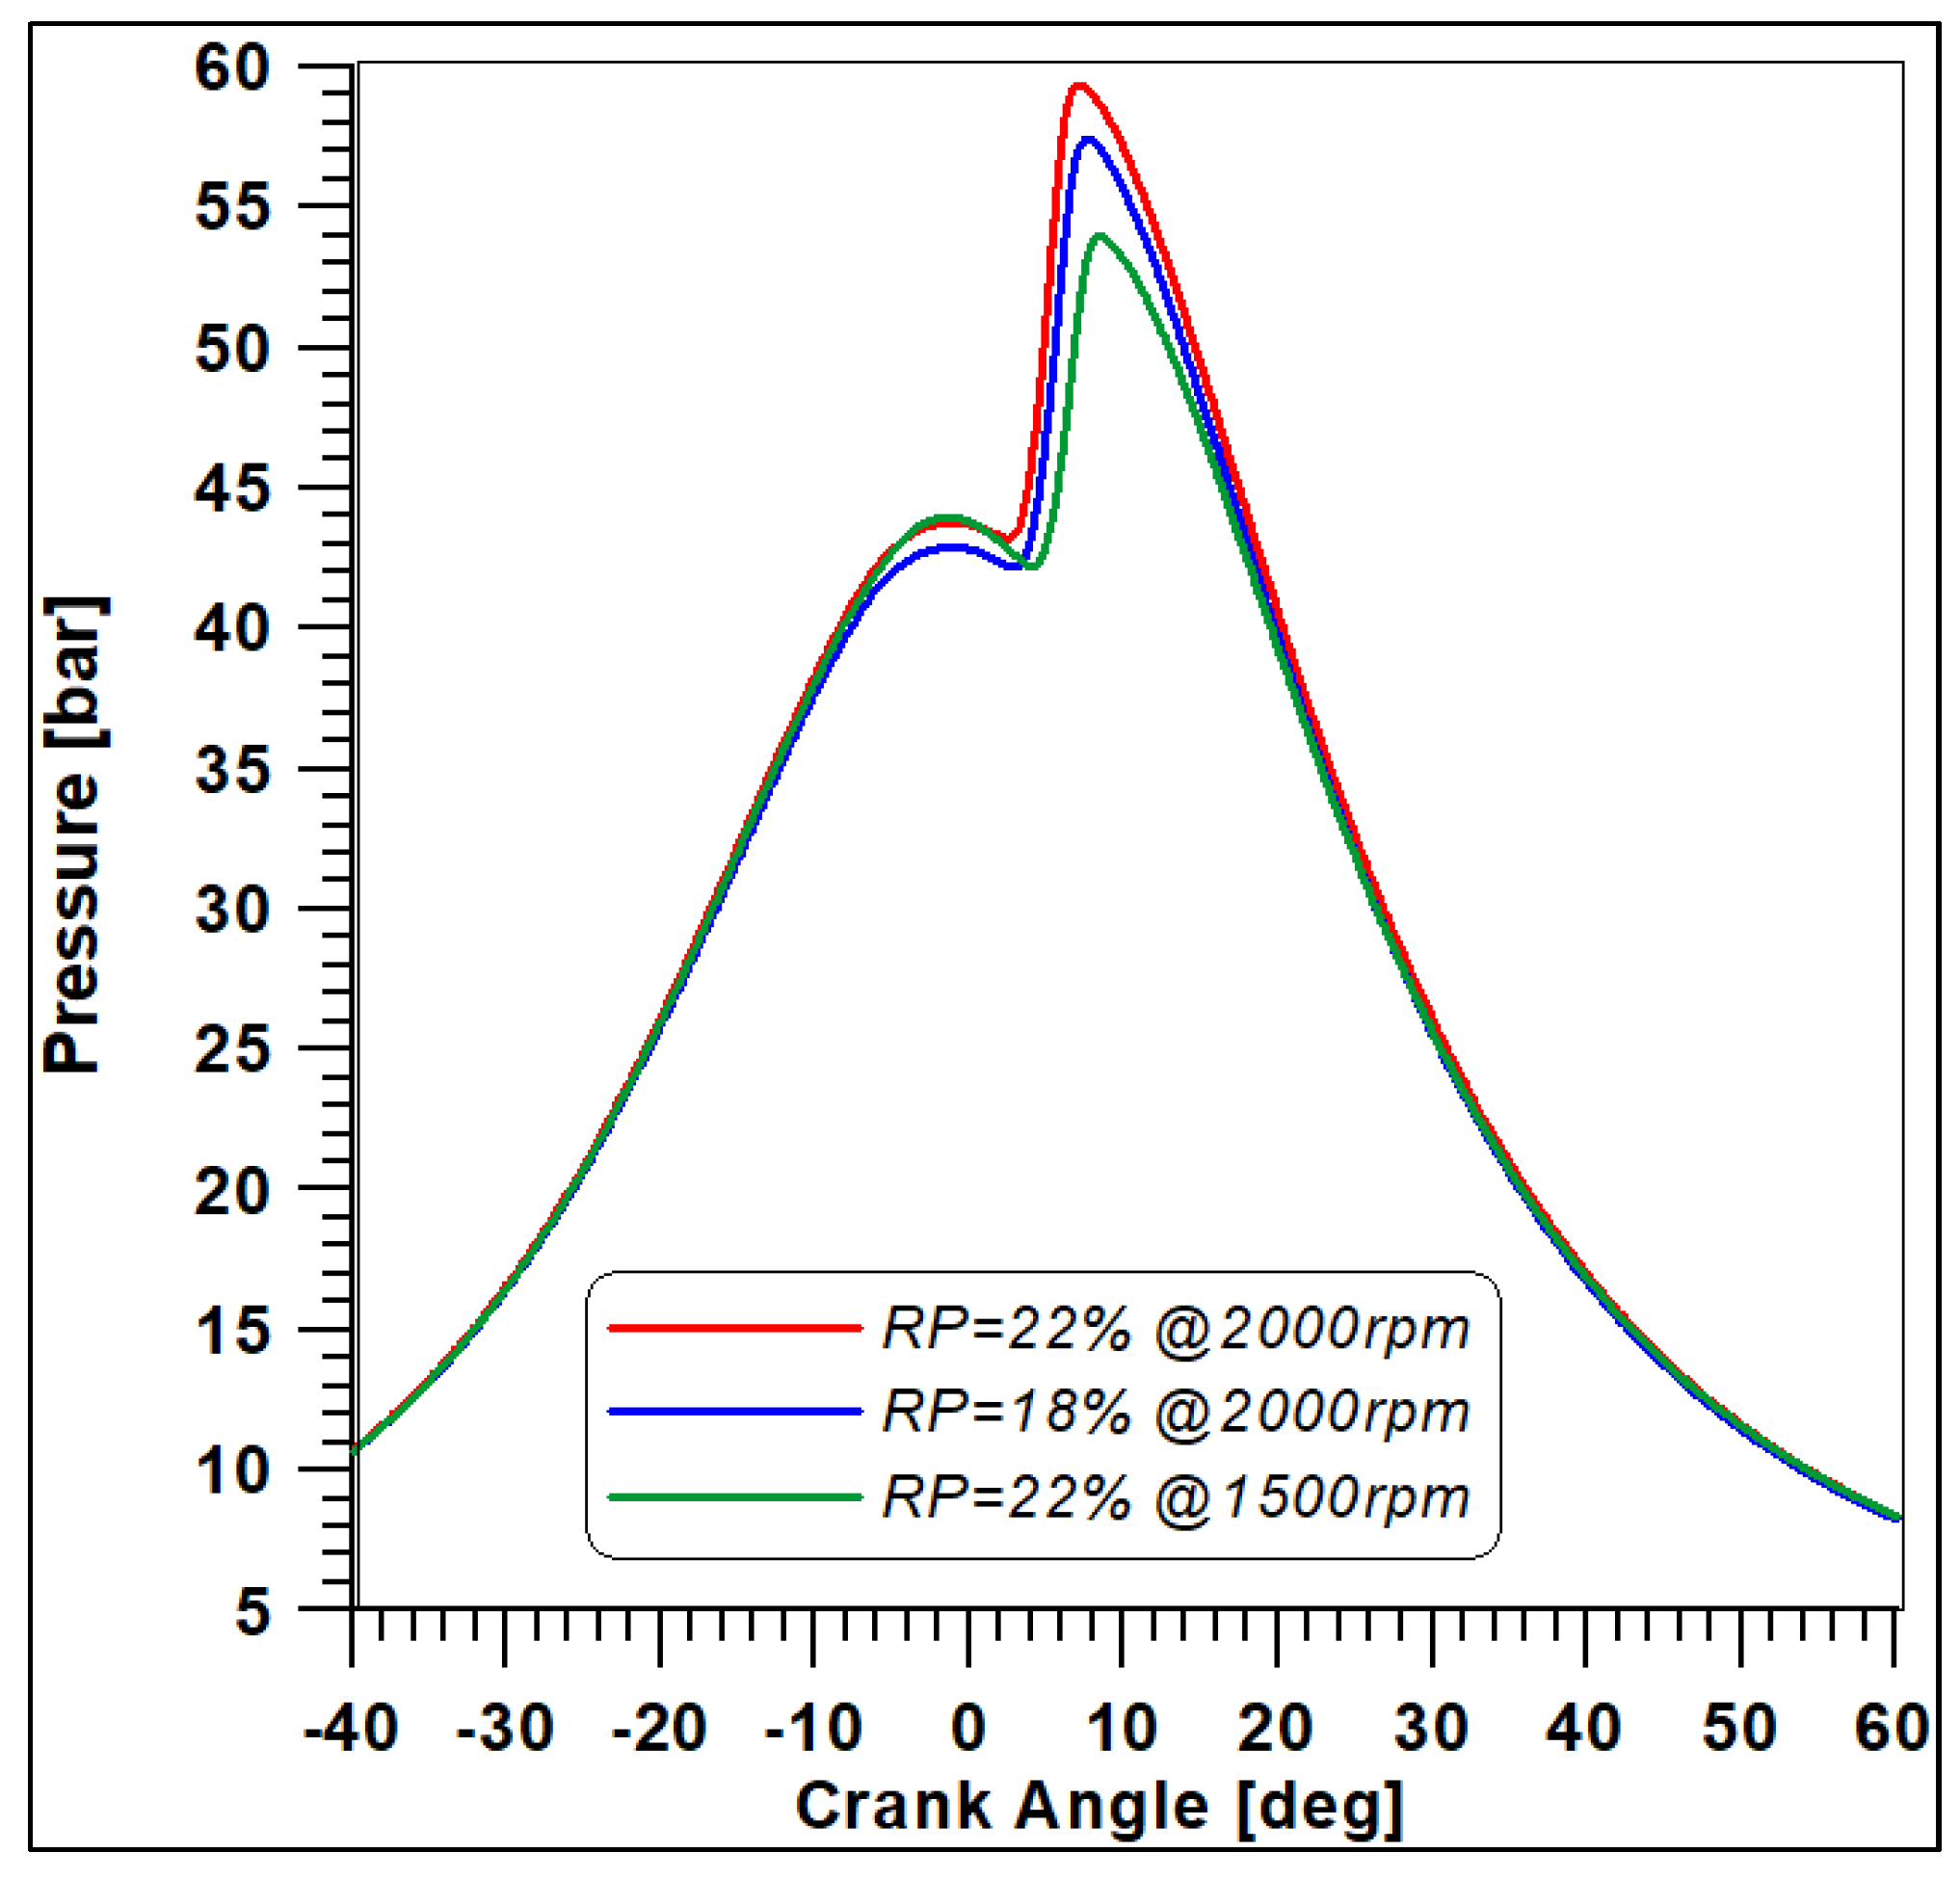
In
Figure 4, the comparison of numerical pressures calculated in the two cases highlights that, as expected, the increase of the engine speed and injection advance causes an increase in the peak pressure.
Indeed, in order to ensure sufficient time for the completion of the kinetic reactions, the start of the diesel oil injection was advanced in the case with higher engine speed. In addition, the injection start (SOI) values of the liquid fuel reported in
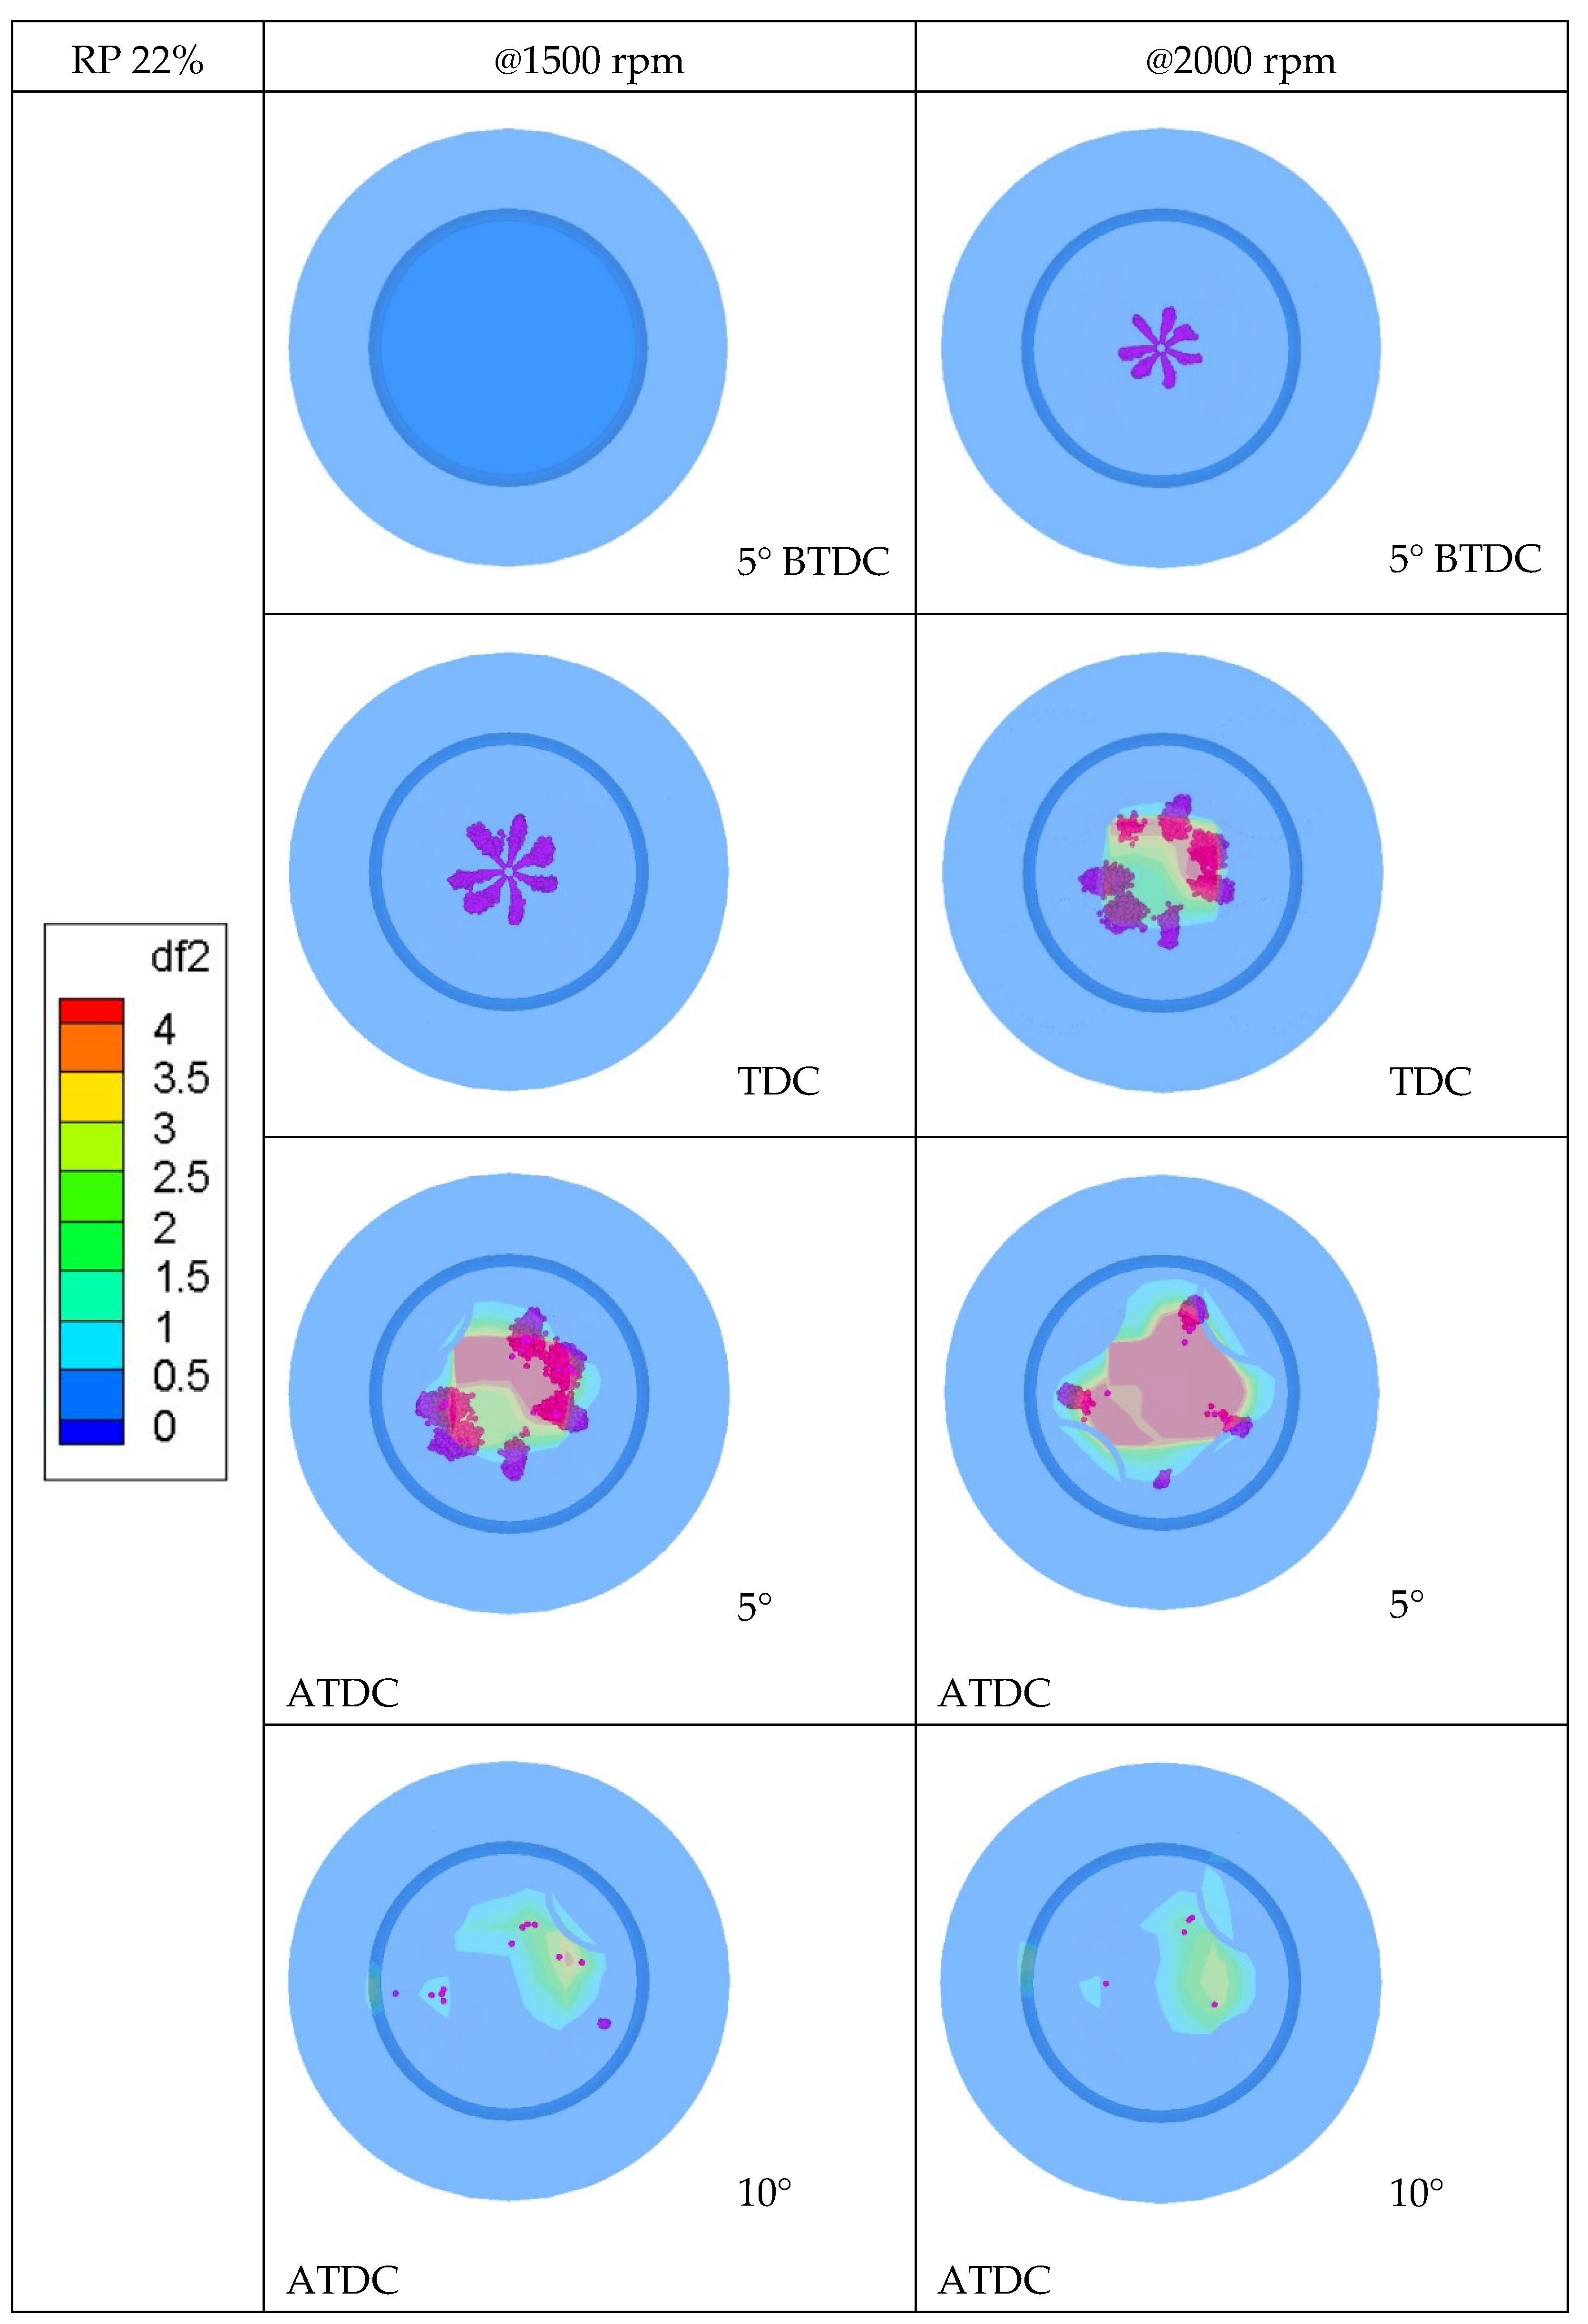
Table 5 refer to the current signal provided by the experimental activity. As a matter of fact, it is important to mention that a delay of 300 µs is detected between the current signal and the actual opening of the injector. Hence, the actual SOI are 3.3 BTDC and 6.4 BTDC. This means that they are shifted by 2.7 deg and 3.6 deg at 1500 and 2000 rpm, respectively. The evolution of a multiphase flow pattern is displayed in
Figure 5; in both cases, it is possible to observe the spreading of the seven liquid jets, and the progressive decrease of droplet presence with the corresponding enlargement of the regions with vaporized fuel.
Clearly, a different start of injection implies a different correspondence of time at each crank angle. However, at 10 crank angle degree after top dead center (ATDC), almost the same amount of time had passed since the injection start (≈1.37 ms at 2000 rpm against ≈1.48 ms at 1500 rpm), and in both cases, an almost complete vaporization of liquid particles was achieved, and the diesel vapour distributions involved the same areas. This confirms that engine speed affects the swirl motion intensity and, consequently, a faster atomization, vaporization, and diesel vapour consumption are obtained.
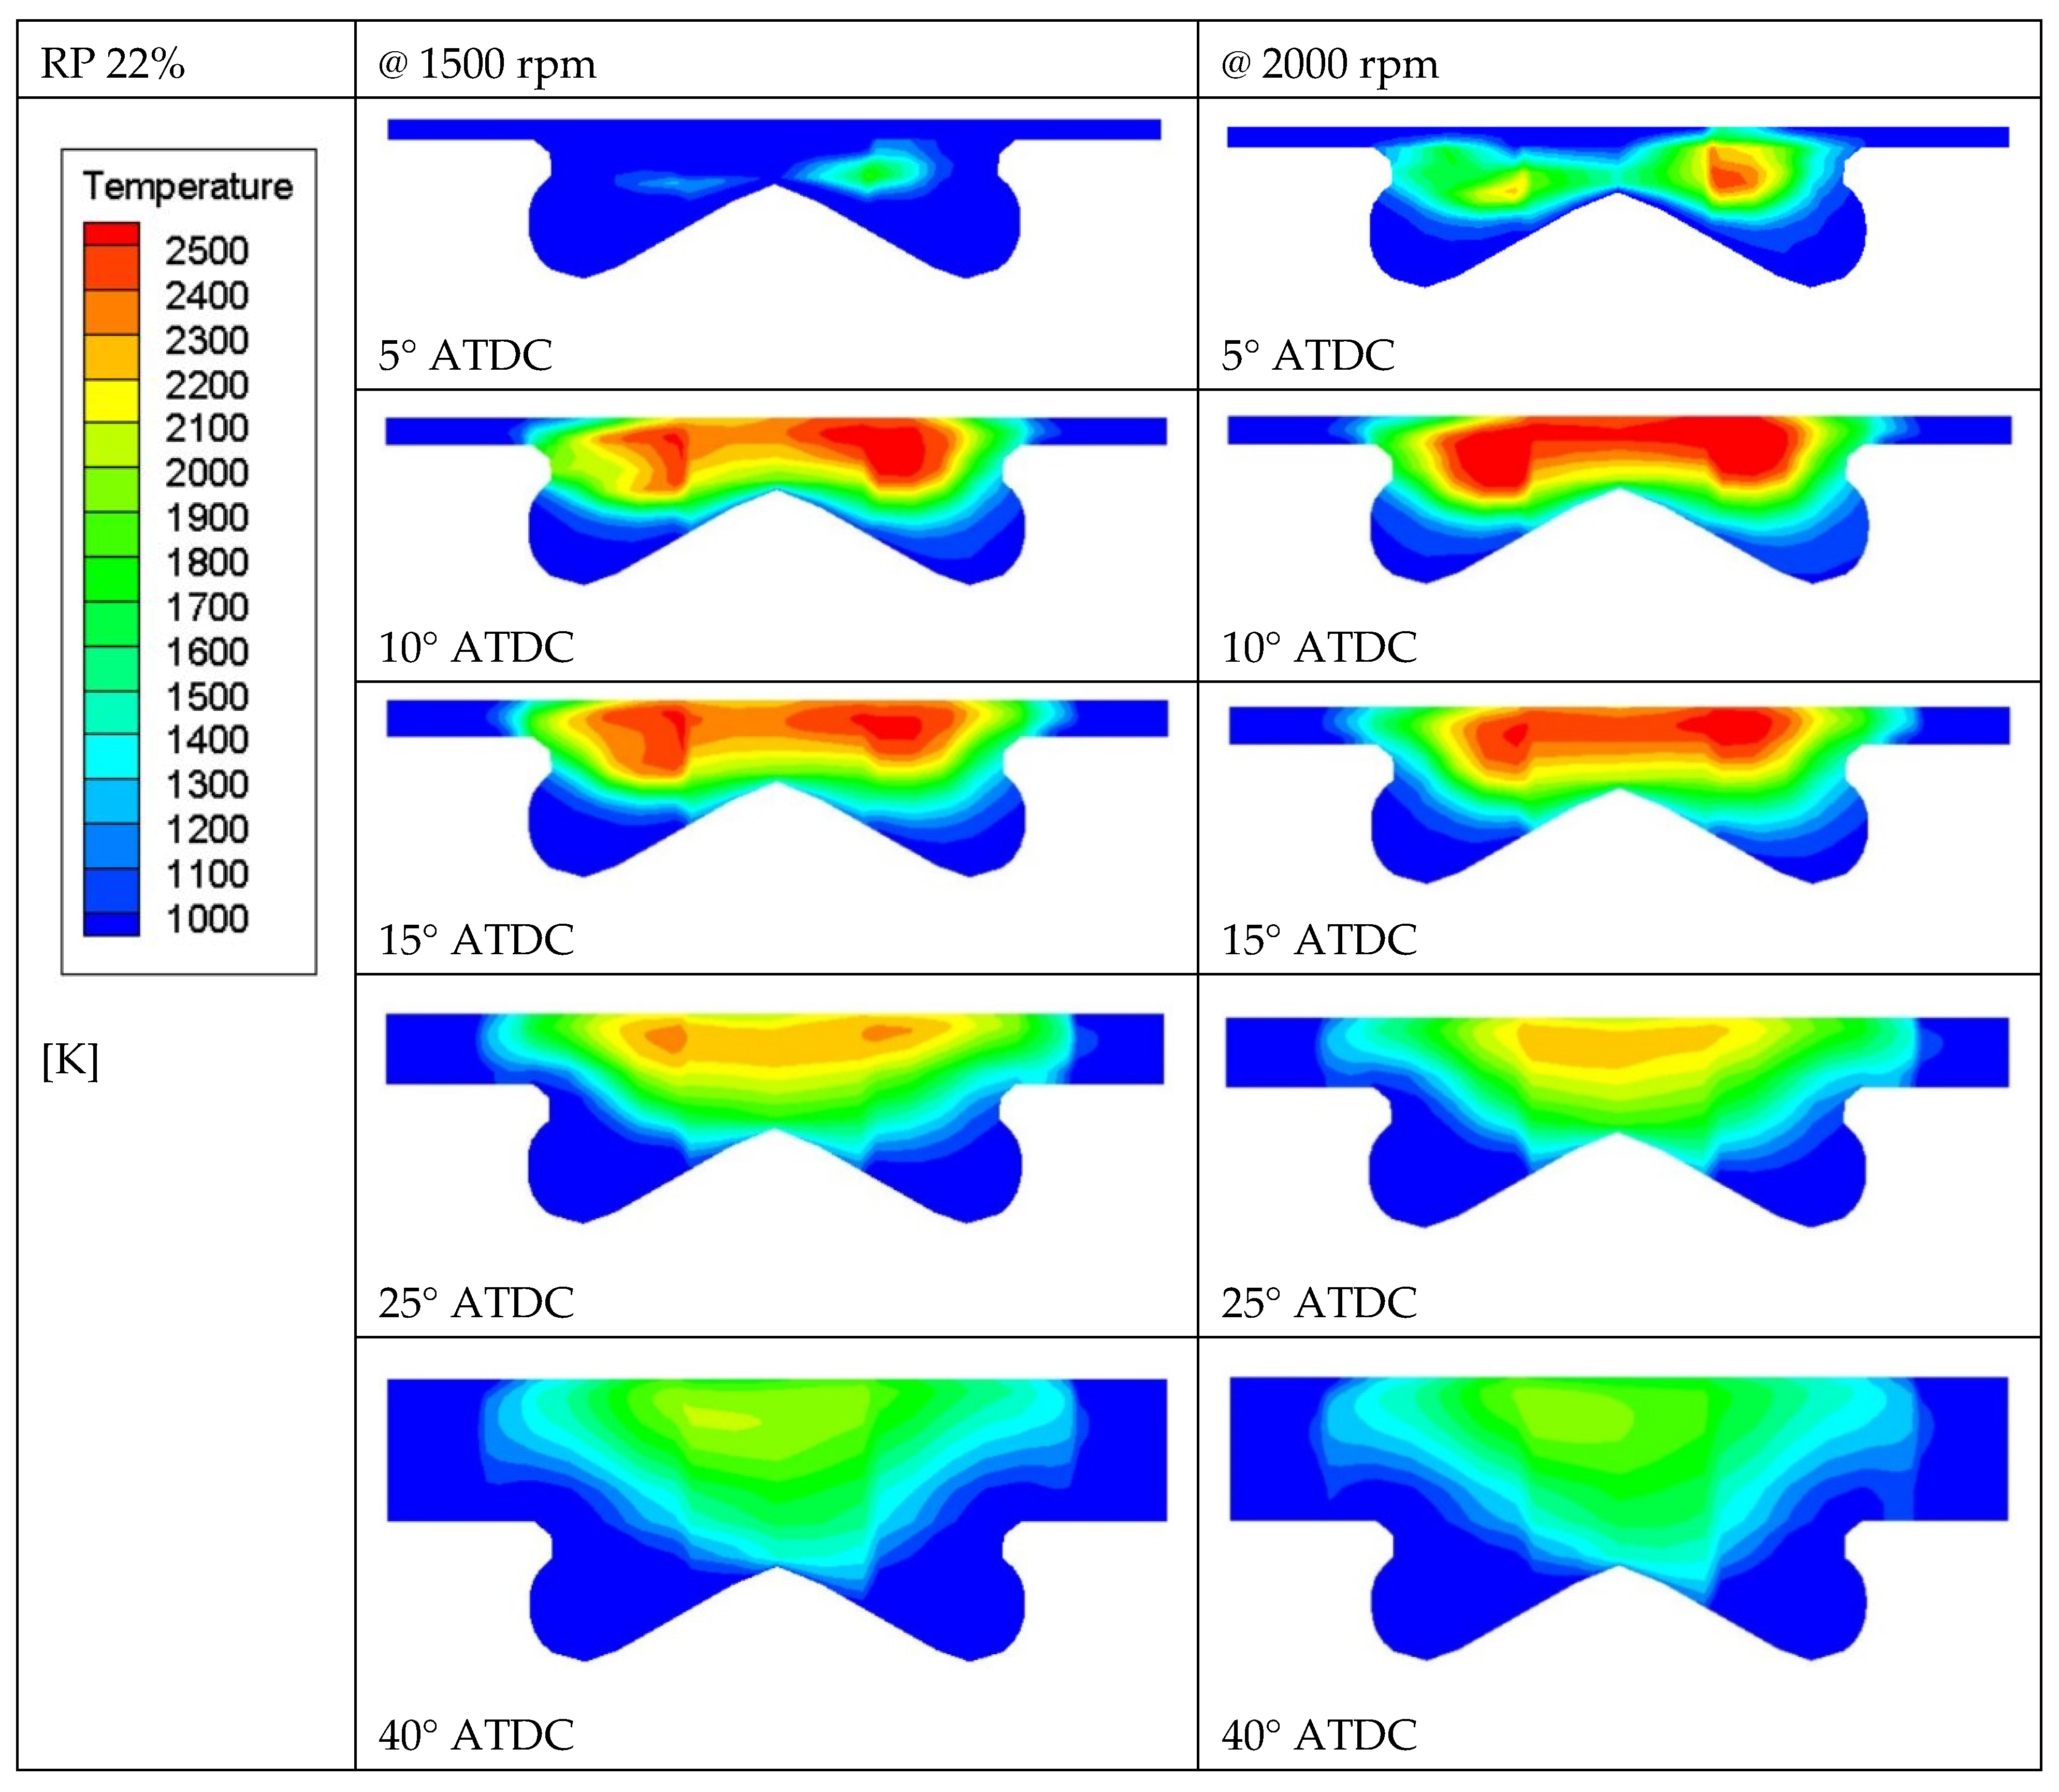
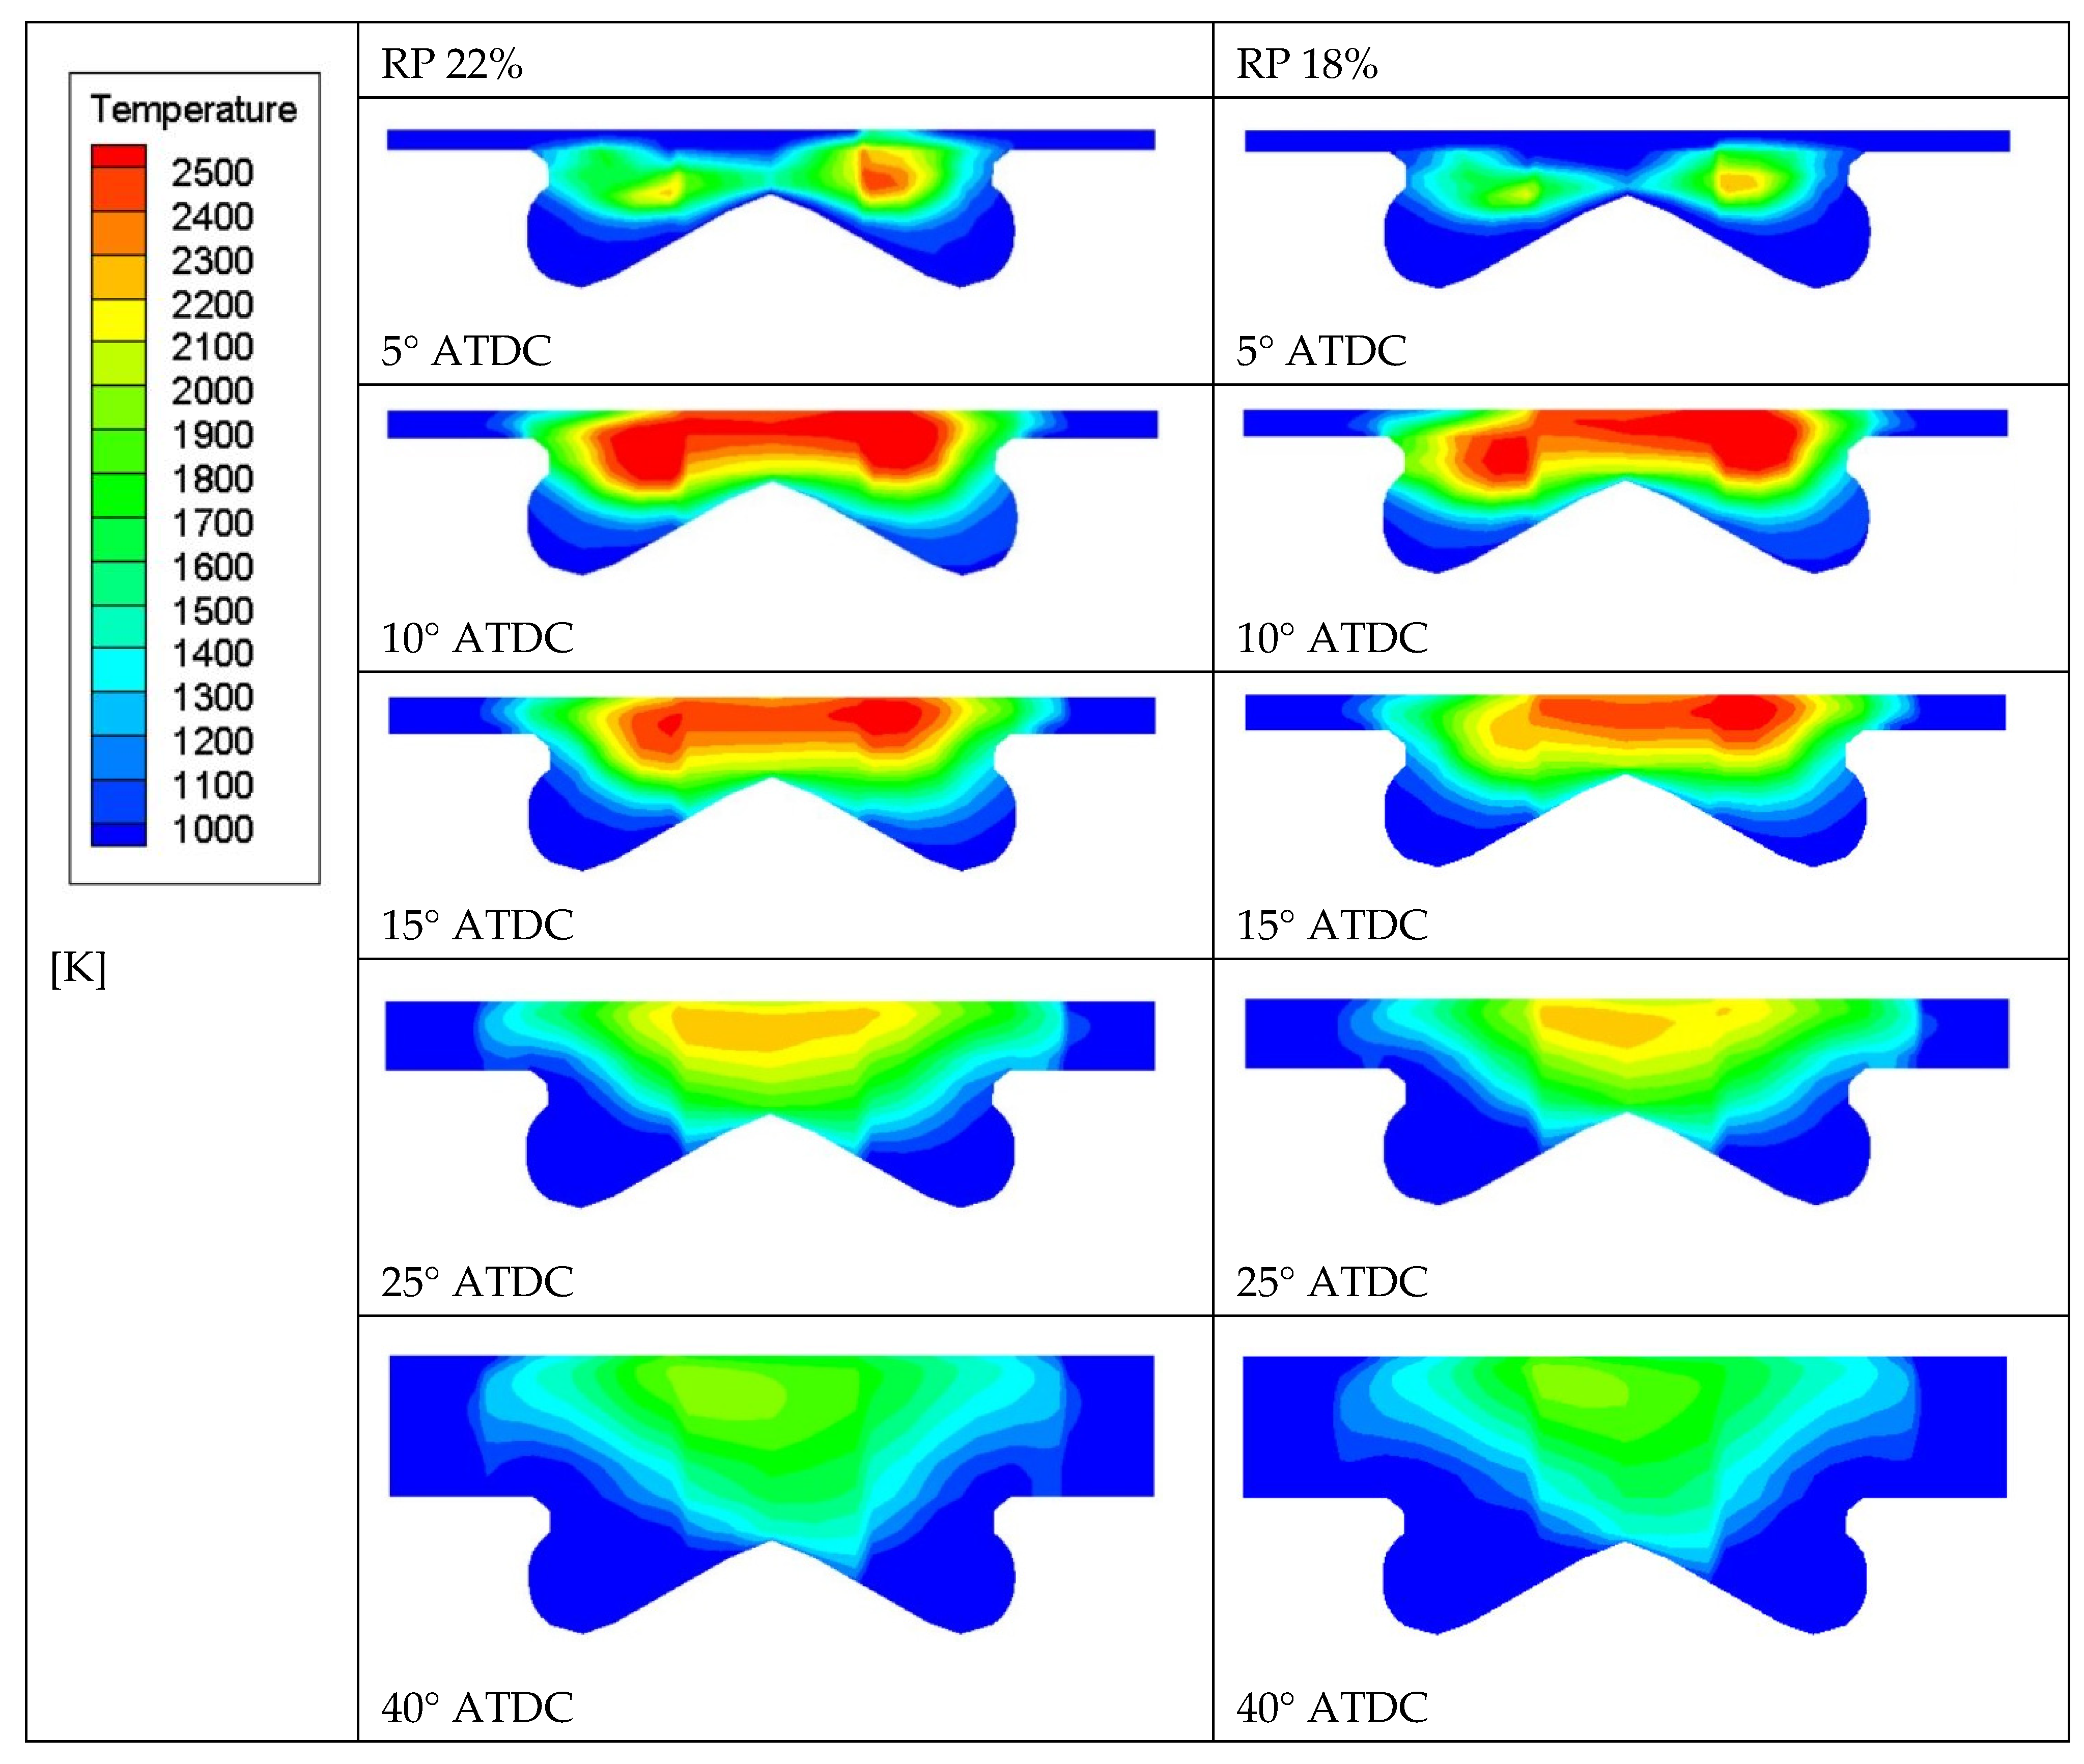
Temperature distributions in
Figure 6 outline that, as observed for the pressure trends, an increase in engine speed leads to a higher peak temperature, although the same regions are affected by the higher temperatures.
In
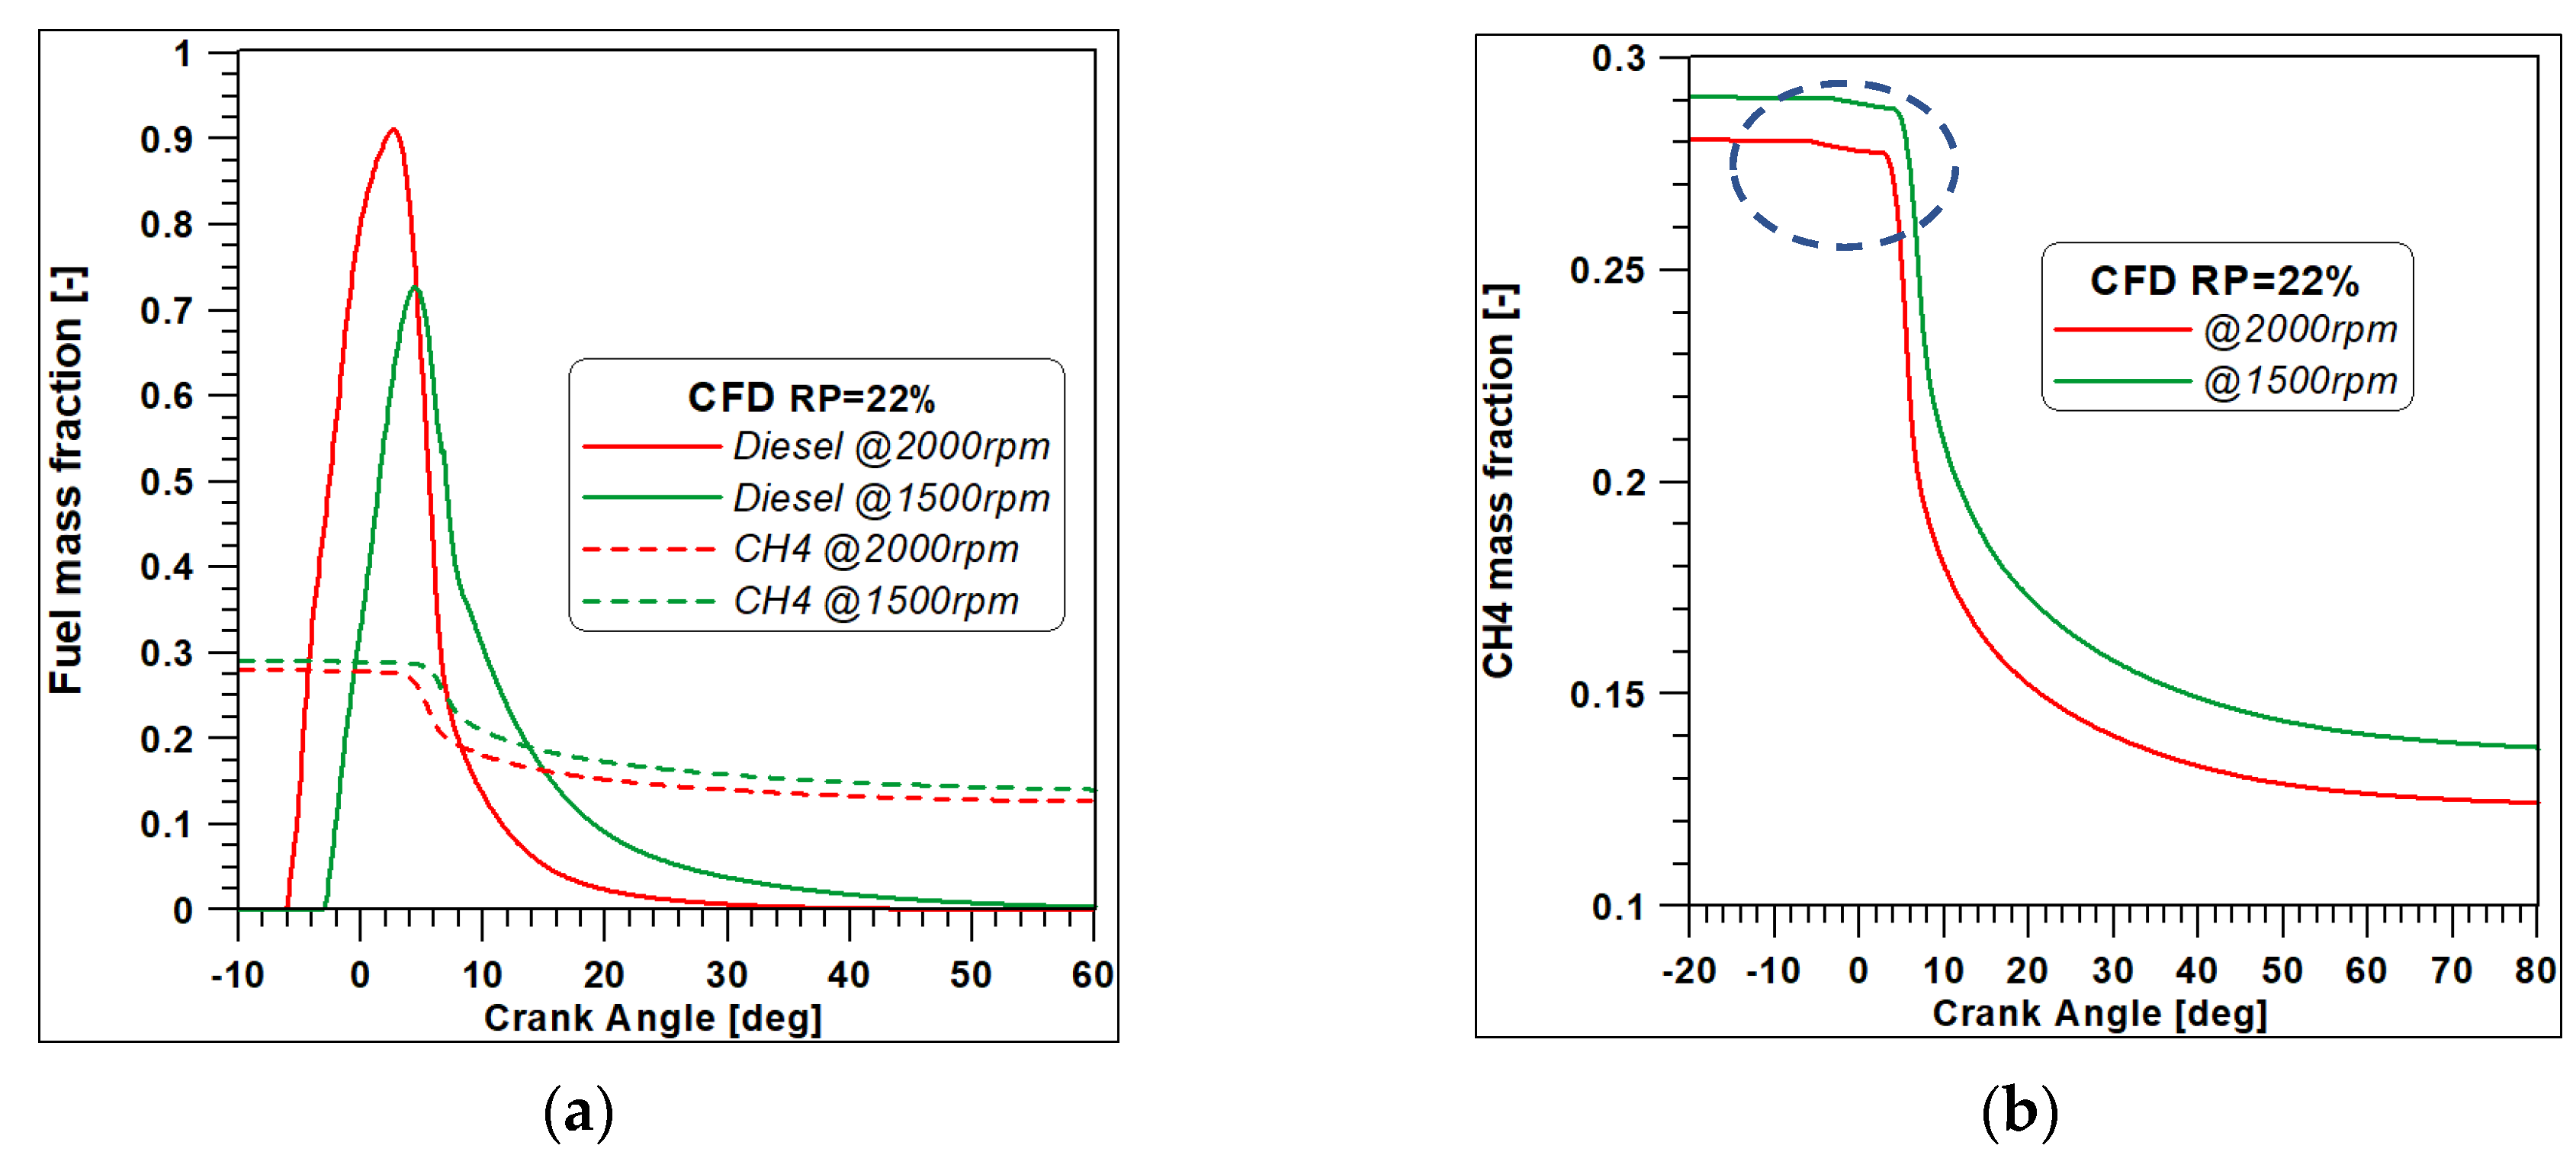
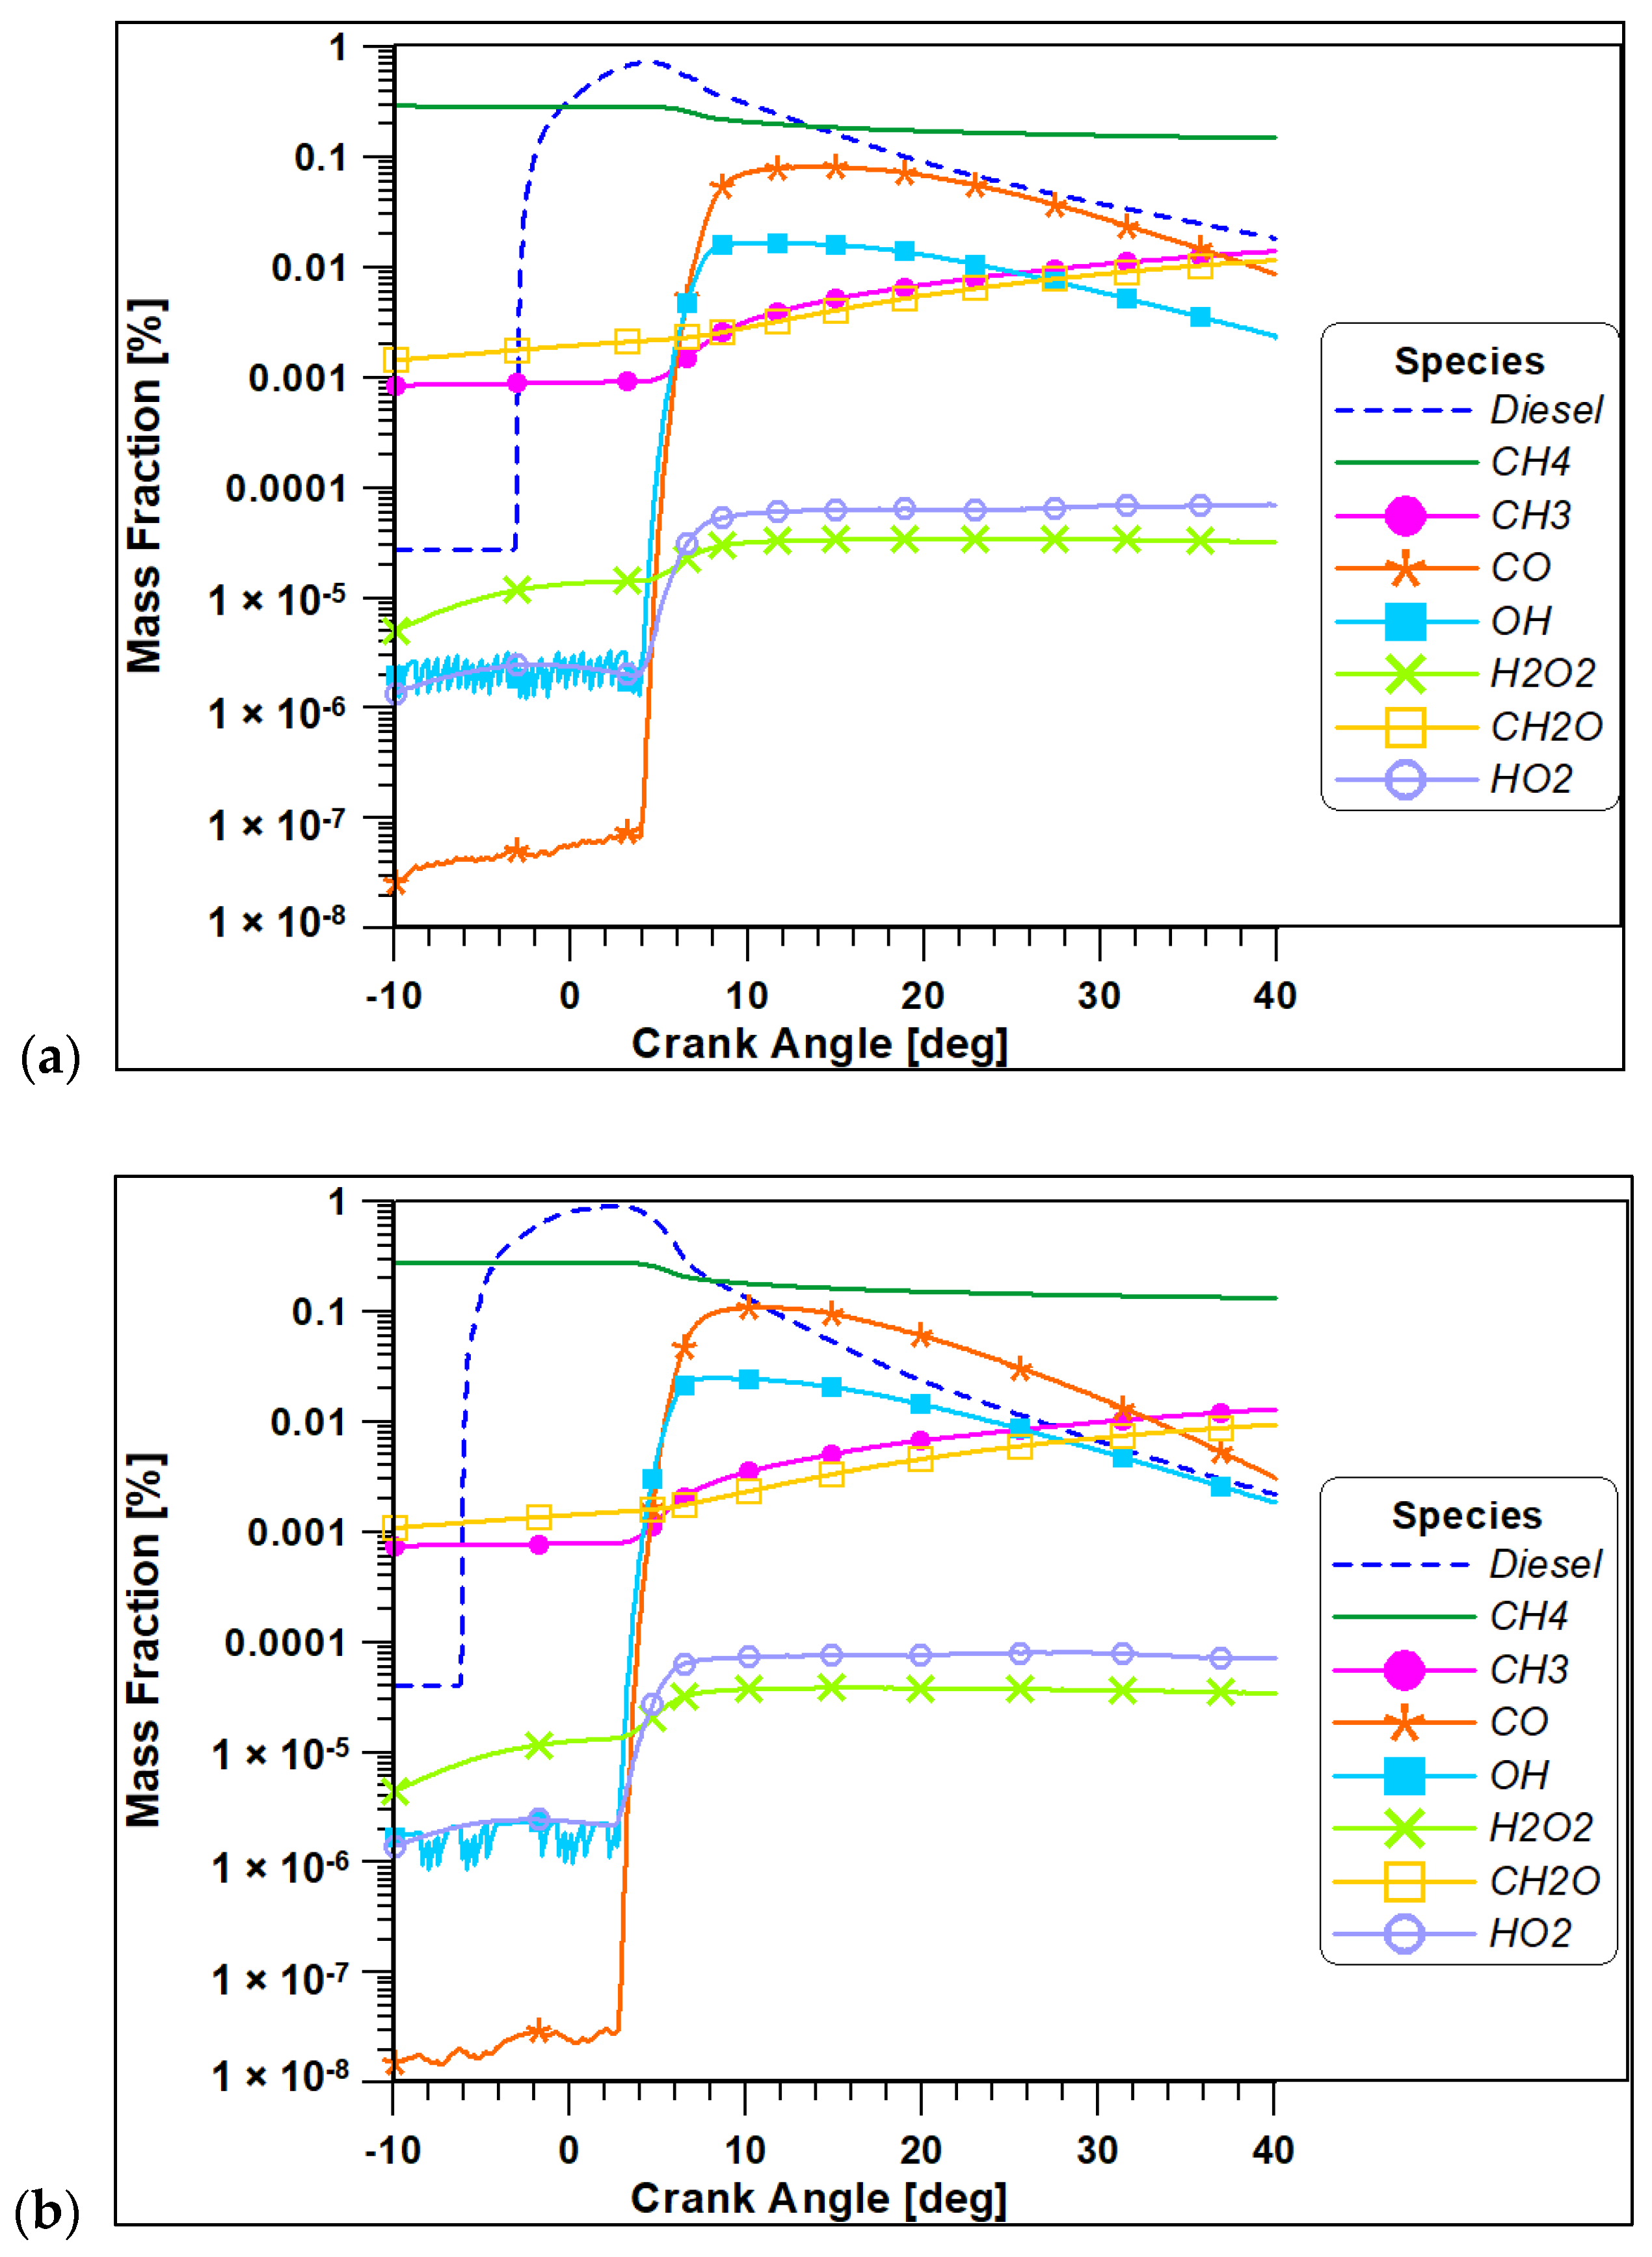
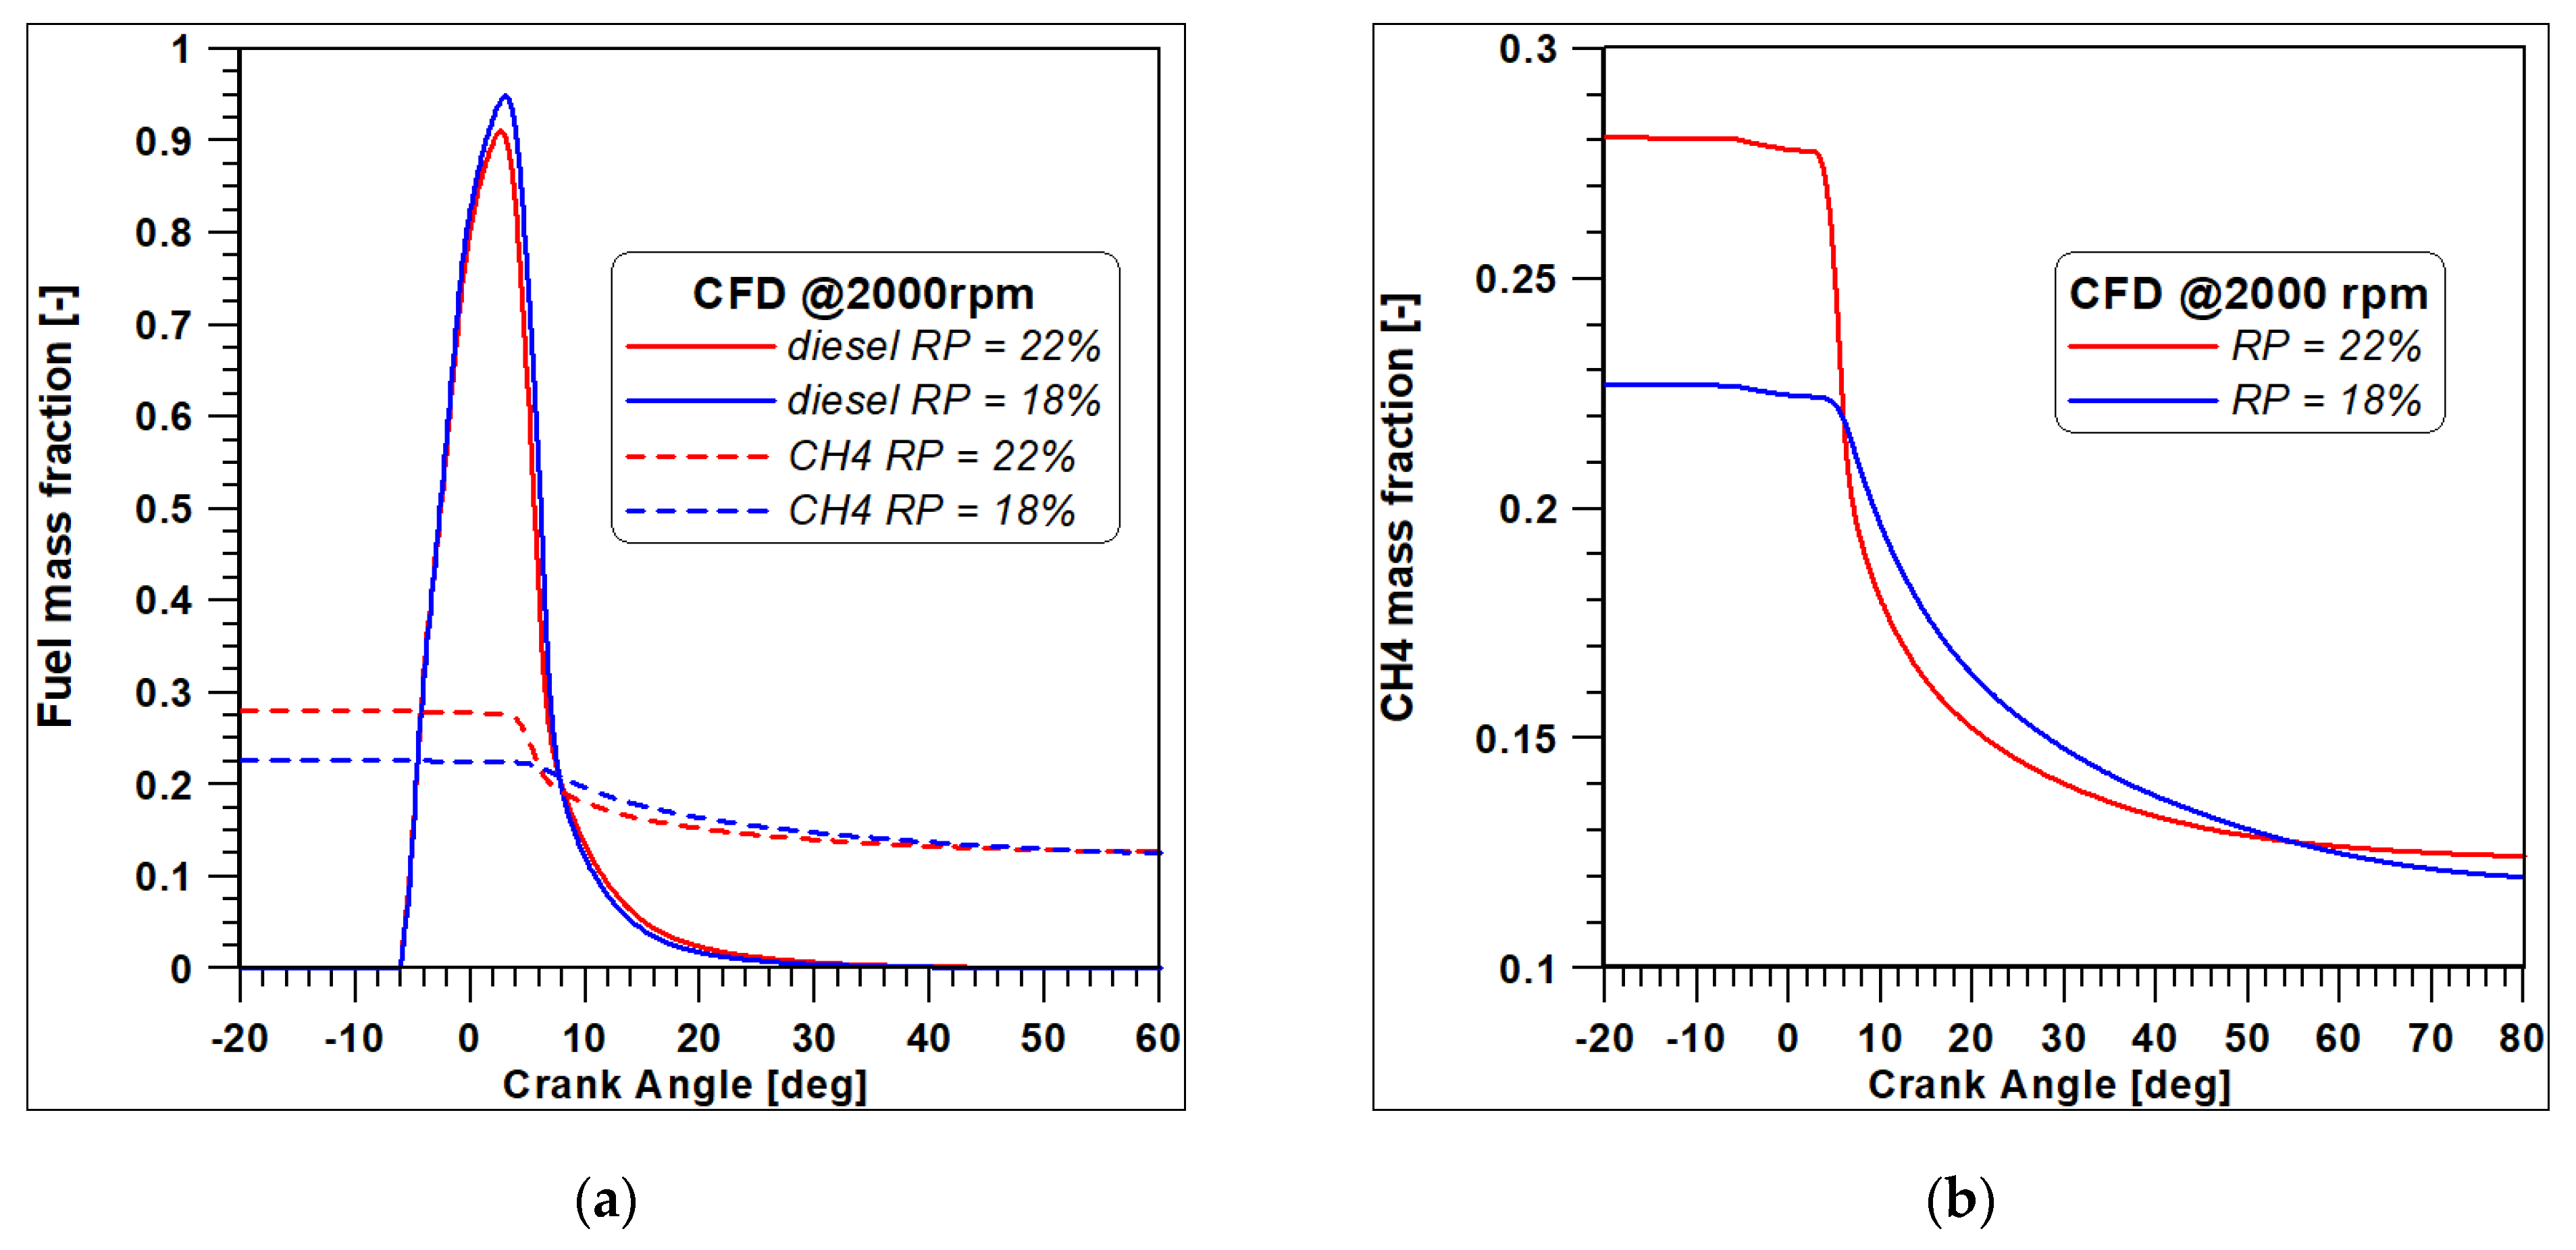
Figure 7a, the mass fractions of both fuels are reported for the two examined cases. As previously mentioned, the development of diesel vapour consumption is difficult to evaluate due to the different engine speed and injection advance. However, in the 1500 rpm case, the diesel vapour starts to burn later, as demonstrated by the lower slope of the curve with respect to the 2000 rpm case, and a slower combustion is observed, as both curves occupy the same angular interval that corresponds to a longer time interval in the 1500 rpm case. In both cases, it is possible to state that methane combustion is only activated after diesel vapour ignition. A zoom of the methane mass fraction is displayed in
Figure 7b in order to better display the main features of methane combustion. Indeed, as evidenced by the dashed circle, a slight decrease in methane content occurs before the real ignition, and this may be due to the activation of the low temperature reactions. This behaviour was already observed in [
7]. In addition, as illustrated in
Figure 8, the same species, i.e., CH
3, H
2O
2 and CH
2O, involved in the first reactions of the Li and Williams scheme are activated before diesel oil ignition.
Moreover,
Figure 7b displays a lower presence of methane at the end of combustion at 2000 rpm but also displays a different mass fraction level of methane inside the cylinder as the intake valve closes. This may be explained by the different charge formation estimated during the mass exchange phase through the valves.
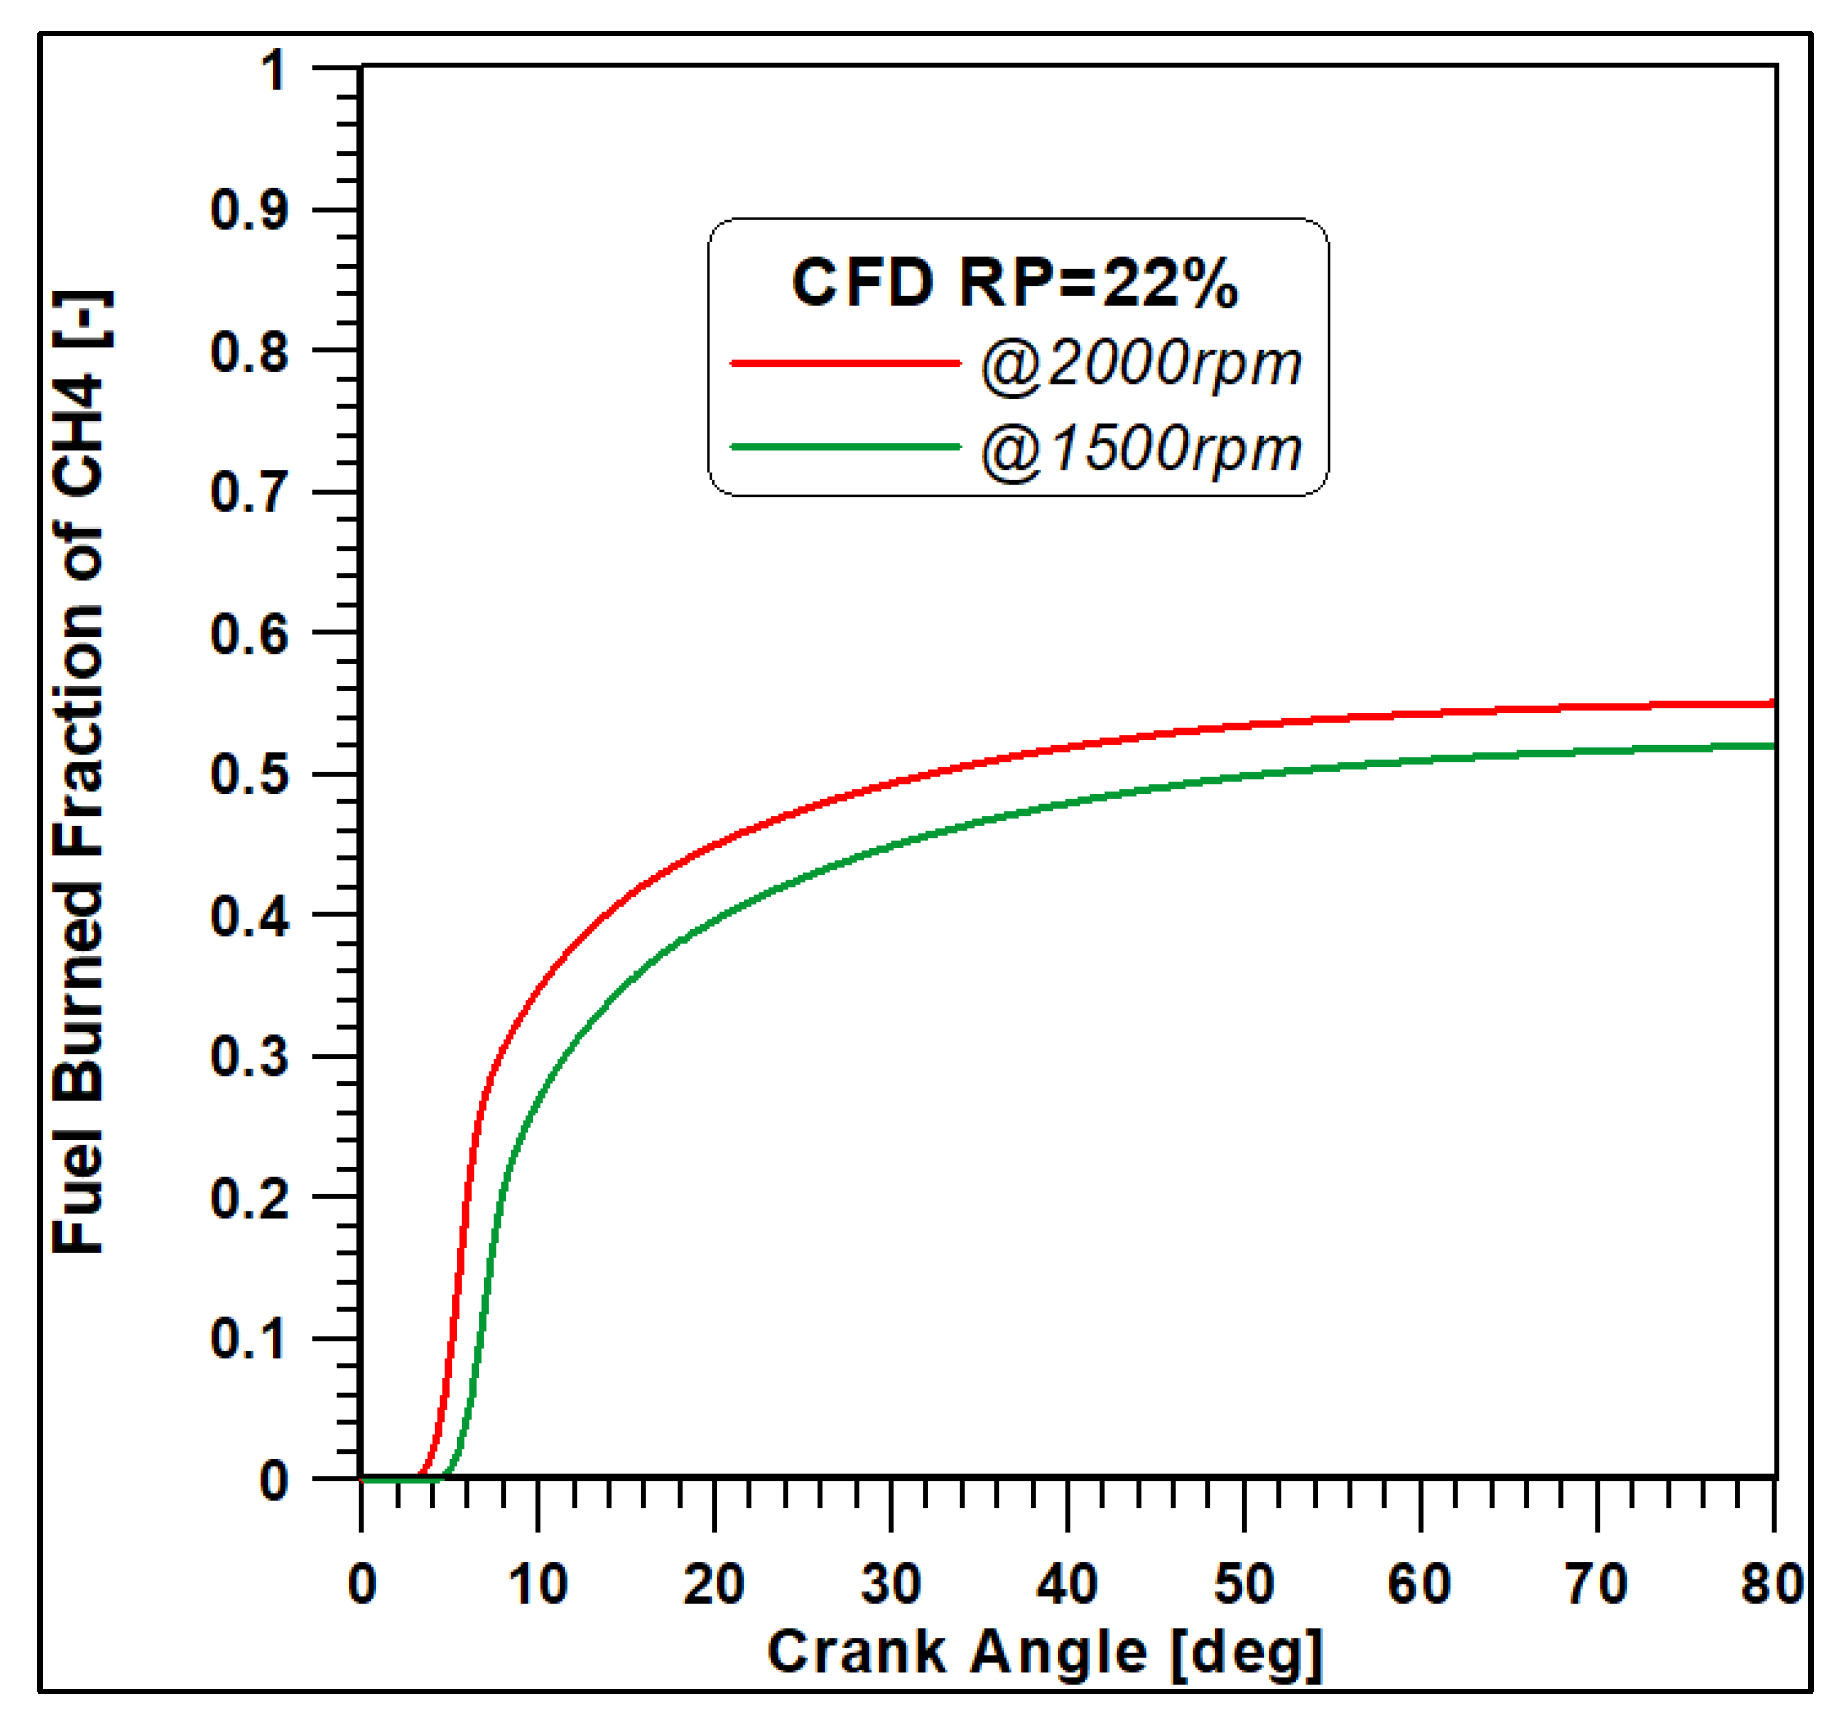
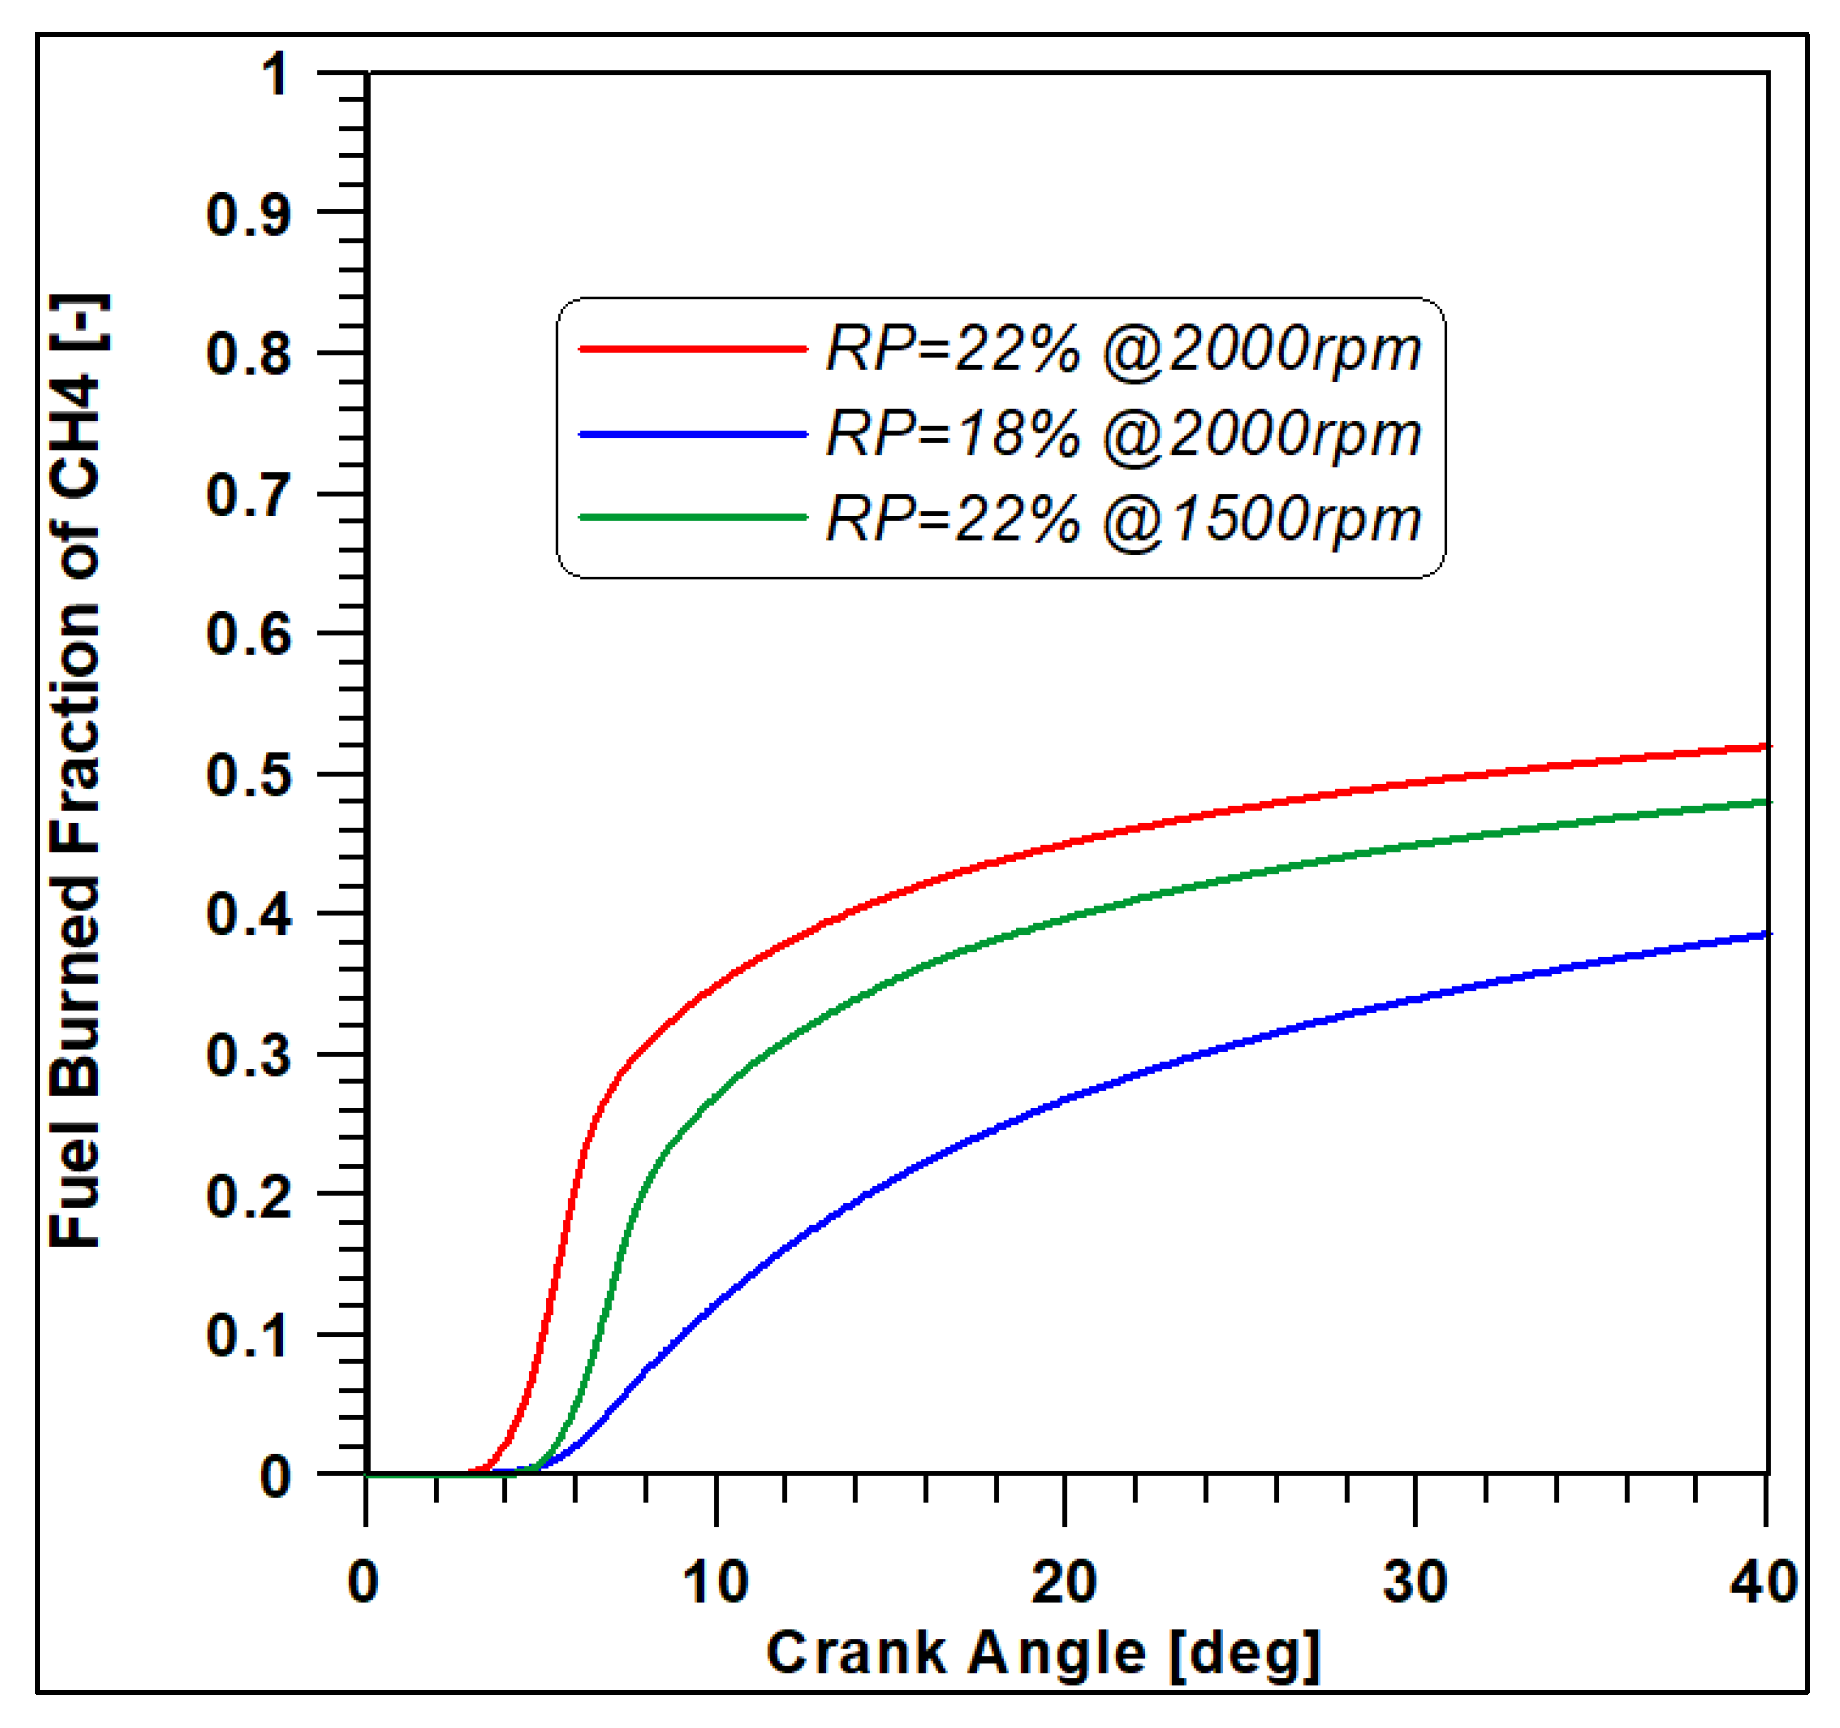
Additionally, it is well known that the volumetric efficiency and the air mass entering the cylinder are affected by the engine speed. With the purpose of identifying the case that presents a more efficient consumption of gaseous fuel, it is necessary to analyze the fraction of burned methane.
As a matter of fact,
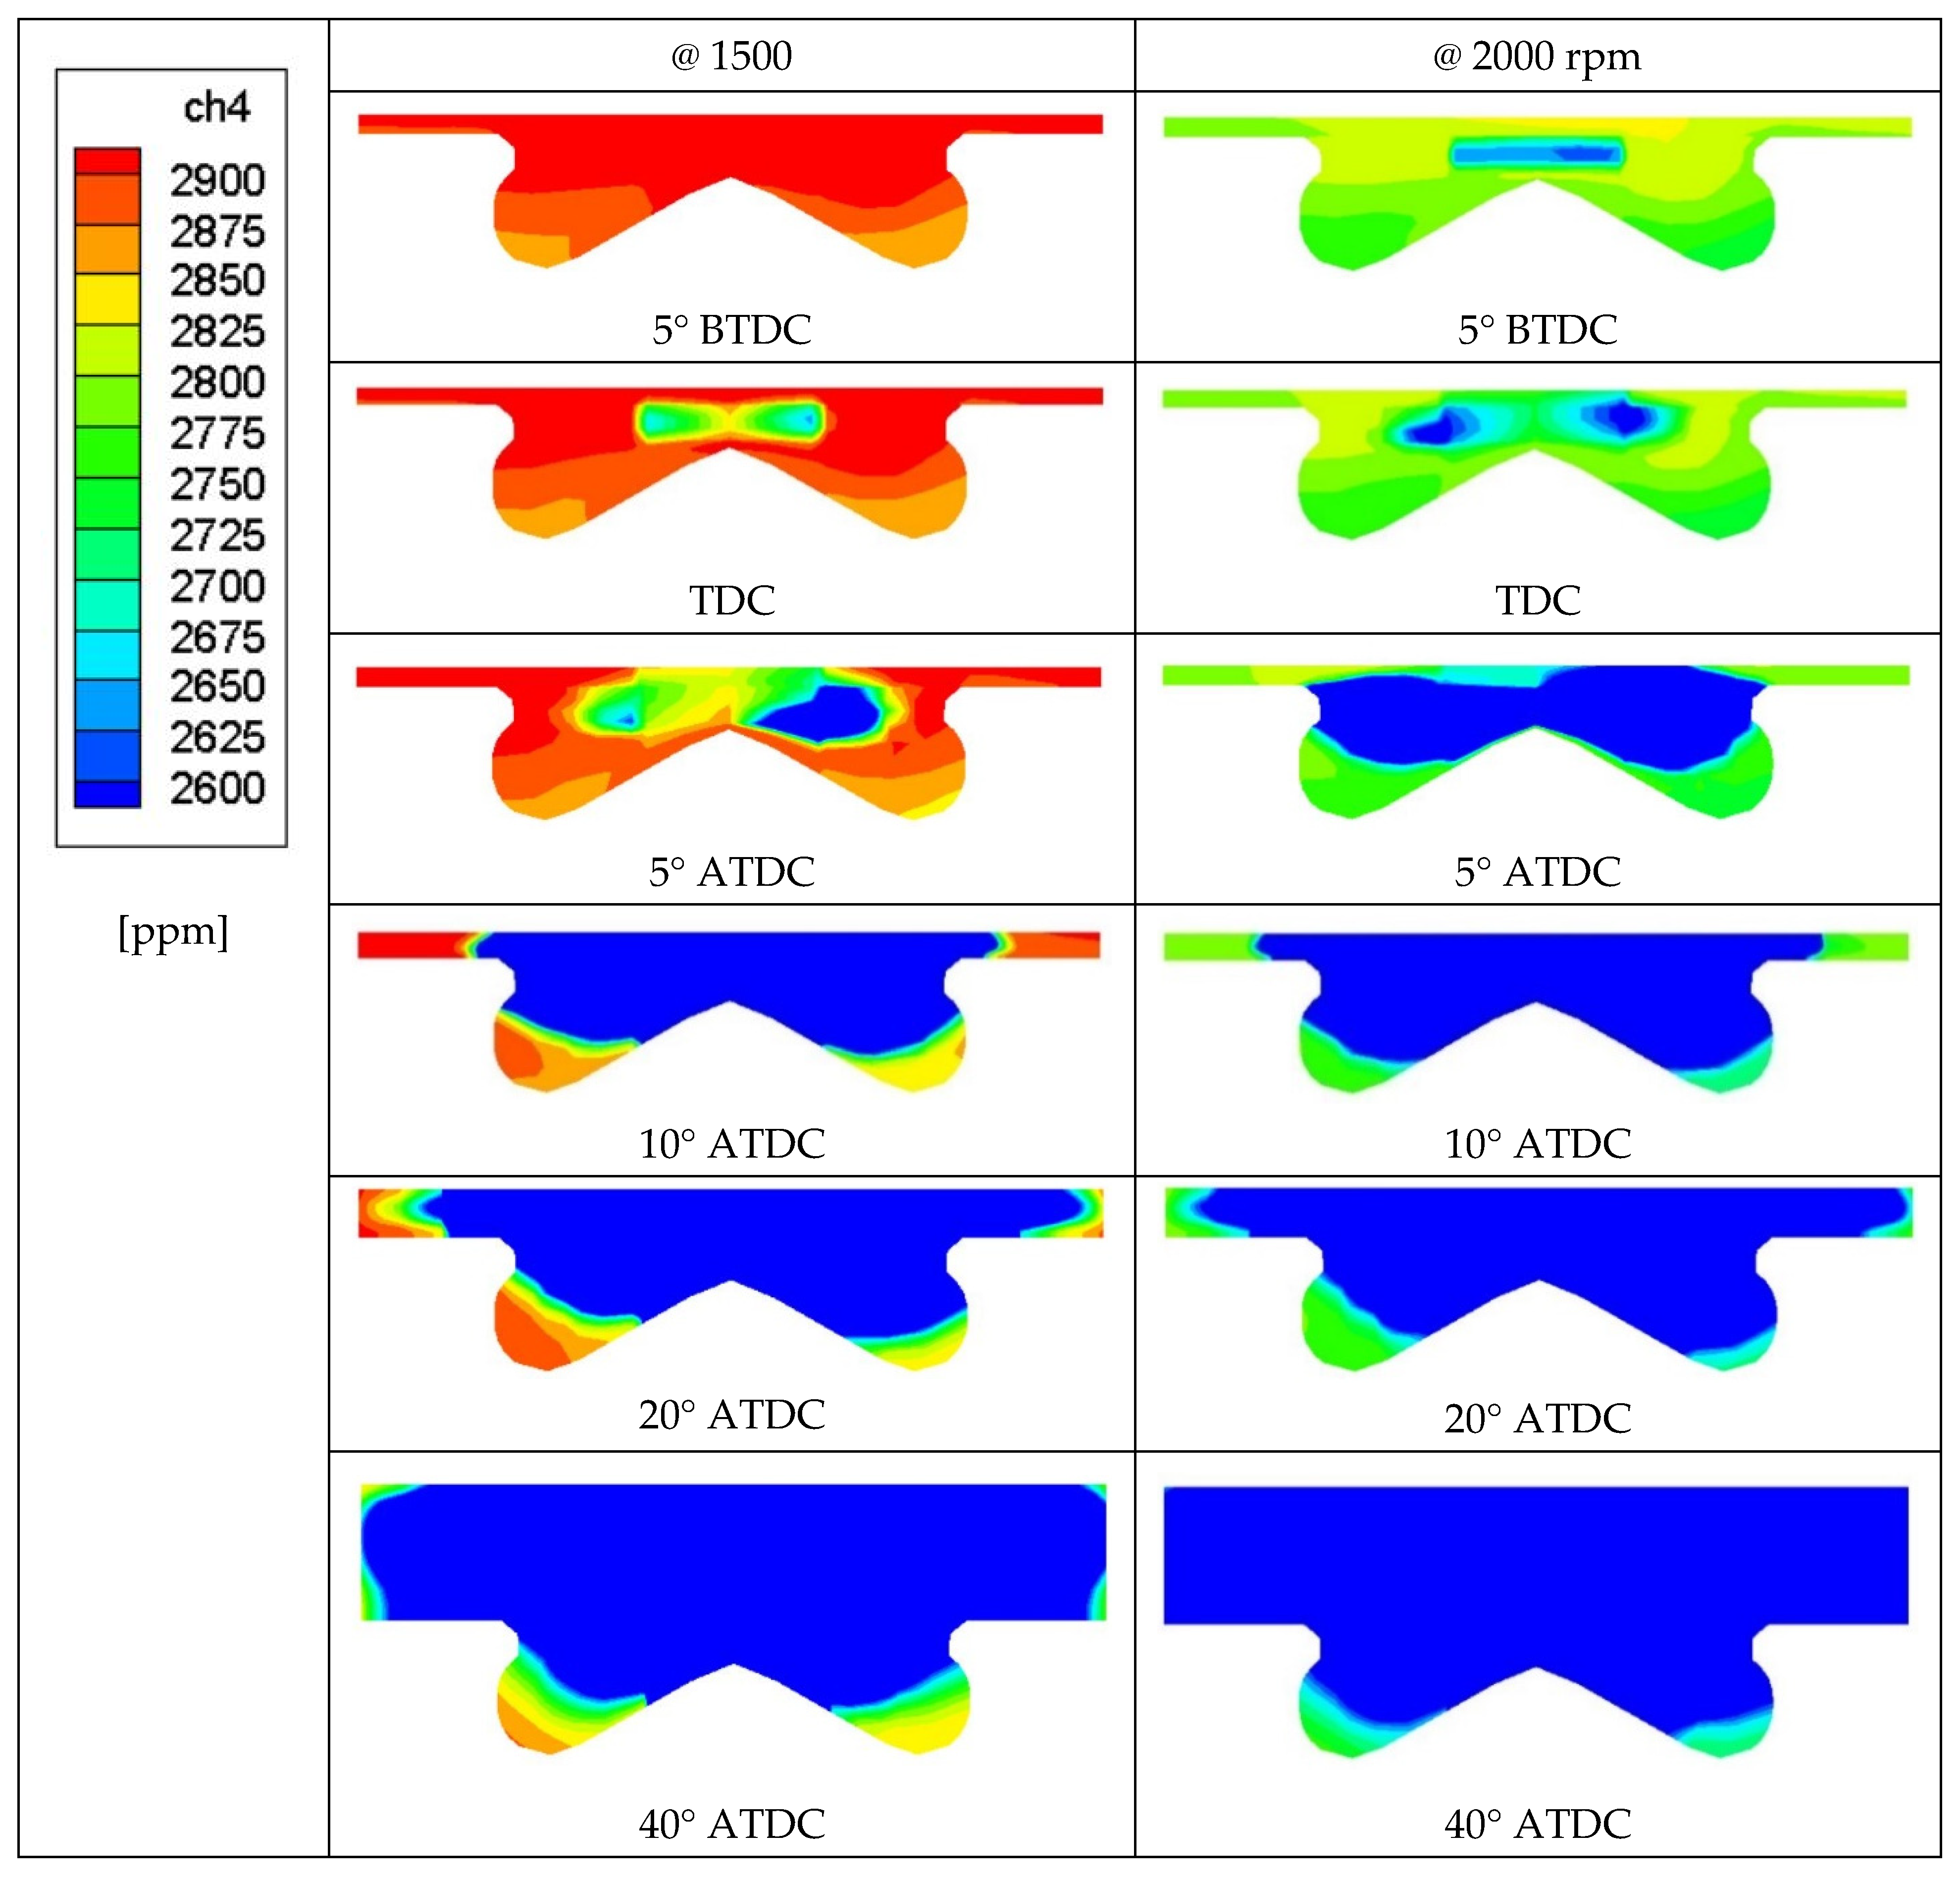
Figure 9 confirms that the increase of speed can be beneficial for methane combustion, as the higher burned methane fraction is obtained in the 2000 rpm case. Nevertheless, the same figure illustrates that a great amount of unburned hydrocarbons is present in the exhaust. Methane distributions reported in
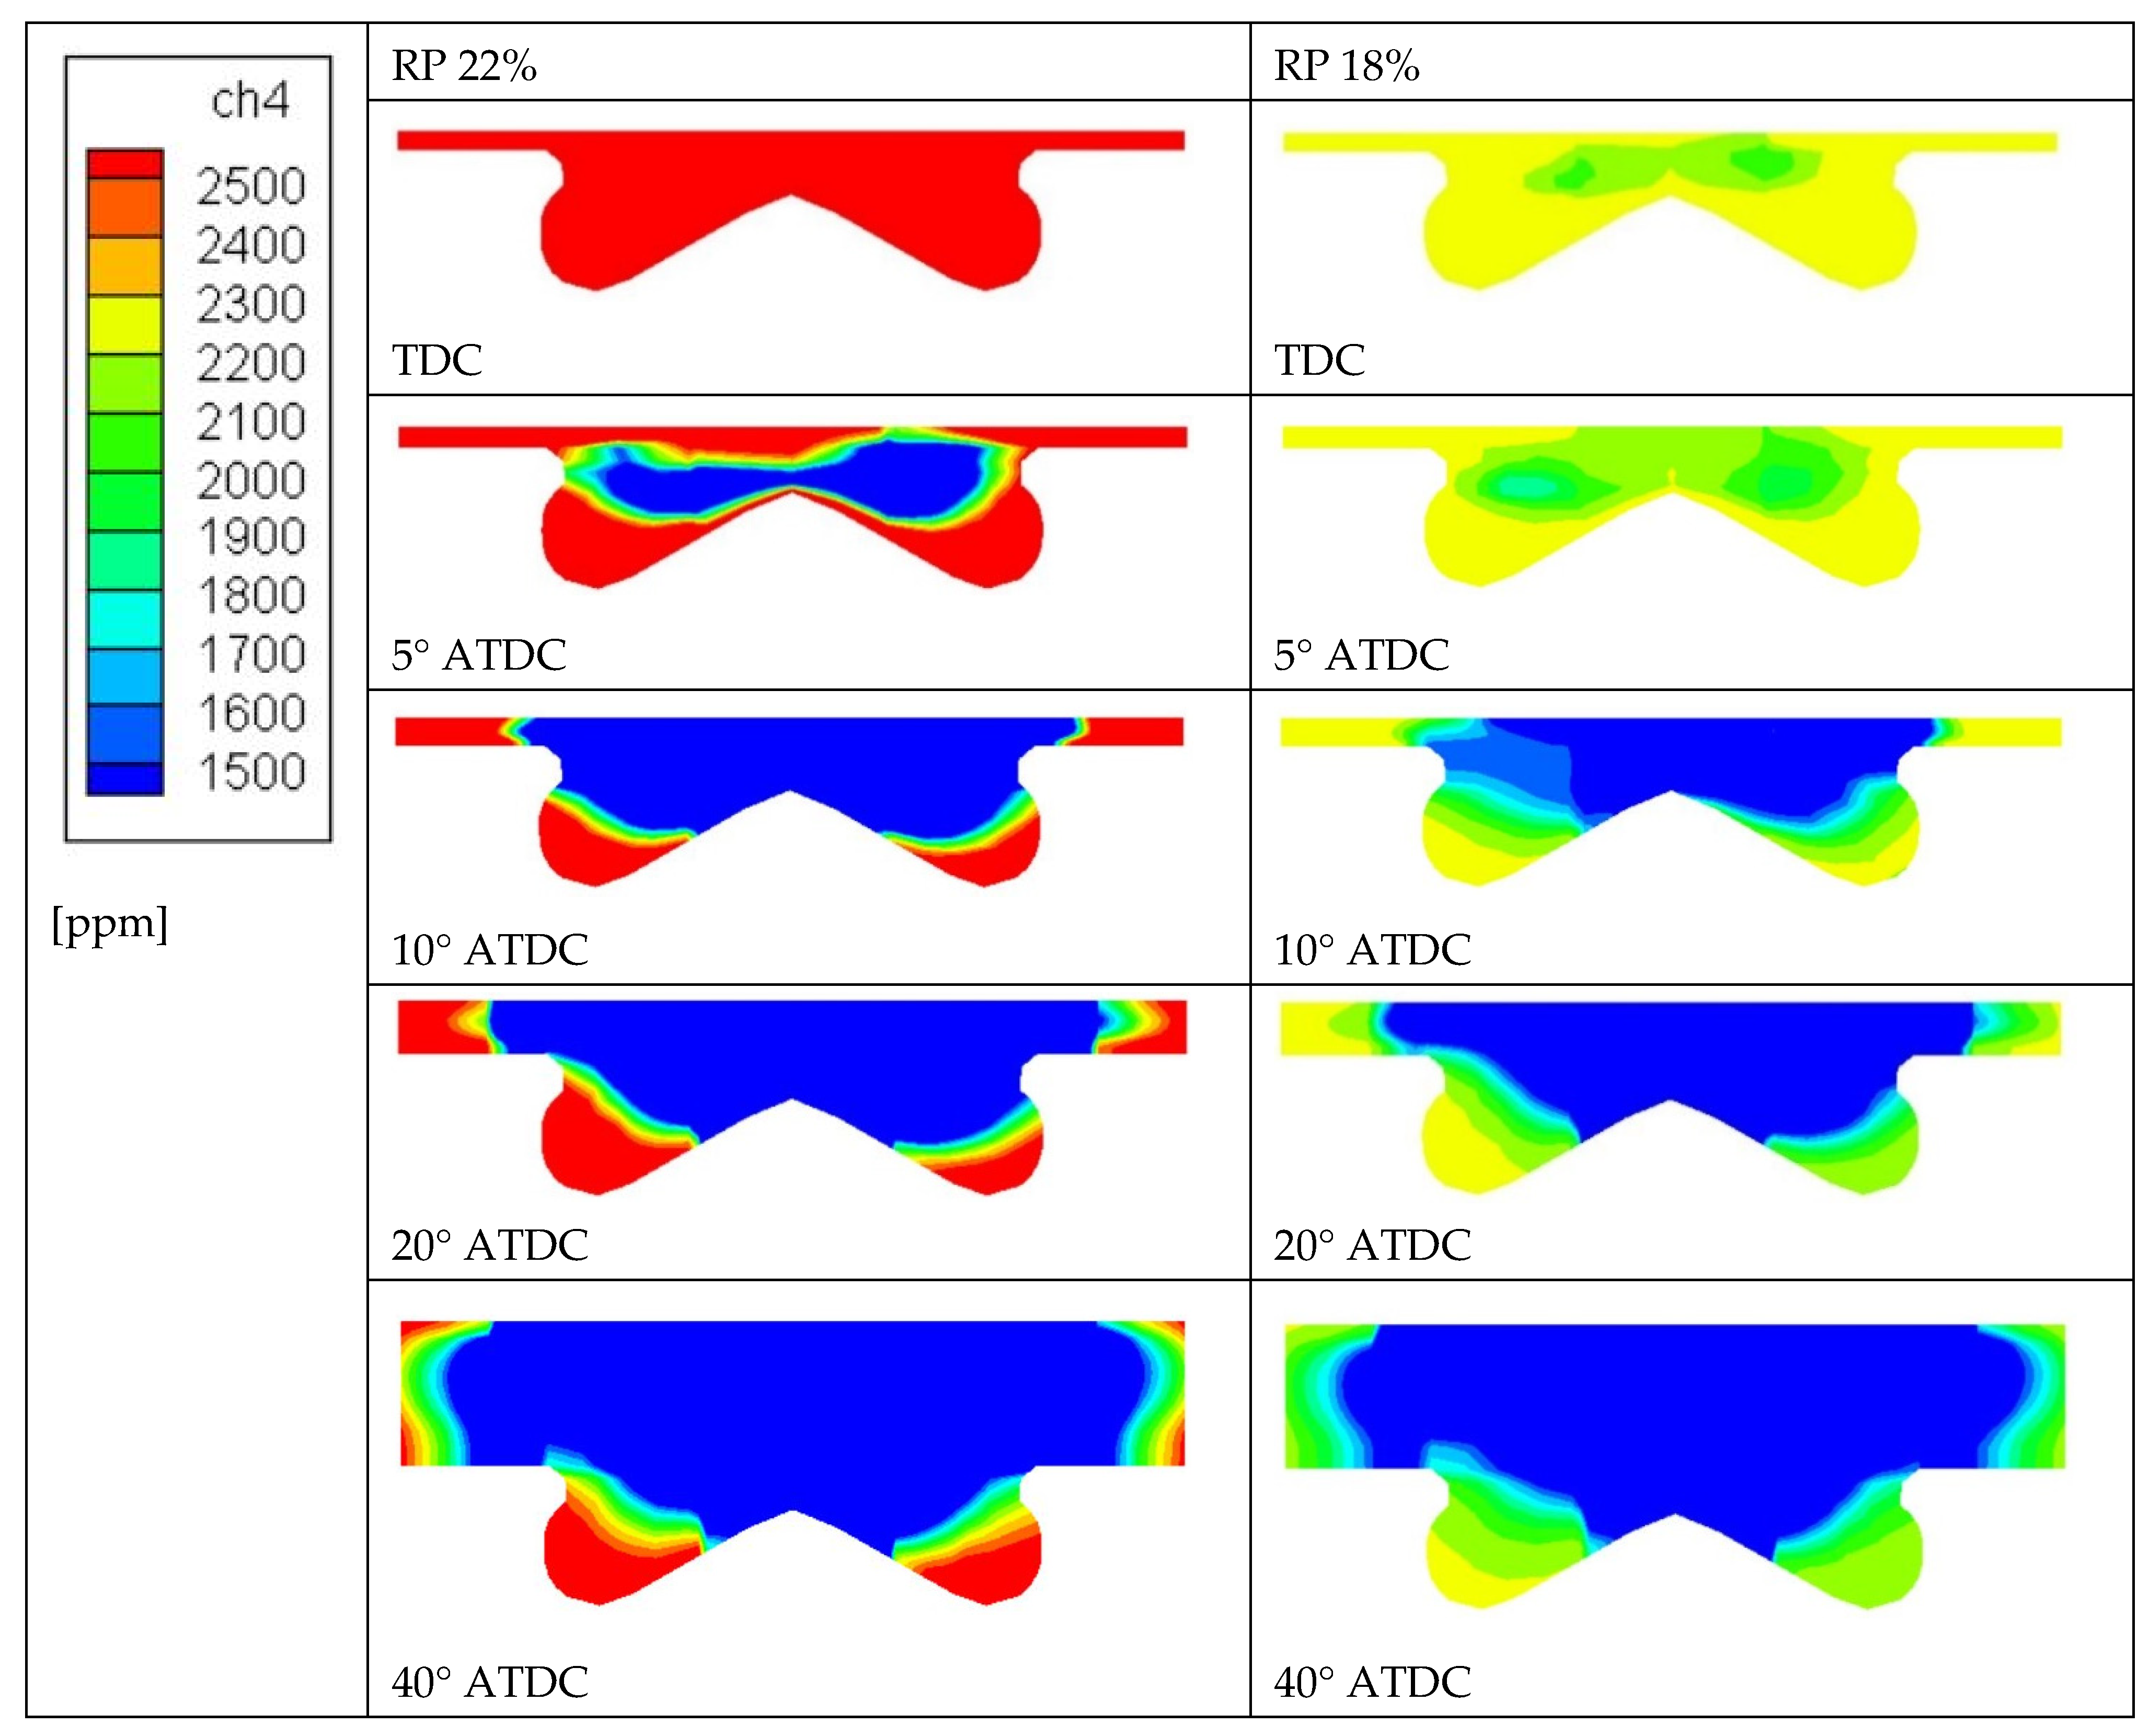
Figure 10 demonstrate that the region where the gaseous fuel is not able to be oxidized is the combustion bowl. In this sense, a future optimization of the direction of the liquid fuel jets and the injection timing could be appropriate to overcome this issue.
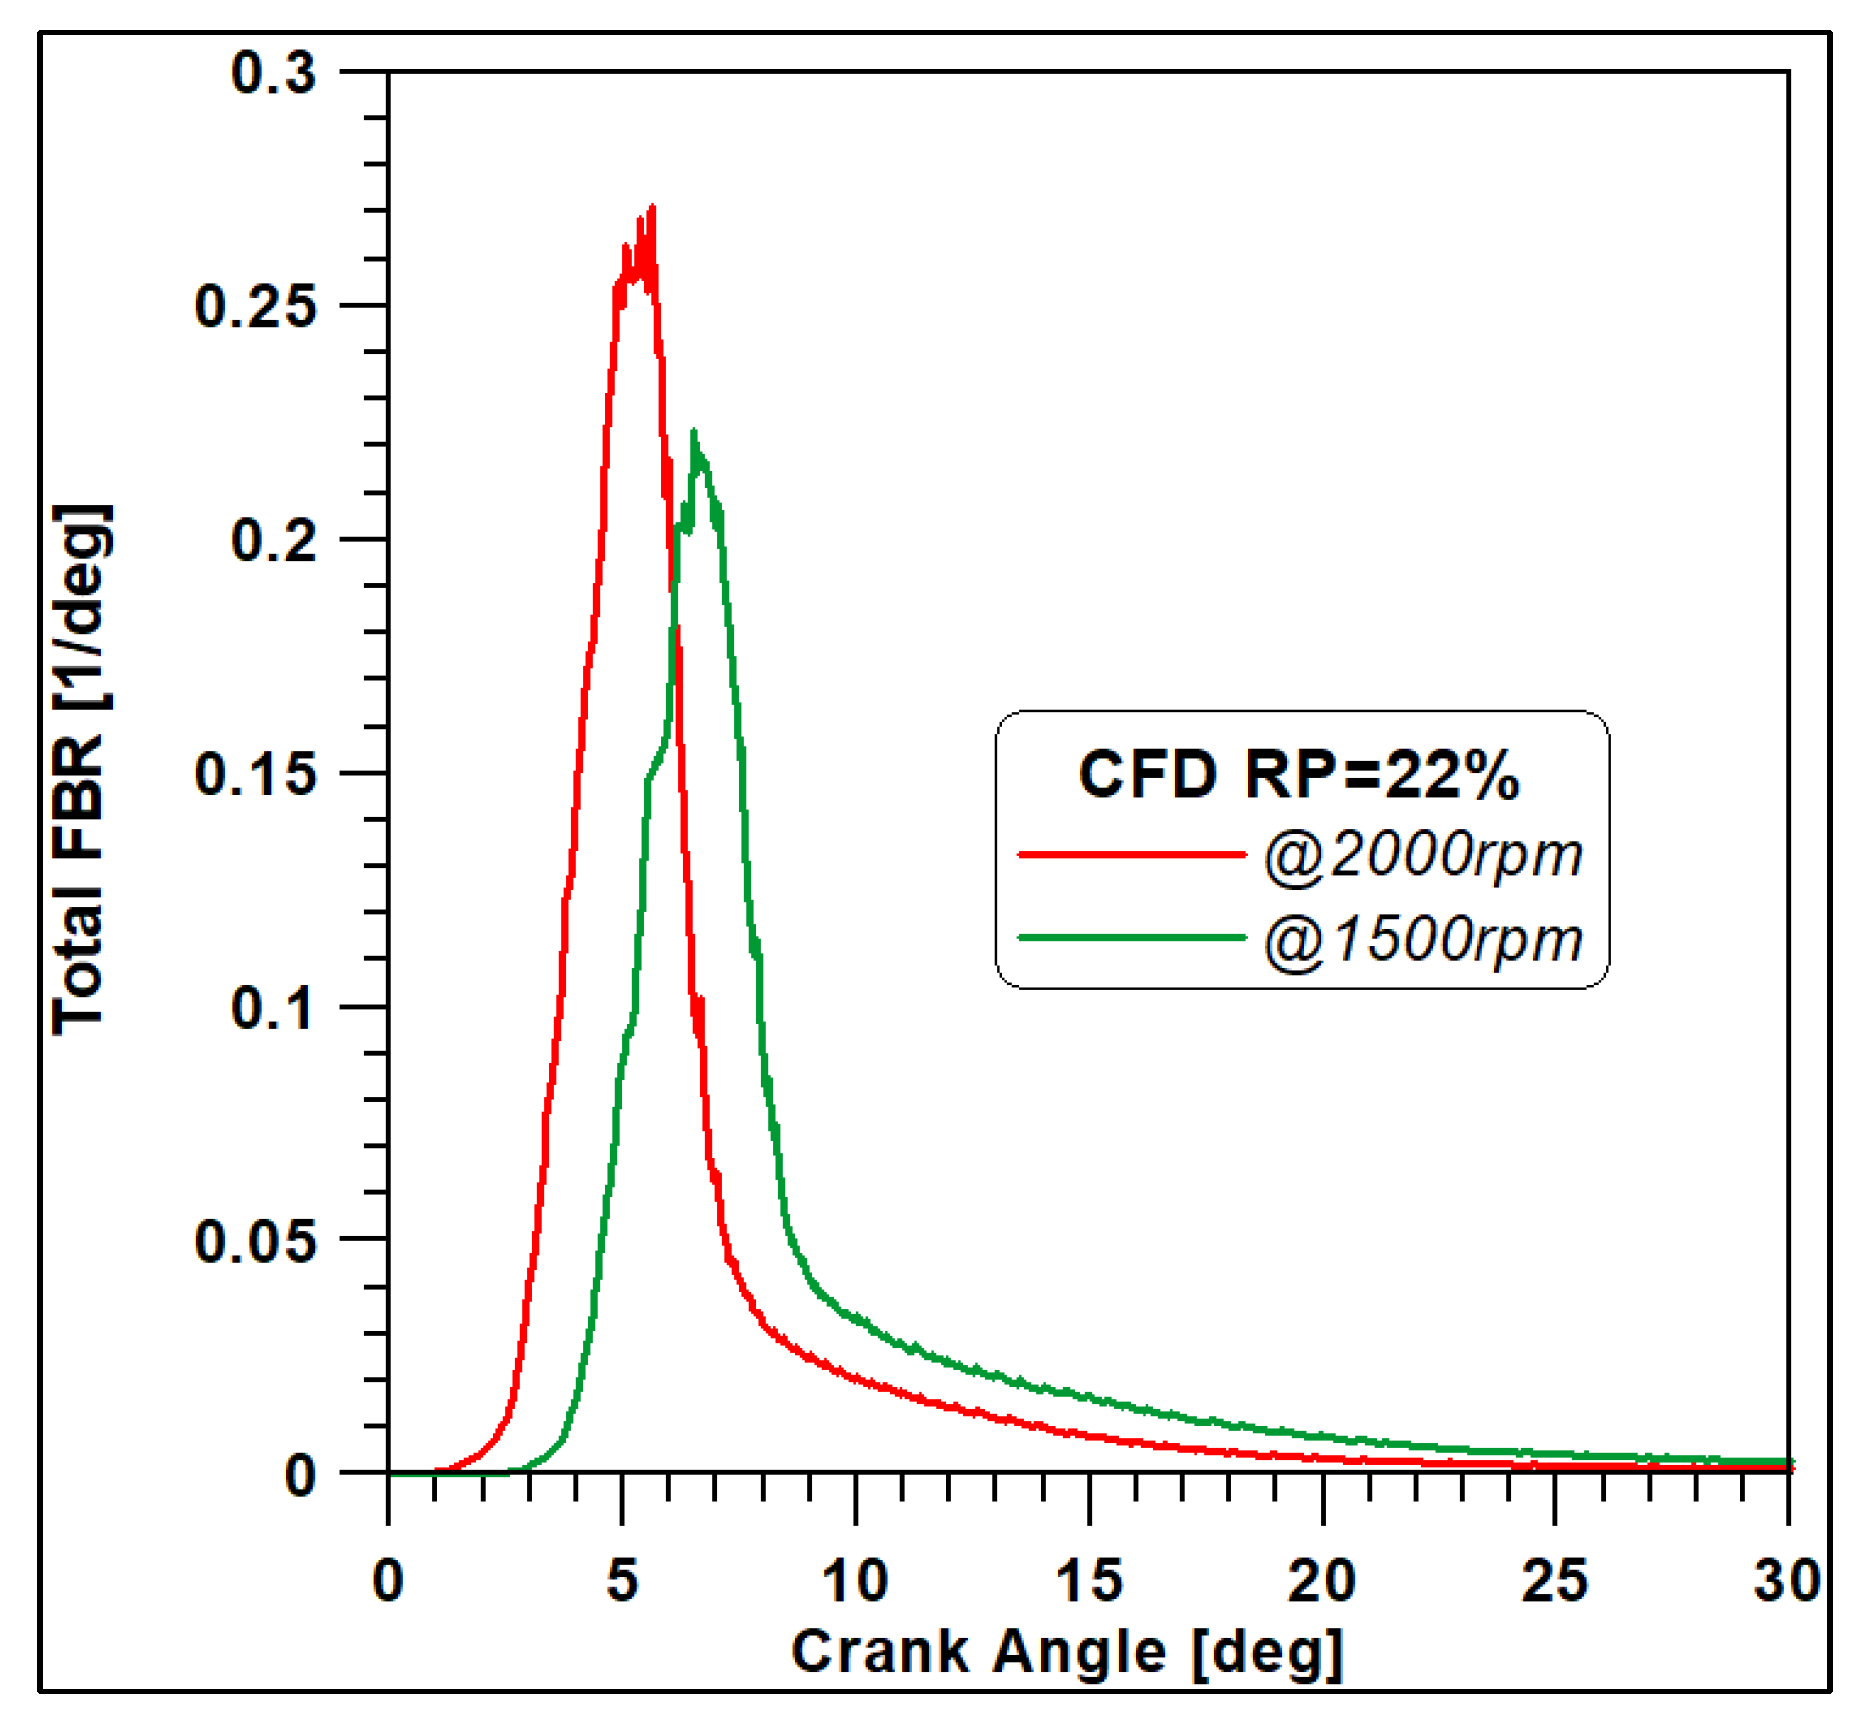
In
Figure 11, the total fuel burning rate (FBR) shows a lower and retarded peak in the 1500 rpm case, as expected, due to the less efficient combustion of methane, evidenced in
Figure 9, and due to the lower advance of start of injection. Finally,
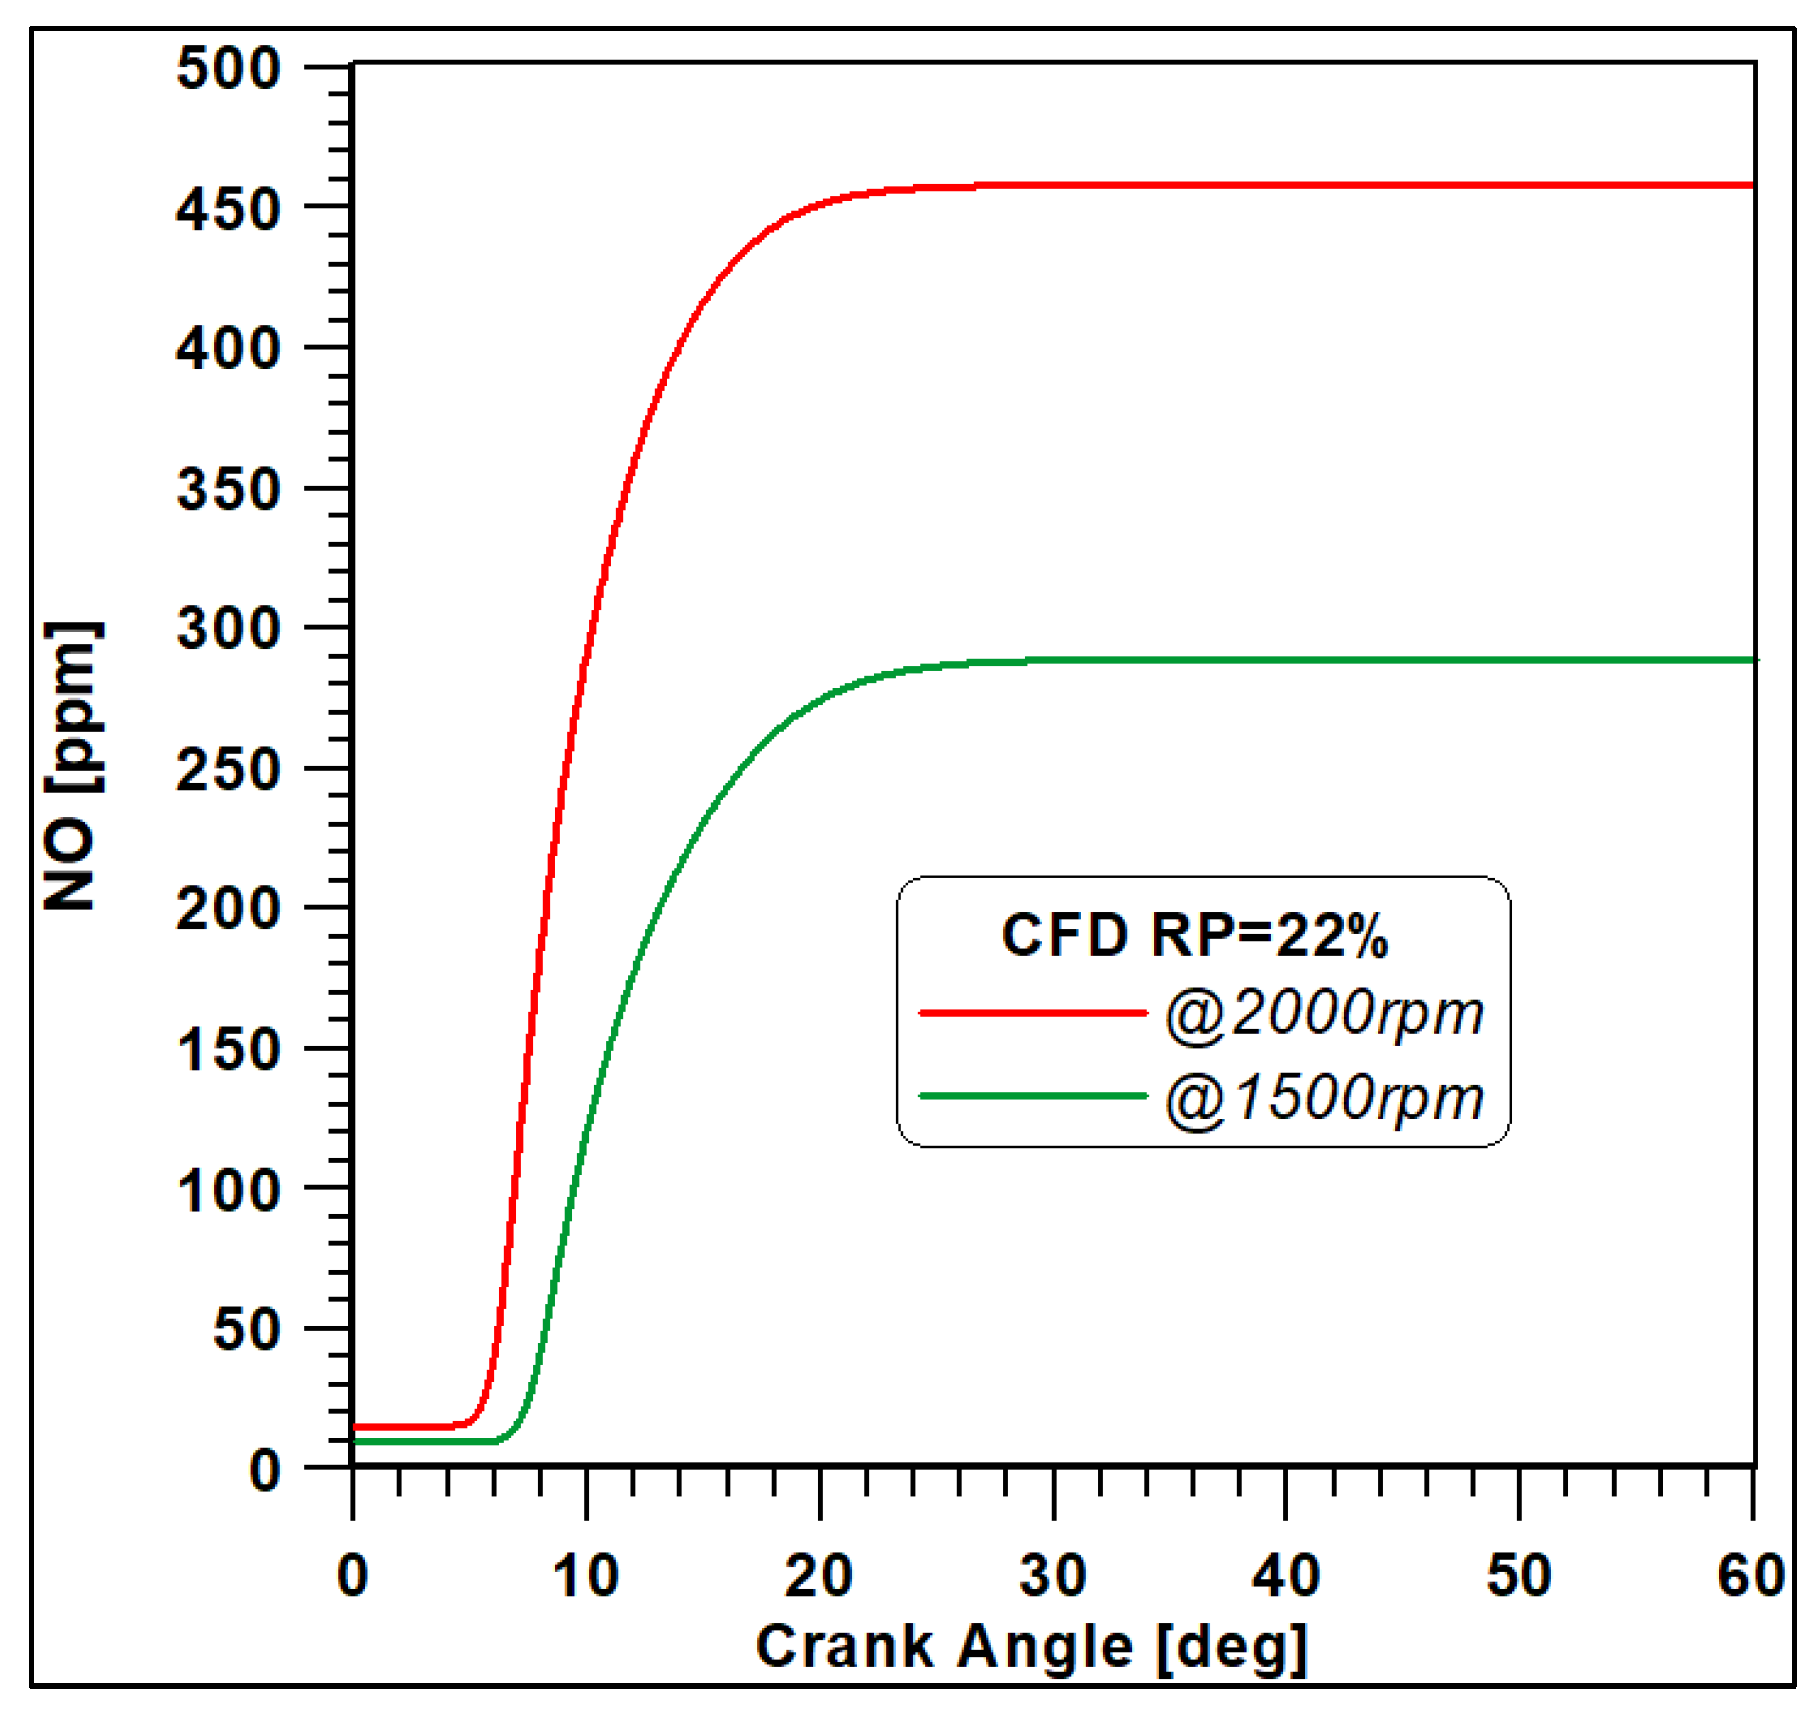
Figure 12 displays that higher concentrations of nitric monoxide are produced in the 2000 rpm case. This is mainly due to the wider zones at achieved a higher temperature in this context, as previously illustrated in
Figure 6.
3.2. Case#2: RP = 18% vs. 22% at 2000 rpm
In this sub-section, the sensitivity of the Li and Williams mechanism to different methane equivalence ratios is tested by comparing the RP = 22% at 2000 rpm, which was previously analyzed, with a case operating at the same engine speed but with a reduced percentage of energy due to methane, such as RP = 18%. In order to explain the results, the fact that that the different premixed ratios were obtained with a methane addition to the baseline diesel oil amount should be considered. This choice is substantially different from the more common dual fuel strategy, which consists of a diesel oil substitution with methane.
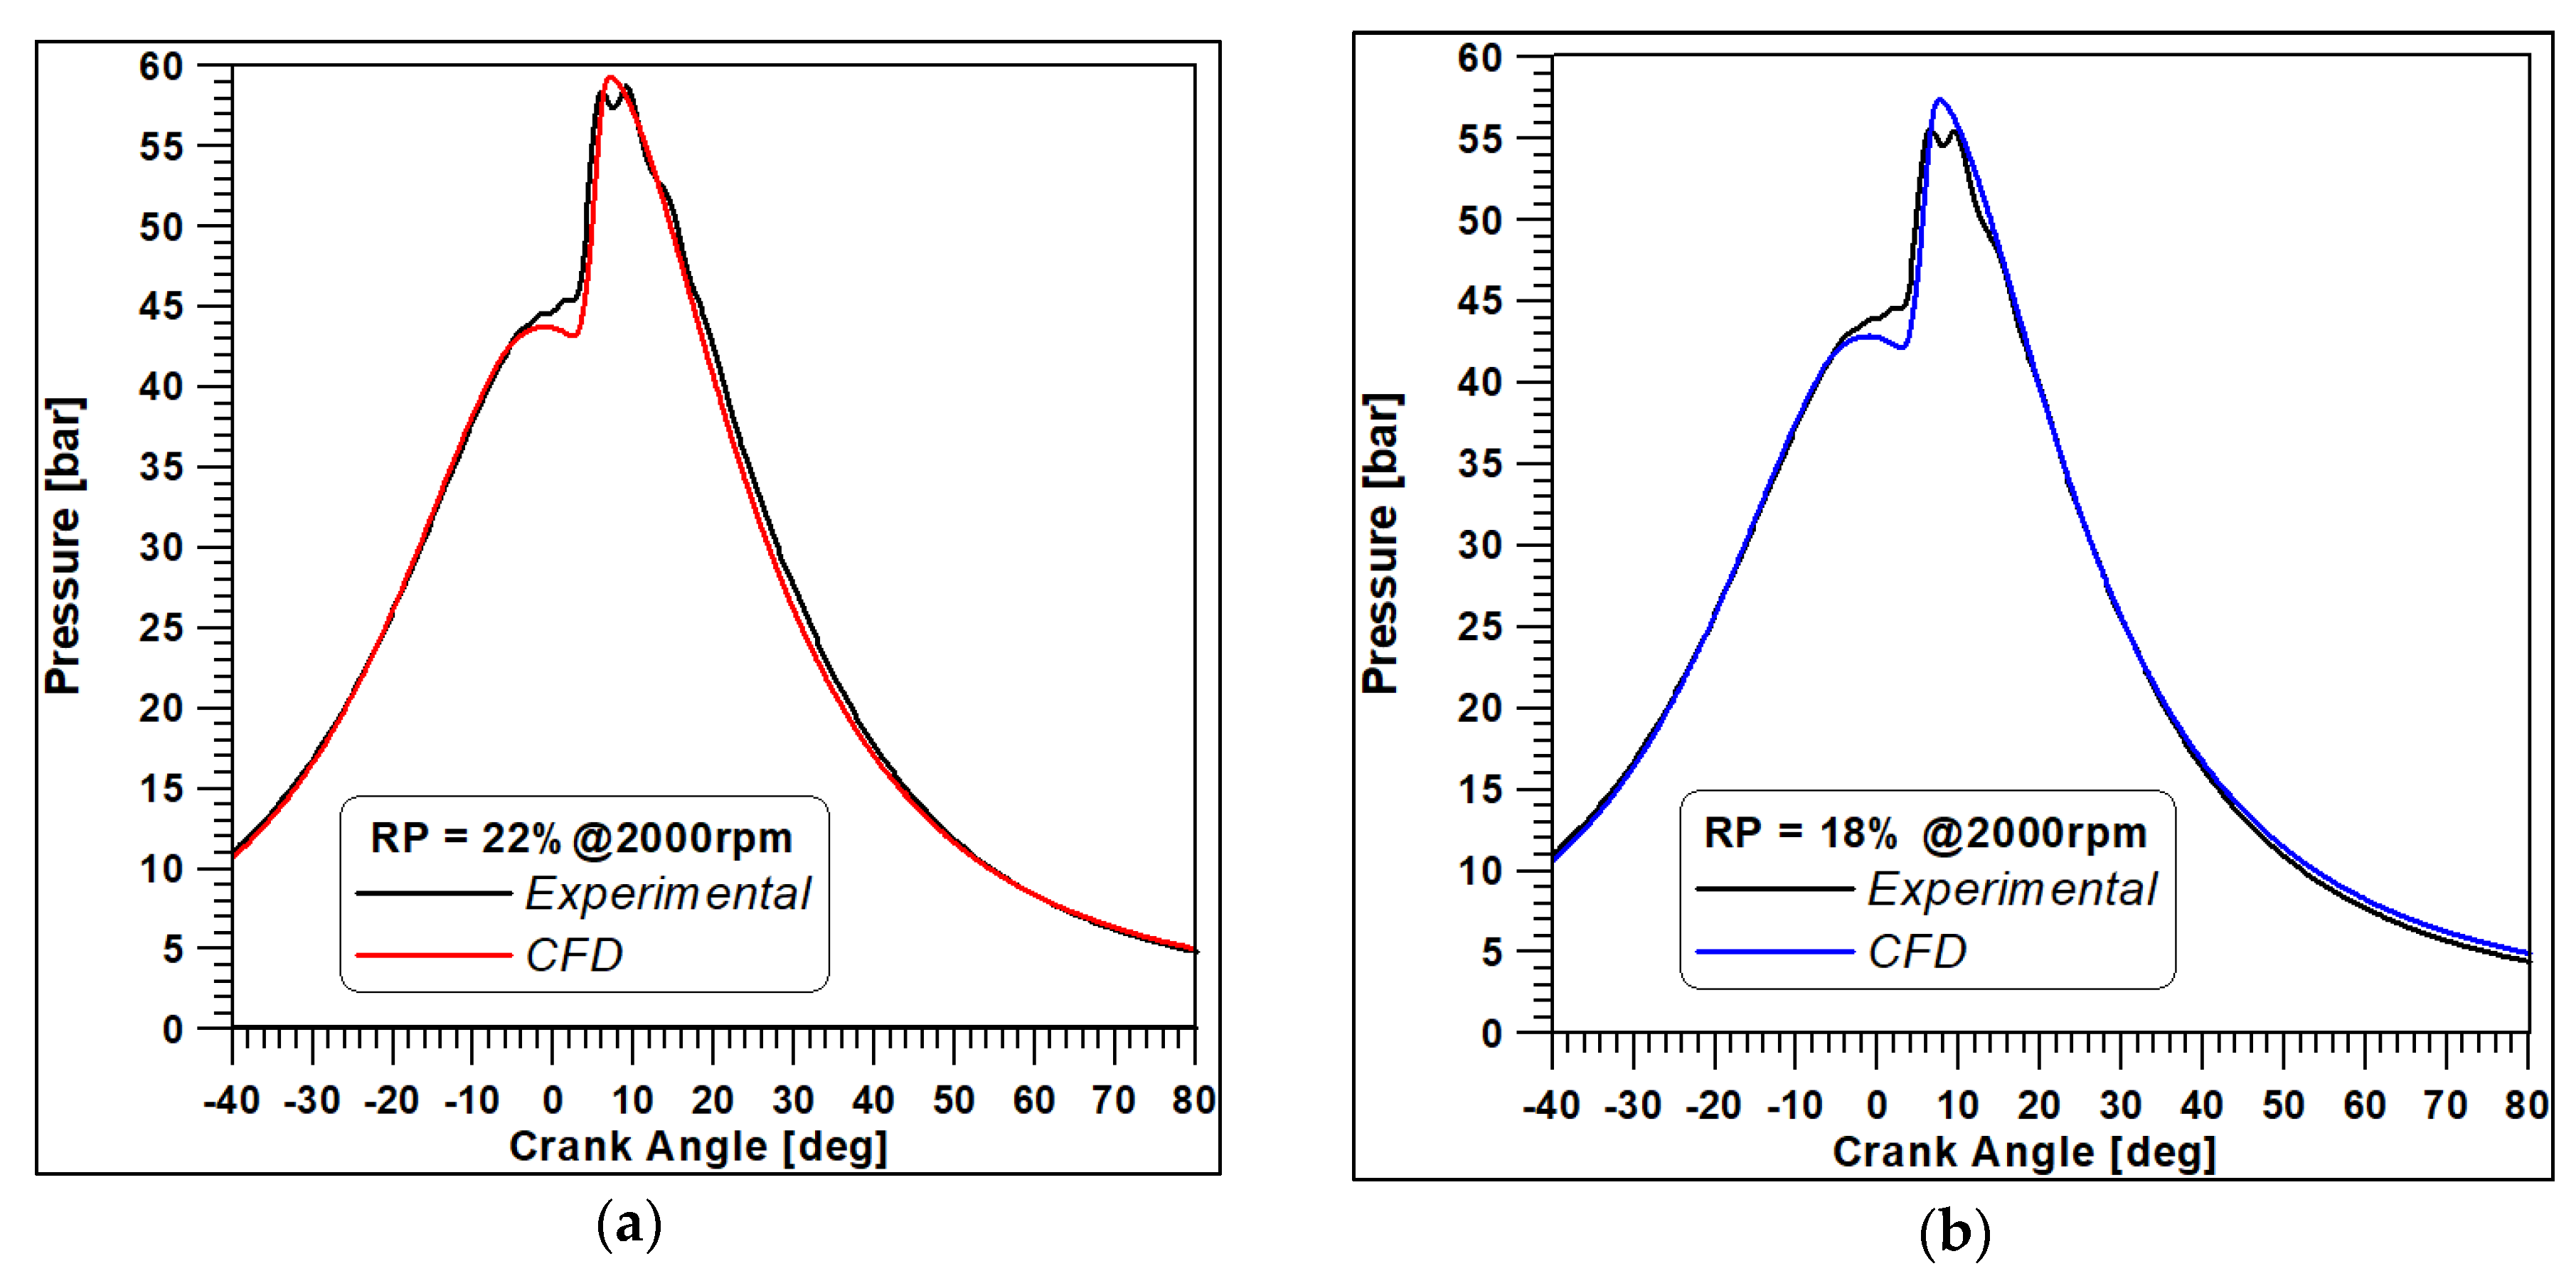
The pressure curve for RP = 18% displays a slight decrease with respect to the RP = 22% case, as plotted in
Figure 13. This was expected since a reduced amount of fuel, i.e., methane, was introduced inside the engine. Nevertheless, if compared to the 1500 rpm case, which was previously illustrated in
Figure 5, the pressure level is higher during the entire combustion process. This means that the engine speed and the start of injection have a more important effect than the amount of fuel on combustion.
Temperature contours in
Figure 14 only show slight differences since combustion is mainly driven by diesel oil, and the start of injection and the amount of liquid fuel is the same. For the same reason,
Figure 15a also does not depict significant differences in n-dodecane consumption. Additionally, in the same figure, it is possible to notice that the combustion of methane is activated by diesel vapour ignition. A better overview of the methane mass fraction, reported in
Figure 15b, shows that the different RP values result in different compositions of the charge trapped in the cylinder. As matter of fact, the higher concentration of methane in the RP = 22% case provokes higher emissions of unburned hydrocarbons, despite the fact that the RP = 18% case is characterized by a slower consumption of methane, as confirmed by
Figure 16. As previously mentioned, these test cases are characterized by an extremely low equivalence ratio that locate the mixture outside the flammability limits of methane. However, by comparing the methane consumption of RP = 18% with RP = 22% at 1500 rpm, it is possible to observe that increasing the amount of methane is necessary to promote the development of an efficient gaseous fuel combustion.
Moreover, as previously mentioned, the Li and Williams reaction mechanism activates a weak methane oxidation before combustion, which also occurs with the reduced amount of methane in the RP = 18% case (
Figure 15b). All of the above considerations are evidenced in the methane distributions at different crank angles, which are illustrated in
Figure 17.
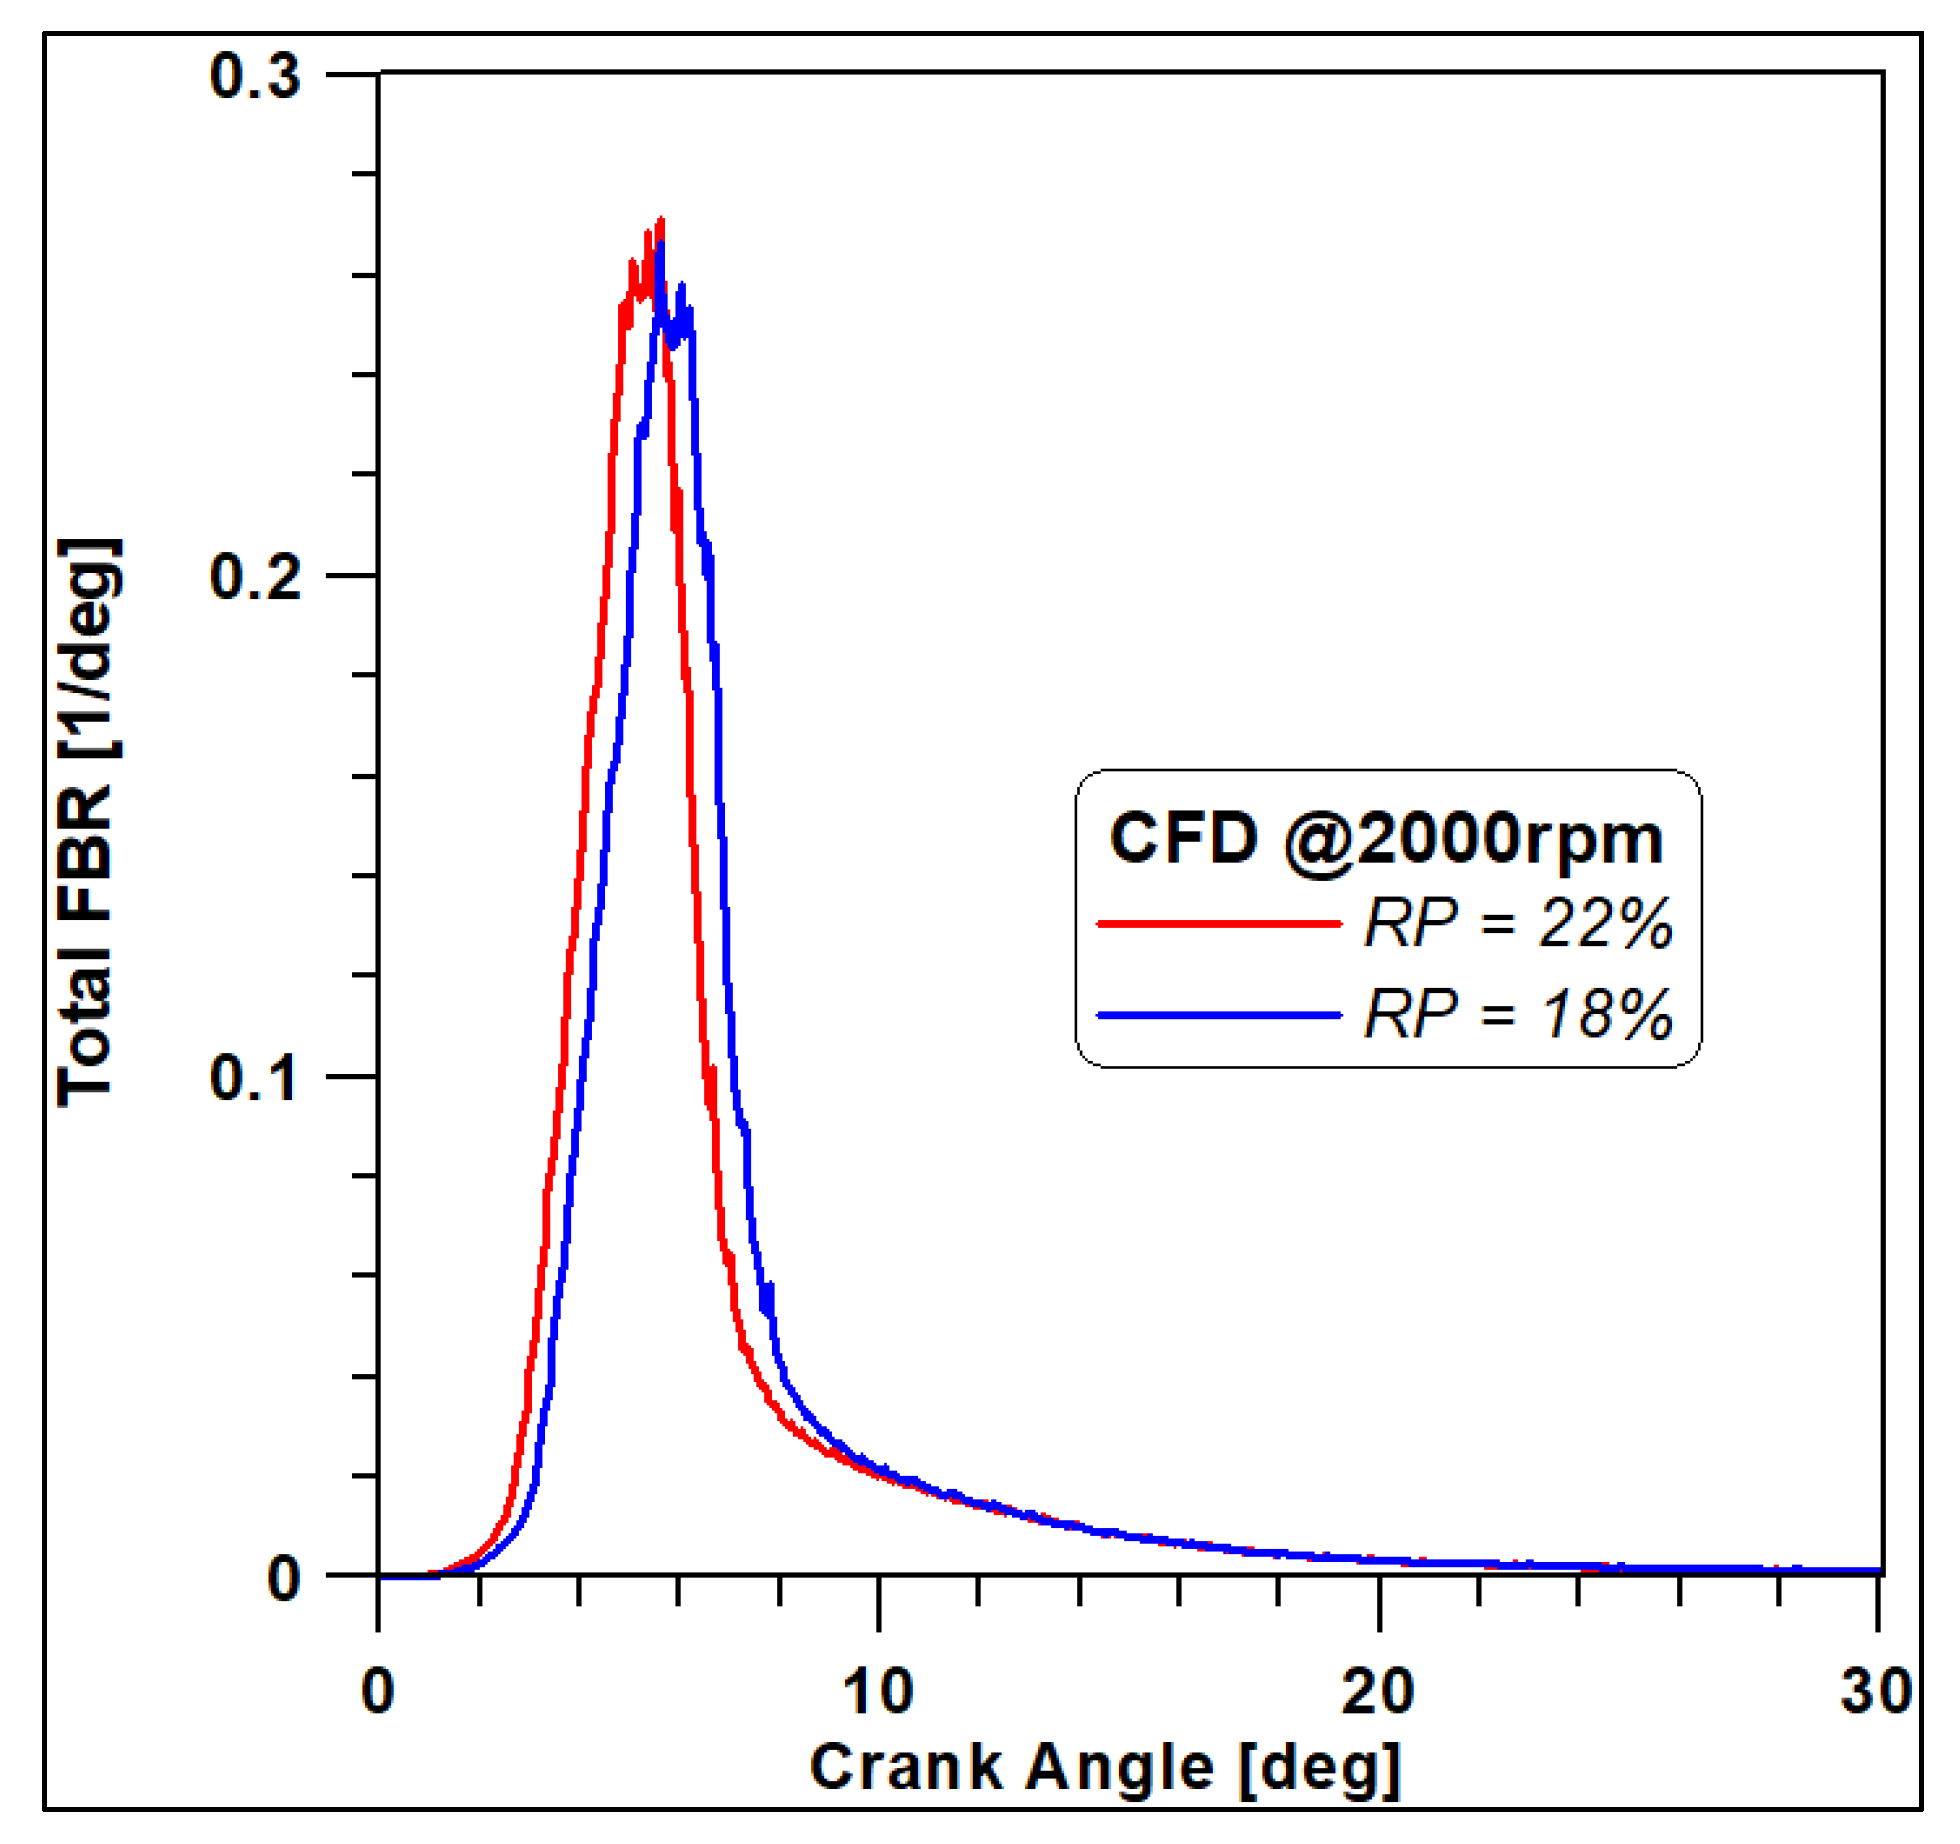
The total fuel burning rates (FBR) in
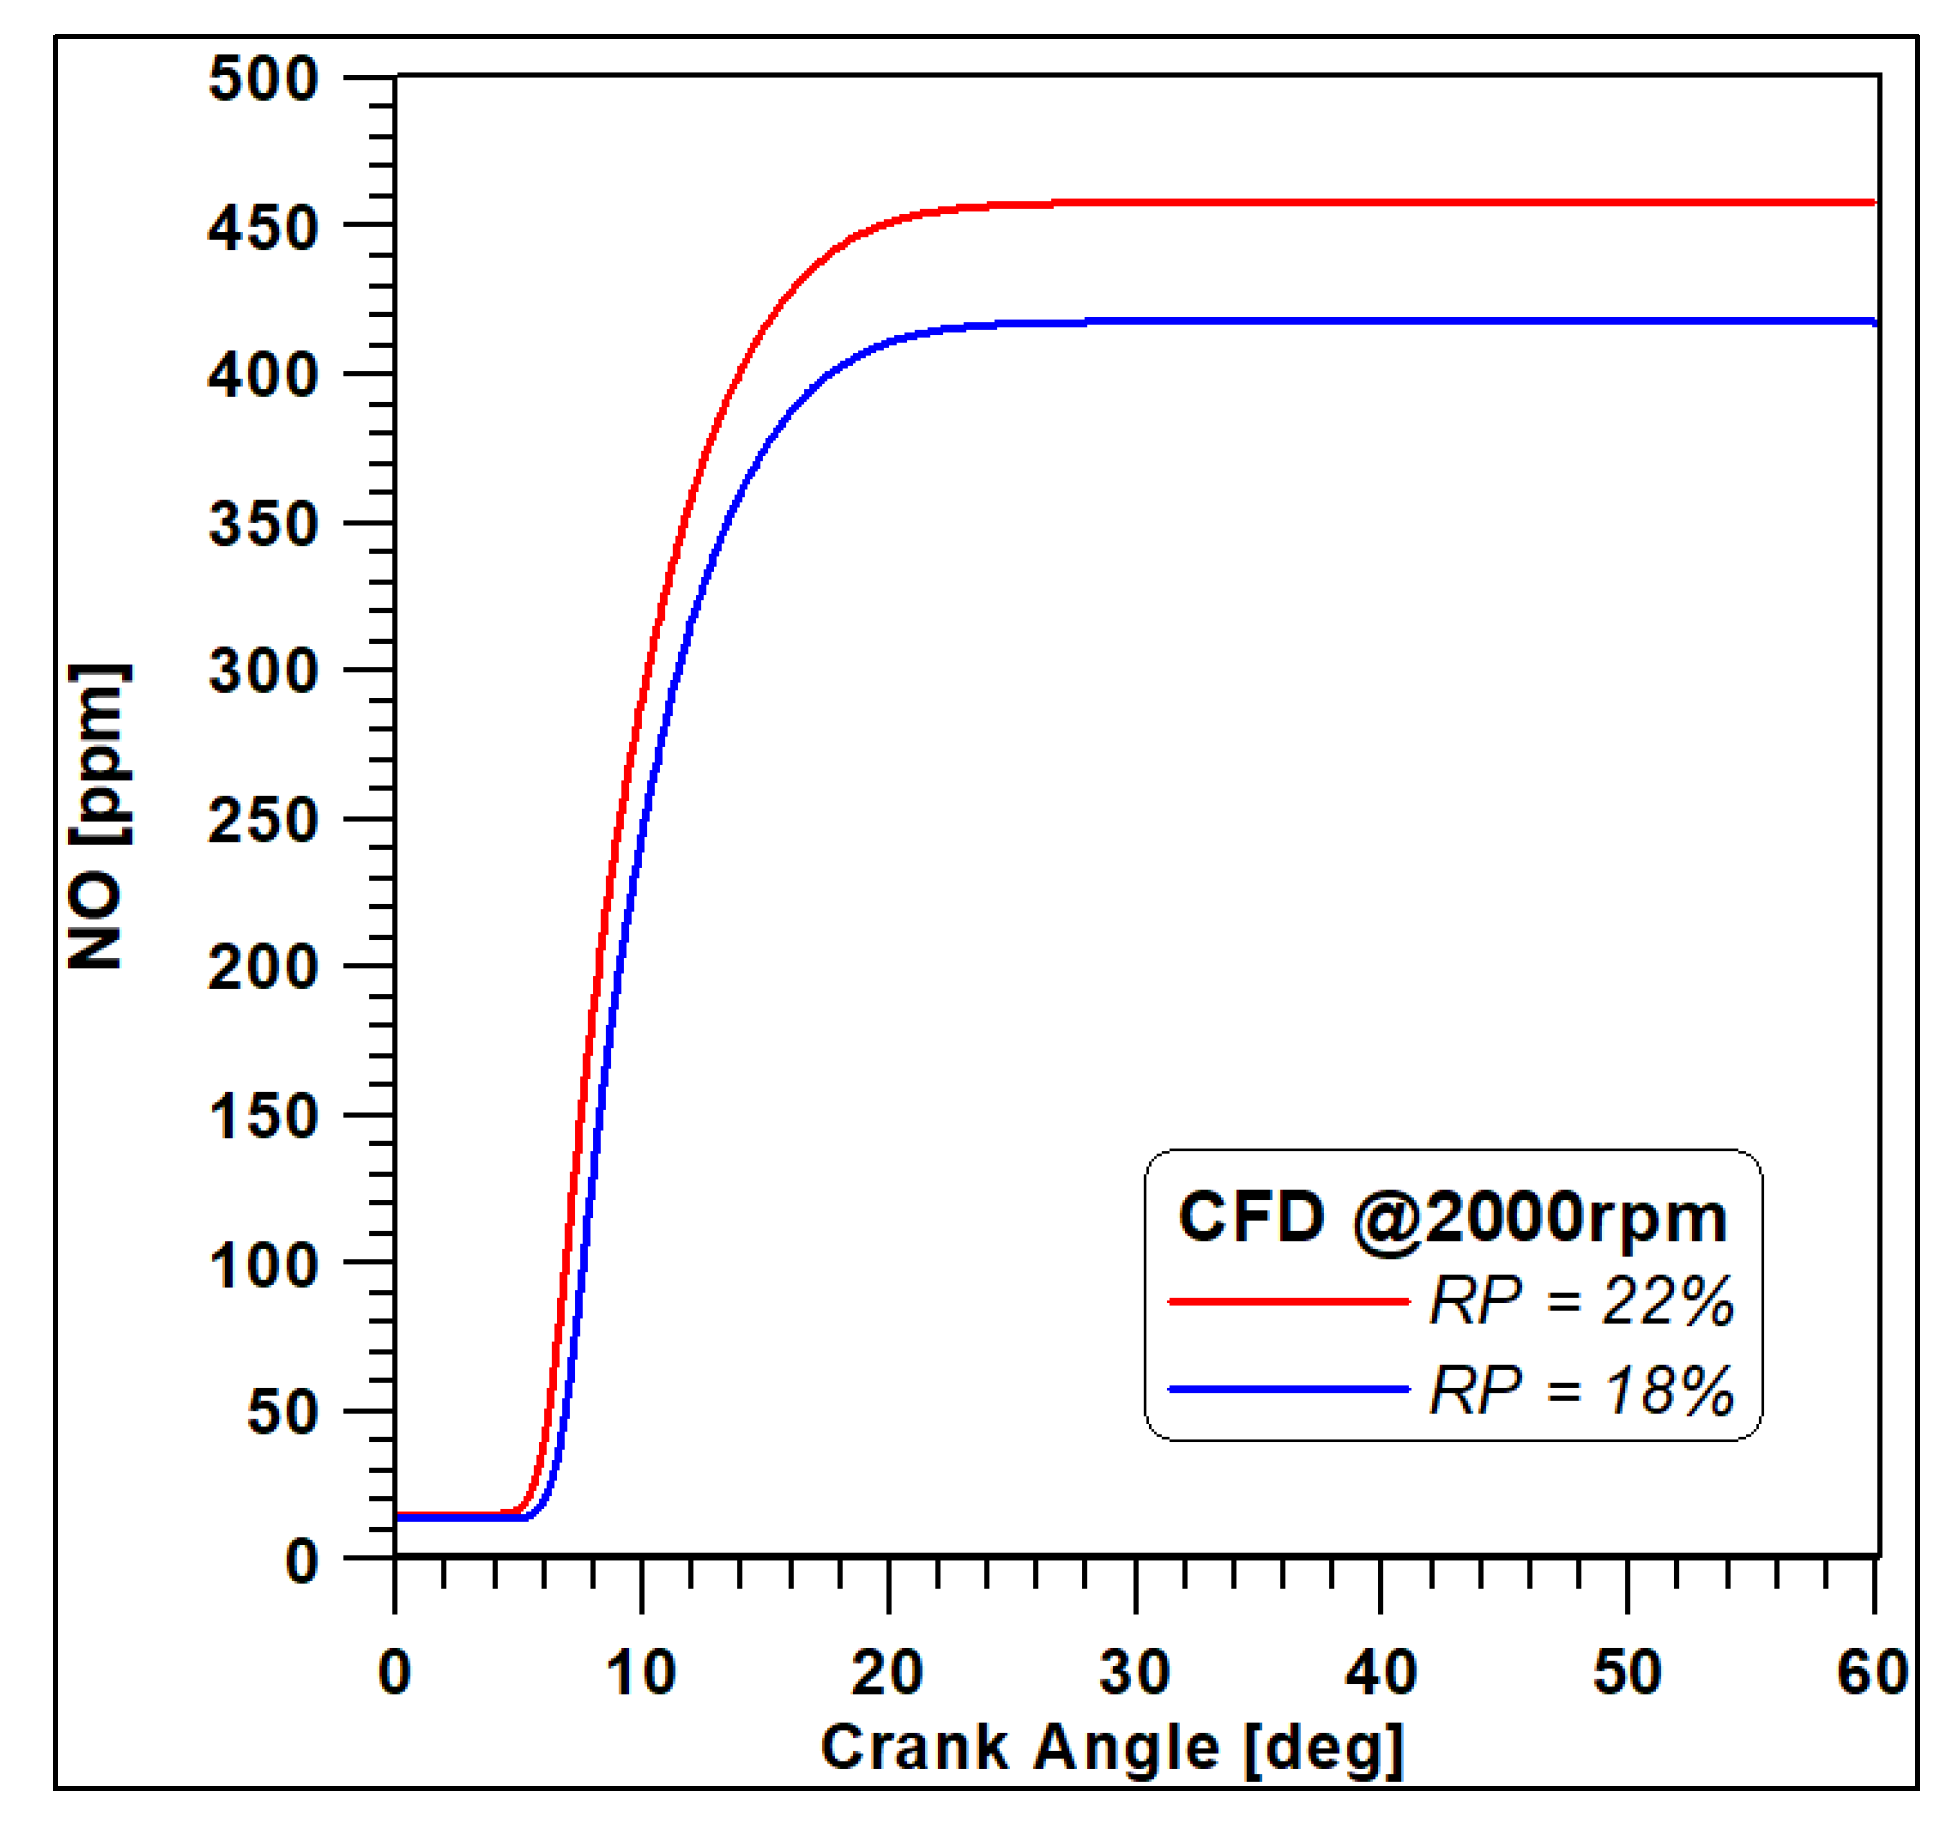
Figure 18 show a slightly lower and delayed peak in the RP = 18% case, which can likely be explained by the reduced amount of methane introduced in the cylinder. For the same reason, the mass fractions of nitric monoxide in
Figure 19 show that the reduction of methane in the RP = 18% case causes a decrease of this pollutant species in the exhaust.
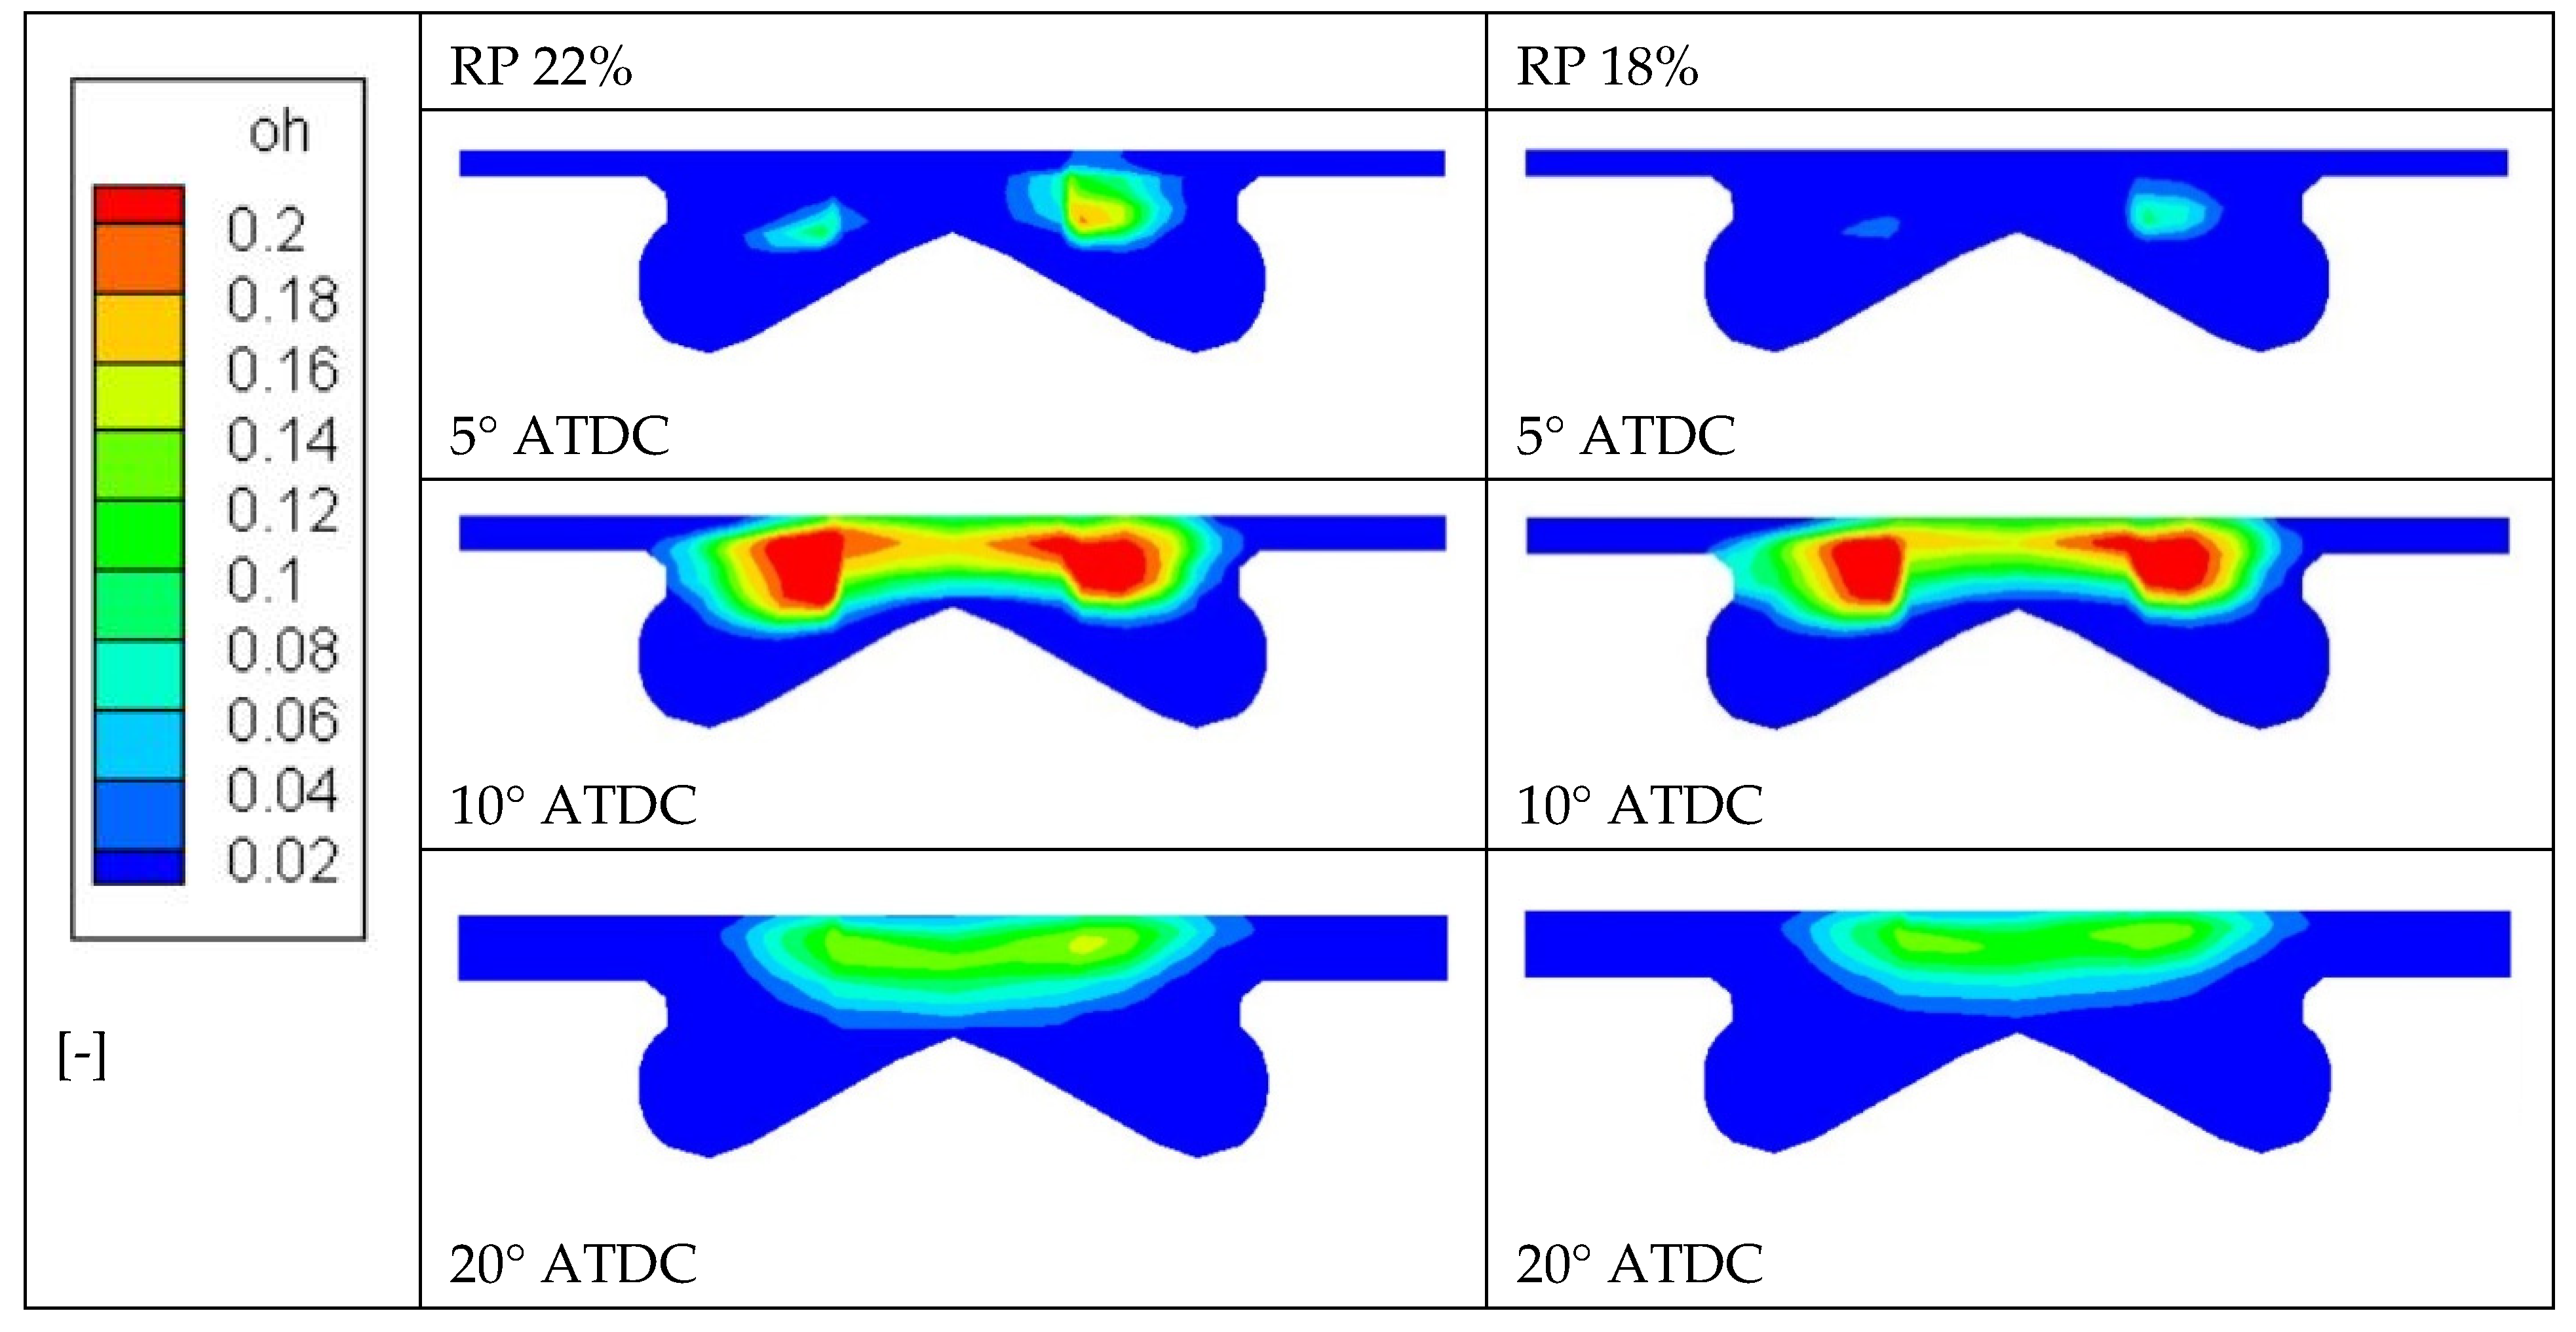
Finally, the OH radical is an important species in the Li and Williams kinetic mechanism (
Table 3), but this new scheme only describes the methane ignition process. Moreover, the oxidation of the gaseous fuel is activated by the first three reactions (RR3 to RR5) that do not present this radical among the products; only reaction RR5 involves OH as a reactant resulting from the equilibrium equations e.4 and e.5 from
Table 4. The contours of the OH mass fractions in
Figure 20 illustrate that this radical is located in zones at higher temperatures previously already discussed in
Figure 14, confirming that this species may represent an important marker of the intensity of combustion. As also suggested by
Figure 21, higher concentrations are observed in the RP = 22% case because OH is only present in the kinetic mechanism of methane, and it is expected to be more present in cases with a higher methane supply. Moreover, it is interesting to notice how the distributions present the same shape: the two cases being performed at the same engine speed confirm that the same swirl motion has been established inside the cylinder, show the involvement of the same regions in the oxidation process.
4. Experimental Activity
The experimental activity was conducted on a single cylinder, four-stroke, direct injection, diesel engine, with a multi valve production head of a 2 L engine. The engine is able to run continuously.
Table 7 reports the specifications of the engine and the injection system.
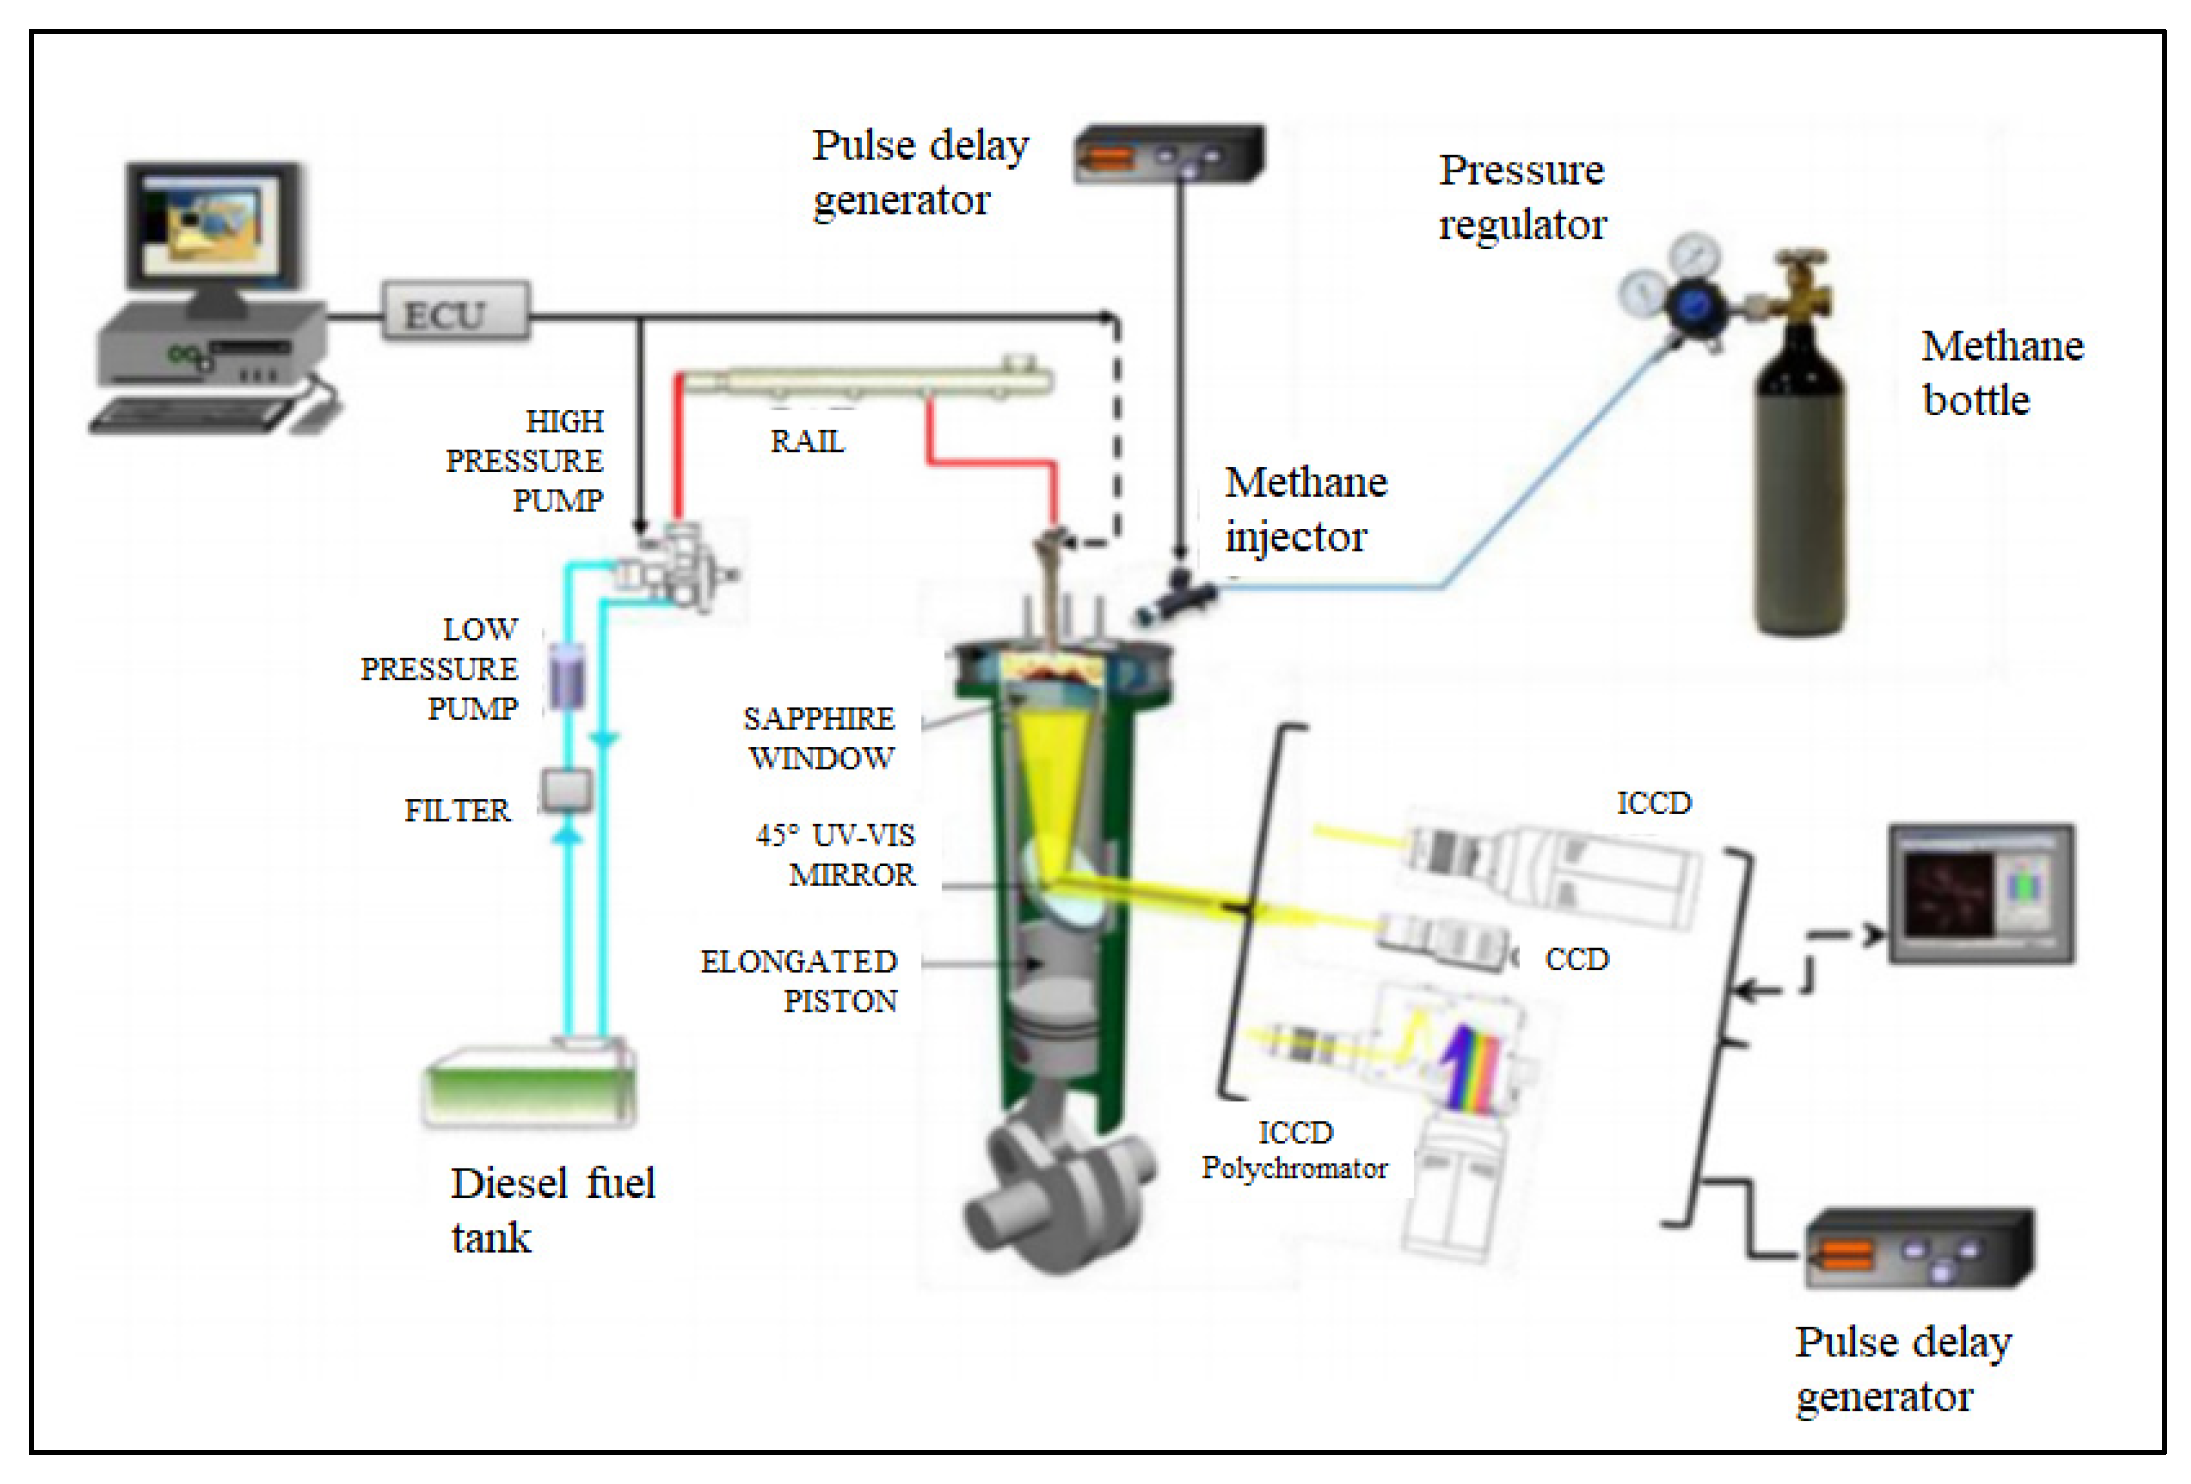
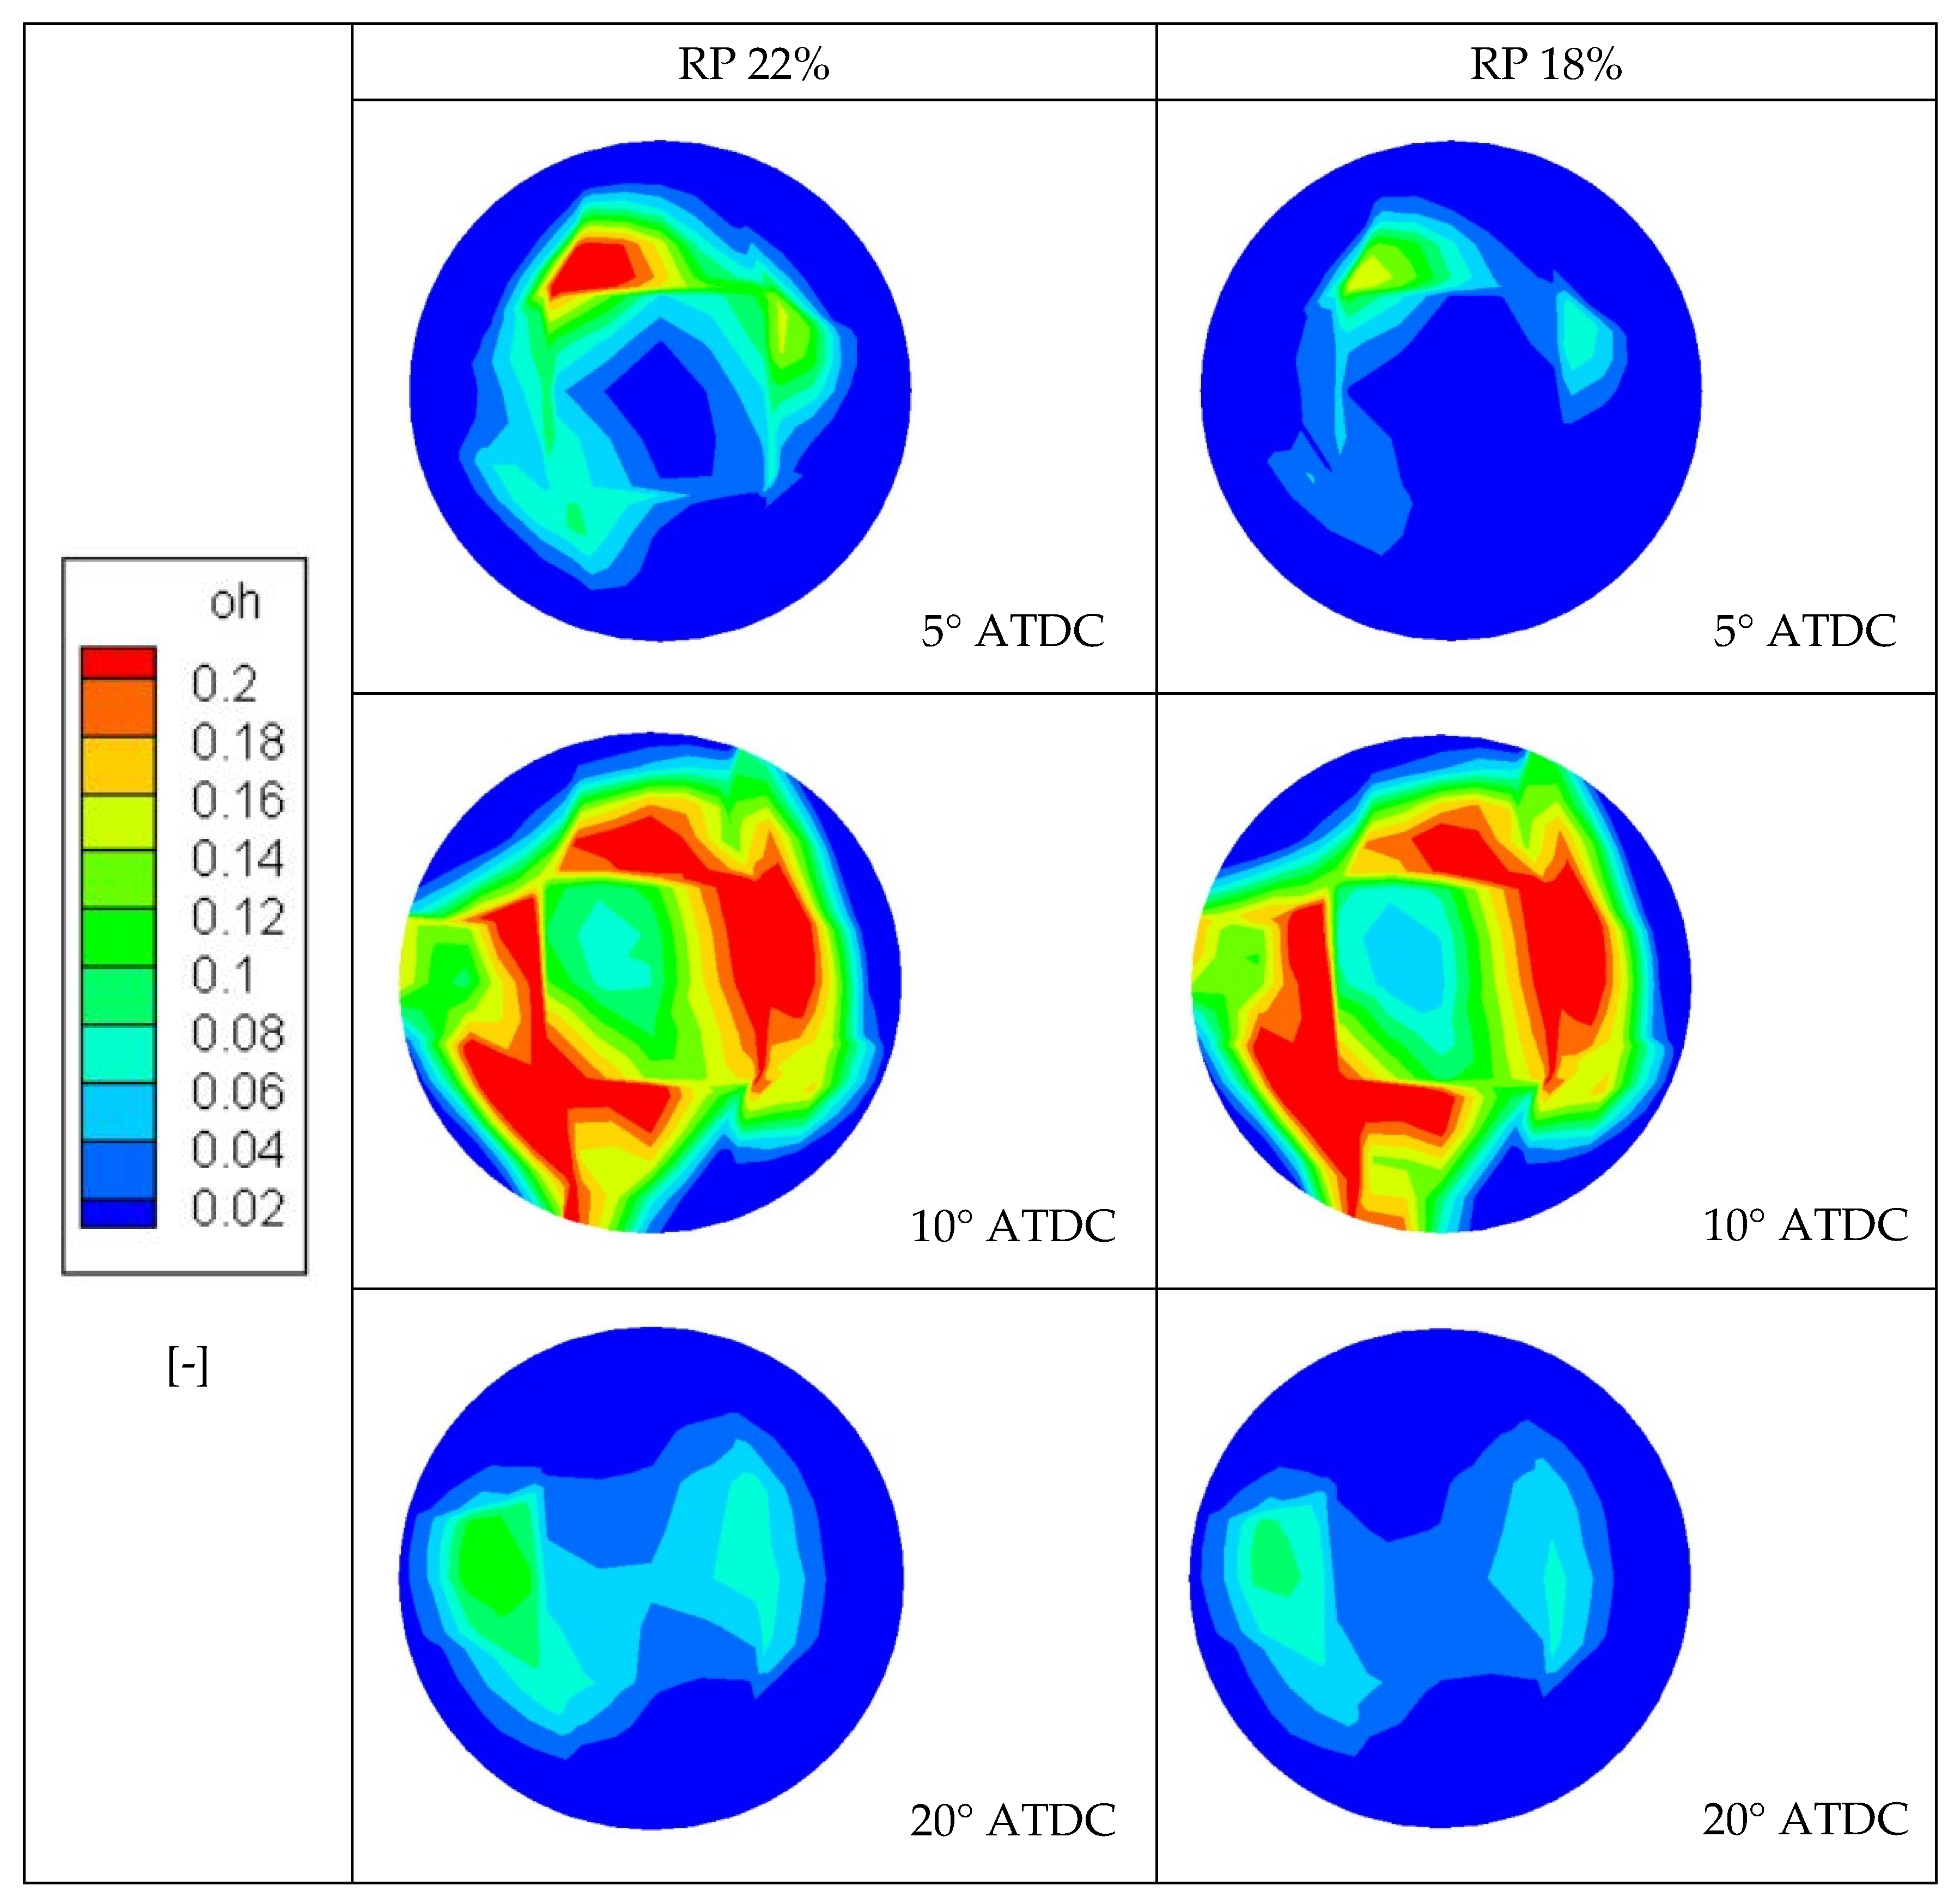
The production head was modified for the single cylinder research engine with particular attention to the water-cooling and lubricating oil head ducts. The transparent engine utilized a classic extended piston with piston crown window with a diameter of 46 mm, which was made of sapphire. Using a 45° UV–VISible mirror inside the extended piston, a full view of the combustion bowl was detected (
Figure 22).
The engine was equipped with common rail injection system capable of a maximum injection pressure of 1800 bar. The injector with a solenoid valve was centrally located, had the same cylinder axis, and mounted a single guide microsac nozzle. The nozzle had seven holes that were symmetrically distributed, and each hole had a convergent-divergent shape. The number of injections (up to 5) per cycle, the start of injection (SOI), and the energizing timing of injection (ET) as well as the dwell time between the consecutive injections were managed by a fully flexible electronic control unit (ECU). In
Table 7, the injection system specifications are reported. On the other hand, the production intake manifold of the engine was modified to add and set an electronic injector that is commonly used in modern port fuel injection (PFI) systems of methane engines. It was applied directly into the non-swirl actuated intake port, where it injected pure methane fuel. The PFI system was fed by a compressed methane bottle at a working pressure of 5 bar. A delay unit synchronized with the engine shaft encoder was used to control methane injection in terms of SOI and ET. The delay unit generated a pulse that managed the PFI injection timing. The desired amount of methane fuel was managed through the pulse width for each injection event.
In the experimental apparatus, sensors were installed to control the following parameters over time: the engine temperature, the intake air temperature and pressure, and the exhaust gas temperature and pressure. The Sensyflow FMT500-IG was used to measure the air mass flow rate. More details and specifications of the engine are reported in ref. [
5].
For each operating condition that was investigated, the cylinder pressure and the drive injector current signals were digitalized and recorded every 0.2 crank angle (approximately) degrees. The average in-cylinder pressure was calculated from 200 consecutive combustion cycles. The heat release rate was calculated from the averaged pressure data via the typical first law and perfect gas analysis [
25]. During the test, the engine was stopped, and the piston window was cleaned.
Table 8 shows the properties of the diesel and methane fuels used in the tests.
Figure 22 displays the experimental set-up used for the digital imaging analysis to perform the natural emission measurements of the flame intensity in the ultraviolet (UV) and visible (VIS) range, respectively. Spectroscopic measurements were conducted by means of a gated intensified CCD (ICCD) camera and a spectrograph at high sensitivity in the UV–VIS range.
Table 9 shows the prominent spectral peaks of the intermediates and products of combustion in the UV and VIS regions [
26].
The spectroscopic measurements detected the temporal evolutions and the spatial distribution of the UV–VIS emission light of the typical combustion species. The images were recorded with an ICCD camera. In particular, the OH spatial distribution was investigated by applying a band pass filter at the 310 nm wavelength in front of the objective lens [
26]. The filter had a band width of +/− 5 nm. Only one image per engine combustion cycle was acquired with a step of approximately 1°. The ICCD camera synchronization with the engine was obtained by means of a delay unit. In particular, the images and spectra were detected with an exposure time of 55 and 41 μs. They correspond to a 0.5°crank angle at engine speeds of 1500 and 2000 rpm, respectively.
5. Experimental Validation
In this last section, a comparison of the numerical results with the experimental measurements is necessary to evaluate the reliability of the Li and Williams model to describe methane ignition in different operating conditions.
The calculated in-cylinder pressures reported in
Figure 23 show a fair compliance with the experimental measurements in both the RP = 22% and 18% cases, especially regarding the compression and expansion phases. Besides the divergence near the TDC, the rise to the peak and the peak are also correctly detected both in terms of the crank angle and the pressure level. However, it is important to highlight an increase in pressure near the top dead center before the real rise to the peak was detected in the experimental activity. This detail could be due to the low temperature reactions already evidenced in the diagrams of the methane mass fractions (
Figure 7b and
Figure 15b). This means that the Li and Williams model seems capable of simulating the correct methane ignition, although the intensity of these reactions cannot be observed in the pressure curve, and perhaps this is not sufficient to provoke the pressure increase near the TDC.
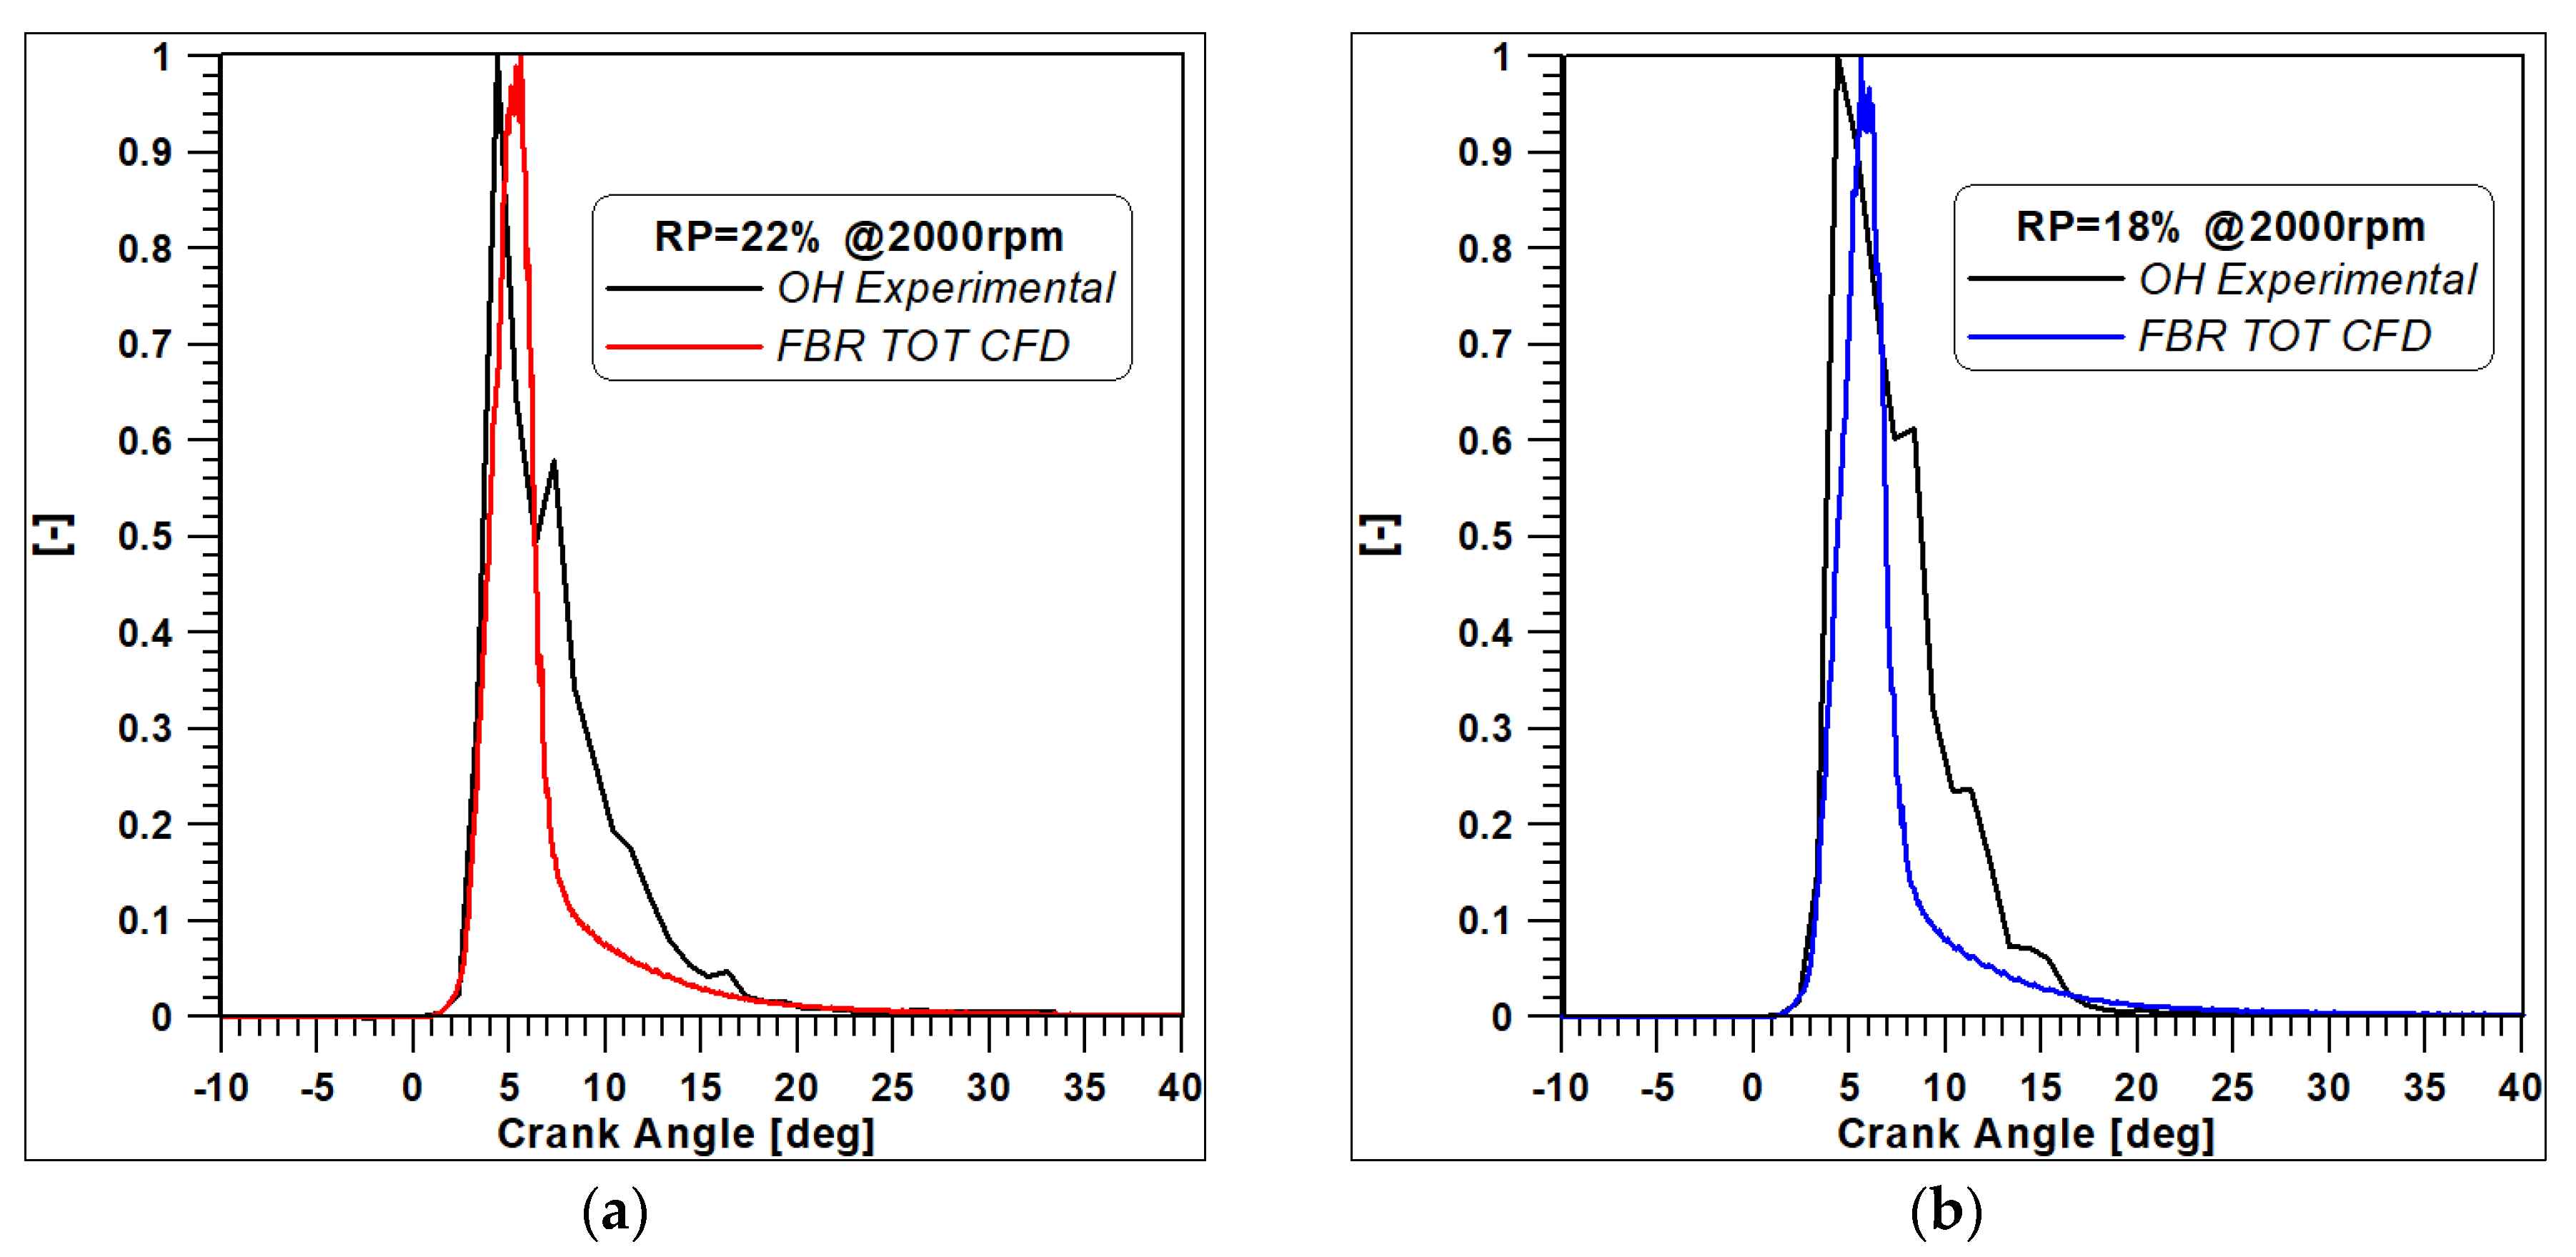
Figure 24 compares the calculated total fuel burning rate and the OH measured during the experimental activity, both non-dimensional, since they are two different variables. Nevertheless, it should be noted that the start of FBR perfectly matches the start of OH radical formation. It is likely that the low temperature reactions do not include the formation of this radical, as is already highlighted in
Figure 8. In addition, the peaks of experimental OH are anticipated at only about 1 crank angle degree with respect to the peaks of fuel burning rates. Since the Total FBR takes the consumption of both fuels into account, this may be due to the full activation of methane combustion. Finally, the duration of both combustion and OH radical presence shows a strong relationship. Therefore, based on these assumptions, it is possible to affirm that the hydroxyl radical OH can represent an important signal for the description and development of dual fuel combustion.
6. Conclusions
Supplying diesel engines with natural gas in dual fuel mode allows the revaluation of this well-established technology by exploiting the advantages of a gaseous fuel to meet environmental requirements. However, a correct understanding and description of the combustion process are necessary for the research of optimization strategies in energy conversion that avoid emissions of unburned hydrocarbons caused by the incomplete oxidation of natural gas and the consequent improper exploitation of its energy content.
For these reasons, the effects of the engine speed on dual fuel combustion development are analyzed via a CFD based approach on a light duty dual fuel diesel engine supplied with an increasing amount of methane. The injection of diesel oil is unchanged, except for the start, which has to be anticipated when increasing the speed regime. In particular, two engine speeds (1500 and 2000 rpm) and two different methane energy supplies (RP = 22 and 18%) were investigated. Moreover, the sensitivity of the Li and Williams model for the description of methane ignition has been tested when the engine speed varies the conditions of premixing formation inside the cylinder.
Results showed that the swirl and tumble intensities and the specific dissipation rate increased proportionally to the engine speed. These variables strongly affect the turbulence–chemistry interaction by improving the atomization, mixing of reactant species, and chemical kinetics, leading to higher pressure levels and temperature peaks, even when a lower amount of methane was introduced in the cylinder. Indeed, in the 1500 rpm case, the diesel vapour started to burn later, and a slower combustion was observed with respect to the 2000 rpm case. Additionally, the speed increase can be beneficial for methane combustion, as a higher burned methane fraction was obtained in the 2000 rpm case. In addition, a lower presence of methane at the end of combustion at 2000 rpm was observed, as was a different mass fraction level of methane inside the cylinder as the intake valve closed, demonstrating that a different charge formation was estimated during the mass exchange phase through the valves.
The Li and Williams model proved its capability to describe the first phase of methane oxidation by detecting a slight decrease before real ignition due to the activation of low temperature reactions at 2000 rpm.
Finally, a validation of the simulations was achieved through a comparison with the experimental measurements obtained from an experimental activity conducted on an optically accessible single-cylinder research engine. In particular, the spatial distribution and temporal evolutions of the UV–VIS emission allowed the visualization of the OH radical, which represents an important marker of the intensity and the development of combustion, which was confirmed by the numerical outcomes in terms of the total fuel burning rate.


