
A Novel Control Strategy on Stable Operation of Fuel Gas Supply System and Re-Liquefaction System for LNG Carriers


Abstract
:1. Introduction
2. LNG Processes and Control Strategy
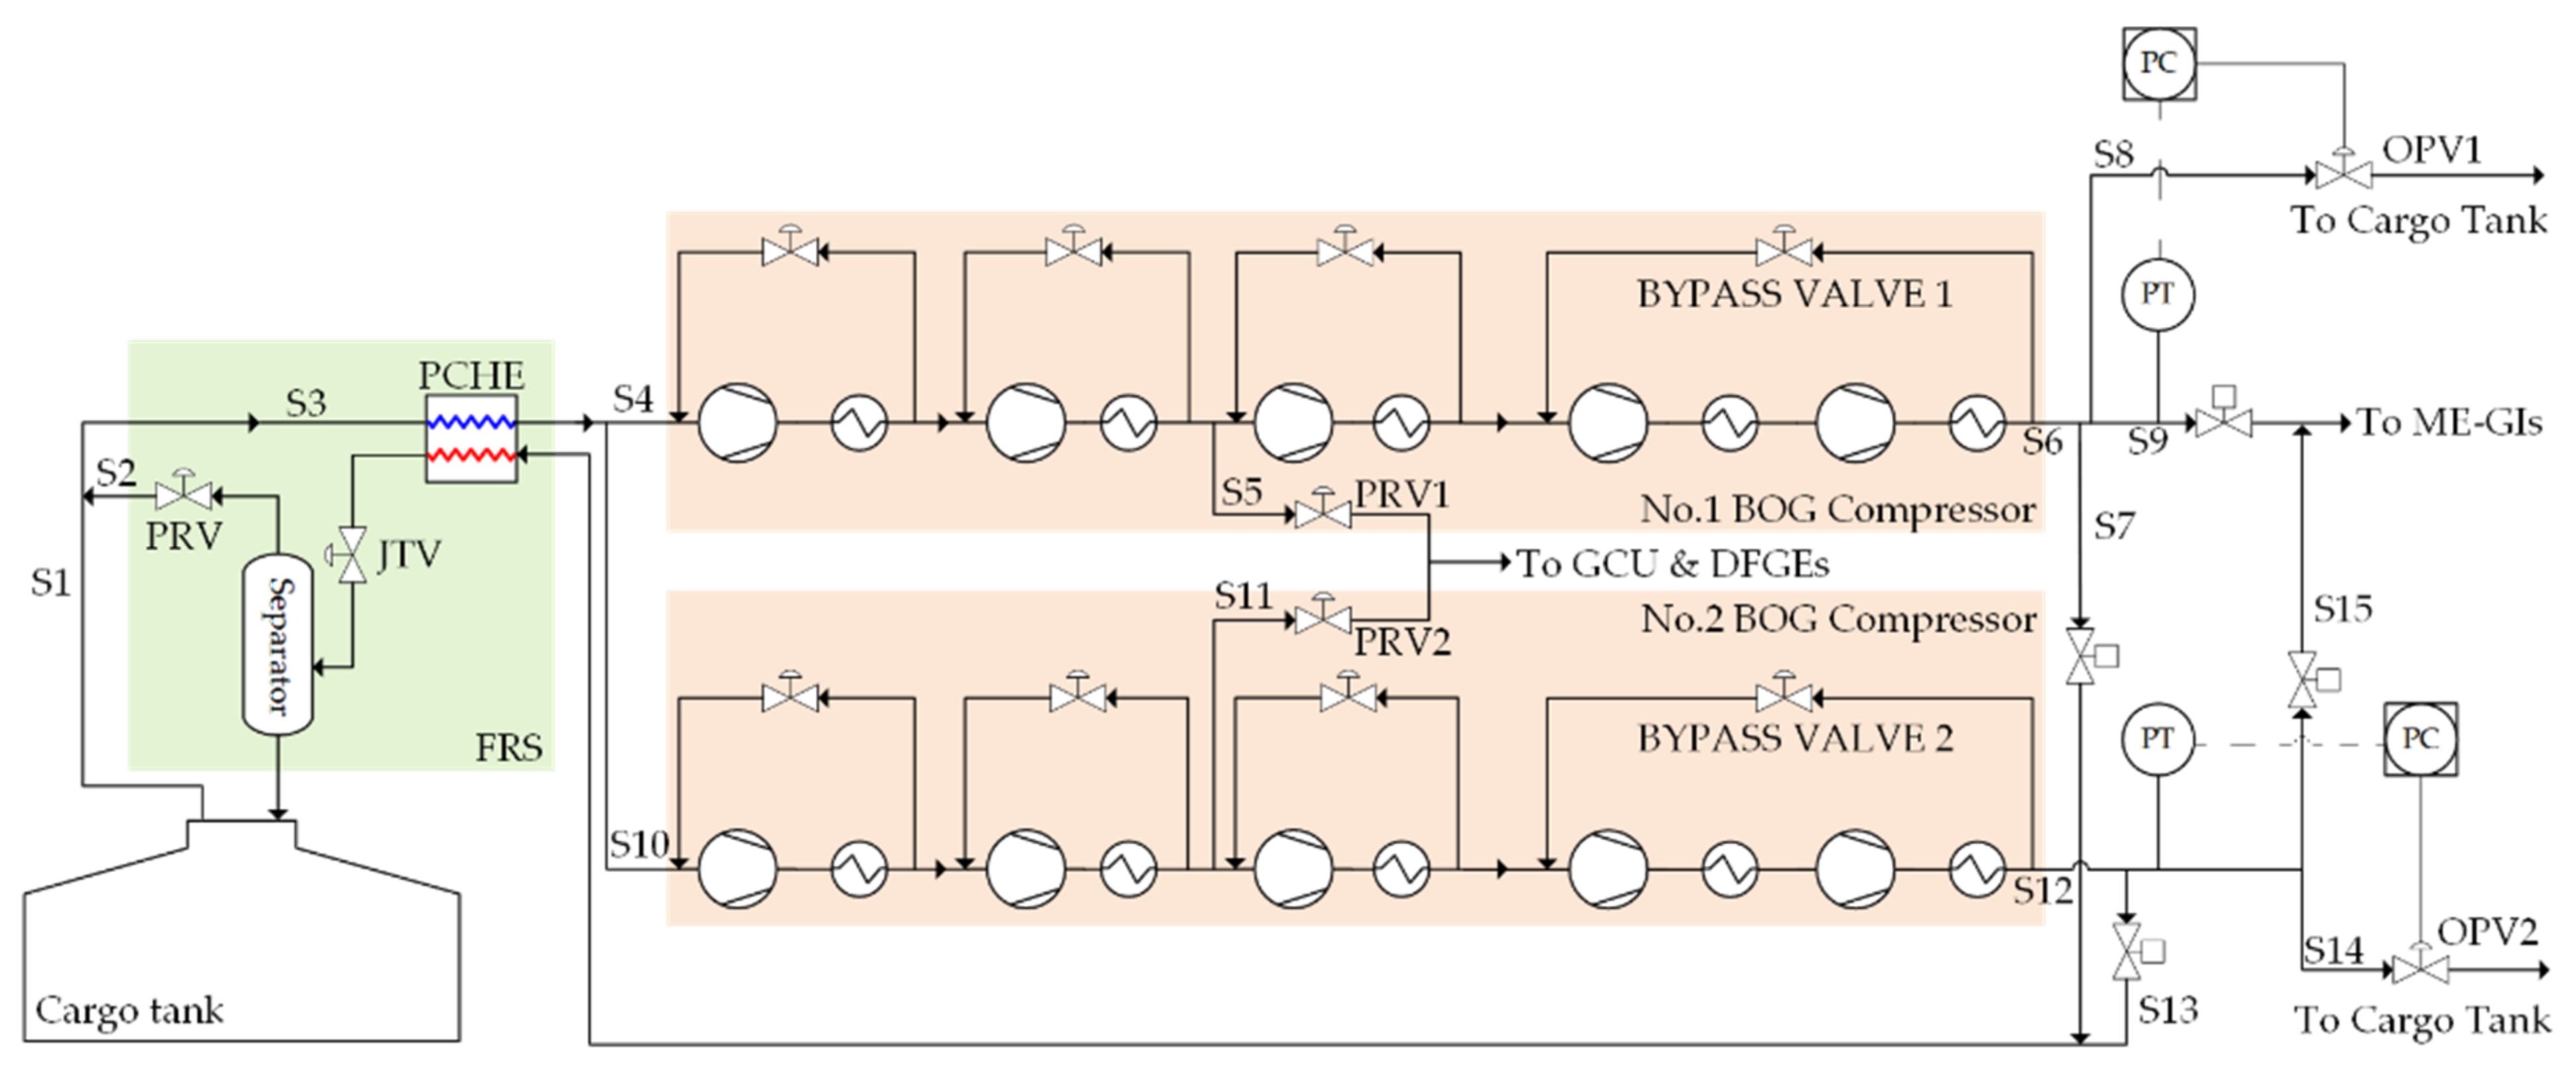
2.1. Case A: Typical Fuel Gas Supply System (FGSS) with Full Re-Liquefaction System (FRS)
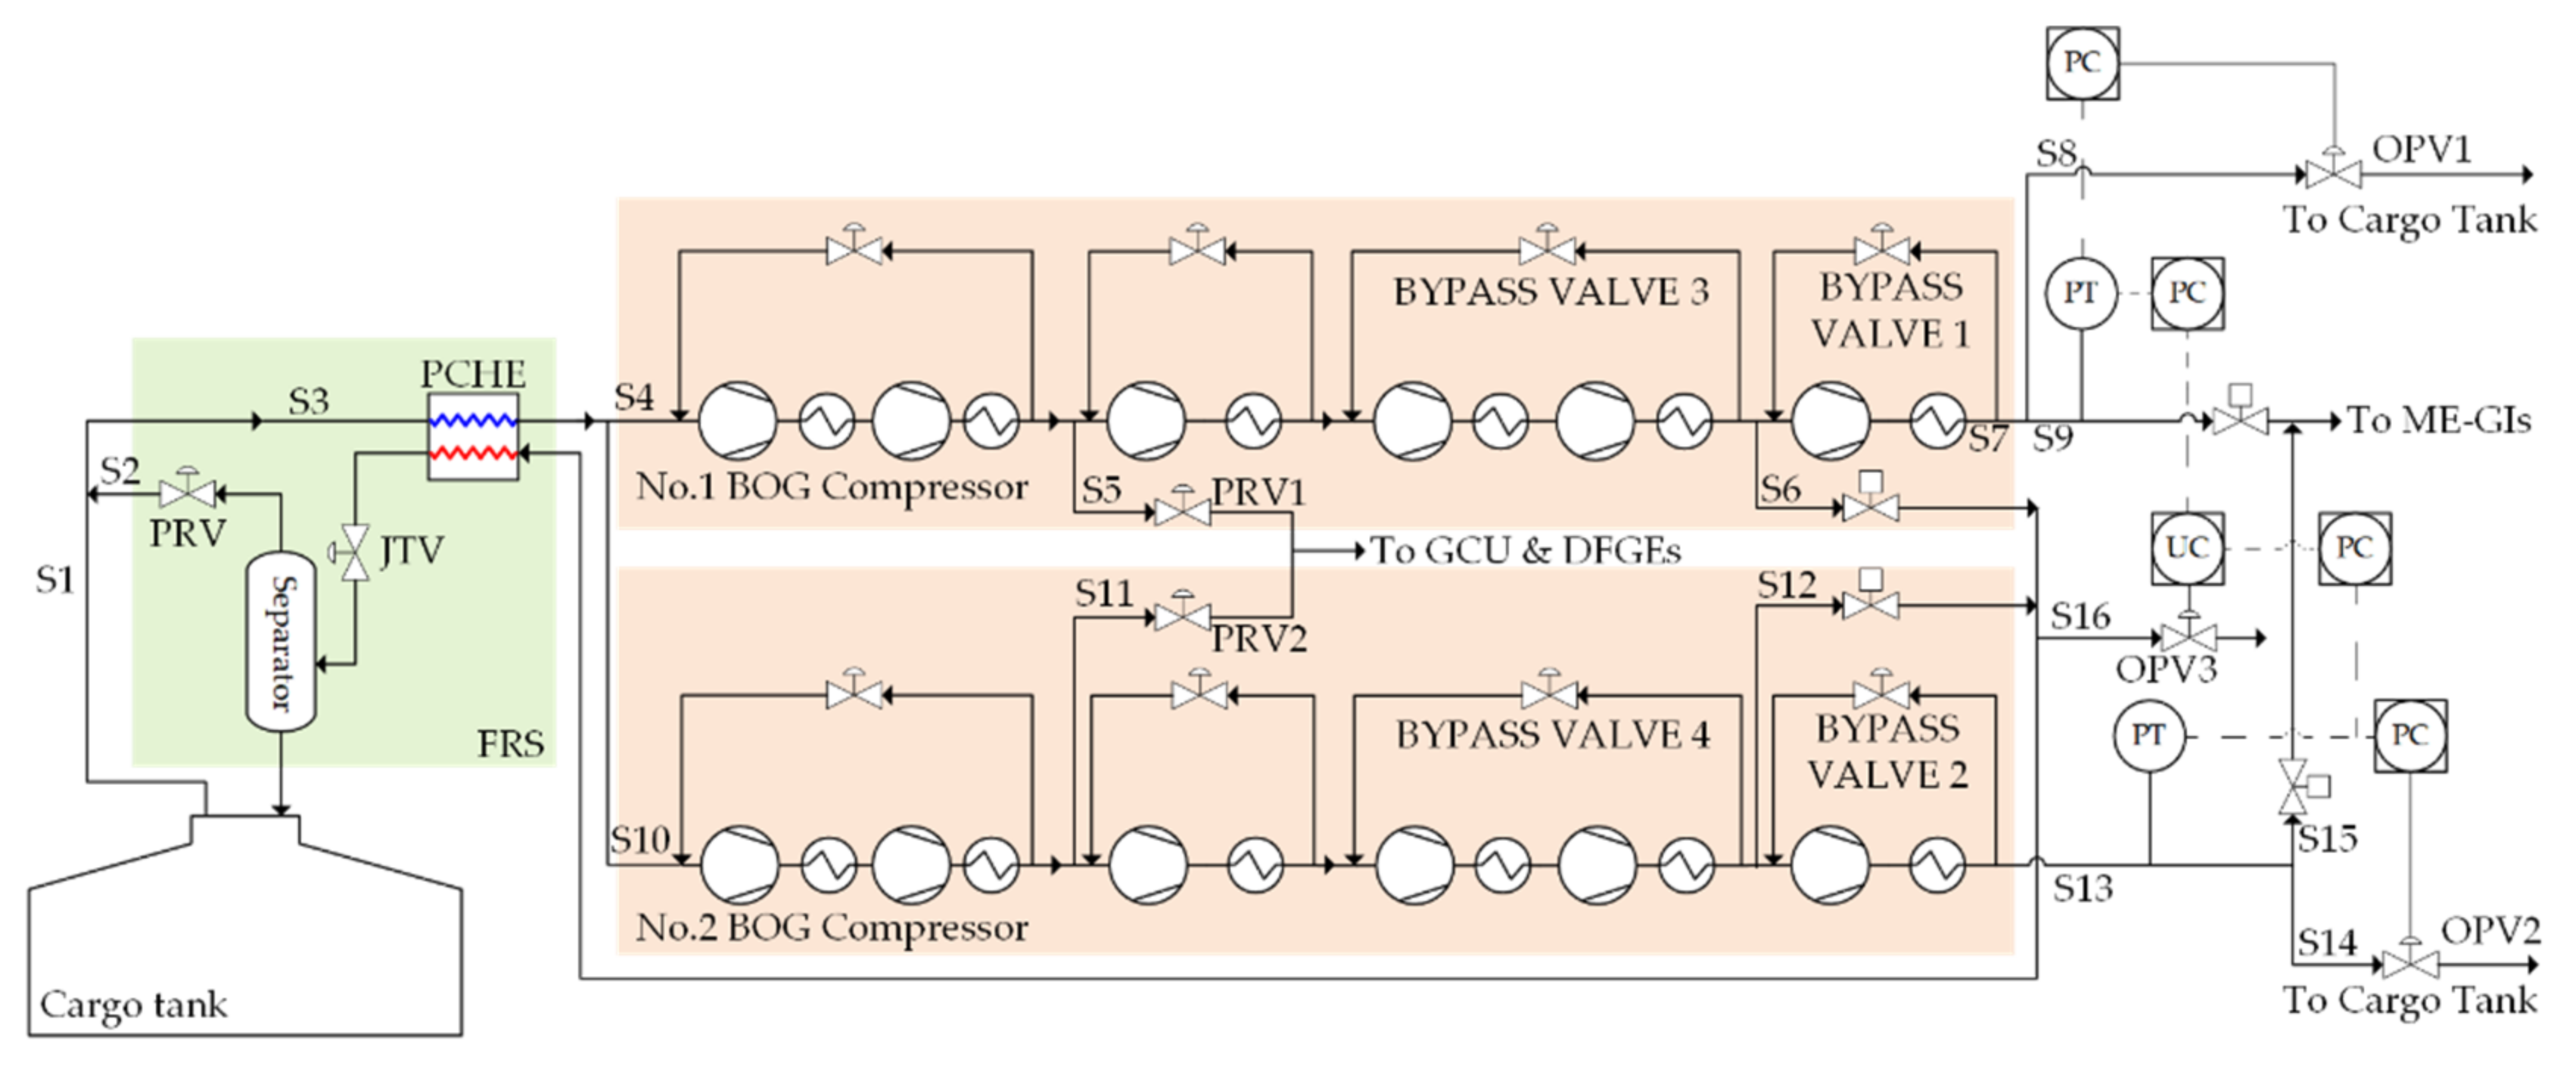
2.2. Case B: Novel Fuel Gas Supply System with Full Re-Liquefaction System and Control Philosophy I
2.3. Case C: Novel Fuel Gas Supply System with Full Re-Liquefaction System and Control Philosophy II
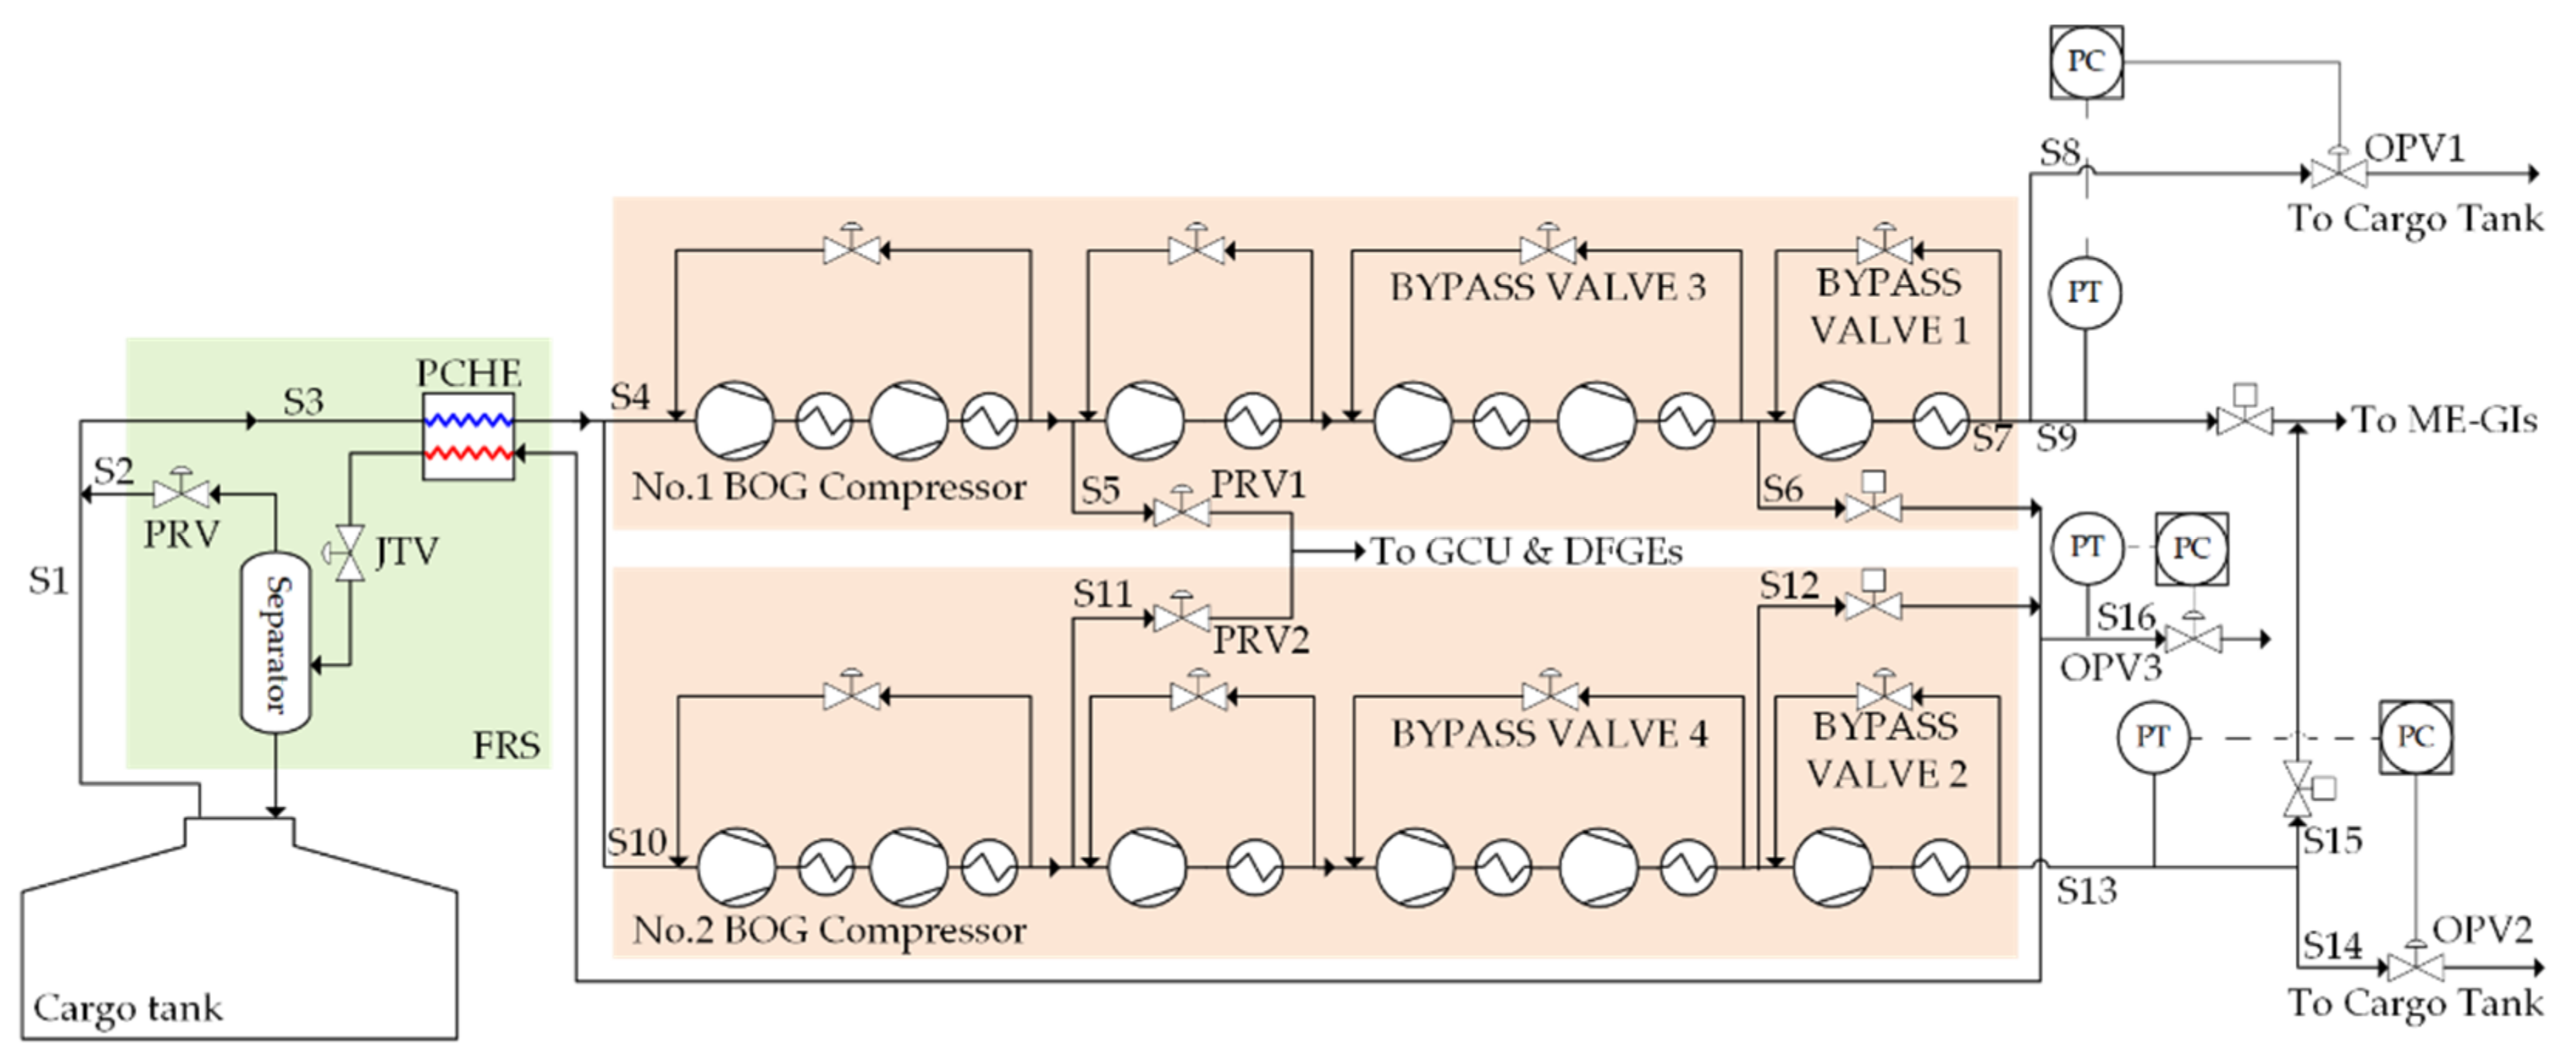
2.4. Case D: Novel Fuel Gas Supply System with Full Re-Liquefaction System and Control Philosophy III
3. Design Basis
3.1. Boil-Off Gas
3.2. Equipment
3.2.1. Compressors
3.2.2. Heat Exchangers
3.2.3. Valves
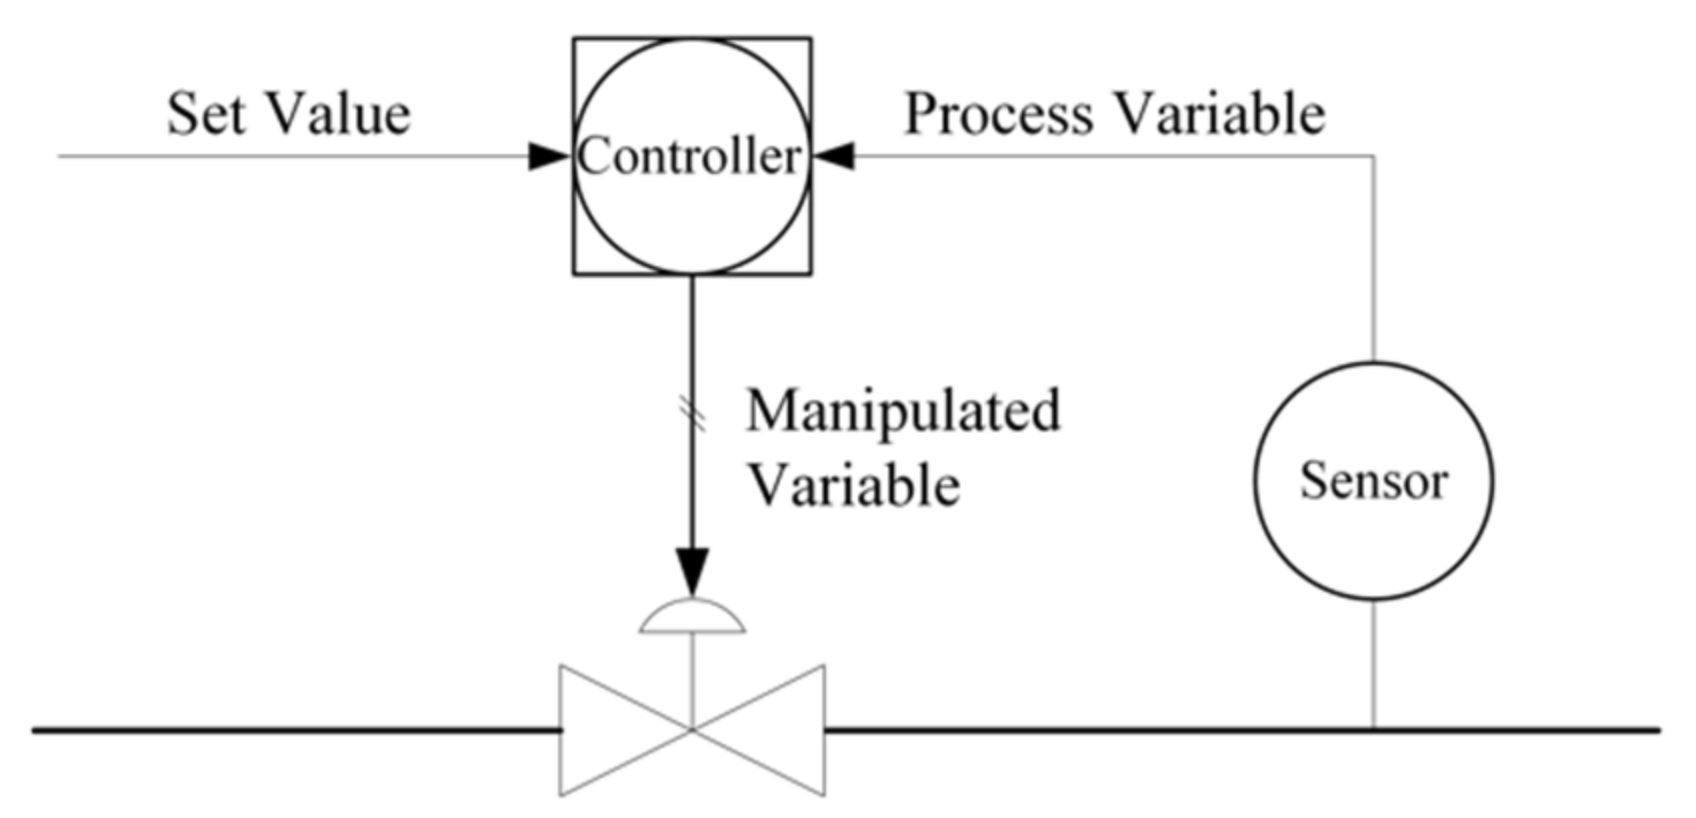
3.3. Controller
3.4. Fuel Gas Consumption
4. Simulation Results
4.1. Controllability Analysis
4.1.1. Case A Results
4.1.2. Case B Results
4.1.3. Case C Results
4.1.4. Case D Results
4.2. Performance Analysis of Processible BOG Amount
5. Discussion
- (1)
- When applying the novel configuration that we proposed, it is advantageous to have a certain amount of the re-liquefaction, low operating expenses (OPEX), and stable operation regardless of the fuel gas consumer’s trips. In terms of the stable re-liquefaction, the proposed configuration prevents delivery of the oil, which is used for lubricating inside the cylinders of the BOG compressors, to the PCHE because 150 bar can be compressed without any lubricants, unlike 300 bar. This means the lubricant oil can be prevented from freezing inside the PCHE under cryogenic conditions and degrading its re-liquefaction performance. When clogging occurs in the PCHE from the lubricant oil, the quantity of re-liquefaction is decreased by the thermal hydraulic imbalance inside the PCHE and the reduction in the heat exchange area. It is technically difficult to apply oil-free in the cylinders of a BOG compressor that supplies 300 bar. Moreover, since there is no clogging of lubricating oil inside the PCHE, there is no need to clean the PCHE, which is difficult to maintain on board, and this is quite beneficial from the viewpoint of OPEX. Considering the stable operation, the BOG compressors should not be abruptly stopped by the trip, unlike the operator’s intention even if the ME-GI engines with the most fuel gas usage are tripped. When the BOG compressors are tripped, preventing BOG management, the BOG must be consumed in the GCU through the free-flow to prevent a pressure increase in the cargo tanks. However, in the novel configuration, control methods become an important issue with the addition of 150 bar piping lines to the re-liquefaction system. In this proposal, three control strategies are presented and reviewed to enable the stable operation of the BOG compressors focusing on trips of the ME-GI engines with the most fuel gas usage. The reviews are carried out by UniSim dynamic simulation. Table 6 shows the summary of the review results. The recommendable control method is Case D, because the multi-controller compares the set values by referring to the pressure in the line where the pressure transmitter is installed, and controls them more efficiently, even if the two main propulsion engines are tripped. This means that the BOG compressors are operated well without any trips.
- (2)
- When focusing on the BOG management, the typical configuration (Case A) shows a better performance regarding the amount of re-liquefaction than the proposal (Case D), shown in Table 4. Although a manageable BOG of approximately 150 to 400 kg/h in Case D is reduced by the fuel gas supply system and the re-liquefaction system compared to Case A, Case D is a better choice considering the stability during the trips of the BOG compressors, the reduction in the amount of re-liquefaction caused by the oil clogging, and the required maintenance work on the PCHE from the oil clogging.
6. Patents
Author Contributions
Funding
Institutional Review Board Statement
Informed Consent Statement
Data Availability Statement
Acknowledgments
Conflicts of Interest
References
- Thomson, H.; Corbett, J.J.; Winebrake, J.J. Natural gas as a marine fuel. Energy Policy 2015, 87, 153–167. [Google Scholar] [CrossRef] [Green Version]
- Kim, A.; Seo, Y. The reduction of Sox emission in the shipping industry: The case of Korean companies. Mar. Policy 2015, 100, 98–106. [Google Scholar] [CrossRef]
- Lindstad, E.; Bø, T.I. Potential power setups, fuels and hull designs capable of satisfying future EEDI requirements. Transp. Res. Part D 2018, 63, 276–290. [Google Scholar] [CrossRef]
- Air Pollution. Available online: https://www.imo.org/en/OurWork/Environment/PollutionPrevention/AirPollution/Pages/Default.aspx (accessed on 1 June 2021).
- Energy Efficiency Measures. Available online: http://www.imo.org/en/OurWork/Environment/PollutionPrevention/AirPollution/Pages/Technical-and-Operational-Measures.aspx (accessed on 1 June 2021).
- Zakaria, N.M.G.; Corbett, J.J.; Rahman, S. Energy efficiency design index (EEDI) for inland vessels in Bangladesh. Procedia Eng. 2017, 194, 362–369. [Google Scholar] [CrossRef]
- Ekanem Attah, E.; Bucknall, R. An Analysis of the Energy Efficiency of LNG Ships Powering Options Using the EEDI. Ocean Eng. 2015, 110, 62–74. [Google Scholar] [CrossRef]
- Marine Diesel Engines How Efficient Can a Two-Stroke Engine. Available online: https://www.stg-online.org/onTEAM/shipefficiency/programm/Clausen.pdf (accessed on 9 October 2021).
- Plessas, T.; Kanellopoulou, A.; Zaraphonitis, G.; Papanikolaou, A.; Shigunov, V. Exploration of Design Space and Optimisation of RoPax Vessels and Containerships in View of EEDI and Safe Operation in Adverse Sea Conditions. Ocean Eng. 2018, 162, 1–20. [Google Scholar] [CrossRef]
- Nikolaos, K.; Christos, P.; Dimitrios, F. A comparative techno-economic analysis of TFDE, ME-GI and X-DF propulsion systems for LNG carriers. In Proceedings of the Case Study for Alternative Multi-Annual Operational Profiles, IAME 2019 Conference, Athens, Greece, 25–28 June 2019. [Google Scholar]
- Dwivedi, S.N. Design considerations for high-pressure reciprocating compressors for refinery services. In Proceedings of the International Compressor Engineering Conference, West Lafayette, IN, USA, 17–20 July 1990. [Google Scholar]
- Tsuzuki, N.; Kato, Y.; Ishiduka, T. High Performance Printed Circuit Heat Exchanger. Appl. Therm. Eng. 2007, 27, 1702–1707. [Google Scholar] [CrossRef]
- Heatric-PCHE. Available online: https://www.heatric.com/ (accessed on 9 October 2021).
- Fernández, I.A.; Gómez, M.R.; Gómez, J.R.; Insua, Á.B. Review of Propulsion Systems on LNG Carriers. Renew. Sustain. Energy Rev. 2017, 67, 1395–1411. [Google Scholar] [CrossRef]
- Park, H.; Lee, S.; Jeong, J.; Chang, D. Design of the Compressor-Assisted LNG Fuel Gas Supply System. Energy 2018, 158, 1017–1027. [Google Scholar] [CrossRef]
- Tan, H.; Shan, S.; Nie, Y.; Zhao, Q. A New Boil-off Gas Re-Liquefaction System for LNG Carriers Based on Dual Mixed Refrigerant Cycle. Cryogenics 2018, 92, 84–92. [Google Scholar] [CrossRef]
- Kim, D.; Hwang, C.; Gundersen, T.; Lim, Y. Process Design and Economic Optimization of Boil-off-Gas Re-Liquefaction Systems for LNG Carriers. Energy 2019, 173, 1119–1129. [Google Scholar] [CrossRef]
- Wei, W.; Ding, G.; Hu, H.; Wang, K. Influence of Lubricant Oil on Heat Transfer Performance of Refrigerant Flow Boiling inside Small Diameter Tubes. Part I: Experimental Study. Exp. Therm. Fluid Sci. 2007, 32, 67–76. [Google Scholar] [CrossRef]
- Tran, N.; Sheng, S.-R.; Wang, C.-C. An Experimental Study and Empirical Correlations to Describe the Effect of Lubricant Oil on the Nucleate Boiling Heat Transfer Performance for R-1234ze and R-134a. Int. Commun. Heat Mass Transf. 2018, 97, 78–84. [Google Scholar] [CrossRef]
- Won, W.; Lee, K.S. Delta-Operator-Based Adaptive Model Predictive Control and Online Optimization of a Natural Gas Liquefaction Process. Chem. Eng. Sci. 2017, 162, 21–32. [Google Scholar] [CrossRef]
- Sun, H.; Shu, D.; Jiang, Z. Simulation Study of the Dynamic Performance of a MRC Plant with Refrigerant Charged or Leaked. Cryogenics 2012, 52, 8–12. [Google Scholar] [CrossRef]
- Kim, H.J.; Park, C.C.; Lee, J.Y.; Lee, C.S.; Kim, M.H. Operational Characteristics of Propane-Mixed Refrigerant Liquefaction Process for Application to 30 Kg/h-Scale LNG Plant: Mixed Refrigerant Supply and Its Effect on Natural Gas Temperature. J. Mech. Sci. Technol. 2016, 30, 1883–1890. [Google Scholar] [CrossRef]
- Yang, S.; Fu, B.; Hou, Y.; Chen, S.; Li, Z.; Wang, S. Transient Cooling and Operational Performance of the Cryogenic Part in Reverse Brayton Air Refrigerator. Energy 2019, 167, 921–938. [Google Scholar] [CrossRef]
- System and Method for Processing Boil-off Gas for a Marine Structure. Available online: https://patents.google.com/patent/KR20130139150A/en (accessed on 1 June 2021).
- Hanlon, P.C. (Ed.) Compressor Handbook, 1st ed.; Chapter 21; McGraw-Hill Education: New York, NY, USA, 2001; Volume 3, pp. 680–683. [Google Scholar]
- Wang, L.; Liu, G.B.; Zhao, Y.Y.; Li, L.L. Performance Comparison of Capacity Control Methods for Reciprocating Compressors. IOP Conf. Ser. Mater. Sci. Eng. 2015, 90, 12029. [Google Scholar] [CrossRef] [Green Version]
- Capacity Control of Reciprocating Compressors. Available online: https://www.controlglobal.com/articles/2016/capacity-control-of-reciprocating-compressors/ (accessed on 9 October 2021).
- Liquefied Natural Gas for Europe—Some Important Issues for Consideration—Google Scholar. Available online: https://scholar.google.com/scholar_lookup?title=Liquefied%20natural%20gas%20for%20europe%20-%20some%20important%20issues%20for%20consideration.%20EUR%20%E2%80%93%20scientific%20and%20technical%20research%20series&author=B.%20Kavalov&publication_year=2009 (accessed on 9 October 2021).
- Miana, M.; Legorburo, R.; Díez, D.; Hwang, Y. Calculation of Boil-Off Rate of Liquefied Natural Gas in Mark III Tanks of Ship Carriers by Numerical Analysis. Appl. Therm. Eng. 2016, 93, 279–296. [Google Scholar] [CrossRef]
- Jeong, H.; Shim, W. Calculation of Boil-Off Gas (BOG) Generation of KC-1 Membrane LNG Tank with High Density Rigid Polyurethane Foam by Numerical Analysis. Pol. Marit. Res. 2017, 24, 100–114. [Google Scholar] [CrossRef] [Green Version]
- Resolution MSC.391(95). Available online: https://www.register-iri.com/wp-content/uploads/MSC_Resolution_39195.pdf (accessed on 9 October 2021).
- NO96 System. Available online: https://gtt.fr/technologies/no96-systems (accessed on 9 October 2021).
- Operation Guide (UniSim® Design); R460 Release; Honeywell International Sàrl: Rolle, Switzerland, 2017; pp. 6-76–6-83.
- Son, H.; Kim, J. Operability Study on Small-Scale BOG (Boil-off Gas) Re-Liquefaction Processes. Energy 2019, 185, 1263–1281. [Google Scholar] [CrossRef]
- Lee, C.; Song, K.; Lee, Y.; Han, C. A Decomposition Methodology for Dynamic Modeling of Cold Box in Offshore Natural Gas Liquefaction Process. Comput. Chem. Eng. 2016, 84, 546–557. [Google Scholar] [CrossRef]
- Emerson Fisher. Control Valve Handbook, 5th ed.; Emerson Fisher: Marshalltown, IA, USA, 2019; pp. 87–110. [Google Scholar]
- Bequette, B.W. Process Control: Modeling, Analysis, and Simulation, 1st ed.; Prentice Hall PTR: Upper Saddle River, NJ, USA, 2003; pp. 195–210. [Google Scholar]
- Honeywell. Dynamic Modeling using UniSim® Design, R411 ed.; Honeywell: London, ON, Canada, 2016; pp. 4.1–4.21. [Google Scholar]
- Durković, R.; Grujičić, R. An Approach to Determine the Minimum Specific Fuel Consumption and Engine Economical Operation Curve Model. Measurement 2019, 132, 303–308. [Google Scholar] [CrossRef]
- Two Stroke—Project Guides. Available online: https://marine.man-es.com/two-stroke/project-guides (accessed on 9 October 2021).
- Wärtsilä 34DF Product Guide. Available online: https://www.wartsila.com/docs/default-source/product-files/engines/df-engine/product-guide-o-e-w34df.pdf?utm_source=engines&utm_medium=dfengines&utm_term=w34df&utm_content=productguide&utm_campaign=msleadscoring (accessed on 9 October 2021).


| Composition (Unit) | Mole Fraction |
|---|---|
| Methane (mol %) | 0.9589 |
| Ethane (mol %) | 0.0296 |
| Propane (mol %) | 0.0072 |
| Butane (mol %) | 0.0006 |
| Nitrogen (mol %) | 0.0037 |
| Composition (Unit) | Mole Fraction |
|---|---|
| Methane (mol %) | 0.9994 |
| Ethane (mol %) | 0.0004 |
| Nitrogen (mol %) | 0.0002 |
| System | Engine Type | Power at NCR | Specific Gas Consumption |
|---|---|---|---|
| ME-GI engine | 5G70ME-GI | 10,000 kW | 4985.6 kJ/kWh |
| DFGE | 6L34DF | 2768 kW | 7526.0 kJ/kWh |
| System (unit) | Action Item | Case A | Case B | Case C | Case D |
|---|---|---|---|---|---|
| ME-GI (bar) | Bypass | 300 | 300 | 300 | 300 |
| OPV | 308 | 308 | 308 | 308 | |
| Trip | 323 | 323 | 323 | 323 | |
| Re-liquefaction (bar) | Bypass | 300 | 150 | 150 | 150 |
| OPV | 308 | 154 | 154 | 154 | |
| Trip | 323 | 163 | 163 | 163 |
| System (unit) | Action Item | 15 Knots | 16 Knots | 17 Knots | 18 Knots | 19 Knots |
|---|---|---|---|---|---|---|
| Case A (kg/h) | FRS (A1) | 2941 | 3071 | 3180 | 3266 | 4127 |
| Vapor (A2) | 1136 | 1188 | 1223 | 1230 | 1936 | |
| Re-liquefaction (A3) | 1810 | 1883 | 1957 | 2036 | 2191 | |
| ME-GIs (A4) | 1250 | 1500 | 1800 | 2200 | 2500 | |
| DFGEs (A5) | 900 | 900 | 900 | 900 | 900 | |
| Processed BOG | 3960 | 4283 | 4657 | 5136 | 5591 | |
| Case B to D (kg/h) | FRS (A1) | 6111 | 6037 | 5972 | 5896 | 5826 |
| Vapor (A2) | 4459 | 4364 | 4276 | 4170 | 4073 | |
| Re-liquefaction (A3) | 1652 | 1673 | 1696 | 1726 | 1753 | |
| ME-GIs (A4) | 1250 | 1500 | 1800 | 2200 | 2500 | |
| DFGEs (A5) | 900 | 900 | 900 | 900 | 900 | |
| Processed BOG | 3802 | 4073 | 4396 | 4826 | 5153 |
| System (Unit) | One Engine Trip | Two Engine Trips | ||||
|---|---|---|---|---|---|---|
| No.1 ME-GI | No.2 ME-GI | FRS | No.1 ME-GI | No.2 ME-GI | FRS | |
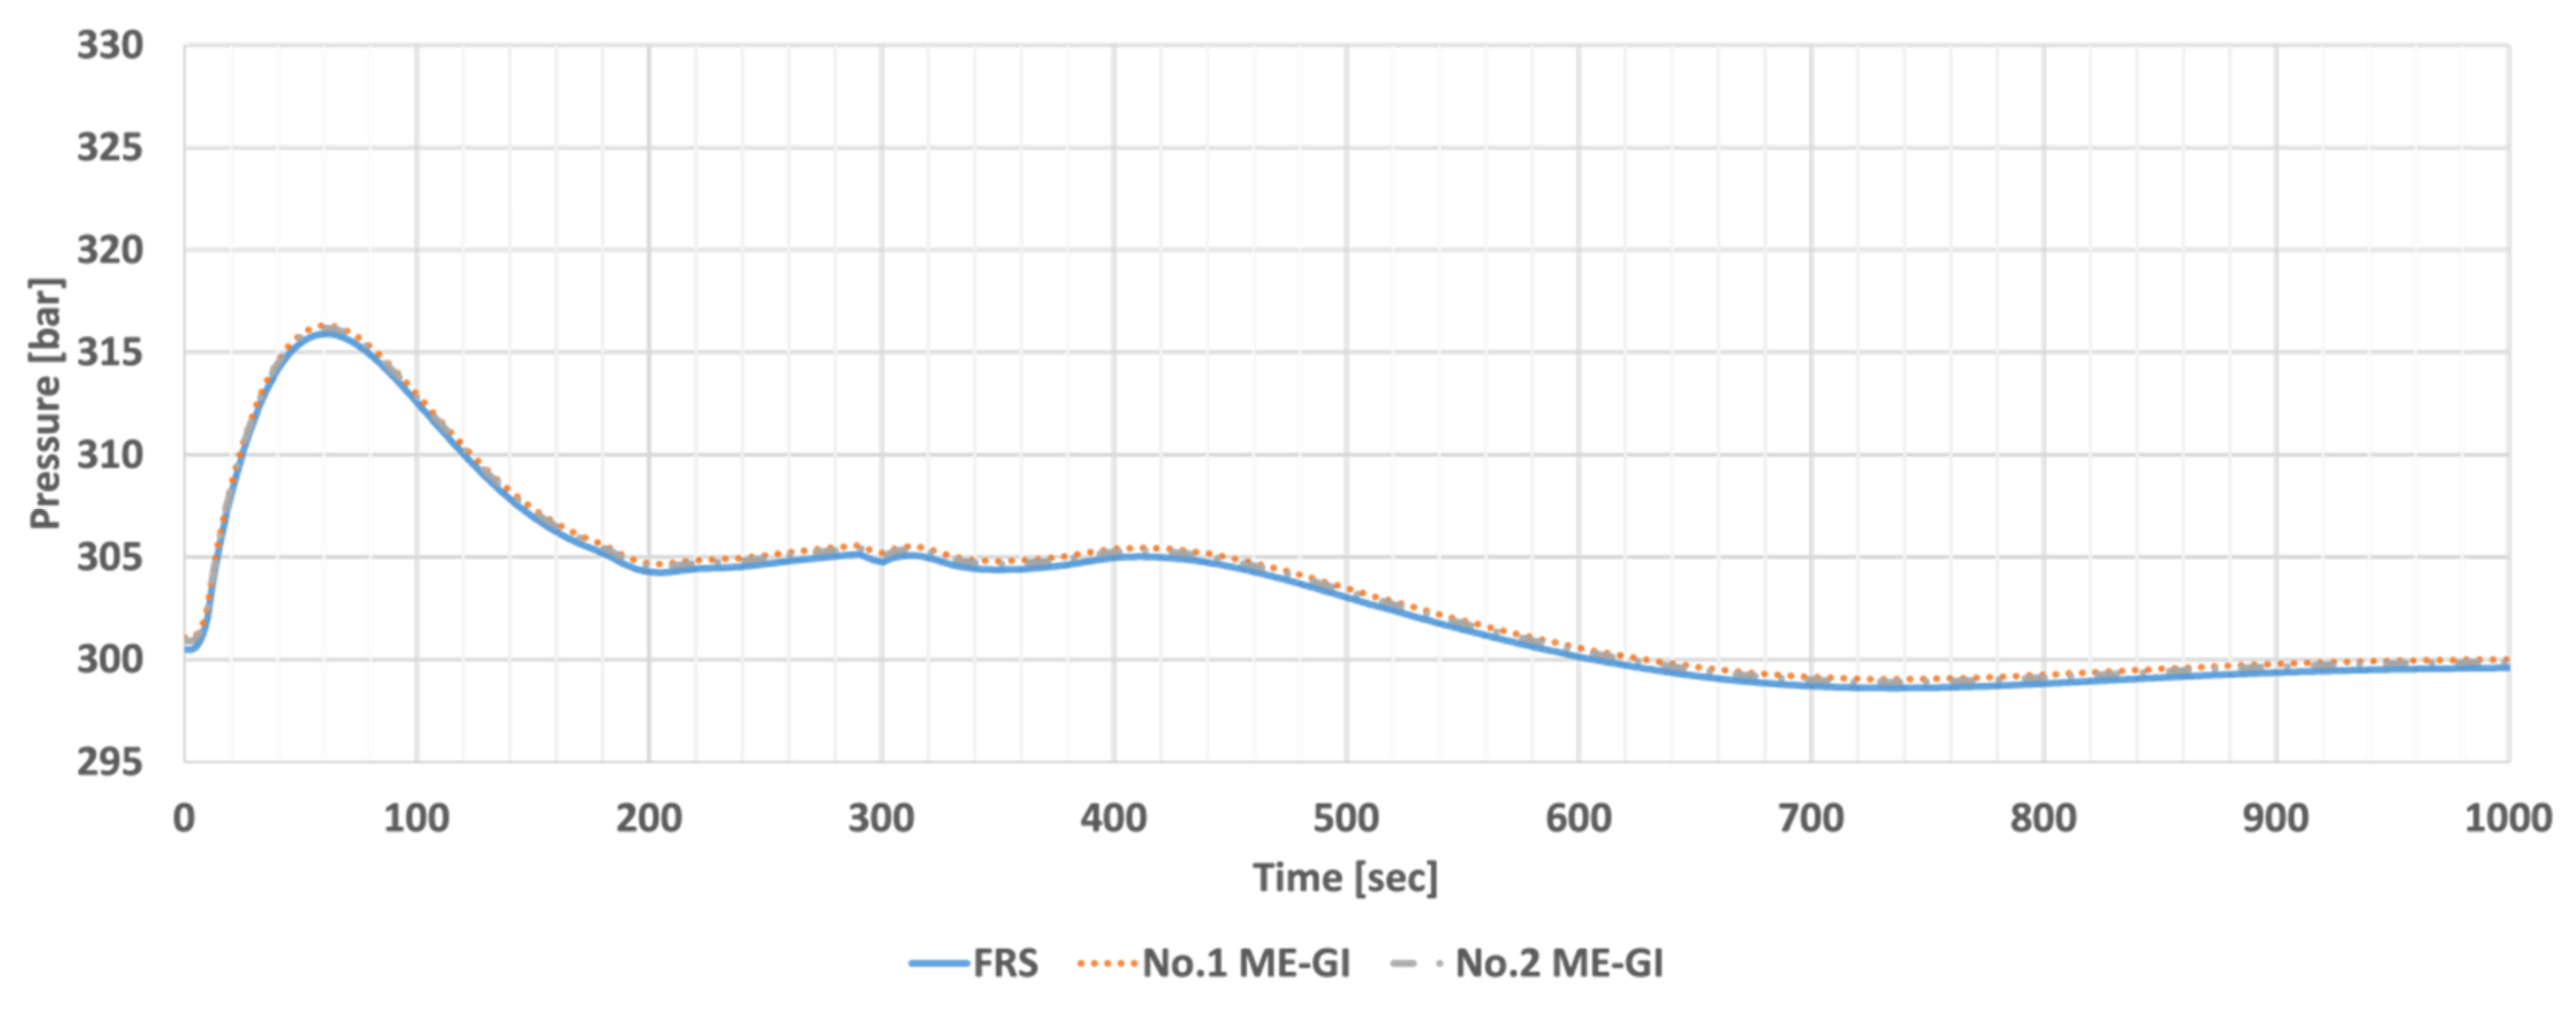
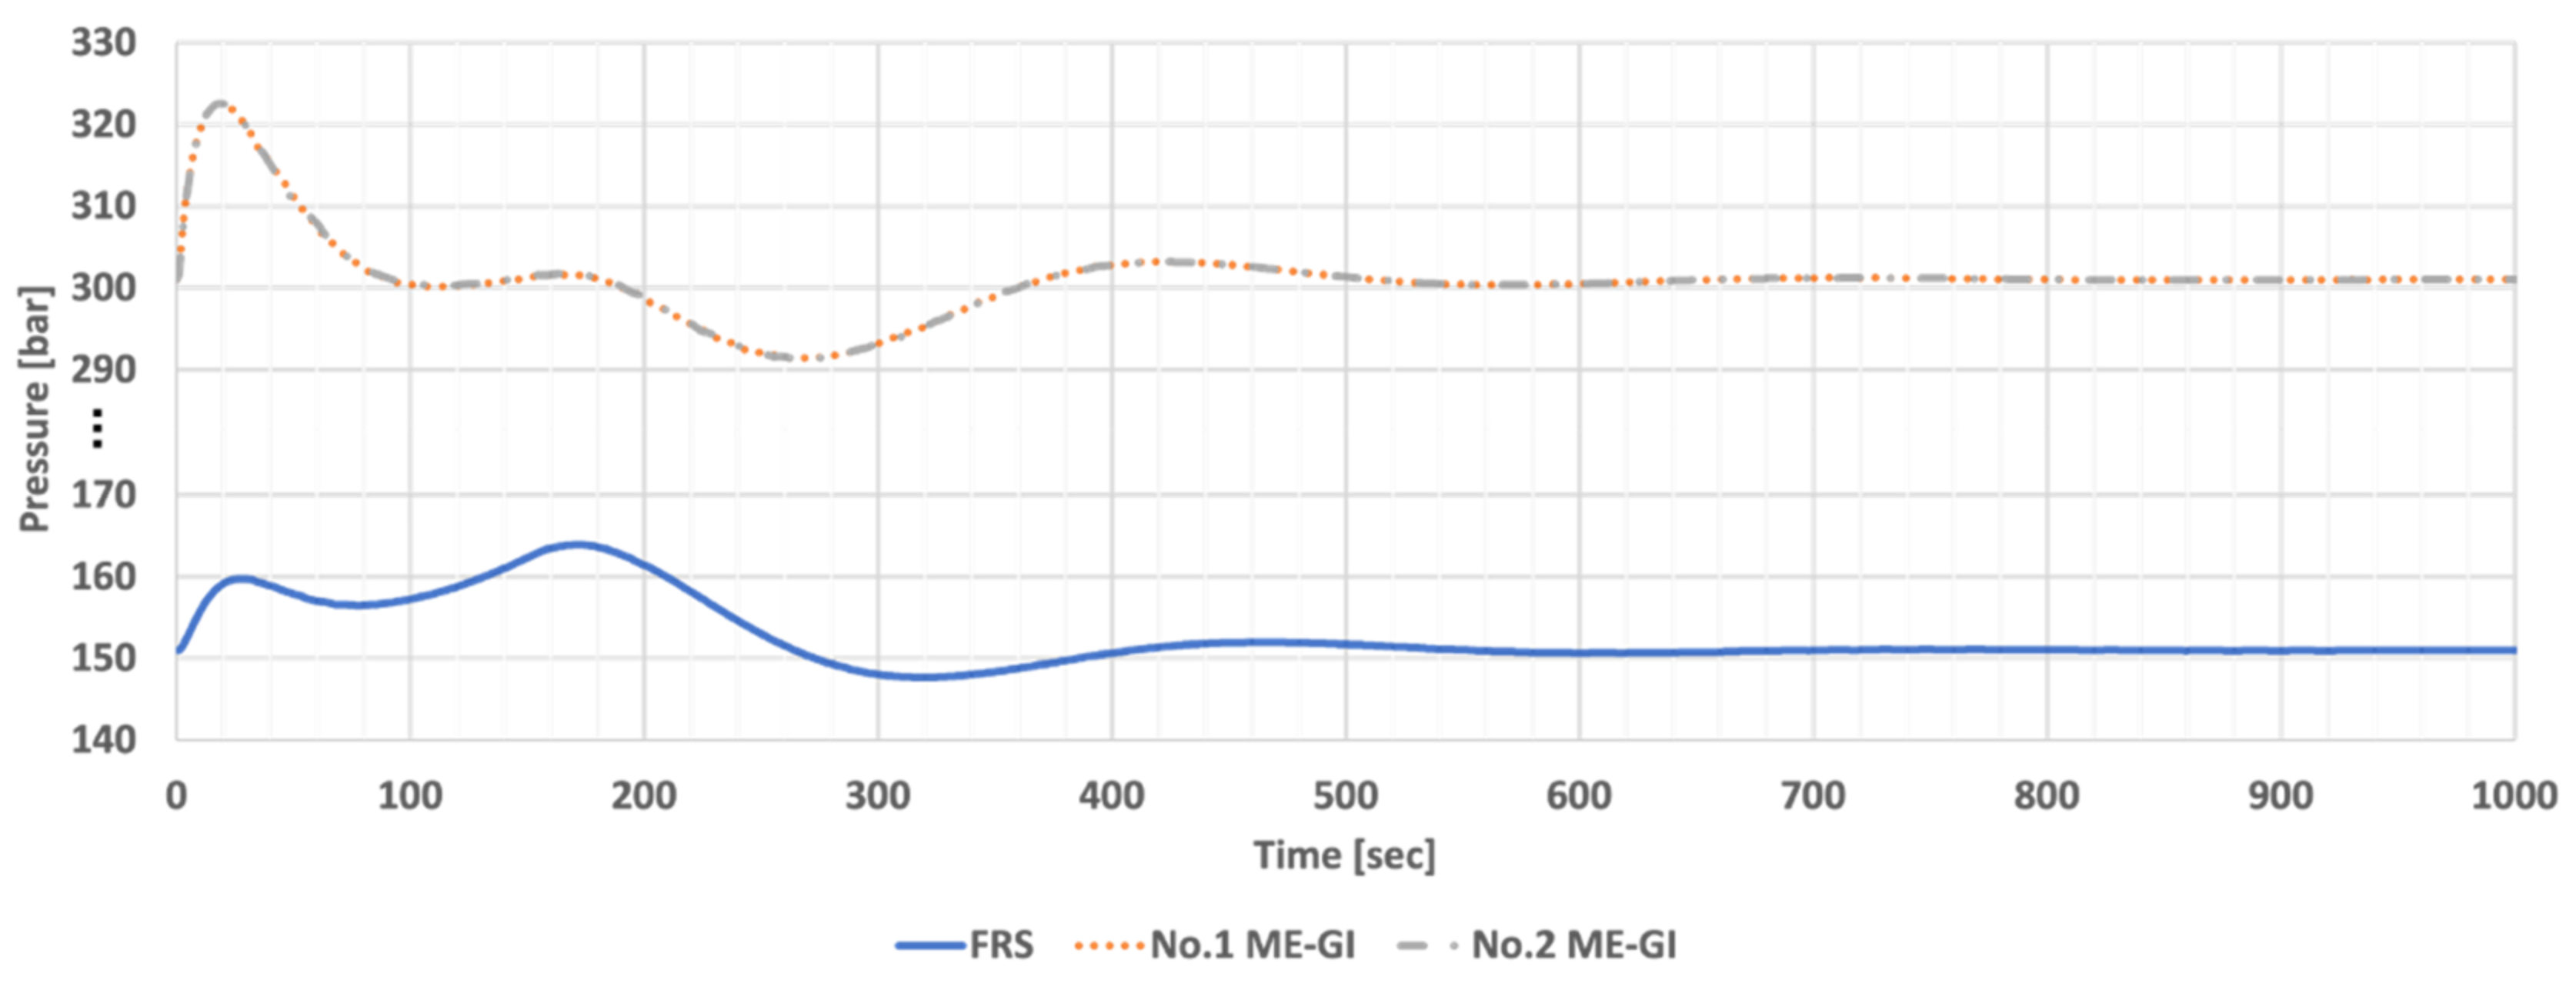
| Case A (bar) | 316.2 | 316.1 | 315.8 | 328.7 | 328.6 | 328.4 |
| Case B (bar) | 318.7 | 303.8 | 157.8 | 322.5 | 322.5 | 163.9 |
| Case C (bar) | 320.0 | 306.6 | 159.6 | 322.3 | 322.3 | 168.1 |
| Case D (bar) | 318.7 | 303.8 | 155.0 | 322.2 | 322.2 | 159.7 |
Publisher’s Note: MDPI stays neutral with regard to jurisdictional claims in published maps and institutional affiliations. |
© 2021 by the authors. Licensee MDPI, Basel, Switzerland. This article is an open access article distributed under the terms and conditions of the Creative Commons Attribution (CC BY) license (https://creativecommons.org/licenses/by/4.0/).
Share and Cite
Hwang, S.-K.; Jung, B.-G. A Novel Control Strategy on Stable Operation of Fuel Gas Supply System and Re-Liquefaction System for LNG Carriers. Energies 2021, 14, 8413. https://doi.org/10.3390/en14248413
Hwang S-K, Jung B-G. A Novel Control Strategy on Stable Operation of Fuel Gas Supply System and Re-Liquefaction System for LNG Carriers. Energies. 2021; 14(24):8413. https://doi.org/10.3390/en14248413
Chicago/Turabian StyleHwang, Soon-Kyu, and Byung-Gun Jung. 2021. "A Novel Control Strategy on Stable Operation of Fuel Gas Supply System and Re-Liquefaction System for LNG Carriers" Energies 14, no. 24: 8413. https://doi.org/10.3390/en14248413
APA StyleHwang, S.-K., & Jung, B.-G. (2021). A Novel Control Strategy on Stable Operation of Fuel Gas Supply System and Re-Liquefaction System for LNG Carriers. Energies, 14(24), 8413. https://doi.org/10.3390/en14248413