Article

Optimization of Operating Conditions for CO2 Methanation Process Using Design of Experiments

1
Plant Engineering Center, Institute for Advanced Engineering, Yongin 17180, Korea
2
Research Institute of Industrial Science and Technology (RIST), 187-12 Geumho-ro, Gwangyang-si 57801, Korea
*
Author to whom correspondence should be addressed.
Energies 2021, 14(24), 8414; https://doi.org/10.3390/en14248414
Submission received: 15 November 2021 / Revised: 1 December 2021 / Accepted: 9 December 2021 / Published: 13 December 2021

Abstract

:
In this study, the Taguchi experimental design method using an L16 orthogonal array was attempted in order to investigate the optimal operating conditions for the CO2 methanation process in Ni-based catalysts. The relative influence of the main factors affecting CO2 conversion and CH4 yield was ranked as follows: reactor pressure > space velocity > reaction temperature. The optimal combination of operating conditions was a reactor temperature of 315 °C, a pressure of 19 bar, and a space velocity of 6000 h−1. The effect of the H2/CO2 ratio on CO2 conversion and CH4 yield was further considered under these optimal operating conditions. Moreover, the catalyst was characterized in order to investigate the production of coke through Brunauer–Emmett–Teller analysis, thermogravimetric analysis, and scanning electron microscopy. The amount of coke produced after the reaction for approximately 24 h was ~2 wt.%. Therefore, the desired CH4 yield and long-term operational stability were successfully obtained using the Taguchi design method and catalyst characterization.

1. Introduction

Environmental issues such as air pollution and global warming have led to increasing efforts to reduce the use of fossil fuels worldwide and replace them with renewable energy sources, such as solar and wind energy. The main limitations to increasing the production of renewable electricity are intermittency and dispersion [1], which require efficient energy-storage technology. The imbalance between production and demand can create serious supply problems despite the availability of low-cost, renewable energy sources. In this context, power-to-gas (PtG) technology is an energy-storage technology that has been rapidly developed and is already being commercialized in Europe to improve energy storage. PtG technology converts surplus energy from renewable sources into combustible chemicals, which are easier to store and transport compared to electrical energy [2]. The PtG process consists of two steps: hydrogen (H2) production through water electrolysis, and methane (CH4) synthesis using CO or CO2 [3]. These H2 and CH4 products produced using the PtG process have excellent storage capacity for extended periods [4]. In particular, the use of CH4 is more desirable owing to its energy density, which is three times higher than that of H2, and to the widespread facilities for its storage and transport [2,5,6]. Methane can be injected and stored into existing gas distribution grids or utilized in natural gas facilities [7].
The CO2 methanation reaction, also known as the Sabatier process, is as follows:
CO 2 + 4 H 2 =   CH 4 + Alarc 2 H 2 O   Δ H R = 165.1   kJ / mol
This reaction is strongly exothermic and is controlled by chemical equilibrium [8]. Owing to kinetic limitations, the CO2 methanation process is mainly performed using Ni-based catalysts at low temperatures of 250–400 °C.
Because of thermodynamic equilibrium, undesirable competing reactions such as CO methanation and the reverse water–gas shift reaction can occur at high temperature as follows:
CO   + 3 H 2 =   CH 4 +   H 2 O   Δ H R = 206.3   kJ / mol
CO 2 + H 2 =   CO +   H 2 O   Δ H R = 41.2   kJ / mol
Therefore, one of the main issues in reactor scale-up is to remove heat generated by this exothermic reaction and maintain the process at a relatively low temperature, without generating hot spots or quenching the reaction [9]. Moreover, the operation must be performed at an appropriate temperature range to prevent unwanted competing reactions, and an adequate pressure is important for process optimization. A pressure increase up to a certain point can improve the reaction efficiency in a general temperature range [10,11]. However, a technical–economic compromise is necessary because the compressor power consumed to increase the water electrolysis hydrogen supply pressure can be greater than the increase in methane and steam production.
Several operating parameters are closely related to the performance of methane production. Extensive studies of CO2 methanation have been conducted to determine the effect of operating variables; relevant details are summarized in Table 1.
Factors that influence CO2 methanation performance include reactor temperature, pressure, space velocity, and H2/CO2 ratio. A high CO2 conversion and CH4 yield can be used as performance indicators for maximum methane gas production. Several experiments for evaluating CO2 methanation have been conducted to investigate the effect of one parameter at a time. However, this approach is time-consuming and labor-intensive [16]. Optimization tools can be used to identify the best output for optimal methane gas production based on input values in less time and with lower costs. The Taguchi optimization method is an efficient approach for optimizing performance with minimal experimentation. Therefore, the Taguchi design of experiment approach can be used to optimize methane production with minimal time and low cost.
The main objective of this study was to optimize CO2 methanation using the Taguchi method to determine the effects of reactor temperature, pressure, space velocity, and H2/CO2 ratio. Because of economic limitations such as operating costs and difficulty in obtaining a sufficient amount of catalyst, pre-evaluation of catalysts or feedstocks and the selection of operating conditions to optimize product yield are typically performed in laboratory and pilot-scale reactors. Therefore, optimizing reaction conversion and product yields is a starting point for scale-up to pilot and commercial CO2 methanation reactors. The most influential parameters and optimal operating conditions for methane production were investigated using the Taguchi experimental design with an L16 orthogonal array. In addition, considering the formation of coke on the catalyst surface, which occurs during methanation, we verified the high performance and durability of the catalyst. During the reactor scale-up process, we investigated possible variations in process factors, such as the H2/CO2 ratio, by minimizing trial and error in the operation and coordination of economic aspects when product productivity and quality above a certain level were secured. Finally, the stability of catalyst activity was evaluated through coking analysis using H2/CO2 under the optimal conditions selected by the Taguchi method.

2. Materials and Methods

2.1. Catalyst Preparation

The catalyst used in this experiment was 40Ni5Mg-Al-Zeolite synthesized by the co- precipitation method, which contains 72 wt% NiO, 16 wt% Al2O3, and 12 wt% SiO2. Nickel nitrate (Ni(NO3)6H2O), Magnesium nitrate (Mg(NO3)6H2O), and Aluminum nitrate (Al(NO3)9H2O) were dissolved in distilled water. The solution temperature was raised to 50 °C while stirring the solution using an overhead stirrer. Then, aqueous ammonia was added dropwise to the solution to precipitate solid particles until pH 7 was reached. After the reaction was carried out for 3 h, the filtered solid powder was dried at 110 °C overnight. The solid material obtained was calcined at 500 °C for 5 h. The prepared catalyst was mixed with a binder (graphite 5%) and zeolite (Chabazite, Si/Al = 16, 10%) and then calcined at 600 °C for 5 h. The catalyst was used in the form of a pellet (diameter = 5 mm, height = 7 mm) with a specific surface area of 161.1 m2/g and a micropore volume of 0.027 cm3/g.

2.2. Catalyst Activity Test

2.2.1. Experimental Apparatus

CO2 methanation experiments under various operating conditions were performed in a fixed-bed reactor (ID = 10 mm, height = 60 mm). The mesh was installed to support the catalyst bed inside the reactor, and 1 g of the catalyst was filled in the catalyst bed.
Preheated feed gases (N2 as an inert gas, H2, and CO2) were injected into the reactor and controlled by a mass flow meter at a specific H2/CO2 ratio. In addition, N2 was used as the reference flow rate to evaluate the flow of product gas exiting the reactor. Thermocouples were inserted at the top and bottom of the reactor to measure the temperature of the catalyst bed and the temperature inside the reactor. The reactor temperature was controlled by an external heating jacket surrounding the reactor. The pressure was controlled by a back-pressure regulator located at the rear end of the condenser (Figure 1).

2.2.2. Data Analysis

A 2Ch-MicroGC (3000 MicroGC Gas Analyzer, Inficon Co., Bad Ragaz, Switzerland) was used to analyze the components of the gas product. The gas from the reactor was dewatered from the condenser and flowed through a filter into a gas chromatograph (GC). The concentration of the gas was then measured in real time in the GC. To ensure the reliability of the reaction, the stream measurement time for each test was at least 2 h. Two columns were used to analyze the cooled reaction gas: Mol-Sieve5A (10 m × 0.32 mm × 30 μm, Inficon) and Plot U (8 m × 0.32 mm × 30 μm, Inficon). To reduce the delay in the analysis of the reaction gas, a PLOT U column was additionally placed on the Mol-Sieve5A column and injected by using a back-flush pretreatment. A micro-thermal conductivity detector was used, and the temperature of the column oven was maintained at 70 °C. Argon was used as the carrier gas for the Mol-Sieve5A column, and helium was used for the PLOT U column. As the reaction gas passed through the column for 240 s, chromatograms of hydrogen, nitrogen, oxygen, carbon monoxide, and methane were obtained from the Mol-Sieve5A column. In addition, the chromatogram of CO2 was obtained from the PLOT U column, and quantitative analysis at the ppm level was performed by calibrating the curve using a standard gas.
The reaction performance was evaluated using Equations (4)–(6).
X C O 2 ( % ) = ( F C O 2 , i n F C O 2 , o u t ) / F C O 2 , i n × 100  
S C H 4 ( % ) = F C H 4 / ( F C H 4 + F C o 2 , o u t ) × 100  
Y C H 4 ( % ) = X C O 2 × S C H 4 / 100  
where Xi is the conversion of i species, Fi is the molar flow rate, Si is the selectivity, and Yi is the yield.

2.3. Taguchi Experimental Design Method

The Taguchi design method was performed using Minitab 20 software to determine the optimal operating conditions for CO2 methanation. The optimal values of all parameter combinations may not be within the same ranges used in the experimental design. Nevertheless, the Taguchi design method was used to increase the efficiency of the experiments by minimizing time loss [17,18].
Based on previous studies, the temperature, pressure, and space velocity of the reactor were selected as the main factors affecting the performance of CO2 methanation. Table 2 shows the factors and levels used in this study.
An orthogonal array with different combinations of input parameters was designed using the Taguchi method. The Taguchi L16 array, including three factors and four levels for analysis, is shown in Table 3.
In the Taguchi method, controllable factors are termed parameters, whereas uncontrollable factors are referred to as noise (N). The method used to calculate the signal-to-noise (S/N) ratio can be classified into three types: larger is better, nominal is best, and smaller is better. In this study, the larger is better rule was adopted with the goal of maximizing the CO2 conversion rate [19]. The S/N ratio can clarify the quantitative characteristics of the process parameters and products. It was calculated as follows:
S / N   r a t i o = 10 log 1 / y 2 / n  
where y is the CO2 conversion or CH4 yield, and n is the number of factor level combination reactions.

2.4. Catalyst Characterization

2.4.1. Qualitative Analysis of Catalyst Characterization

The specific surface area of the catalyst was measured based on the N2 adsorption/desorption isotherm, which was determined using a Brunauer–Emmett–Teller (BET) analyzer (Tristar II 3020, Micromeritics, Norcross, GA, USA). During pre-treatment, the sample was degassed under vacuum at 150 °C for 1 h. The BET method was then used to calculate the specific surface area.
A field scanning electron microscope (Mira3, Tescan, Kohoutovice, Czech Republic) was used to analyze the surface structure of the catalyst. After drying the catalyst sample at 120 °C for approximately 1 h, the catalyst was coated with a metal, and nitrogen was added under vacuum. The surface structure of the catalyst before and after the reaction was determined from scanning electron microscopy (SEM) images.

2.4.2. Quantitative Analysis of Coke Production

After 16 sets of experiments consisting of a Taguchi orthogonal array, additional tasks were performed for each H2/CO2 ratio under the determined optimal conditions. A thermogravimetric analyzer (DTG-60, Shimadzu, Kyoto, Japan) was used to investigate the coke produced in the catalyst after the CO2 methanation. The temperature was raised to 800 °C at a heating rate of 10 °C/min under an air atmosphere. This temperature was maintained for 5 min, while the sample mass was measured. The equation used to calculate the mass of coke produced was as follows:
W c ( wt % ) = M t , b M t , a M t , a × 100  
where Wc is the coke weight percent (wt.%), and Mt,b and Mt,a are the sample mass before and after thermogravimetric analysis, respectively.

3. Results and Discussion

3.1. Taguchi Approach

Figure 2 shows the average S/N ratio plot for each factor based on the experimental results of the Taguchi L16 combination. The profile of each factor (Figure 2) indicates that the output factors (CO2 conversion rate and CH4 yield) did not increase or decrease according to the level change in each factor. For factor A (reactor temperature), the S/N ratio formed an inflection point at 315 °C. Tamimi et al. [20] reported that an increase in the reaction temperature up to 350 °C leads to higher CO2 conversion, but a further temperature increase can decrease the conversion because of the thermodynamic limit. Although the degrees of influence of the pressure and space velocity on the conversion rate were different, the trends were similar to those in the results of several previous studies [14,20,21,22,23].
A larger average S/N ratio leads to higher CO2 conversion and CH4 yield. The effect of each factor was calculated by subtracting the minimum S/N ratio from the factor’s maximum S/N ratio [24,25]. The magnitude of change in the average S/N ratio indicates the magnitude of influence of each factor on CO2 conversion and CH4 yield. The effects of temperature, pressure, and space velocity are shown in Figure 3a.
A higher effect value suggests a greater effect on the yield and conversion rate of CO2 methanation. Figure 3 shows that the relative influence of the factors was ranked as reactor pressure (Factor B) > space velocity (factor C) > temperature (factor A), and the influence of pressure (factor B) on CO2 conversion and CH4 yield was clearly more pronounced than that of the other two factors. The optimal conditions for CO2 methanation were obtained by selecting and combining the levels at the highest S/N ratio for each factor. As shown in Figure 2 and Figure 3a, the combination of optimal conditions for each factor that led to the highest S/N ratio corresponded to the second level in factor A, the fourth level in factor B, and the first level in factor C. This result indicates that a reactor temperature of 315 °C, a pressure of 19 bar, and a space velocity of 6000 h−1 formed the optimal combination of operating conditions. Figure 3b shows the S/N ratio profile of the experimental results obtained using a Taguchi L16 array design combination, including the S/N ratio for the optimal combination.
Catalyst reactions are fundamentally complex phenomena, and their productivity is affected by several interactions. Therefore, the optimization results can be influenced by the effects of interactions. Potential interactions between different control factors can be interpreted as the magnitude of the difference between the predicted performance and the validation experiment [24]. Accordingly, a verification experiment was performed because the obtained combination of the three optimal conditions was not included in the previously performed Taguchi L16 array.
Table 4 shows the verification results of the experiments analyzing the parameter combination A2B4C1. The experimental results were compared to the predicted values. The relative difference (in percent) in the S/N ratio was 0.87, and the predicted value for each combination was close to the experimentally measured value. The differences between the predicted and the experimental responses were attributed to the interaction between parameters. The H2/CO2 ratio is among the main factors determining the CO2 methanation performance, along with temperature, pressure, and space velocity. Therefore, the effect of the H2/CO2 ratio on the methanation reaction was investigated under the optimal combination of operating conditions obtained by the Taguchi L16 orthogonal array experiment. A H2/CO2 range of 3.6–4.0 was selected to ensure sufficient methane yield in commercial plants and maintain long-term performance.

3.2. Catalytic Performance

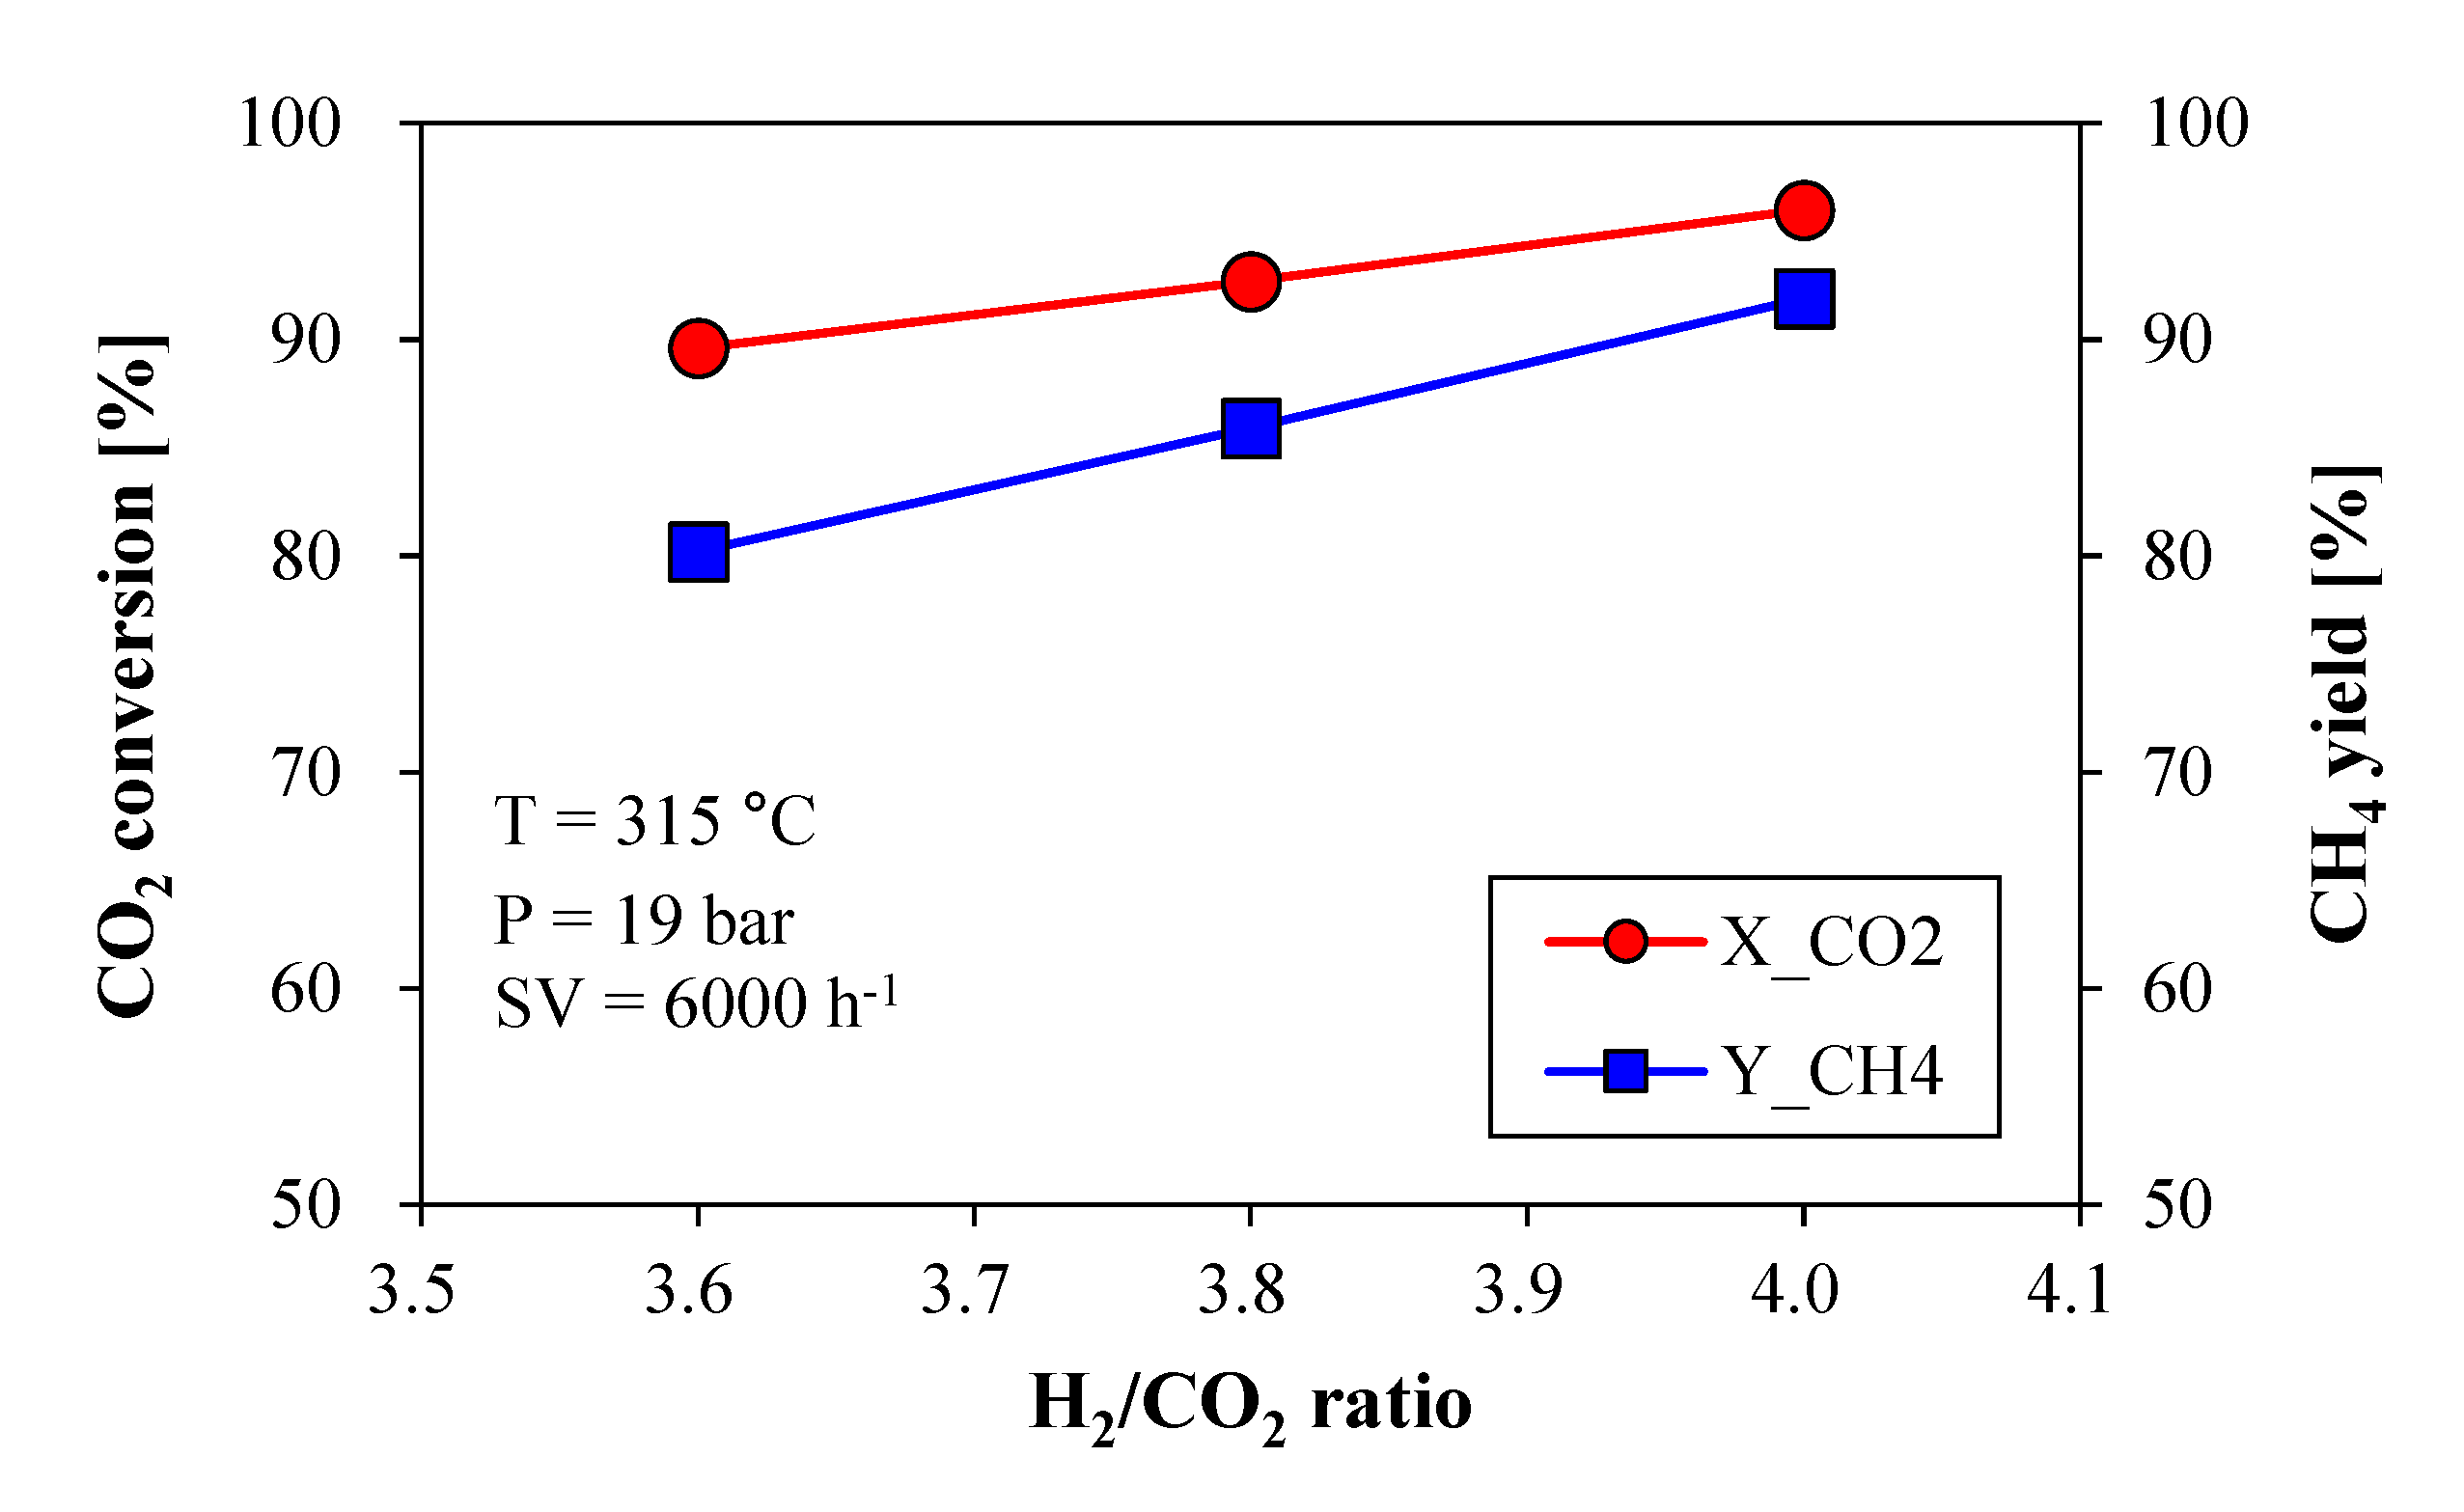
Figure 4 shows the effect of the H2/CO2 ratio on the CO2 conversion and CH4 yield at 315 °C, a pressure of 19 bar, and a space velocity of 6000 h−1, which were the operating conditions of the optimal combination. The catalytic performance was found to be similar to the thermodynamic equilibrium value [6]. The CO2 conversion and CH4 yield increased as the H2/CO2 ratio increased from 3.6 to 4.0. The quality and production capacity of methane can be affected by potential and complex interactions between several factors. For instance, increasing the H2/CO2 molar ratio in the reactant increases the CO2 conversion rate by increasing the amount of H2 that can react with CO2 [20,26]. However, an excessive amount of H2 can increase the amounts of CH4 produced and the amounts of unreacted H2; thus, the economic aspects of this reaction should be carefully evaluated.
Deactivation of the catalyst by coke is very important for catalysts used in the industrial field. Accumulation of coke in the catalyst bed may prevent the injected gas from passing through the catalyst bed and thereby cause backflow. Therefore, we investigated the performance of the overall process by considering the potential for catalyst coking obtained in the experiments using different H2/CO2 ratios.
Figure 5 shows the amount of coke produced after the reaction at H2/CO2 = 3.6, 3.8, and 4.0. The amount of coke produced was compared based on the wt.%. Coke production increased by approximately 1.2–1.8 times as the H2/CO2 ratio increased from 3.6 to 4.0. Ocampo et al. [21] reported that a lack of hydrogen can promote catalyst deactivation. However, under all three conditions, the amount of coke generated (approximately 2 wt.%) was considered insignificant compared to the total amount of catalyst. Therefore, the operating conditions can be adjusted while considering the economic balance if a production capacity above a certain level is guaranteed.
Table 5 shows the specific surface area and pore volume of the catalyst particles measured according to the BET method by N2 gas adsorption. The BET surface area was approximately 80–82% of that of the fresh catalyst. The volume of 1.7–300 nm pores slightly decreased compared to the fresh catalyst as the CO2 methanation proceeded, but the effect of the H2/CO2 ratio was small or insignificant. Previous studies showed that alumina sinter easily under hydrothermal conditions, contributing to the reduction in the BET surface area [27]. The formation of deposits and pore clogging on the catalyst surface may decrease the specific surface area, which can decrease the CO2 conversion rate. The degree of influence of the H2/CO2 ratio on the BET surface area and pore volume was distributed at almost the same level.
The presence of carbon deposits on the catalyst surface was observed by using SEM. Figure 6 shows the SEM images after CO2 methanation of the surface morphology and after carbon deposition changes in the catalyst for each H2/CO2 ratio. Figure 6a–c shows that the pore structure was lost because of gradual thermal fatigue as compared to the fresh catalyst shown in Figure 6d. The carbon deposition on the catalyst surface appeared to slightly intensify as the H2/CO2 ratio decreased, but the difference was negligible.
The effects of the three H2/CO2 ratios (H2/CO2 = 3.6, 3.8, and 4.0) on CO2 conversion and CH4 yield were similar and led to nearly identical effects on carbon deposition. In other words, H2/CO2 molar ratios of 3.6–4.0 did not substantially affect the CO2 methanation performance. Therefore, the results indicate that stable operation is possible under the optimal combination for CO2 methanation obtained using the Taguchi design method within the H2/CO2 range of 3.6–4.0.

4. Conclusions

We optimized the operating conditions of CO2 methanation using the Taguchi design method. The CH4 yield was maximized by selecting the output factor (CO2 conversion) and efficient parameters. Reaction temperature, reactor pressure, and space velocity at three factors and four levels were investigated as influencing factors. The relative influence of these factors on CO2 methanation experiments using a Taguchi L16 array were in the following order: reactor pressure (factor B) > space velocity (factor C) > reaction temperature (factor A). The optimal combination of operating conditions for CO2 methanation was a reactor temperature of 315 °C, a pressure of 19 bar, and a space velocity of 6000 h−1. The optimal combination of parameters that was obtained was verified through experiments, and the relative difference (in percent) between the predicted and the experimental S/N ratio was 0.87. We also investigated whether stable catalyst performance could be achieved under the selected operating conditions, as well as the degree to which the H2/CO2 ratio affects the CO2 conversion rate and CH4 yield. Based on a stoichiometric ratio of H2/CO2 = 4, the CO2 conversion and CH4 yield increased as the H2/CO2 ratio increased from 3.6 to 3.8. The amount of coke generated after the reaction was inversely proportional to the H2/CO2 ratio, but the amount of coke generated for all H2/CO2 ratios (3.6, 3.8, and 4.0) accounted for only approximately 2 wt.% of the total sample mass. The results obtained using the Taguchi design method and catalyst characterization demonstrate that sufficient methane yield and long-term operational stability can be obtained at 315 °C, 9 bar, and 6000 h−1 in the range of H2/CO2 = 3.6–4.0.

Author Contributions

Conceptualization, C.-E.Y.; investigation, C.-E.Y., C.J. and H.-S.S.; writing—original draft preparation, C.-E.Y., D.K.; writing—review and editing, C.-E.Y., M.S. and D.K.; visualization, C.-E.Y.; supervision, M.S. and S.K. All authors have read and agreed to the published version of the manuscript.

Funding

This research received no external funding.

Acknowledgments

This work was supported by the Korea Institute of Energy Technology Evaluation and Planning (KETEP) and the Ministry of Trade, Industry & Energy (MOTIE) of the Republic of Korea (No. 20192810100080).

Conflicts of Interest

The authors declare no conflict of interest.

References

  1. Meylan, F.D.; Moreau, V.; Erkman, S. Material constraints related to storage of future European renewable electricity surpluses with CO2 methanation. Energy Policy 2016, 94, 366–376. [Google Scholar] [CrossRef]
  2. Momeni, M.; Soltani, M.; Hosseinpour, M.; Nathwani, J. A comprehensive analysis of a power-to-gas energy storage unit utilizing captured carbon dioxide as a raw material in a large-scale power plant. Energy Convers. Manag. 2021, 227, 113613. [Google Scholar] [CrossRef]
  3. Blanco, H.; Faaij, A. A review at the role of storage in energy systems with a focus on Power to Gas and long-term storage. Renew. Sustain. Energy Rev. 2018, 81, 1049–1086. [Google Scholar] [CrossRef]
  4. Götz, M.; Lefebvre, J.; Mörs, F.; Koch, A.M.; Graf, F.; Bajohr, S.; Kolb, T. Renewable Power-to-Gas: A technological and economic review. Renew. Energy. 2016, 85, 1371–1390. [Google Scholar] [CrossRef] [Green Version]
  5. Dannesboe, C.; Hansen, J.B.; Johannsen, I. Catalytic methanation of CO2 in biogas: Experimental results from a reactor at full scale. React. Chem. Eng. 2020, 5, 183–189. [Google Scholar] [CrossRef] [Green Version]
  6. Schaaf, T.; Grünig, J.; Schuster, M.R.; Rothenfluh, T.; Orth, A. Methanation of CO2-storage of renewable energy in a gas distribution system. Energy Sustain. Soc. 2014, 4, 1–14. [Google Scholar] [CrossRef]
  7. Chein, R.Y.; Wang, C.C. Experimental Study on CO2 Methanation over Ni/Al2O3, Ru/Al2O3, and Ru-Ni/Al2O3 Catalysts. Catalysts 2020, 10, 1112. [Google Scholar] [CrossRef]
  8. Gruber, M.; Weinbrecht, P.; Biffar, L.; Harth, S.; Trimis, D.; Brabandt, J.; Blumentritt, R. Power-to-Gas through thermal integration of high-temperature steam electrolysis and carbon dioxide methanation-Experimental results. Fuel Process. Technol. 2018, 181, 61–74. [Google Scholar] [CrossRef]
  9. Brooks, K.P.; Hu, J.; Zhu, H.; Kee, R.J. Methanation of carbon dioxide by hydrogen reduction using the Sabatier process in microchannel reactors. Chem. Eng. Sci. 2007, 62, 1161–1170. [Google Scholar] [CrossRef]
  10. Gao, J.; Wang, Y.; Ping, Y.; Hu, D.; Xu, G.; Gu, F.; Su, F. A thermodynamic analysis of methanation reactions of carbon oxides for the production of synthetic natural gas. RSC Adv. 2012, 2, 2358–2368. [Google Scholar] [CrossRef]
  11. Stangeland, K.; Kalai, D.; Li, H.; Yu, Z. CO2 methanation: The effect of catalysts and reaction conditions. Energy Procedia 2017, 105, 2022–2027. [Google Scholar] [CrossRef]
  12. Chwoła, T.; Spietz, T.; Więcław-Solny, L.; Tatarczuk, A.; Krótki, A.; Dobras, S.; Zdeb, J. Pilot plant initial results for the methanation process using CO2 from amine scrubbing at the Łaziska power plant in Poland. Fuel 2020, 263, 116804. [Google Scholar] [CrossRef]
  13. Türks, D.; Mena, H.; Armbruster, U.; Martin, A. Methanation of CO2 on Ni/Al2O3 in a structured fixed-bed reactor—A scale-up study. Catalysts 2017, 7, 152. [Google Scholar] [CrossRef] [Green Version]
  14. Du, G.; Lim, S.; Yang, Y.; Wang, C.; Pfefferle, L.; Haller, G.L. Methanation of carbon dioxide on Ni-incorporated MCM-41 catalysts: The influence of catalyst pretreatment and study of steady-state reaction. J. Catal. 2007, 249, 370–379. [Google Scholar] [CrossRef]
  15. Bassano, C.; Deiana, P.; Lietti, L.; Visconti, C.G. P2G movable modular plant operation on synthetic methane production from CO2 and hydrogen from renewables sources. Fuel 2019, 253, 1071–1079. [Google Scholar] [CrossRef]
  16. Pant, A.; Rai, J.P.N. Bioremediation of chlorpyrifos contaminated soil by two phase bioslurry reactor: Processes evaluation and optimization by Taguchi’s design of experimental (DOE) methodology. Ecotoxicol. Environ. Saf. 2018, 150, 305–311. [Google Scholar] [CrossRef]
  17. Kang, K.; Azargohar, R.; Dalai, A.K.; Wang, H. Hydrogen production from lignin, cellulose and waste biomass via supercritical water gasification: Catalyst activity and process optimization study. Energy Convers. Manag. 2016, 117, 528–537. [Google Scholar] [CrossRef]
  18. Özdemir, C.; Akın, A.N.; Yıldırım, R. Low temperature CO oxidation in hydrogen rich streams on Pt-SnO2/Al2O3 catalyst using Taguchi method. Appl. Catal. A Gen. 2004, 258, 145–152. [Google Scholar] [CrossRef]
  19. Chen, W.H.; Chiu, G.L.; Ong, H.C.; Lam, S.S.; Lim, S.; Ok, Y.S.; Kwon, E.E. Optimization and analysis of syngas production from methane and CO2 via Taguchi approach, response surface methodology (RSM) and analysis of variance (ANOVA). Fuel 2021, 296, 120642. [Google Scholar] [CrossRef]
  20. Tamimi, K.; Alavi, S.M.; Rezaei, M.; Akbari, E. Preparation of the Mn-Promoted NiO–Al2O3 nanocatalysts for low temperature CO2 methanation. J. Energy Inst. 2021, 99, 48–58. [Google Scholar] [CrossRef]
  21. Ocampo, F.; Louis, B.; Kiennemann, A.; Roger, A.C. CO2 methanation over Ni-Ceria-Zirconia catalysts: Effect of preparation and operating conditions. IOP Conf. Ser. Mater. Sci. Eng. 2011, 19, 012007. [Google Scholar] [CrossRef]
  22. Han, D.; Kim, Y.; Byun, H.; Cho, W.; Baek, Y. CO2 methanation of biogas over 20 wt% Ni-Mg-Al catalyst: On the effect of N2, CH4, and O2 on CO2 conversion rate. Catalysts 2020, 10, 1201. [Google Scholar] [CrossRef]
  23. Guilera, J.; Boeltken, T.; Timm, F.; Mallol, I.; Alarcón, A.; Andreu, T. Pushing the limits of SNG process intensification: High GHSV operation at pilot scale. ACS Sustain. Chem. Eng. 2020, 8, 8409–8418. [Google Scholar] [CrossRef]
  24. Shah, M.; Mondal, P. Optimization of CO2 reforming of methane process for the syngas production over Ni–Ce/TiO2–ZrO2 catalyst using the Taguchi method. Int. J. Hydrog. 2021, 46, 22799–22812. [Google Scholar] [CrossRef]
  25. Chen, C.J.; Hung, C.I. Optimization of co-gasification process in an entrained-flow gasifier using the Taguchi method. J. Therm. Sci. Technol. 2013, 8, 190–208. [Google Scholar] [CrossRef]
  26. Aziz, M.A.A.; Jalil, A.A.; Triwahyono, S.; Mukti, R.R.; Taufiq-Yap, Y.H.; Sazegar, M.R. Highly active Ni-promoted mesostructured silica nanoparticles for CO2 methanation. Appl. Catal. B Environ. 2014, 147, 359–368. [Google Scholar] [CrossRef]
  27. Johnson, M.F. Surface area stability of aluminas. J. Catal. 1990, 123, 245–259. [Google Scholar] [CrossRef]
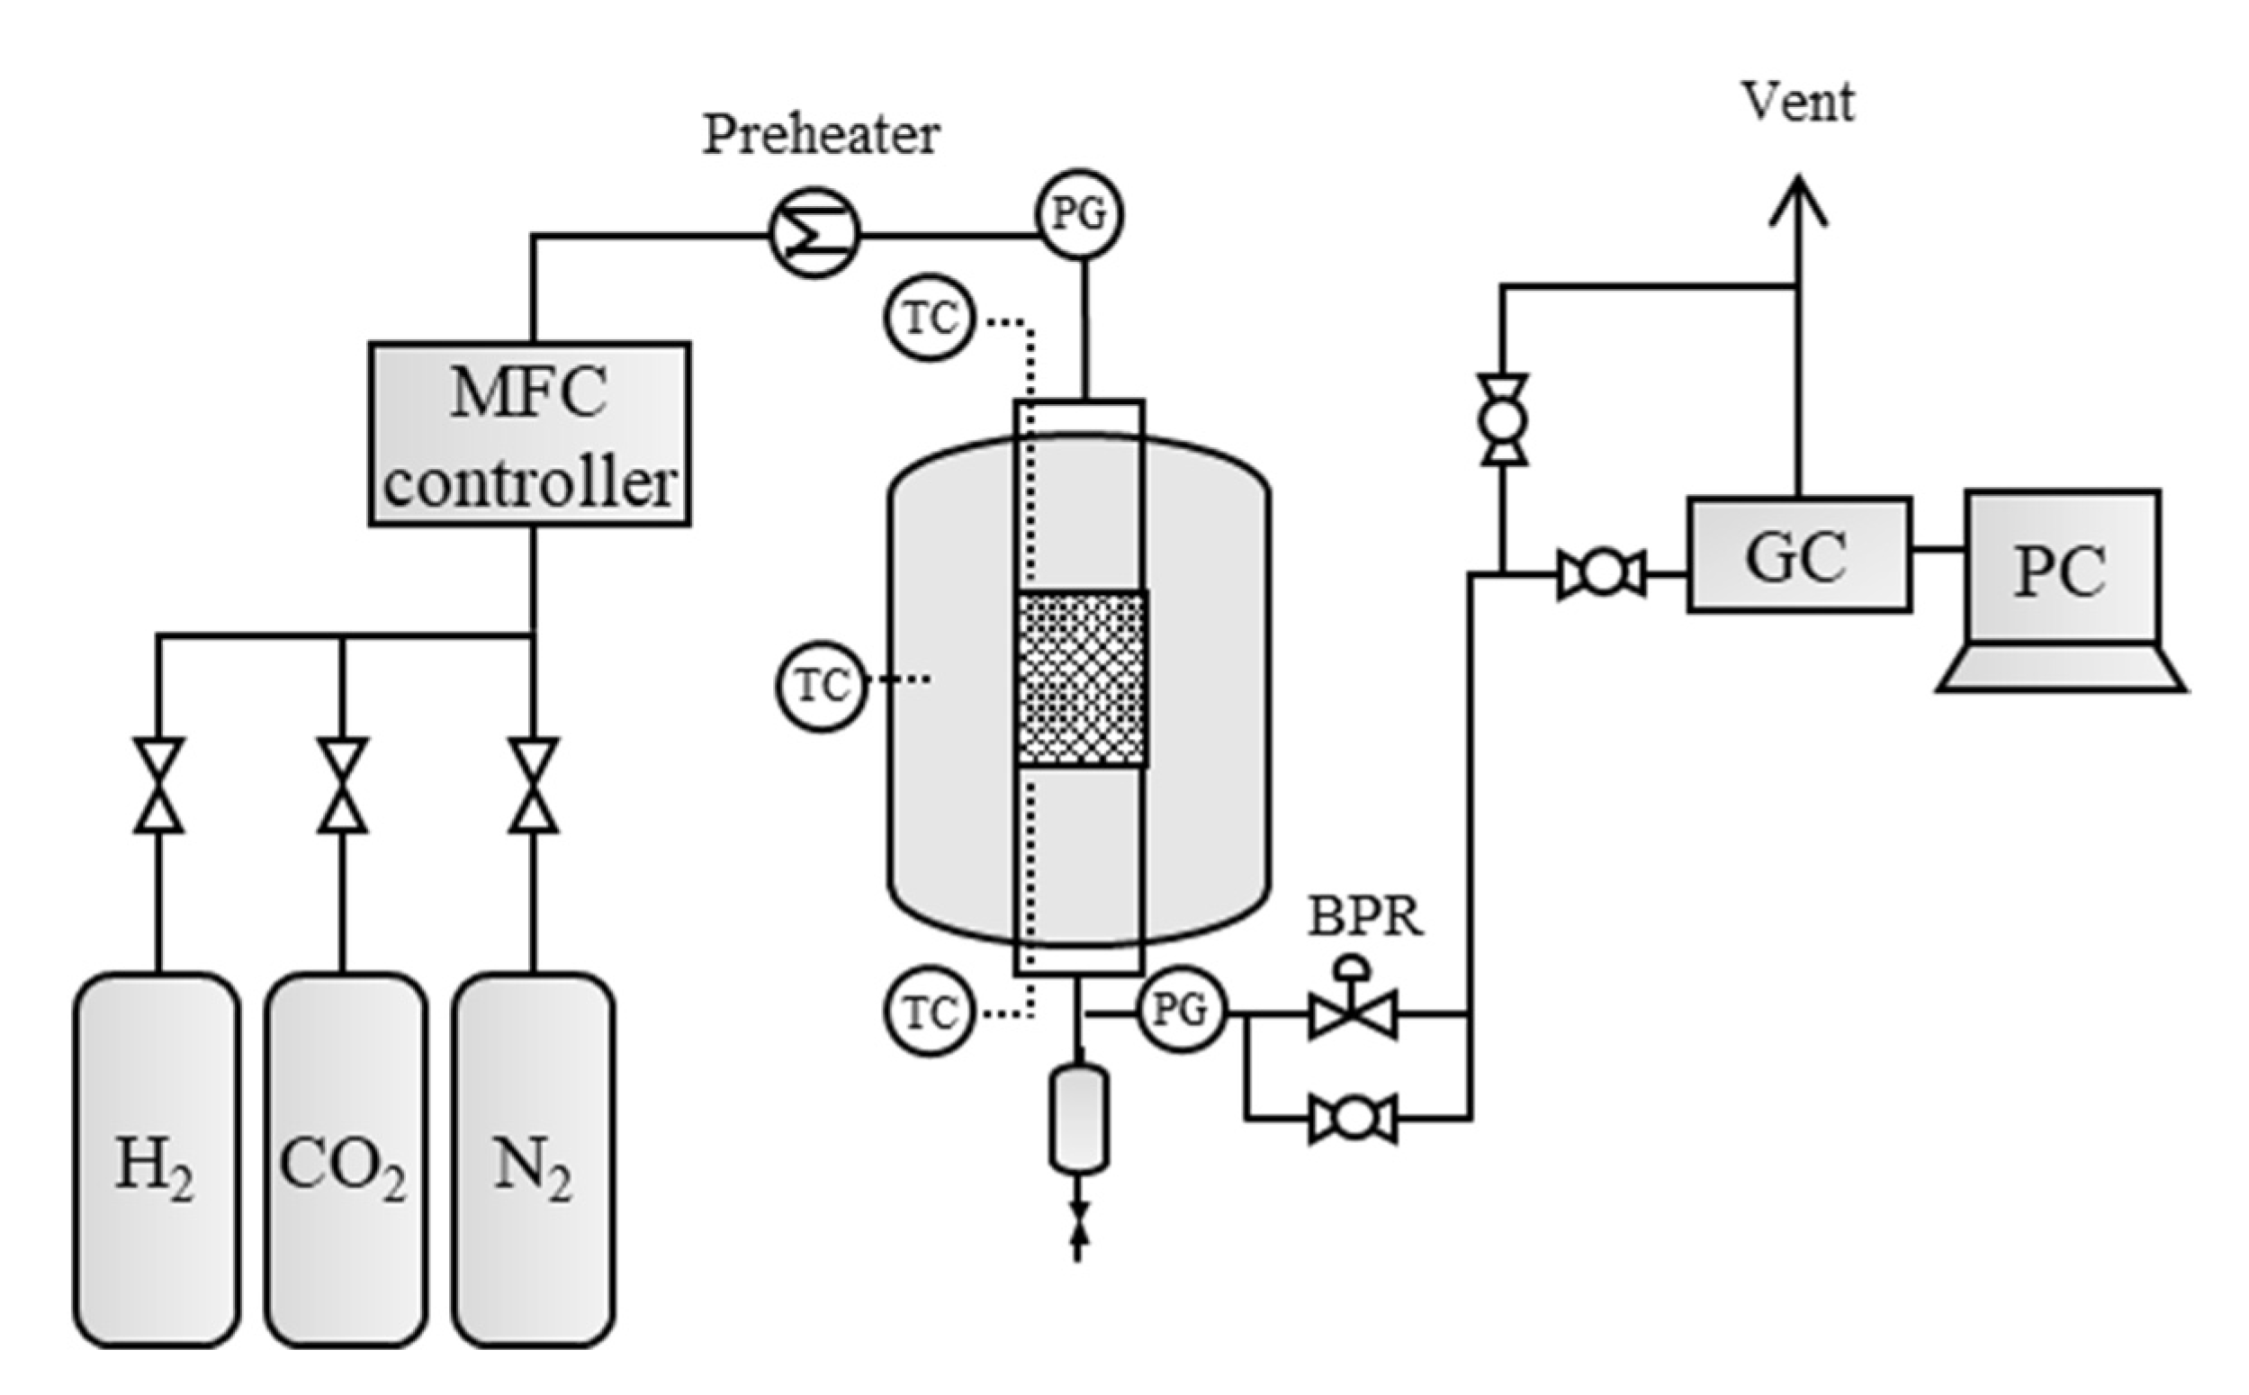
Figure 1. Schematic diagram of the experimental apparatus.
Energies 14 08414 g001
Figure 2. Primary effects of S/N ratio on CO2 conversion and CH4 yield.
Energies 14 08414 g002
Figure 3. Profiles of (a) effect value in terms of CO2 conversion and CH4 yield, and (b) mean S/N ratios for 16 cases of orthogonal array and optimal combinations.
Energies 14 08414 g003
Figure 4. Effect of H2/CO2 on CO2 conversion and CH4 yield at 315 °C, 19 bar, and 6000 h−1.
Energies 14 08414 g004
Figure 5. Coke produced during CO2 methanation at different H2/CO2 molar ratios.
Energies 14 08414 g005
Figure 6. SEM images of catalysts after CO2 methanation at H2/CO2 molar ratios of (a) 3.6, (b) 3.8, and (c) 4.0, and for (d) fresh catalyst.
Energies 14 08414 g006
Table 1. Summary of experimental studies on CO2 methanation.
Operating ParametersReactor TypeCatalystReference
Temperature: 250–550 °C
Reaction cycle, Metal loading amount
(H2/CO2 = 5; SV = 5835 h−1)
Packed-bed reactorNi/Al2O3,
Ru/Al2O3,
Ru-Ni/Al2O3
[7]
H2/CO2: 1–5
Pressure: 1–100 atm
Temperature: 200–600 °C
H2/CO2/H2O: 4/1/(0–0.5)
H2/CO2/O2: 4/1/(0–0.5)
Fixed-bed reactorNi-based catalyst [10]
Gas flow rate: 9.9–23 Nm3/h
H2/CO2: 3.72–4.2
Pressure: 1.5–3.0 bar
Temperature: 280–350 °C
Microchannel reactor Ni-based catalyst [12]
Pressure: 1–10 bar
Temperature: 250–400 °C
Triple fixed-bed reactorNi/Al2O3 catalyst[13]
GHSV: 5760–23,000 L kg−1 h−1
H2/CO2: 1.0–4.2
Temperature: 100–600 °C
Fixed-bed reactorNi-based catalyst
(Ni-MCM-41)
[14]
WHSV: 6000–11,500 Ncm3/g∙h
H2/CO2: 4.3–4.5
Pressure: 1–5 bar
Multi-tubular fixed-bed reactor0.5 wt.% Ru on Al2O3[15]
Table 2. Experimental parameters and their levels for the Taguchi design.
FactorUnitLevel 1Level 2Level 3Level 4
ATemperature°C280315350385
BPressurebar171319
CSpace velocityh−1600013,50021,00028,500
Table 3. L16 orthogonal array used in this study.
No.Factor AFactor BFactor C
Temperature (°C)Pressure (Bar)Space Velocity (H−1)
128016000
2280713,500
32801321,000
42801928,500
5315113,500
631576000
73151328,500
83151921,000
9350121,000
10350728,500
11350136000
123501913,500
13385128,500
14385721,000
153851313,500
16385196000
Table 4. Validation results from experiments for optimal parameter combination.
Parameter CombinationPredictedExperimental
Confirmation
Relative Difference (%)
S/N RatioS/N Ratio
A2B4C139.8039.450.87
Table 5. BET analysis of catalysts after CO2 methanation for 24 h.
H2/CO2Bet Surface Area (m2/g)1.7 nm–300 nm
Pore Volume (cm3/g)
Total Pore Volume (cm3/g)
3.6129.20.240.298
3.8130.10.240.300
4.0132.80.250.298
Fresh catalyst161.10.260.301
Publisher’s Note: MDPI stays neutral with regard to jurisdictional claims in published maps and institutional affiliations.