Article

Biomass Potential for Producing Power via Green Hydrogen

by
Nestor Sanchez
1,
David Rodríguez-Fontalvo
1,
Bernay Cifuentes
2,
Nelly M. Cantillo
1,
Miguel Ángel Uribe Laverde
1 and
Martha Cobo
1,*
1
Group of Energy, Materials, and Environment, Department of Chemical and Biochemical Processes, Faculty of Engineering, Universidad de La Sabana, Chia 250001, Colombia
2
Faculty of Engineering, Chemical Engineering, Universidad de La Salle, Bogotá 111711, Colombia
*
Author to whom correspondence should be addressed.
Energies 2021, 14(24), 8366; https://doi.org/10.3390/en14248366
Submission received: 7 October 2021 / Revised: 29 October 2021 / Accepted: 18 November 2021 / Published: 11 December 2021

Abstract

:
Hydrogen (H2) has become an important energy vector for mitigating the effects of climate change since it can be obtained from renewable sources and can be fed to fuel cells for producing power. Bioethanol can become a green H2 source via Ethanol Steam Reforming (ESR) but several variables influence the power production in the fuel cell. Herein, we explored and optimized the main variables that affect this power production. The process includes biomass fermentation, bioethanol purification, H2 production via ESR, syngas cleaning by a CO-removal reactor, and power production in a high temperature proton exchange membrane fuel cell (HT-PEMFC). Among the explored variables, the steam-to-ethanol molar ratio (S/E) employed in the ESR has the strongest influence on power production, process efficiency, and energy consumption. This effect is followed by other variables such as the inlet ethanol concentration and the ESR temperature. Although the CO-removal reactor did not show a significant effect on power production, it is key to increase the voltage on the fuel cell and consequently the power production. Optimization was carried out by the response surface methodology (RSM) and showed a maximum power of 0.07 kWh kg−1 of bioethanol with an efficiency of 17%, when ESR temperature is 700 °C. These values can be reached from different bioethanol sources as the S/E and CO-removal temperature are changed accordingly with the inlet ethanol concentration. Because there is a linear correlation between S/E and ethanol concentration, it is possible to select a proper S/E and CO-removal temperature to maximize the power generation in the HT-PEMFC via ESR. This study serves as a starting point to diversify the sources for producing H2 and moving towards a H2-economy.

1. Introduction

Ensuring access to sustainable and reliable energy and decarbonizing the energy system by mid-21st century are the primary commitments of the Paris Agreement. The decarbonization of the energy sector can be fulfilled by implementing renewable energy alternatives such as wind, solar, hydro, and biomass instead of fossil fuels [1]. According to the hydrogen (H2) council, H2 plays a relevant role in a global industrial decarbonization [2]. H2 is commonly produced by methane steam reforming (MSR). However, the use of cleaner, renewable feedstocks is more promising from an environmental perspective [3]. Bioethanol is a renewable feedstock for producing H2 by steam reforming, hereafter referred to as ethanol steam reforming (ESR). Main advantages of the use of bioethanol include: (i) high versatility and availability; (ii) low sulfur content; and (iii) high technical readiness level (TRL) [4]. Biomass is converted into H2 via bioethanol by coupling fermentation, distillation, ESR, and syngas cleaning [5]. The resulting H2 could be fed into a fuel cell to produce power. Among the available fuel cell types, high temperature proton exchange membrane fuel cells (HT-PEMFC) present high tolerance to syngas impurities such as carbon monoxide (CO) and carbon dioxide (CO2) [6], making them suitable for use in this process.
Several factors influence H2 production and thus power production in the HT-PEMFC. Rossetti et al. [7] determined that the higher the steam-to-ethanol ratio (S/E) is, the higher the H2 production but the lower the net electric power output will be. This behavior is associated with the fact that the energy required to reach the ESR temperature increases with the water content in the feed, reducing the process net energy output. Besides, Cobo et al. [8] reported that H2 selectivity increases along with the S/E over a Rh6Pt2/La2O3 catalyst at 700 °C. An increment on the S/E will also reduce the carbon deposits [9]. Furthermore, increasing S/E will have an outstanding effect on reducing the CO content. Thermodynamic analyses show that a S/E above 4.0 will result in a H2 yield > 4.0 with a CO content < 10 mol.% [10]. S/E is commonly set by mixing water and azeotropic ethanol (~96 vol.%). The latter is obtained by a distillation train that purifies the raw bioethanol obtained after fermentation. This process removes harsh impurities from the raw bioethanol that further affect ESR, but it is highly energy consuming.
Selection of the purification technology depends on the features of the raw bioethanol, which is produced from a wide spectrum of biomass such as corn grain, sugar beet, sugarcane juice, molasses, sugarcane press-mud, wheat straw, wood hydrolysates, cassava, and more [4,11,12]. Fermentation of those biomass results in a raw bioethanol with different ethanol profiles that, consequently, will influence H2 production by ESR and, subsequently, the power production in a HT-PEMFC [4]. Raw bioethanol derived from those kinds of biomass is a mixture of solid and liquid phases. Therefore, to distill this raw bioethanol, solids must be removed by filtration and centrifugation. However, the use of additional separation units will increase the overall cost. As an alternative, batch distillation devices are used to purify bioethanol when high solid content is present in the inlet stream [5]. Furthermore, this is a suitable strategy to purify bioethanol and produce H2 for small-scale farmers [13], considered to be those whose area harvested is less than 5 ha [14], and which can produce up to 95 L day-1 [15]. Alembics are batch distillation devices that are frequently used in small facilities to produce beverage spirits with an ethanol content up to 70 vol.%. The ethanol content will depend on the distillation time, easily achieving values between 35 wt.% and 46 wt.% [16]. This ethanol content is key to increase H2 yield and reduce energy consumption during ESR.
Up to now, two main factors have been identified: the biomass source, that influences the resulting ethanol content on raw bioethanol, and the S/E that could be adjusted during batch distillation. Aside from those factors, temperature of the catalytic reactions of both ESR and syngas cleaning are key to produce H2 for its subsequent use in a HT-PEMFC. On one hand, temperatures between 600 and 700 °C will reduce the energy demand for ESR, while reducing the cooling demand of the overall process [10]. Due to the endothermicity of the steam reforming reaction, higher temperature favors ethanol conversion into H2 [17]. Cifuentes et al. [18] designed a monolith washcoated with RhPt/CeO2-SiO2 for producing H2 from bioethanol via ESR. This catalyst produces at least 60 mol.% H2 during 50 h time on stream through the ESR of bioethanol coming from the fermentation of biomass. In addition, this catalyst is resistant to the presence of bioethanol impurities due to the Rh active sites and the oxygen storage capacity of CeO2 that oxidizes carbon deposits [4,19]. In addition, Pt active sites promote the water gas shift reaction (WGSR) and consequently increase H2 yield [20]. On the other hand, the syngas cleaning is mainly focused on the removal of CO, which poisons the HT-PEMFC electrodes. The temperature to remove CO from the syngas is critical and depends on the catalyst. For instance, Cifuentes et al. [21] assessed three different nano-structured catalysts to remove CO from the syngas stream. They showed that Au-Cu catalyst supported over a nano-shaped polyhedral and CeO2 rods achieved higher CO removal than Au-Cu catalyst supported over nano-shaped cube CeO2. In the former case, at temperatures between 220 and 260 °C, almost complete CO conversion was observed, while in the latter case the highest CO conversion was 80% at 280 °C. Similarly, Cifuentes et al. [22] reported that monoliths washcoated with Au-Cu/CeO2 showed the highest activity at 210 °C.
Since different biomass compositions lead to different ethanol profiles and, consequently, different syngas composition, it is pertinent to determine proper conditions to convert bioethanol derived from biomass into H2 for its subsequent use for power generation in a HT-PEMFC. To do so, response surface methodology (RSM) along with modelling and simulation in Aspen Plus® can be used as a tool to define proper conditions along the process. RSM is a tool that determines the optimal response by coupling mathematical and statistical models while decreasing the number of experimental runs [23]. Different studies have combined the use of Aspen Plus® and RSM to optimize different processes such as gasification of Sysigium cumini [23], methanol steam reforming to produce H2 for HT-PEMFC [24], extraction of γ-Oryzanol from defatted rice bran [25], ESR to produce H2 for low temperature PEMFC (LT-PEMFC) [20], biomass steam-gasification [26], dividing wall distillation columns [27], and industrial CO2 capture [28]. The main purpose of Aspen Plus® is to model and simulate the complete process, whereas the aim of RSM is to determine the optimal conditions based on an experimental design that includes factors that might affect the performance of the overall process.
Based on the above, the aim of this paper is to optimize the power production in a HT-PEMFC from biomass via ESR by coupling Aspen Plus® and RSM. To do so, the process, which encompasses four stages (i.e., batch distillation, ESR, CO-removal, and HT-PEMFC), was modelled and simulated in Aspen Plus®. Additionally, five factors (i.e., ethanol composition, alembic load, S/E, ESR temperature, and CO-removal temperature) were analyzed and optimized through RSM. Results from this study lead to the selection of suitable conditions to convert any kind of bioethanol into power via ESR.

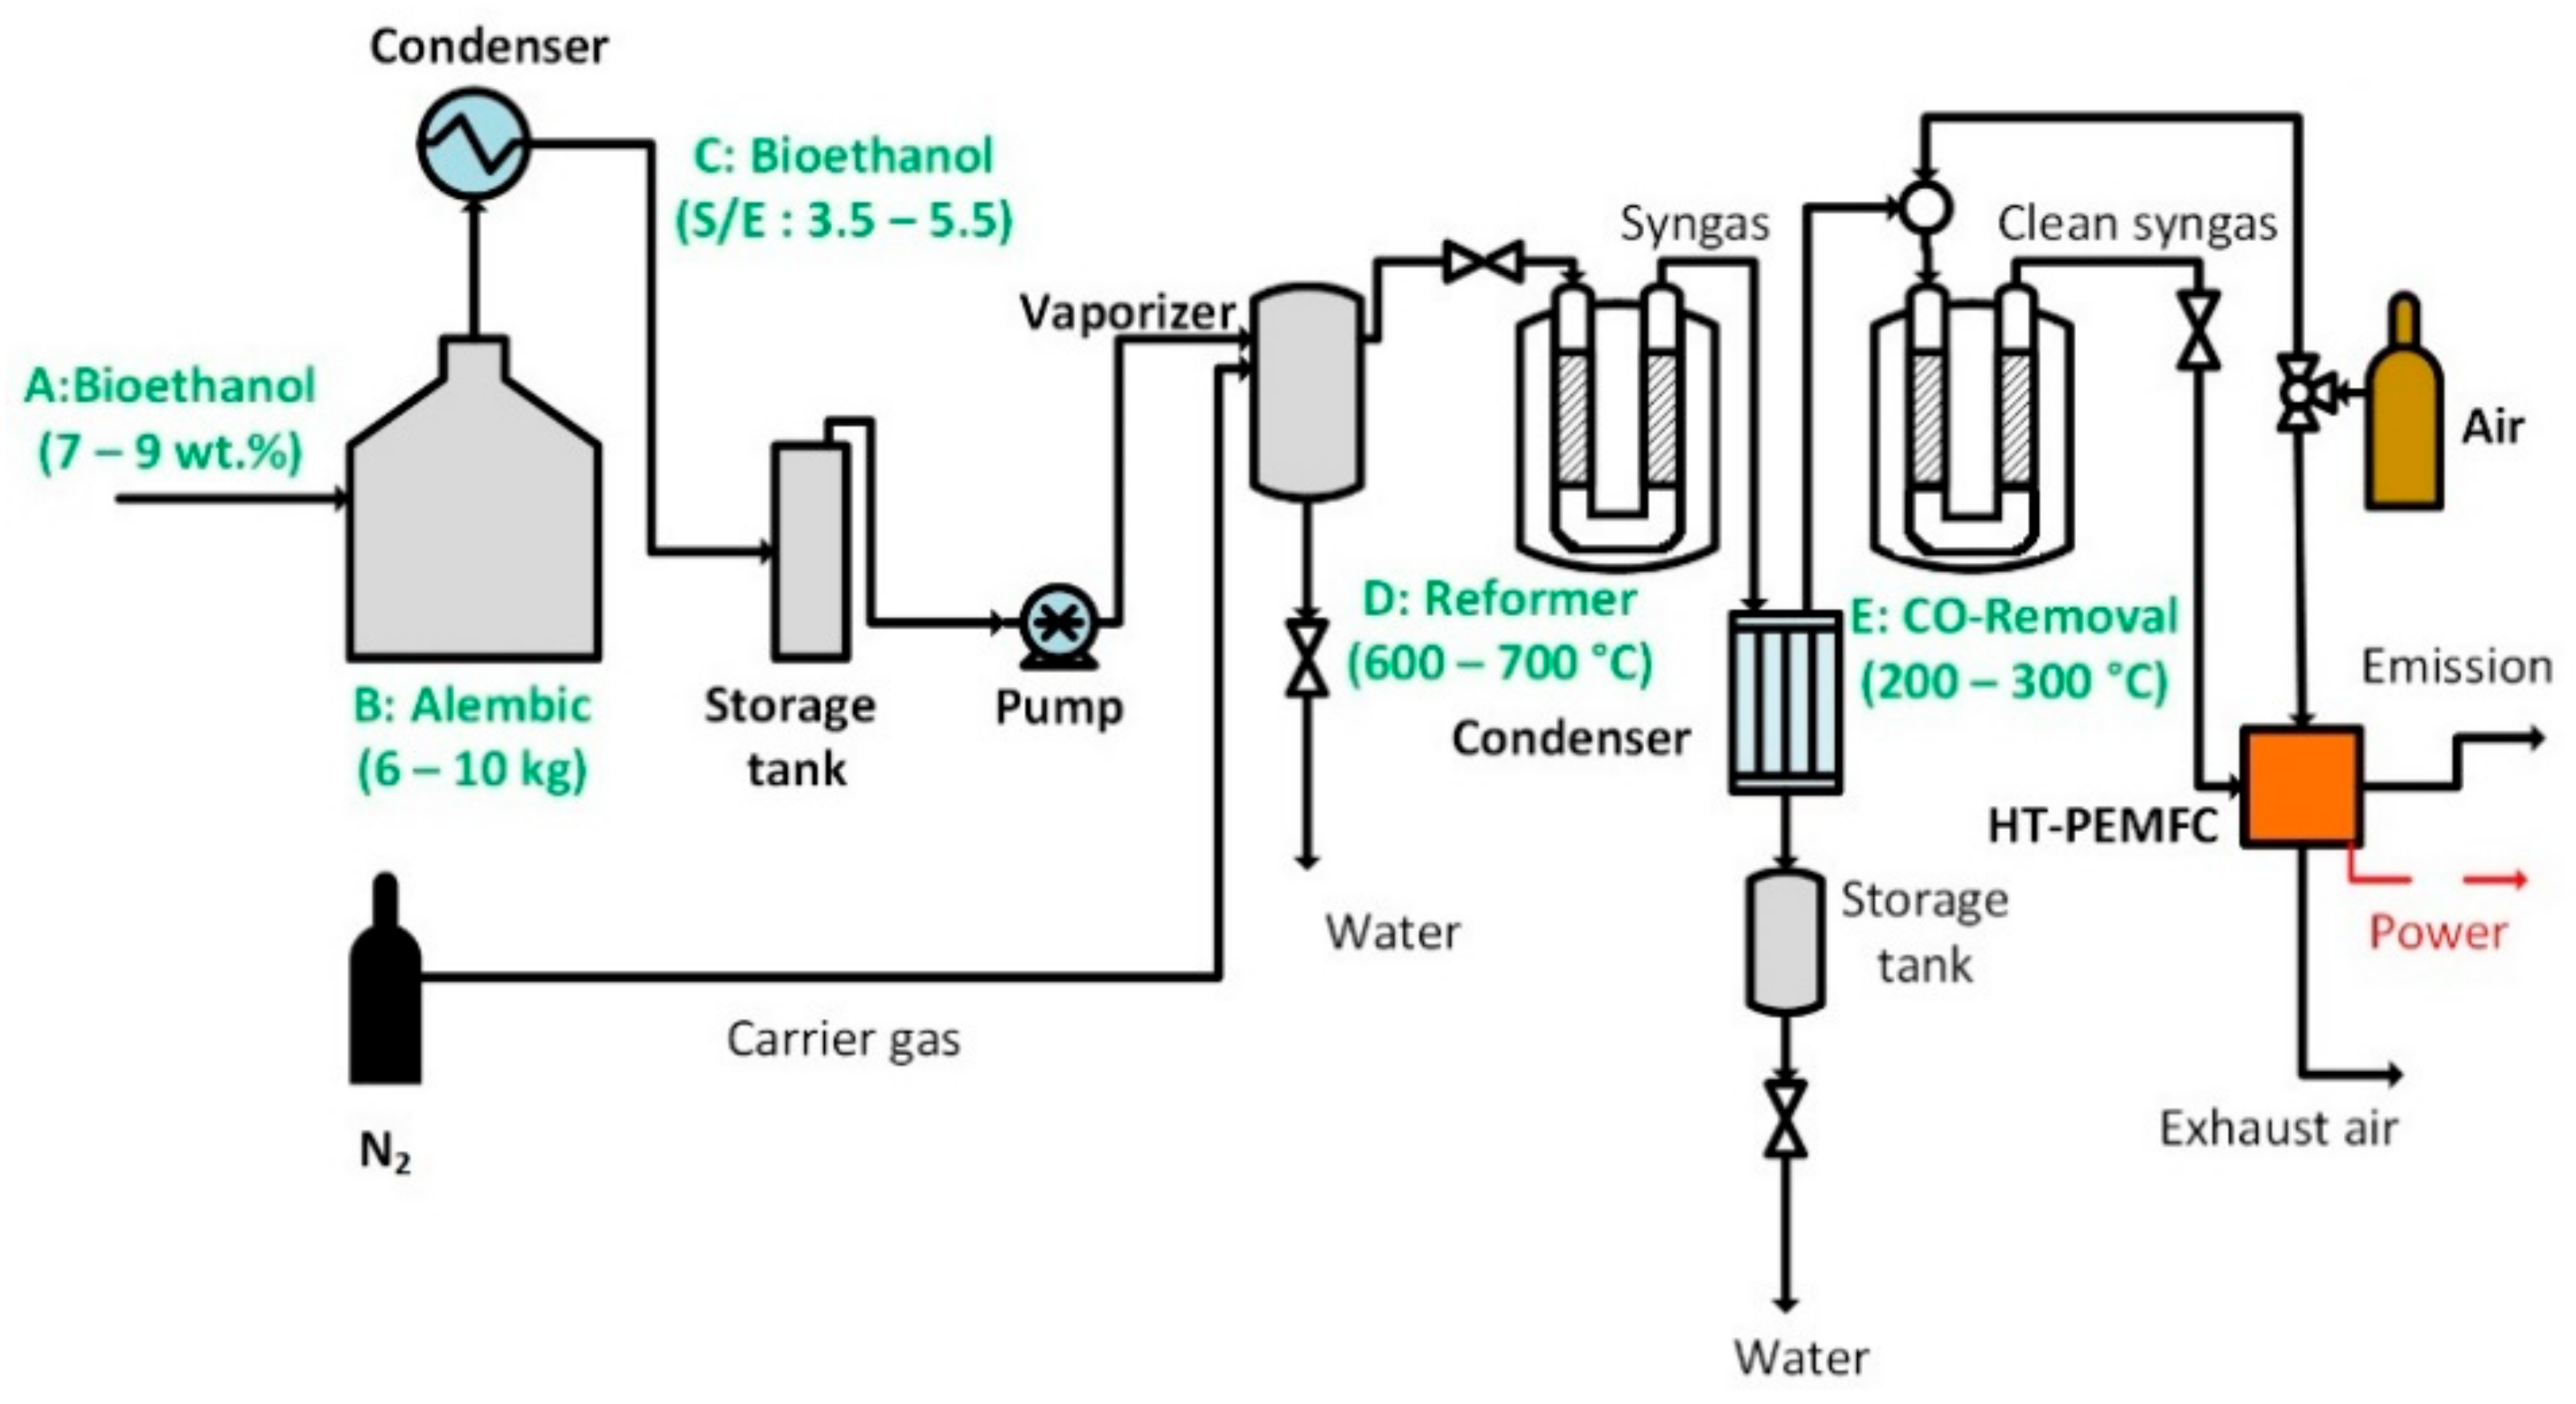
2. Materials and Methods

For determining the suitable conditions to produce power from biomass via ESR, a simulation in Aspen Plus® V.12 (Aspen Tech, Bedford, MA, USA) and Matlab 2020b (MathWorks, Natick, MA, USA) coupled to the RSM was carried out. The aim of the simulation in Aspen Plus® was to model and simulate the ethanol conversion into H2, while the purpose of MATLAB was to model and simulate the performance of a commercial HT-PEMFC. Lastly, through the RSM, an optimization of main variables was performed. Details of the methodology are shown in the upcoming sections.

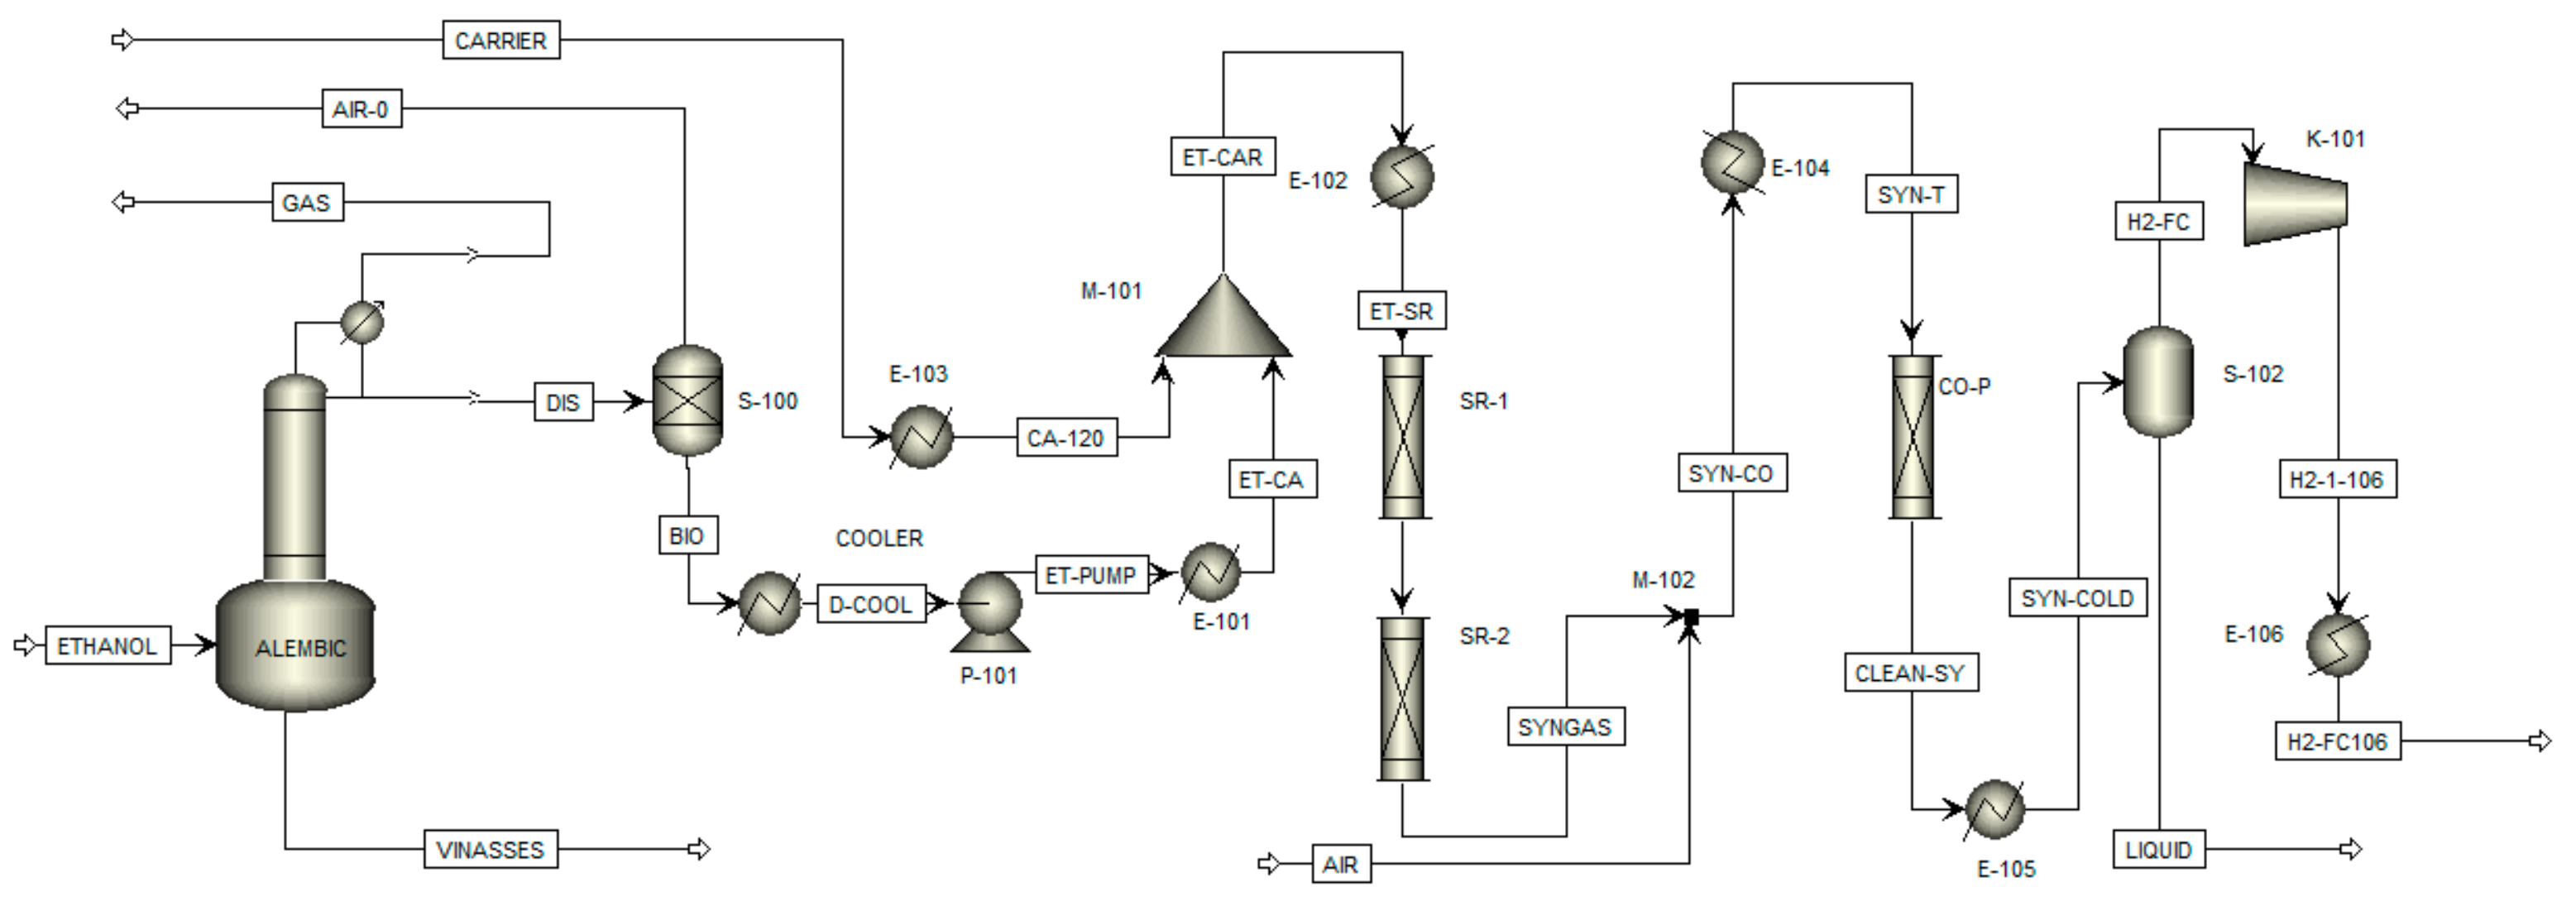
2.1. Aspen Plus® Simulation
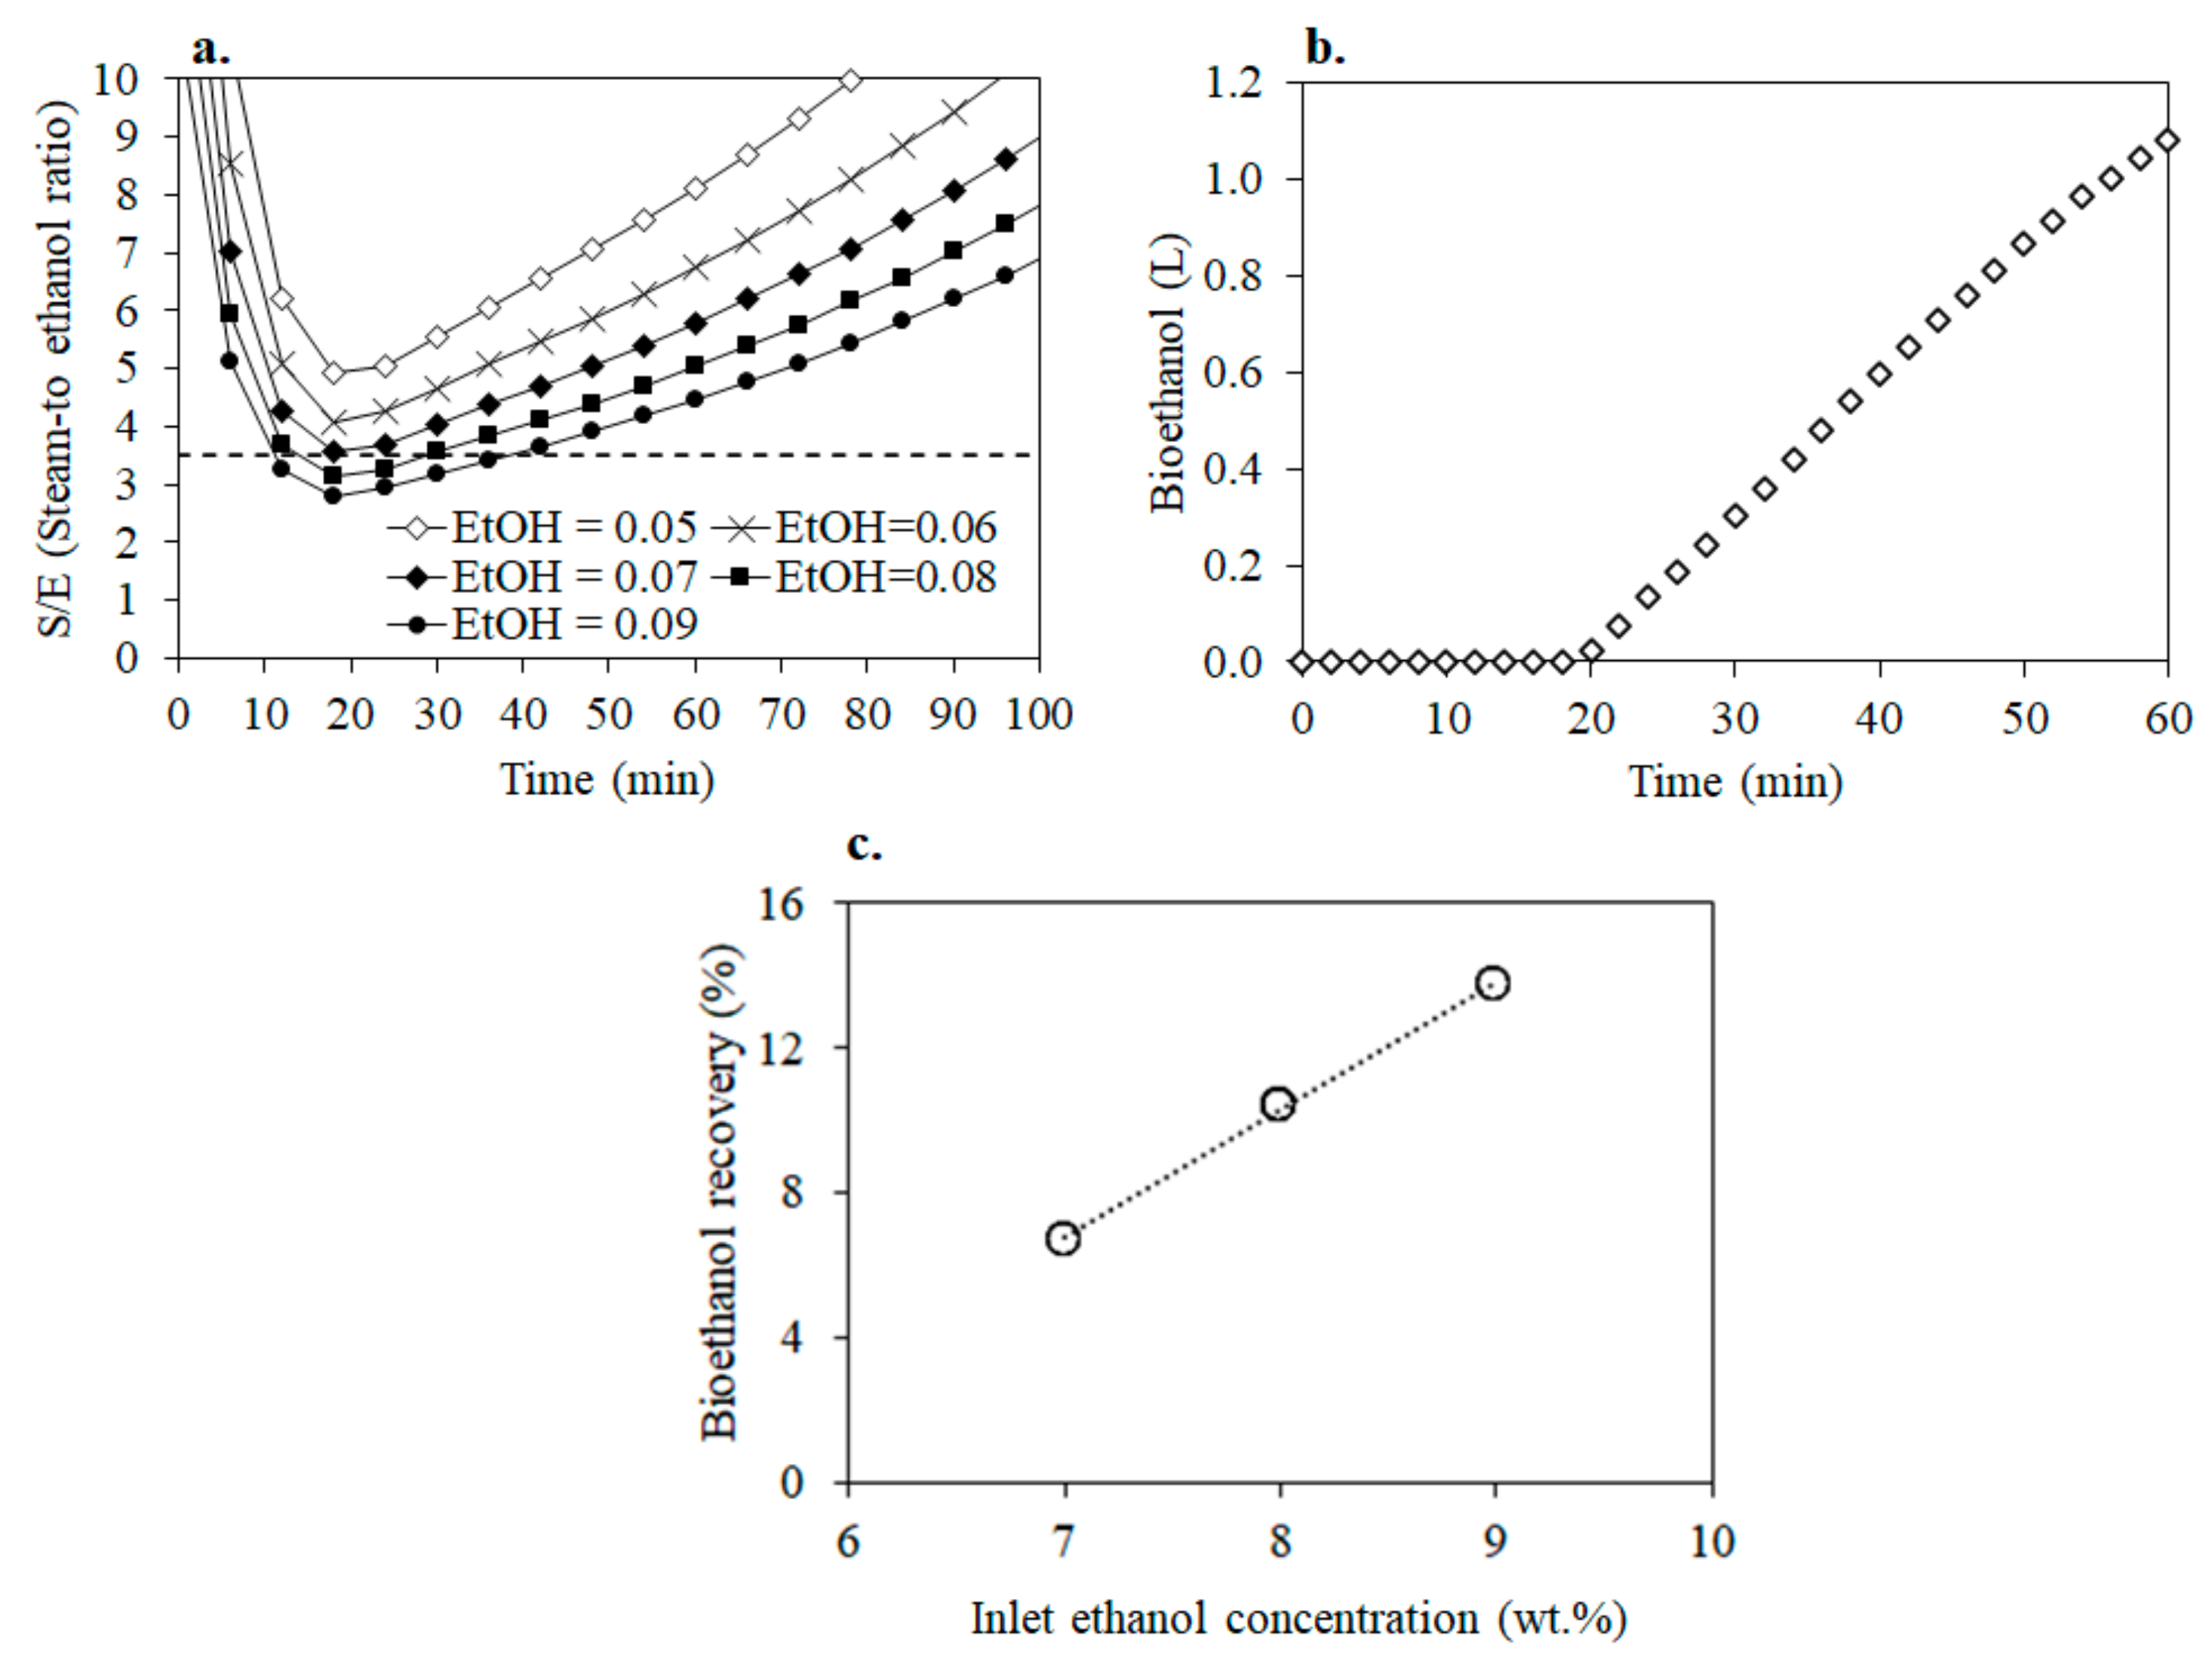
Figure 1 shows the Aspen flowsheet for producing syngas enriched with H2 from ethanol. The simulation mainly includes ethanol purification by batch distillation (i.e., Alembic), ethanol conversion into syngas by ESR (i.e., SR-1 and SR-2), and syngas purification by CO-removal reaction process (i.e., CO-P). In addition, several auxiliary units such as heat exchangers, compressors, and pumps were employed to condition the process streams.

2.1.1. Alembic

Simulation of the alembic was carried out in Aspen Plus® V.12 (Aspen Tech, Bedford, MA, USA) by using the Batch-Sep subroutine. The non-random two-liquid (NRTL) thermodynamic model was employed as thermodynamic package. The batch distillation unit was modelled with two equilibrium stages, named as pot and partial condenser. Two distillation receivers were employed. The first receiver collected the liquid fraction, while the second receiver collected the vapor fraction. The condenser and pot characteristics are described in Table S1 (See Supplementary Material S1). The distillate mass flow rate was adjusted at 0.017 kg min−1. The initial condition was set as initial charge. It means that the pot is filled with a specific amount of charge and the remainder was initially filled with the pad gas, which was air. Moreover, pressure was set to the ambient pressure, 0.76 bar. The operating step was set as a duty of 1.3 kW. The final condition was stablished to fulfill the desirable S/E ratio.

2.1.2. Ethanol Steam Reforming

Ethanol steam reforming (ESR) was modelled using a plug bed packed reactor (PBD) in Aspen Plus® and using the kinetics for the following reactions: ethanol decomposition (Equation (1)), reverse WGSR (Equation (2)), methane steam reforming (Equation (3)); and incomplete methane steam reforming (Equation (4)) [22]. The kinetic parameters were calculated using the software Aspen Plus® and are shown in Table S2.1 (See Supplementary Material S2). Results of the experimental and Aspen Plus® data are shown in Table S2.2 (See Supplementary Material S2). The kinetic parameters make it possible to forecast the behavior of H2 and CO yield over monoliths washcoated with RhPt/CeO2-SiO2 at temperatures between 600 and 700 °C since the student’s statistical t-test showed that there was no significant difference between the experimental and Aspen Plus® results according to Table S2.3 (See Supplementary Material S2). Those temperatures were selected to guarantee that ethanol conversion was complete [18].
C 2 H 5 OH CO + H 2 + CH 4
CO 2 + H 2 CO + H 2 O
CH 4 + 2 H 2 O CO 2 + 4 H 2
CH 4 + H 2 O CO + 3 H 2

2.1.3. Carbon Monoxide Removal

The CO-removal from the syngas stream was modelled using a PBD reactor in Aspen Plus® and using the kinetics previously reported by Cifuentes et al. [22] who considered the oxidation of CO (Equation (5)), WGSR (Equation (6)), and the H2 oxidation (Equation (7)). The kinetic parameters were calculated using the software Aspen Plus® and shown in Table S3.1 (See Supplementary Material S3). Results of the experimental and Aspen Plus® data are shown in Table S3.2 (See Supplementary Material S3). The kinetic parameters enable forecasting of the behavior of CO removal over monoliths washcoated with Au-Cu/CeO2 at temperatures between 200 and 300 °C since the student’s statistical t-test showed that there was no significant difference between the experimental and Aspen Plus® results according to Table S3.3 (See Supplementary Material S3).
CO + 0.5 O 2   CO 2
CO + H 2 O CO 2 + H 2
H 2 + 0.5 O 2 H 2 O

2.2. Matlab

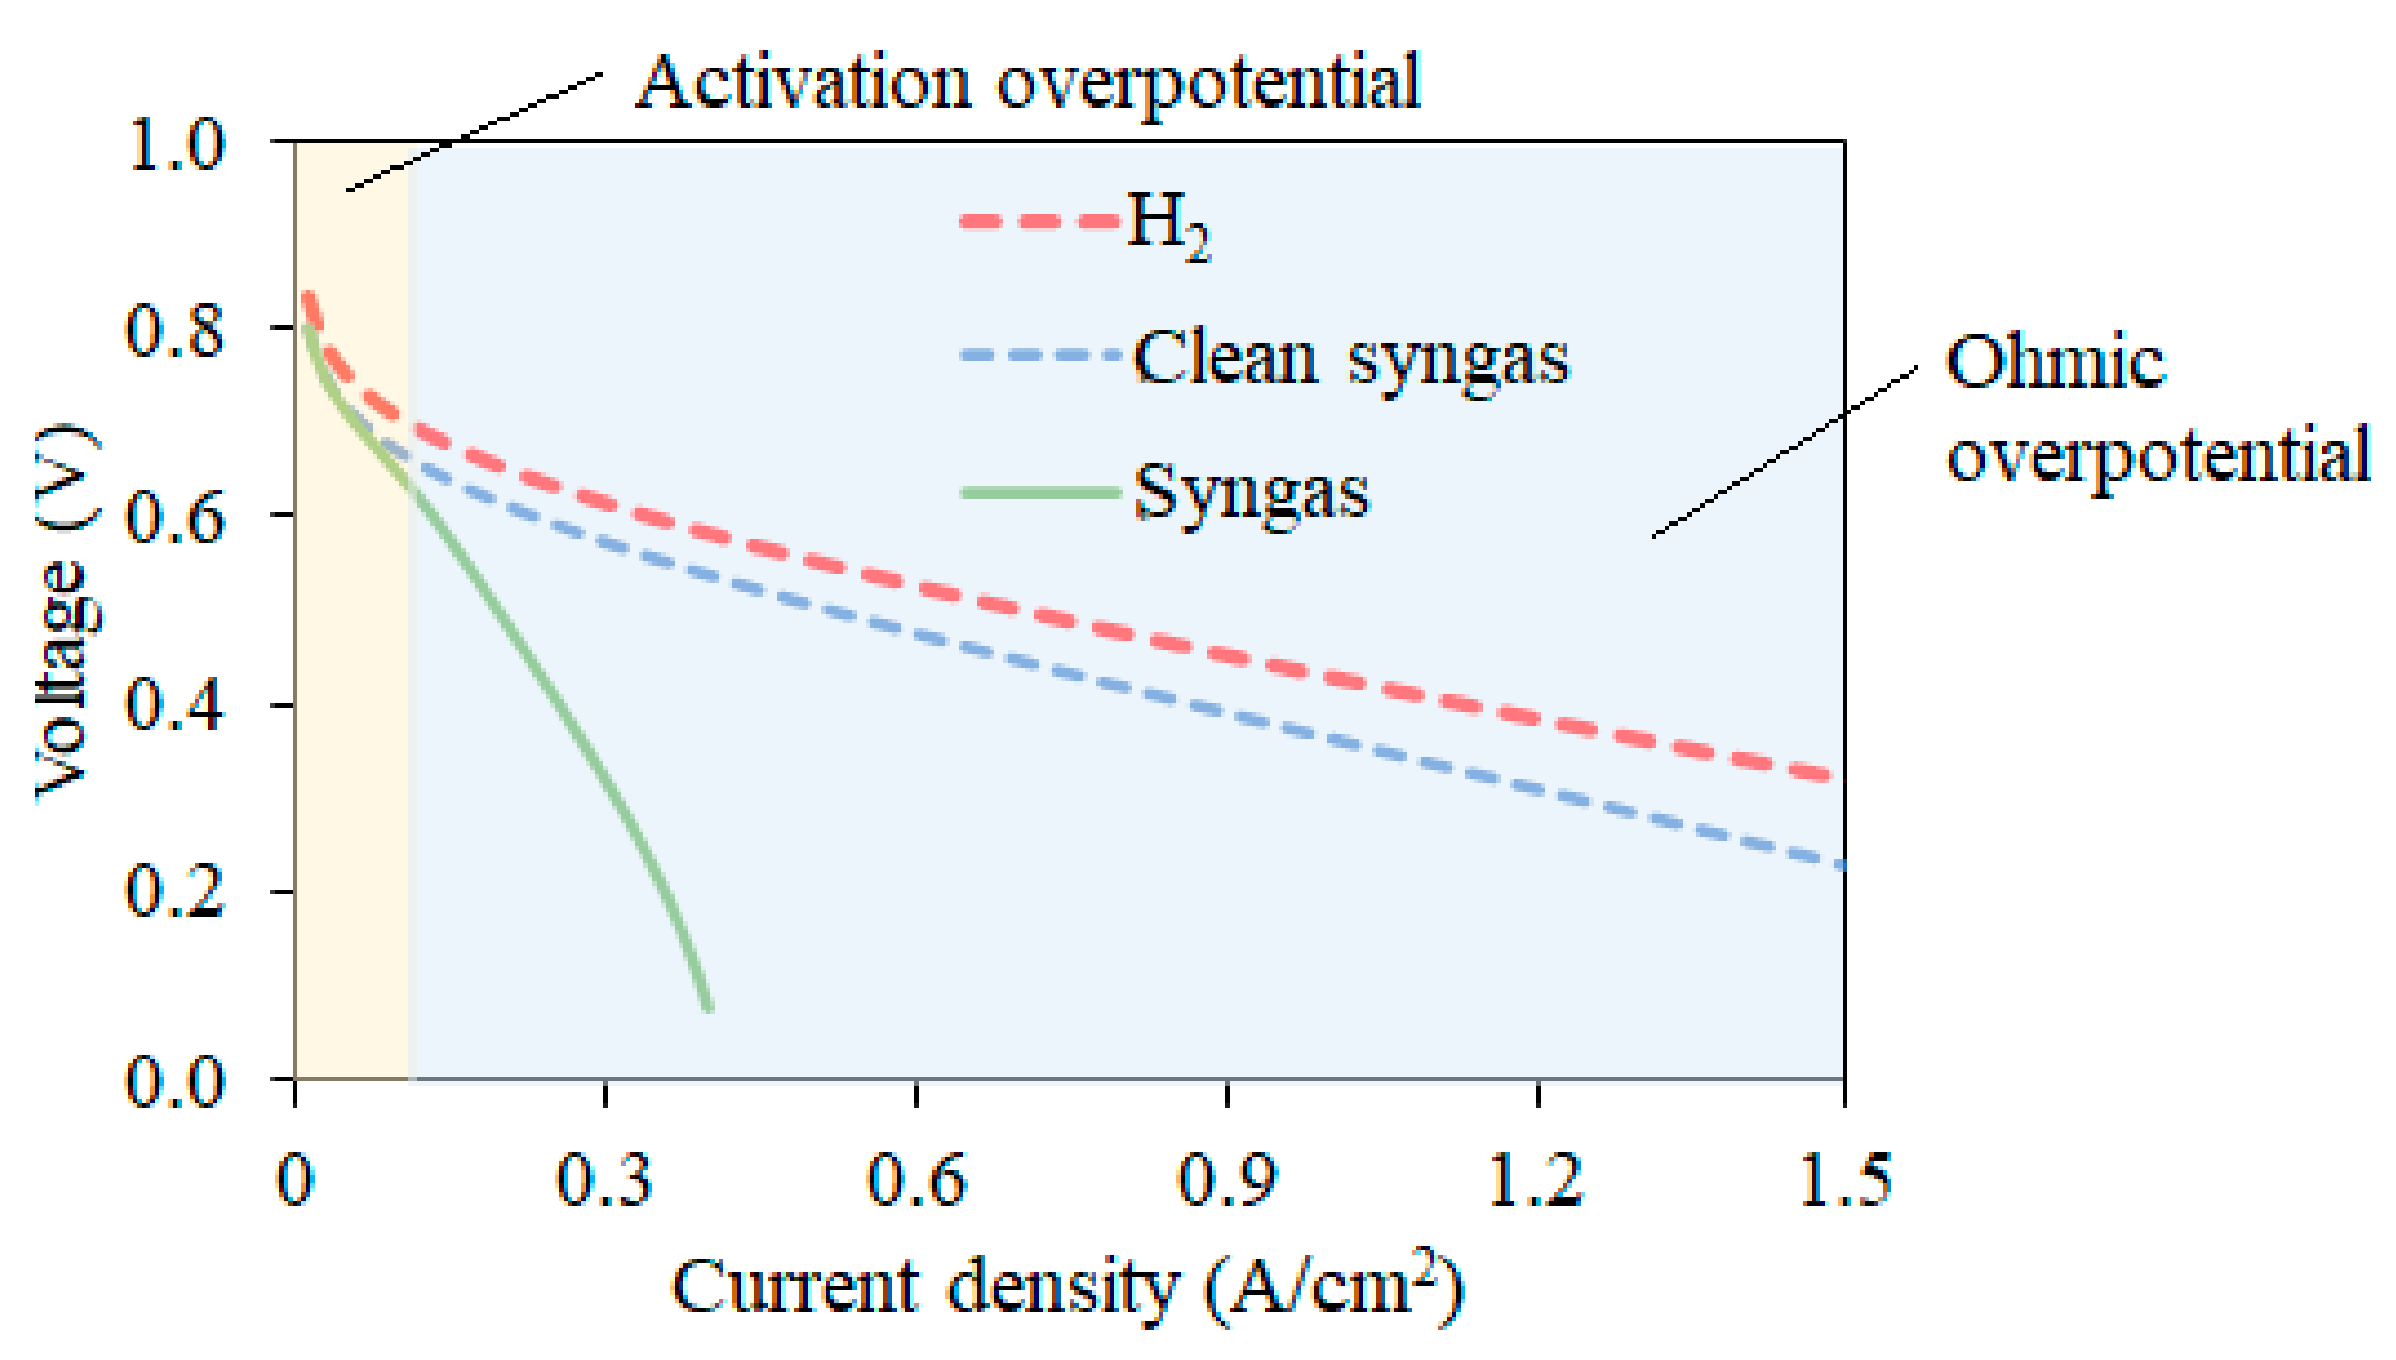
High Temperature Proton Exchange Membrane Fuel Cell (HT-PEMFC)

A one-dimensional and semi-empirical model of a HT-PEMFC described by Nalbant et al. [29] was adopted. The model was fully developed in Matlab (MathWorks, Natick, MA, USA) and equipped with Ordinary Differential Equation solver (ODE 45) to solve the governing equations. This model considered the following assumptions: (i) steady state and isothermal operation; (ii) convection effects are negligible; (iii) ideal gas behavior; (iv) no water condensation; and (v) negligible gas permeability through the membrane. The catalyst is considered an interface and the electrochemical reactions are assumed to occur in the gas phase. The chemical reactions taking place in the anode and cathode compartments correspond to Equations (8) and (9), respectively.
H 2   2 H + + 2 e Anode
O 2 + 4 H + + 4 e   2 H 2 O   Cathode
The complete model of the HT-PEMFC is described in Supplementary Material S4. Power of the HT-PEMFC was calculated according to Equation (10), where PNET is the power delivered by the fuel cell in watts, N is the number of fuel cells, j is the current density (A m−2), A is the cell area (m2), and V is the cell voltage (V). The current density was set to 0.2 A cm−2 to avoid possible performance issues of the fuel cell. Previous studies showed that, at this current value, higher efficiencies were observed [30]. The number of fuel cells (N) was calculated according to Equation (11), where F is the faraday constant (sA mol−1), NH2 is the molar H2 flow rate (mol s−1), and λH2 is the stoichiometric ratio. N is an important parameter since it determines the overall cost of the fuel cell. The area (A) of the fuel cell was set to 300 cm2 since it is available in the market. The net power and the number of cells needed were estimated using the following equations:
P NET = N * A * j * V  
N = 2 * F * N H 2 λ H 2 * A * j

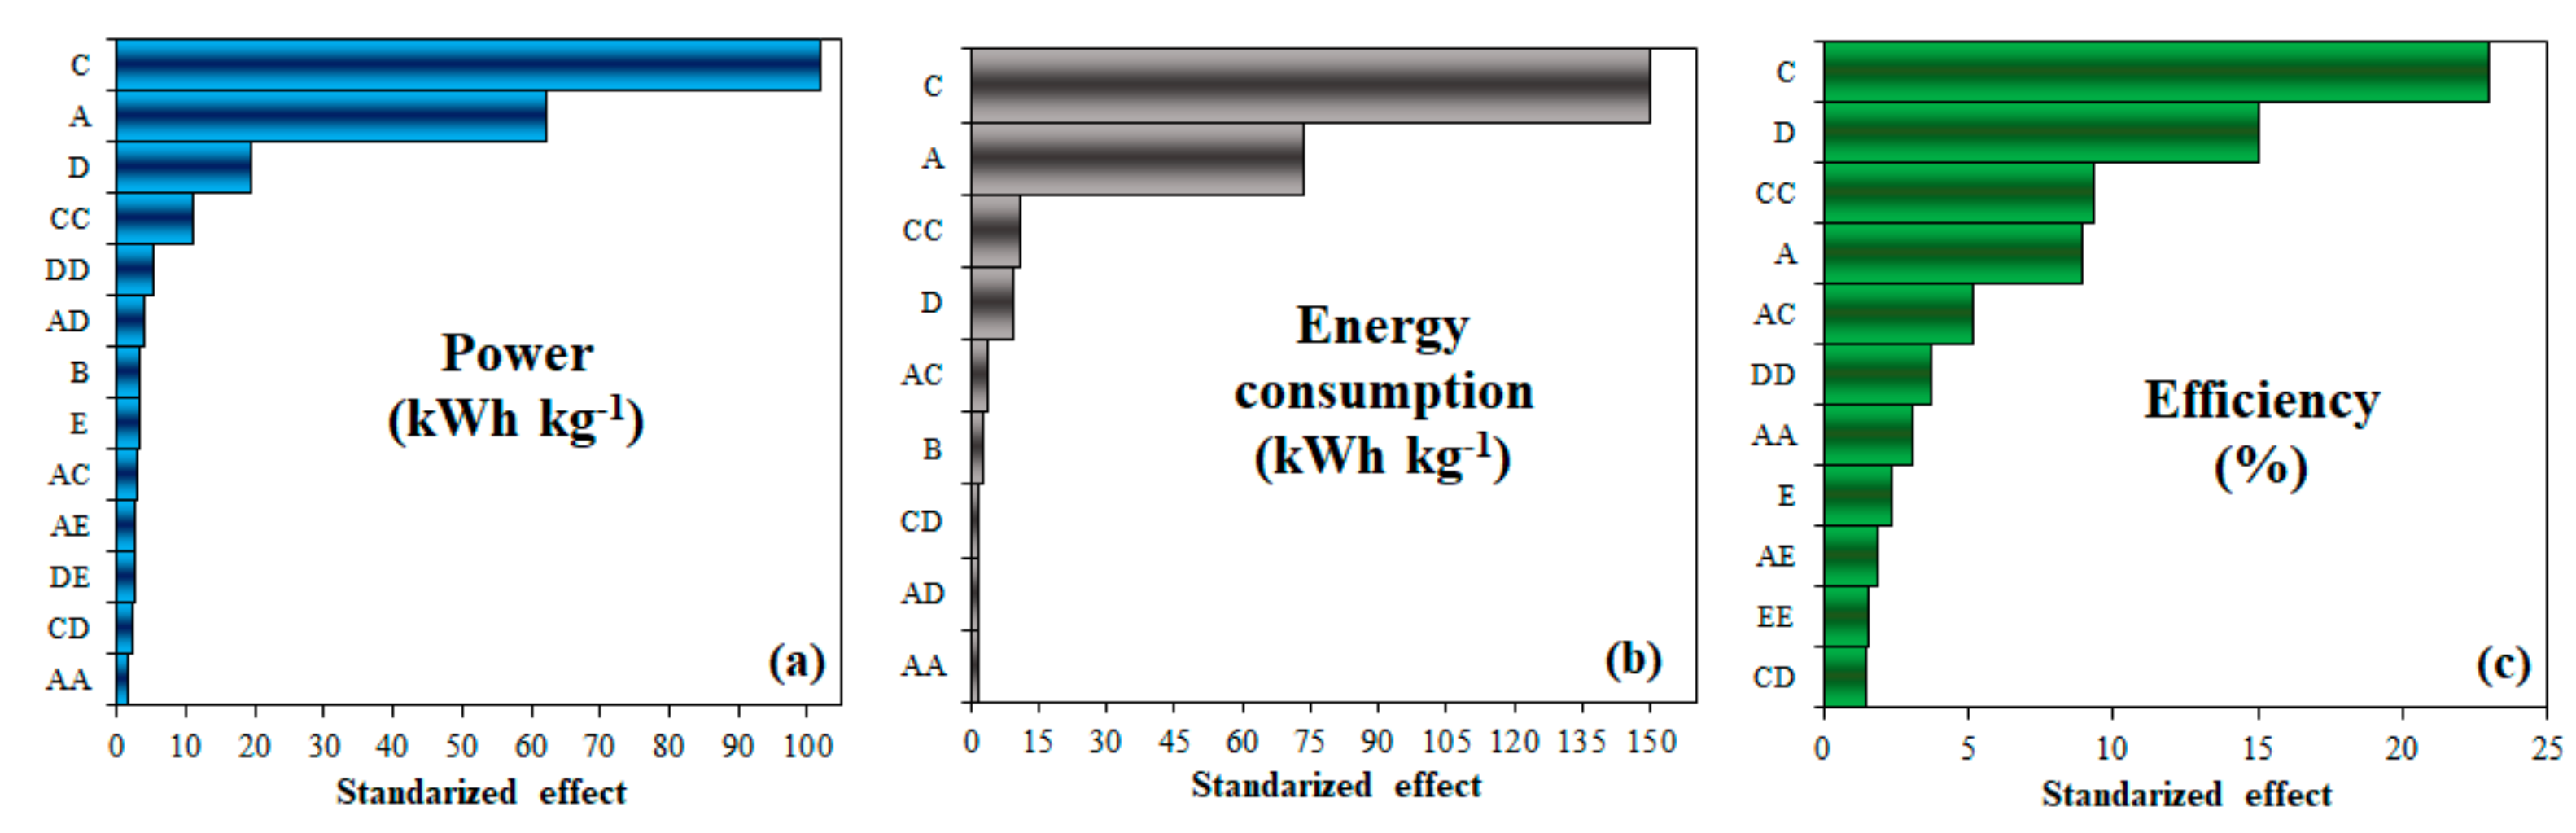
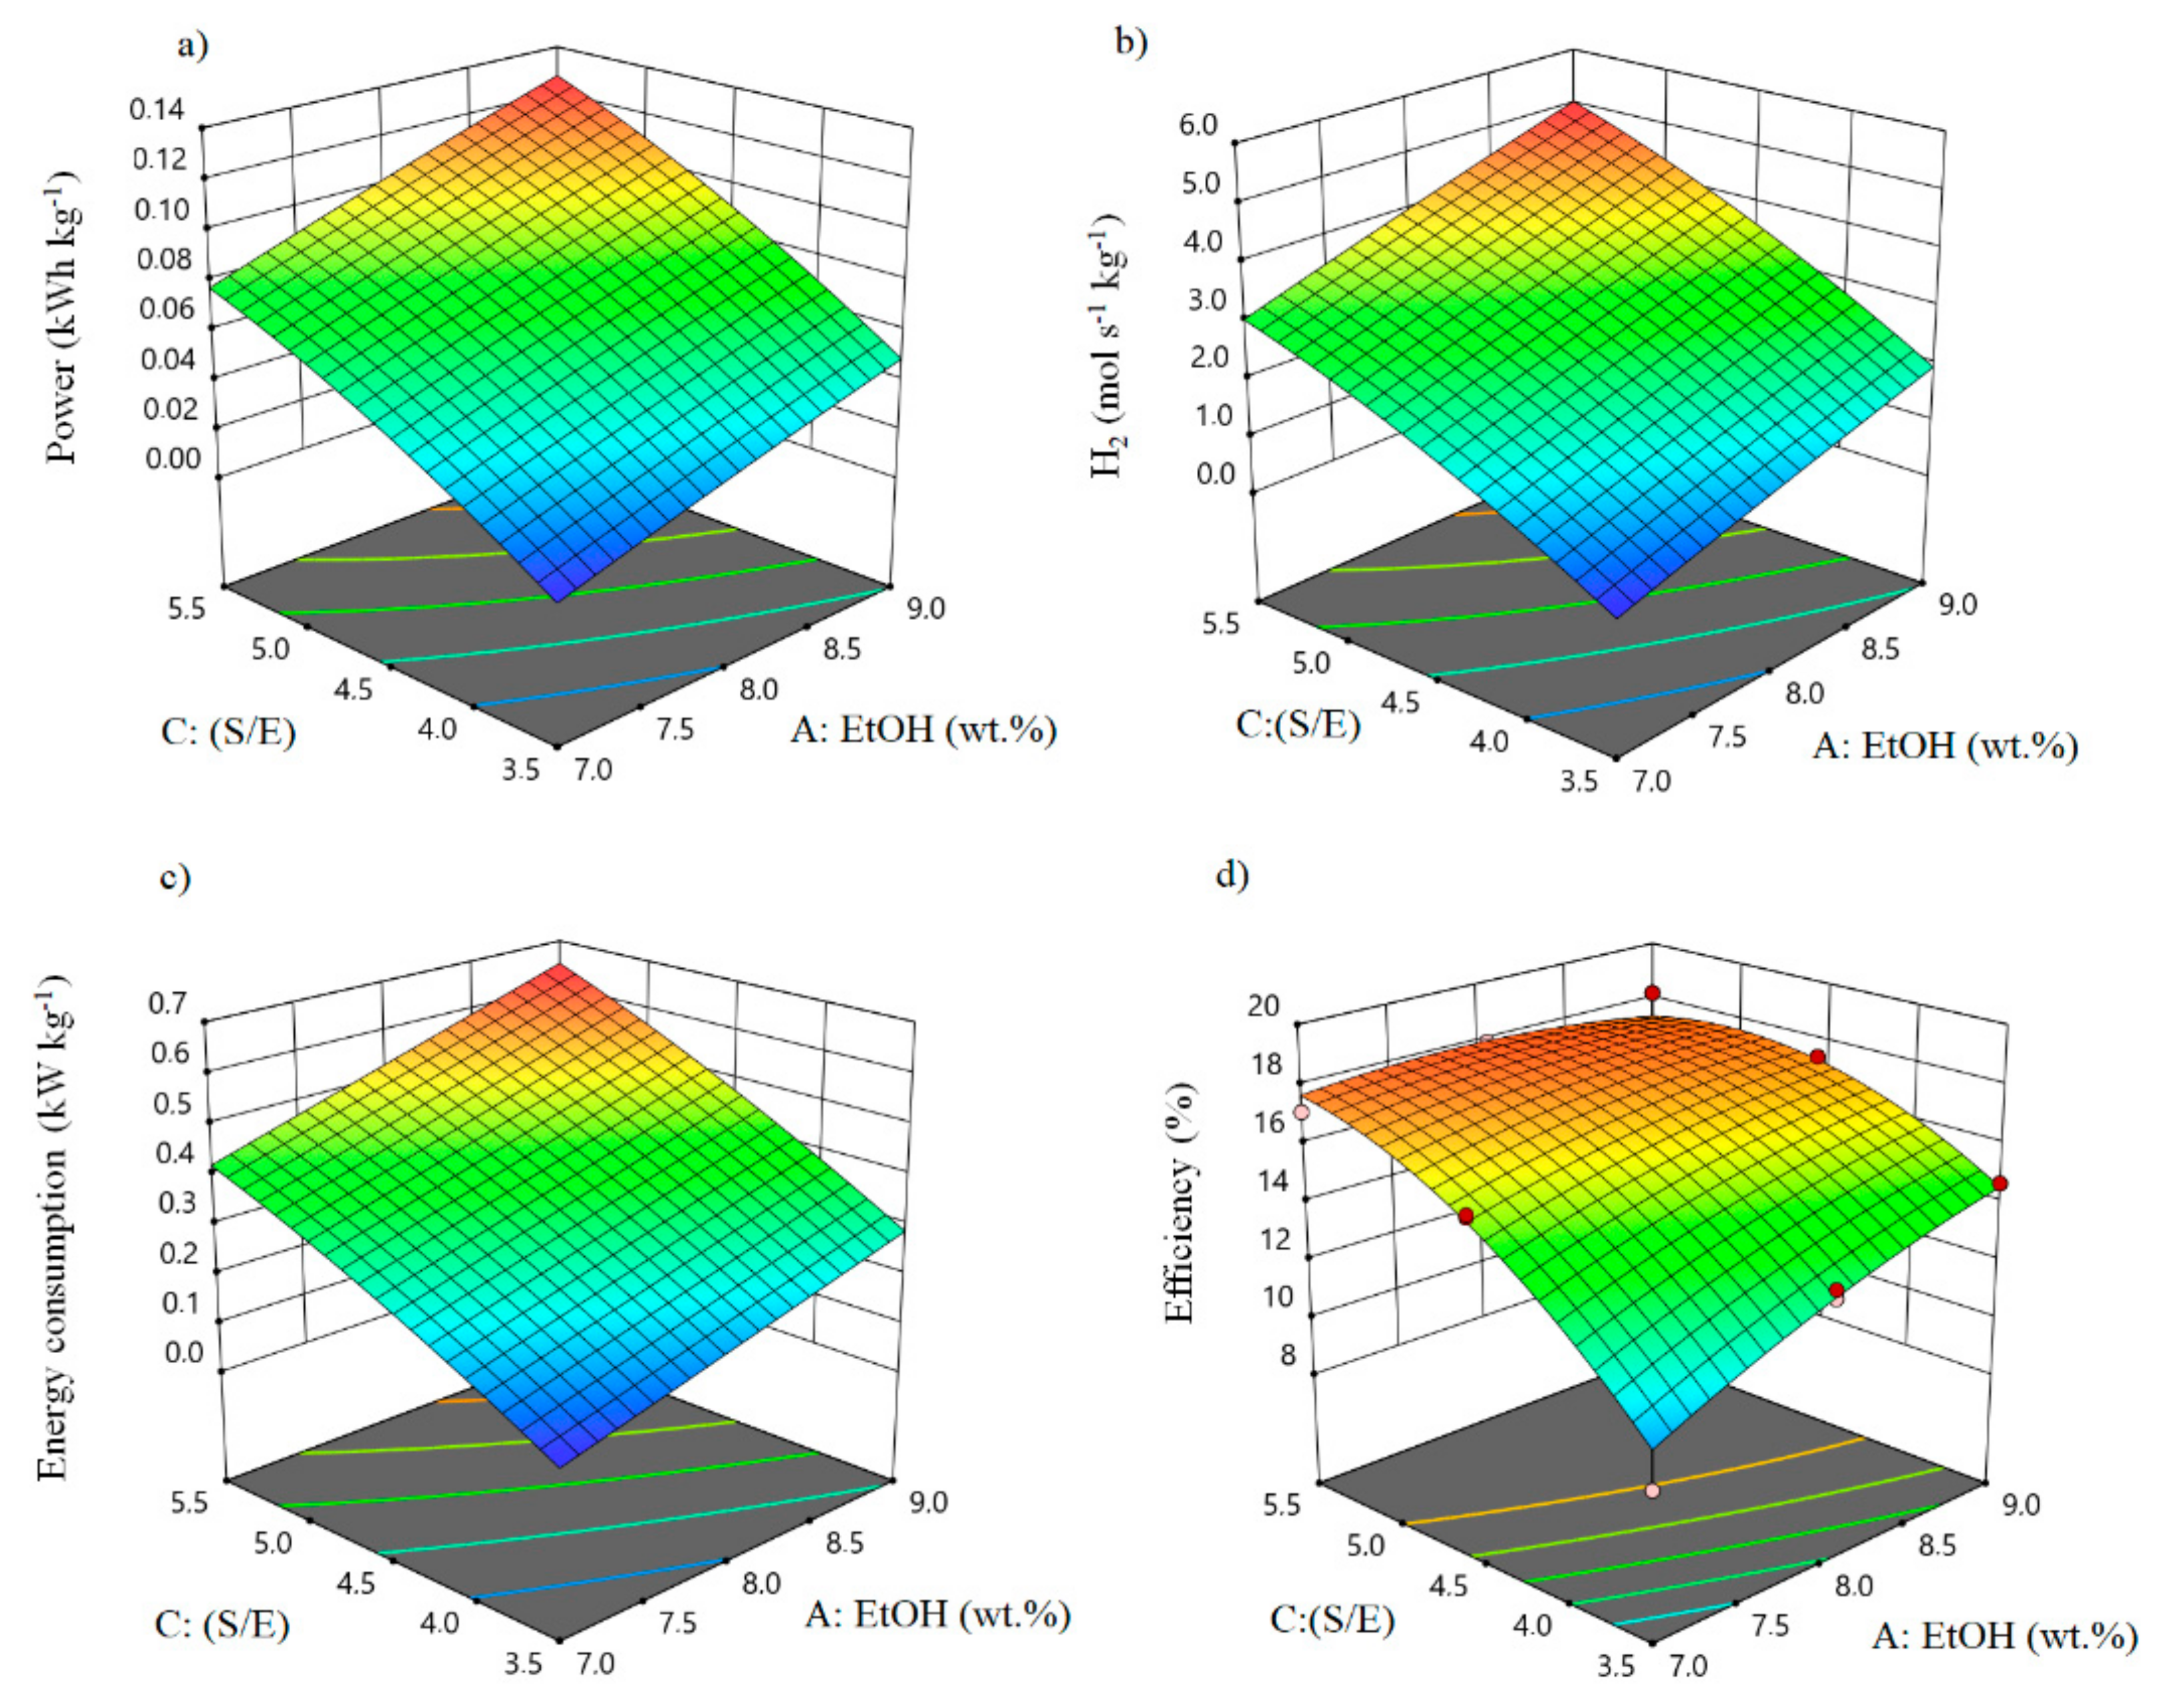
2.3. Response Surface Methodology (RSM)

A Box–Behnken design (BBD) method was employed to determine the effect of five critical variables during the production of power from bioethanol via ESR and overall efficiency of the process. Those variables were initial ethanol content (A), initial bioethanol charge in the alembic (B), steam-to-ethanol ratio (C), ESR temperature (D), and CO-removal temperature. These variables were included in the Aspen flowsheet described in Figure 1. 46 simulations were performed. The simulation results allowed the estimation of the composition of the H2 stream and the energy consumption of the main equipment. The composition of H2 was exported to Matlab to calculate the fuel cell power according to Section 2.2. The efficiency of the process was calculated according to Equation (12), where PNET is the net power produced in the HT-PEMFC, mEtOH is the mass flow of ethanol (kg s−1), and QTotal is the total thermal energy required in the process.
Efficiency = P NET 26 , 800 * m EtOH + Q Total * 100
Statistical analysis was performed in Minitab V18 (Minitab LCC, PE, USA). The model for all the response variables was adjusted by using regression. This method allows introduction of any term whose p-value is lower or equal to the specified alpha value. Herein, alpha value was set to 0.15.

3. Results

Figure 2 shows the process for producing power from bioethanol based on the pilot plant located at Universidad de La Sabana (Colombia). The process encompasses four main stages named as: (i) alembic; (ii) ESR; (iii) CO-removal, and (iv) HT-PEMFC. In the alembic, bioethanol is distilled until a specific S/E ratio. In this process, the inlet ethanol content, alembic load, and S/E was assessed. Afterwards, ethanol is purified through batch distillation, the resulting bioethanol is converted into syngas over monoliths washcoated with RhPt/CeO2-SiO2 at temperatures between 600 °C and 700 °C. At these conditions, complete conversion of ethanol is attained [18]. The resulting syngas is then cooled down and sent to the CO-removal reactor which operates between 200 and 300 °C and packed with a monolith washcoated with Au-Cu/CeO2 to remove CO [31]. Lastly, the CO-free syngas is fed to a commercial HT-PEMFC to produce power. The previously cited factors (i.e., inlet ethanol content, alembic load, S/E, reformer temperature, and CO-removal reactor temperature) were evaluated to determine their effect on the power production, energy consumption, H2 flow rate, and overall efficiency. In the upcoming section, the effect of the previously cited factors on the selected response variables through the RSM is explored.

3.1. Box–Behkhen Design

A BBD method was employed to determine the effect of critical variables during the conversion of bioethanol into H2 and its subsequent use for producing power in a HT-PEMFC. Those variables were the inlet ethanol content (A), the alembic load (B), the molar steam-to-ethanol ratio (C), the steam reforming temperature (D), and the CO-removal temperature (D). While the response variables were the power production in a HT-PEMFC, the process efficiency, and the thermal energy consumption. Detailed ANOVA results are shown in Supplementary Material S5. The correlation coefficient (R2) and the adjusted correlation coefficient (R2adj) were employed to determine the accuracy of the model [26]. Both coefficients were higher than 0.906, as shown in Table S5.1 (See Supplementary Material S5). Hence, the model explained 90.6% of the data variability. In addition, differences between R2 and R2adj are lower than 0.2 for all the response variables (Table S5.1 in Supplementary Material S5.1), concluding that the response surface represents the data accurately [32].
Figure 3 shows the Pareto chart for all the response variables. Herein, single letters (i.e., A, B, C, D, and E) represent the effect of the main factor on the response variable. Whereas combined letters (e.g., AC, AD, CD) show the interaction effect of two different factors on the response variable, and similar combined letters (e.g., CC, DD) display the quadratic effect of the main factor over the response variable. Accordingly, the S/E, represented with the letter C in the y-axis, has the highest influence on all the response variables, followed by the inlet ethanol content (A) which influences mainly the power fuel cell (Figure 3a). The temperature of the ESR (D) influences mainly the process efficiency, as shown in Figure 3b. CO-removal temperature (E) has the lowest effect over all the tested variables. In the upcoming section, we explore the effect of main factors on the response variables described in Figure 3. Since alembic load (B, in Figure 3) does not have a significant effect on the response variables, this will not be discussed in this paper.

3.1.1. Steam-to-Ethanol Ratio (S/E)

According to Figure 3, S/E (C) has the strongest influence on the power production, process efficiency, and energy consumption. The S/E ratio influences the product distribution during ESR and depends on the alembic operating conditions. Figure 4 shows the effect of both distillation time in the alembic and ethanol concentration on the S/E ratio. Although alembic can be appropriate for bioethanol distillation of fermented agro-industrial residues at small scale [33], distillation time in this device is a critical variable to be controlled. According to Figure 4a, the batch distillation starts producing elevated S/E values, but the bioethanol yield is negligible (Figure 4b). As long as the distillation continues, the S/E decreases until a minimum at about 20 min (Figure 4a). Afterwards, both S/E (Figure 4a) and bioethanol yield (Figure 4b) increase, delivering higher power production and H2 flow rates, but higher energy requirements, as shown in Figure 5.
Figure 4c shows a correlation between the bioethanol recovery and the inlet ethanol concentration. Herein, bioethanol recovery is calculated as the ratio between the bioethanol obtained as distillate and the bioethanol fed to the alembic unit. According to Figure 4c, there is a directly proportional correlation between the inlet ethanol concentration and the bioethanol recovery. Hence, larger inlet ethanol concentration will produce more bioethanol and consequently more H2, as shown in the upcoming section.
Figure 5a shows that, for a similar initial ethanol concentration, there is an increment on the power production along with the S/E. For instance, when the inlet ethanol concentration is 9.0 wt.%, an increase on power production will rise almost twice along with S/E. The S/E strongly influences the H2 and CO concentration in the syngas stream. Also, an increase of the H2 flow rate will have a proportional effect on the power production. Figure 5b shows a similar trend to that observed in Figure 5a. For instance, when the inlet ethanol concentration is 9.0 wt.%, an increment on S/E from 3.5 to 5.5 will increase the H2 flow rate from 3.0 to 5.0 mol s−1 kg−1. Figure 3b shows that S/E also strongly affects the energy consumption of the overall process. Consequently, Figure 5c shows that the energy consumption ranged between 0.1 and 0.65 kW kg−1 and depended on the S/E and ethanol concentration. Among processes, the auxiliary units such as the heat exchangers are the stages that consume the highest amount of energy (49%), followed by the alembic (42%), and the ESR (9%). Among auxiliary units, E-103 (in Figure 1) consumes the highest amount of energy, mainly associated with bioethanol evaporation and the use of an inert gas as a carrier due to its low heat capacity. Followed by the auxiliary units, the alembic consumes about 46% of the total energy in the process described in Figure 2.
Figure 5c shows that regardless of the ethanol concentration, an increment on the S/E will require a higher amount of energy, since longer distillation times are required, as previously discussed. The ESR is the operation unit that consumes less energy. The contribution of ESR to the overall energy consumption is about 9%. The low contribution is associated with the low amount of bioethanol that is needed during ethanol conversion to H2 by ESR over monoliths washcoated with RhPt/CeO2-SiO2. For instance, about 10% of the inlet bioethanol is recovered as distillate during the alembic operation, as shown in Figure 4c. The bioethanol recovered in said stage is employed as feedstock during ESR.
Both power production and energy consumption are important parameters in the process design since they indicate the efficiency of the overall process. Herein, process efficiency was defined as the ratio between the power produced in the HT-PEMFC and the energy consumed in the overall process (Equation (12)). Figure 5d shows that the global efficiency exhibits a maximum value of ~17% when using a S/E = 5.5 and an ethanol inlet concentration of 7.0 wt.%. For S/E > 5, the influence of the initial ethanol concentration is minimal. Aside from S/E, the ethanol inlet concentration has an influence on the power production, energy consumption, and process efficiency, but in a lesser extent, as shown in the upcoming section.

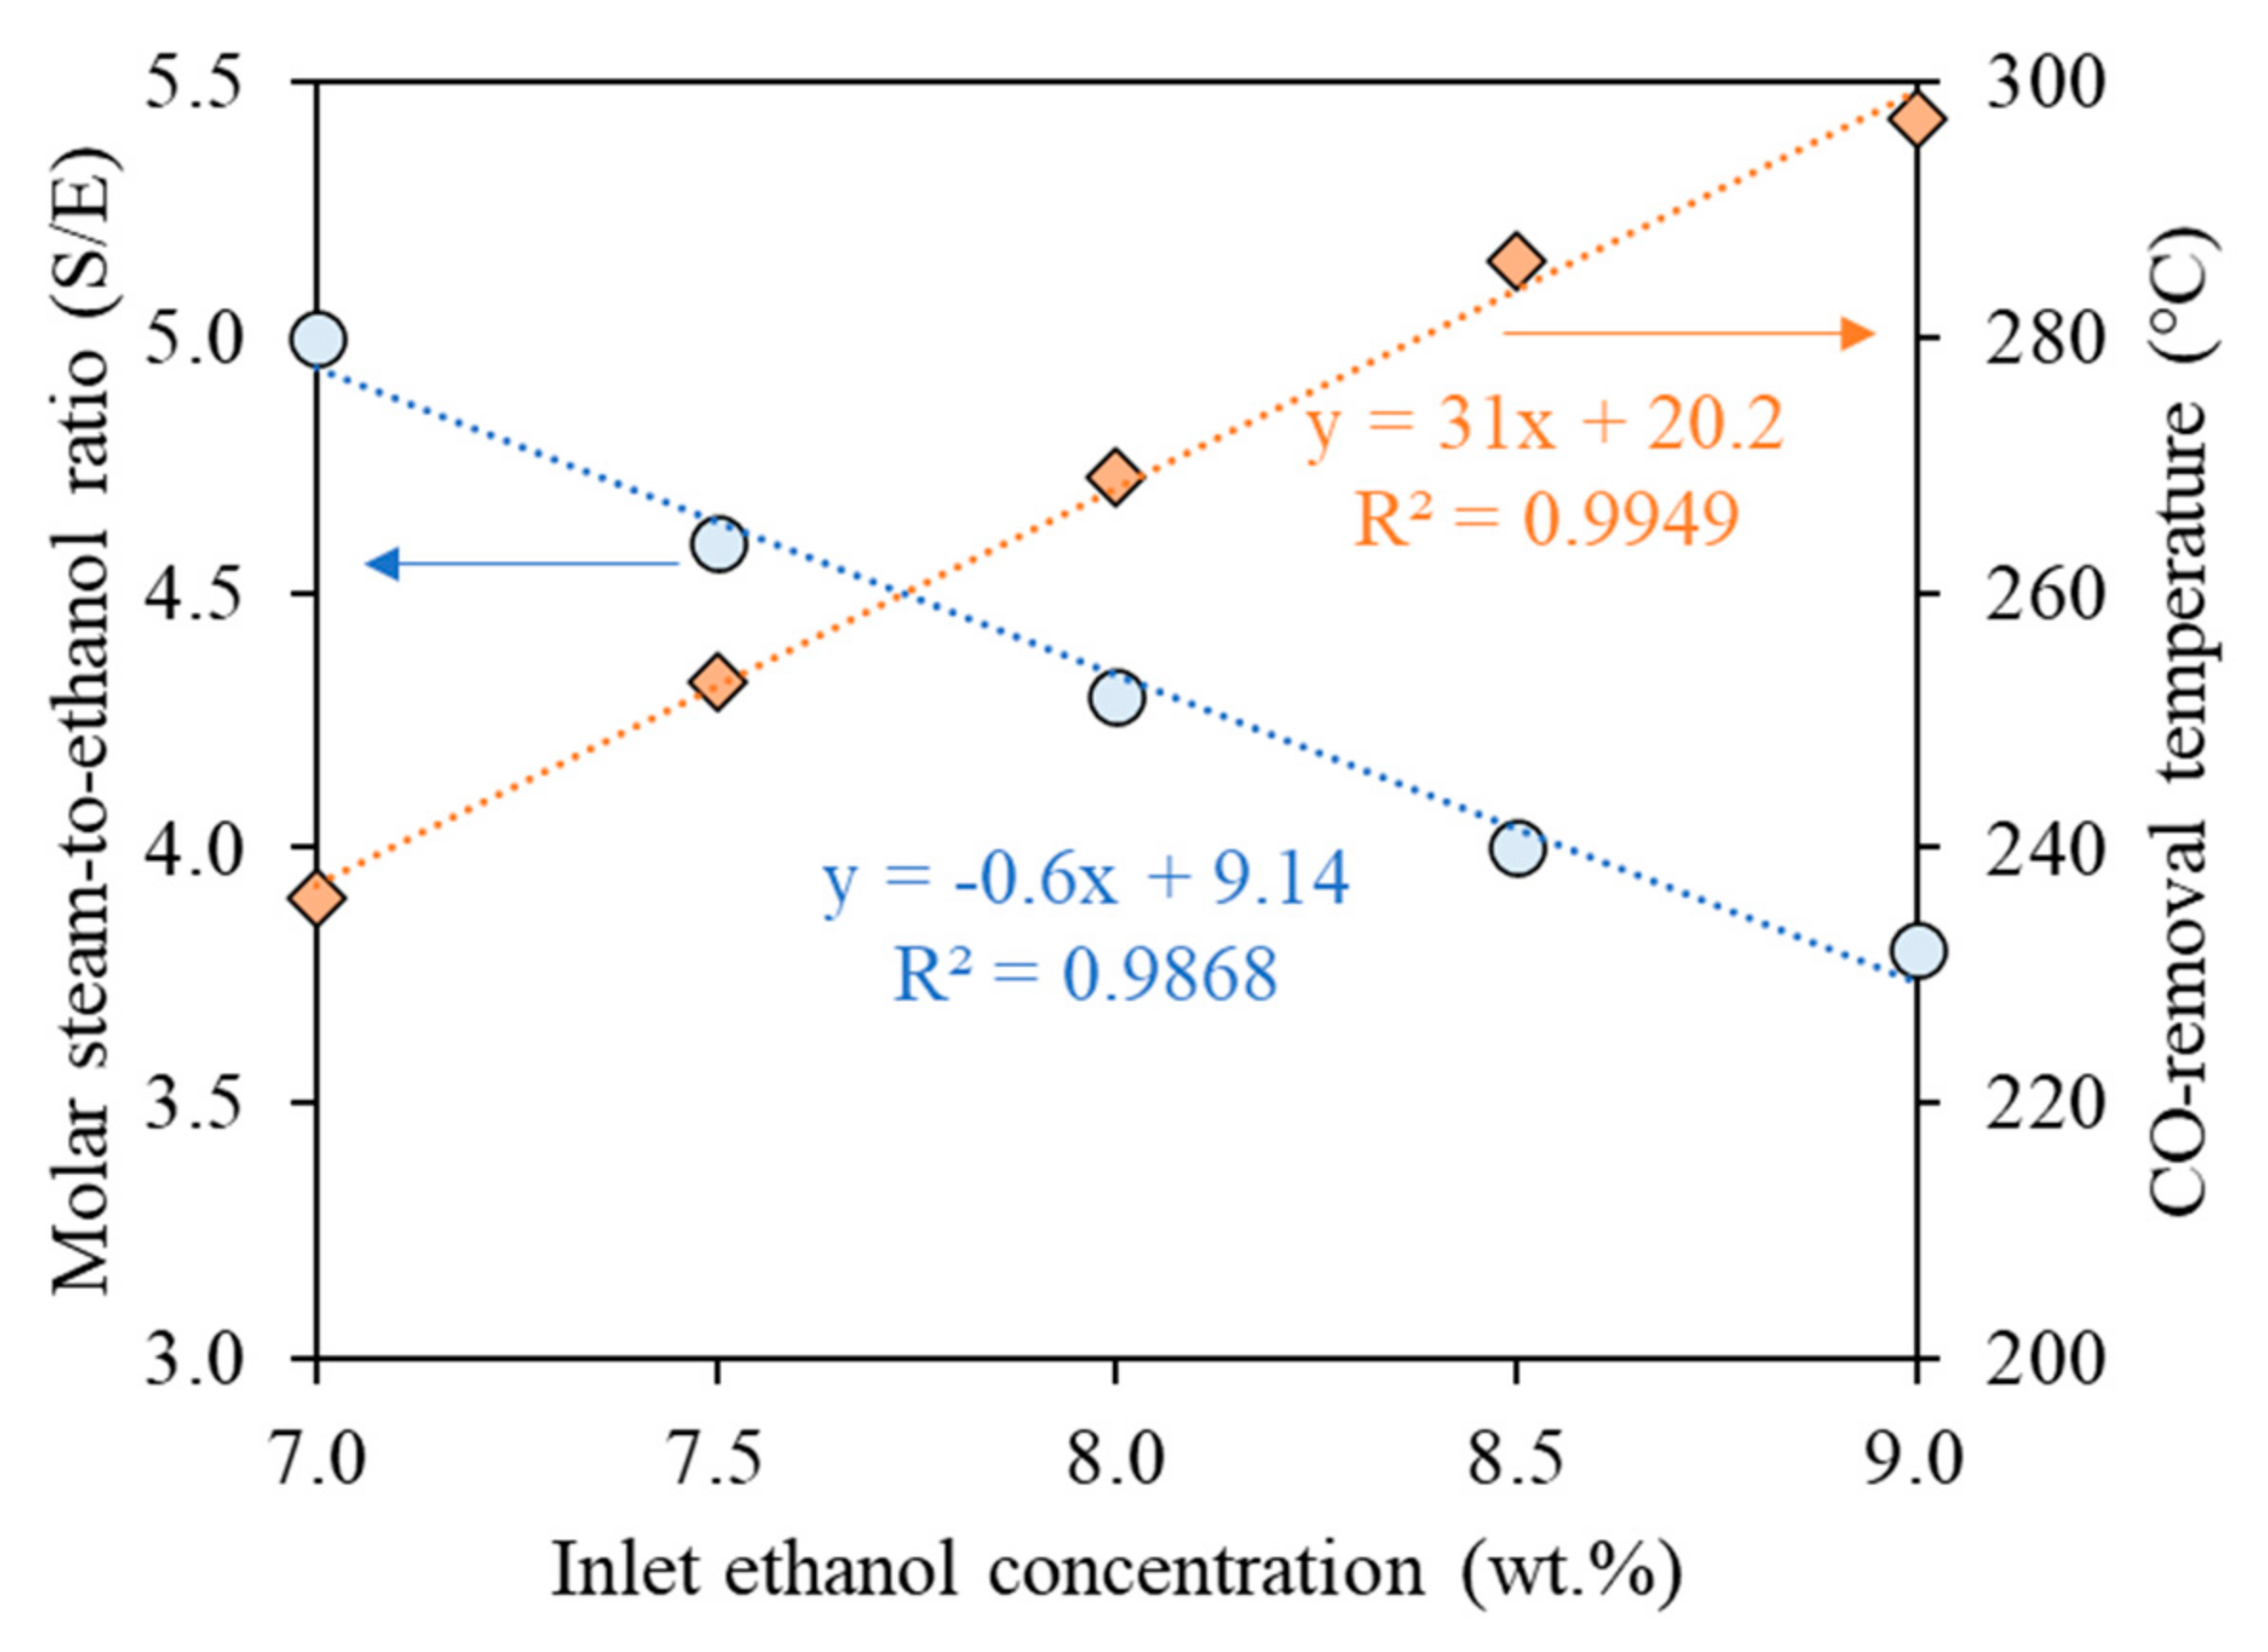
3.1.2. Ethanol Concentration

Figure 3a,b shows that the inlet ethanol concentration in the raw bioethanol will affect the power production and energy consumption, respectively. Table 1 shows different types of biomass that are employed for producing bioethanol. These biomass types were classified into first, second, and third generation bioethanol.
According to Table 1, ethanol concentrations ranging from 5.33 wt.% to 10.03 wt.% are obtained from first generation bioethanol, whereas concentrations ranging from 0.99 wt.% to 11.61 wt.% are obtained from second generation, and 1.13 wt.% to 2.65 wt.% from third generation bioethanol, respectively. Third generation ethanol has a concentration <5.0 wt.%, as shown in Table 1, which eliminates this group of bioethanol generation from the process described in Figure 2. Among second bioethanol generation, some biomass (e.g., rice straw and date pulp sap) can be considered as a source of suitable ethanol to produce H2 by ESR. Literature review suggests a desirable S/E range from 3.0 to 5.0 [46], which can be achieved by batch distillation, as displayed in Figure 4a.
Figure 5a shows an increment of the power production along with the inlet ethanol concentration in the bioethanol fed to the alembic. Similarly, Figure 5b shows that the H2 flow rate produced during ESR is directly proportional to the ethanol concentration. The effect of the ethanol concentration on the previously cited variables is correlated with the amount of bioethanol that is recovered in the batch distillation unit. Figure 4c portrays that an increment of the inlet ethanol concentration will warrant higher amount of bioethanol that could be used for producing H2 by ESR, and consequently, larger power generation in the HT-PEMFC.
Figure 5c exhibits an increment of the energy consumption within the ethanol concentration, regardless the S/E. This trend is associated with the batch distillation time. The higher the ethanol concentration is, the longer the distillation time will be to attain a similar S/E in a batch distillation unit. For instance, Figure 4a shows that about 30, 42, and 54 min are required to achieve a S/E of 4.0 when the ethanol concentration is 7 wt.%, 8 wt.%, and 9 wt.%, respectively. Additionally, Figure 5d indicates that the overall efficiency increases with the inlet ethanol concentration. Since efficiency is correlated with power production, higher inlet ethanol concentration will produce more H2, and consistently, more power will be generated in a HT-PEMFC. Aside from the ethanol concentration and S/E, the ESR temperature has a significant effect on the response variables such as power production, H2 flow rate, thermal consumption, and efficiency. In the upcoming section, we explore the effect of ESR temperature over the previously cited variables.

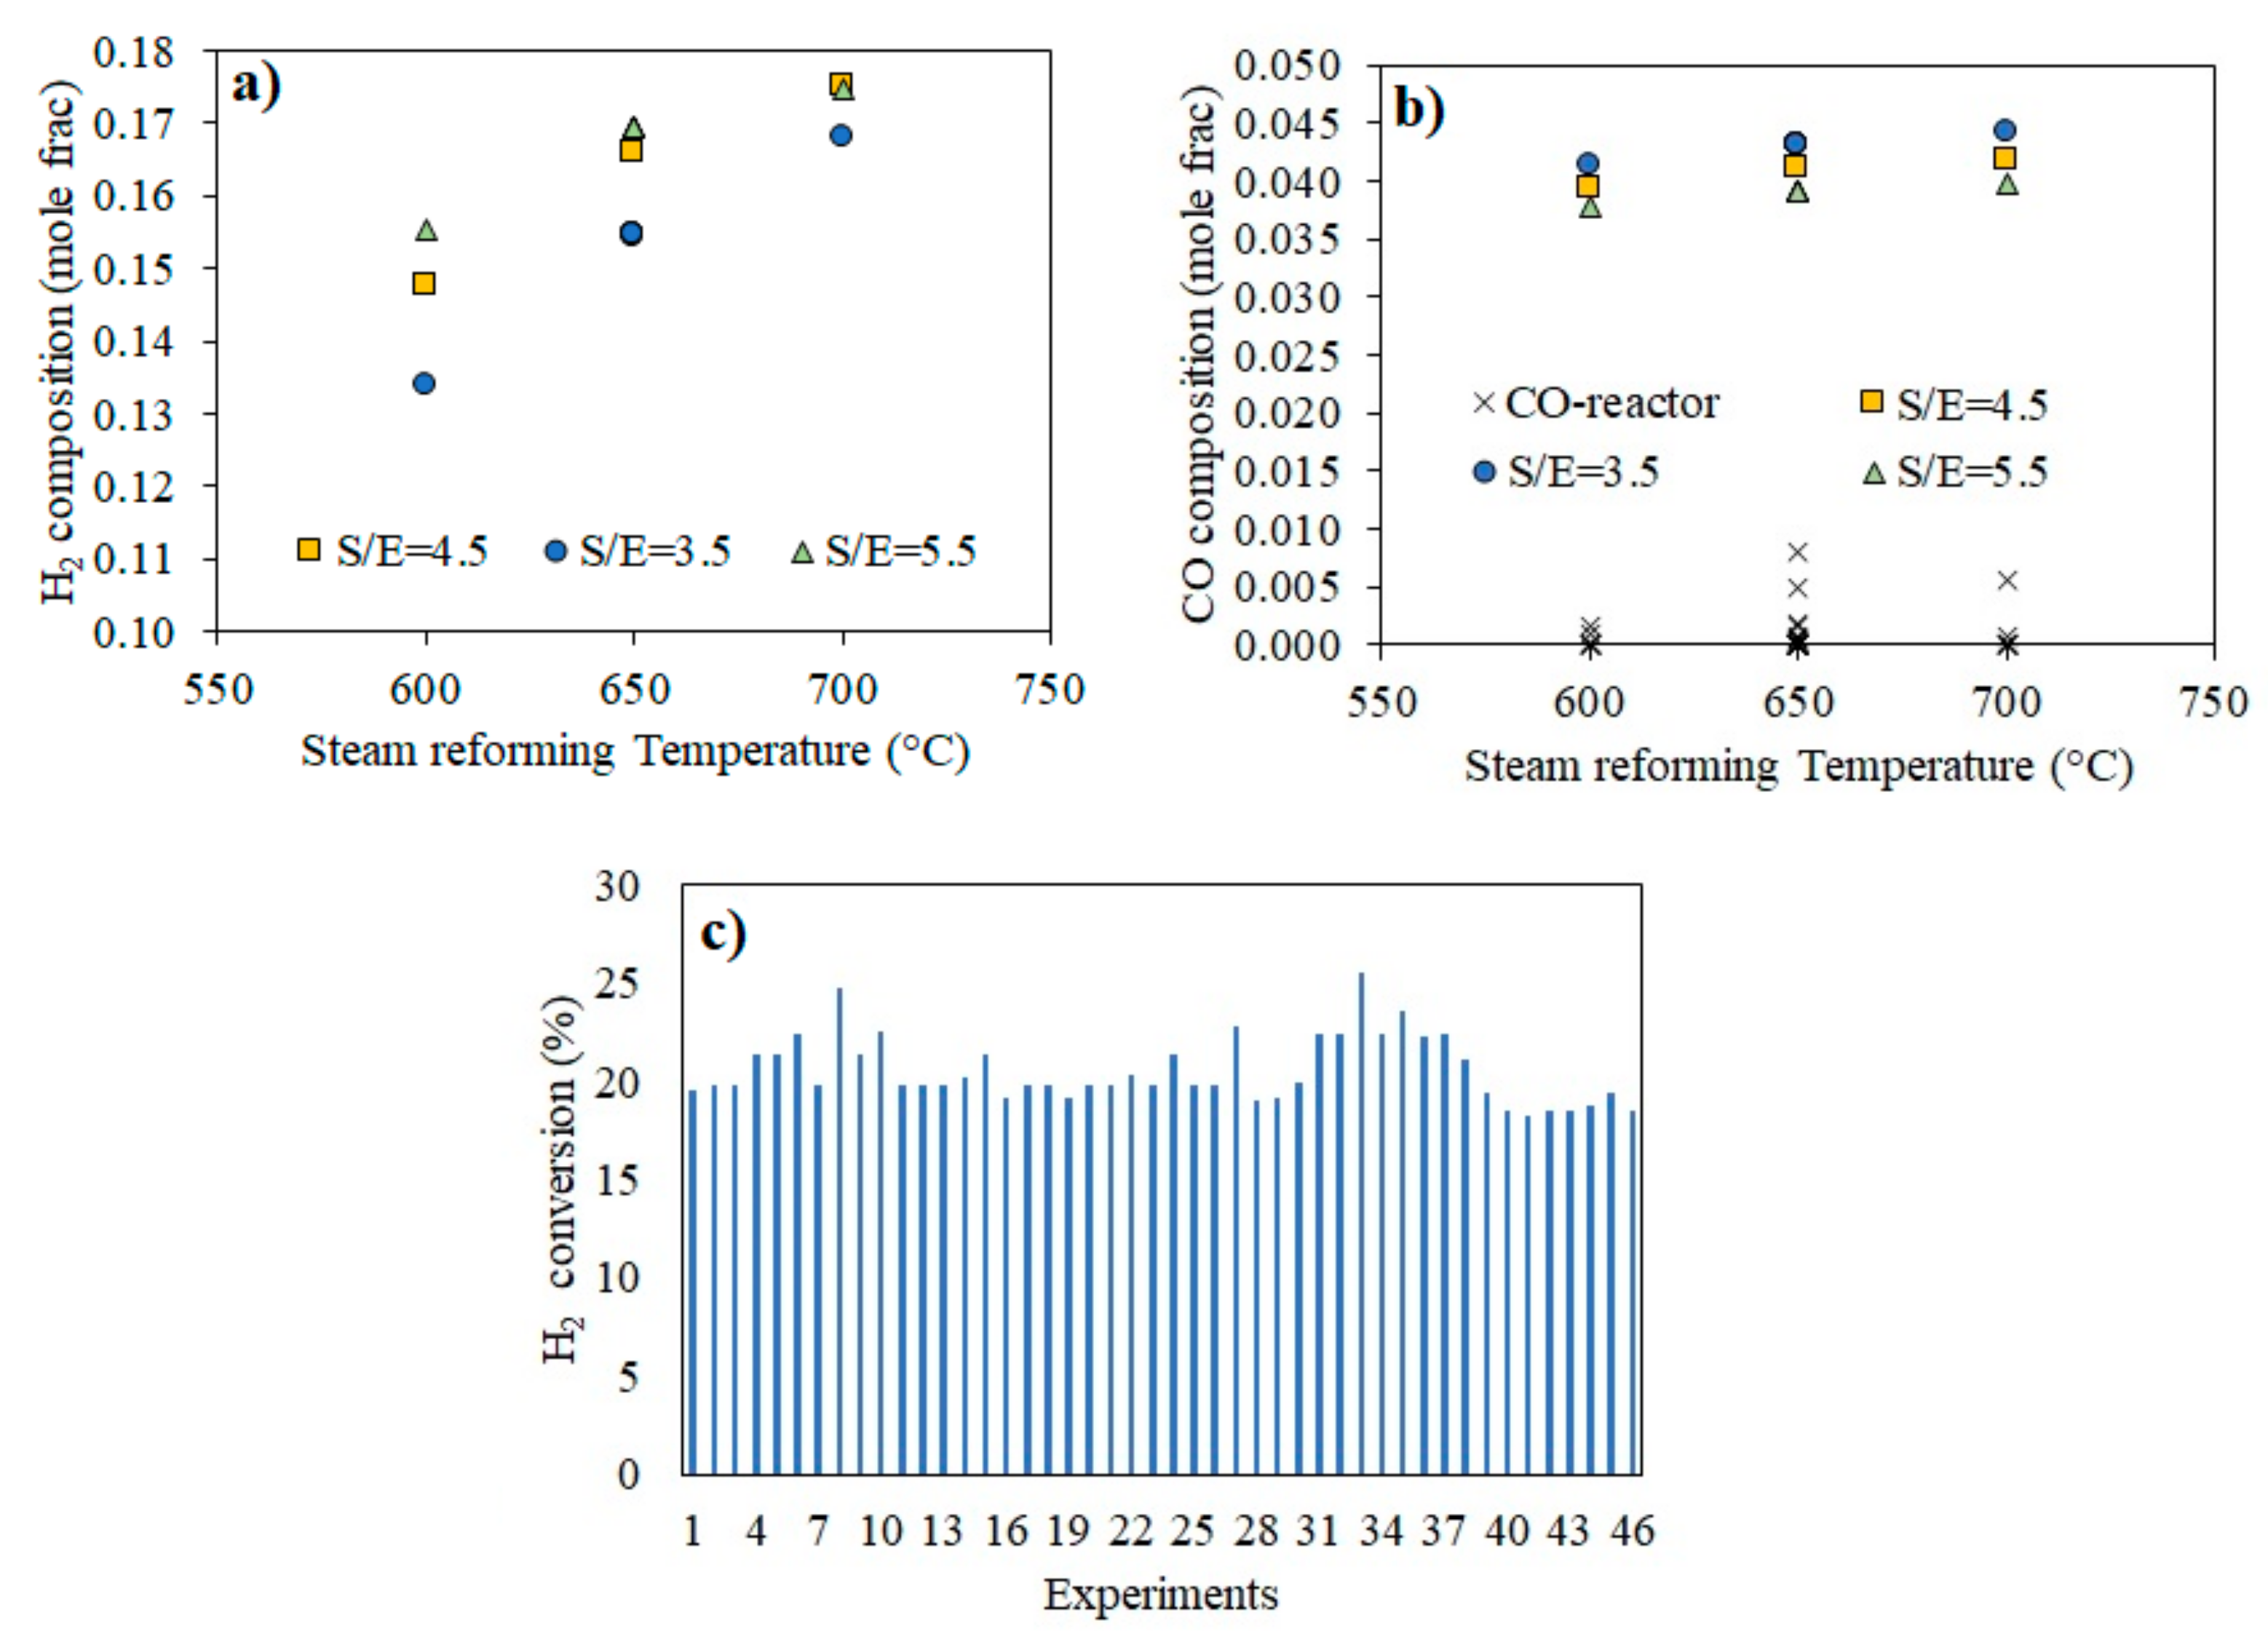
3.1.3. Steam Reforming Temperature

In this study, ESR temperature was evaluated between 600 and 700 °C. Among the output variables explored, the ESR temperature influences the power generation and process efficiency, as shown in Figure 3a,c, respectively. Besides, Figure 6a shows that there is positive correlation between SR temperature and H2 concentration. Moreover, the S/E influences the H2 concentration. Indeed, Figure 6a displays that at low temperature, H2 concentration increases along with the S/E. However, at temperature above 700 °C, the effect of S/E become negligible. Aside from the H2 concentration on the syngas stream, CO concentration also exhibits an increase as reforming temperature increases, as shown in Figure 6b. Presence of CO, even at very low concentrations, can have a negative effect on cell performance and, therefore, power generation. To overcome the effect of CO, the addition of a second reactor in series to remove CO is required. In the upcoming section, the use of this reactor is explored.

3.1.4. CO-Removal Temperature

CO from syngas could be removed by different pathways such as the WGSR and CO oxidation. The latter could reduce CO concentration to less than 100 ppm, if proper conditions and catalysts are employed. Recently, Cifuentes et al. [21,31,47] developed an Au-Cu/CeO2 catalyst that allows to reduce CO content to less than 100 ppm, but with a higher H2 loss. The CO-removal temperature has a significant effect on the CO content. Therefore, this factor was assessed against the response variables such as power generation, energy consumption, and global efficiency. According to Figure 3, neither of the response variables is strongly affected by the temperature of the CO removal reactor. Figure 6b shows that CO composition is affected by the ESR temperature and S/E. Indeed, higher temperature on the ESR will increase CO concentration, whereas larger S/E will reduce the CO concentration. Therefore, a change in S/E could be used as a strategy to control the amount of CO produced and thus, modify the H2/CO ratio in the syngas obtained from ESR. H2/CO is a relevant operation condition to design syngas clean-up technologies [31]. However, the addition of a second reactor will reduce the CO concentration to less than 0.008 mole frac (8000 ppm), regardless of the temperature conditions, as shown in Figure 6b.
H2 losses during CO-removal reaction can also affect the power production. H2 losses are also correlated with CO-removal temperature. Figure 6c shows that H2 losses during CO-removal are similar for all the experiments. Indeed, H2 conversion ranges between 18.2% and 25.6%. These slight differences suggest that temperature conditions (i.e., 200–300 °C) did not affect the CO concentration and the H2 conversion. Therefore, the CO-removal temperature is the variable with the least impact on the overall process. Even though the CO-removal reaction temperature does not exhibit a significant effect on power production, process efficiency, and energy consumption, the addition of the CO-removal reactor is key in the process design.
Figure 7 shows the polarization curves when pure H2, syngas, and clean syngas are employed in the HT-PEMFC. Herein, clean syngas refers to syngas without CO after the CO-removal reactor stage. The polarization curves represent the performance of the fuel cell system in terms of the voltage drops and current densities. The polarization curve shows three different losses associated with electrodes activation, ohmic resistance losses, and mass transport [48]. According to Figure 7, a similar trend in terms of voltage drop is observed for the pure H2 and the clean syngas. Differences between both polarization curves are associated with the H2 concentration on both streams, considering that H2 stream is 100 mol% H2 while the clean syngas has 17.5 mol% H2. Concerning the effect of the syngas stream on the voltage drop, significant differences are observed. Indeed, when current density is 0.3 A/cm2, the voltage is 0.32 V and 0.57 V for the syngas and clean syngas, respectively. Hence, CO affects the fuel cell performance and consequently, a CO-removal stage is required to clean the syngas and increase power production. The CO-removal reactor could operate between 200 and 300 °C since both CO concentration and H2 conversion are similar, as shown in Figure 6.
Up to now, we explored different factors such as S/E, ethanol concentration, steam reforming temperature, and CO-removal temperature. However, it is important to determine suitable conditions for producing power from different biomass. This will diversify the sources to produce affordable and clean energy, as is described by the United Nations agenda in terms of the sustainable development goals. In the upcoming section, an optimization of the main variables is carried out for different ethanol concentrations which represent possible sources for producing energy by the technology described in Figure 2.

4. Discussion

Several variables were analyzed during the conversion of raw bioethanol into power via green H2 and using ESR. Among variables, S/E has the strongest influence on the H2 and CO concentrations that, subsequently, affect power production. Besides, the S/E is also influenced by the ESR temperature. Conversion of ethanol and selectivity to various reaction products are heavily influenced by the reaction temperature. For instance, at temperatures below 300 °C, ESR does not occur at a significant extent. At this temperature range, ethanol dehydrogenation is favored instead. ESR, on the other hand, is favored at temperatures above 400 °C [10,49]. The resulting syngas composition is influenced by the reaction temperature as CO2 and CH4 selectivity varies with this parameter. Selectivity towards CO2 and CH4 has been found to be directly proportional to the ESR temperature up to 550 °C. Above this temperature, the selectivity of both compounds falls due to favoring of the methanol reformation reaction. Ethanol conversion is expected to be complete at reaction temperatures above 600 °C with H2 selectivity over 90%, along with a significant increase on the selectivity towards CO. S/E decisively influences the reaction mechanisms of the ESR [50]. In accordance with the kinetic schemes proposed by [51] and [50] for ESR, water contributes to oxidizing carbon intermediates obtained from ethanol decomposition (Equation (1)) [52] via steam reforming reactions (e.g., Equations (3) and (4)). Also, an increase in the S/E ratio prevents reverse WGSR (Equation (2)), reducing CO formation and improving H2 yield [10]. This effect is more significant at high temperatures (>600 °C), where the possibility of occurrence of reverse WGSR increases [50]. Higher content of water in the inlet bioethanol will boost the WGSR [8]. López et al. [53] reported that at 700 °C, CO molar flow rate decreases and H2 yield increases when the steam-to-carbon ratio increases due to the availability of oxidants species in the reaction interface. In addition, at higher temperature the effect of S/E is hindered by the temperature. Hernandez and Kafarov [54] and Rabestein et al. [10] reported a similar behavior from thermodynamic analysis. Arevalo et al. [55] stated that over a Ni-CZ catalyst, a similar H2 yield is achieved at 700 °C, regardless of the S/E. Also, Cobo et al. [8] displayed that at temperatures above 600 °C, S/E did not have a relevant effect on H2 yield over a RhPt/La2O3 catalyst.
On the other hand, the H2 content present in the flow stream entering the fuel cell will have an important effect on power production. A lower H2 partial pressure can result in a significant effect on the mass transport rates of reactants and products and can directly affect current distribution and, therefore, cell performance [56]. Power production depends mainly on the current and cell voltage. While the current is associated with the H2 flow rate, the cell voltage depends on the irreversible voltage losses such as those associated with the anode and cathode activation losses and the ohmic losses. This dependence can be explained by the fact that power is directly related to the H2 content present in the flow stream entering the fuel cell. A reduction in H2 concentration in the anodic compartment negatively affects the fuel cell performance. Furthermore, the anode activation losses are strongly correlated with the presence of CO in the fuel stream [57]. The poison effect of CO is associated with the strong adsorption on the catalyst surfaces, typically Pt [29]. This strong adsorption between CO and the platinum sites hinders H2 access to the catalyst sites and reduces the H2 oxidation reaction efficiency [58]. Therefore, CO content will affect the overall cell voltage and consequently the fuel cell power. Several studies reported that the higher the S/E is, the higher the H2 yield and the lower the CO yield will be, as reported for different catalysts such as Co/MCM-41, Ni/MCM-41 [52], RhPt/La2O3 [8], and PtNi/CeO2-ZrO2 [59].
Aside from the S/E and ESR temperature, the carrier gas is a critical hotspot on the production of power from ethanol [5] and strongly influences the syngas profile. For instance, Cifuentes et al. [18] reported that low carrier gas ratios (i.e., liters of carrier gas per mL of bioethanol) will decrease the H2 yield during ESR over monoliths washcoated with RhPt/CeO2-SiO2. The use of a carrier gas will influence the process efficiency since higher energy consumption will be attained. Efficiency reported in this study is about 17%. Authayanun et al. [60] reported an efficiency of 29% when bioethanol coming from cassava was reformed for producing H2 and power in an LT-PEMFC. Likewise, Sanchez et al. [5] showed an efficiency of 56% when ethanol coming from sugarcane press-mud was employed for producing H2 and power in an LT-PEMFC. George and Suresh [61] indicated that system efficiency varied from 10% to 60% and depends on the process conditions such as steam-to-carbon ratio, reformer temperature, and fuel cell pressure. A similar efficiency (~17%) was reported during the steam reforming of glycerol, mainly ascribed to the dilution effect on the H2 stream [62,63]. While pure H2 is required for the LT-PEMFC operation, diluted H2 can be fed to a HT-PEMFC. However, the dilution effect will have an impact on the power generation [48].
Therefore, an optimization of the assessed factors is necessary to determine the suitable conditions to maximize the power production. The optimization of the main factors was performed to minimize both energy consumption and number of fuel cells and maximize power production and overall efficiency, using RSM. Table 2 shows that maximum power obtained through the process described in Figure 2 is 0.07 kWh per kg of bioethanol with an energy consumption of 0.37 kW per kg of bioethanol, and an efficiency of 17.8%. These values could be obtained for any bioethanol stream whose ethanol concentration ranges between 7.0 wt.% and 9.0 wt.%. However, batch distillation parameters such as distillation time must be adjusted to achieve a proper S/E that allows to obtain the optimized values described above.
Figure 8 shows the correlation between S/E and the CO-removal temperature with the inlet ethanol concentration for obtaining the optimized values described in Table 2. There is an inverse correlation between the inlet ethanol concentration and S/E, which will affect the CO-removal temperature. In addition, Figure 8 makes it possible to determine the optimal S/E and CO-removal temperature based on the initial ethanol concentration, to maximize the power production on the HT-PEMFC. For instance, for producing power from sugarcane molasses (8.0 wt.% ethanol in Table 1), S/E must be adjusted to 4.3 and the CO-removal temperature should be 269 °C. Therefore, the S/E and the CO-removal temperature must be selected in accordance with the initial ethanol concentration. This study shows the “domino effect” that the initial ethanol concentration obtained from biomass fermentation has on H2 purification and highlights the need to develop integrative tools to design sustainable models.

5. Conclusions

Determination and optimization of the main factors for producing power from biomass using green H2 as energy vector has been carried out by coupling Aspen Plus® and response surface methodology (RSM). The steps analyzed in the process were biomass fermentation, bioethanol purification, H2 production via ESR, syngas cleaning by a CO-removal reactor, and power production in a high temperature proton exchange membrane fuel cell (HT-PEMFC). The variables that presented the greatest effect on the power production, energy consumption, and process efficiency were steam-to-ethanol ratio (S/E) used in the ESR > ethanol concentration in the raw bioethanol obtained after fermentation > ESR temperature. Despite the CO-removal temperature did not show a significant effect on the process, the use of a CO-removal reactor to clean the syngas coming from the ESR is indispensable for producing green H2 and power in the HT-PEMFC. Maximum power production would be 0.07 kWh kg−1 with an efficiency of about 17%, and an energy consumption of 0.37 kW per kg of bioethanol when the reformer temperature is 700 °C. These values can be achieved when first- and second-generation bioethanol are used, with a range of inlet ethanol concentrations between 7.0 wt.% and 9.0 wt.%. Both S/E and CO-removal temperature should be adjusted in accordance with the inlet ethanol concentration for obtaining the highest power in the HT-PEMFC. Hence, this study gives a first insight into the possibility of selecting suitable conditions for producing power and green H2 via ESR for a wide variety of bioethanol sources.

Supplementary Materials

The following are available online at https://www.mdpi.com/article/10.3390/en14248366/s1. Table S1: Characterization of the 304 stainless steel tank alembic, Table S2: ANOVA of the regression model for the prediction of the final ethanol content, Table S3: Kinetic parameters of the ESR over washcoated monoliths with RhPt/CeO2-SiO2, Table S4: Comparison between experimental and Aspen Plus® data for H2 and CO yield over washcoated monolith with RhPt/CeO2-SiO2, Table S5: Statistical result for the steam reforming process, Table S6: Kinetic parameters for the removal of CO over washcoated monoliths with Au-Cu/CeO2, Table S7: Comparison between experimental and Aspen Plus® data for H2 and CO conversion over washcoated monoliths with Au-Cu/CeO2, Table S8: Statistics results for CO-removal validation, Table S9: Materials, transport phenomena, and thermodynamic parameters for a HT-PEMFC, Table S10: Gas properties, Table S11: ANOVA for all the response variables; Table S12: ANOVA table for power production, Table S13: ANOVA table for the efficiency, Table S14: ANOVA table for thermal energy consumption.

Author Contributions

Conceptualization, N.S. and B.C.; methodology, N.S., D.R.-F., N.M.C. and B.C.; validation, N.S., D.R.-F. and B.C.; formal analysis, N.S., B.C., N.M.C. and D.R.-F.; investigation, N.S., N.M.C., B.C. and D.R.-F.; resources, M.C.; data curation, N.S., B.C., N.M.C. and D.R.-F.; writing—original draft preparation, N.S.; writing—review and editing, B.C., N.M.C., D.R.-F., M.Á.U.L. and M.C.; visualization, N.S. and B.C.; supervision, N.S. and M.C.; project administration, M.C.; funding acquisition, M.C. All authors have read and agreed to the published version of the manuscript.

Funding

This research was funded by Minciencias (grant number 036-2021) and Universidad de La Sabana (project code ING-272-2021).

Institutional Review Board Statement

Not applicable.

Informed Consent Statement

Not applicable.

Data Availability Statement

Not applicable.

Conflicts of Interest

The authors declare no conflict of interest.

References

  1. Sachs, J.D.; Schmidt-Traub, G.; Mazzucato, M.; Messner, D.; Nakicenovic, N.; Rockström, J. Six Transformations to achieve the Sustainable Development Goals. Nat. Sustain. 2019, 2, 805–814. [Google Scholar] [CrossRef]
  2. McKinsey & Company. Hydrogen Insights: A Perspective on Hydrogen Investment, Market Development and Cost Competitiveness. Available online: https://hydrogencouncil.com/en/hydrogen-insights-2021/ (accessed on 19 November 2021).
  3. Hajjaji, N.; Pons, M.; Renaudin, V.; Houas, A. Comparative life cycle assessment of eight alternatives for hydrogen production from renewable and fossil feedstock. J. Clean. Prod. 2013, 44, 177–189. [Google Scholar] [CrossRef]
  4. Sanchez, N.; Ruiz, R.; Hacker, V.; Cobo, M. Impact of bioethanol impurities on steam reforming for hydrogen production: A review. Int. J. Hydrogen Energy 2020, 45, 11923–11942. [Google Scholar] [CrossRef]
  5. Sanchez, N.; Ruiz, R.; Rödl, A.; Cobo, M. Technical and environmental analysis on the power production from residual biomass using hydrogen as energy vector. Renew. Energy 2021, 175, 104743. [Google Scholar] [CrossRef]
  6. Authayanun, S.; Hacker, V. Energy and exergy analyses of a stand-alone HT-PEMFC based trigeneration system for residential applications. Energy Convers. Manag. 2018, 160, 230–242. [Google Scholar] [CrossRef]
  7. Rossetti, I.; Compagnoni, M.; Torli, M. Process simulation and optimization of H2 production from ethanol steam reforming and its use in fuel cells. 2. Process analysis and optimization. Chem. Eng. J. 2015, 281, 1036–1044. [Google Scholar] [CrossRef]
  8. Cobo, M.; Pieruccini, D.; Abello, R.; Ariza, L.; Córdoba, L.F.; Conesa, J.A. Steam reforming of ethanol over bimetallic RhPt/La2O3: Long-term stability under favorable reaction conditions. Int. J. Hydrogen Energy 2013, 38, 5580–5593. [Google Scholar] [CrossRef]
  9. Sharma, Y.C.; Kumar, A.; Prasad, R.; Upadhyay, S.N. Ethanol steam reforming for hydrogen production: Latest and effective catalyst modification strategies to minimize carbonaceous deactivation. Renew. Sustain. Energy Rev. 2017, 74, 89–103. [Google Scholar] [CrossRef]
  10. Rabenstein, G.; Hacker, V. Hydrogen for fuel cells from ethanol by steam-reforming, partial-oxidation and combined auto-thermal reforming: A thermodynamic analysis. J. Power Sources 2008, 185, 1293–1304. [Google Scholar] [CrossRef]
  11. Angili, T.S.; Grzesik, K.; Rödl, A.; Kaltschmitt, M. Life cycle assessment of bioethanol production: A review of feedstock, technology and methodology. Energies 2021, 14, 2939. [Google Scholar] [CrossRef]
  12. Sanchez, N.; Cobo, M.; Rodriguez-fontalvo, D.; Uribe-laverde, M.Á.; Ruiz-pardo, R.Y. Bioethanol Production from Sugarcane Press-Mud: Assessment of the Fermentation Conditions to Reduce Fusel Alcohol. Fermentation 2021, 7, 194. [Google Scholar] [CrossRef]
  13. Coelho, T.C.; Souza, O.; Sellin, N.; Medeiros, S.H.W.; Marangoni, C. Analysis of the reflux ratio on the batch distillation of bioethanol obtained from lignocellulosic residue. Procedia Eng. 2012, 42, 131–139. [Google Scholar] [CrossRef] [Green Version]
  14. Ramírez Gil, J.G. Characterization of traditional production systems of sugarcane for panela and some prospects for improving their sustainability. Rev. Fac. Nac. Agron. 2016, 70, 8045–8055. [Google Scholar] [CrossRef]
  15. Banerjee, S.; Mudliar, S.; Sen, R.; Giri, B.; Saptute, D.; Tapan, C.; Pandey, R. Commercializing lignocellulosic bioethanol: Technology bottlenecks and possible remedies. Biofuels Bioprod. Biorefining 2010, 4, 77–93. [Google Scholar] [CrossRef]
  16. Luna, R.; López, F.; Pérez-Correa, J.R. Minimizing methanol content in experimental charentais alembic distillations. J. Ind. Eng. Chem. 2018, 57, 160–170. [Google Scholar] [CrossRef]
  17. Cifuentes, B.; Valero, M.F.; Conesa, J.A.; Cobo, M. Hydrogen production by steam reforming of ethanol on Rh-Pt catalysts: Influence of CeO2, ZrO2 and La2O3 as supports. Catalysts 2015, 5, 1872. [Google Scholar] [CrossRef] [Green Version]
  18. Cifuentes, B.; Gómez, J.; Sánchez, N.; Proaño, L.; Bustamante, F.; Cobo, M. Bioethanol steam reforming over monoliths washcoated with RhPt/CeO2–SiO2: The use of residual biomass to stably produce syngas. Int. J. Hydrogen Energy 2021, 46, 4007–4018. [Google Scholar] [CrossRef]
  19. Sanchez, N.; Ruiz, R.Y.; Cifuentes, B.; Cobo, M. Controlling Sugarcane Press-Mud Fermentation to Increase Bioethanol Steam Reforming for Hydrogen Production. Available online: https://data.mendeley.com/datasets/g4jrbkk7v9/1 (accessed on 15 April 2019).
  20. Cifuentes, B.; Figueredo, M.; Cobo, M. Response Surface Methodology and Aspen Plus Integration for the Simulation of the Catalytic Steam Reforming of Ethanol. Catalysts 2017, 7, 15. [Google Scholar] [CrossRef] [Green Version]
  21. Cifuentes, B.; Bustamante, F.; Araiza, D.G.; Diaz, G.; Cobo, M. Hydrogen purification of actual syngas streams for energy applications: Au-Cu supported over nano-shaped CeO2 as stable catalysts for the carbon monoxide removal. Appl. Catal. A Gen. 2020, 598, 117568. [Google Scholar] [CrossRef]
  22. Cifuentes, A.; Torres, R.; Llorca, J. Modelling of the ethanol steam reforming over Rh-Pd/CeO2 catalytic wall reactors. Int. J. Hydrogen Energy 2019, 45, 26265–26273. [Google Scholar] [CrossRef] [Green Version]
  23. Singh, D.K.; Tirkey, J.V. Modeling and multi-objective optimization of variable air gasification performance parameters using Syzygium cumini biomass by integrating ASPEN Plus with Response surface methodology. Int. J. Hydrogen Energy 2021, 46, 18816–18831. [Google Scholar] [CrossRef]
  24. Ozcan, O.; Akin, A.N. Thermodynamic analysis of methanol steam reforming to produce hydrogen for HT-PEMFC: An optimization study. Int. J. Hydrogen Energy 2019, 44, 14117–14126. [Google Scholar] [CrossRef]
  25. Kayathi, A.; Prasad, P.; Bonfim-rocha, L.; Cardozo-filho, L.; Bollampalli, A.; Jegatheesan, V. Extraction of γ-Oryzanol from defatted rice bran using supercritical carbon dioxide (SC-CO2): Process optimisation of extract yield, scale-up and economic analysis. Process Saf. Environ. Prot. 2021, 148, 179–188. [Google Scholar] [CrossRef]
  26. Zaman, S.A.; Roy, D.; Ghosh, S. Process modeling and optimization for biomass steam-gasification employing response surface methodology. Biomass Bioenergy 2020, 143, 105847. [Google Scholar] [CrossRef]
  27. Long, N.V.D.; Lee, M. Dividing wall column structure design using response surface methodology. Comput. Chem. Eng. 2012, 37, 119–124. [Google Scholar] [CrossRef]
  28. Hemmati, A.; Rashidi, H.; Hemmati, A.; Kazemi, A. Using rate based simulation, sensitivity analysis and response surface methodology for optimization of an industrial CO2 capture plant. J. Nat. Gas Sci. Eng. 2019, 62, 101–112. [Google Scholar] [CrossRef]
  29. Nalbant, Y.; Colpan, C.O.; Devrim, Y. Development of a one-dimensional and semi-empirical model for a high temperature proton exchange membrane fuel cell. Int. J. Hydrogen Energy 2017, 43, 5939–5950. [Google Scholar] [CrossRef]
  30. Gwak, G.; Kim, M.; Kim, D.; Faizan, M.; Oh, K.; Lee, J.; Choi, J.; Lee, N.; Lim, K.; Ju, H. Performance and efficiency analysis of an HT-PEMFC system with an absorption chiller for tri-generation applications. Energies 2019, 12, 905. [Google Scholar] [CrossRef] [Green Version]
  31. Cifuentes, B.; Cifuentes, A.; Bustamante, F.; Soler, L.; Llorca, J.; Cobo, M. Monoliths washcoated with AuCu catalysts for CO removal in an ethanol fuel processor: Effect of CeO 2 e SiO 2 dual support on the catalytic performance and reactor cost. Int. J. Hydrogen Energy 2020, 46, 2166–2181. [Google Scholar] [CrossRef]
  32. Veljković, V.B. Comment on “study of fuel properties of rubber seed oil based biodiesel” [Energy Convers. Manage. 2014;78:266-275] by Ahmad et al. Energy Convers. Manag. 2014, 86, 1186–1188. [Google Scholar] [CrossRef]
  33. Sacher, J.; García-Llobodanin, L.; López, F.; Segura, H.; Pérez-Correa, J.R. Dynamic modeling and simulation of an alembic pear wine distillation. Food Bioprod. Process. 2013, 91, 447–456. [Google Scholar] [CrossRef]
  34. Sanchez, N.; Ruiz, R.; Plazas, A.; Vasquez, J.; Cobo, M. Effect of pretreatment on the ethanol and fusel alcohol production during fermentation of sugarcane press-mud. Biochem. Eng. J. 2020, 161, 107668. [Google Scholar] [CrossRef]
  35. Hajar, S.; Azhar, M.; Abdulla, R.; Jambo, S.A.; Marbawi, H.; Azlan, J.; Azifa, A.; Faik, M.; Francis, K. Yeasts in sustainable bioethanol production: A review. Biochem. Biophys. Rep. 2017, 10, 52–61. [Google Scholar] [CrossRef]
  36. Roukas, T.; Kotzekidou, P. Rotary biofilm reactor: A new tool for long-term bioethanol production from non-sterilized beet molasses by Saccharomyces cerevisiae in repeated-batch fermentation. J. Clean. Prod. 2020, 257, 120519. [Google Scholar] [CrossRef]
  37. Malik, K.; Salama, E.S.; El-Dalatony, M.M.; Jalalah, M.; Harraz, F.A.; Al-Assiri, M.S.; Zheng, Y.; Sharma, P.; Li, X. Co-fermentation of immobilized yeasts boosted bioethanol production from pretreated cotton stalk lignocellulosic biomass: Long-term investigation. Ind. Crops Prod. 2021, 159, 113122. [Google Scholar] [CrossRef]
  38. Ben Atitallah, I.; Arous, F.; Louati, I.; Zouari-Mechichi, H.; Brysch-Herzberg, M.; Woodward, S.; Mechichi, T. Efficient bioethanol production from date palm (Phoenix dactylifera L.) sap by a newly isolated Saccharomyces cerevisiae X19G2. Process Biochem. 2021, 105, 102–112. [Google Scholar] [CrossRef]
  39. Han, W.; Liu, Y.; Xu, X.; Huang, J.; He, H.; Chen, L.; Qiu, S.; Tang, J.; Hou, P. Bioethanol production from waste hamburger by enzymatic hydrolysis and fermentation. J. Clean. Prod. 2020, 264, 121658. [Google Scholar] [CrossRef]
  40. Jin, X.; Ma, J.; Song, J.; Liu, G.Q. Promoted bioethanol production through fed-batch semisimultaneous saccharification and fermentation at a high biomass load of sodium carbonate-pretreated rice straw. Energy 2021, 226, 120353. [Google Scholar] [CrossRef]
  41. Thi, L.; Trinh, P.; Lee, J.; Lee, H. Acidified glycerol pretreatment for enhanced ethanol production from rice straw. Biomass Bioenergy 2016, 94, 39–45. [Google Scholar] [CrossRef]
  42. Lu, J.; Song, F.; Liu, H.; Chang, C.; Cheng, Y.; Wang, H. Production of high concentration bioethanol from reed by combined liquid hot water and sodium carbonate-oxygen pretreatment. Energy 2021, 217, 119332. [Google Scholar] [CrossRef]
  43. Ho, S.; Huang, S.; Chen, C.; Hasunuma, T.; Kondo, A. Biore source Technology Bioethanol production using carbohydrate-rich microalgae biomass as feedstock. Bioresour. Technol. 2013, 135, 191–198. [Google Scholar] [CrossRef] [PubMed]
  44. Onay, M. Bioethanol production via different saccharification strategies from H. tetrachotoma ME03 grown at various concentrations of municipal wastewater in a flat-photobioreactor. Fuel 2019, 239, 1315–1323. [Google Scholar] [CrossRef]
  45. Min, K.J.; Oh, D.Y.; Park, K.Y. Pilot-scale cultivation of water-net in secondary effluent using an open pond raceway for nutrient removal and bioethanol production. Chemosphere 2021, 277, 130129. [Google Scholar] [CrossRef] [PubMed]
  46. Oakley, J.H.; Hoadley, A.F.A. Industrial scale steam reforming of bioethanol: A conceptual study. Int. J. Hydrogen Energy 2010, 35, 8472–8485. [Google Scholar] [CrossRef]
  47. Cifuentes, B.; Bustamante, F.; Conesa, J.A.; Córdoba, L.F.; Cobo, M. Fuel-cell grade hydrogen production by coupling steam reforming of ethanol and carbon monoxide removal. Int. J. Hydrogen Energy 2018, 3, 17216–17229. [Google Scholar] [CrossRef] [Green Version]
  48. Mamlouk, M.; Sousa, T.; Scott, K. A High Temperature Polymer Electrolyte Membrane Fuel Cell Model for Reformate Gas. Int. J. Electrochem. 2011, 2011, 520473. [Google Scholar] [CrossRef] [Green Version]
  49. Fatsikostas, A.N.; Kondarides, D.I.; Verykios, X.E. Steam reforming of biomass-derived ethanol for the production of hydrogen for fuel cell applications. Chem. Commun. 2001, 1, 851–852. [Google Scholar] [CrossRef]
  50. Montero, C.; Remiro, A.; Benito, P.L.; Bilbao, J.; Gayubo, A.G. Optimum operating conditions in ethanol steam reforming over a Ni/La2O3-αAl2O3 catalyst in a fluidized bed reactor. Fuel Process. Technol. 2018, 169, 207–216. [Google Scholar] [CrossRef]
  51. Llorca, J.; Corberán, V.C.; Divins, N.J.; Fraile, R.O.; Taboada, E. Hydrogen from Bioethanol. Renew. Hydrog. Technol. Prod. Purif. Storage Appl. Saf. 2013, 135–169. [Google Scholar] [CrossRef]
  52. Nejat, T.; Jalalinezhad, P.; Hormozi, F.; Bahrami, Z. Hydrogen production from steam reforming of ethanol over Ni-Co bimetallic catalysts and MCM-41 as support. J. Taiwan Inst. Chem. Eng. 2019, 97, 216–226. [Google Scholar] [CrossRef]
  53. López, E.; Divins, N.J.; Anzola, A.; Schbib, S.; Borio, D.; Llorca, J. Ethanol steam reforming for hydrogen generation over structured catalysts. Int. J. Hydrogen Energy 2013, 38, 4418–4428. [Google Scholar] [CrossRef]
  54. Hernández, L.; Kafarov, V. Thermodynamic evaluation of hydrogen production for fuel cells by using bio-ethanol steam reforming: Effect of carrier gas addition. J. Power Sources 2009, 192, 195–199. [Google Scholar] [CrossRef]
  55. Arévalo, J.D.; Martinez-hernández, Á.; Vargas, J.C.; Córdoba, L.F. Hydrogen Production and Purification by Bioethanol Steam Reforming and Preferential Oxidation of CO. Tecciencia 2018, 13, 55–64. [Google Scholar]
  56. Francesconi, J.A.; Mussati, M.C.; Aguirre, P.A. Effects of PEMFC operating parameters on the performance of an integrated ethanol processor. Int. J. Hydrogen Energy 2010, 35, 5940–5946. [Google Scholar] [CrossRef]
  57. Suwanmanee, U.; Saebea, D.; Hacker, V.; Assabumrungrat, S.; Arpornwichanop, A.; Authayanun, S. Conceptual design and life cycle assessment of decentralized power generation by HT-PEMFC system with sorption enhanced water gas shift loop. Energy Convers. Manag. 2018, 171, 20–30. [Google Scholar] [CrossRef]
  58. Moradi Bilondi, A.; Abdollahzadeh, M.; Kermani, M.J.; Heidary, H.; Havaej, P. Numerical study of anode side CO contamination effects on PEM fuel cell performance; and mitigation methods. Energy Convers. Manag. 2018, 177, 519–534. [Google Scholar] [CrossRef]
  59. Palma, V.; Ruocco, C.; Ricca, A. Ceramic foams coated with Pt-Ni/CeO2-ZrO2 for bioethanol steam reforming. Int. J. Hydrogen Energy 2016, 41, 11526–11536. [Google Scholar] [CrossRef]
  60. Authayanun, S.; Suwanmanee, U.; Arpornwichanop, A. Enhancement of dilute bio-ethanol steam reforming for a proton exchange membrane fuel cell system by using methane as co-reactant: Performance and life cycle assessment. Int. J. Hydrogen Energy 2015, 40, 12144–12153. [Google Scholar] [CrossRef]
  61. George, D.; Suresh, P.V. Detailed analysis of Integrated Steam Ethanol Reformer and High Temperature Polymer Electrolyte Membrane Fuel Cell. Int. J. Hydrogen Energy 2015, 41, 1248–1258. [Google Scholar] [CrossRef]
  62. Authayanun, S.; Wiyaratn, W.; Assabumrungrat, S.; Arpornwichanop, A. Theoretical analysis of a glycerol reforming and high-temperature PEMFC integrated system: Hydrogen production and system efficiency. Fuel 2013, 105, 345–352. [Google Scholar] [CrossRef]
  63. Authayanun, S.; Arpornwichanop, A.; Patcharavorachot, Y.; Wiyaratn, W.; Assabumrungrat, S. Hydrogen production from glycerol steam reforming for low- and high-temperature PEMFCs. Int. J. Hydrogen Energy 2011, 36, 267–275. [Google Scholar] [CrossRef]
Figure 1. Aspen Plus® flowsheet for producing syngas from ethanol via ESR. S: Separators; E: Heat Exchangers; SR: Steam reforming reactors; CO-P: CO-removal reactor; K: Compressors; M: Mixers; Alembic: Batch distillation unit.
Energies 14 08366 g001
Figure 2. Process flow diagram for producing power from bioethanol.
Energies 14 08366 g002
Figure 3. Pareto chart for (a) power fuel cell; (b) total energy consumption; (c) process efficiency. The terms in the y axis correspond to: A (Initial ethanol content); B (Alembic load); C (Steam-to-ethanol ratio); D (Steam reforming temperature); and E (CO-removal temperature). Combined letters represent the interaction between the factors.
Energies 14 08366 g003
Figure 4. (a) Effect of the batch distillation time and inlet ethanol concentration (wt.%) on the molar steam-to-ethanol ratio; (b) Effect of the batch distillation time (min) on the bioethanol production (L); (c) Effect of the inlet ethanol concentration (wt.%) on the final bioethanol recovery (kmol bioethanol/kmol inlet bioethanol).
Energies 14 08366 g004
Figure 5. Surface plot diagram of the (a) power fuel cell; (b) H2 flow rate; (c) energy consumption, and (d) efficiency in terms of the steam-to-ethanol ratio (S/E) and the ethanol content (wt.%).
Energies 14 08366 g005
Figure 6. (a) Effect of the steam reforming temperature and S/E on the H2 composition (b) Effect of the steam reforming temperature and the use of a CO removal reactor on the CO composition, (c) H2 conversion on the CO-removal reactor for all the experiments.
Energies 14 08366 g006
Figure 7. Polarization curve for syngas fed to HT-PEMFC. Red line: (H2: 100 mol%; CO: 0.0 mol%; CO2: 0.0 mol%; CH4: 0.0 mol%; N2 balance); Blue line: (H2: 13.7 mol%; CO: 0.0 mol%; CO2: 7.0 mol%; CH4: 0.2 mol%; H2O: 3.10 mol%; N2 balance); green line (H2: 17.5 mol%; CO: 4.2 mol%; CO2: 3.1 mol%; CH4: 0.2 mol%; H2O: 10.2 mol%; N2 balance).
Energies 14 08366 g007
Figure 8. Correlation between the molar steam-to-ethanol ratio (S/E) and CO-removal temperature with the inlet ethanol concentration (wt.%).
Energies 14 08366 g008
Table 1. Ethanol composition from different agro-industrial feedstocks after fermentation.
FeedstockGenerationFermentation
Conditions
Ethanol
(g L−1)
Ethanol
(wt.%)
Ref.
Sugarcane press-mudFirstT = 30 °C, 200 rpm, pH = 5.5, 24 h61.06.21[34]
Sugar molassesFirstT = 30 °C, 115 rpm, 12 h78.68.00[35]
Cane molassesFirstT = 33 °C, 150 rpm, 48 h92.09.37[35]
Beet molassesFirstT = 30 °C, pH = 5.0, 40 rpm, 36 h52.3 5.33[36]
Cassava mashFirstT = 33 °C, 100 rpm, 42 h86.18.77[35]
Sorghum juiceFirstT = 30 °C, 72 h98.510.03[35]
Waste woodSecondT = 30 °C, 150 rpm, pH = 5.5, 16 h18.51.88[35]
Wheat strawSecondT = 42 °C, pH = 5.5, 72 h36.23.69[35]
Cotton stalkSecondT = 30 °C, 150 rpm, 96 h9.810.99[37]
Date palm sapSecondT = 30 °C, 150 rpm, 72 h86.88.91[38]
Waste hamburgerSecondT = 30 °C, 400 rpm, 50 h27.42.77[39]
Rice strawSecondT = 37 °C, 48 h112.311.61[40]
Rice strawSecondT = 30 °C, 150 rpm, 72 h9.65 0.95[41]
ReedSecondT= 36 °C, 48 h66.56.79[42]
C. vulgarisThirdT = 30 °C, pH= 5.0–6.0, 60 h11.71.18[43]
H. tetrachotoma ME03ThirdT = 30 °C, 150 rpm, 36 h11.21.13[44]
Hydrodictyon
reticulatum
ThirdT = 30 °C, 120 rpm, 48 h26.22.65[45]
Table 2. Optimized variables to produce power from raw bioethanol.
ParameterUnitValue
EtOH contentwt.%7.07.58.08.59.0
Alembic loadkg6.06.06.06.06.0
S/E 5.04.64.34.03.8
ESR temperature°C700700700700700
CO-removal temperature°C236253269286297
PowerkWh kg−10.070.070.070.070.07
Efficiency%17.817.617.417.417.2
Energy consumptionkW kg−10.370.370.370.360.36
Number of cells 1313131313
H2 flow ratemol s−1 kg−12.682.732.772.772.78
Publisher’s Note: MDPI stays neutral with regard to jurisdictional claims in published maps and institutional affiliations.

