1. Introduction
The majority of the human population is located in cities, where, in developed countries, about 80% of the population lives [
1]. This contributes to problems associated with dense urban areas, such as urban heat island effects, which ultimately lead to a higher energy demand, but also to higher production of unwanted exhalants and emissions. Moreover, the use of solar energy helps to mitigate various environmental problems and improve the quality of life in the cities. Solar thermal or photovoltaic applications are very common around the world and have become an important factor in the overall energy production mix in many countries. Therefore, it is increasingly important to know the solar resource potential of urban areas.
Solar radiation in urban areas is a key input factor in many urban energy models and sustainable city designs. Examples include thermal and photovoltaic applications, passive heating systems, or urban microclimate designs [
2,
3,
4]. The implementation of distributed photovoltaic systems transforms the urban environment from a place of energy consumption to a place of energy production. Distributed solar systems are scalable at a micro-scale and open up new investment opportunities for electricity production within the city, allowing consumers to become producers. The changes, associated with rapidly expanding solar benefits in cities, are expected to have disruptive impacts on urban electricity infrastructures and related institutions, and will require tools to evaluate and plan for future changes.
The increasing availability of three-dimensional (3D) city models and high-resolution geospatial data stimulated solar resource assessments for urban areas [
2,
5,
6,
7]. Currently, there are several well-developed models of solar radiation distribution, such as the r.sun model by Hofierka and Šúri [
8], the Solar Analyst model in the ArcGIS program [
9], the Perez model [
10], the SORAM model [
11], SURFSUN3D [
12], and the SOL model [
6], often used for solar radiation assessments in urban areas. Hofierka and Zlocha [
5] developed v.sun, a 3D version of the r.sun model for 3D city models. Freitas et al. [
6] pointed out that 3D solar radiation modeling that includes vertical surfaces, such as facades, is very time consuming if applied to large cities. The data must include topologically correct 3D vector data that usually require manual editing and verification of 3D polygon orientation represented by a normal vector. A frequent solution to the problem is the use of a high-resolution digital surface model (DSM) approximating vertical surfaces, such as facades, by quasi-vertical surfaces [
13]. This introduces an error in solar radiation estimates for vertical surfaces. To date, no in-depth analysis has been published that assesses whether this approximation is acceptable.
Nevertheless, the previously predominant two-dimensional (2D) solar radiation models, such as the r.sun model [
8], are gradually being augmented by 3D solar radiation models that allow a better representation of vertical surfaces (building facades) while facilitating interactive assessment of PV potential in complex urban environments [
12,
14,
15,
16]. Technological advances provide new opportunities for complex 3D approaches in solar modeling [
17].
The main objective of this study is to compare the results of 2D r.sun and 3D v.sun solar radiation models implemented in GRASS GIS [
18] with field measurements by a pyranometer for the city of Košice in eastern Slovakia to demonstrate the applicability of 2D vs. 3D approaches in assessing the solar resource potential in urban areas. Therefore, five locations are selected with morphologically diverse buildings still typical for this urban area. The measurements and solar radiation modeling were carried out during a typical summer day (23 June 2021) for three different time moments. The solar radiation values were calculated for the time of measurements using the r.sun and v.sun modules integrated in the open-source GRASS GIS software. By comparing the r.sun and v.sun models with the measurements, we demonstrate the accuracy of the models specifically for selected building facades.
2. Methods and Data
Most GIS-based solar radiation models provide estimates of solar radiation over large areas using digital terrain models (DTMs) and selected atmospheric and land cover parameters derived from ground-based or satellite-based data [
19,
20,
21,
22]. These topographic solar radiation models can only be used for 2D surfaces, such as land surfaces or rooftops. There are 2 models implemented in GRASS GIS that are based on the same fundamental basis of solar radiation, but they work differently with the geometric representation of the Earth’s surface. The r.sun model is for 2D surfaces, such as terrain or roofs, represented by rasters, while v.sun is for 3D city models represented by 3D vectors [
5].
The solar radiation methodology used in the r.sun and v.sun models is based on the European Solar Radiation Atlas (ESRA) methodology [
23,
24] and described in [
8] and [
5]. The calculation of the direct (beam) component of solar radiation on surfaces for clear-sky atmospheric conditions
(W/m
2) is quite straightforward:
where
is the normal extra-terrestrial irradiance outside the atmosphere (W/m
2),
is the air mass 2 Linke atmospheric turbidity factor (-), m is the relative optical air mass (-),
the Rayleigh optical thickness at air mass m (-), and
is the solar incidence angle measured between the sun and a surface.
The diffuse component implemented in this model is empirically derived from European climate conditions. The model for estimating the clear-sky diffuse irradiance on a surface
[W/m
2] is defined by the following equation [
25]:
where
is a diffuse transmission function dependent on the Linke turbidity factor
,
is a diffuse solar altitude function dependent on the solar altitude
,
is a function accounting for the diffuse sky irradiance dependent on surface inclination
, and
is a measure of the amount of beam irradiance available. For surfaces in a shadow, we assume
and
.
The ground reflected clear-sky irradiance received on a surface
(W/m
2) is proportional to the total horizontal irradiance, which is a sum of beam and diffuse irradiance on a horizontal surface, mean ground albedo, and a fraction of the ground viewed by a surface [
26]. The reflected radiation contributes to total radiation only by several percents in open areas and depends strongly on the reflectance of surrounding surfaces [
8].
2.1. The r.sun Solar Radiation Model
The r.sun model implemented in the open GRASS GIS environment is one of the commonly used GIS-based solar radiation models [
18]. The r.sun model is based on a comprehensive methodology for spatially and temporally distributed solar radiation and irradiance calculations developed by Hofierka and Šúri [
8]. The model can calculate direct (beam), diffuse, and reflected solar radiation components of the total solar radiation for a specific location on land surface, given day, latitude, and atmospheric conditions. The module is designed to meet the needs of users in different scientific fields, such as environmental sciences, photovoltaics, agriculture, or forestry. Its applications range from local to regional scales. Another typical feature of this module is that it considers the shadow effect of local topography, which can be switched on and off according to the type and need of a given calculation. Solar irradiation maps are calculated by integrating the corresponding irradiances in selected time steps between the sunrise and sunset times for a given day.
The r.sun module works in two modes. In the first mode, it calculates the angle of incidence of solar radiation (expressed in degrees) and the solar irradiance values (W/m
2) for the set local time. In the second mode, the daily solar irradiation amounts are calculated for the set day. By scripting, these two modes can be used separately or in combination to provide estimates for any desired time interval [
27].
Together with the r.sun model, the PVGIS online tool was developed to assess the photovoltaic potential of chosen locations within the regions of Europe and Africa [
28]. The r.sun model was also used in the assessments of photovoltaic potential in urban areas [
2]. The most commonly investigated surfaces include roofs of buildings. Thus, we can determine, for example, the photovoltaic potential for installing PV systems on these rooftops [
2].
The basic input parameters of the r.sun model include a DSM and raster maps of slope steepness, aspect, and land surface albedo, as well as Linke’s turbidity coefficient. Another input parameter is the specific hour of the day and day of the year for which calculations of global solar radiation, or its individual components, will be performed.
The advantages of this model according to Šúri et al. [
27] are as follows:
Full integration with GRASS GIS;
Calculations can be performed in sunny weather or during the day;
Input and output data can be processed by other tools in the GRASS GIS environment;
The data are obtained from meteorological and satellite stations;
Memory management and code optimization allows to use high-resolution data from a local to global level.
The growing trend of solar applications in urban areas requires the use of the most efficient models that can evaluate the solar potential of each surface. Therefore, it is important to evaluate the complex morphology of urban areas using models that exploit 3D environments. While the r.sun model can be applied to 2D surfaces in the form of rooftops, the v.sun model has been developed to detect the solar potential of vertical surfaces and facades [
5].
2.2. The v.sun Solar Radiation Model
The v.sun model is essentially a 3D variant of the r.sun model that can also calculate direct, diffuse, and reflected solar radiation for a given day, latitude and surface, and atmospheric conditions. It is implemented in the GRASS GIS environment and is based on practically the same radiation methodology as the r.sun model. The difference, however, is that the v.sun model uses a new vector-voxel calculation procedure for complex 3D urban surfaces [
5].
Buildings and urban areas are represented by 3D vectors in the form of polygons when using the v.sun model in 3D urban models. A typical simple digital representation of buildings is a box model. Although the calculation of the incident solar radiation for each polygon may seem simple, the shading effect of neighboring buildings must also be taken into account. This is why it is important in the v.sun model to take into account the variations in solar incidence and to divide each polygon into smaller segments. By segmenting the polygons in the next step, we are able to determine a more accurate estimate of the solar potential of polygonal areas thanks to voxels [
5].
The v.sun model estimates direct, diffuse, and reflected radiation during clear-sky conditions. As solar radiation passes through the atmosphere, airflow and atmospheric cloudiness are taken into account, which can change the nature of the radiation. Similar to r.sun, the calculation works in two modes. The first mode is used to compute solar irradiances (in W/m2) for 3D polygonal data. The second mode aims to use the 3D vector data to determine the daily solar irradiation (in W/m2) over the time span of a particular day within the year. The advantage of these modes is that they can work alone or in combination to estimate the solar radiation impact at different time intervals.
The fundamental difference between the v.sun and r.sun module is in the geometry. While v.sun uses a complete or full 3D model of the city (roofs as well as vertical surfaces, such as facades, are taken into account), r.sun is a 2D (for a given x,y position, only one elevation value is possible). Thus, the r.sun model is more suitable for modeling the distribution of solar radiation for roofs and areas outside buildings.
The preparation of the input data of the v.sun model is quite complicated in terms of structure and topology. The orientation of the polygons (surface normals) must be outwards, and the vertices in all polygons must be ordered in the same manner clockwise or counterclockwise. The accuracy of the calculations depends on the size of the polygons that can be controled by a parameter [
5].
2.3. Study Area and Data
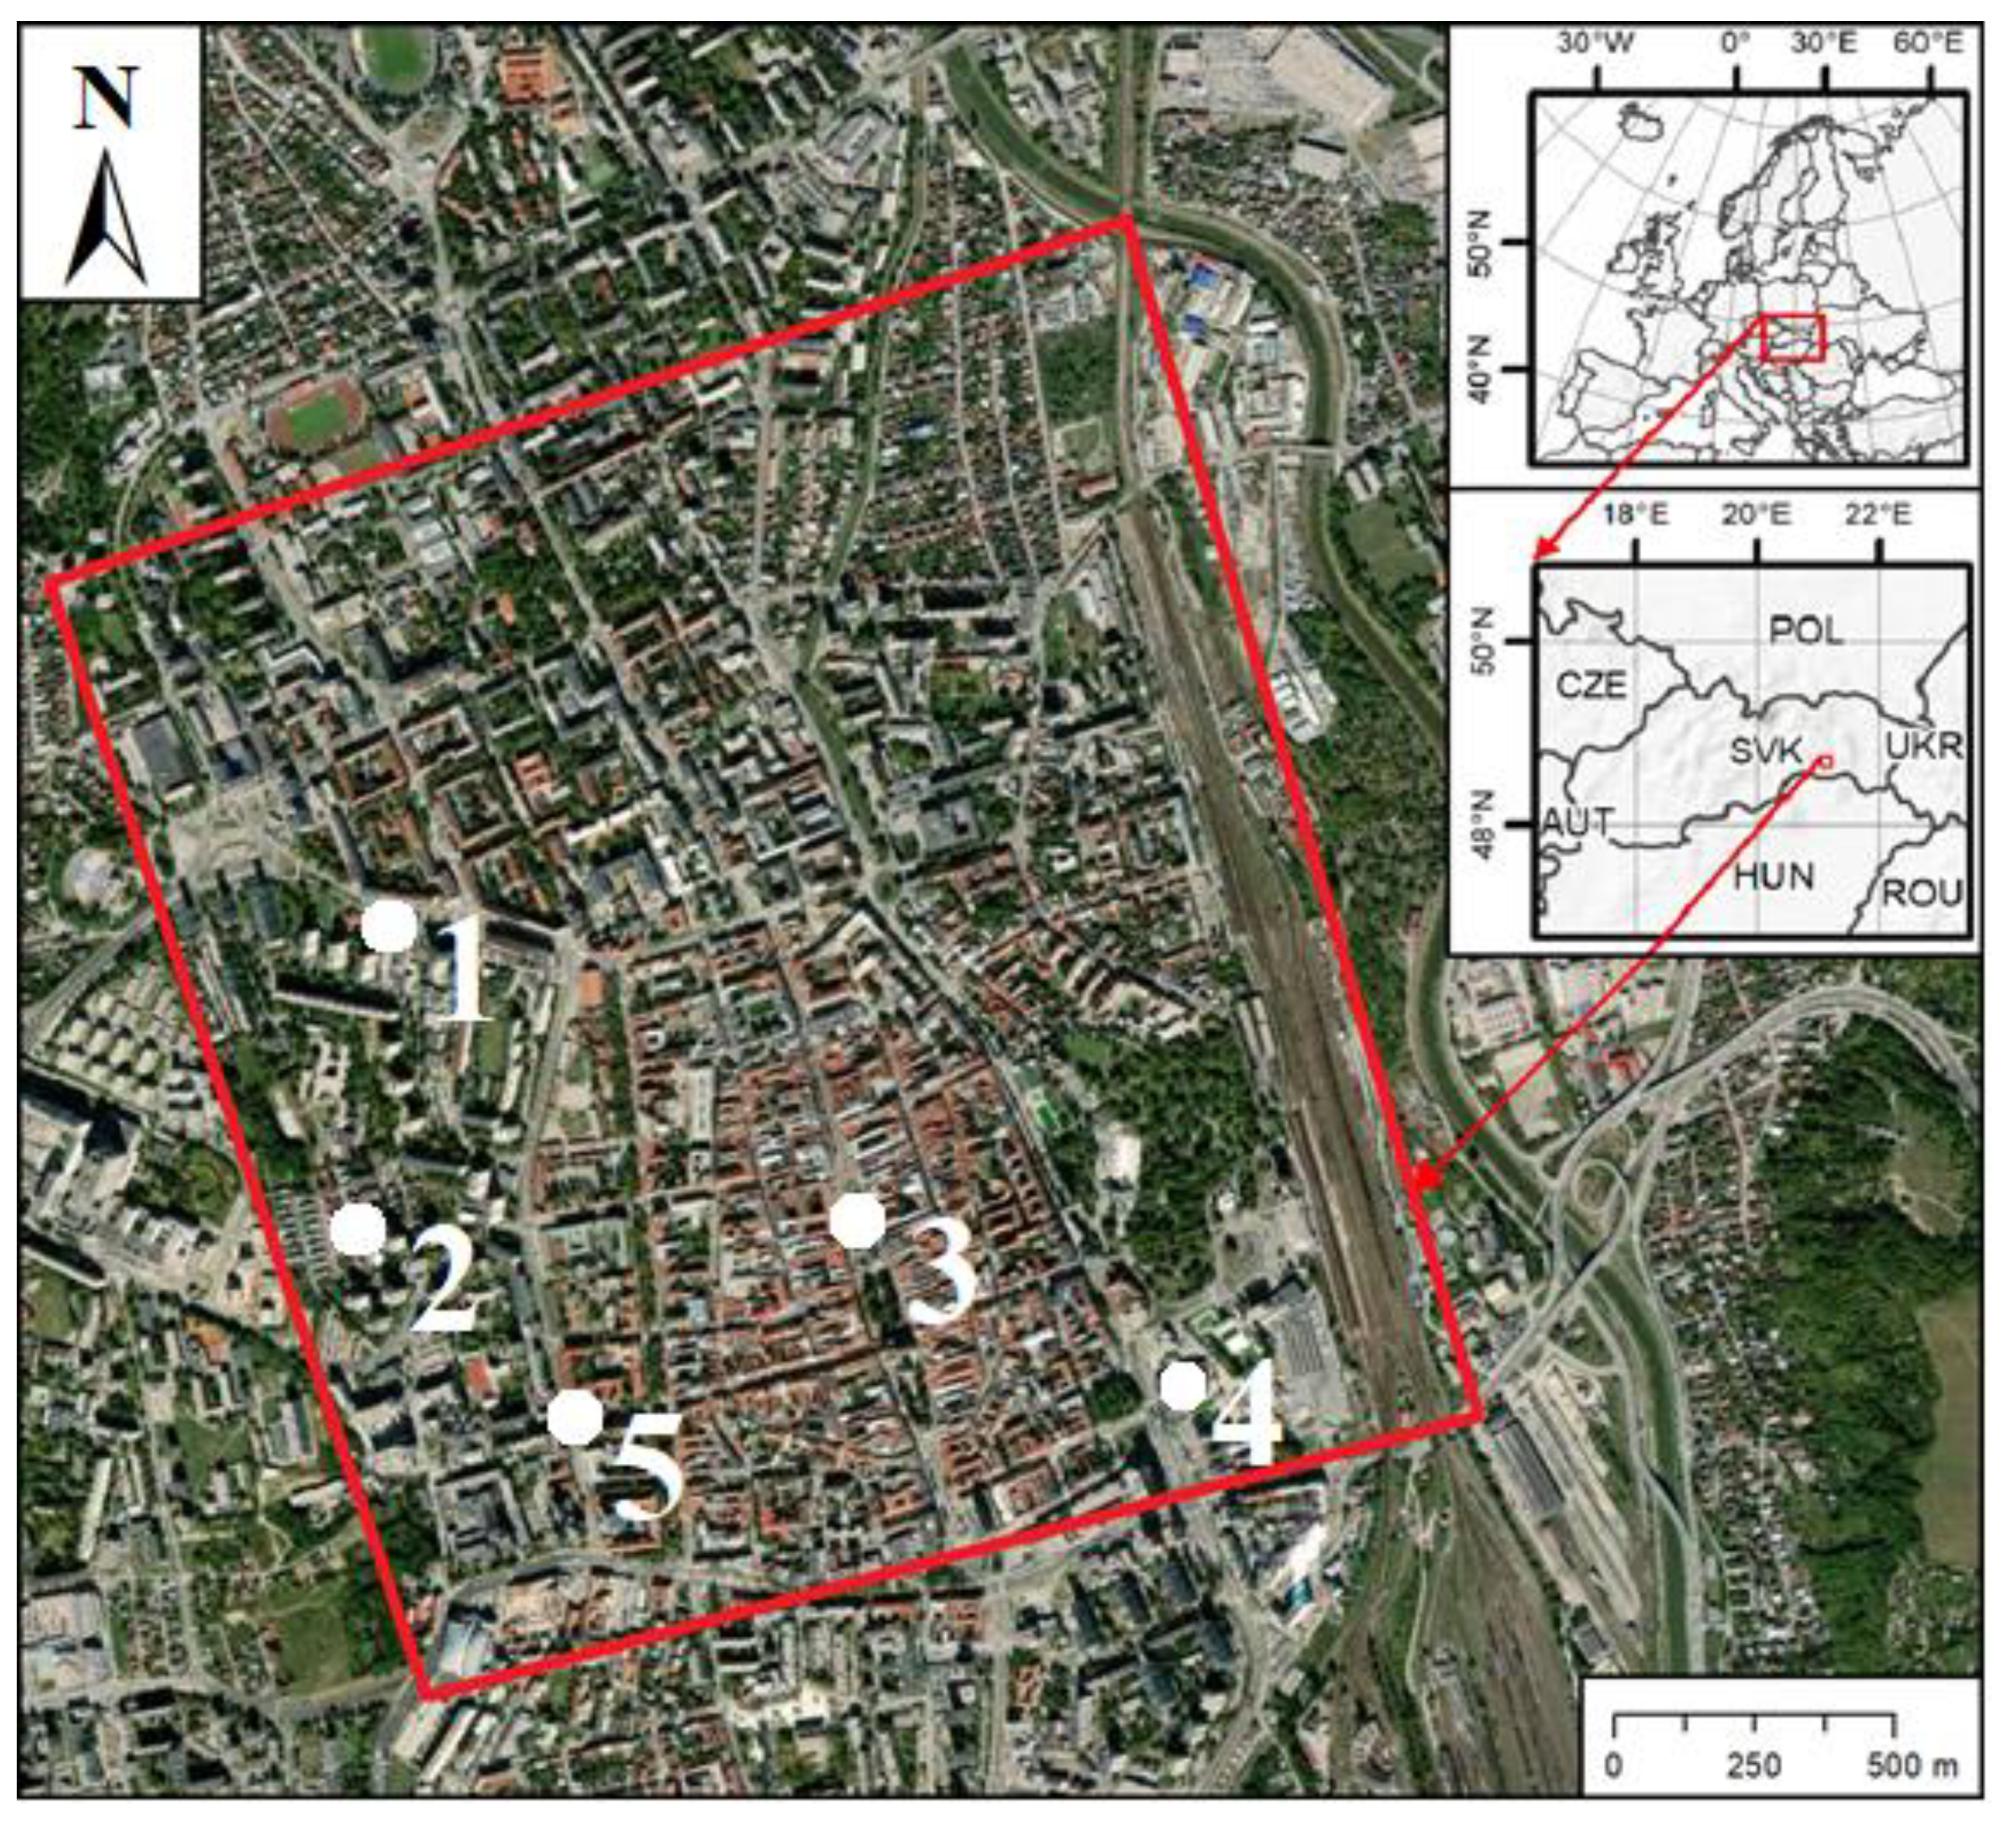
Our study area is located in the central part of the city of Košice (
Figure 1). The city of Košice is the second largest city in Slovakia with a population of approximately 240,000 inhabitants and an area of 242.77 km
2. It is part of an agglomeration with more than 367,000 inhabitants and the Košice-Prešov agglomeration with 555,800 inhabitants is one of the largest urbanized areas in Slovakia. The city of Košice is a typical example of an urban area in a temperate climate in Central Europe. The eastern part of Slovakia, where the city of Košice is also located, is characterized by warm and relatively dry summers and cold, slightly humid winters, with average daily temperatures ranging from −2 °C in January to 21 °C in July. The average annual number of clear-sky and overcast days for the city Košice is 48 and 126, respectively [
29]. Based also on this factor, an area of 4 km
2 was selected, where different types of buildings are located, from administrative to residential buildings.
The geometric 3D model of the city of Košice was derived from photogrammetric data collected by PHOTOMAP, s.r.o. company Košice. The model represents a level of detail 2 (LoD2) [
30], which means that the model contains information about the basic geometry of buildings, including roofs. The 3D model itself was processed by combining data from aerial surveying and airborne laser scanning. The aerial survey imagery was photogrammetrically mapped in the PHOTOMOD software and the aerial laser scanning data were vectorized in the Ustation software. The 3D city model is stored in a shapefile vector format and consists of 61,766 polygons. A DTM with a cell size of 0.2 m was derived from LIDAR (light detection and ranging) data collected in late summer 2016 using the LEICA ALS70 airborne laser scanner.
Pyranometer MS-60 [
31,
32] produced by the EKO-INSTRUMENTS company was used to measure solar irradiances. The pyranometer’s response time is 95% less than 18 s; the measured irradiance values are in the range of 0–2000 W/m
2; and maximum measuring error is +/−18 W/m
2. Measurements were taken at selected locations around 9:00 a.m., 12:00 p.m., and 4:00 p.m., local time. Two minute measurements at five s intervals were taken at the given location, then the values were averaged.
2.4. Calculation of Solar Radiation
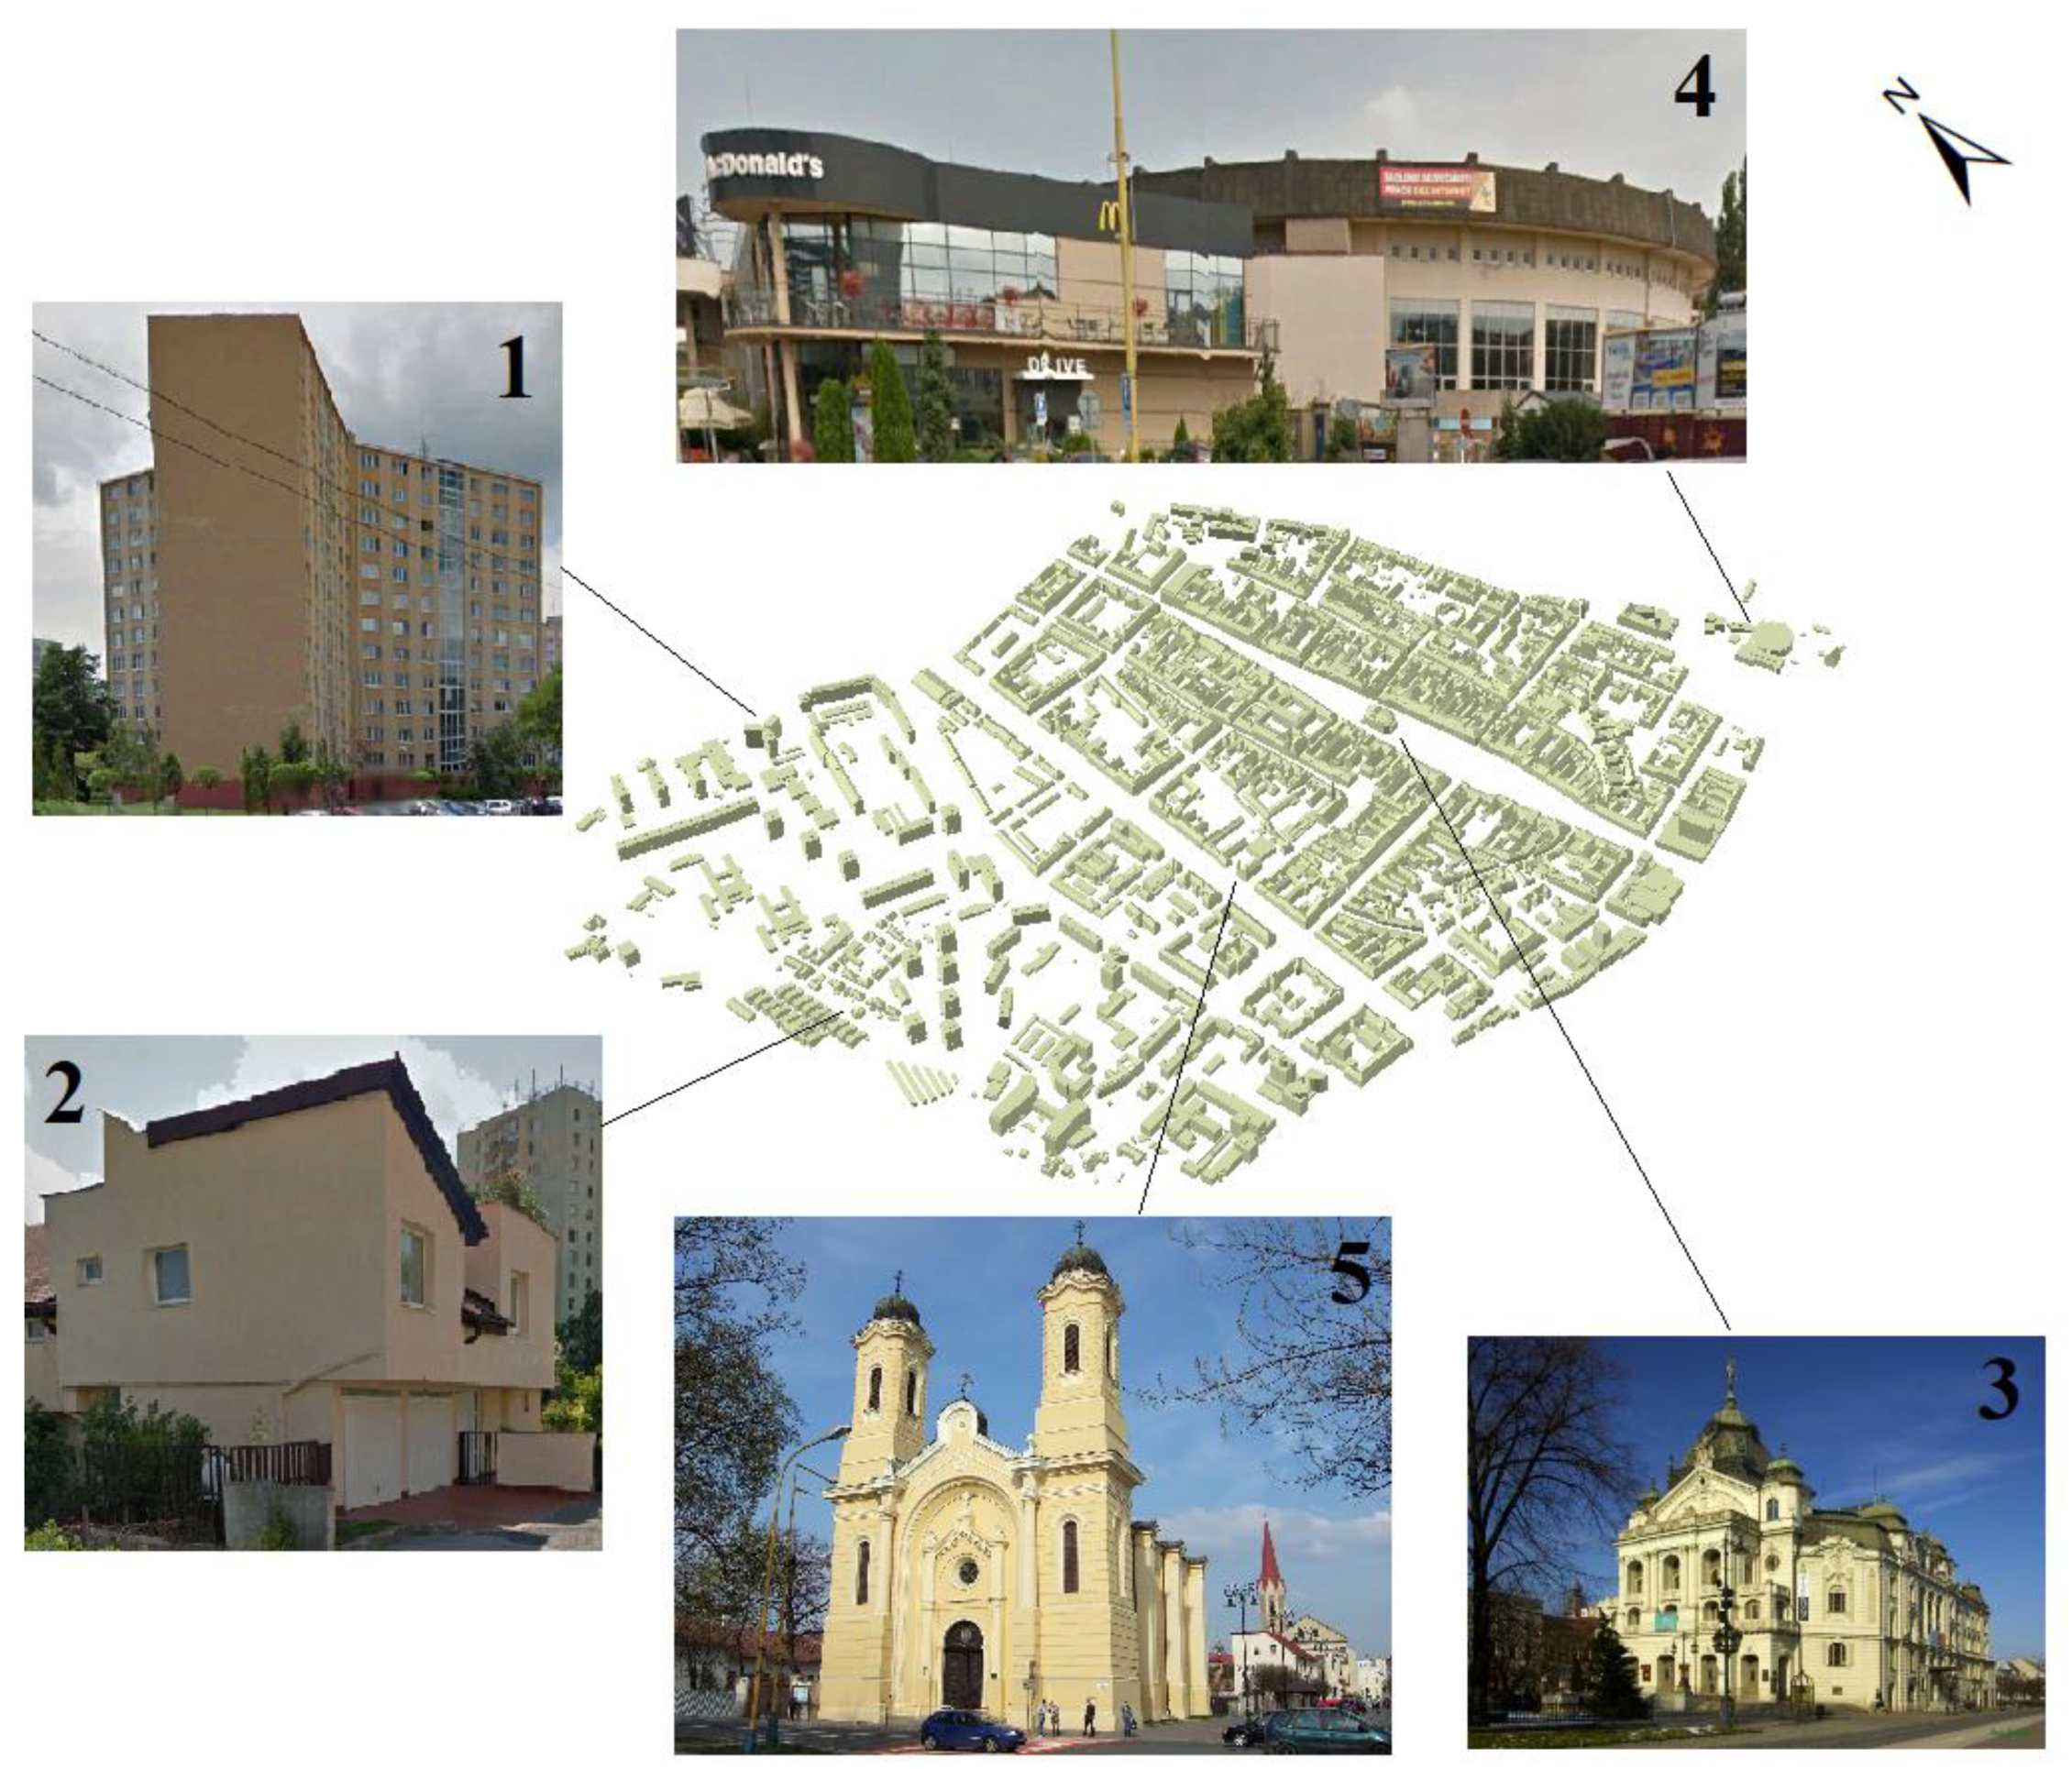
Urban zones can be distinguished on the basis of their morphological and functional characteristics, which are often associated with specific socio-demographic and cultural features [
33]. These factors play an important role in the use of solar energy, so it is important to analyze the different aspects of solar radiation distribution in urban environments. Based on these factors, 5 locations in the city of Košice were selected to demonstrate the use of the r.sun and v.sun modules, and then these locations were compared with the data from the pyranometer measurements (
Figure 2). These include two buildings in the city centre (the State Theatre and the Greek-Catholic Church) and three buildings from the wider city centre of Košice, namely the Municipal Swimming Pool, the apartment house, and the residential house. The actual measurements were carried out on the selected vertical facades of the buildings. We opted for south-facing facades at the selected locations in most cases; in one case, it was the east-facing facade. Subsequently, the measured values were compared with the calculated irradiance values by the v.sun and r.sun models. In case of the v.sun model, it can be easily identified as an attribute value for the specific polygon representing the facade. In case of the r.sun model, the identification of the site on the steeply inclined surface approximating the facade is more complicated, essentially it is a matter of a specific cell identification within the DSM. The positions of pyranometer measurements were measured by the global navigation satellite system (GNSS) using the Topcon HiPER HR. The point measurements were performed for 30 s using the real-time kinematic (RTK) positioning via weighted averaging with an overall accuracy of the fixed solution between 1 and 2 cm.
3. Results
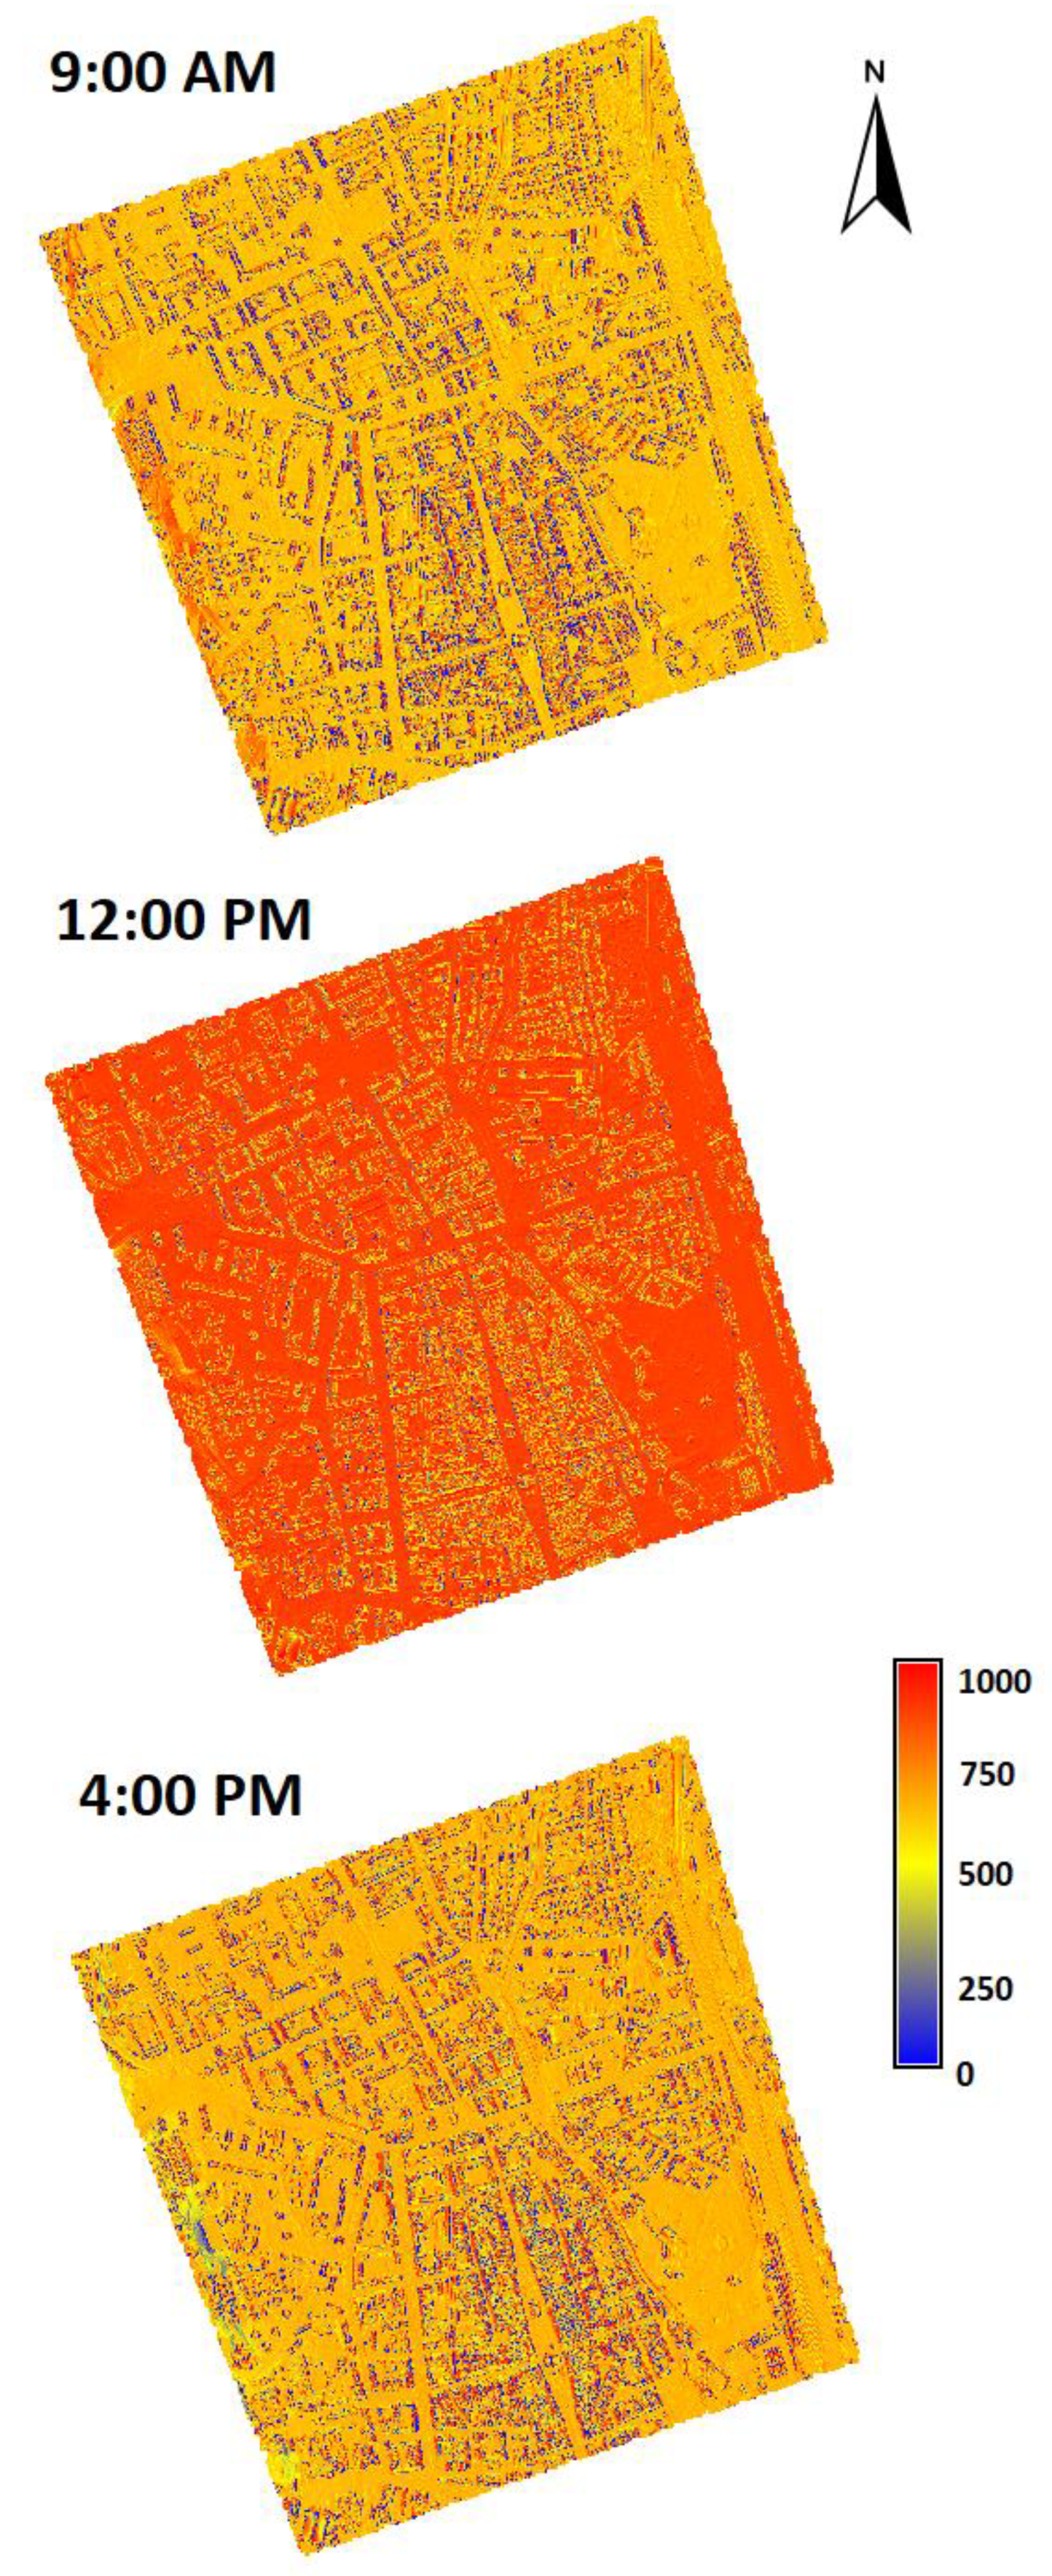
The selected buildings have different architectures and different types of facades. We selected four south-facing and one east-facing facade. The day during which the measurements took place represents a typical summer day (23 June 2021). The measurements took place at approximately 9:00 a.m., 12:00 p.m., and 4:00 p.m., local time. Since we only had one pyranometer, we had to conduct the actual measurement between 8:30 a.m. and 9:30 a.m., since it was not possible to be at all selected locations at the same time. This was also performed for the 12:00 p.m. and 4:00 p.m. measurements. The exact times of measurements were recorded by the pyranometer. We then computed irradiances by solar models for these exact times of measurements. Using the r.sun module, we calculated raster maps for the selected time horizons for the center of the city of Košice, which are shown in
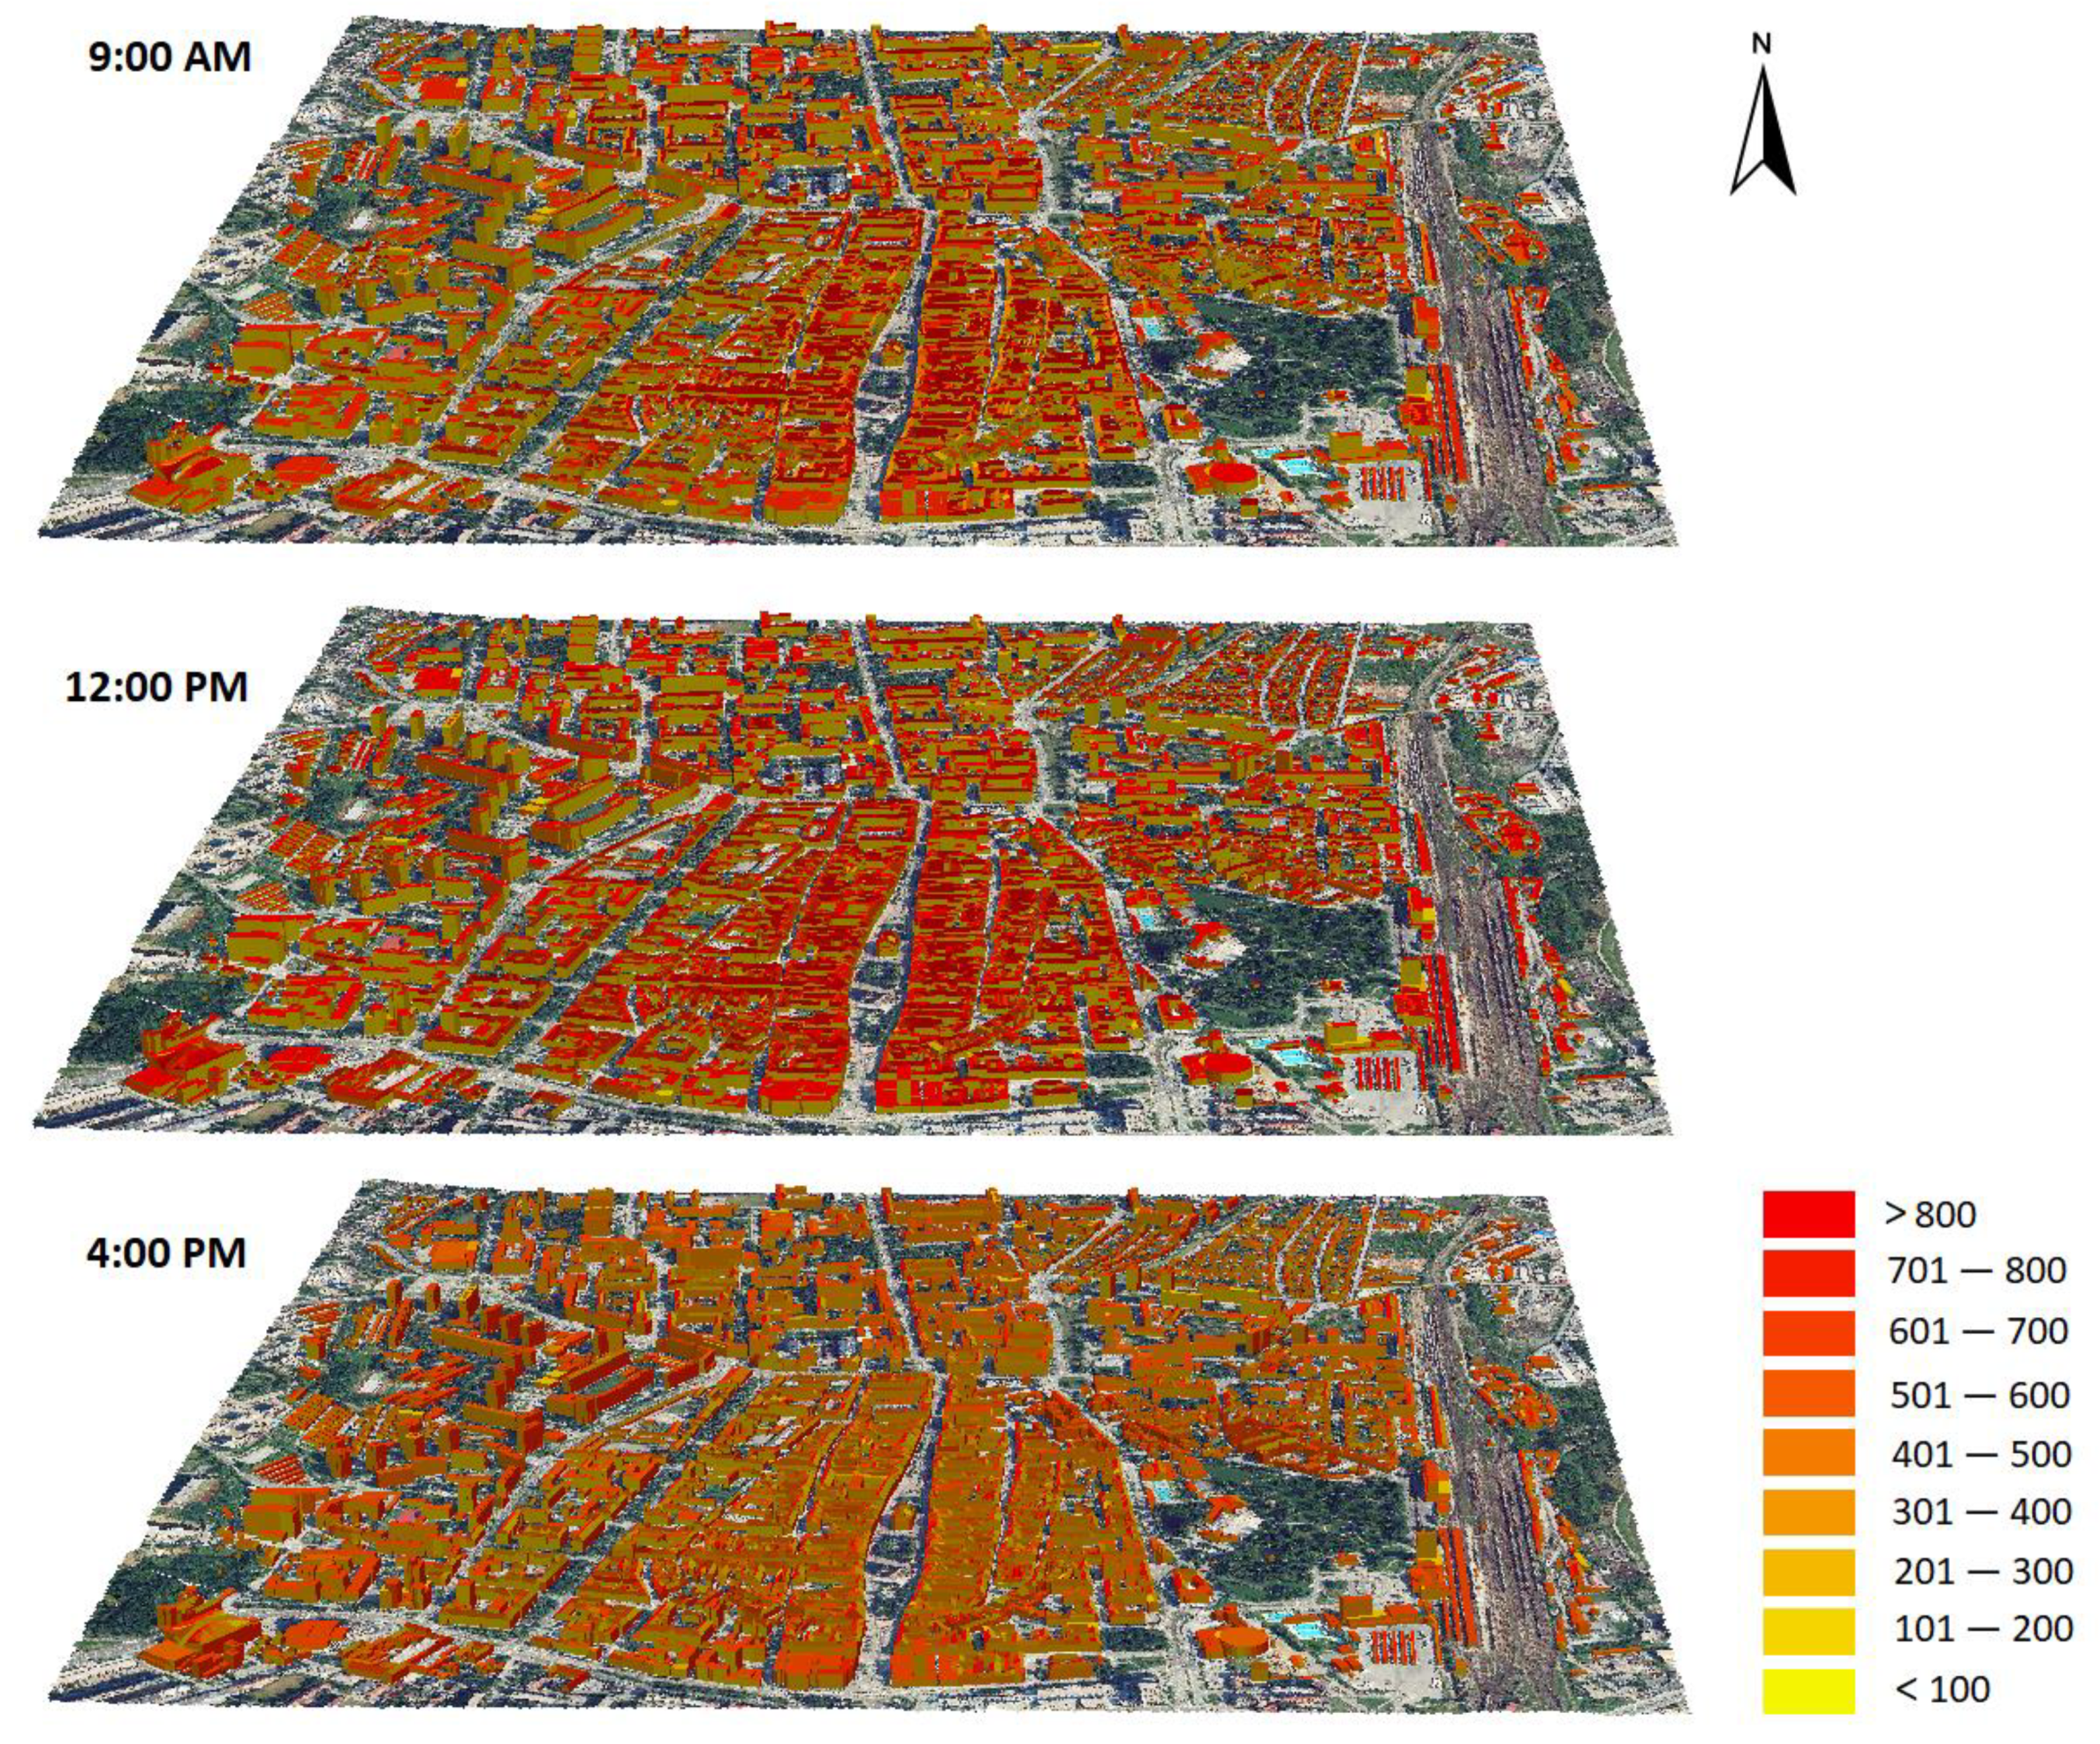
Figure 3. The calculation of solar radiation by the r.sun model is based on the DSM representing terrain and buildings. The facades are only approximated by steeply inclined surfaces. To compare the model with pyranometer measurements for the selected locations, we used their GNSS positions and identified raster cells containing the modeled solar irradiance values. The 3D distribution of solar irradiance by the v.sun model is shown in
Figure 4. The model calculates solar irradiance only for polygons of the 3D city model. This means that it is much easier to identify solar irradiance for a particular facade represented by a polygon than by raster cells.
Since the real time of measurement is always recorded by the instrument, we could use the solar radiation models for these exact times to ensure the correct comparison between the values. In the following subsections, we present the results for the particular locations.
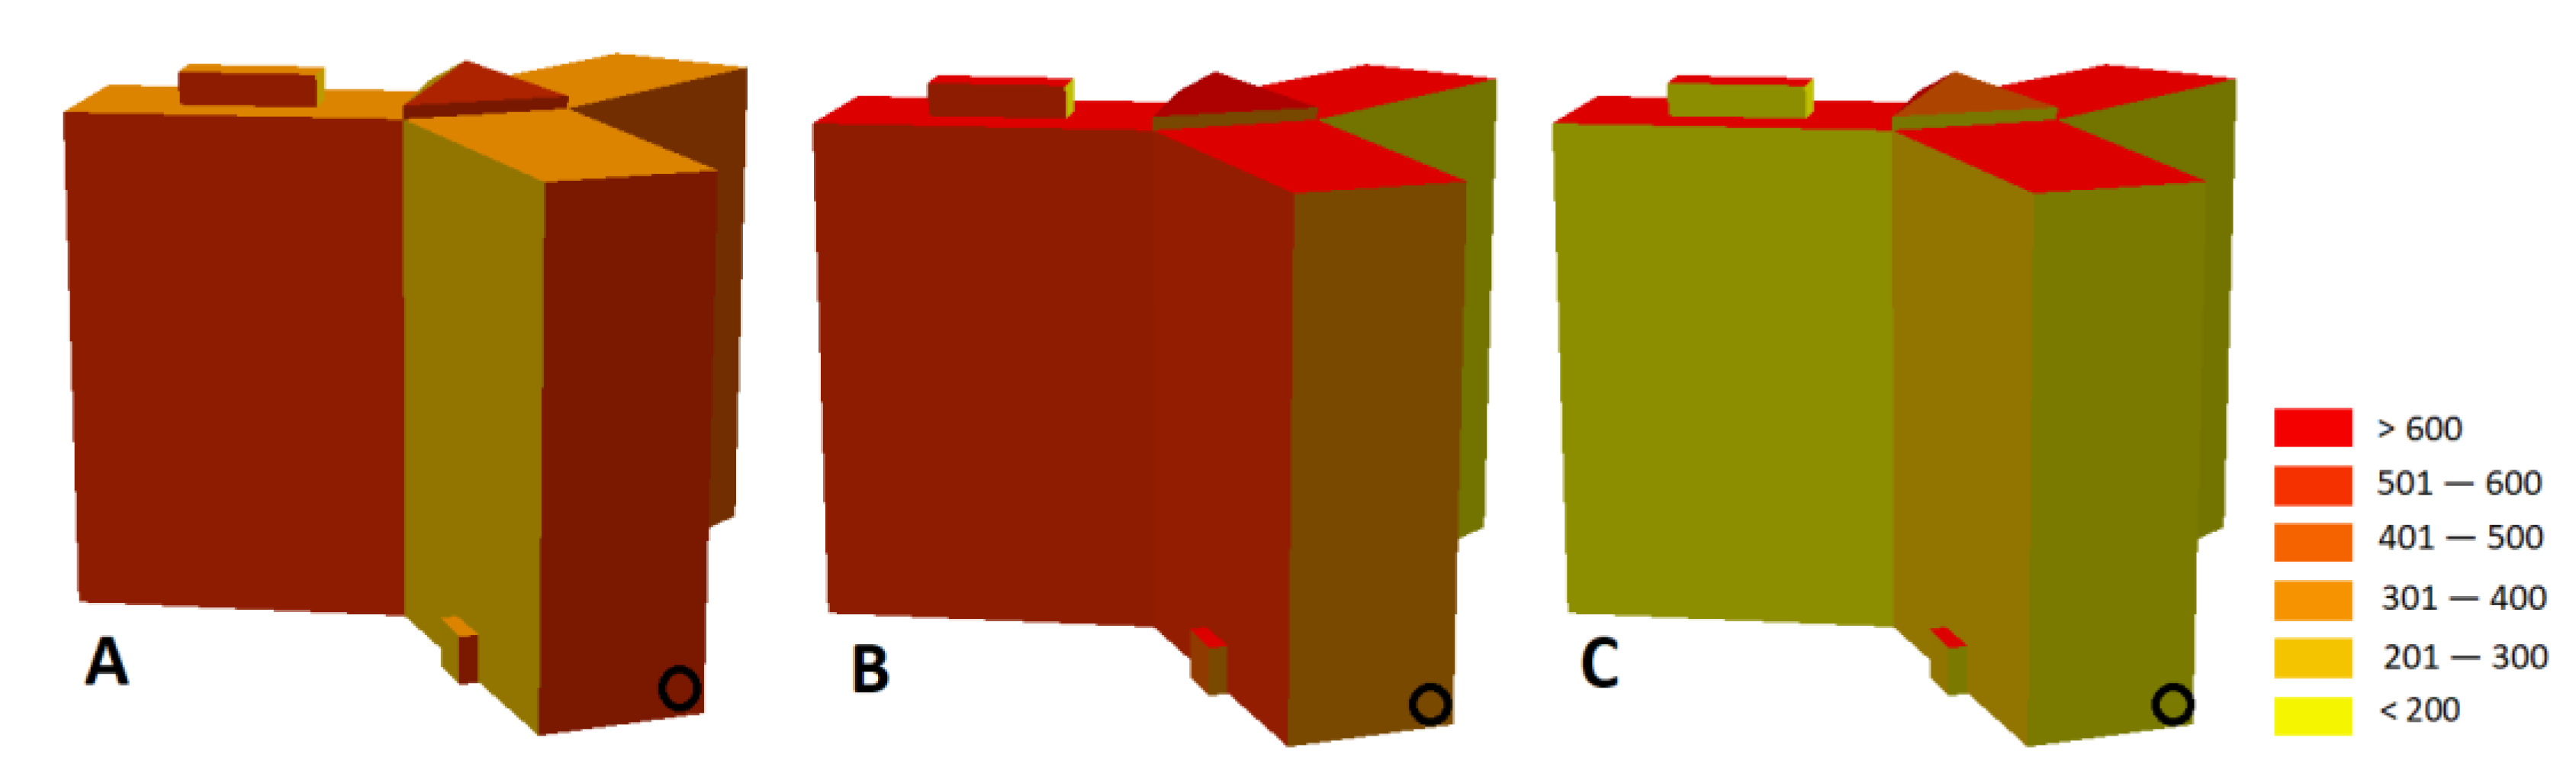
3.1. Apartment House
The first location is situated in the wider center of Košice in Československá street-apartment house (
Figure 1 and
Figure 2). The facade faces the east. At 8:26 a.m., we recorded a value of 663 W/m
2, which is the highest value of all measured objects at that time (
Table 1). This is evidently due to the fact that the facade itself is oriented to the east, so solar irradiance is higher than in other south-facing facades or even on horizontal surfaces. The v.sun model gave us a value of 581 W/m
2 (
Figure 5A), and the r.sun model calculated a value of 40 W/m
2. The value from the r.sun model was read on a nearly perpendicular building facade represented by a high-resolution DSM. However, the facade approximation in this relatively tall building, apparently, led to geometric deformations that prevented a correct calculation of solar irradiance.
Figure 5A shows that in the morning facades receive more solar irradiance than flat, horizontal rooftops.
At 11:25 a.m., the measured facade value dropped to 249 W/m
2 compared to the morning measurement. A similar decrease can be observed in the v.sun value (396 W/m
2). This decrease in solar irradiance is due to its facade orientation. The r.sun value still shows a low value due to an improper geometric representation of the facade by the particular raster cell.
Figure 5B clearly shows that, at this time, solar irradiance is the highest at the rooftops as well as south-facing facades.
At 3:13 p.m., we recorded a value of only 72 W/m
2. This indicates that the site was already shaded. With the v.sun model, we recorded a value of 180 W/m
2, and r.sun calculated a value of 952 W/m
2. The v.sun model probably records a small amount of beam irradiance, whilst the r.sun model shows a completely opposite value to the morning and noon values and confirms the problem with the accuracy of geometric representation of the facade. At this time, the rooftops receive a relatively large amount of solar irradiance (
Figure 5C).
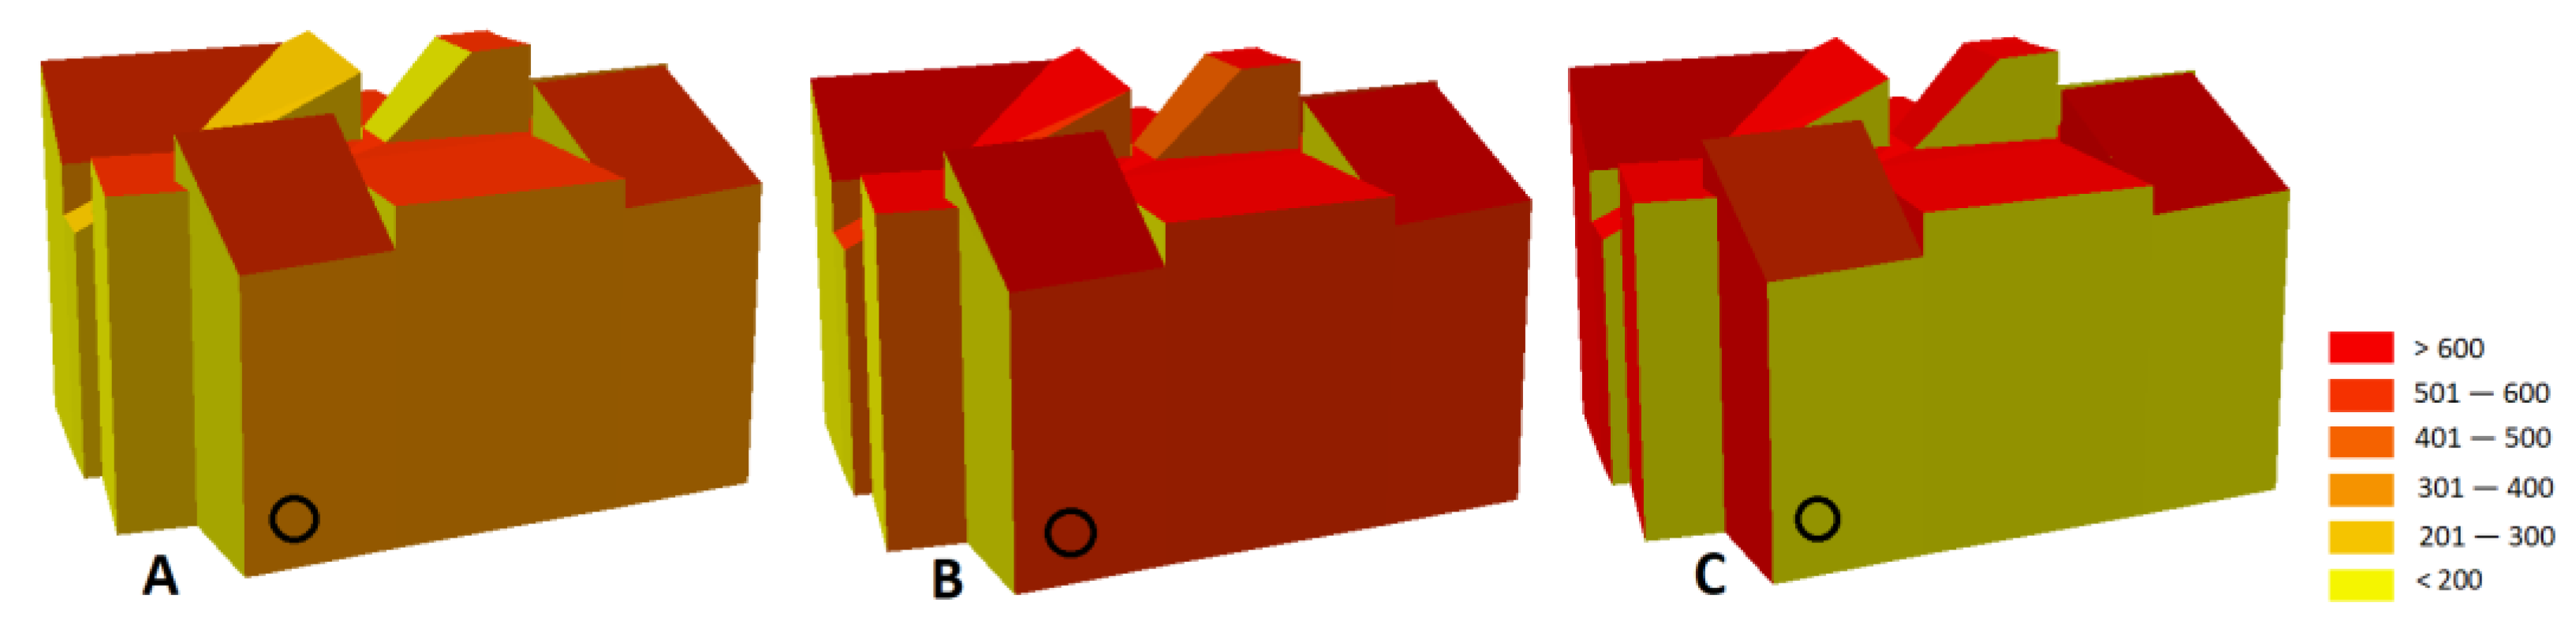
3.2. Residential House
The second analyzed location is a residential house in Muránska Street. It is a classic two-story house in the wider center of Košice. In this case, we selected a south-facing facade. The value measured by the pyranometer at 8:39 a.m. is 458 W/m
2 (
Table 2), which is more than 200 W/m
2 less compared to the previous location (
Table 1). In the morning, east-facing facades receive more solar irradiance than south-facing facades. We recorded a value of 372 W/m
2 with the v.sun model and 574 W/m
2 with the r.sun model (
Figure 6A). Both values vary from the measured value, but they are still reasonable.
The value recorded by the pyranometer at 11:34 a.m. is slightly higher (549 W/m
2) than that recorded in the morning. In June, during the noon, the sun altitude is high, so the solar incidence angle is lower for facades than for rooftops, leading to lower solar irradiance values (
Figure 6). Both the v.sun and r.sun models also show maximal values, albeit the v.sun estimate is very close to the measured value (514 W/m
2). At 3:59 p.m., the value recorded by the pyranometer (188 W/m
2) was significantly lower than that recorded in the morning, and a similar value was predicted by the v.sun model (164 W/m
2). The r.sun prediction is almost four times higher than the actual value (709 W/m
2).
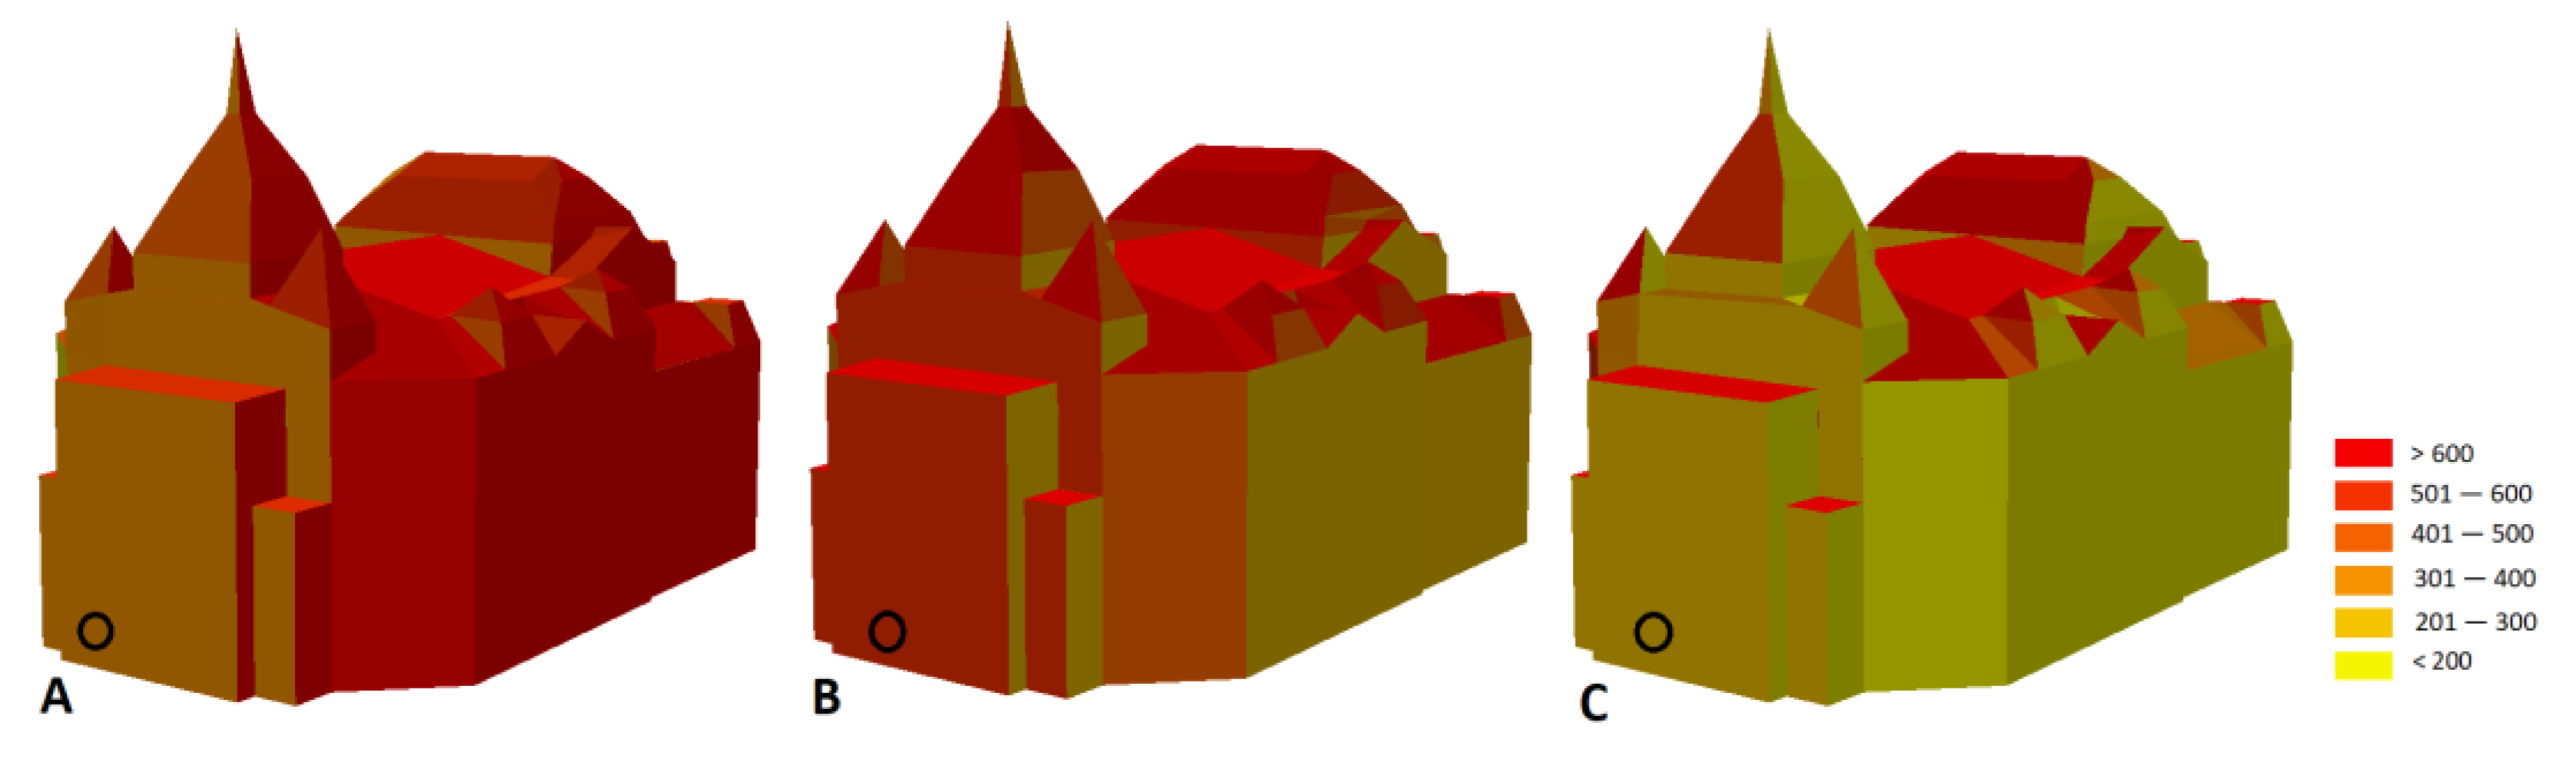
3.3. State Theatre
The third location in our study is the State Theatre right in the center of the city of Košice on Hlavná Street. It is a building constructed in the Neo-Baroque style, which corresponds to its rather structured and complicated architecture (
Figure 7). The value measured by the pyranometer at 8:57 a.m. was 413 W/m
2, which is almost 260 W/m
2 less compared to the first location facing to the east (apartment building), but similar to the residential house. The recorded value was quite accurately modeled by both models: v.sun (317 W/m
2) and r.sun (456 W/m
2) (
Table 3).
The value recorded by the pyranometer at 11:50 a.m. is 505 W/m2. This can also be attributed to the architecture of the building mentioned above, but also to the position of the Sun in the sky at that moment in time. The v.sun model showed almost an identical value. From this point of view, we can conclude that the comparison of the results is very accurate at this point in time at this location.
The measurement at 3:31 p.m. recorded a value of 87 W/m2. The v.sun model calculated a significantly higher value (293 W/m2) as did the r.sun model (287 W/m2). This can be explained by the fact that, during the measurement at the given place at 3:31 p.m., the sun was slightly shaded by a cloud.
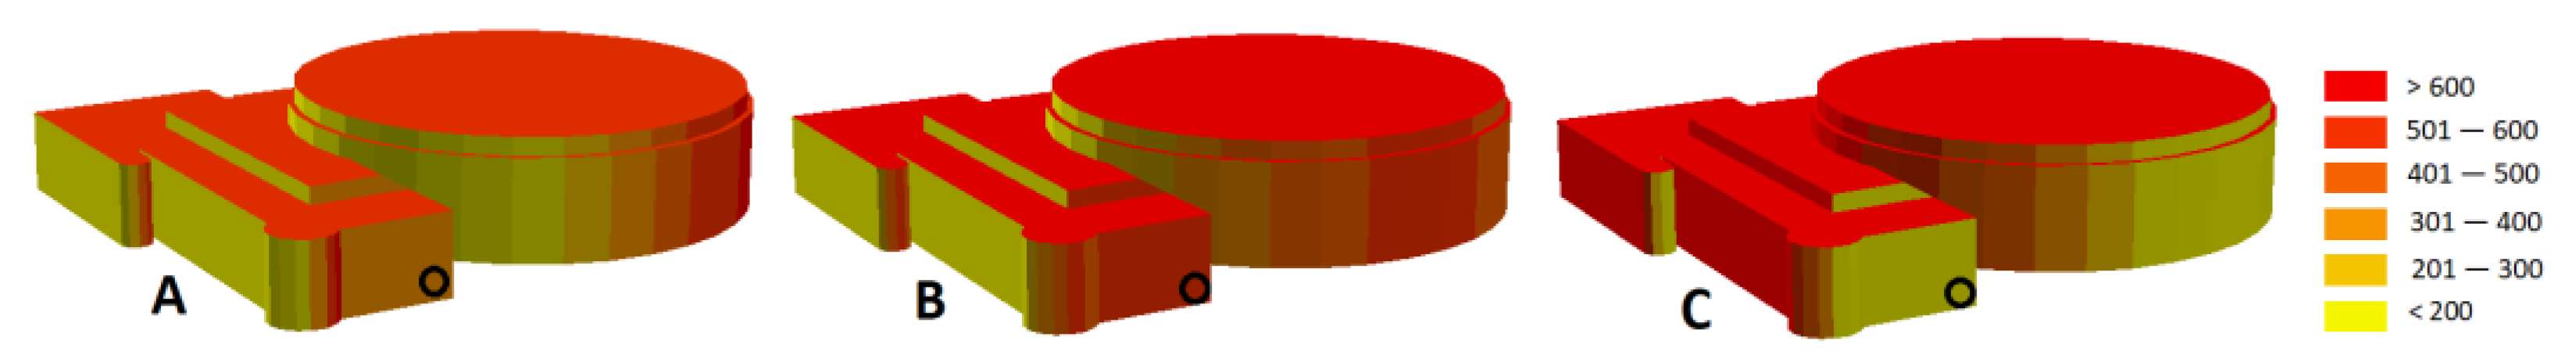
3.4. Municipal Swimming Pool
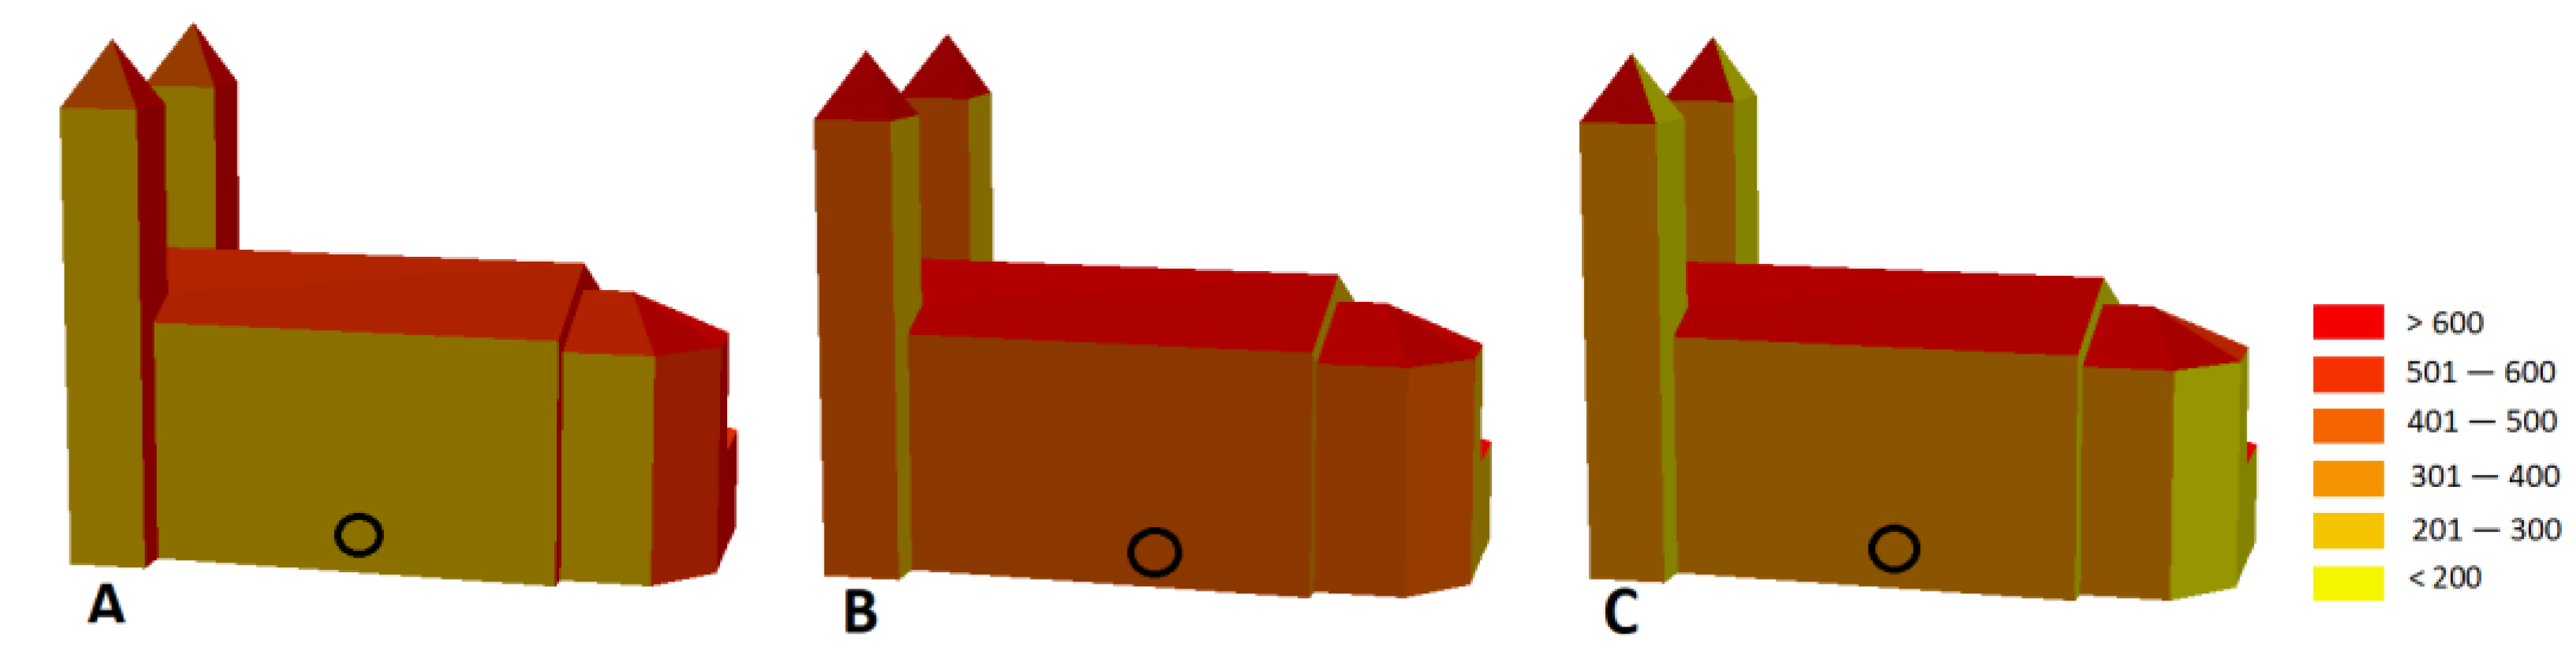
The fourth location that we will compare is the Municipal Swimming Pool in the Protifašistických bojovníkov Street. The building itself is a morphologically complex structure made up of the swimming pool itself, but also other institutions that are housed there. The measurement at 9:19 a.m. showed a value of 502 W/m
2; the r.sun and v.sun models showed slightly different values (579 W/m
2 and 386 W/m
2, respectively), which can be considered acceptable (
Figure 8) (
Table 4).
The measurement recorded at 12:09 p.m. is much lower (155 W/m
2) and in comparison to predicted values by the v.sun and r.sun models (513 W/m
2 and 819 W/m
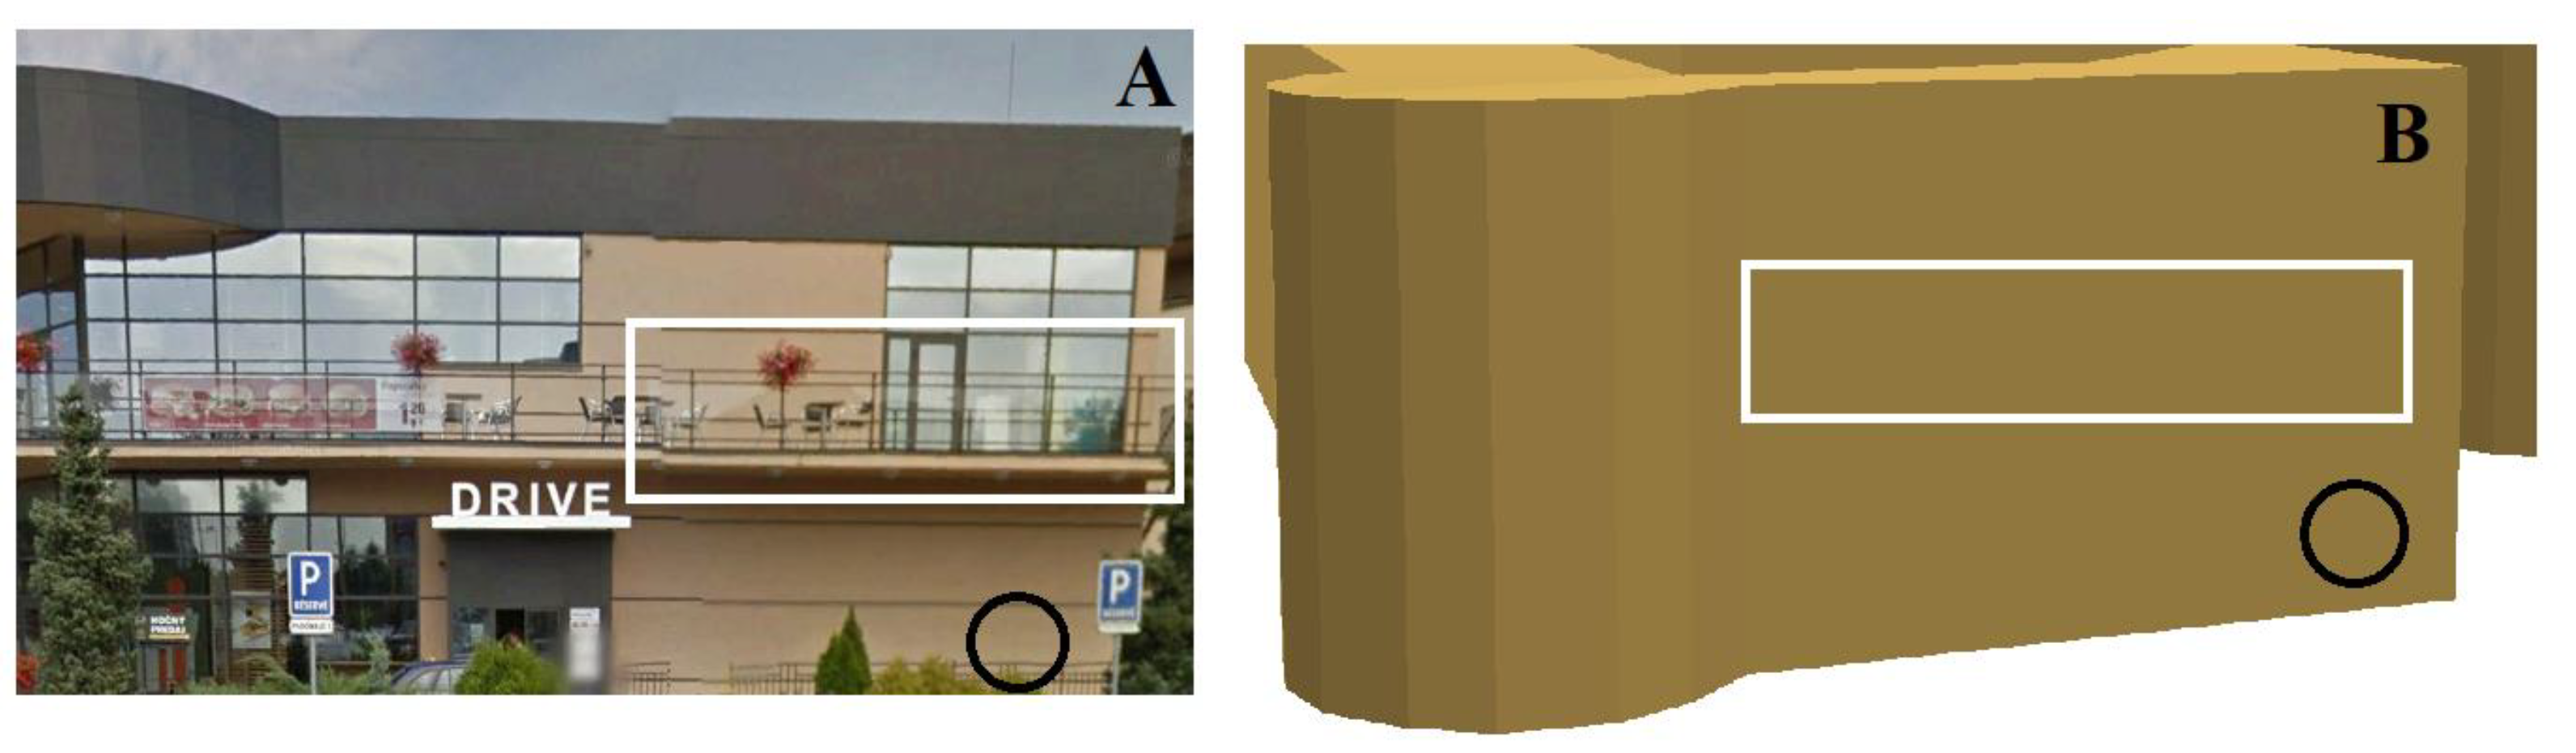
2, respectively). However, this fact has a logical explanation. During the actual measurement at that time, we noticed that there was a terrace above the measured facade (
Figure 9), which caused a shadow at the time of the measurement since the solar altitude was very high. However, the terrace is not present in our 3D city model and DSM, so the solar radiation models do not reflect this fact in the results. At 3:47 p.m., we have already measured a slightly lower value at this location than at noon (97 W/m
2); a similar value was calculated by the v.sun (170 W/m
2). The r.sun model again predicted a very high value (760 W/m
2), probably due to a DSM distortion at this site.
3.5. Greek-Catholic Church
The last location we have consiidered in this article is the Greek-Catholic Church of the Nativity of the Virgin Mary in Moyzesova Street. We also focused on the south-facing facade of the building. At 8:50 a.m., we measured 348 W/m
2; v.sun (
Figure 10) calculated a value slightly lower (237 W/m
2) (
Table 5). With the r.sun model, we again recorded a significantly higher value, due to the aforementioned facade representation issues.
At 11:44 a.m., the pyranometer recorded value of 534 W/m2. The r.sun and v.sun models also recorded similar values, which were increased compared to the morning measurement. The value recorded at 3:25 p.m. by the pyranometer (313 W/m2) is approximated by the v.sun model with a value of 357 W/m2 and 202 W/m2 by the r.sun model. This lower value by r.sun is clearly also affected by a geometric distortion of the DSM.
4. Discussion
The modeling and use of solar radiation in urban environments are an important area of study in various scientific fields and disciplines, especially for solar resource assessments, such as photovoltaic and thermal applications, as well as urban heat island effects. Over the last decade, several studies have focused on this matter [
34,
35,
36]. In this study, we focused on the accuracy of 2D (r.sun) and 3D (v.sun) solar radiation models for facades in built-up areas in comparison with field measurements using a pyranometer.
We selected five different buildings in locations in the wider center of Košice, which are shown in
Figure 1 and
Figure 2. The measurements were carried out during a typical summer day (23 June 2021) for morning, noon, and afternoon time horizons, using the EKO-INSTRUMENTS MS-60 pyranometer during 2 min measurements in 5 s interval. The averaged value for each location was used in a comparison with the predicted values by the r.sun and v.sun models.
The results showed relatively large differences in the measured and predicted values of solar irradiance. The mean error and mean absolute error of all predictions are −22 W/m2 and 103 W/m2 for v.sun, respectively, and −219 W/m2 and 345 W/m2 for r.sun, respectively. Evidently, the 3D v.sun solar radiation model predicted solar irradiances on vertical surfaces with much better accuracy. The 2D r.sun solar radiation model failed to accurately predict solar irradiances in most cases, mostly due to an improper geometric representation of facades by a DSM. High sensitivity of the solar radiation model to input parameters, such as slope steepness or aspect, explains poor results of the model. Nevertheless, the model can provide acceptable results for rooftops and areas between the buildings. However, our results clearly show that a DSM does not provide a sufficiently accurate approximation of vertical surfaces in urban areas to estimate their solar resource potential with an acceptable accuracy.
This study also showed that the morphological complexity of buildings can affect the solar assessments, even in a 3D approach, because currently many 3D city models are available in a LoD2 accuracy with missing morphological structures, such as terraces, casting shadows, especially when solar elevation is high (
Figure 9).
It should be noted that this analysis was carried out for selected buildings only and we did not include a complex analysis of shadows cast by neighboring buildings nor trees. This could affect some of the predicted values, especially in the morning and afternoon that have lower solar elevations.
In the manner of every other model, the r.sun/v.sun models have their advantages and disadvantages. The v.sun module can compute a 3D solar radiation for buildings represented by a 3D city model, but the disadvantage is its complicated preparation in terms of structure and topology. Another disadvantage is that it cannot account for vegetation, and this is an area for future improvements. The advantage of the r.sun model is a very simple preparation of input data for raster map calculations, which is easier and faster than for the v.sun model. To conclude, the r.sun solar radiation model should be only used for 2D surfaces, such as roofs and areas between buildings, while the v.sun solar radiation model is more appropriate for buildings, including facades, or other vertical surfaces represented by 3D polygons.
5. Conclusions
Solar energy is one of the most important renewable sources of energy. Therefore, it is desirable to model solar radiation in detail, especially in urban areas. There are currently several models that seek to model more accurately the distribution of solar radiation. Such models include r.sun and v.sun, which we analyzed in our study. They have the advantage of choosing parameters for spatial modeling, while working with spatially differentiated input and output data in raster/vector format. Both models use the same solar radiation component; however, they treat the geometry of input data differently. The results of both models were validated by in situ pyranometer measurements. The comparison of the results of individual models and measurements took place in locations that represent a typical urban environment in the study area. In addition to apartment buildings, with a relatively simple surface geometry, there are often historic buildings in the center with a more complex morphology of facades. By selecting different types of structures, we identified the shortcomings of individual models as well as input data.
The comparison of models and in situ measurements showed relatively good estimates by the 3D v.sun model and poor estimates by the 2D r.sun model. This can be attributed to an improper geometric representation of vertical surfaces by a DSM, which has a strong impact on solar resource assessments of the model. We also found that the LoD2 3D city models can be problematic in case of complex buildings with morphological structures, such as terraces. These cast shadows on facades especially when solar altitude is high and thus assessments even by the 3D model are inaccurate.
Nevertheless, both solar radiation models can be used effectively for solar resource assessments when used properly. The drawback of the v.sun model is that it does not provide estimates of solar radiation for urban greenery, which is often important part of urban areas. Our results also showed that the r.sun model is not able to accurately represent the spatial distribution of solar radiation on vertical surfaces, but its simplicity and speed provide a major advantage in modeling horizontal surfaces, such as roofs of buildings. The vector solar model v.sun proved to be a more suitable alternative for use in a 3D environment, based on its vector-voxel approach and its ability to model even vertical surfaces.
Our analysis can be helpful for solar resource assessments in urban areas using these solar radiation models or other solar radiation models with implemented similar methodology based on DSM and 3D city models. We see a great potential in integration with other areas of research and industry, for example for thermal and photovoltaic applications. We also envisage the use of these models in urban planning, and also in addressing the issue of urban heat islands.
Author Contributions
Conceptualization, Š.K. and J.H.; methodology, Š.K. and J.H.; software, Š.K., J.H., J.B. and J.Š.; validation, Š.K., J.H. and J.Š.; formal analysis, Š.K., J.H., J.B. and J.Š.; investigation, Š.K., J.H., J.B. and J.Š.; writing—original draft preparation, Š.K. and J.H.; visualization, Š.K.; supervision, J.H.; project administration, J.H.; funding acquisition, J.H. All authors have read and agreed to the published version of the manuscript.
Funding
The research was funded by the Slovak Research and Development Agency (APVV) under the contract No. APVV-18-0044 and by the Scientific Grant Agency of the Ministry of Education, Science, Research, and Sport of the Slovak Republic and the Slovak Academy of Sciences (VEGA), under the contract No. 1/0300/19.
Institutional Review Board Statement
Not applicable.
Informed Consent Statement
Not applicable.
Data Availability Statement
The data presented in this study are available on request from the corresponding author. The data are not publicly available due to privacy reasons.
Conflicts of Interest
The authors declare no conflict of interest. The funders had no role in the design of the study; in the collection, analyses, or interpretation of data; in the writing of the manuscript; or in the decision to publish the results.
References
- Chen, M.; Zhang, H.; Liu, W.; Zhang, W. The global pattern of urbanization and economic growth: Evidence from the last three decades. PLoS ONE 2014, 9, e103799. [Google Scholar] [CrossRef] [PubMed] [Green Version]
- Hofierka, J.; Kaňuk, J. Assessment of photovoltaic potential in urban areas using open-source solar radiation tools. Renew. Energy 2009, 34, 2206–2214. [Google Scholar] [CrossRef]
- Ratti, C.; Baker, N. Energy consumption and urban texture. Energy Build. 2005, 37, 762–776. [Google Scholar] [CrossRef]
- Lindberg, F.; Grimmond, C. The influence of vegetation and buildings morphology on shadow patterns and mean radiant temperatures in urban areas: Model development and evaluation. Theor. Appl. Climatol. 2011, 105, 1–13. [Google Scholar] [CrossRef]
- Hofierka, J.; Zlocha, M. A new 3D Solar Radiation Model for 3D City Models. Trans. GIS 2012, 16, 681–690. [Google Scholar] [CrossRef]
- Freitas, S.; Catita, C.; Redweik, P.; Brito, M.C. Modelling solar potential in the urban environment: State-of-the-art review. Renew. Sustain. Energy Rev. 2015, 41, 915–931. [Google Scholar] [CrossRef]
- Biljecki, F.; Stoter, J.; LeDoux, H.; Zlatanova, S.; Çöltekin, A. Applications of 3D City Models: State of the Art Review. ISPRS Int. J. Geo Inf. 2015, 4, 2842. [Google Scholar] [CrossRef] [Green Version]
- Hofierka, J.; Šúri, M. A new GIS—Based solar radiation model and its application to photovoltaic assessments. Trans. GIS 2004, 8, 175–190. [Google Scholar]
- Chow, A.; Fung, A.S.; Li, S. GIS modeling of solar neighborhood potential at a fine spatiotemporal resolution. Buildings 2014, 4, 195. [Google Scholar] [CrossRef]
- Cheng, L.; Zhang, F.; Li, S.; Mao, J.; Xu, M.; Ju, W.; Liu, X.; Wu, J.; Min, K.; Zhang, X.; et al. Solar energy potential of urban buildings in 10 cities of China. Energy 2020, 196, 117038. [Google Scholar] [CrossRef]
- Erdély, R.; Wang, Y.; Guo, W.; Hanna, E.; Colantuono, G. Three-Dimensional Solar Radiation Model (SORAM) and its application to 3-D urban planning. Sol. Energy 2014, 101, 63–73. [Google Scholar] [CrossRef]
- Liang, J.; Gong, J.; Zhou, J.; Ibrahim, A.N.; Li, M. An open-source 3D solar radiation model integrated with a 3D Geographic Information System. Environ. Model. Softw. 2014, 64, 94–101. [Google Scholar] [CrossRef]
- Redweik, P.; Catita, C.; Brito, M.C. Solar energy potential on roofs and facades in an urban landscape. Sol. Energy 2013, 97, 332–341. [Google Scholar] [CrossRef]
- Ranalli, J.; Calvert, K.; Boz, M.B.; Brownson, J.R.S. Toward comprehensive solar energy mapping systems for urban electricity system planning and development. Electr. J. 2018, 31, 8–15. [Google Scholar] [CrossRef]
- Huld, T. PVMAPS: Software tools and data for the estimation of solar radiation and photovoltaic module performance over large geographical areas. Sol. Energy 2017, 142, 171–181. [Google Scholar] [CrossRef]
- Hofierka, J.; Kaňuk, J. Aplikácie 3D modelov miest v geografickom výskume. Geogr. Cassoviensis 2010, 4, 69–72. [Google Scholar]
- Carneiro, C.; Morello, E.; Ratti, C.; Golay, F. Solar radiation over the urban texture: LIDAR data and image processing techniques for environmental analysis at city scale. In 3D Geo-Information Sciences; Springer: Berlin/Heidelberg, Germany, 2009; pp. 319–340. [Google Scholar]
- Neteler, M.; Mitasova, H. Open Source GIS: A GRASS GIS Approach, 3rd ed.; Springer: Boston, MA, USA, 2008; p. 406. [Google Scholar]
- Hetrick, W.; Rich, P.M.; Barnes, F.J.; Weiss, S.B. GIS-based solar radiation flux models. Am. Soc. Photogramm. Remote. Sens. Tech. Pap. 1993, 3, 132–143. [Google Scholar]
- Dubayah, R.; Rich, P. Topographic solar radiation models for GIS. Int. J. Geogr. Inf. Syst. 1995, 9, 405–413. [Google Scholar] [CrossRef]
- Kumar, L.; Skidmore, A.K.; Knowles, E. Modeling topographic variation in solar radiation in a GIS environment. Int. J. Geogr. Inf. Sci. 1997, 11, 475–497. [Google Scholar] [CrossRef]
- Wilson, P.; Gallant, J. Secondary topographic attributes. In Terrain Analysis. Principles and Application; Wiley: New York, NY, USA, 2000; pp. 87–132. [Google Scholar]
- Rigollier, C.; Bauer, O.; Wald, O. On the clear sky model of the ESRA—European Solar Radiation Atlas—With respect to the Heliostat method. Sol. Energy 2000, 68, 33–48. [Google Scholar] [CrossRef] [Green Version]
- Scharmer, K.; Greif, J. The European Solar Radiation Atlas. Vol. 2: Database and Exploitation Software; Presses de l´Ecole des Miner: Paris, France, 2000. [Google Scholar]
- Muneer, T. Solar radiation model for Europe. Build. Serv. Eng. Res. Technol. 1990, 11, 153–163. [Google Scholar] [CrossRef]
- Muneer, T. Solar Radiation and Daylight Models for Energy Efficient Design of Buildings; Architectural Press: Oxford, UK, 1997. [Google Scholar]
- Šúri, M.; Huld, T.; Hofierka, J. Digital terrain modeling: Development and application in a policy support environment. In Lecture Notes in Geoinformation and Cartography, 1st ed.; Peckham, R.J., Jordan, G., Eds.; Springer: Berlin/Heidelberg, Germany, 2007; pp. 259–273. [Google Scholar]
- Huld, T.; Műller, R.; Gambardella, A. A new solar radiation database for estimating PV performance in Europe and Africa. Sol. Energy 2012, 86, 1803–1815. [Google Scholar] [CrossRef]
- Bochníček, O.; Hrušková, K. Klimatický Atlas Slovenska; Slovenský Hydrometeorologický Ústav: Bratislava, Slovakia, 2015; p. 132. [Google Scholar]
- Biljecki, F.; Ledoux, H.; Stoter, J. An improved LOD specification for 3D building models. Comput. Environ. Urban Syst. 2016, 59, 25–37. [Google Scholar] [CrossRef] [Green Version]
- Guo, W.; Cheng, B.; Wang, C.; Tang, X. Tree planting indices and their effect on summer park thermal environment: A case study of a subtropical satellite city, China. Indoor Built Environ. 2020. [Google Scholar] [CrossRef]
- Lee, D.S.; Jo, J.H. Application of simple sky and building models for the evaluation of solar irradiance distribution at indoor locations in buildings. Build. Environ. 2021, 197, 107840. [Google Scholar] [CrossRef]
- Matlovič, R. Geografia Priestorovej Štruktúry Mesta; University of Prešov: Prešov, Slovakia, 1998. [Google Scholar]
- Okumus, D.E.; Terzi, F. Evaluating the role of urban fabric on surface urban heat island: The case of Istanbul. Sustain. Cities Soc. 2021, 73, 103128. [Google Scholar] [CrossRef]
- Halder, B.; Bandyopadhyay, J.; Banik, P. Monitoring the effect of urban development on urban heat island basedon remote sensing and geospatial approach in Kolkata and adjacent areas, India. Sustain. Cities Soc. 2021, 74, 103186. [Google Scholar] [CrossRef]
- Huang, X.; Song, J.; Wang, C.; Chui, T.F.M.; Chan, P.W. The synergistic effect of urban heat and moisture islands in a compact high-rise city. Build. Environ. 2021, 205, 108274. [Google Scholar] [CrossRef]
Figure 1.
Location of the study area in the city of Košice, Slovakia.
Figure 1.
Location of the study area in the city of Košice, Slovakia.
Figure 2.
Positions of the selected locations in the city of Košice: Apartment house, Československá Street (1); Residential house, Muránska Street (2); State Theatre, Hlavná Street (3); Municipal swimming pool, Protifašistických bojovníkov Street (4); and Greek-Catholic Church of the Nativity of the Virgin Mary, Moyzesova Street (5).
Figure 3.
Solar irradiance from the r.sun model in the city center of Košice on 23 June 2021 (W/m2).
Figure 3.
Solar irradiance from the r.sun model in the city center of Košice on 23 June 2021 (W/m2).
Figure 4.
Solar irradiance from the v.sun model in the city center of Košice on 23 June 2021 (W/m2).
Figure 4.
Solar irradiance from the v.sun model in the city center of Košice on 23 June 2021 (W/m2).
Figure 5.
Solar irradiance at the apartment house from the v.sun model on 23 June 2021 (W/m2) at (A) 8:26 a.m., (B) 11:25 a.m., and (C) 3:13 p.m. The black circle represents the measurement location.
Figure 5.
Solar irradiance at the apartment house from the v.sun model on 23 June 2021 (W/m2) at (A) 8:26 a.m., (B) 11:25 a.m., and (C) 3:13 p.m. The black circle represents the measurement location.
Figure 6.
Solar irradiance at the residential house from the v.sun model on 23 June 2021 (W/m2) at (A) 8:39 a.m., (B) 11:34 a.m., and (C) 3:59 p.m. The black circle represents the measurement location.
Figure 6.
Solar irradiance at the residential house from the v.sun model on 23 June 2021 (W/m2) at (A) 8:39 a.m., (B) 11:34 a.m., and (C) 3:59 p.m. The black circle represents the measurement location.
Figure 7.
Solar irradiance at the State Theatre on 23 June 2021 (W/m2) at (A) 8:57 a.m., (B) 11:50 a.m., and (C) 3:31 p.m. The black circle represents the measurement location.
Figure 7.
Solar irradiance at the State Theatre on 23 June 2021 (W/m2) at (A) 8:57 a.m., (B) 11:50 a.m., and (C) 3:31 p.m. The black circle represents the measurement location.
Figure 8.
Solar irradiance at the Municipal Swimming Pool on 23 June 2021 (W/m2) at (A) 9:19 a.m., (B) 12:09 p.m., and (C) 3:47 p.m. The black circle represents the measurement location.
Figure 8.
Solar irradiance at the Municipal Swimming Pool on 23 June 2021 (W/m2) at (A) 9:19 a.m., (B) 12:09 p.m., and (C) 3:47 p.m. The black circle represents the measurement location.
Figure 9.
Location of the terrace on the Municipal Swimming Pool building: (A) real state of the building with terrace (white rectangle); (B) geometric 3D model, missing the terrace (white rectangle). The black circle represents themeasurement location.
Figure 9.
Location of the terrace on the Municipal Swimming Pool building: (A) real state of the building with terrace (white rectangle); (B) geometric 3D model, missing the terrace (white rectangle). The black circle represents themeasurement location.
Figure 10.
Solar irradiance at Greek Church on 23 June 2021 (W/m2) at (A) 8:50 a.m., (B) 11:44 a.m., and (C) 3:25 p.m. The black circle represents the measurement location.
Figure 10.
Solar irradiance at Greek Church on 23 June 2021 (W/m2) at (A) 8:50 a.m., (B) 11:44 a.m., and (C) 3:25 p.m. The black circle represents the measurement location.
Table 1.
Solar irradiance at the apartment house in Československá street in W/m2 on 23 June 2021.
Table 1.
Solar irradiance at the apartment house in Československá street in W/m2 on 23 June 2021.
| Time | Pyranometer | v.sun | r.sun | Position |
|---|
| 8:26 a.m. | 673 | 581 | 40 | east |
| 11:25 a.m. | 249 | 396 | 46 | east |
| 3:13 p.m. | 72 | 180 | 952 | east |
Table 2.
Solar irradiance at the residential house in Muránska street in W/m2 on 23 June 2021.
Table 2.
Solar irradiance at the residential house in Muránska street in W/m2 on 23 June 2021.
| Time | Pyranometer | v.sun | r.sun | Position |
|---|
| 8:39 a.m. | 458 | 372 | 574 | south |
| 11:34 a.m. | 549 | 514 | 903 | south |
| 3:59 p.m. | 188 | 164 | 709 | south |
Table 3.
Solar irradiance at the State Theatre in W/m2 on 23 June 2021.
Table 3.
Solar irradiance at the State Theatre in W/m2 on 23 June 2021.
| Time | Pyranometer | v.sun | r.sun | Position |
|---|
| 8:57 a.m. | 413 | 317 | 456 | south |
| 11:50 a.m. | 505 | 503 | 688 | south |
| 3:31 p.m. | 87 | 293 | 287 | south |
Table 4.
Solar irradiance at the Municipal Swimming Pool in W/m2 on 23 June 2021.
Table 4.
Solar irradiance at the Municipal Swimming Pool in W/m2 on 23 June 2021.
| Time | Pyranometer | v.sun | r.sun | Position |
|---|
| 9:19 a.m. | 502 | 386 | 579 | south |
| 12:09 p.m. | 155 | 513 | 819 | south |
| 3:47 p.m. | 97 | 170 | 760 | south |
Table 5.
Solar irradiance at Greek-Catholic Church in W/m2 on 23 June 2021.
Table 5.
Solar irradiance at Greek-Catholic Church in W/m2 on 23 June 2021.
| Time | Pyranometer | v.sun | r.sun | Position |
|---|
| 8:50 a.m. | 348 | 237 | 645 | south |
| 11:44 a.m. | 534 | 483 | 771 | south |
| 3:25 p.m. | 313 | 357 | 202 | south |
| Publisher’s Note: MDPI stays neutral with regard to jurisdictional claims in published maps and institutional affiliations. |
© 2021 by the authors. Licensee MDPI, Basel, Switzerland. This article is an open access article distributed under the terms and conditions of the Creative Commons Attribution (CC BY) license (https://creativecommons.org/licenses/by/4.0/).


