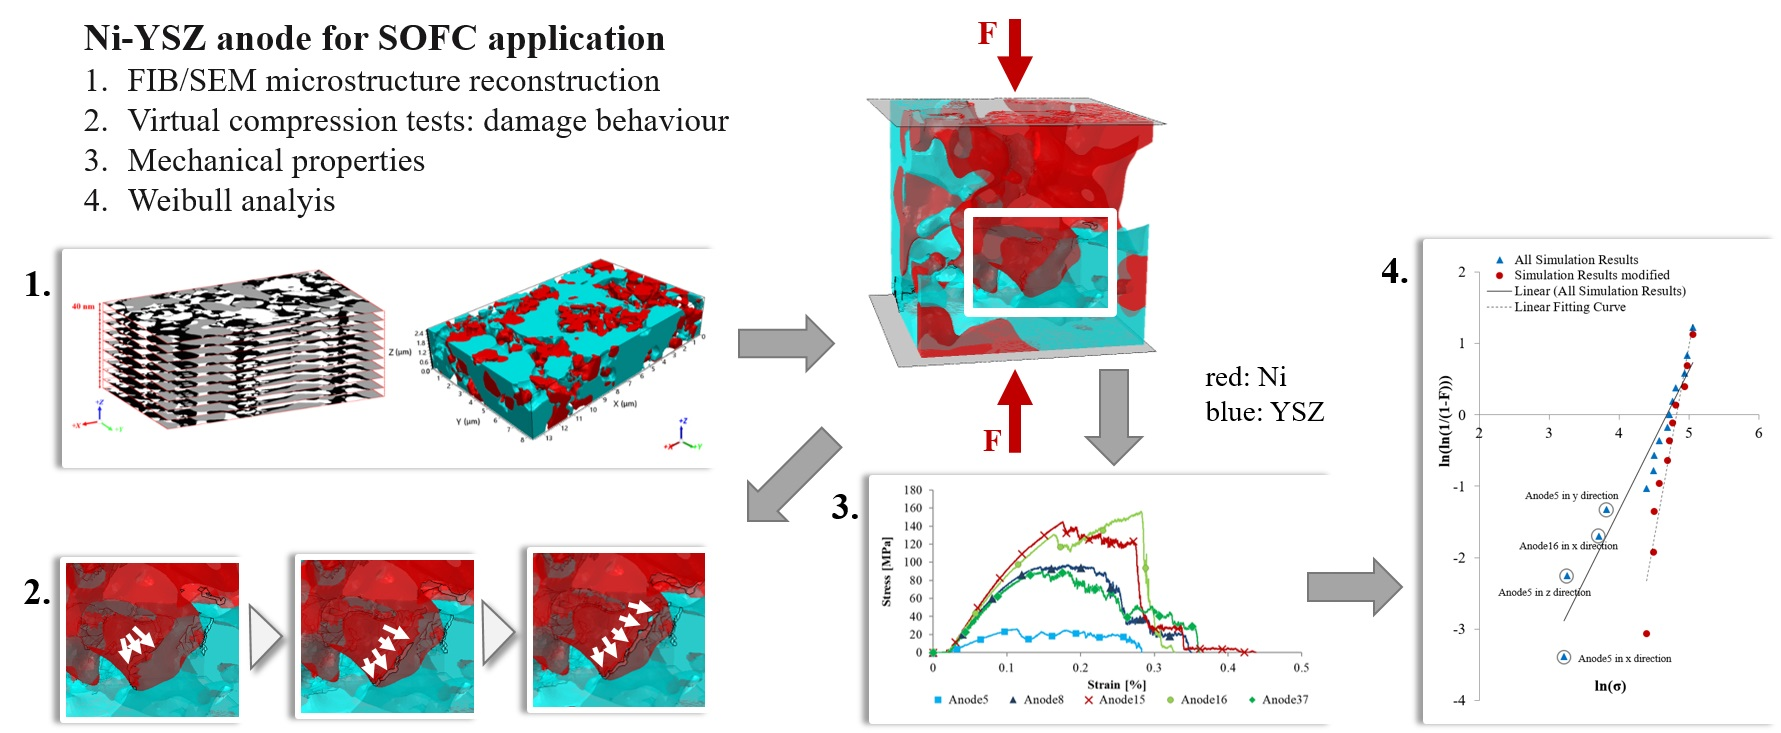
1. Introduction
Solid Oxide Fuel Cells (SOFCs) directly convert the chemical energy stored in fuels, such as hydrogen or gaseous hydrocarbons, into electrical power and thermal energy through electrochemical reactions. High efficiencies, in terms of energy conversion, fuel flexibility, and low CO
2 emissions, when running on hydrocarbons, represent key benefits of an SOFC for mobile or stationary applications. A planar SOFC consists of two porous ceramic electrodes providing a large inner surface with a huge amount of reactive sites for the fuel and the oxygen, separated by a gas-tight solid oxide electrolyte layer. The most widely used material for SOFC electrolytes is yttria-stabilised zirconia (YSZ) due to its high ionic conductivity. However, the different compositions and microstructures of the adjacent components lead to a difference in thermal expansion coefficient (TEC) in the individual layers. In particular, at the interface of the electrolyte and anode layer, the TEC difference results in residual stresses, which can lead to low reliability during cell operation and can cause cell failure [
1,
2].
According to Lee et al. three factors are required to achieve the best performance of a SOFC anode: the anode, which is typically a composite of ceramic and metal (cermet), has to provide (1) high electrical conductivity, (2) enough electrochemical activity (related to chemical reactions at anode), and (3) specific microstructural condition (related to diffusion of the reaction products) [
3]. For that reason, Ni/YSZ cermet anodes are preferred to single-phase anodes, such as pure nickel, as they more closely match the thermal expansion coefficient of the electrolyte and present enhanced electrochemical performance due to the combination of ionic conductivity, electronic conductivity, and electrocatalytic activity [
4]. The TEC of Ni/YSZ can be adjusted by different volume ratios of Ni and YSZ. A high Ni content represents a high electrical conductivity but causes instability of the microstructure because of Ni coarsening [
3]. On the other hand, a high YSZ ratio avoids significant changes in the bulk dimensions due to a closer TEC to that of the electrolyte. Since the composition, microstructure, and porosity of the cermet have a great impact on the electrical, electrochemical, and mechanical properties, an appropriate composition of Ni and YSZ must be chosen to represent the best possible compromise for the requirements [
5]. Lee et al. have identified a suitable Ni volume fraction of 40–50%, based on previous findings on the relation between Ni content and electrical conductivity of Ni/YSZ at operation temperature [
3,
6].
As shown in
Table 1, previous studies have chosen a Ni/YSZ ratio of 40:60 (Ni:YSZ). However, Iwai et al. have investigated Ni/YSZ ratios of 50:50 in their study [
7]. In SOFC, the most commonly used porosity of the cermet anode amount to approximately 40% [
3,
6,
8,
9].
As mentioned before, the thermal cycling during operation of the SOFCs induces thermal stresses in the microstructure and affects the mechanical behaviour of the Ni/YSZ cermet. Hence, a future goal in research is to understand the mechanical and damage behaviour. The majority of studies on the strength of the cells and the electrodes or electrolyte layers were carried out using experiments that were unsuitable for microscale observations. Microstructure-based simulations offer a promising alternative way to obtain further fundamental insights into the damage behaviour. However, micromechanical investigations require 3D image data of the microstructure in order to understand how the phases are aligned and connected. The literature provides a wealth of electrode modelling studies, exploring electrochemical operation and mechanical performance, based on the combination of Focused Ion Beam (FIB) tomography and Scanning Electron Microscopy (SEM) (referred to as FIB/SEM tomography) as well as finite element (FE) simulations [
11,
14,
15,
16]. Thus far, the published mechanical stress simulations evaluated the thermal stress at the operation temperature due to the CTE mismatch between Ni and YSZ. In addition, mechanical loads were applied on the established 3D microstructure models. As a result, the Ni/YSZ interface was identified as a critical region concerning the mechanical integrity of the structure, and the failure probability was calculated. However, the exact damage behaviour of the Ni/YSZ cermet of the anode has yet to be investigated [
17,
18,
19]. Research questions about contact definitions between Ni/YSZ interfaces and the cracking behaviour of the material phases remain unanswered.
The present work demonstrates the application of appropriate constitutive numerical models in mechanical tests under compressive loading conditions, while varying volume fractions of nickel and 8YSZ (8 mol% yttria-stabilised zirconia) to identify their specific material characteristics.
Section 2 describes the 3D reconstruction of an SOFC anode from 2D cross-sectional images after a FIB/SEM tomography. In addition, the subsequent generation of specimens with different phase compositions of the 3D model and their transformation into a FE analysis and the application of the material and failure models are presented.
Section 3 provides results of the simulations of compressive tests, where the effects of each solid phase and of high porosities on the mechanical behaviour of the anode layer were assessed and determined as well as the evaluation employing Weibull analysis. Then, the presented results are discussed (
Section 4) and the whole study is concluded (
Section 5).
2. Materials and Methods
2.1. Reconstruction of Anode Microstructure
2.1.1. Data Acquisition
The present study is based on a stack of microstructural image data of a Ni/YSZ anode from an anode-supported cell obtained by FIB/SEM tomography.
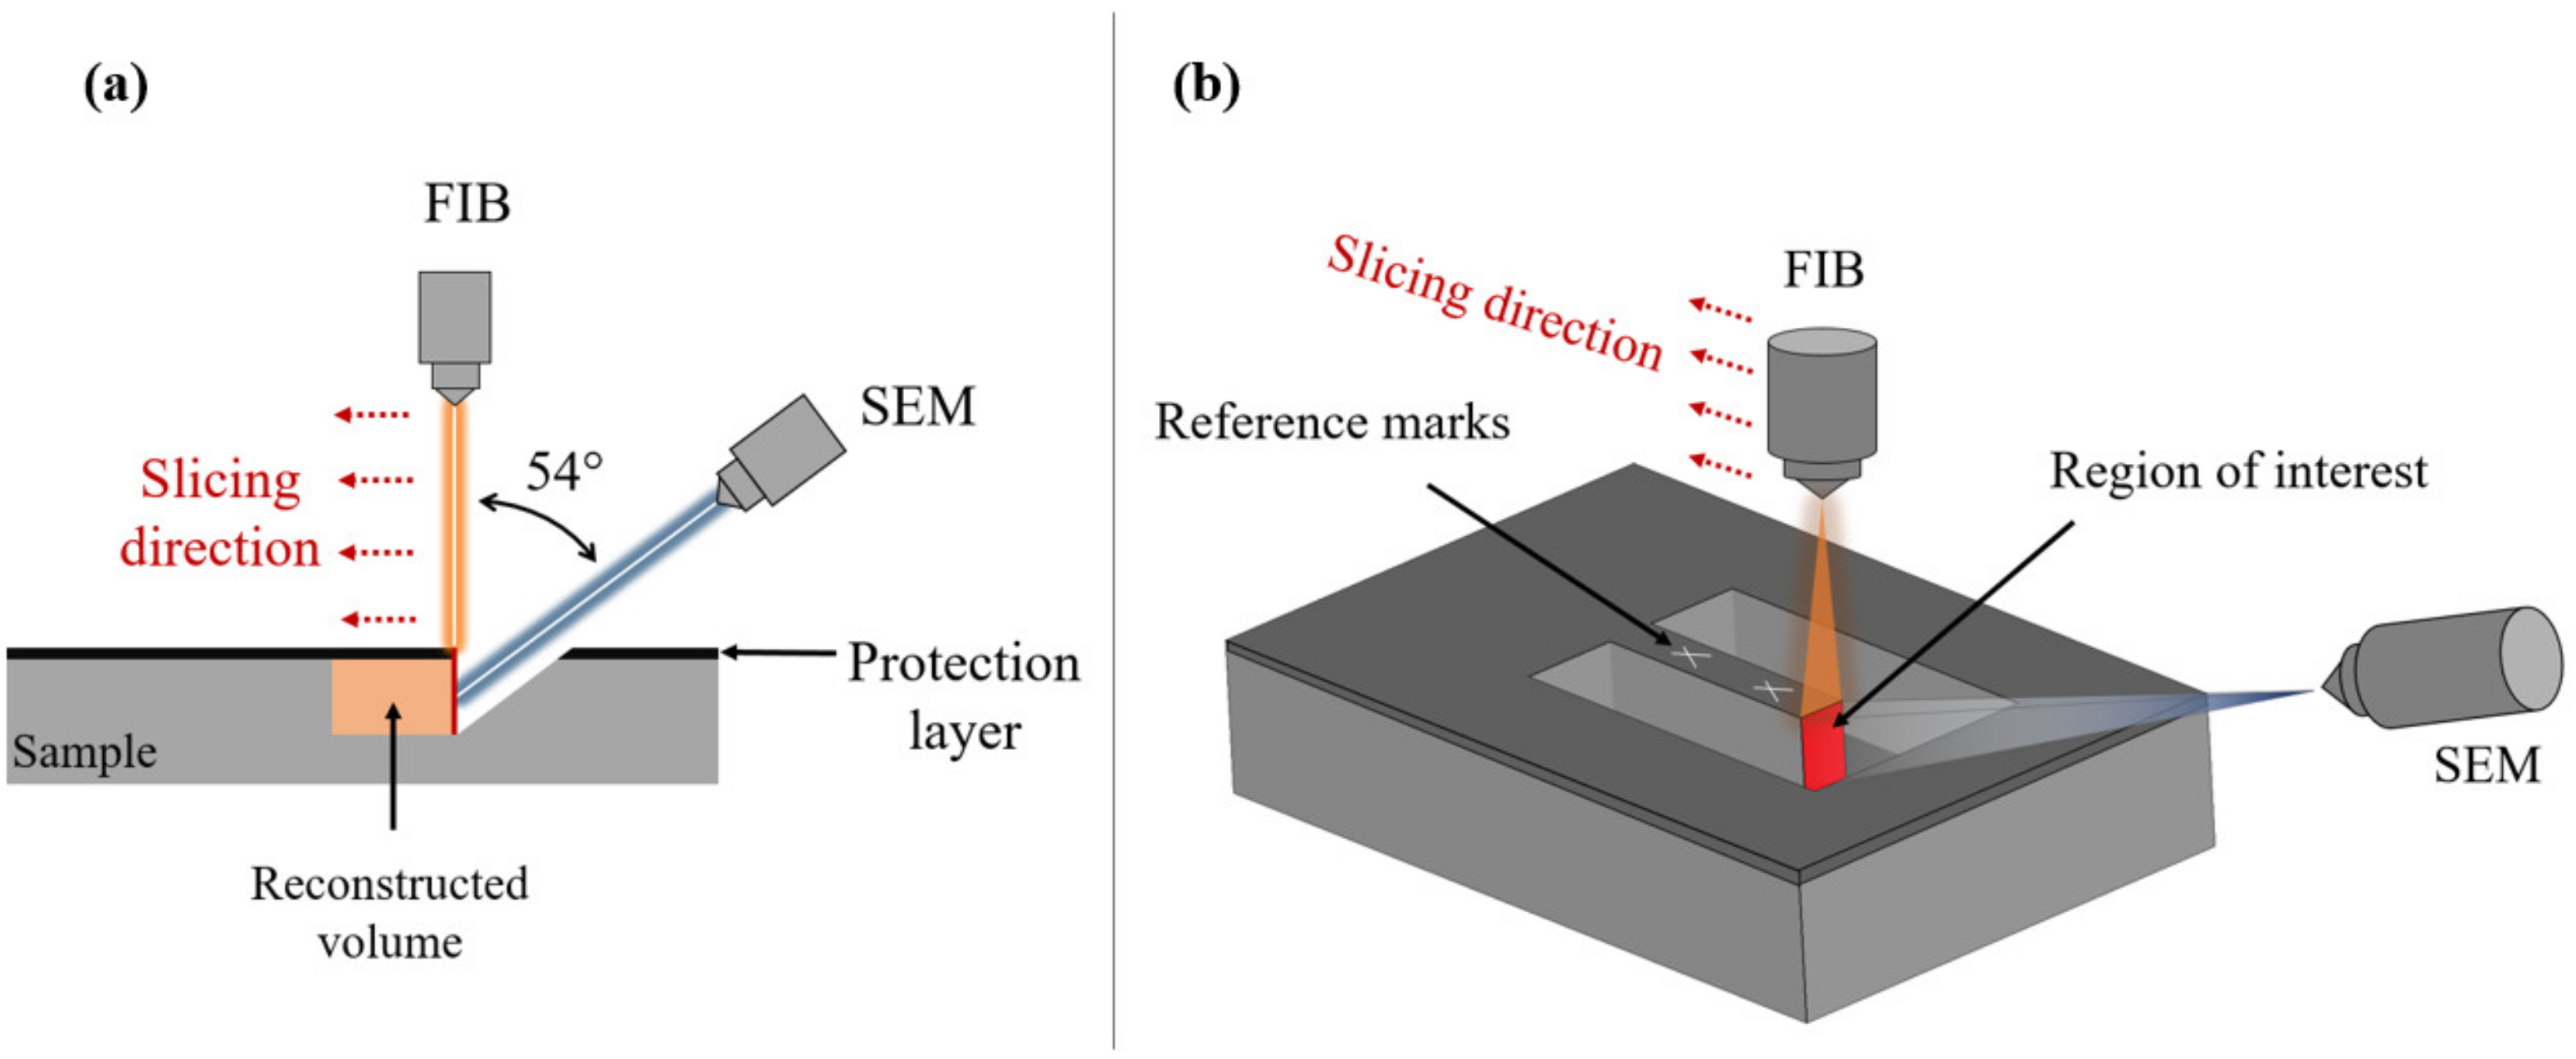
First, the anode sample was infiltrated with an epoxy resin under vacuum conditions to distinguish between the solid phase and the pores of the Ni/YSZ cermet during the SEM observation. Then, the sample was grinded and polished to obtain a plane surface. To avoid accidental ion milling or erosion during the FIB tomography, a protection layer (platinum) was deposited onto the sample surface (perpendicular to the ion beam) [
11]. The setting of the FIB/SEM is shown in
Figure 1a, where the beams of FIB and SEM form an angle of 54°. The sample surface was aligned perpendicularly to the FIB beam [
7,
17]. As presented in
Figure 1b, a “U-shaped trench” around the region of interest (ROI) was milled by using FIB to expose the ROI for computational reconstruction. At first, a reference cut in slicing direction was introduced in the sample surface by FIB. In the next step, the FIB sequentially cut slices of the microstructure. For each slice milling, an image of the ROI was captured by SEM [
20]. The stacking process of the cross-sectional images depends on the spacing between two SEM images, which is defined by the step size during the FIB slicing process [
21].
2.1.2. Image Processing
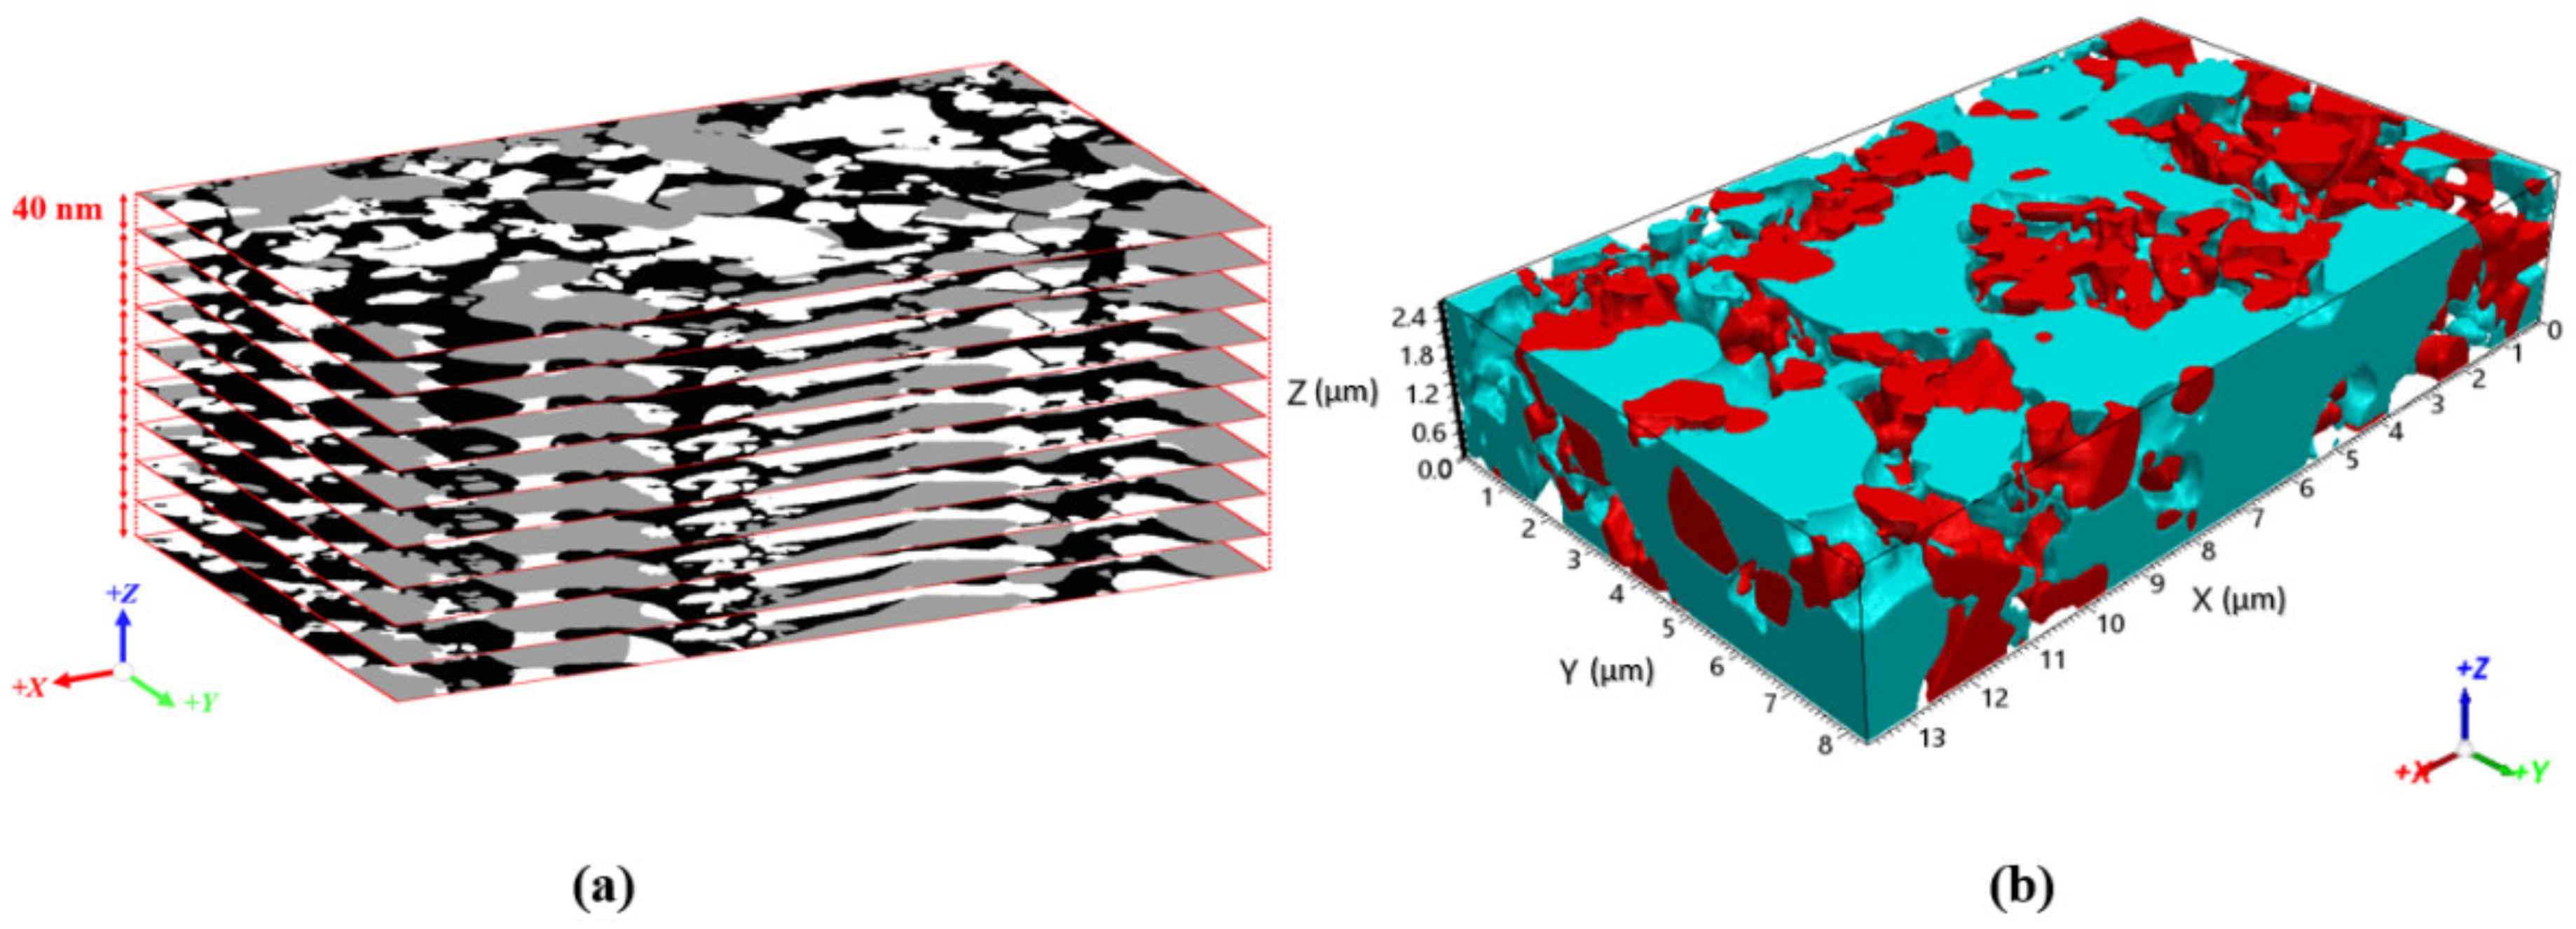
A set of 63 images was used in this work with a pixel resolution of 19.4 nm and a spacing of 40 nm in the z direction (two pixel sizes) between two slices, as illustrated in
Figure 2a. The alignment of the sliced SEM images and the assignment of the phases (Ni, 8YSZ and pores) was performed by using a MATLAB script. In a first step, all image slices were aligned to the reference cut in x and y directions to ensure that the regions of the single phases correspond to each other. During FIB tomography, images were taken by using an in-lens BSE (backscattered electrons) detector and an SE2 detector for segmentation of the three phases. The in-lens BSE images with typically stronger contrasts were used to separate the solid phase from pores. The pore phase was identified with a greyscale threshold value of 60. Regions below 60 were defined as pores (black) and regions above were defined as solids (grey, white). After that, the solids, Ni and 8YSZ phase, were separated by the SE2 images with a threshold value of 150. Then, the segmented in-lens BSE and SE2 images were overlaid to obtain the separation of the three phases in each single image. In addition to the segmentation by MATLAB, the SEM images were edited manually to remove artefacts and regions, which were not infiltrated completely with resin. As
Figure 2a depicts, the processed images consist of three clearly assigned phases with threshold values of 0 (black, pores), 255 (white, nickel), and 150 (grey, 8YSZ). The Ni phase is defined by the white colour due to its stronger reflection during the tomography. The 3D dimensions of the reconstructed ROI were 13.62 × 8.32 × 2.48 µm
3 (total volume 281 µm
3), as shown in
Figure 2b.
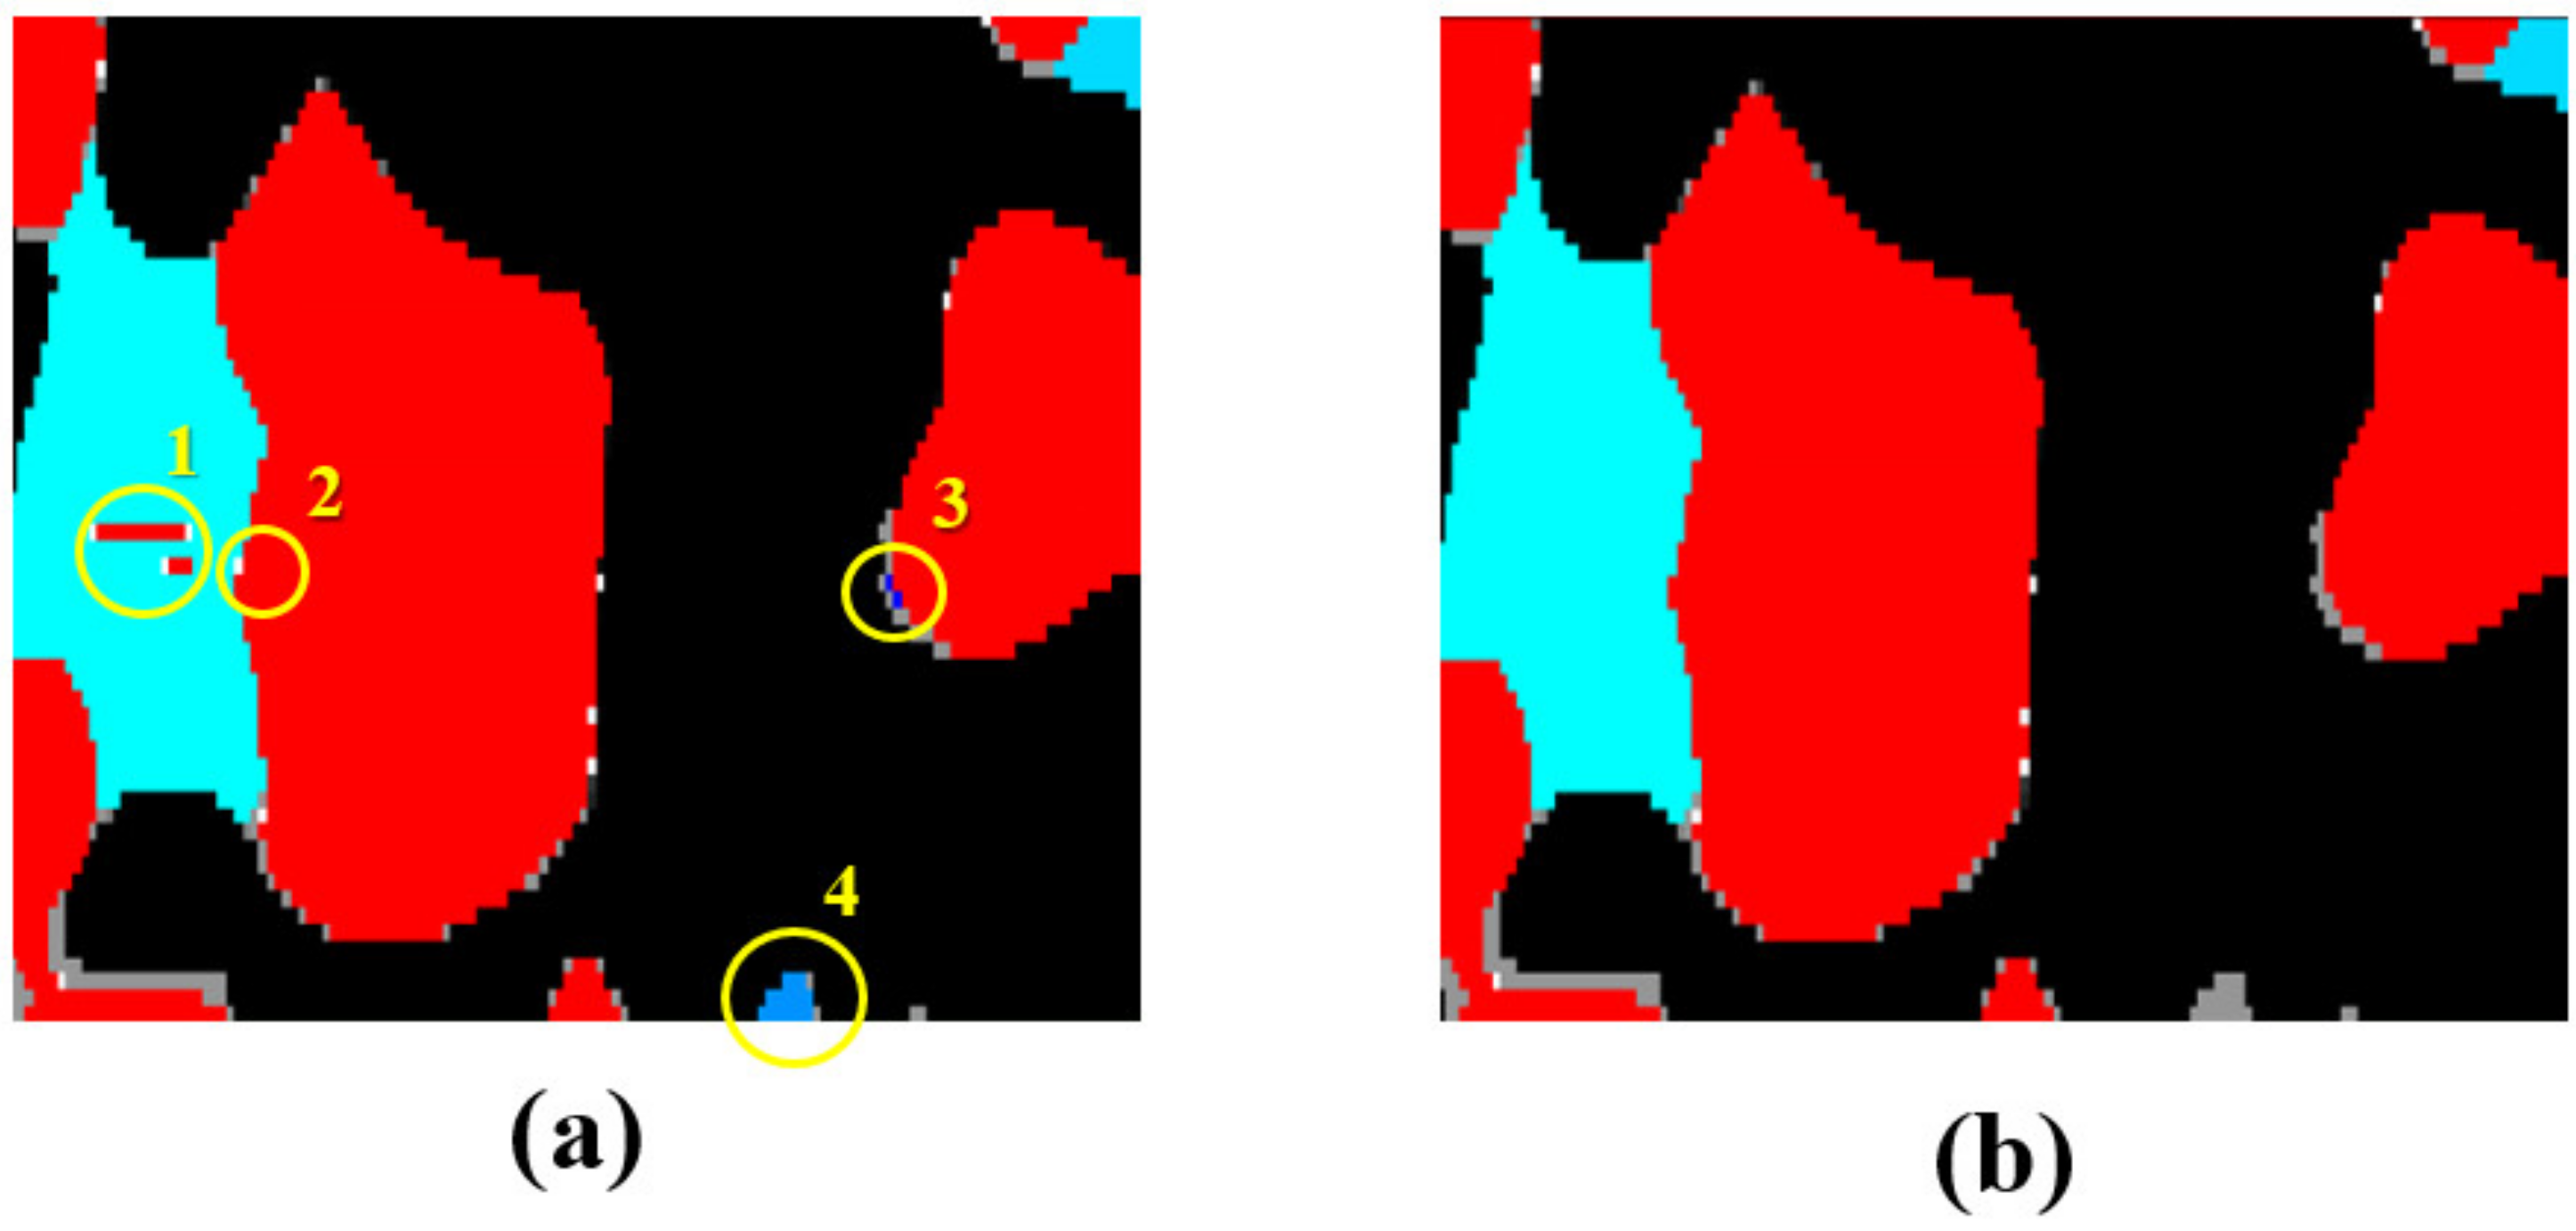
Image processing was conducted using the Synopsys Simpleware ScanIP software (hereinafter referred to as ScanIP) to identify and remove artefacts, if necessary, in order to create an accurate 3D model of the reconstructed microstructure. After stacking the images, image processing filters, such as 3D median, morphological, and recursive Gaussian, were applied. The change in volume fractions of nickel, 8YSZ, and pores was analysed for each application of the respective filters. In spite of the application of smoothing filters, different kinds of artefacts remained in the reconstructed model, which can be classified into (1) assignment errors, (2) pixel errors between two phases, (3) overestimation of the YSZ phase, and (4) freely moving particles in the 3D model, as presented in
Figure 3.
Artefacts of the first and second categories were edited manually. Errors due to an overestimation of the YSZ phase were segmented into a separate mask in ScanIP, which were removed. Freely moving particles can lead to numerical issues during the simulation and were removed from the model. Applying a median filter of 4 pixels, morphological filter of 1 pixel, recursive Gaussian filter of 1 pixel, and the additional cleaning of the remained artefacts yields volume fractions of 26.4% Ni, 38% 8YSZ, and 35.6% porosity (total solids: 41% Ni and 59% 8YSZ). When comparing volume fractions of Ni/YSZ anodes with the literature (cf.
Table 1), Vivet et al. expected the YSZ/Ni volume ratio to be 60/40 after the reduction treatment and calculated the volume fractions to 26% Ni, 33% YSZ and 41% porosity [
11]. Simwonis et al. provided theoretical volume fractions of 24% Ni, 36% YSZ and 40% porosity in their study [
10]. To conclude, the volume fractions in this study agree well with the results of the literature, producing a volume ratio of 60/40 (YSZ/Ni).
2.2. Numerical Investigation
In the following, FE models with varied volume fractions of nickel, 8YSZ, and porosity were generated and examined in compression tests in x, y, and z directions, using appropriate material and failure models for nickel and 8YSZ (cf.
Section 3.2). Compressive load was selected to investigate the effect of the manufacturing process as well as the assembly of the cell on the anode microstructure. In this study, the electrolyte layer on top of the anode was deposited by a PVD process [
23,
24]. Typically, large compressive stresses were introduced in the underlying substrate due to the PVD process, which is the anode layer in this study [
25]. In addition, the cells and the metallic interconnectors must be compressed for assembly [
18].
Different volume ratios were chosen to gain insights into the mechanical behaviour of the microstructure and the influence of the microstructure on the mechanical behaviour.
The reconstructed model was analysed in ScanIP.
Figure 4 (1–3) shows gridlines of 15 sections, which were used to divide the entire model into smaller sections. The gridlines were positioned on the positions 1, 2, and 3 to create varied volume fractions. In total, volume ratios of 45 segments with a respective single volume of 2.4 × 2.4 × 2.4 μm
3 were determined. The naming convention of the samples refers to their position in the model. The counting sequence was set as follows: position (1): 1 to 15, position (2): 16 to 30, and position (3): 31 to 45.
From this, five suitable samples with different characteristics were selected: two models with identical solid phase ratios but different porosity and two models with equal porosity but contrary solid ratios of nickel and 8YSZ (80:20; 20:80). An additional model, measuring a Ni-YSZ ratio of 50:50, was used to complete the study (
Figure 4, bottom section). Volume fractions of the solid phases and porosity in the selected cut outs are presented in
Table 2.
After the discretisation of the models for numerical simulations, all models were composed of an average of 380,000 tetrahedral elements (linear tetrahedral element C3D4), as depicted in
Figure 4 (bottom section).
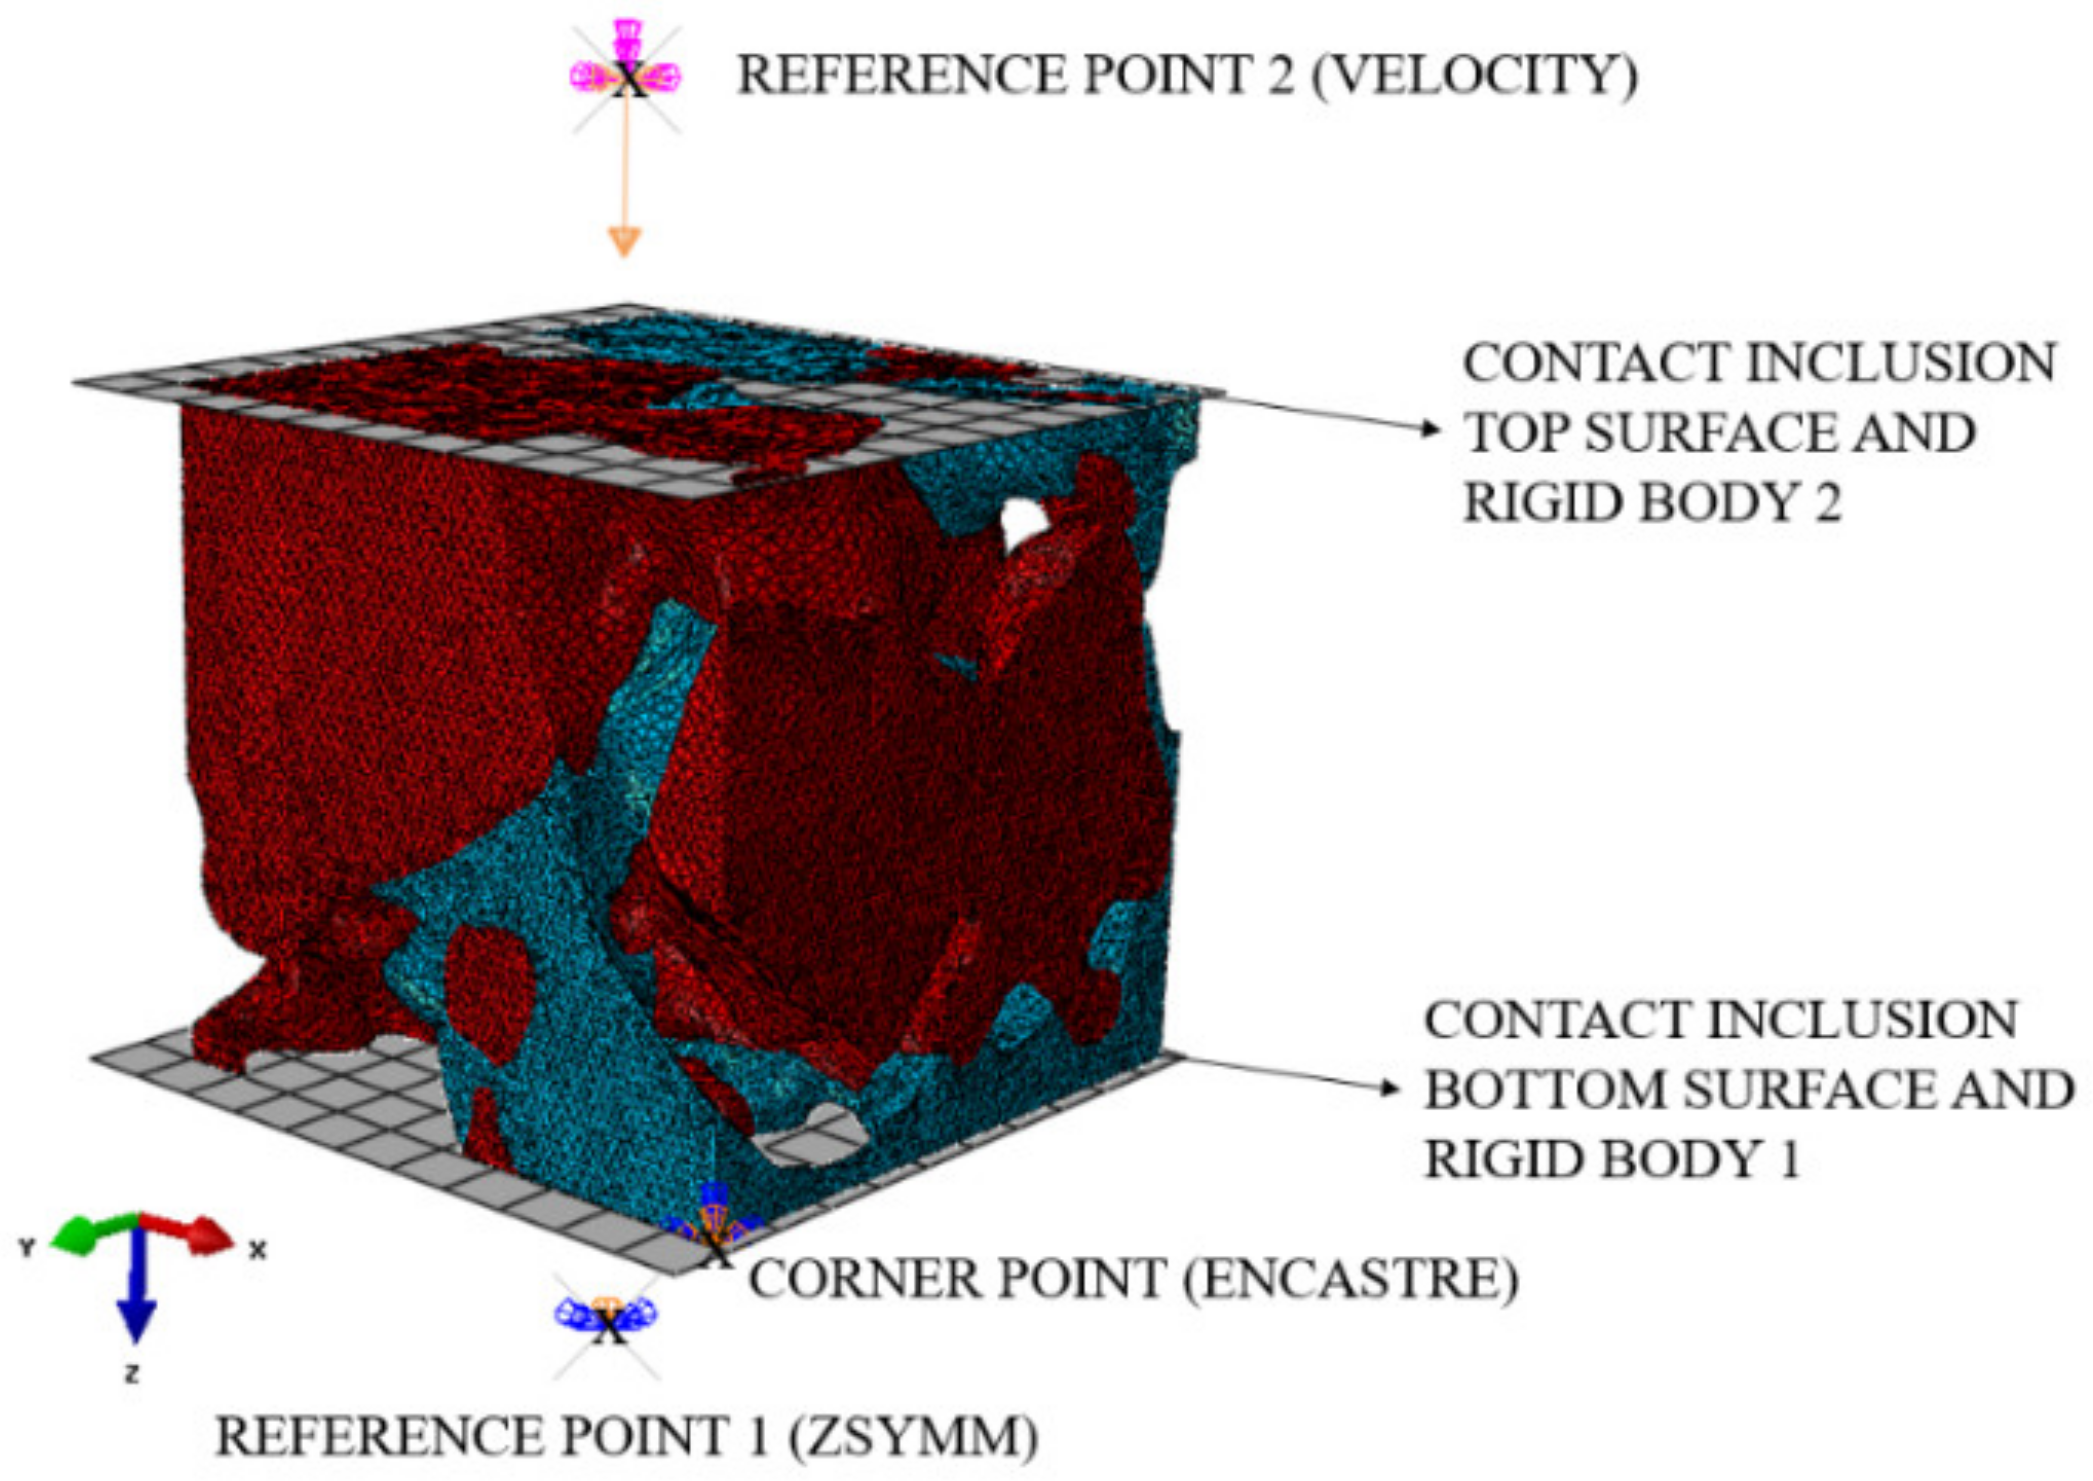
2.2.1. Boundary Conditions and Constraints
The simulations for mechanical testing, such as compression tests in the x, y, and z directions, were conducted in the dynamic solver Abaqus/Explicit. The loads were applied to the FE models by assigning velocities to a reference node, which is linked to a rigid body plate transferring the loads onto the surface of the structure. The velocity indicates the strain rate during the test. The compressive load was introduced successively in the x, y, and z (stacking) directions to understand the effects on the mechanical behaviour of different volume ratios of the microstructure and the influence of the anisotropy.
Figure 5 shows an example of a compression test in the z direction, in which the degrees of freedom on the top and bottom side are constrained by using three boundary conditions in the Abaqus/CAE assembly.
Firstly, one bottom corner point of the structure was fixed in all degrees of freedom (
ENCASTRE). Secondly, rigid bodies with shapes of a plate were used to introduce the compressive load into the microstructure. As the model in
Figure 5 presents, one rigid body plate was aligned parallel to the top surface and the other was aligned parallel to the bottom surface, considering a spacing of 5 × 10
−4 µm for contact definitions between the sample and the plates. Rigid body constraints attach a reference point to the element set of the planar rigid body. Reference point 1, which refers to the lower rigid body, was constrained in the loading direction (
ZSYMM). The velocity was assigned to reference point 2 (
Figure 5). Furthermore, contact definitions with element-based surfaces were expected between the rigid body and the microstructure to apply the compression. This contact model was defined as a “hard” contact algorithm normal to the surfaces between the element set of the rigid body and the element set of the sample surface. In addition, a general self-contact was assigned to ensure that particles that separated after failure of the microstructure are still in contact with the remainder of the sample.
To simplify, the contact between the Ni phase and the YSZ phase was considered as perfect adhesion with no additional interface behaviour.
2.2.2. Constitutive Models
In the next step, material and failure models were specified for the ductile nickel phase and the brittle YSZ phase in Abaqus/Explicit. The temperature and strain-rate dependent Johnson–Cook (JC) material model was utilised for nickel to describe its plastic ductility and isotropic hardening behaviour, while the Johnson–Cook dynamic failure model represented its damage behaviour. Although the presented study considers quasi-static loading conditions, the temperature and strain-rate dependent JC material and damage model was chosen due to further simulations on the thermal shock behaviour of SOFC anodes as well as under operational conditions in the future. Brittle 8YSZ was characterised by linear elastic behaviour and the brittle cracking damage model. During the simulation, the damage propagation was performed by removing elements from the FE model, according to the damage criterion.
Table 3 provides general material properties for 8YSZ and nickel at room temperature, based on the system of physical units, which was set in micrometres in the FE model (referring to the 3D dimensions: 2.4 × 2.4 × 2.4 µm
3). Additional temperature-dependent material properties are reported in the literature [
26,
27,
28,
29,
30,
31,
32].
2.2.3. Johnson–Cook Material and Failure Model for Nickel
The Johnson–Cook (JC) material model depends on two parameter sets. The first set includes values for
A,
B,
n,
m, melting, and room temperature of the material to implement the JC metal plasticity material definition. The second set, consisting of the parameters
C and the reference strain rate
, defines the JC strain rate dependence [
34].
Bae et al. [
33] have presented these material parameters for Johnson–Cook hardening and Johnson–Cook strain rate dependence for nickel, as listed in
Table 4.
As mentioned before, the Johnson–Cook failure model was additionally used to predict the damage of ductile metals, such as nickel, taking into consideration plastic deformation. It is based on a damage accumulation of increments of the equivalent plastic strain value Δ
εpl with regard to the failure strain
εpl,f. Failure occurs when the damage parameter
D presented in Equation (1) exceeds a value of 1 [
34].
The strain at failure
εpl,f is calculated by using Equation (2):
The failure parameters
D1,
D2, and
D3 describe the dependency of the fracture strain to the stress triaxiality,
D4 expresses the strain-rate dependency, and
D5 considers temperature softening [
35]. The term
p/q represents the stress triaxiality, where
p and
q are the hydrostatic stress and the von Mises equivalent stress, respectively. The failure parameters are defined to calculate the damage parameter.
Table 5 summarises the failure parameters
D1–
D5 of an alloy with 52.5% Ni (Inconel 718), according to Erice et al. [
36].
These failure parameters were used as a primary approximation for the damage initiation. After running the first simulation, the model appeared to be unaffected by the chosen parameters. The authors suggested that the failure parameters needed to be adjusted due to the different length scale of the numerical model (physical units in µm). Hence, the failure parameters were reduced by a factor of 100 in further simulations.
2.2.4. Brittle Cracking Model for YSZ
Brittle materials, such as ceramics (8YSZ), show no or very small plastic deformation. The brittle material behaviour is purely elastic. However, when exceeding the elastic limit, failure occurs immediately. The brittle cracking model in the dynamic solver Abaqus/Explicit expresses this brittle material behaviour. According to the Rankine criterion, a crack is initiated when the maximum principal tensile stress is higher than the tensile strength of the brittle material [
34].
Abaqus applies Hillerborg’s fracture energy cracking criterion [
37] to calculate the amount of energy, which is used for crack propagation in Mode I fracture (crack opening orthogonal to tensile stress). Hillerborg divided the energy, which is absorbed during a tensile test, into two sections: elastic energy and fracture energy. The elastic energy per unit volume stored in the entire sample before reaching the tensile strength is represented by the stress–strain curve. The fracture energy per unit area after exceeding the tensile strength is expressed by the area below the stress–displacement curve [
38]. Abaqus considers the decrease in strength during crack propagation as a linear relationship [
27]. The displacement at total failure
u0 (loss of strength) is determined by the critical energy release rate
GIc and fracture stress
σf as
u0 = 2∙GIc/σf. This model requires the properties: failure stress
σf and Mode I fracture energy
GIc (critical energy release rate).
Table 6 illustrates the used fracture parameters for 8YSZ in this work.
3. Results
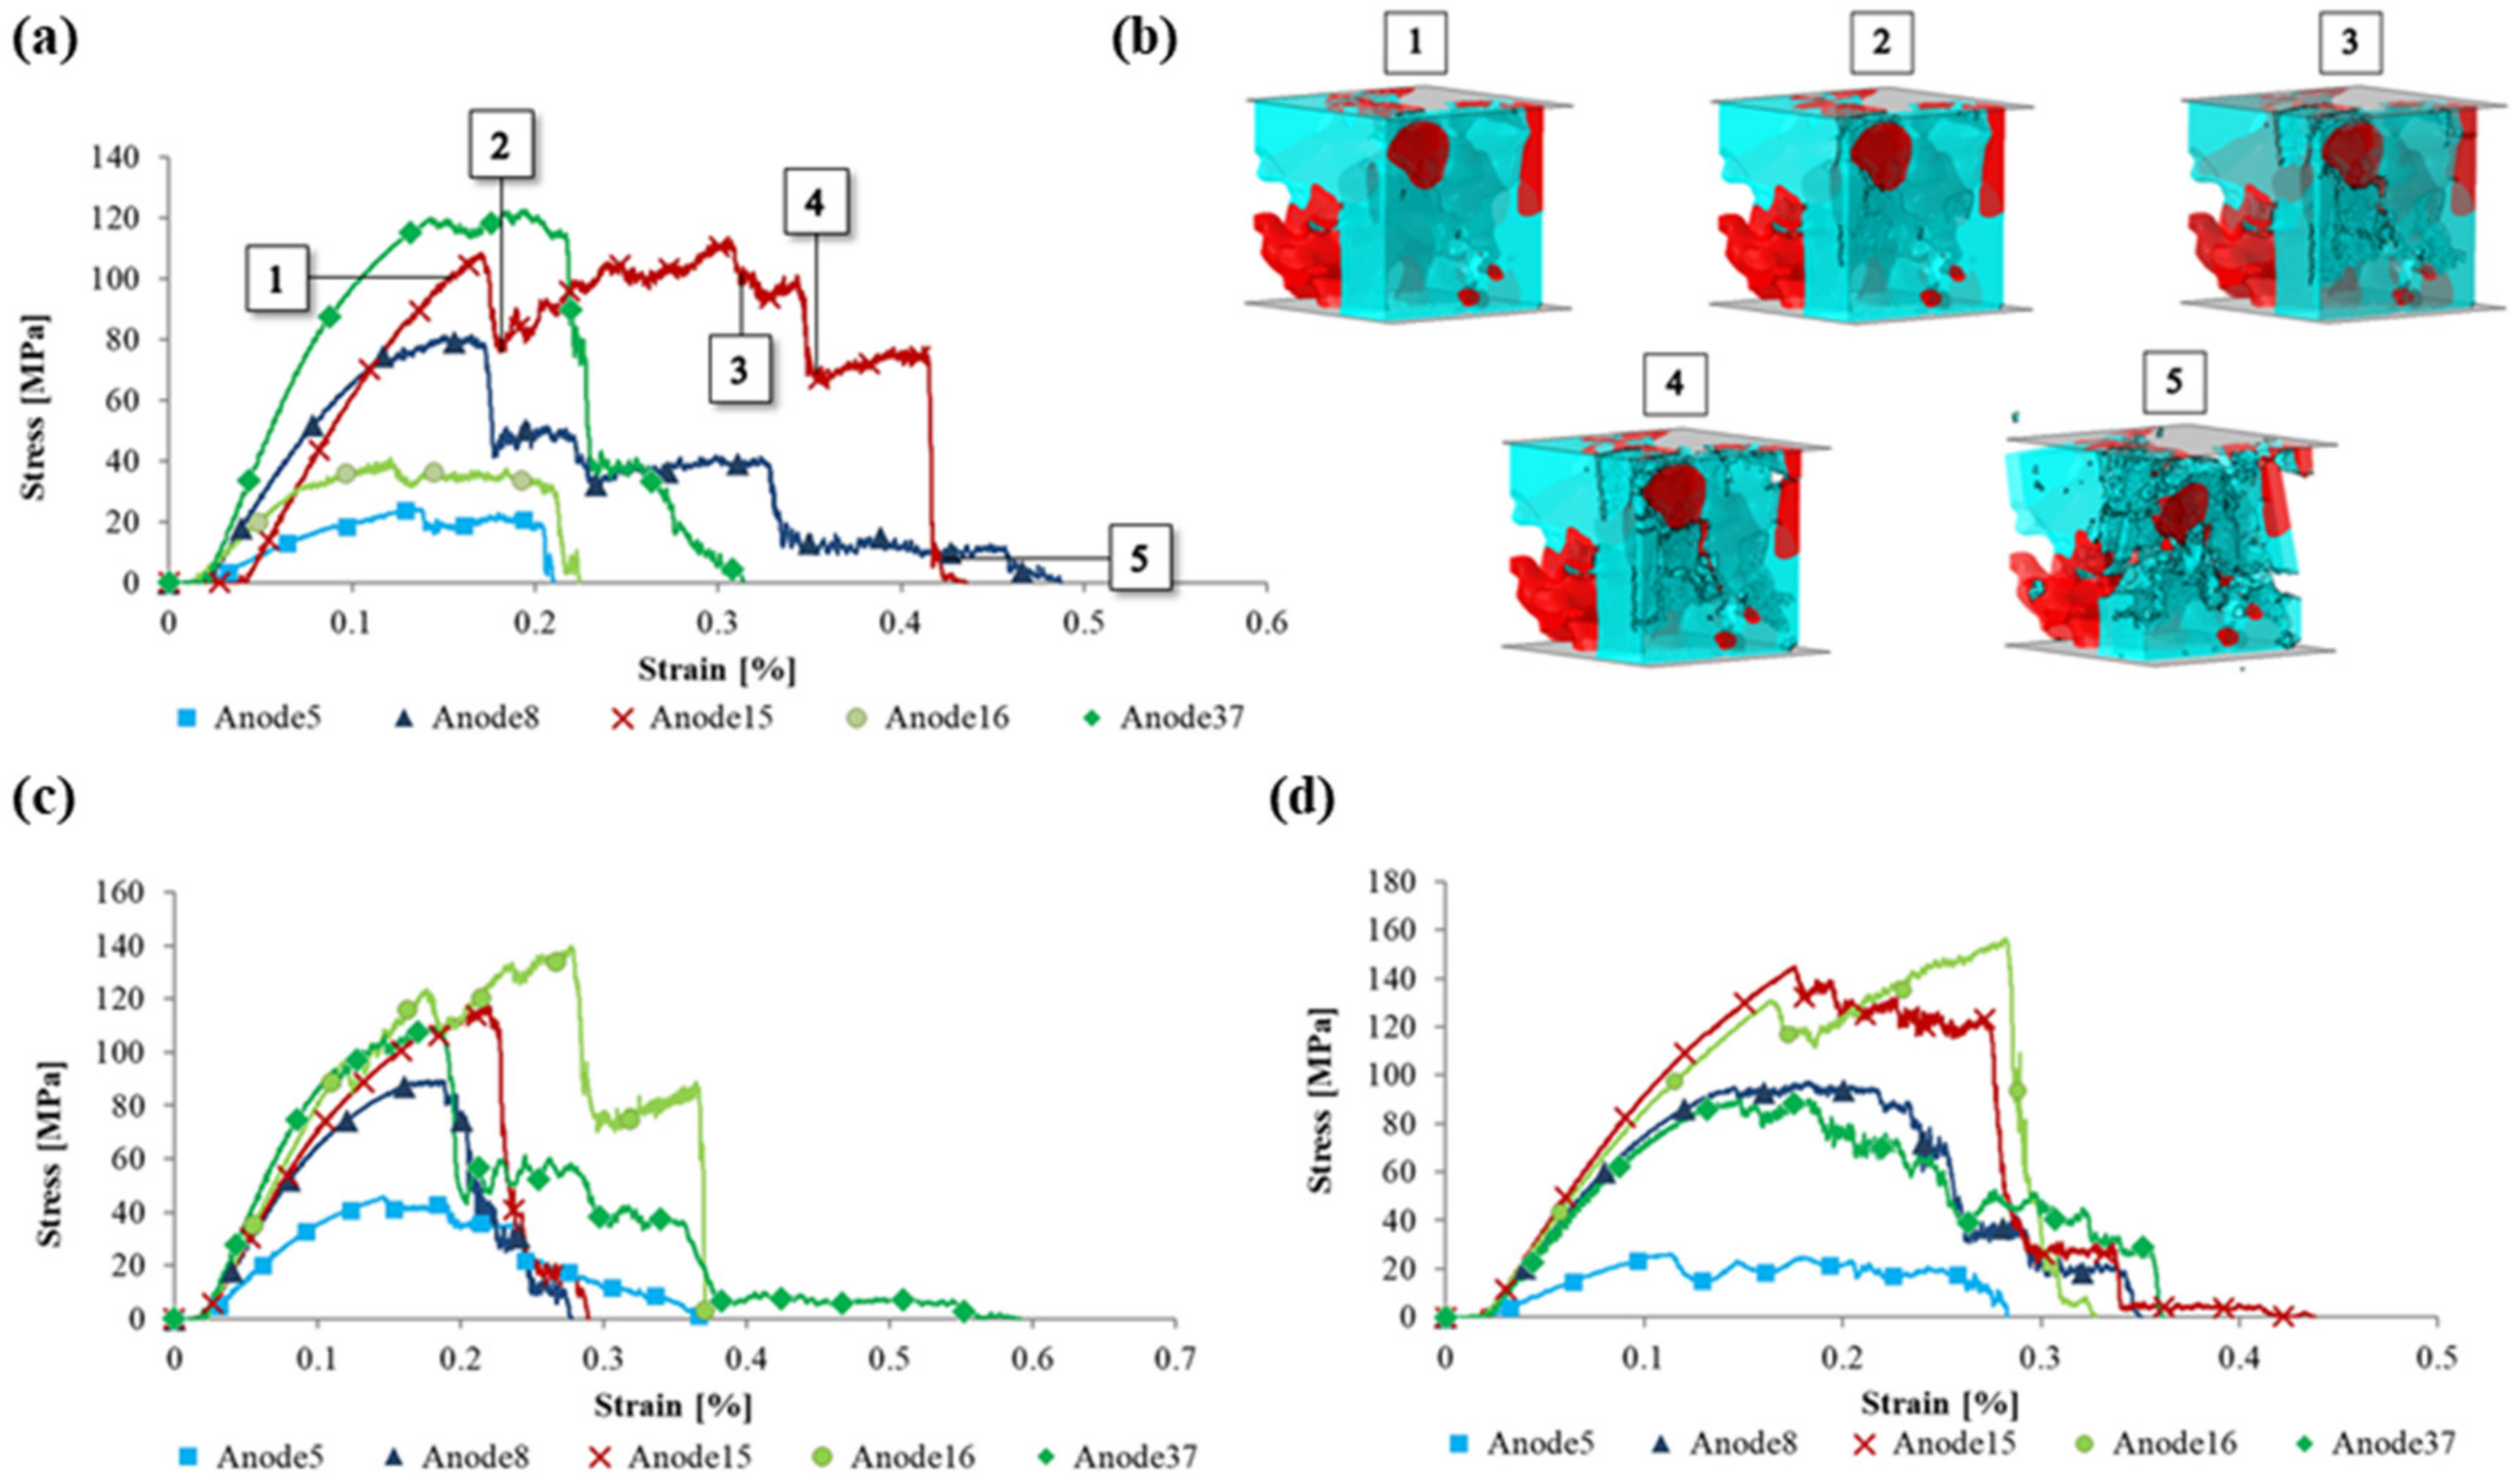
The five presented models were examined in the x, y, and z directions by compression tests to verify if effective anisotropic material behaviour exists. A total of 15 simulations were carried out, and the stress–strain curves of the models are compared. In order to investigate the damage of the Ni and YSZ phase and the corresponding influence of the microstructure morphology, the shape of the stress–strain curves of models tested in the x direction is correlated to single events during testing. Furthermore, Weibull plots based on the stress at failure are presented to describe the typical distribution of the strength values. Conclusively, the results of Weibull moduli, Young’s moduli, and energy release rates are compared with the existing literature.
3.1. Stress–Strain Curve
To obtain the exact stress–strain curves from the load–displacement data, the loaded surface areas on the top and the bottom of the sample are computed by using the ImageJ software. The average of these surface areas describe an intermediate surface area of the sample. The stress is calculated by dividing the reaction force on the reference point by the mean surface area, whereas the strain is determined with respect to the displacement and edge length.
Figure 6a demonstrates the generated stress–strain curve of Anode15 in a compression test in the x direction with its associated damage evolution. A damage event in the microstructure is indicated by a decrease in the stress level. The crack initiation in the sample (i.e., stress reduction after first maximum) is observed at the Ni/YSZ interface. This result agrees well with the investigations of Celik et al. and Xiang et al. which have identified the Ni/YSZ interface as a critical location for stress concentrations leading to failure [
18,
19].
3.2. Young’s Modulus and Compressive Strength
Detailed results obtained from the compression tests in the x, y, and z direction are presented in
Figure 6a–c. The highlights of these figures are the significant differences in the failure stress and fracture energies (as integral of the stress–displacement curve) of the models.
The resulting Young’s moduli and compressive strength of the models determined from the figures above are listed in
Table 7.
The models of Anode5 and Anode8 have identical solid volume fractions but differences in porosity. When comparing Anode5 and Anode8, the compressive strength amounts to 24.8 MPa and 81.1 MPa, respectively. The Young’s modulus, which is represented by the slope of the stress–strain curve, is equal to 30.7 GPa for Anode5 and 94.5 GPa for Anode8 (
Table 7). These results indicate that the porosity has a major influence on the stiffness and strength properties. However, a preferential orientation of the mechanical properties is not observed. As shown in
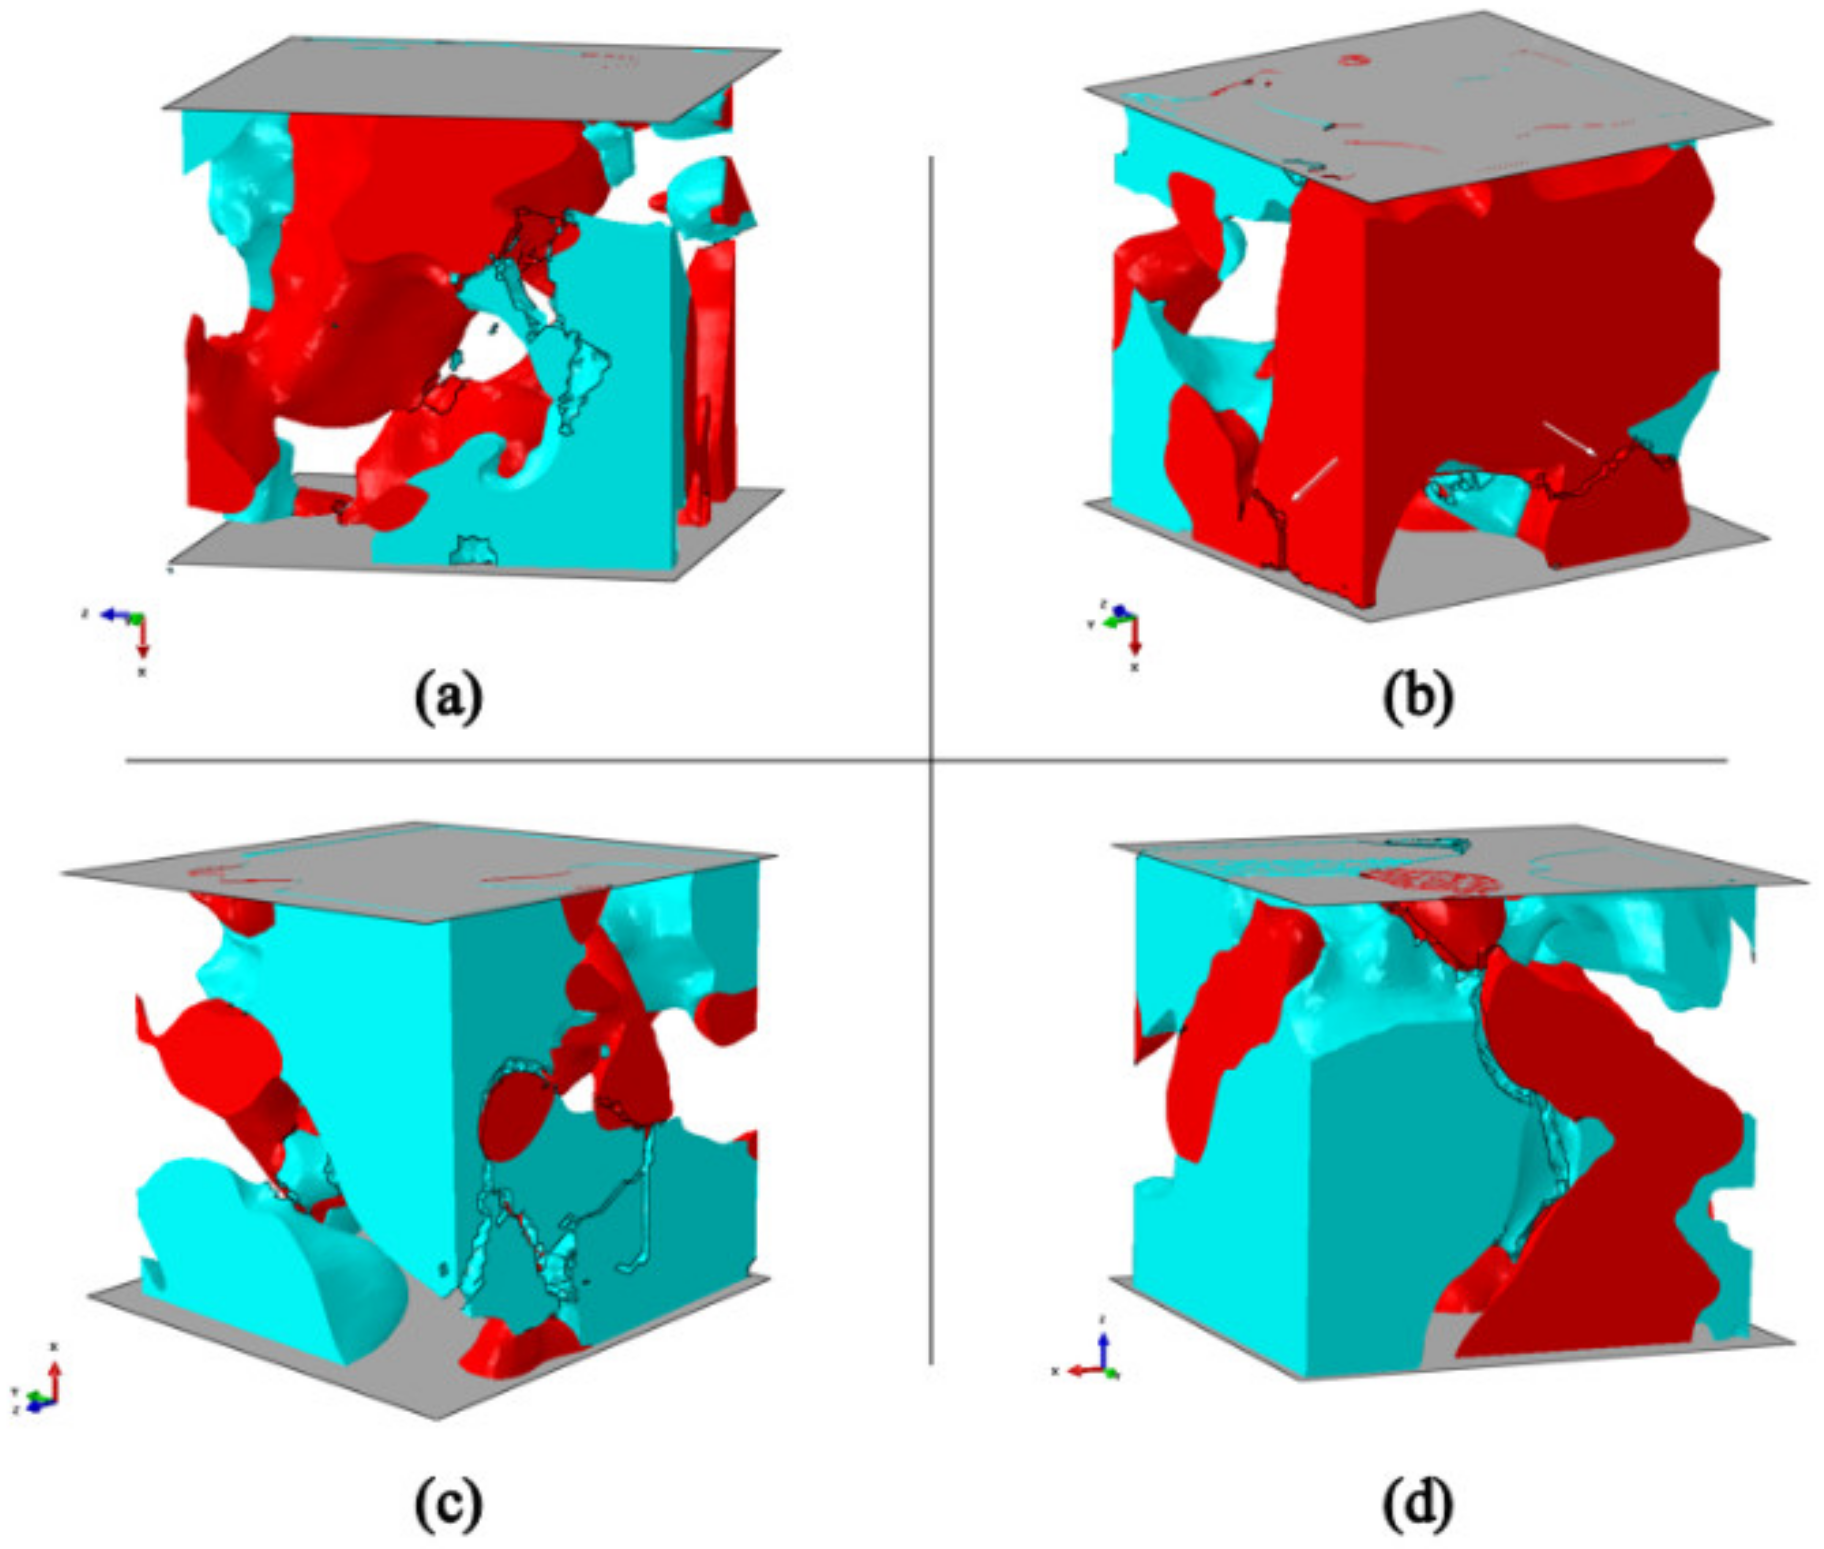
Figure 7a, the geometry of Anode5 consists of fine struts and is fragile due to the high porosity, which therefore caused the failure to occur earlier than in the other models. The comparison of the crack pattern of all the models shows that in most cases, cracking appear mainly in the YSZ phase.
The models of Anode15, Anode16, and Anode37 possess a similar porosity of 32 to 34%, but contrary volume fractions of Ni and 8YSZ (cf.
Table 2). Anode37 shows the highest compressive strength and Young’s modulus. It can be attributed to the geometry and volume fraction of the Ni phase (79% Ni, 21% 8YSZ), which is arranged as a coherent volume element, as presented in
Figure 7b. The increase in stress at the beginning of the compression of Anode37 can be explained by the force absorption of the robust Ni phase. After a slight decrease due to the ductility of Ni, two main struts collapsed at an elongation of 0.22% (compare
Figure 6a with
Figure 7b, white arrows). The force was diverted to the remaining brittle YSZ phase.
On the contrary, the YSZ phase is dominant in Anode16. As
Figure 7c displays, no consistent Ni phase in the x direction could support the microstructure. Most of the nickel was located in the y–z plane. Consequently, the failure occurred on the weakest point of 8YSZ until the sample fell apart. When comparing the results of Anode16 in the x direction with the results in the z direction, the compressive strength is 40.8 MPa and 156.3 MPa, respectively (see
Table 7). Salmang and Scholze explained that the brittle behaviour and the toughness of ceramic materials could be improved by using the plasticity of a second phase [
41], which can be seen in
Figure 7d. While compressing Anode16 in the z direction, the strut of nickel provided a strong reinforcement of the structure. Furthermore, this supportive effect of the Ni phase on the mechanical behaviour is also found in the compression tests in the y and z directions of the models.
3.3. Weibull Distribution
The Weibull distribution is used to analyse the mean strength and to estimate the reliability of the structures. It is described by Equation (3), where
F(σ) is the probability density function (probability of failure),
σ is the stress at failure,
σ0 is the characteristic Weibull strength, and
m is the Weibull modulus [
42]. In general, the higher the Weibull modulus, the less the strength values scatter. Typical Weibull moduli for sintered ceramics are 5 to 20 [
41]. Although different production processes lead to different reliabilities, this range of the Weibull moduli is taken into account for an approximate comparison in the present study.
The probability density function can be expressed by using the double logarithmic scales [
40], which yield Equation (4).
The compressive strength values in
Table 7 are sorted in ascending order
σ1, σ2, …, σN, to determine the probability density function F expressed by Equation (5), where
i represents the rank of each value and N indicates the number of measured strength values [
43] (
N = 15).
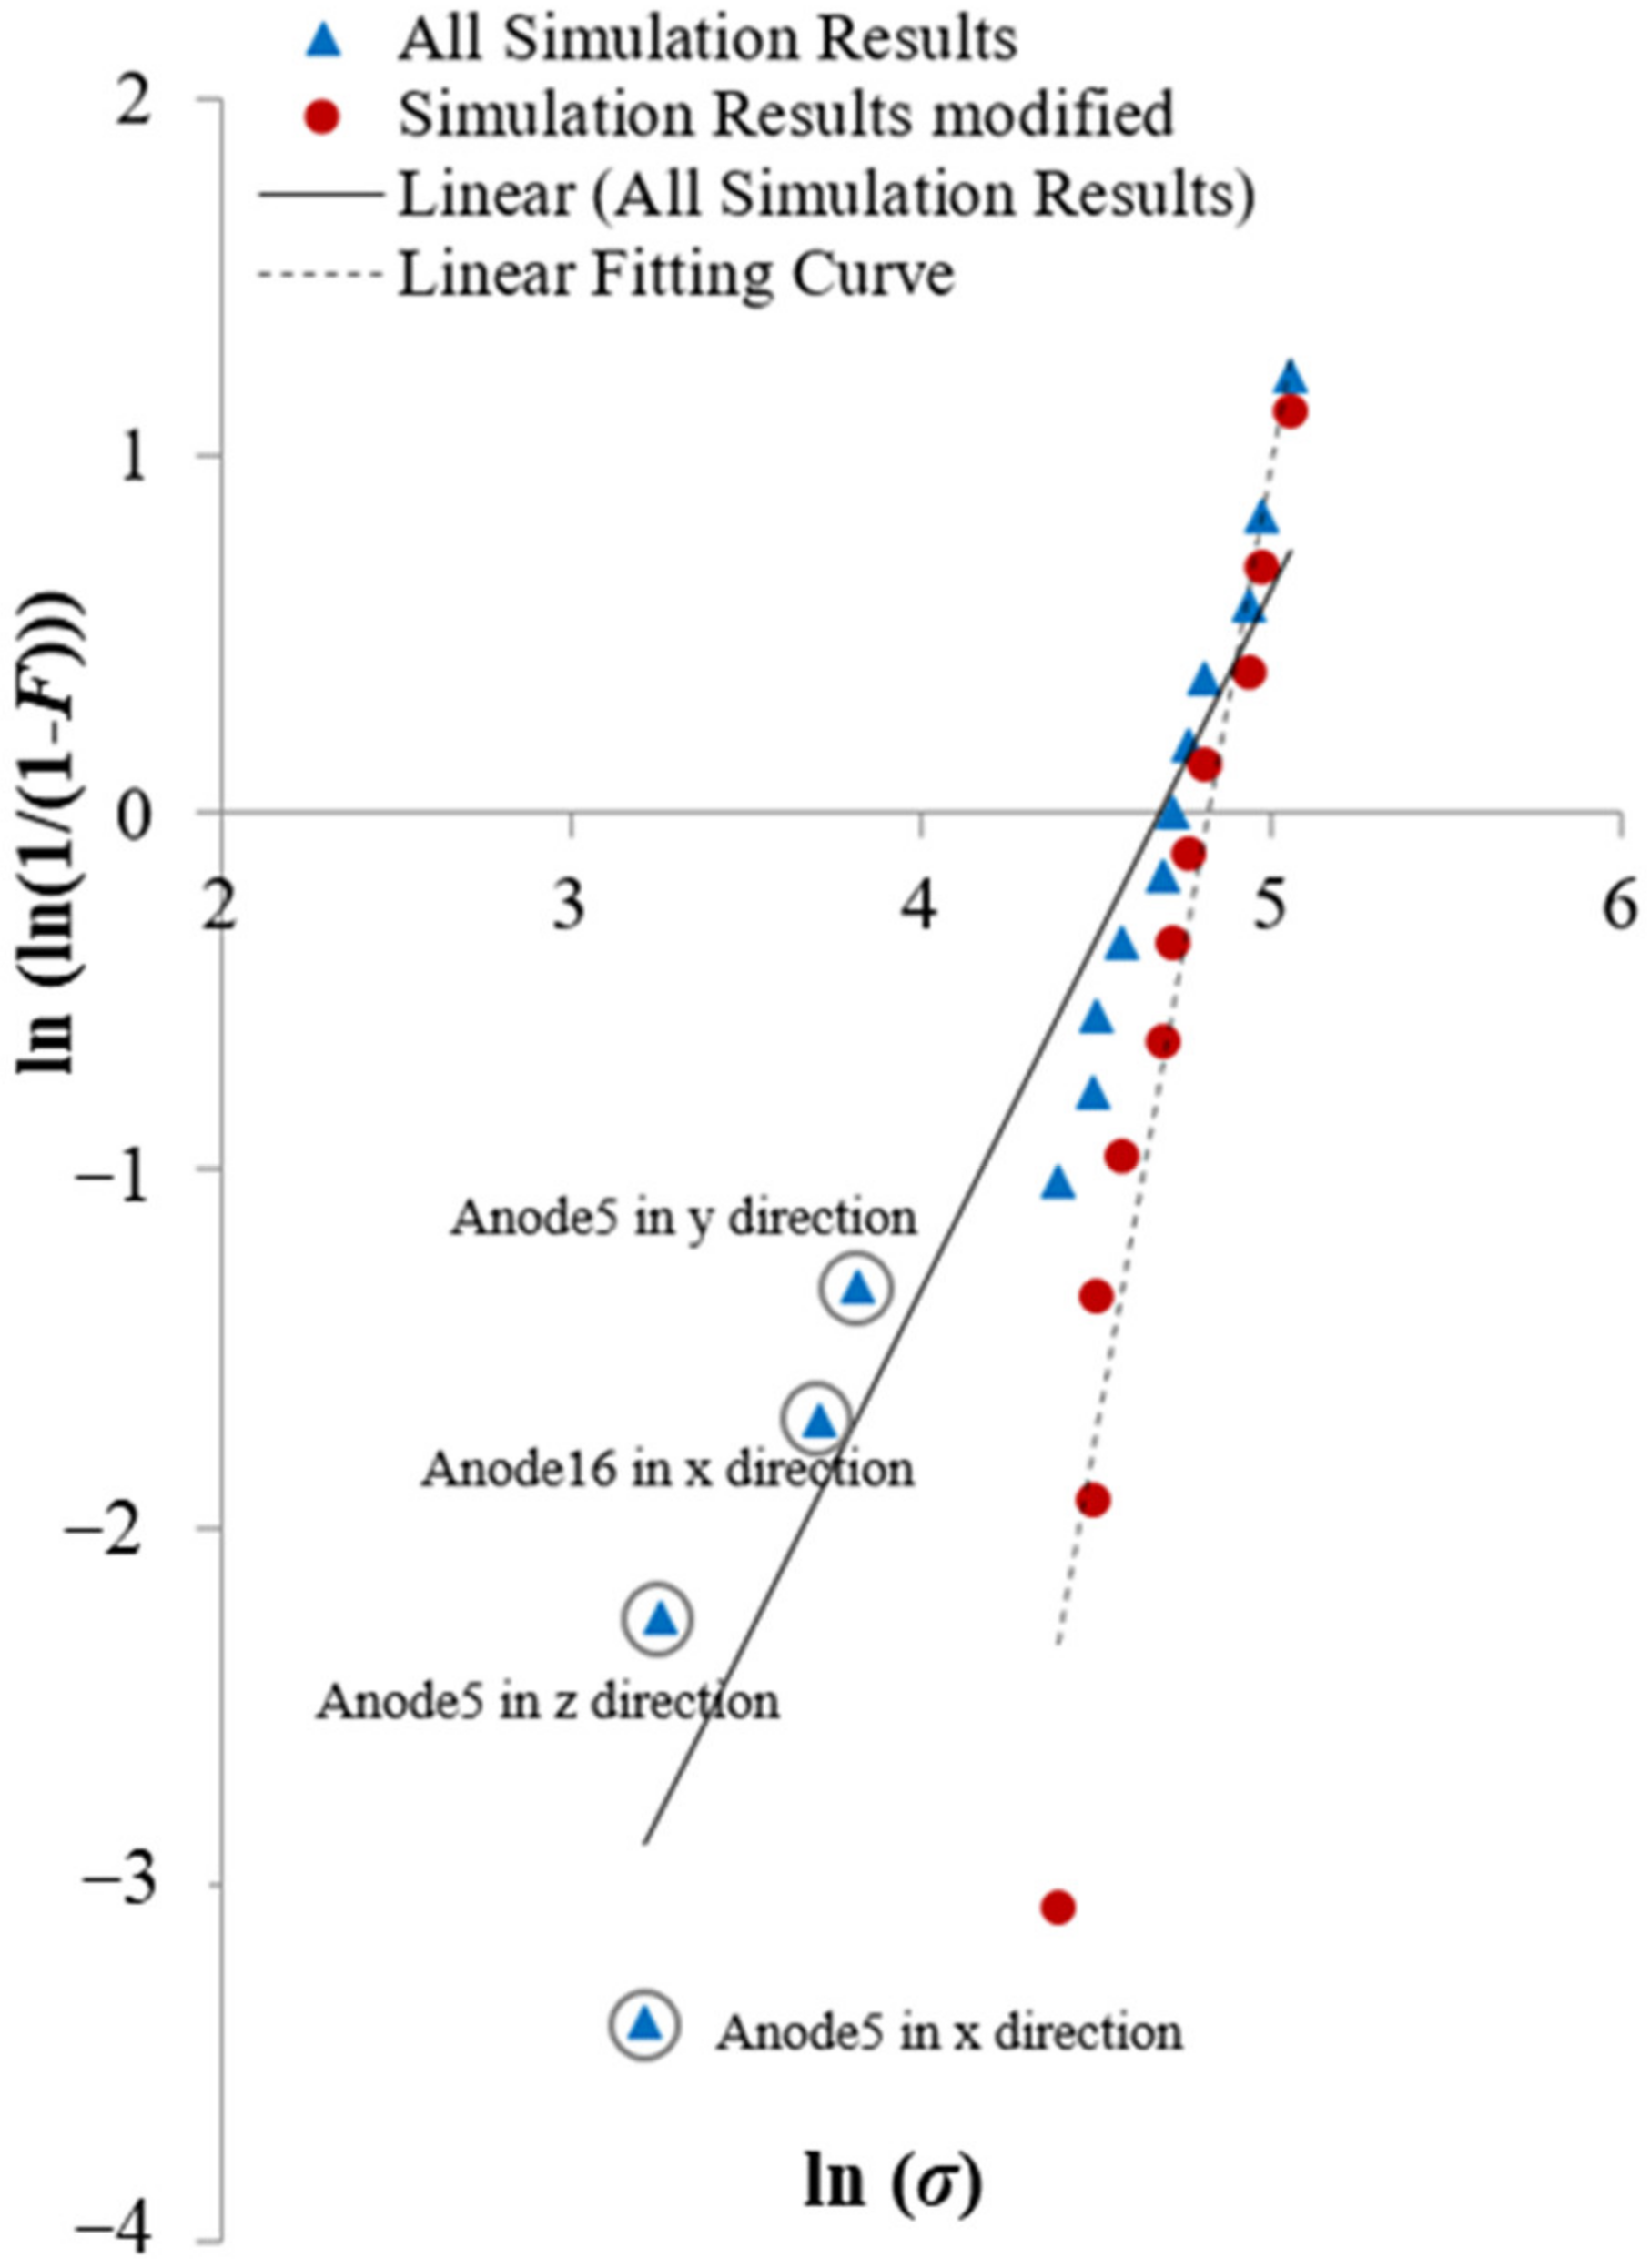
Figure 8 illustrates the application of the linearised Weibull distribution on all compressive strength values under the loading condition.
The Weibull modulus is obtained directly from the slope of the linearised Weibull distribution, according to the linear fitting curve y = m · x − b, while the Weibull strength is calculated from the y-intercept of the linear equation by the expression σ0 = exp(b/m). This yields a Weibull modulus of 2.0 and a Weibull strength of 107.6 MPa. The low Weibull modulus can be explained by two reasons.
Firstly, an effect on the sample thickness has been reported by Radovic and Lara-Curzio, in which experimental results from biaxial tests indicated a decrease in the Weibull modulus (from 6.4 to 3.8) with decreasing sample thickness (from 1.44 to 0.45 mm) [
42]. Therefore, the low Weibull modulus in this work could be attributed to the sample dimensions of 2.4 µm rather than to lower reliability, which increases substantially the effect of a critical single microstructure feature on the strength. Although Radovic and Lara-Curzio could not explain the tendency in their work, this trend matches to the presented results from smaller samples very well.
The second reason is the difference in the microstructure design of the samples series. The effect of a high porosity in the results of Anode5 degraded the mechanical behaviour significantly (see
Figure 6a–c). As discussed before, the result of Anode16 in the x direction showed a reduced compressive strength due to the missing support of the Ni phase (
Figure 7c). For this reason, the Weibull distribution is replotted by neglecting these results (cf.
Figure 8), resulting in an increased Weibull modulus of 5.5 and a Weibull strength of 124.0 MPa due to the high similarity in the morphology of the remaining samples, as illustrated in
Table 8. The Weibull modulus of 5.5 corresponds better to the typical values in the literature [
41] when neglecting the above-mentioned tests.
3.4. Energy Release Rate and Fracture Toughness
The released energy is calculated from the stress–displacement curve for all samples in the x, y, and z directions, based on the point of crack initiation under loading condition with respect to the average surface area of a single element of the microstructure [
39]. The average energy release rates G for each sample are depicted in
Table 9.
Irwin [
44] has established a relationship between the energy release rate
G and the stress intensity factor
KI (i.e., the fracture toughness) for plane stress and plane strain conditions, as shown respectively in Equations (6) and (7), where
E is the effective Young’s modulus and
ν is the Poisson’s ratio.
A thin plate of thickness z is generally described by the plane stress condition due to a smaller z dimension compared to its x and y dimensions, whereas a plane strain condition is expected in bulk structures with larger z dimension than the x and y dimensions. Since the samples in this study were cut out from the anode structure (see
Figure 2b), a plane strain condition could be predicted in the single samples. On the other hand, the overall anode structure resembles a thin plate, which corresponds better to a plane stress condition. Hence, the actual load condition could be identified as a combination of plane stress and plane strain conditions.
In the following, the average values of the stress intensity factor are calculated for either condition by inserting the effective Young’s moduli and the energy release rates from this study into the above equations (
Table 9).
The stress intensity factors of plane stress and plane strain conditions of either sample show no significant difference. When comparing the fracture toughness within the samples, high volume fractions of nickel (Anode15 and Anode37) lead to an increase in fracture toughness, although the orientation of the Ni phase affected the damage behaviour significantly (Anode16). On the other hand, a higher porosity in the sample results in a low fracture toughness and a rapid damage to the microstructure (Anode5). The characteristics of the fracture toughness can be attributed to the behaviour of the toughness of the Ni phase.
In the literature, Radovic and Lara-Curzio [
42] have reported a fracture toughness of 2.5 ± 0.1 MPa m
1/2 and 1.9 ± 0.2 MPa m
1/2 in Ni-YSZ anodes with porosities of 34.4 ± 0.6% and 45.94 ± 0.6%, respectively, which were obtained from double torsion tests at ambient temperature. Although the samples in the present study possess different properties of morphology and composition, the average fracture toughness of the samples with a porosity of 32 to 34% amounted to 2.7 ± 0.4 MPa m
1/2 for plane stress condition and 2.8 ± 0.4 MPa m
1/2 for plane strain condition, which agrees very well with the experimental values given by Radovic and Lara-Curzio. To conclude, the results of the fracture toughness in this work correlate with the order of magnitude from actual fracture mechanical tests.
4. Discussion
This work has examined the damage behaviour of a porous anode for Solid Oxide Fuel Cell (SOFC) applications using numerical simulations. The investigated anode consisted of a Ni-YSZ cermet composed of nickel and an oxide ceramic, 8 mol% yttria-stabilised zirconia (8YSZ). In order to characterise the material behaviour and the influence of the two phases, compressive tests of the anode structure were carried out based on the production process of SOFCs.
Firstly, a representative 3D model of the anode has been reconstructed from 2D cross-sectional images after a FIB/SEM tomography. Volume fractions of 26.4% Ni, 38% 8YSZ, and 35.6% porosity were obtained (solid phase fractions 41% Ni, 59% 8YSZ). Thereafter, the 3D model of the microstructure was prepared for finite element (FE) analysis, using the software Abaqus. Five samples with different phase compositions were selected for the study. The material behaviour of nickel was defined by the Johnson–Cook material and damage model, while the brittle cracking and failure model represented the damage behaviour of YSZ, based on fracture stress and energy release rate. These models were tested successively in the x, y, and z directions by compressive loads. It was found that the porosity has an enormous influence on the compressive strength. The higher the porosity, the lower the strength of the microstructure. Nickel showed a greater impact on the strength. High Ni contents in the anode generally increased the toughness of the overall structure, although it depended on the orientation and geometry of the nickel phase. When the Ni phase was aligned parallel to the loading direction, a supporting effect on the microstructure was observed, which was characterised by significantly high toughness. Conversely, a rapid failure of the sample was found when oriented perpendicular to the loading direction. Crack initiation occurred either at the Ni/YSZ interface or at the smallest diameter of the material struts. Finally, the results of compressive strength were validated through a Weibull distribution analysis, which yielded a low Weibull modulus of 2.0, regarding all results. Previous studies have attributed low Weibull moduli to a size effect, which can be confirmed in this work due to the selected sample size (2.4 × 2.4 × 2.4 μm3). On the other hand, an increased Weibull modulus of 5.5 was determined when neglecting the results of higher porosity and a missing support of the Ni phase. The observation of the beneficial effect of the Ni phase with respect to the strength of the cell is supported by the fracture toughness results.
5. Conclusions
In this study, full 3D FE models of an SOFC anode consisting of nickel and 8 mol% yttria-stabilised zirconia (8YSZ) were characterized mechanically by performing virtual compression tests. Based on the results obtained in this study for the crack pattern, the mechanical properties, as well as the Weibull analysis, the following conclusions can be drawn:
The presented work shows the applicability and the potential of damage modelling to understand failure mechanisms and to determine the strength of SOFC anodes.
The simulation results, which can be embedded into findings of other experimental and numerical studies, even prove the suggested adjustment of the JC damage parameter in this study due to the different length scales of the literature values and the model size.
In the majority of the investigated volumes, cracking occurs at the Ni/YSZ interface, according to the observations of Celik et al. and Xiang et al. which have identified the Ni/YSZ interface as a critical location for stress concentrations leading to failure.
Due to the ductility of nickel, with an increasing amount of Ni-phase, the strength as well as the fracture toughness of the anode is increased.
The orientation of the Ni-phase with respect to the loading direction affects the mechanical behaviour of the anode strongly.
The very detailed investigated volume elements deliver specific suggestions to improve the anode structure from the mechanical point of view for future production processes using e.g., additive manufacturing.
The statistical evaluation of the simulation results applying the Weibull analysis delivers reasonable results considering the size effect reported by Radovic and Lara-Curzio.
Alongside additional simulations with loading conditions mimicking the SOFC under operation, the authors are currently developing a technique to examine the effect of the different phases on the damage behaviour at phase boundaries. This technique provides an opportunity to study stress levels within the nickel and YSZ phases and their failure mechanisms in more detail. It also has an application as a sub-modelling technique with applied displacement boundary conditions at the model cut planes from a macro-scale stress analysis.
Author Contributions
Conceptualisation, K.S., V.G. and S.S.; methodology, K.S. and V.G.; validation, K.S. and V.G.; formal analysis, K.S.; investigation, K.S. and V.G.; data curation, K.S.; writing—original draft preparation, K.S.; writing—review and editing, V.G. and S.S.; visualisation, K.S.; supervision, V.G. and S.S.; funding acquisition, V.G. and S.S. All authors have read and agreed to the published version of the manuscript.
Funding
This research was funded by Nissan Motor Ltd. The publication was financially supported by the open access publication fund of the University of Stuttgart.
Data Availability Statement
The data presented in this study are available on request from the corresponding author. The data are not publicly available due to the large amount of data from commercially available simulation software.
Acknowledgments
This work was supported by Nissan Motor Ltd., which provided half-cell SOFCs for investigation. The authors also appreciate the contributions by Scheck and Willer to prepare the samples for nanotomography and to provide the nanotomographic data.
Conflicts of Interest
The authors declare no conflict of interest.
References
- Brandon, N.P. Solid Oxide Fuel Cell Lifetime and Reliability; Academic Press: Cambridge, MA, USA, 2017. [Google Scholar]
- Singhal, S.C.; Kendall, K. Fundamentals, design and applications. In High-Temperature Solid Oxide Fuel Cells; Elsevier: New York, NY, USA, 2003. [Google Scholar] [CrossRef]
- Lee, J.-H.; Moon, H.; Lee, H.-W.; Yoon, K.-H.; Kim, J. Quantitative analysis of microstructure and its related electrical property of SOFC anode, Ni–YSZ cermet. Solid State Ion. 2002, 148, 15–26. [Google Scholar] [CrossRef]
- Atkinson, A.; Barnett, S.; Gorte, R.J.; Irvine, J.; McEvoy, A.J.; Mogensen, M.B.; Singhal, S.C.; Vohs, J. Advanced anodes for high-temperature fuel cells. Nat. Mater. 2004, 3, 17–27. [Google Scholar] [CrossRef] [PubMed]
- Prakash, B.S.; Kumar, S.S.; Aruna, S. Properties and development of Ni/YSZ as an anode material in solid oxide fuel cell: A review. Renew. Sustain. Energy Rev. 2014, 36, 149–179. [Google Scholar] [CrossRef]
- Kawashima, T.; Hishinuma, M. Analysis of Electrical Conduction Paths in Ni/YSZ Particlate Composites Using Perlocation Theory. Mater. Trans. 1996, 37, 1397–1403. [Google Scholar] [CrossRef][Green Version]
- Iwai, H.; Shikazono, N.; Matsui, T.; Teshima, H.; Kishimoto, M.; Kishida, R.; Hayashi, D.; Matsuzaki, K.; Kanno, D.; Saito, M.; et al. Quantification of SOFC anode microstructure based on dual beam FIB-SEM technique. J. Power Source 2010, 195, 955–961. [Google Scholar] [CrossRef]
- Dees, D.W.; Claar, T.D.; Fee, D.C. Conductivity of Porous Ni/ZrO2-Y203 Cermets, Electrochem. Storage 1987, 134, 2141–2146. [Google Scholar]
- Hu, W.; Guan, H.; Sun, X.; Li, S.; Fukumoto, M.; Okane, I. Electrical and Thermal Conductivities of Nickel-Zirconia Cermets. J. Am. Ceram. Soc. 2005, 81, 2209–2212. [Google Scholar] [CrossRef]
- Simwonis, D.; Tietz, F.; Stover, D. Nickel coarsening in annealed Ni/8YSZ anode substrates for solid oxide fuel cells. Solid State Ion. 2000, 132, 241–251. [Google Scholar] [CrossRef]
- Vivet, N.; Chupin, S.; Estrade, E.; Piquero, T.; Pommier, P.; Rochais, D.; Bruneton, E. 3D Microstructural characterization of a solid oxide fuel cell anode reconstructed by focused ion beam tomography. J. Power Source 2011, 196, 7541–7549. [Google Scholar] [CrossRef]
- Holzer, L.; Iwanschitz, B.; Hocker, T.; Keller, L.; Pecho, O.; Sartoris, G.; Gasser, P.; Muench, B. Redox cycling of Ni–YSZ anodes for solid oxide fuel cells: Influence of tortuosity, constriction and percolation factors on the effective transport properties. J. Power Source 2013, 242, 179–194. [Google Scholar] [CrossRef]
- Jiao, Z.; Shikazono, N.; Kasagi, N. Quantitative Characterization of SOFC Nickel-YSZ Anode Microstructure Degradation Based on Focused-Ion-Beam 3D-Reconstruction Technique. J. Electrochem. Soc. 2012, 159, B285–B291. [Google Scholar] [CrossRef]
- Wilson, J.R.; Kobsiriphat, W.; Mendoza, R.; Chen, H.-Y.; Hiller, J.M.; Miller, D.J.; Thornton, K.; Voorhees, P.W.; Adler, S.B.; Barnett, S.A. Three-dimensional reconstruction of a solid-oxide fuel-cell anode. Nat. Mater. 2006, 5, 541–544. [Google Scholar] [CrossRef]
- Carraro, T.; Joos, J.; Rüger, B.; Weber, A.; Ivers-Tiffée, E. 3D finite element model for reconstructed mixed-conducting cathodes: II. Parameter sensitivity analysis. Electrochim. Acta 2012, 77, 309–314. [Google Scholar] [CrossRef]
- Joos, J.; Ender, M.; Rotscholl, I.; Menzler, N.H.; Ivers-Tiffée, E. Quantification of double-layer Ni/YSZ fuel cell anodes from focused ion beam tomography data. J. Power Source 2014, 246, 819–830. [Google Scholar] [CrossRef]
- Clague, R.; Shearing, P.; Lee, P.; Zhang, Z.; Brett, D.; Marquis, A.; Brandon, N. Stress analysis of solid oxide fuel cell anode microstructure reconstructed from focused ion beam tomography. J. Power Source 2011, 196, 9018–9021. [Google Scholar] [CrossRef]
- Celik, S.; Ibrahimoglu, B.; Toros, S.; Mat, M.D. Three dimensional stress analysis of solid oxide fuel cell anode micro structure. Int. J. Hydrogen Energy 2014, 39, 19119–19131. [Google Scholar] [CrossRef]
- Xiang, Y.; Da, Y.; Zhong, Z.; Shikazono, N.; Jiao, Z. Thermo-mechanical stress analyses of solid oxide fuel cell anode based on three-dimensional microstructure reconstruction. Int. J. Hydrogen Energy 2020, 45, 19791–19800. [Google Scholar] [CrossRef]
- Joos, J. Microstructural Characterisation, Modelling and Simulation of Solid Oxide Fuel Cell Cathodes; Karlsruhe Institut für Technologie: Karlsruhe, Germany, 2015. [Google Scholar]
- Rüger, B.; Joos, J.; Weber, A.; Carraro, T.; Ivers-Tiffée, E. 3D Electrode Microstructure Reconstruction and Modelling. ECS Trans. 2009, 25, 1211–1220. [Google Scholar] [CrossRef]
- Shearing, P.; Golbert, J.; Chater, R.; Brandon, N. 3D reconstruction of SOFC anodes using a focused ion beam lift-out technique. Chem. Eng. Sci. 2009, 64, 3928–3933. [Google Scholar] [CrossRef]
- Coddet, P.; Liao, H.L.; Coddet, C. A review on high power SOFC electrolyte layer manufacturing using thermal spray and physical vapour deposition technologies. Adv. Manuf. 2014, 2, 212–221. [Google Scholar] [CrossRef]
- Tanhaei, M.; Mozammel, M. Yttria-stabilized zirconia thin film electrolyte deposited by EB-PVD on porous anode support for SOFC applications. Ceram. Int. 2017, 43, 3035–3042. [Google Scholar] [CrossRef]
- Teixeira, V. Mechanical integrity in PVD coatings due to the presence of residual stresses. Thin Solid Films 2001, 392, 276–281. [Google Scholar] [CrossRef]
- Sarantaridis, D.; Atkinson, A. Redox Cycling of Ni-Based Solid Oxide Fuel Cell Anodes: A Review. Fuel Cells 2007, 7, 246–258. [Google Scholar] [CrossRef]
- Farraro, R.; McLellan, R.B. Temperature dependence of the Young’s modulus and shear modulus of pure nickel, platinum, and molybdenum. Met. Mater. Trans. A 1977, 8, 1563–1565. [Google Scholar] [CrossRef]
- Mori, M.; Yamamoto, T.; Itoh, H.; Inaba, H.; Tagawa, H. Thermal Expansion of Nickel-Zirconia Anodes in Solid Oxide Fuel Cells during Fabrication and Operation. J. Electrochem. Soc. 1998, 145, 1374–1381. [Google Scholar] [CrossRef]
- Gao, L.; Wei, L.; Guo, H.; Gong, S.; Xu, H. Deposition mechanisms of yttria-stabilized zirconia coatings during plasma spray physical vapor deposition. Ceram. Int. 2016, 42, 5530–5536. [Google Scholar] [CrossRef]
- Vasechko, V. Thermo-Mechanical Investigations of Reoxidation-Stable Material Concepts for Solid Oxide Fuel Cells; Rheinisch-Westfälischen Technischen Hochschule Aachen: Aachen, Germany, 2014. [Google Scholar]
- Touloukian, Y.S.; Kirby, R.K.; Taylor, R.E.; Desai, P.D. Thermophysical Properties of Matter—The TPRC Data Series. Therm. Expans. Met. Elem. Alloys 1975, 12, 1150. [Google Scholar] [CrossRef]
- Bause, T. Thermomechanische Eigenschaften und Schädigungsverhalten Keramischer Werkstoffverbunde in der Hochtemperaturbrennstoffzelle; RWTH Aachen: Aachen, Germany, 2012. [Google Scholar]
- Bae, G.; Xiong, Y.; Kumar, S.; Kang, K.; Lee, C. General aspects of interface bonding in kinetic sprayed coatings. Acta Mater. 2008, 56, 4858–4868. [Google Scholar] [CrossRef]
- Dassault Systèmes Simulia. Abaqus 6.13; Dassault Systèmes Simulia: Providence, RI, USA, 2013. [Google Scholar]
- Ribeiro, J.; Santiago, A.; Rigueiro, C. Damage model calibration and application for S355 steel. Procedia Struct. Integr. 2016, 2, 656–663. [Google Scholar] [CrossRef]
- Erice, B.; Perez-Martin, M.J.; Gálvez, F. An experimental and numerical study of ductile failure under quasi-static and impact loadings of Inconel 718 nickel-base superalloy. Int. J. Impact Eng. 2014, 69, 11–24. [Google Scholar] [CrossRef]
- Hillerborg, A.; Modéer, M.; Petersson, P.-E. Analysis of crack formation and crack growth in concrete by means of fracture mechanics and finite elements. Cem. Concr. Res. 1976, 6, 773–781. [Google Scholar] [CrossRef]
- Hillerborg, A. RILEM Technical Committees, the theoretical basis of a method to determine the fracture energy GF of concrete. Mater. Struct. 1985, 18, 291–296. [Google Scholar] [CrossRef]
- Kumar, A.N.; Sørensen, B.F. Fracture energy and crack growth in surface treated Yttria stabilized Zirconia for SOFC applications. Mater. Sci. Eng. A 2002, 333, 380–389. [Google Scholar] [CrossRef]
- Kondoh, J.; Shiota, H.; Kawachi, K.; Nakatani, T. Yttria concentration dependence of tensile strength in yttria-stabilized zirconia. J. Alloys Compd. 2004, 365, 253–258. [Google Scholar] [CrossRef]
- Salmang, S.H.; Scholze, H. Keramik, 7th ed.; Springer: Berlin/Heidelberg, Germany, 2007. [Google Scholar]
- Radovic, M.; Lara-Curzio, E. Mechanical properties of tape cast nickel-based anode materials for solid oxide fuel cells before and after reduction in hydrogen. Acta Mater. 2004, 52, 5747–5756. [Google Scholar] [CrossRef]
- Faes, A.; Frandsen, H.L.; Pihlatie, M.; Kaiser, A.; Goldstein, D.R. Curvature and Strength of Ni-YSZ Solid Oxide Half-Cells After Redox Treatments. J. Fuel Cell Sci. Technol. 2010, 7, 051011. [Google Scholar] [CrossRef]
- Irwin, G.R. Analysis of Stresses and Strains Near the End of a Crack Traversing a Plate. J. Appl. Mech. 1957, 24, 361–364. [Google Scholar] [CrossRef]
Figure 1.
Scheme of FIB/SEM setting (
a), FIB slicing process (
b), adapted with permission from Shearing [
22] and Iwai et al. [
7]. 2021 Elsevier.
Figure 1.
Scheme of FIB/SEM setting (
a), FIB slicing process (
b), adapted with permission from Shearing [
22] and Iwai et al. [
7]. 2021 Elsevier.
Figure 2.
Stacking of SEM images with a spacing in the z direction of 40 nm (a) and 3D reconstruction of the anode, 8YSZ: light blue, Ni: red (b).
Figure 2.
Stacking of SEM images with a spacing in the z direction of 40 nm (a) and 3D reconstruction of the anode, 8YSZ: light blue, Ni: red (b).
Figure 3.
Artefacts during image processing highlighted in yellow (a) and after using cleaning procedure (b).
Figure 3.
Artefacts during image processing highlighted in yellow (a) and after using cleaning procedure (b).
Figure 4.
Model generation with various volume fractions, 8YSZ: light blue, Ni: red. Naming convention of analysed samples (top), selected models, and their corresponding discretisation (bottom).
Figure 4.
Model generation with various volume fractions, 8YSZ: light blue, Ni: red. Naming convention of analysed samples (top), selected models, and their corresponding discretisation (bottom).
Figure 5.
Assembly, boundary conditions, and constraints for compression tests.
Figure 5.
Assembly, boundary conditions, and constraints for compression tests.
Figure 6.
Stress–strain curves after compression test in the x direction with associated damage evolution of Anode15 (a), crack initiation and damage propagation (b), stress–strain curves after compression test in the y direction (c) and in z direction (d).
Figure 6.
Stress–strain curves after compression test in the x direction with associated damage evolution of Anode15 (a), crack initiation and damage propagation (b), stress–strain curves after compression test in the y direction (c) and in z direction (d).
Figure 7.
Resulting crack pattern in the simulation of Anode5 (a), Anode37 (b), and Anode16 (c) from loading in the x direction and crack pattern of Anode16 from loading in the z direction (d), 8YSZ: light blue, Ni: red.
Figure 7.
Resulting crack pattern in the simulation of Anode5 (a), Anode37 (b), and Anode16 (c) from loading in the x direction and crack pattern of Anode16 from loading in the z direction (d), 8YSZ: light blue, Ni: red.
Figure 8.
Linearised Weibull plots of the compression test results.
Figure 8.
Linearised Weibull plots of the compression test results.
Table 1.
List of volume fractions of Ni, YSZ, and pores, published in the literature.
Table 1.
List of volume fractions of Ni, YSZ, and pores, published in the literature.
| Author | Ni
[Vol %] | YSZ
[Vol %] | Porosity
[Vol %] | Ni
Total Solids
[Vol %] | YSZ
Total Solids
[Vol %] |
|---|
| Simwonis et al. [10] | 24.0 | 36.0 | 40.0 | 40.0 | 60.0 |
| Vivet et al. [11] | 26.0 | 33.0 | 41.0 | 44.1 | 55.9 |
| Iwai et al. [7] | 27.4 | 25.1 | 47.5 | 52.2 | 47.8 |
| 25.3 | 25.1 | 49.6 | 50.2 | 49.8 |
| 24.5 | 26.0 | 49.5 | 48.5 | 51.5 |
| Holzer et al. [12] | 32.0 | 43.0 | 29.0 | 42.7 | 57.3 |
| Jiao et al. [13] | 22.2 | 35.4 | 42.4 | 38.6 | 61.4 |
Table 2.
Volume fractions of the models for this study.
Table 2.
Volume fractions of the models for this study.
| Sample No. | Anode5 | Anode8 | Anode15 | Anode16 | Anode37 |
|---|
| Porosity p in % | 56 | 34 | 34 | 32 | 34 |
| Volume fraction Ni in % | 66 | 66 | 50 | 21 | 78 |
| Volume fraction 8YSZ in % | 34 | 34 | 50 | 79 | 22 |
Table 3.
General material properties of 8YSZ and Ni at RT used in the FE model. Adapted with permission from [
26]. 2021 Wiley. [
28,
33]. 2021 Elsevier.
Table 3.
General material properties of 8YSZ and Ni at RT used in the FE model. Adapted with permission from [
26]. 2021 Wiley. [
28,
33]. 2021 Elsevier.
| Material | 8YSZ | Nickel |
|---|
| Density ρ × 10−18 in t µm−3 | 5.9 | 8.9 |
| Young’s modulus E in GPa | 206 | 240 |
| Poisson’s ratio ν | 0.29 | 0.31 |
| Thermal expansion coefficient α × 10−6 in K−1 | 8.7 | 13.4 |
Table 4.
Johnson–Cook parameters for metal plasticity of nickel. Adapted with permission from [
33]. 2021 Elsevier.
Table 4.
Johnson–Cook parameters for metal plasticity of nickel. Adapted with permission from [
33]. 2021 Elsevier.
| A in GPa | B in GPa | C | n | m | Tm in K | T0 in K | |
|---|
| 0.163 | 0.648 | 0.006 | 0.33 | 1.44 | 1726 | 298 | 1 |
Table 5.
Johnson–Cook failure parameter for the Ni alloy Inconel. Adapted with permission from [
36]. 2021 Elsevier.
Table 5.
Johnson–Cook failure parameter for the Ni alloy Inconel. Adapted with permission from [
36]. 2021 Elsevier.
| D1 | D2 | D3 | D4 | D5 |
|---|
| 0.04 | 0.75 | −1.45 | 0.04 | 0.89 |
Table 6.
Critical energy release rate and fracture stress at room temperature of 8YSZ for fracture energy cracking criterion.
Table 6.
Critical energy release rate and fracture stress at room temperature of 8YSZ for fracture energy cracking criterion.
| Critical energy release rate GIc × 10−3 in nJ µm−2 | 3.47 [39] |
| Fracture stress σf in GPa | 0.212 [40] |
Table 7.
Young’s modulus and compressive strength of the samples in the x, y, and z direction.
Table 7.
Young’s modulus and compressive strength of the samples in the x, y, and z direction.
| Model | Direction | Young’s Modulus
in GPa | Compressive Strength
in MPa |
|---|
| Anode5 | x | 30.7 | 24.8 |
| y | 49.7 | 45.7 |
| z | 34.4 | 26.0 |
| Anode8 | x | 94.5 | 81.1 |
| y | 89.5 | 89.4 |
| z | 109.1 | 97.0 |
| Anode15 | x | 107.9 | 112.6 |
| y | 94.8 | 117.2 |
| z | 125.3 | 144.7 |
| Anode16 | x | 55.2 | 40.8 |
| y | 107.1 | 139.9 |
| z | 115.1 | 156.3 |
| Anode37 | x | 142.3 | 122.4 |
| y | 122.3 | 108.9 |
| z | 101.3 | 90.0 |
Table 8.
Weibull modulus and Weibull strength for compression test obtained by the linearised form of the probability density function.
Table 8.
Weibull modulus and Weibull strength for compression test obtained by the linearised form of the probability density function.
| Weibull Plot | Weibull Modulus m | Weibull Strength σ0 in MPa | Goodness of Fit, R2 |
|---|
| original | 2.0 | 107.6 | 0.9268 |
| modified | 5.5 | 124.0 | 0.926 |
Table 9.
Average energy release rates and stress intensity factor KI.
Table 9.
Average energy release rates and stress intensity factor KI.
| Model | Energy Release Rate
in J m−2 | Stress Intensity Factor
Plane Stress Condition
in MPa m1/2 | Stress Intensity Factor
Plane Strain Condition
in MPa m1/2 |
|---|
| Anode5 | 14.26 | 0.73 | 0.77 |
| Anode8 | 68.23 | 2.56 | 2.69 |
| Anode15 | 87.33 | 3.07 | 3.22 |
| Anode16 | 48.43 | 2.09 | 2.20 |
| Anode37 | 68.87 | 2.87 | 3.01 |
| Publisher’s Note: MDPI stays neutral with regard to jurisdictional claims in published maps and institutional affiliations. |
© 2021 by the authors. Licensee MDPI, Basel, Switzerland. This article is an open access article distributed under the terms and conditions of the Creative Commons Attribution (CC BY) license (https://creativecommons.org/licenses/by/4.0/).


