Article

Effect of Climate Change and Occupant Behaviour on the Environmental Impact of the Heating and Cooling Systems of a Real Apartment. A Parametric Study through Life Cycle Assessment

1
Department of Environmental Engineering, University of Calabria, 87036 Rende, Italy
2
Department of Civil Engineering, University of Minho, 4800-058 Guimarães, Portugal
3
GREiA Research Group, Universitat de Lleida, 25001 Lleida, Spain
*
Authors to whom correspondence should be addressed.
Energies 2021, 14(24), 8356; https://doi.org/10.3390/en14248356
Submission received: 2 November 2021 / Revised: 1 December 2021 / Accepted: 9 December 2021 / Published: 11 December 2021

Abstract

:
Climate change has a strong influence on the energy consumption of buildings, affecting both the heating and cooling demand in the actual and future scenario. In this paper, a life cycle assessment (LCA) was performed to evaluate the influence of both the occupant behaviour and the climate change on the environmental impact of the heating and cooling systems of an apartment located in southern Italy. The analysis was conducted using IPCC GWP and ReCiPe indicators as well as the Ecoinvent database. The influence of occupant behaviour was included in the analysis considering different usage profiles during the operational phase, while the effect of climate change was considered by varying the weather file every thirty years. The adoption of the real usage profiles showed that the impact of the systems was highly influenced by the occupant behaviour. In particular, the environmental impact of the heating system appeared more influenced by the operation hours, while that of the cooling system was more affected by the natural ventilation schedules. Furthermore, the influence of climate change demonstrated that more attention has to be dedicated to the cooling demand that in the future years will play an ever-greater role in the energy consumption of buildings.

1. Introduction

According to the Sustainable Development Goals Report 2021 of United Nations [1], global efforts made so far were insufficient and there still is much progress to be made for reaching the objectives of Agenda 2030 [2]. Additionally, the authors of the Sixth Assessment Report of the Intergovernmental Panel on Climate Change pointed out that global warming of 1.5 and 2 °C will be exceeded during the twenty-first century unless significant actions are taken to reduce CO2 and other greenhouse gases (GHG) emissions in the coming decades [3].
At the European level, new ambitious targets were set with the European Green Deal [4] to reduce GHG emissions and becoming the first climate-neutral continent by 2050. Most of the European buildings present low energy performance and inefficient heating and cooling systems [5,6]. Thus, the building sector still constitutes an important issue to be addressed, being responsible for more than 40% of the worldwide energy consumption and 36% of global GHG [7,8,9,10].

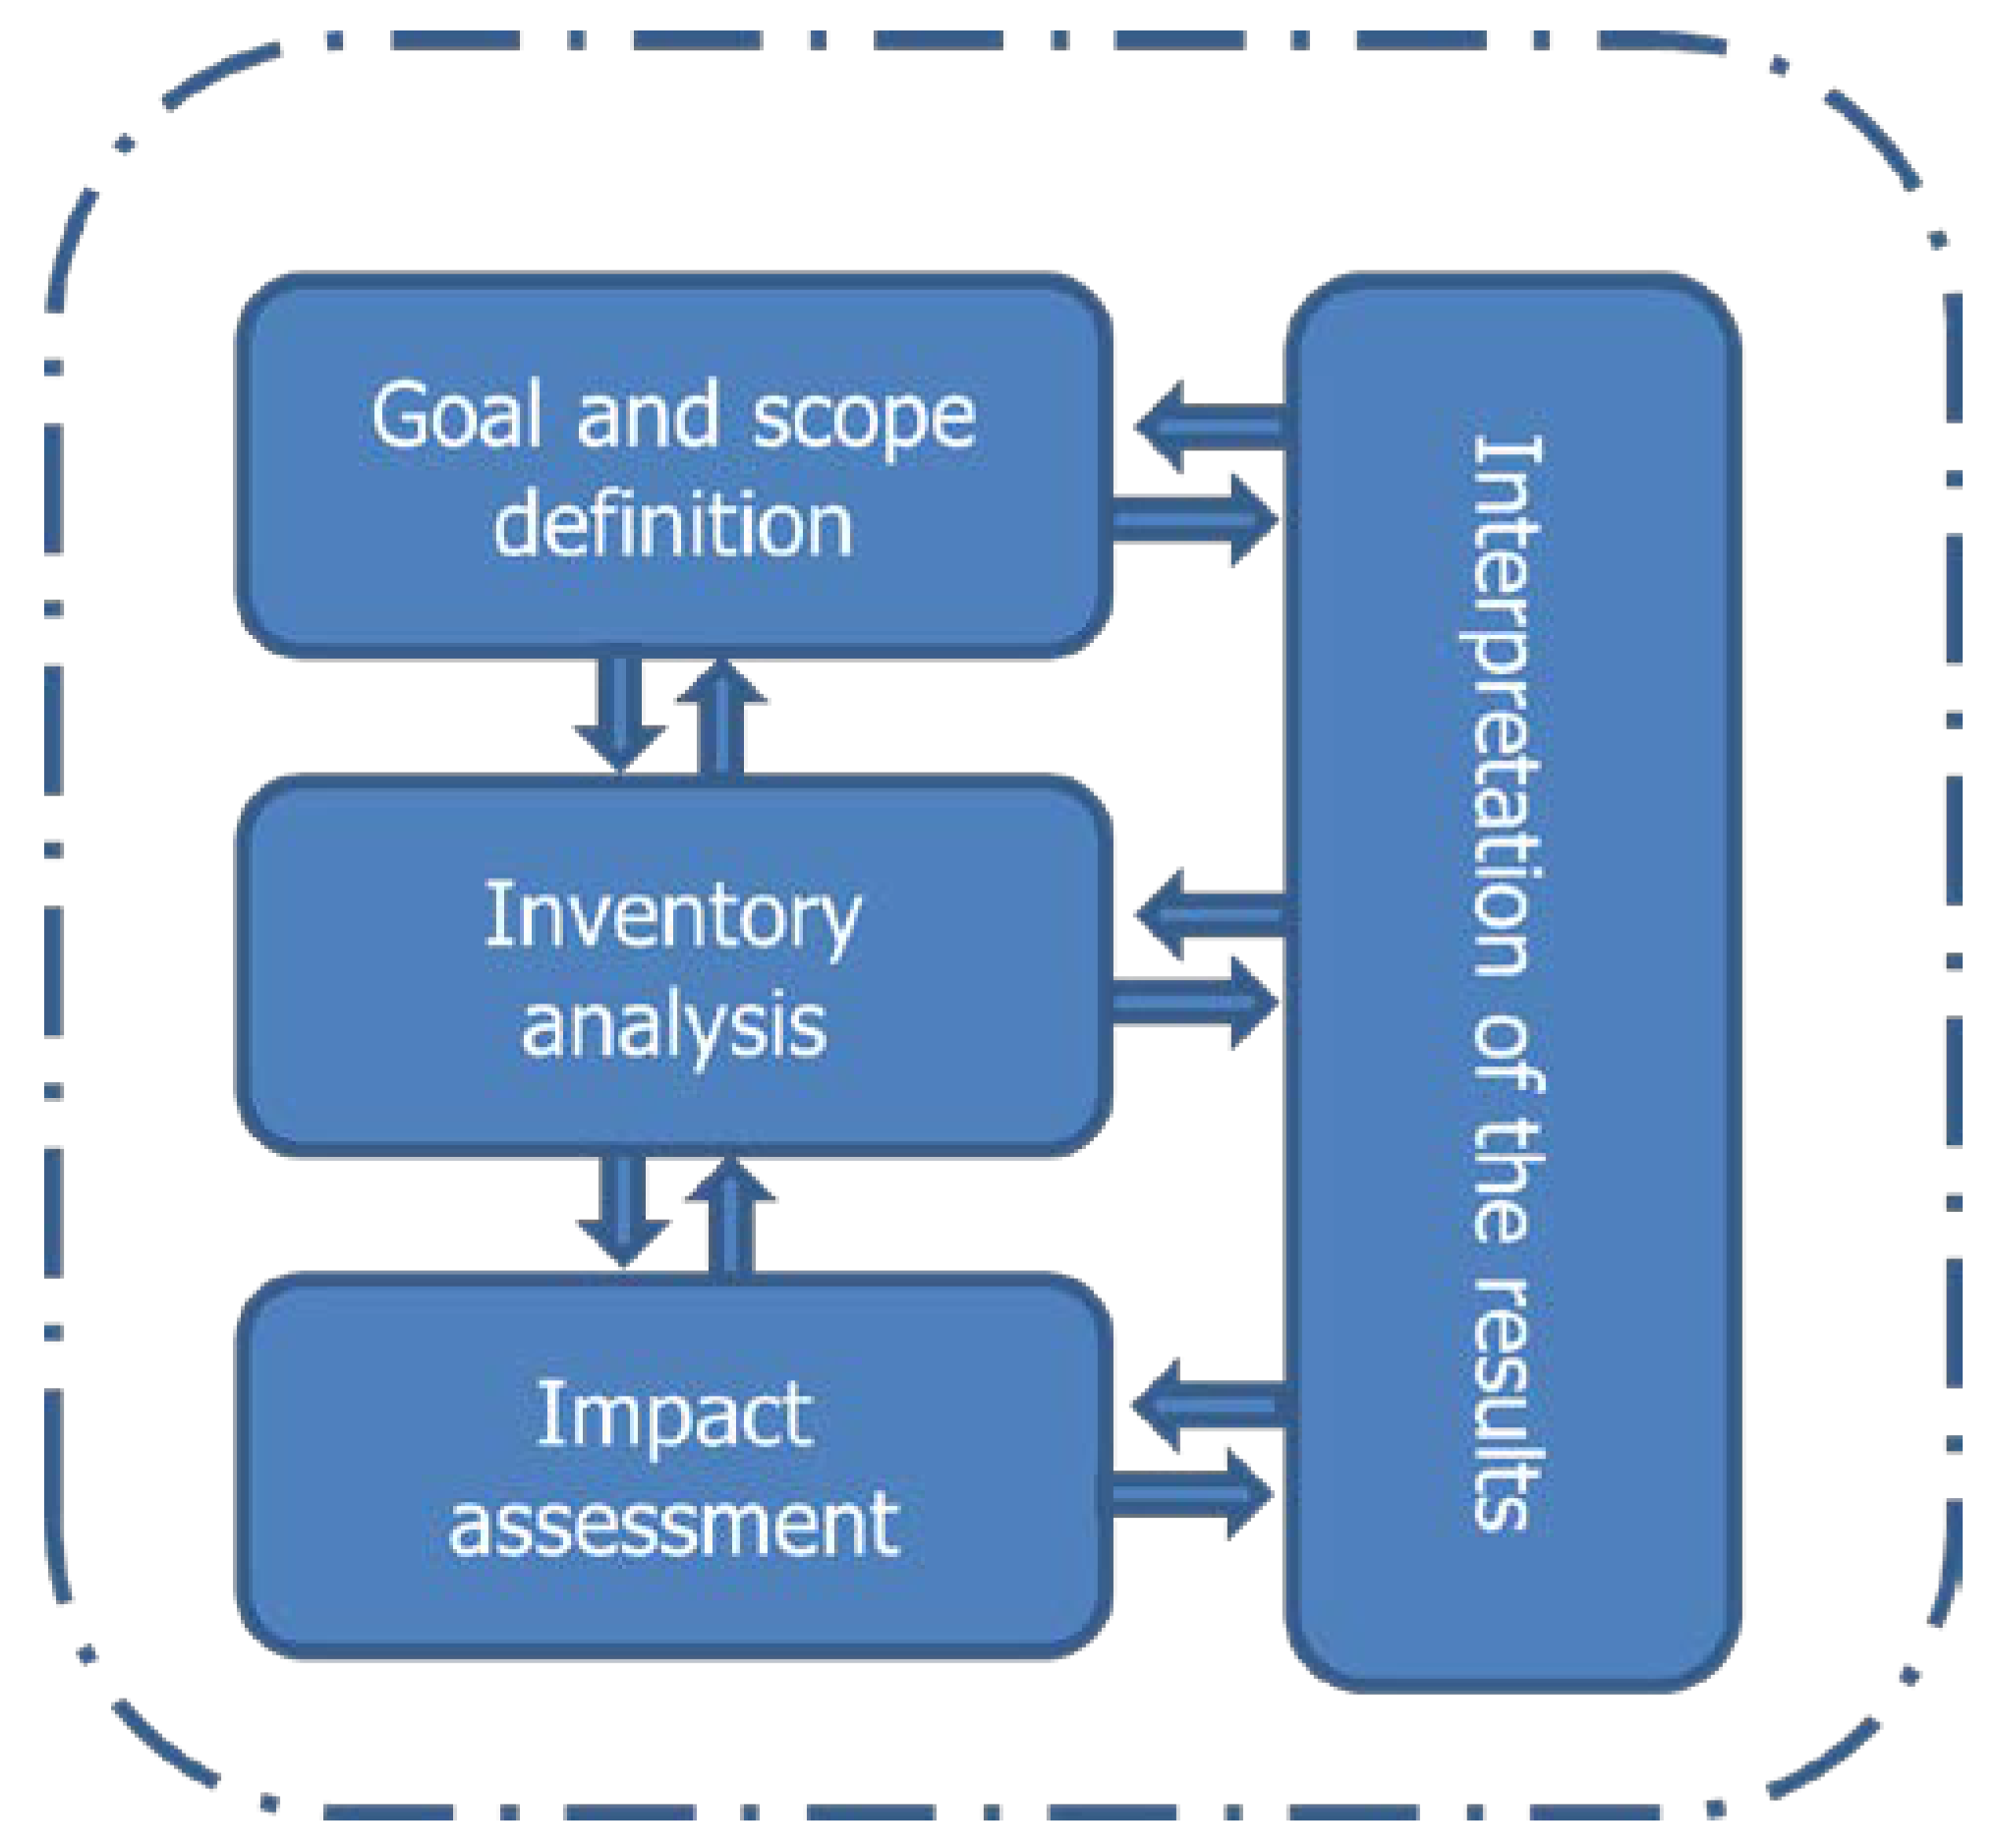
1.1. Life Cycle Assessment Applied to Buildings

Life cycle assessment (LCA) is a quantitative method widely known to assess the environmental impacts of products or systems.
The literature on LCA applications to buildings is very extensive, and there is broad agreement in recognizing the importance of the operational stage during the entire cycle of the buildings. Ramesh et al. [11] reviewed 73 buildings across 13 countries and showed that the operational stage is responsible for around 80–90% of the life cycle energy demand of buildings. Similar results were obtained for the Italian context by Asdrubali et al. [12] that assessed to 77% the contribution of the operational stage in the case of detached houses, and up to 85% for office buildings. Sartori and Hestnes [13] analysed the results of 60 LCA of buildings found in the literature highlighting that there is a linear regression between their operational and total energy. Furthermore, a review conducted by Cabeza et al. [14] reported that most of the LCAs are conducted for buildings designed and constructed as low-energy buildings while the percentage of LCA for traditional buildings is lower.
Different authors focused the attention to the environmental impact of the heating and cooling systems because they are the most responsible for emissions during the entire life cycle of a house [15].
Vignali [16] conducted a comparison of the environmental impact of a traditional gas boiler and a condensing gas boiler in three Italian cities obtaining that the impact of the condensing boiler is 23% on average lower than that of the traditional boiler. Additionally, the operational stage of both the systems was responsible, on average, for more than 90% of the total impact. Greening and Azapagic [17] compared the life cycle environmental impacts of domestic heat pumps (air, ground, and water-source) and a gas boiler for the UK context. The impact of the heat pumps was always higher than that of the gas boiler due to the use of electricity. The results showed that the total impact of heat pumps could decrease as the percentage of renewable energy sources in the UK electricity mix increases, while still exceeding the impact of the gas boiler. Llantoy et al. [18] performed an LCA for a lifespan of 30 years to compare the environmental impact of an innovative hybrid energy storage system for heating and domestic hot water production in continental climates with the environmental impact of a traditional system. The results of the analysis, performed through the ReCiPe and the IPCC global warming potential GWP indicators, showed that the total impact of the innovative hybrid energy storage system was lower than the reference one. Zsembinszki et al. [19] compared the environmental performance of an innovative compact hybrid electrical-thermal storage system and a traditional system for cooling, heating, and domestic hot water production in the Mediterranean context. The authors obtained a relevant reduction in energy consumption during the operational stage with the innovative system, despite the environmental impact during its entire life cycle (30-years lifespan) being almost double than that of the traditional system. Shah et al. [15] likened the life cycle impact of three heating and cooling systems (warm-air furnace and air conditioning, hot water boiler and air conditioning, and air–air heat pump) in four cities of the USA considering a lifespan of 35 years. In general, the impact of the heat pump was always higher than that of other systems in a percentage strictly related to the diverse energy mix of the four considered cities. Similar results were obtained by Karkour et al. [20] that performed an LCA to assess the impact of residential air conditioners in Indonesia. The results suggested that the impacts are strongly dependent on the energy mix of the country but could be reduced with diverse solutions, such as introducing refrigerants with low global warming impact and encouraging the recycling of units.

1.2. Problems Related to Climate Change

Among all the mentioned studies, it can be noticed that the attention was mainly focused on the energy demand of buildings by considering the same climatic scenario and the impact of climate change was usually neglected. However, climate change is currently recognized as the most important and critical challenge to mankind globally [21]. Nowadays, just because of climate change, buildings are facing new climatic conditions for which they were not designed [22]. Thus, the impact of climate change on the energy performance of buildings and the environmental impact of the heating and cooling systems cannot be undervalued [23].
For example, Tootkaboni et al. [24] analysed the impact of climate change on the future energy performance of residential buildings in the most populated Italian climate zone. The authors found a decrease of around 30.9% of the heating energy demand and a significant increase in cooling demand up to 255.1%. Similar conclusions were reached by Ciancio et al. [25] that, simulating the energy performance of a building located in three European cities, assessed for 2080 a reduction of the heating energy demand from 36% to 80% and an increase of cooling energy needs from 142% to 2316%. The authors in [26] assessed the influence of climate change on the heating and cooling energy demand of different building prototypes located in Toronto. By 2070, they estimated an average decrease of 18–33% for heating energy use and an average increase of 15–126% for cooling energy use.
Regarding the effect of climate change on the environmental impact of the cooling system in residential buildings of Qatar, Andric and Al-Ghamdi [27] prevised an augmentation of the CO2 emissions as well as more consumptions of water and fossil fuel, and an increase of the impact on the already strained local marine ecosystem due to the increase of the energy demand for cooling.

1.3. Problems Related to Occupant Behaviour

Another aspect usually overlooked in the studies on LCA is occupant behaviour, whose influence on the energy performance of buildings, and specifically on the heating and cooling systems, is well known [28,29]. Moreover, the AR5 report of the Intergovernmental Panel on Climate Change (IPCC) [30] highlighted that occupant behaviour, such as different thermal control of the indoor environment and natural ventilation usages, determines factors of differences from 3 to 10 worldwide in residential energy use, also in similar dwellings. The literature focused on understanding how people use a space and how their behaviour influences the energy performance of the buildings increased in the last decades [31]. For example, a recent study [32] investigated the impact of occupant behaviour on heating energy consumption and indoor temperature in residential buildings finding that there were outstanding differences in the resulting energy consumption and in the percentage of time in which thermal comfort conditions were met for the different user scenarios.
Fajilla et al. [33] introduced a novelty by analysing the influence of both occupant behaviour and climate change on the energy performance of buildings. The authors showed how the occupant preferences through the control of heating, cooling systems, and natural ventilation impact the energy needs, and how climate change can amplify this impact.
Now, however, a step forward is needed to understand how people influence the environmental impact of the heating and cooling systems.
In fact, despite the importance of the operational stage, it seems that not enough efforts were dedicated to analysing how occupants’ behaviour influences the environmental performance of these systems, and the literature in this field is very scarce.
For example, Su et al. [34] performed an LCA to assess the environmental performance of the cooling and heating systems among different houses in China focusing on the families dimension and the age of families’ members. The results showed that the larger households, and the families with elderly people or children are more likely to have a higher environmental impact due to the higher cooling and heating demand. The authors highlighted the importance of carrying out further studies to better address the influence of occupant behaviour.
Negishi et al. [35] proposed a framework for a dynamic LCA applied to building systems to discover the influence of the parameters time variation of the building systems such as occupant behaviour, technical performance degradations of the systems, and the variation in the energy mix. Results suggested the need for further investigation for a deeper understanding of the influence of occupant behaviour. Su et al. [36] came to similar conclusions and pointed out that traditional LCA methods have two drawbacks consisting in not considering the time variance of parameters over the entire life cycle of the buildings (e.g., climate), and the behaviours of occupants.

1.4. Aim and Objectives of the Study

As emerged from the literature review, the operational stage is the most influencing phase during an LCA of heating and cooling systems or of an entire building. Despite the importance of this stage, it was generally treated with a standard approach and not all influencing factors were investigated. The common procedure of conducting an LCA analysis was to examine the operational stage of the systems considering usage profiles suggested by national standards, with a consequent underestimation of the impact of occupant behaviour [37]. Moreover, the simulation of energy consumption was usually conducted by not considering climatic scenarios, overlooking the effect of climate change that will cause a decrease in the heating energy demand and an increase in the cooling energy demand [25,26]. To fill this gap in the literature, the aim of this study lies in to jointly analyse the effect of occupant behaviour and climate change on the environmental impact of the heating and cooling systems through an LCA analysis. The influence of occupant behaviour and climate change on the energy performance of buildings was already investigated in the literature, but the influence of both these two factors in an LCA analysis has been never explored. This combined investigation is the main novelty of the paper, especially in the study of the environmental impact of heating and cooling systems.
More in detail, chosen an existing building as a case study with heating and cooling systems installed, an environmental analysis is performed by comparing the results obtained conducting firstly an LCA including the influence of occupant behaviour, and secondly an LCA that considers both occupant behaviour and climate change. To achieve these objectives, the paper aims to answer these research questions:
  • RQ1: How does occupants behaviour affect the environmental impact of heating and cooling systems’ operation phase?
  • RQ2: Can occupants behaviour mitigate or amplify the effect of climate change on the total environmental impact of heating and cooling systems? In addition, vice versa?
The approach used in the investigation wants to highlight the importance of considering new and actual variables in the energy simulation and environmental impact evaluation of building systems. In particular, the environmental impacts of heating and cooling systems are analysed by considering the occupant behaviour to bring the evaluations closer to the reality, and climate change to test the validity of technical solutions in future contexts. The findings of this proposed approach could provide new insights to scientists and practitioners for the improvement of design criteria, and also to policymakers for future regulations.

2. Methods

2.1. Case Study

The heating and cooling systems of an apartment located at Rende (Southern Italy), characterized by Mediterranean climate conditions and defined as “Csa” according to the Köppen climate classification [38], were considered for the study. The heating system consists of an autonomous 24 kW wall-mounted gas boiler that works with natural gas. The cooling system is composed of two heat pumps installed in the living room and the bedrooms with a design capacity of 4 kW and 6 kW, respectively.
The apartment has a gross floor area of 80 m2 and is located on the second floor of a six-story building built in 2008. The rooms of the apartment are south and west facing, with a floor-to-ceiling height equal to 2.7 m and a window-to-wall ratio of 30%. The structure of the building is reinforced concrete, while the external walls (U-value of 0.6 W/m2·K) are made of double hollow bricklayers with an internal air gap partially filled with expanded polystyrene. The windows consist of double glazing and a frame with thermal break (U-value 2.72 W/m2·K). The horizontal and vertical overhangs were modelled using standard component blocks considered by the software in shading calculation. Upstairs there is an adiabatic block where there is another heated apartment, while downstairs there is an unconditioned thermal zone. Three thermal zones (living area, bedrooms, and bathrooms) were considered, and the characteristic parameters were changed in terms of management of the heating and cooling systems, as both activation period and setpoint temperature, and ventilation hourly profiles. The internal heat loads (φint) were determined through the following relation provided by the Standard UNI/TS 11300-1 [39]:
ϕ i n t = 7.987   A f     0.0353   A f 2
where Af is the usable floor area of the house [m2]. The calculated value amounts to 5.56 W/m2 and groups all contributions of occupancy, miscellaneous equipment, catering process, and lighting.
The calibration of the building model was verified in previous work [40] according to the ASHRAE Guideline 14-2002 [41] through the Normalized Mean Bias Error (NMBE) and the Coefficient of Variation of the Root Mean Square Error (CVRMSE). Errors lower than the limit values were obtained for both metrics (NMBE < 5%, CVRMSE < 15%).

2.2. Energy Simulations

Typical hourly profiles of heating (h1, h2, and h3), natural ventilation in winter (v1, v2, and v3), cooling (c1, c2, and c3), and natural ventilation in summer (v4, v5, and v6) were obtained from a questionnaire survey [33]. The profiles are summarised in Table 1 and shown in Table 2, Table 3, Table 4 and Table 5.
More details about the schedules can be found in a previous work published by the authors [33]. By combining these usage schedules, nine profiles for the heating (h1v1, h1v2, h1v3, h2v1, h2v2, h2v3, h3v1, h3v2, and h3v3) and cooling (c1v4, c1v5, c1v6, c2v4, c2v5, c2v6, c3v4, c3v5, and c3v6) season were adopted to represent different occupants’ behaviour. Dynamic energy simulations were conducted for the heating season from 1 October to 30 April with a setpoint temperature of 20 °C, and for the cooling season from 1 May to 30 September with a setpoint temperature of 26 °C (Table 6). Further energy assessments were obtained by varying the heating and cooling setpoint temperatures of ±2 °C. The simulations were conducted through DesignBuilder (v. 6.1.6.008) [42] by using the METEONORM weather data [43] for the current climate (2020) and the data of future climate scenarios (2050 and 2080) obtained with the climate change world weather file generator (CCWorldWeatherGen) [44]. More in detail, CCWorldWeatherGen is a Microsoft Excel-based tool commonly used in this field [9,22,25,26,45] to obtain weather files for future scenarios. It implements the morphing procedure on the current weather file and provides weather files for future scenarios using outputs from the UK Hadley Centre Coupled Model (v.3, HadCM3) [46].

2.3. LCA Methodology

Life cycle assessment (LCA) is a tool widely common for assessing the environmental impact of a product, process, or system through its complete life cycle [47], including the manufacturing, operational, and disposal stage. The analysis was performed following the four main steps suggested by the ISO 14040 and 14044 guidelines [48,49], as shown in Figure 1.
The study was carried out through the indicators IPCC 2013 Global Warming Potential for long-term effect (GWP 100 a) and short-term effect (GWP 20 a), and ReCiPe extracted from the Ecoinvent 3.7.1 database [50] by considering data related to the European context. These two indicators were selected based on the evaluation made by the Joint Research Commission of European Union that indicated the GWP indicator as the only indicator representative for all midpoint models currently used in LCA studies [51], and the ReCiPe indicator as the best method for the European context in comparison with EPS2000, Eco-indicator 99, and IMPACT2002+ [52].

2.3.1. Goal and Scope Definition

The goal of the analysis was to assess if and how the occupants’ behaviour related to the use of the heating and cooling systems affects the environmental impact of these systems. Consistent with the aim of this paper, the cooling system was considered composed of a single heat pump with a design capacity of 10 kW. The details of the systems are given below in Table 7.
Since the reference building is the same in all cases, the study was focused on the systems (operational stage) and not on the building materials; thus, only the gas boiler and the heat pump available in Ecoinvent were included in the LCA study. Failure to consider the individual materials that constitute the systems is the cause of an error. On the other hand, this approximation is reported throughout the analysis and, since it is a comparison, the error is compensated. The lifetime of the entire analysis was assumed to be 90 years, while the lifespan and the number of replacements of each system during the 90 years were calculated according to the lifetime of the various systems. Conventionally, the LCAs of products or buildings are performed with a lifetime ranging from 30 to 50 years [12,18,19,53,54], without considering any external variations (e.g., climate change) to the system boundary that could alter the environmental impact of the systems or the buildings. Following the conventional methodology, the LCA for 90 years (hereinafter referred to as LCAb) was assessed by considering the same weather data for the entire period, as shown in Figure 2a. LCAb was considered as a benchmark to compare the results of the LCA proposed in this analysis.
This investigation was performed by considering the influence of both occupants’ behaviour and climate change by varying the weather data every 30 years. In the end, the LCA for the entire lifetime of 90 years (hereinafter referred to as LCAcc) was calculated as the sum of three contributions: LCA 1, LCA 2, and LCA 3, as shown in Figure 2b.
Based on previous studies carried out in this field [12,18,19,53], the functional unit of 1 m2 of usable floor area was adopted in this analysis. The scope of the study is from ‘cradle to grave’.

2.3.2. Life Cycle Inventory (LCI)

The life cycle inventory (LCI) is the phase of LCA destined to quantify all the inputs and outputs of a product system through its life cycle [48] and consists of three stages, manufacturing, operational, and end-of-life (disposal).
The inventory for the manufacturing stage of the systems is shown in Table 8. For both the gas boiler and heat pump, the disposal stage was included during the manufacturing stage.
The input data for the operational stage are the annual energy consumption for the heating and cooling systems shown in Table 6. The energy consumption of the heating and cooling systems was presented separately to consider the different impacts of electricity and natural gas.

2.3.3. Life Cycle Impact Assessment (LCIA)

The life cycle impact assessment (LCIA) is the phase of LCA in which the results of the LCI are associated with specific indicators to assess their potential environmental impacts [48]. Table 9 shows the LCIA during the manufacturing and disposal stage for both gas boiler and heat pump calculated with the GWP [kgCO2-eq/m2] and ReCiPe indicators [Impact point/m2]. It can be noticed that the impacts for LCAb and LCAcc during the manufacturing and disposal stage are the same.
The LCIA during the operational stage of the heating and cooling systems calculated with both LCAb and LCAcc is presented in Table 10 and Table 11.

3. Results and Discussion

The last step of the LCA, namely the interpretation of the results, is presented in this section.

3.1. Manufacturing and Disposal Stage

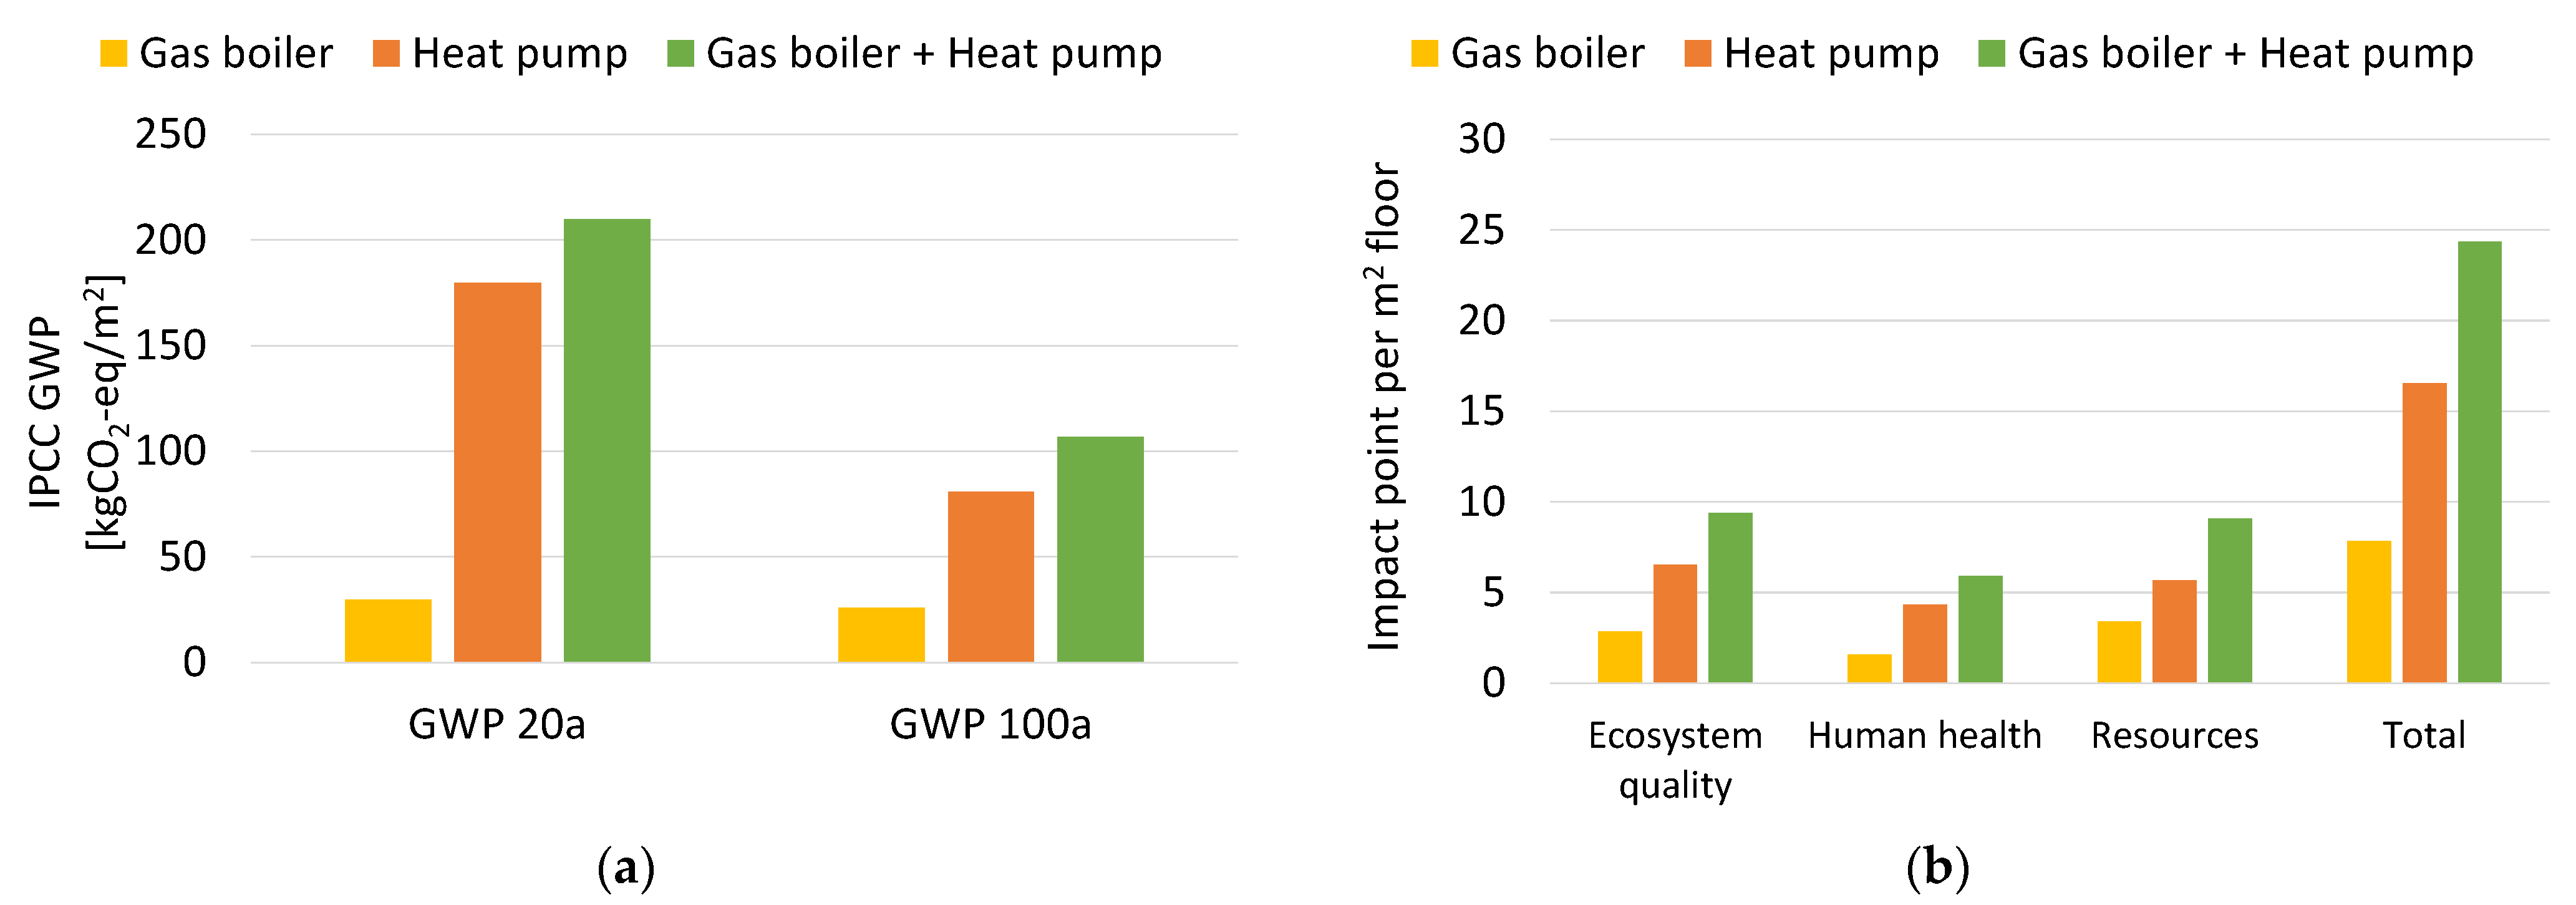
Figure 3 shows the impact of the gas boiler and the heat pump during the manufacturing and disposal stage calculated through the indicator IPPC GWP for short-term (GWP 20a) and long-term (GWP 100a) (Figure 3a), and the ReCiPe indicator (Figure 3b).
In general, the impact of the heat pump appears to be always higher than that of the gas boiler. It is in accordance with previous studies, such as [17,19]. In fact, the environmental impacts of the heat pump ranged from 180 kgCO2-eq/m2 (GWP 20a) to 81 kgCO2-eq/m2 (GWP 100a), far higher than those of the gas boiler that reached 30 kgCO2-eq/m2 for GWP 20 and 26 kgCO2-eq/m2 for GWP 100a. Regarding the ReCiPe indicator (Figure 4b), around 16 and 8 impact point/m2 were obtained for the heat pump and the gas boiler, respectively. More in detail, the impact of the heat pump mainly affects the ecosystem quality (around 7 impact point/m2), while the gas boiler has a higher impact in the category of resources with an environmental impact of around 3 impact point/m2. The higher damage of the heat pump to the ecosystem could be caused by the presence of refrigerant in the system. The heat pump found in the Ecoinvent database includes the R134a refrigerant that is one of the most damaging, by varying the typology of the refrigerant it could be possible reducing the impact of the heat pump [18]. Additionally, the damage due to the gas boiler may be reduced by decreasing the quantity of material used for manufacturing. The impacts obtained for the manufacturing and disposal stage are in line with the values of existing researches, e.g., [18,19].

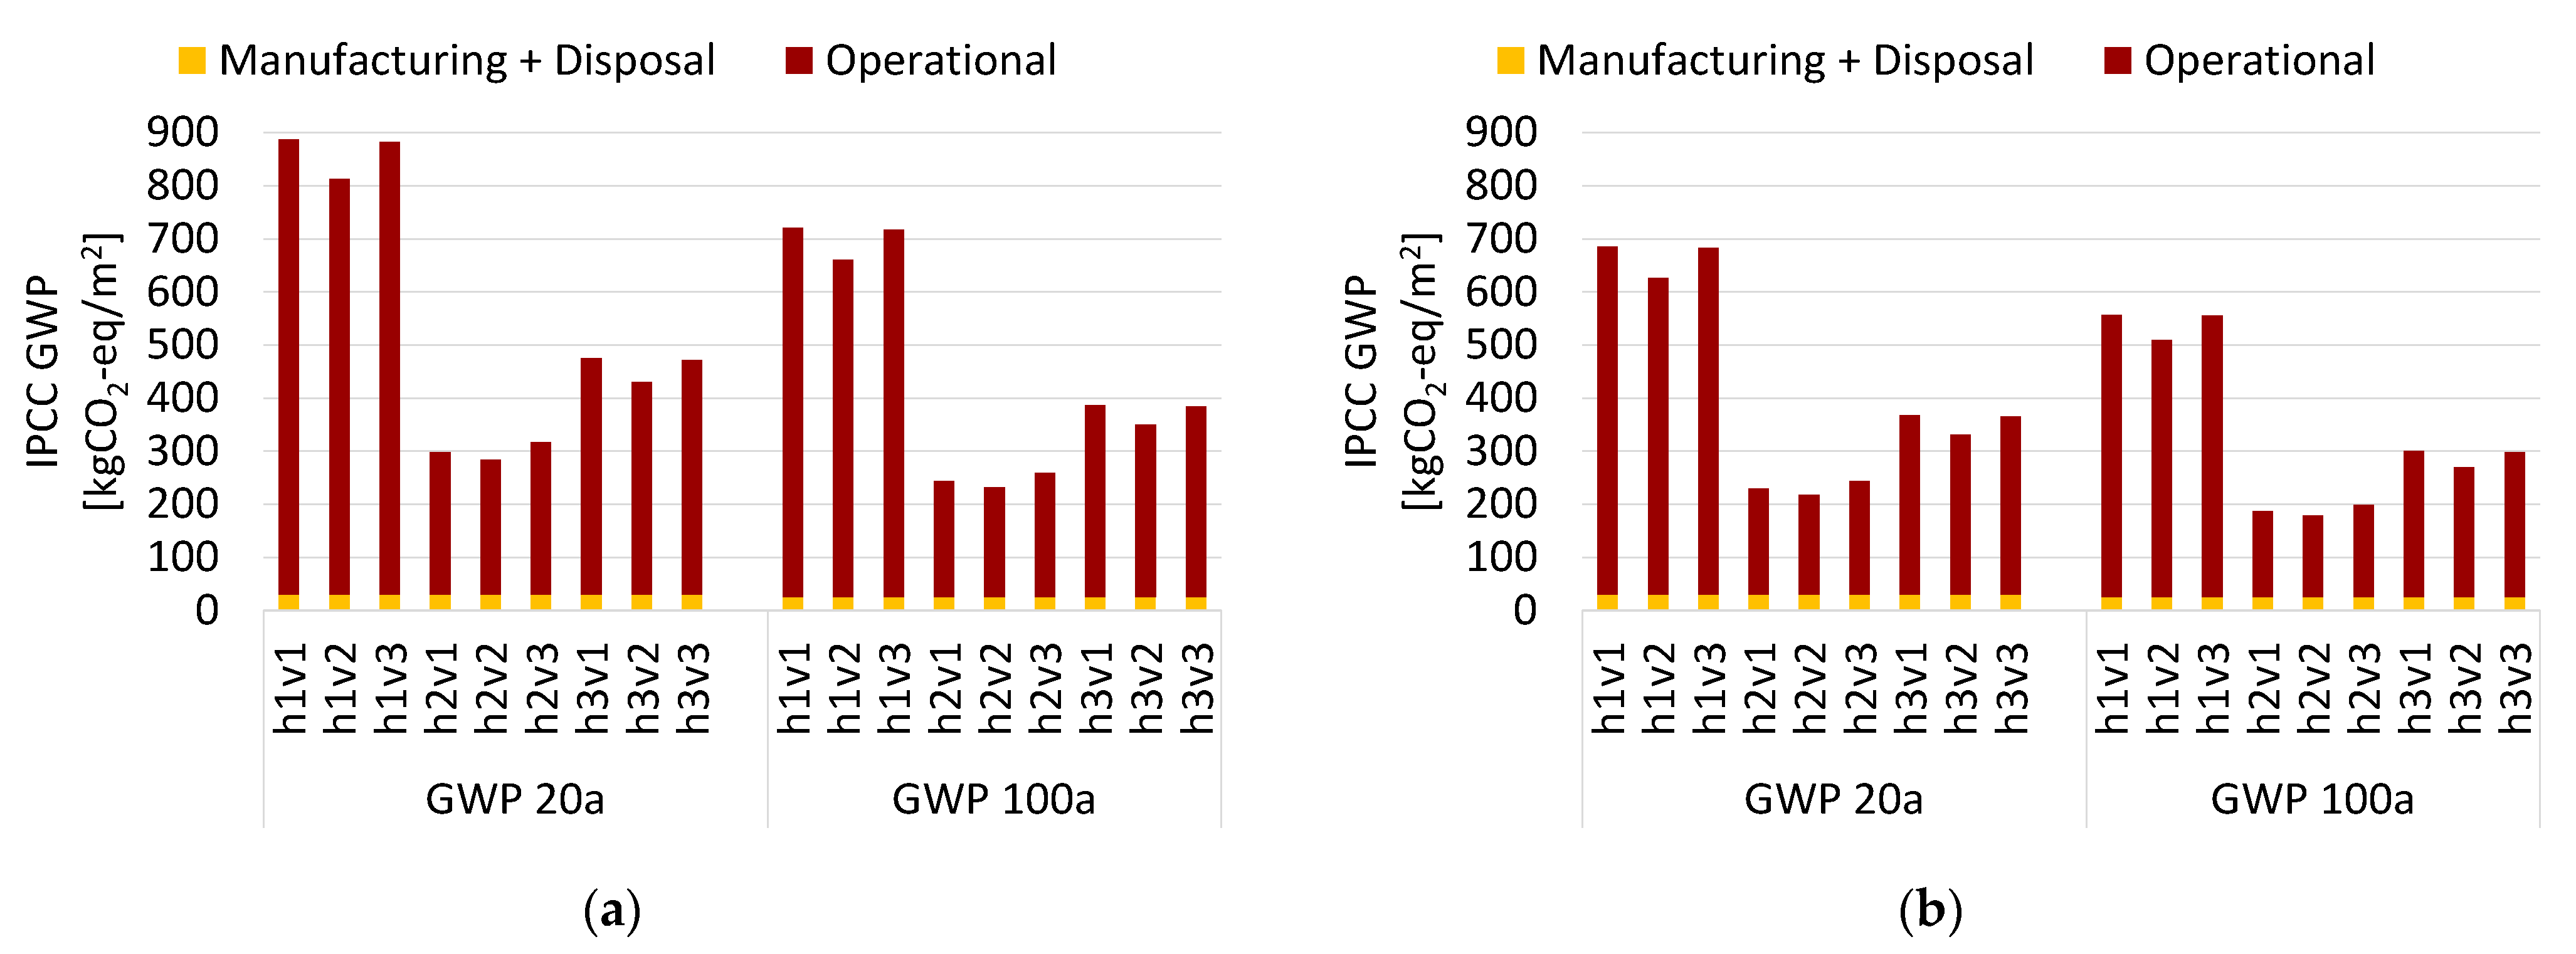
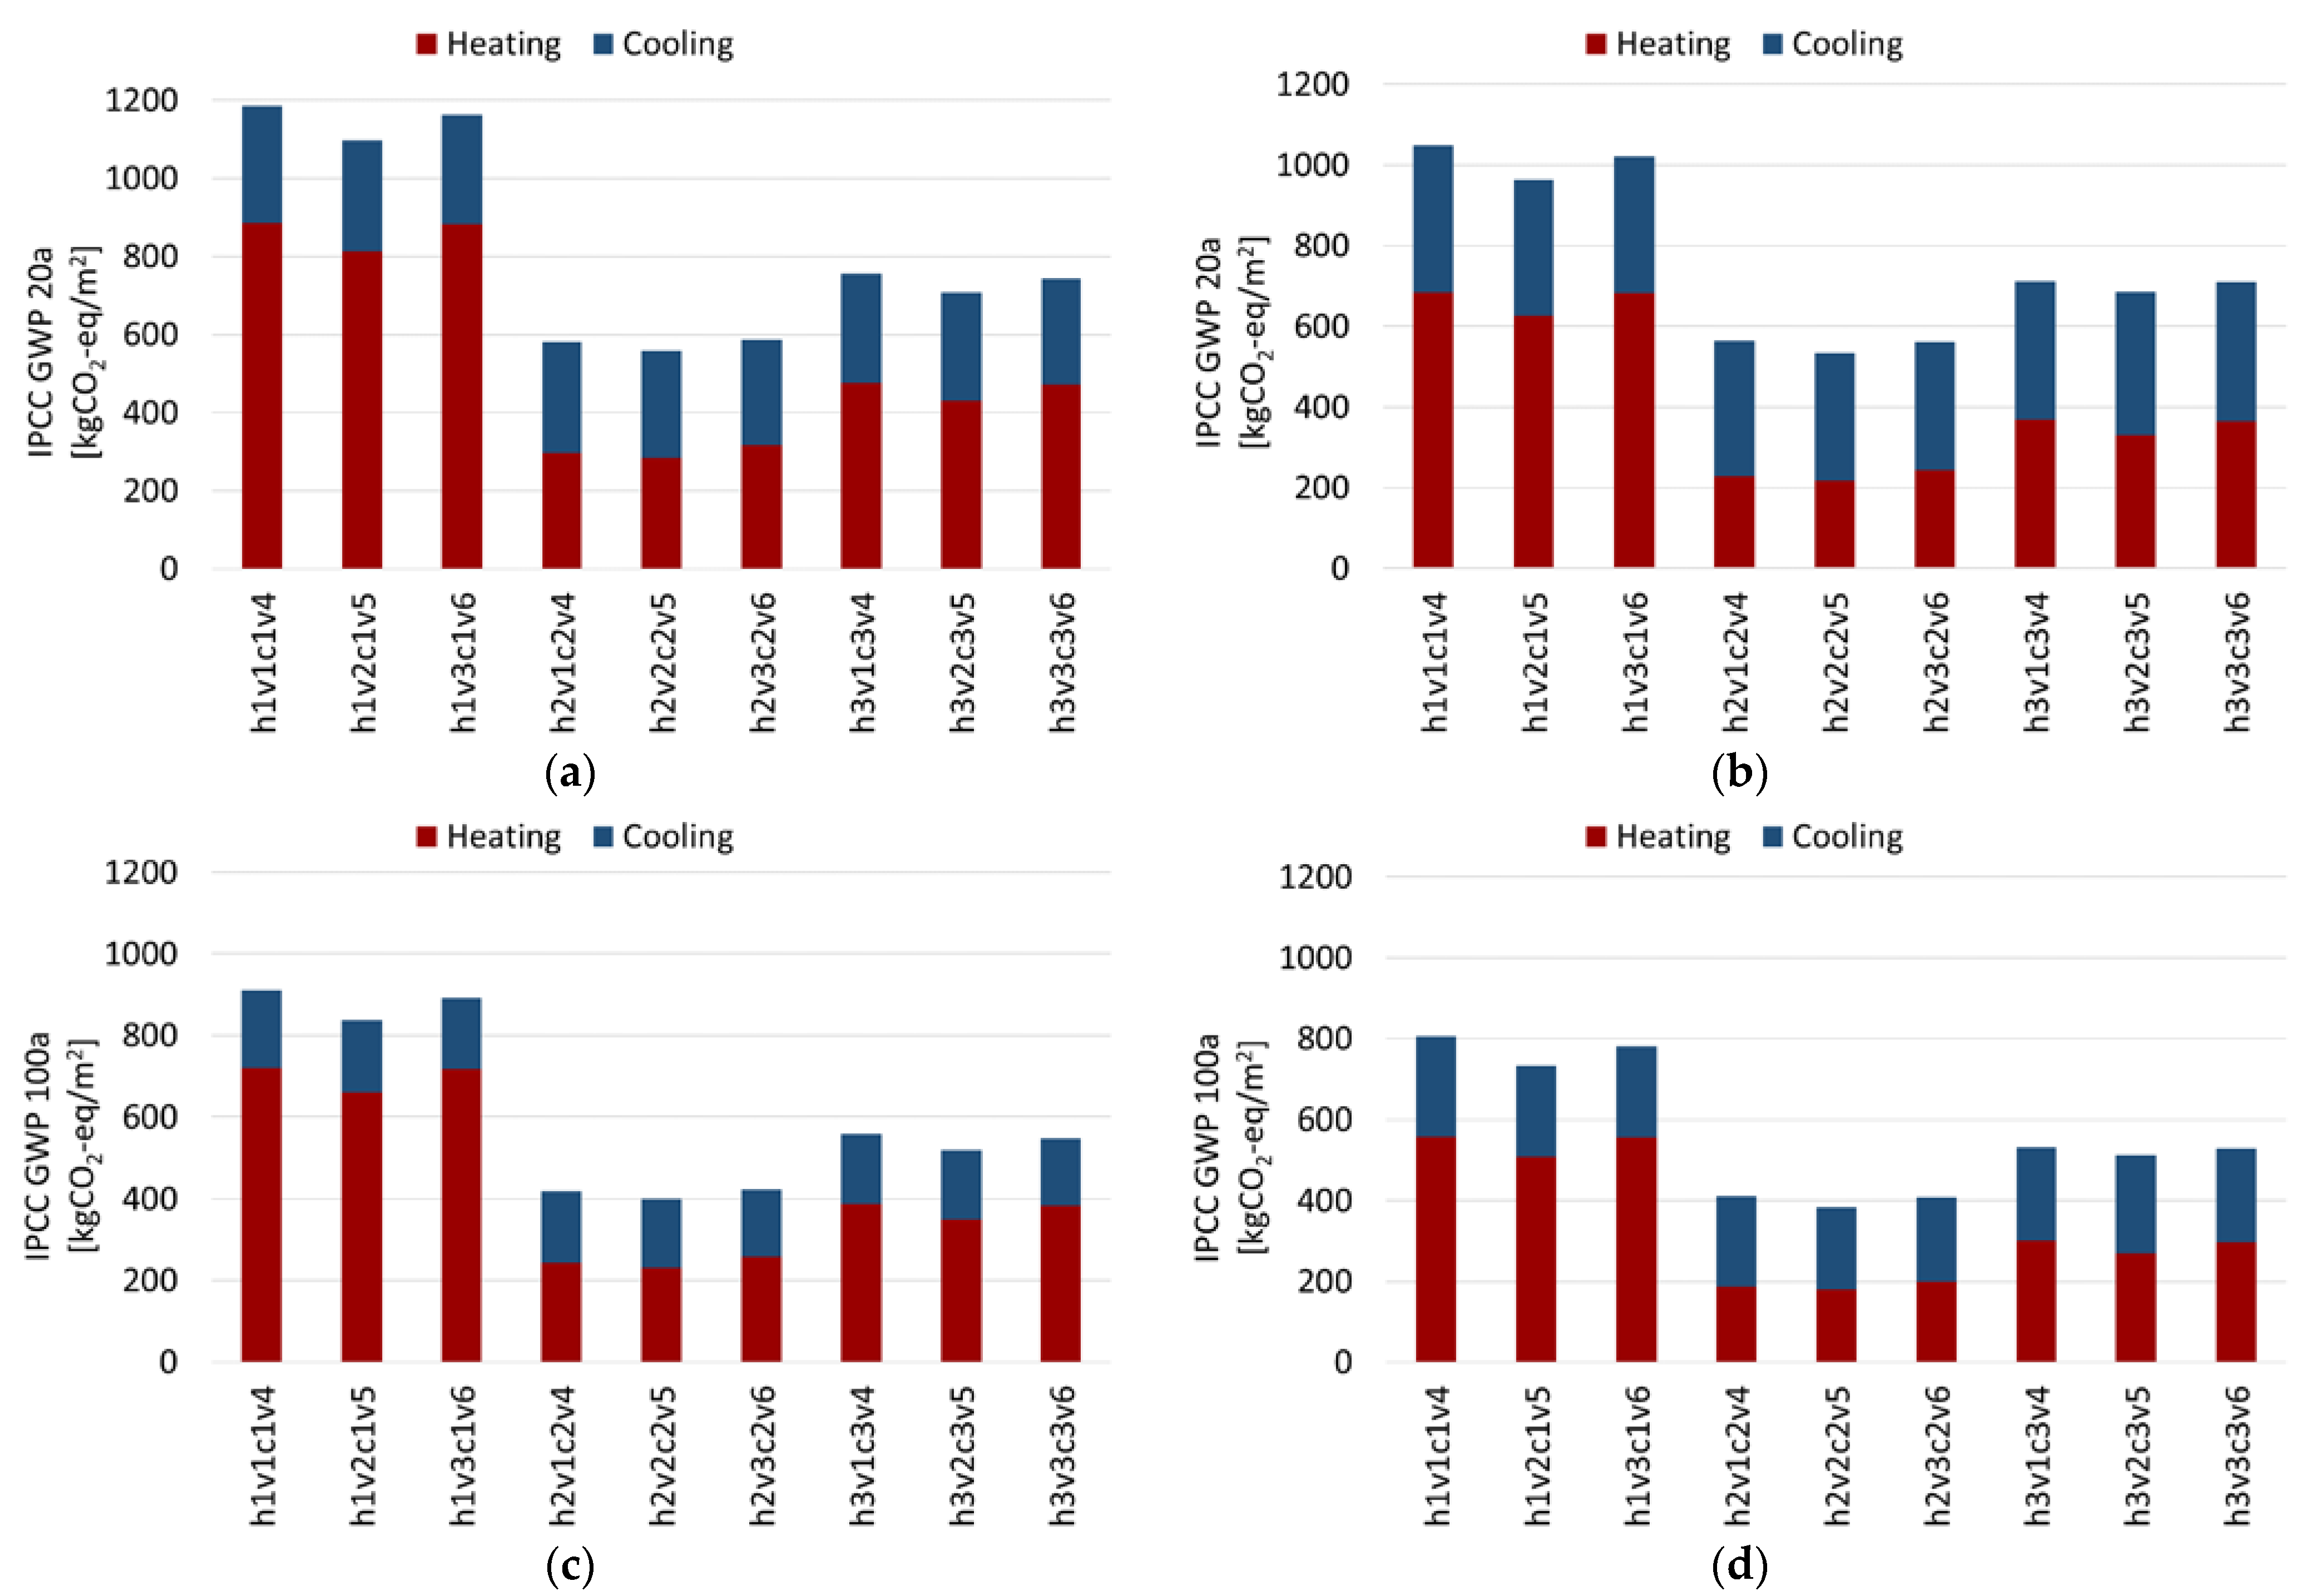
3.2. Operational Stage

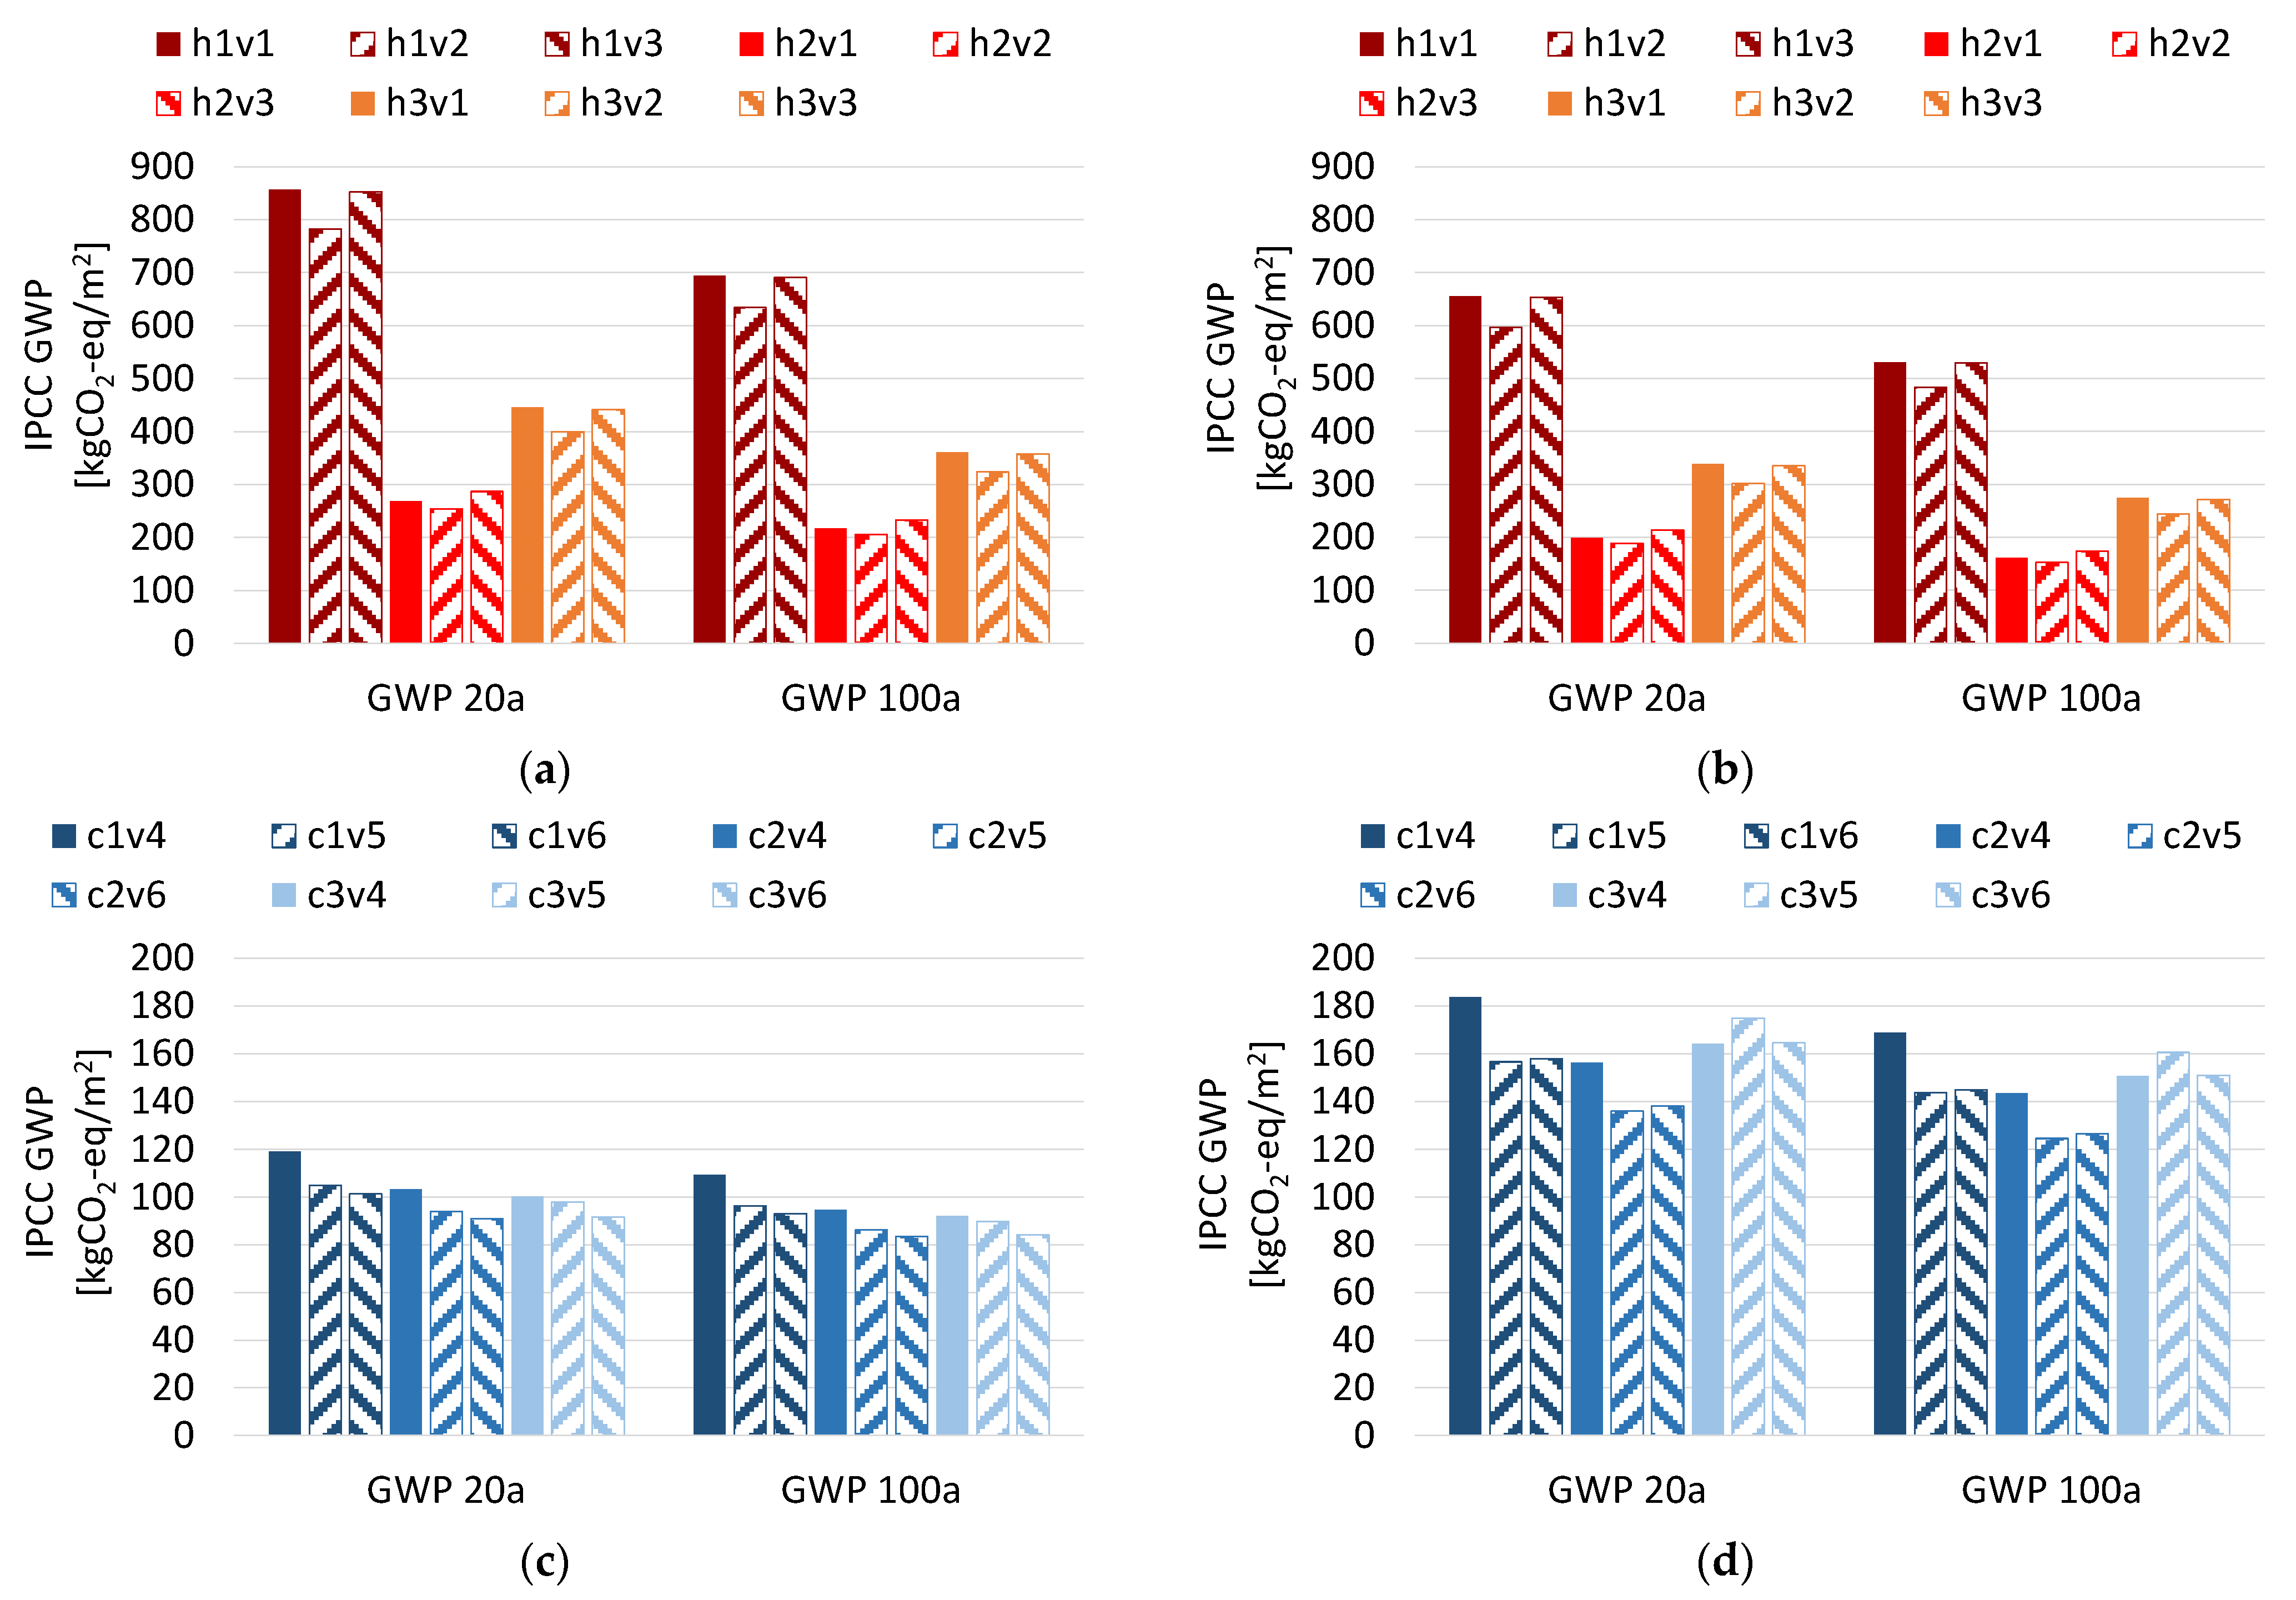
The results of the impacts of the heating and cooling systems during the operational stage calculated with the GWP indicator are shown in Figure 4.
LCAb and LCAcc provided different results: the impacts of the heating were higher for LCAb (Figure 4a) than those calculated with LCAcc (Figure 4b), and opposite trends were observed for the cooling (Figure 4c,d). These results can be explained by the fact that climate change, which will cause a decrease in heating consumption and an increase in cooling consumption [33,45], was included only in the LCAcc analysis. Moreover, it can be seen how a different occupant behaviour can influence the impact of these systems, at first glance.
Regarding the heating environmental impact, it was possible to observe variation mainly among the heating profiles. Maximum impact variations equal to −70% and −53% were obtained between the profile h1v1 and the profiles h2v2 and h3v2. For the LCAb, the highest impact was obtained for the profile h1v1 (857 kgCO2-eq/m2 for GWP 20a and 694 kgCO2-eq/m2 for GWP 100a), while the lowest impact was observed for the profile h2v2 (254 kgCO2-eq/m2 for GWP 20a and 206 kgCO2-eq/m2 for GWP 100a). With LCAcc the maximum and minimum impacts were also found for h1v1 and h2v2, with values 24% and 26% lower than those found with LCAb.
The environmental impact of the cooling system varied among the three cooling usage profiles and from one ventilation profile to another. Additionally, while the impacts calculated with LCAb decreased moving from c1 to c3 and from v4 to v6, this trend was not found with LCAcc. The maximum impact was due to the profile c1v4 with both LCAb (Figure 4c) and LCAcc (Figure 4d); the minimum impact was obtained for the profile c2v6 with LCAb and the profile c2v5 with LCAcc. The discrepancy between the results of LCAcc and LCAb was caused by climate change that influenced the energy consumptions of the profiles and engendered a different augmenting of the hours of operation of the cooling system during the considered 90 years. LCAb provided the maximum and minimum impact values equal to 119 and 91 kgCO2-eq/m2 for the short-term effect GWP 20a and equal to 109 and 84 kgCO2-eq/m2 for long-term effect GWP 100a, respectively. With LCAcc, values equal to 184 kgCO2-eq/m2 (GWP 20a) and 169 kgCO2-eq/m2 (GWP 100a) for the profile c1v4 and equal to 136 kgCO2-eq/m2 (GWP 20a) and 124 kgCO2-eq/m2 (GWP 100a) for the profile c2v5 were obtained. 
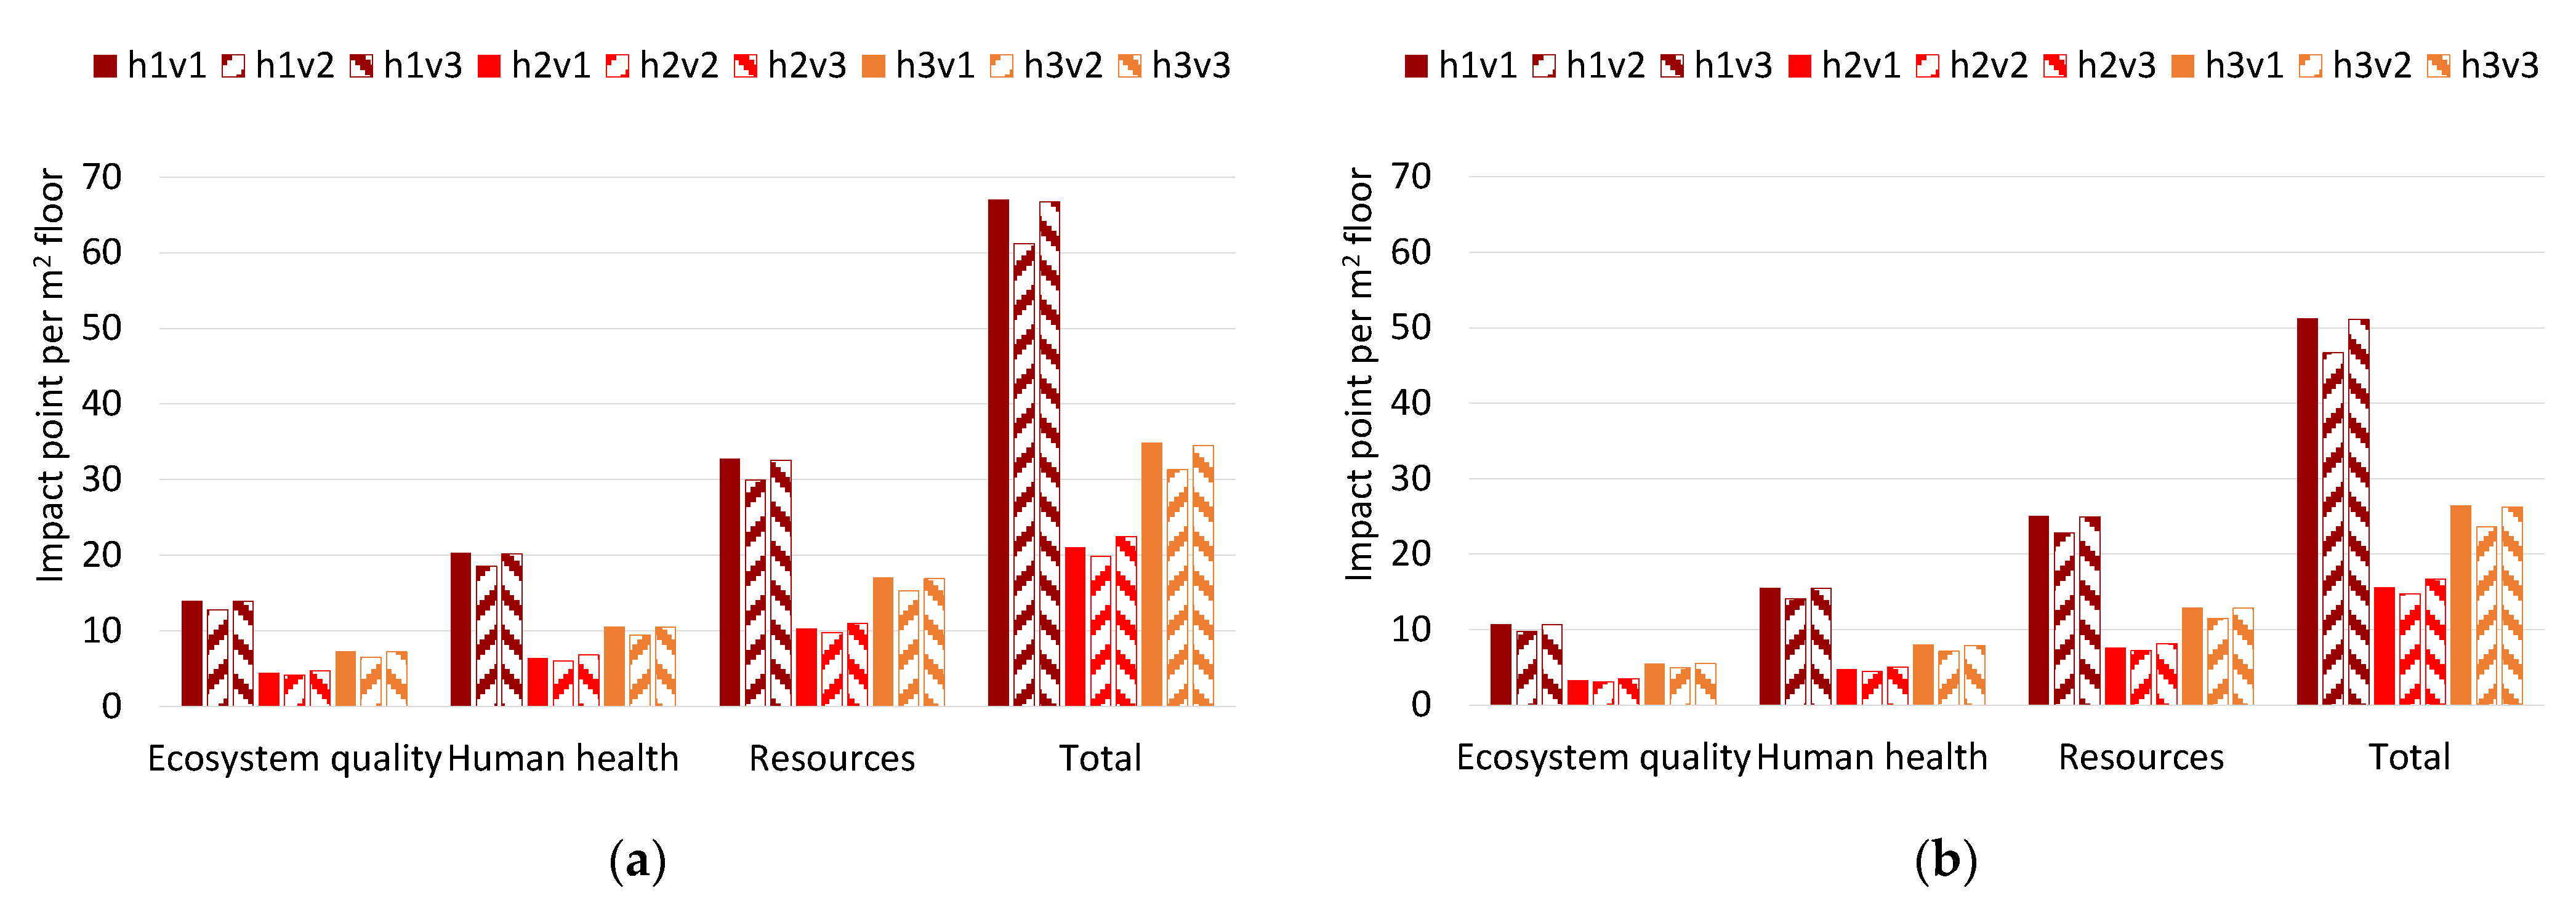
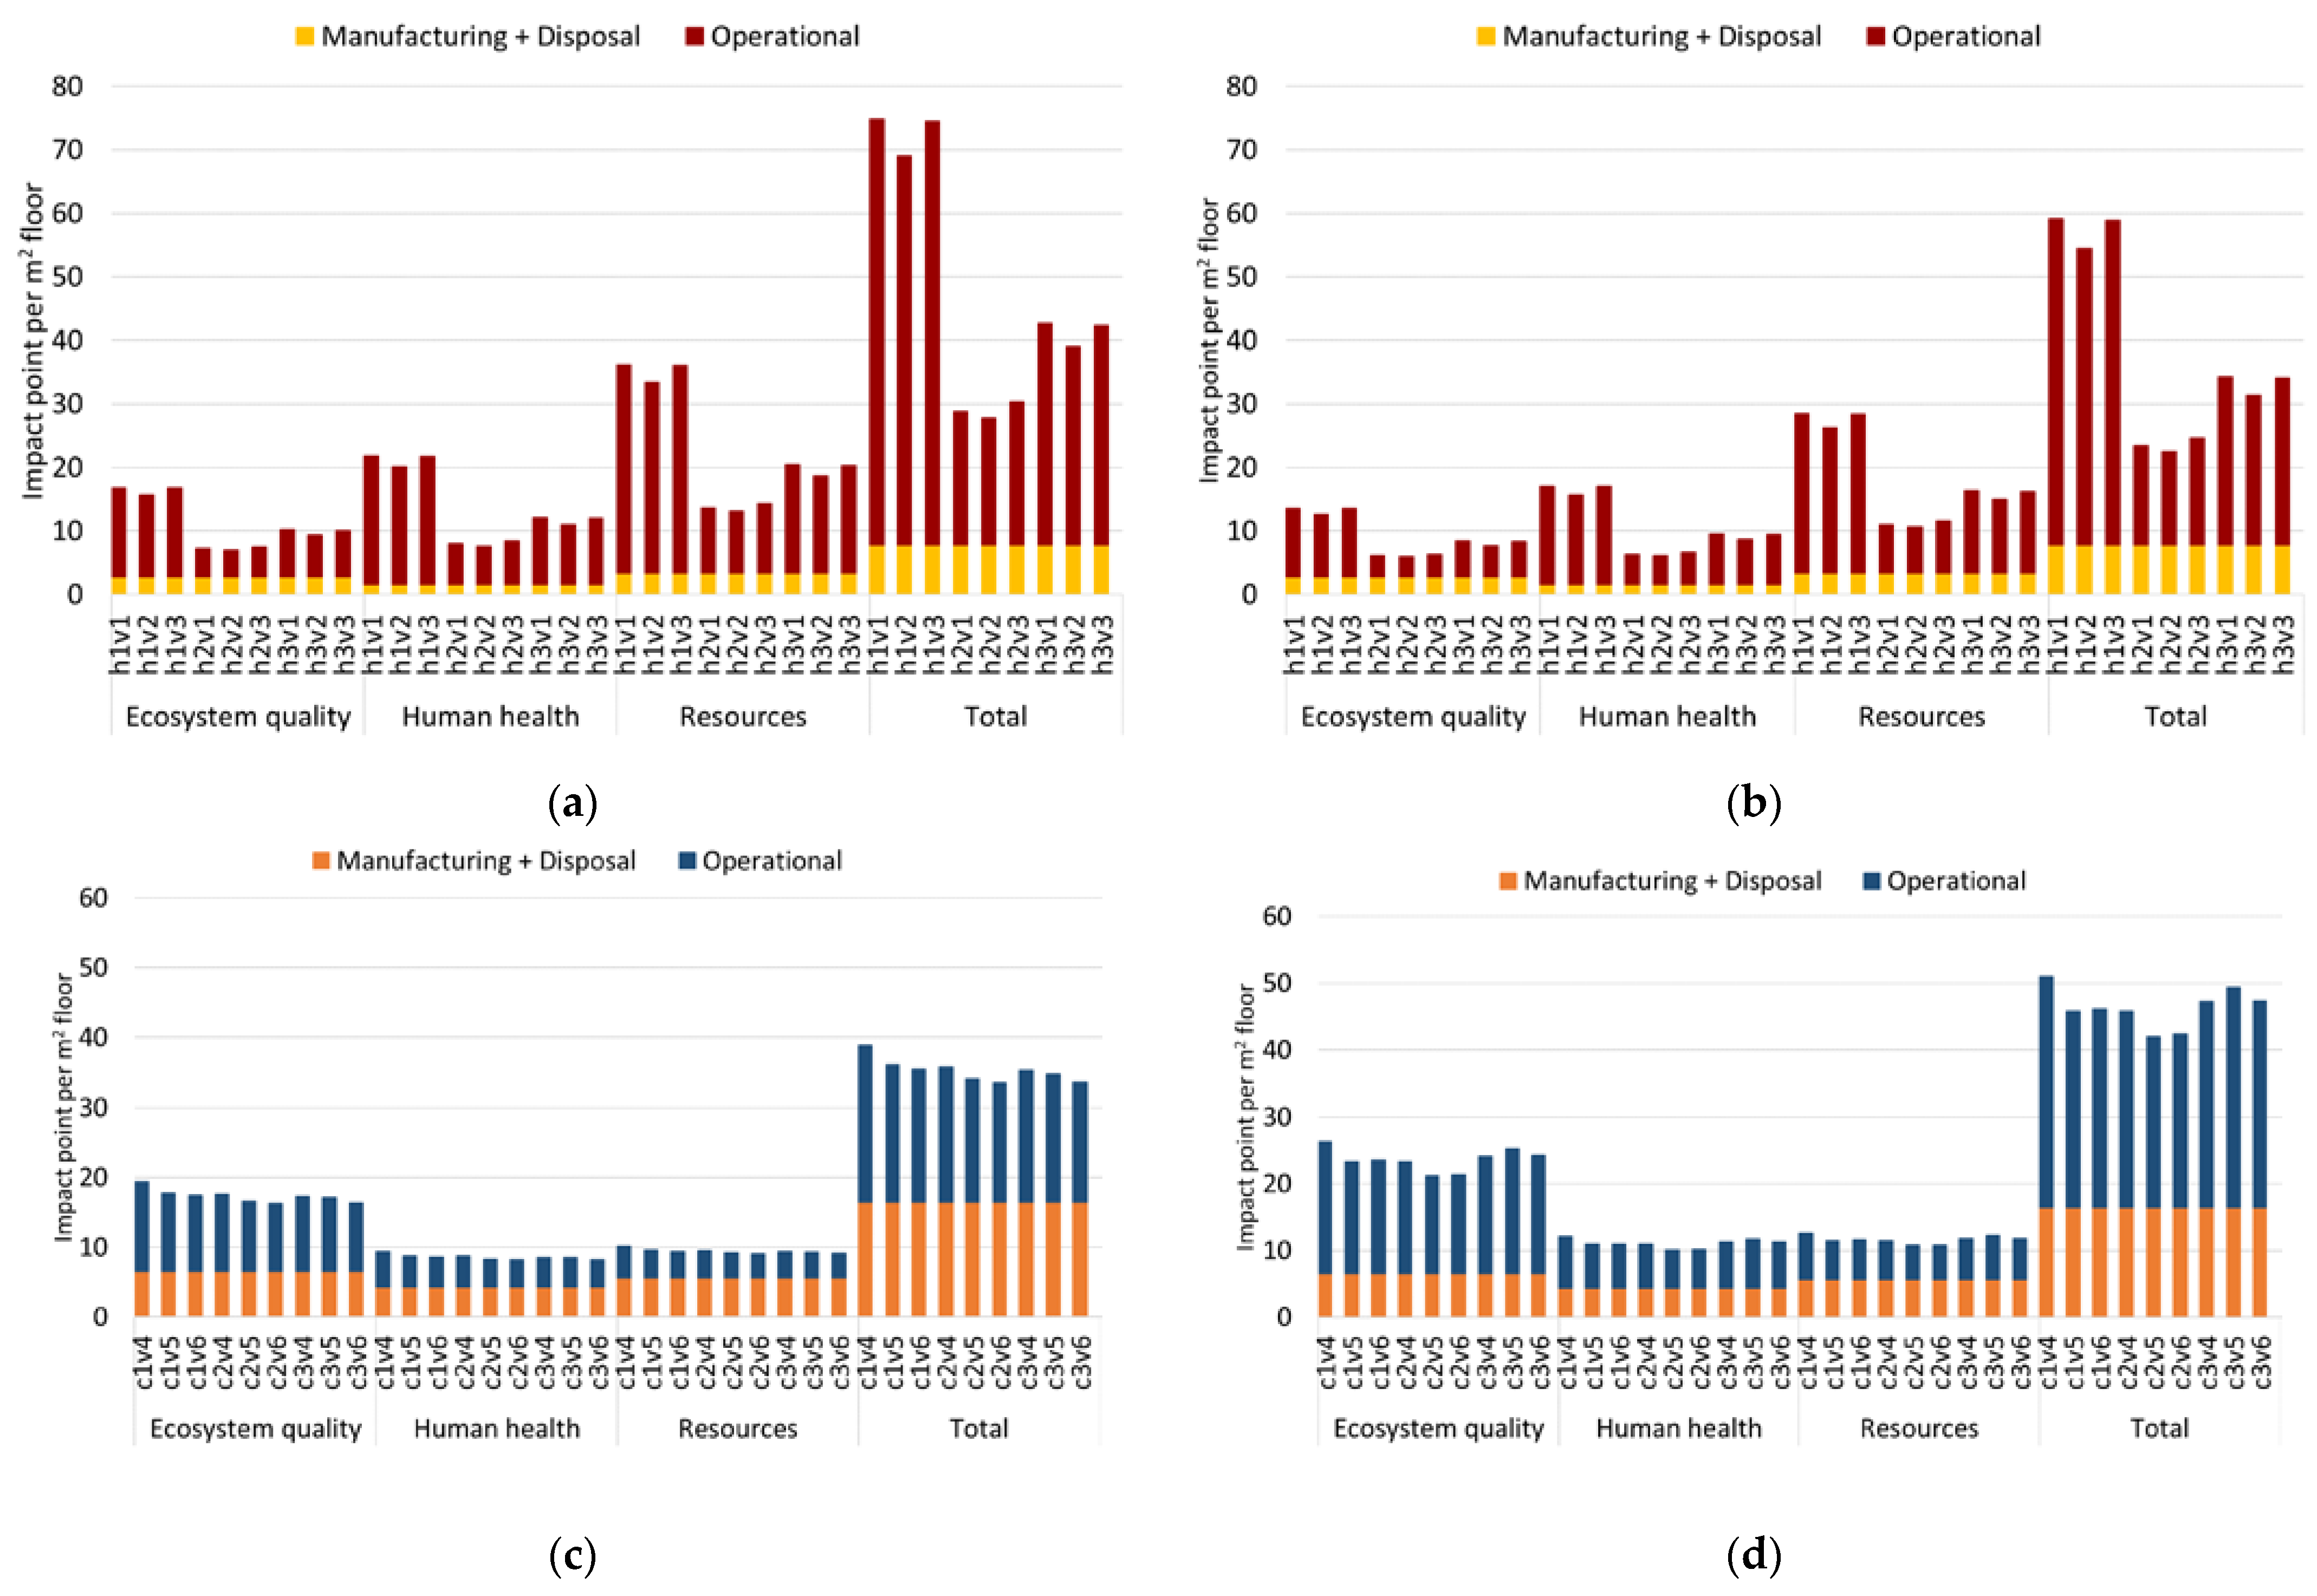
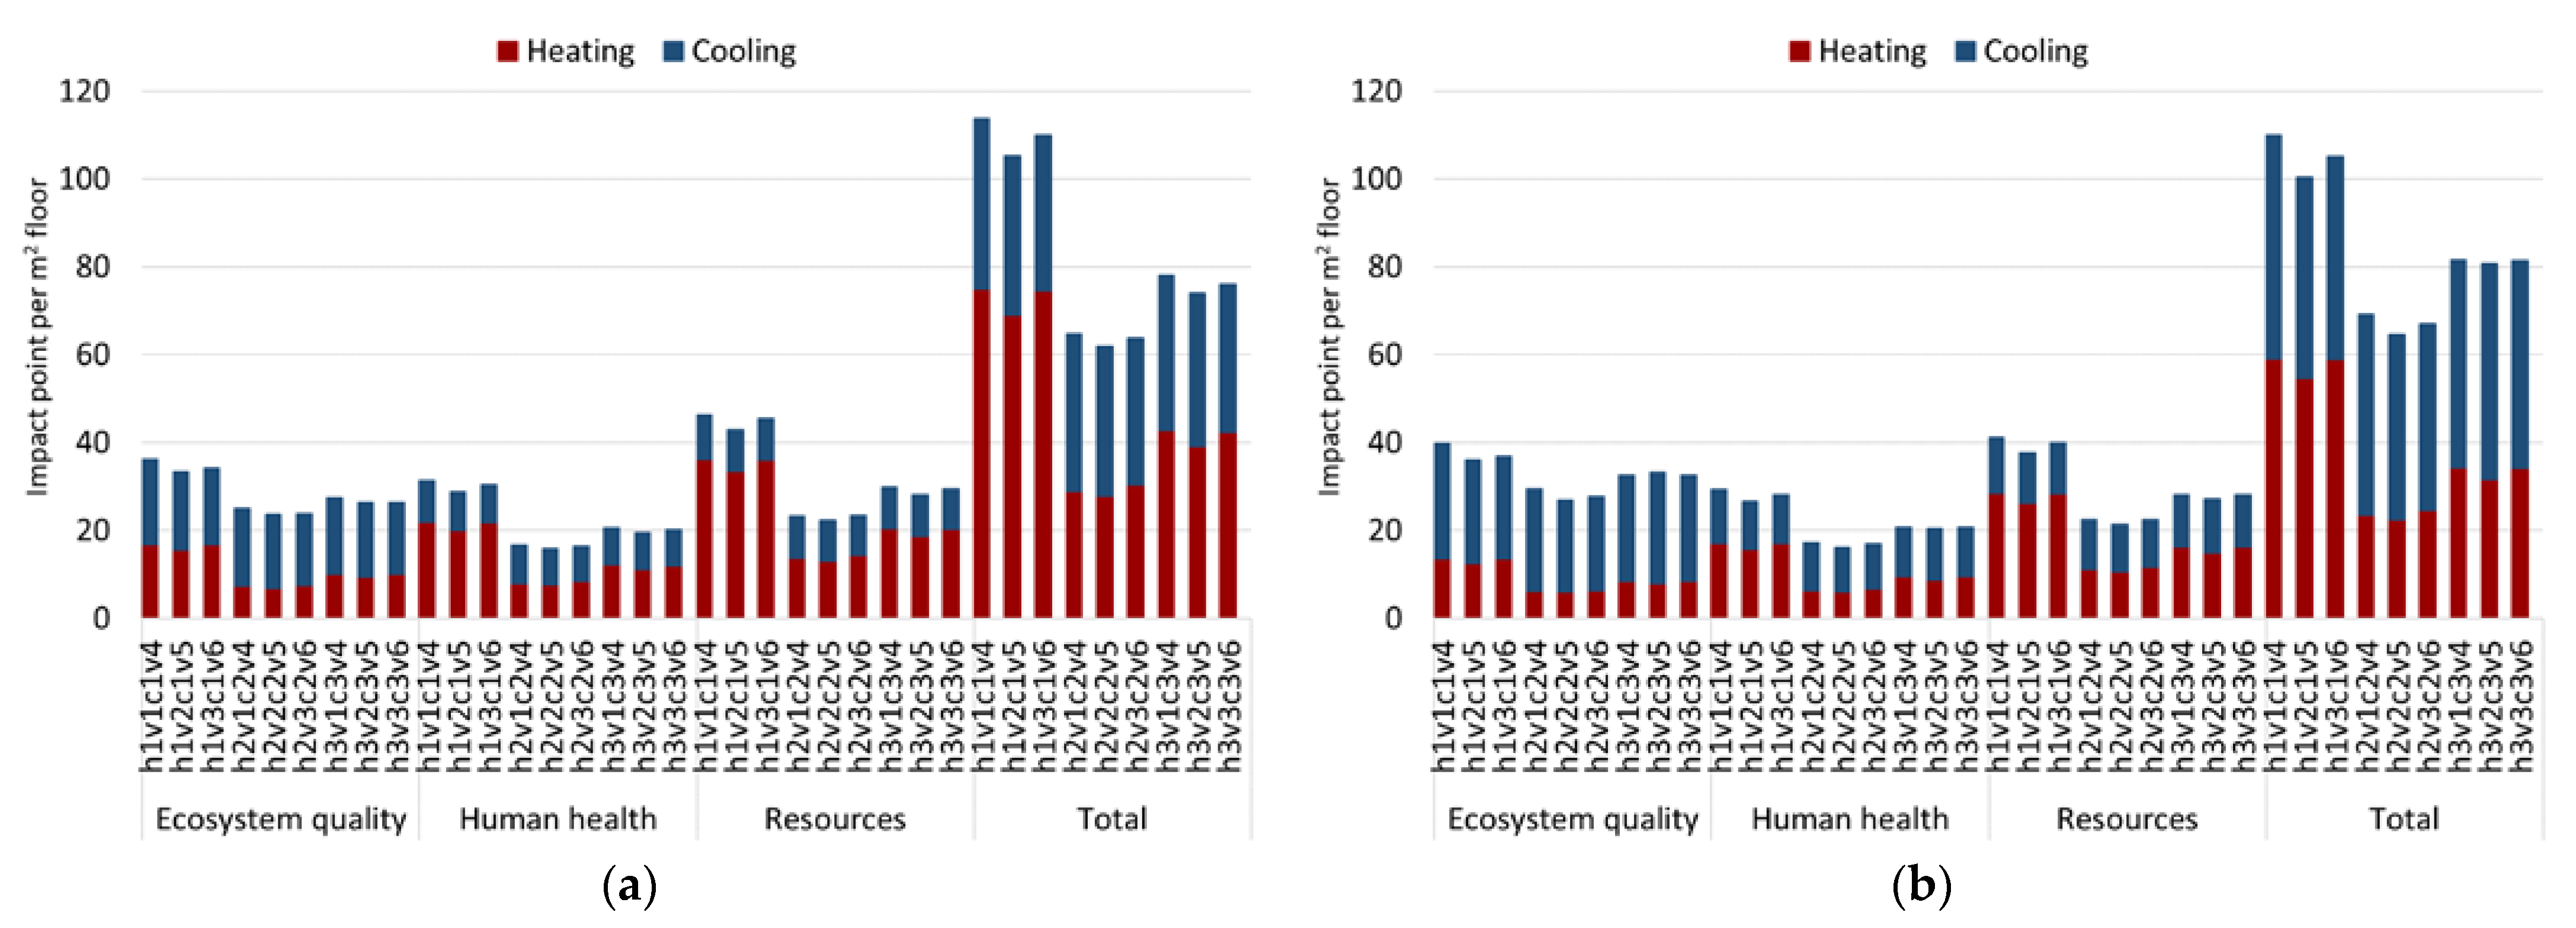
Figure 5 shows the results of the impacts during the operational stage of the two considered systems calculated with the indicator ReCiPe. The trends observed among the usage profiles with the GWP indicator were also encountered with the indicator ReCiPe. According to the results of Figure 3b, the damage caused during the operational stage of the heating system (Figure 5a,b) mainly affects the resources category, while the impact of the cooling operation (Figure 5c,d) was particularly damaging for the ecosystem quality.
The impact caused by heating in the category of resources reached peaks of 33 and 25 impact point/m2 with LCAb and LCAcc, respectively. Regarding the cooling operation, maximum impact points per m2 of about 13 and 20 were obtained from LCAb and LCAcc in the ecosystem quality category.
The effect of climate change produced a reduction of the total impacts caused by the heating system for LCAcc, if compared with those obtained with LCAb. In particular, impact values from 20 to 67 impact point/m2 (Figure 5a) and from 15 to 51 impact point/m2 (Figure 5b) were obtained through the indicator ReCiPe.
An opposite effect was produced to the impact of the cooling system that was higher for LCAcc. Impact values from 17 to 22 impact point/m2 and from 25 to 34 impact point/m2 were obtained with LCAb and LCAcc, respectively.

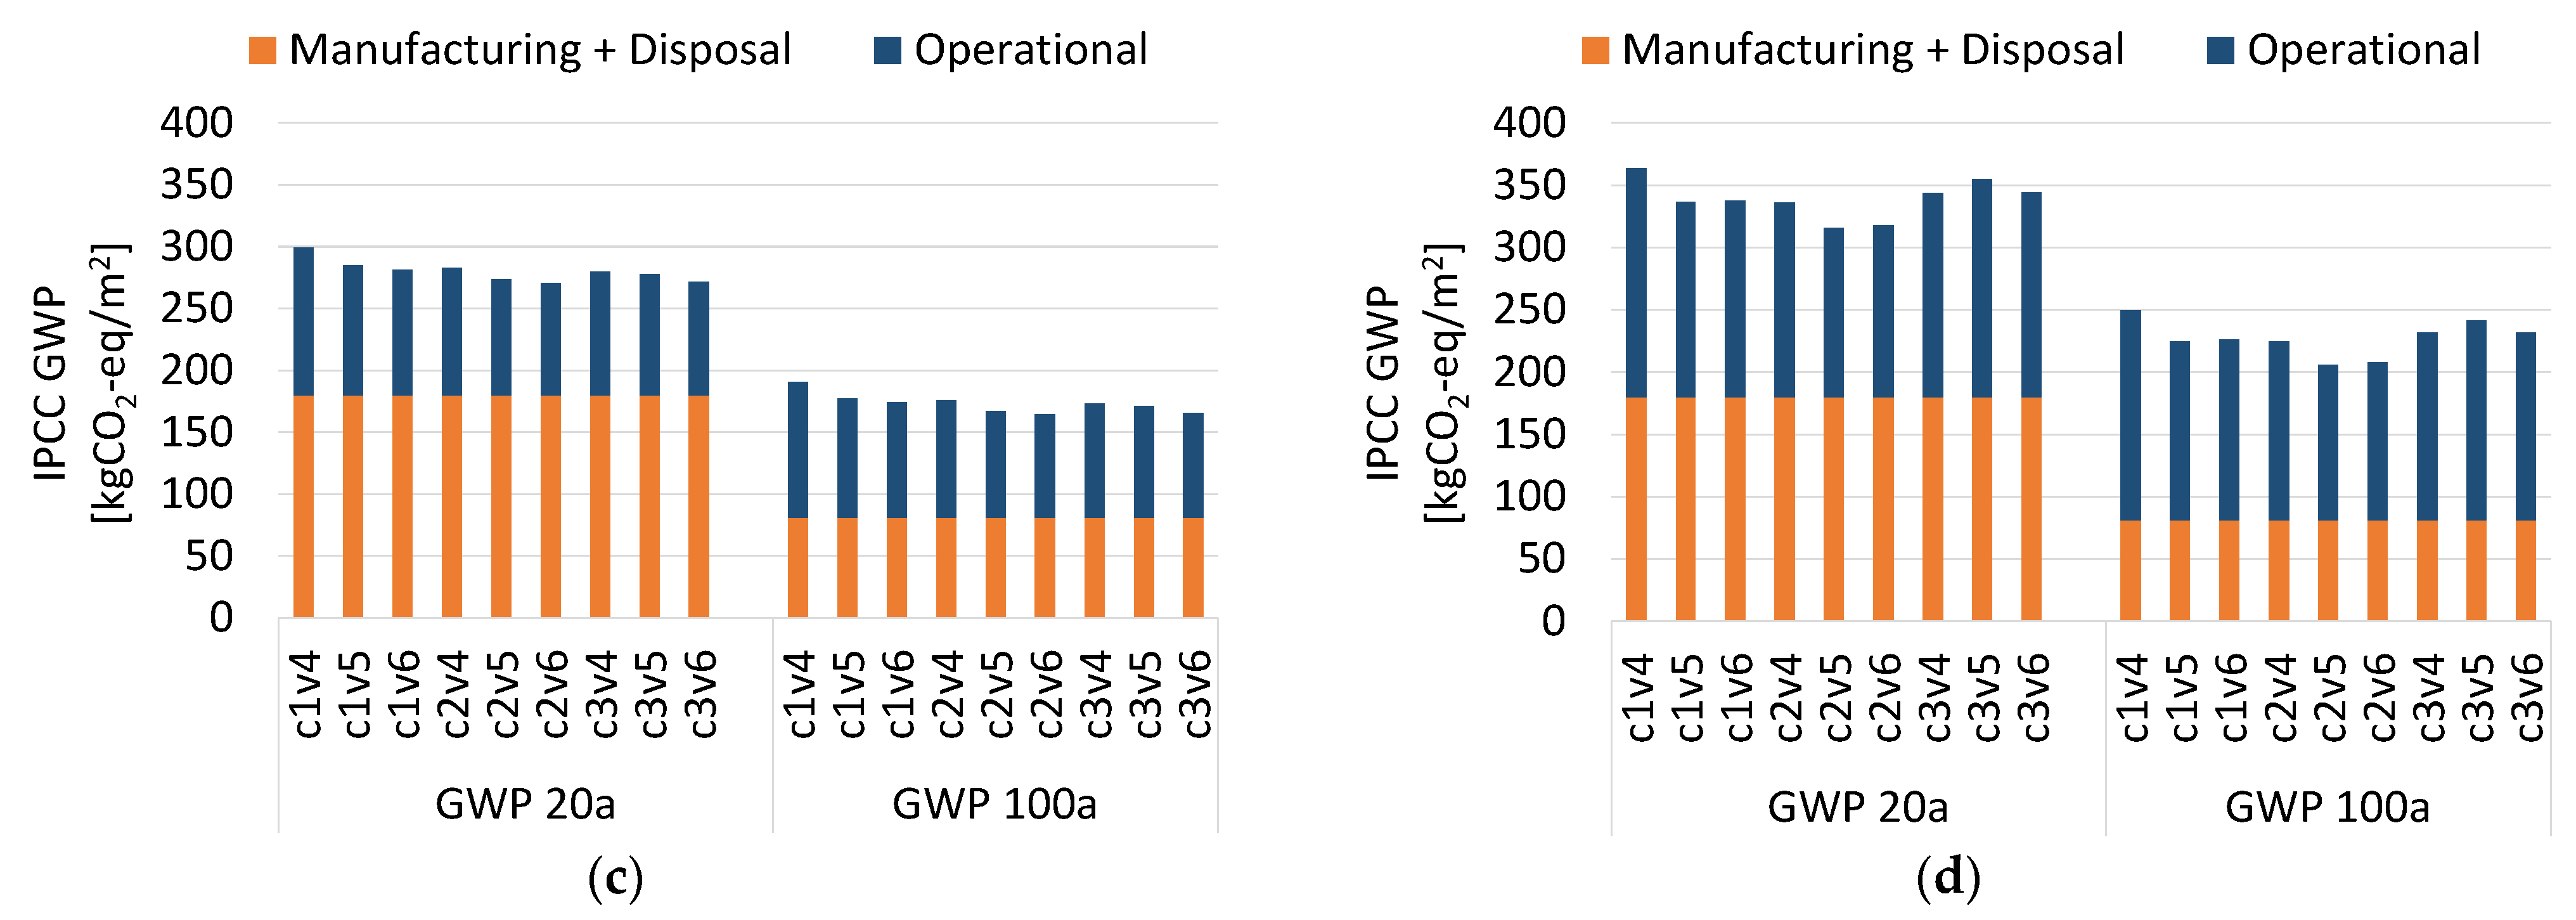
3.3. Total Impact (Manufacturing, Operational, and Disposal Stage)

The total impacts of the heating and cooling systems, namely the impact caused during the manufacturing, operational, and disposal stage, calculated through the GWP indicator are shown in Figure 6.
It is interesting to notice that, while for the heating system (Figure 6a,b) the total impact is almost completely due to the operational stage (more than 90%), the impact related to cooling (Figure 6d) changed between GWP 20a and GWP 100a. In fact, for all the nine cooling profiles the impact for short-term effect (GWP 20a) is mainly due to the manufacturing and disposal stage, while for the long-term effect the environmental damage related to the operational stage is predominant.
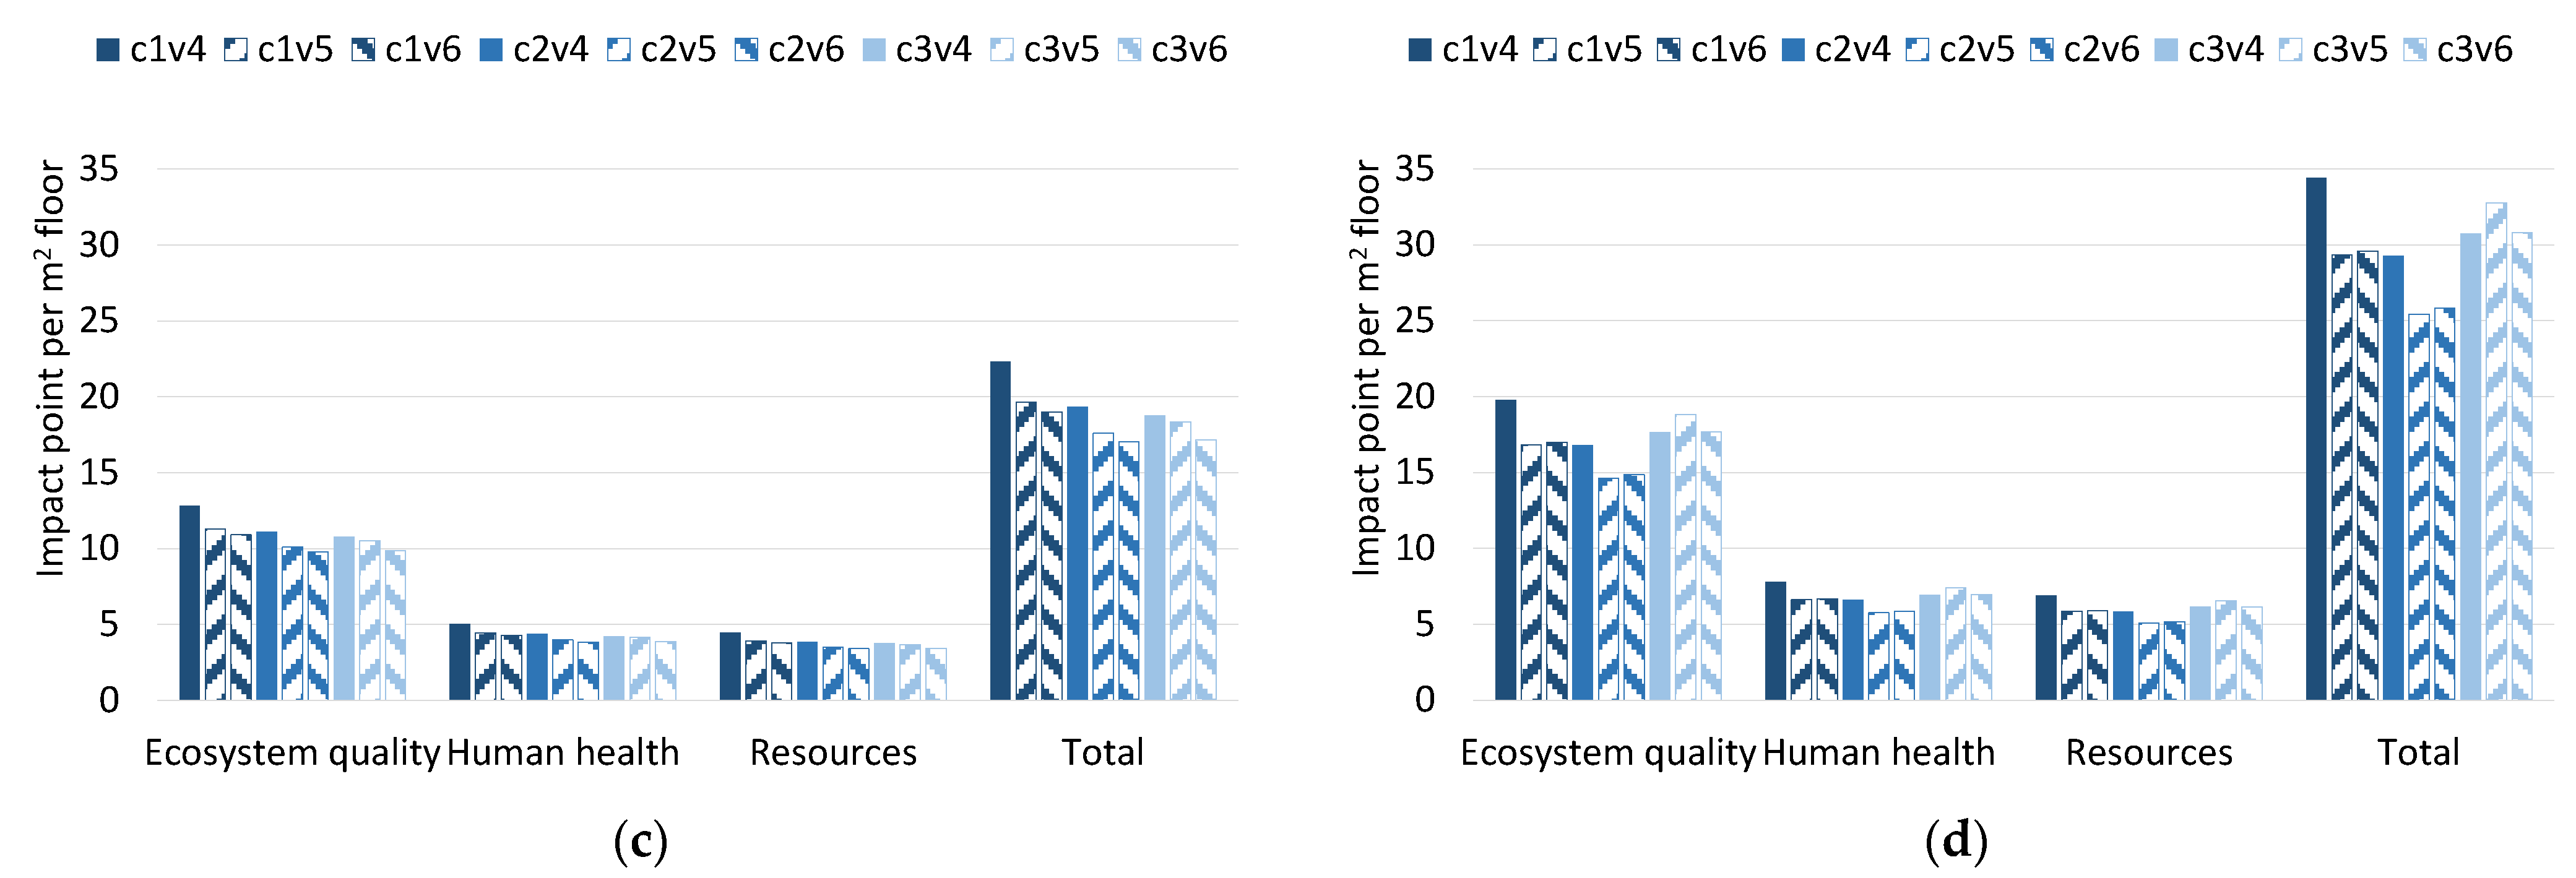
Similar results were obtained with the indicator ReCiPe (Figure 7a–d). The total impact due to heating was mainly caused by the operational stage.
Regarding the cooling system, the operational was also the most damaging stage. Only for human health and resources categories, manufacturing appeared to be the most impacting stage. This can be explained by the fact that the impact of the cooling system in these categories was very low if compared with that of the ecosystem quality category.

3.4. Annual Impact of the Two Systems

Figure 8 and Figure 9 show the comparison between the annual results per m2 of floor area calculated with LCAb and LCAcc through the indicators GWP and ReCiPe.
In general, LCAb provided impact values ranging from 1185 to 558 kgCO2-eq/m2 with GWP 20a (Figure 8a) and from 911 to 419 kgCO2-eq/m2 with GWP 100a (Figure 8c). The results obtained with LCAcc (Figure 8b,d) were always lower than the previous, in a measure ranging from −3% (with profiles h2v1c2v4 and h3v2c3v5) to −12% (with profiles h1v1c1v4, h1v2c1v5, and h1v3c1v6).
Analysing more in depth the results, for LCAb the impact due to heating operation was always higher than that caused by cooling. In contrast, the cooling impact appeared to be predominant in three profiles (h2v1c2v4, h2v2c2v5, and h2v3c2v6) with LCAcc.
Regarding the annual results obtained with the ReCiPe indicator, it should be noticed that LCAb provided impacts higher than those of LCAcc only for the first three profiles. Furthermore, LCAb (Figure 9a) attributed to the heating system the main percentage of the total impact for six out nine profiles (h1v1c1v4, h1v2c1v5, h1v3c1, h3v1c3v4, h3v2c3v5, h3v3c3v6). In the case of LCAcc (Figure 9b), the impact of the heating system is the major contributor of the total impact only for the first three profiles (h1v1c1v4, h1v2c1v5, and h1v3c1v6).

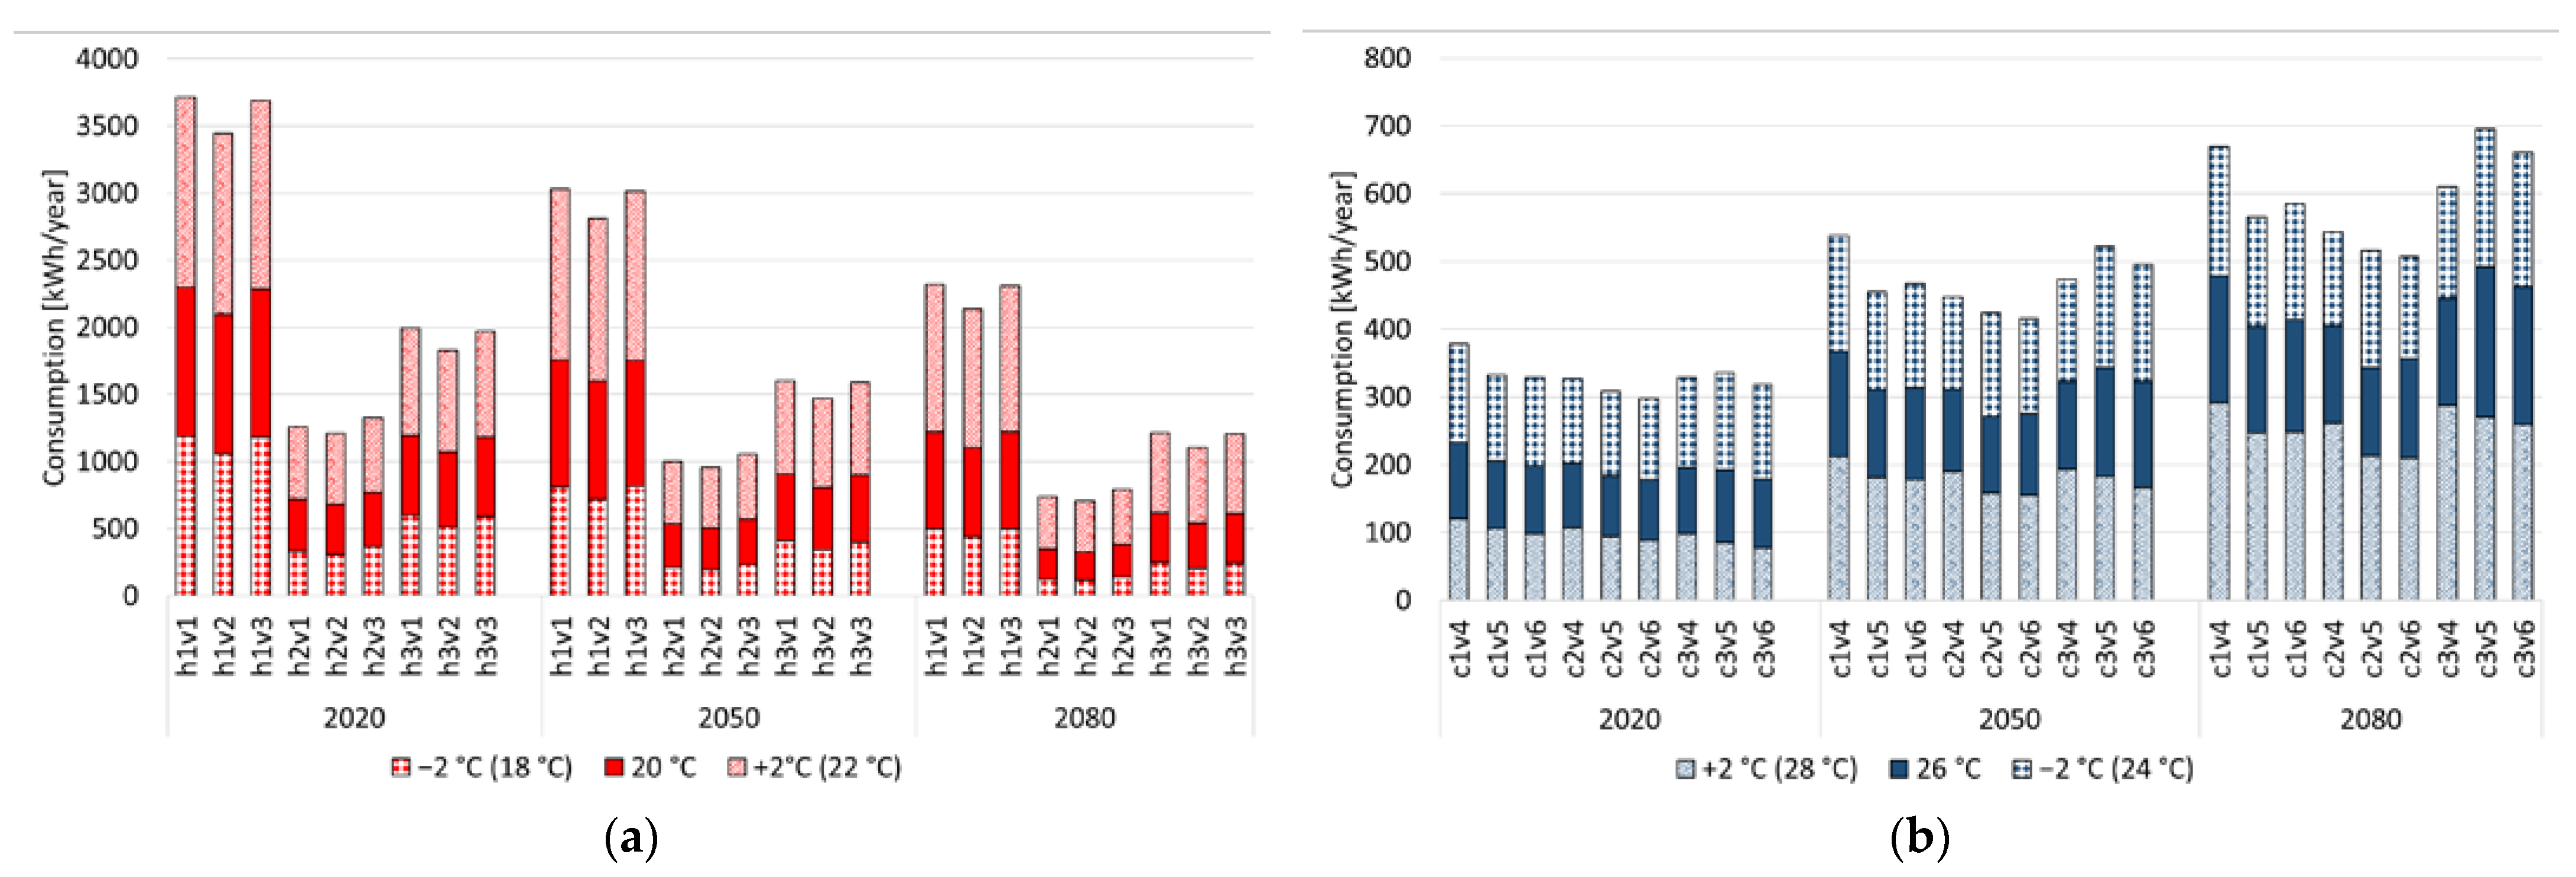
3.5. Influence of Occupant Behaviour by Varying the Setpoint Temperature

As already mentioned in Section 2.2, energy simulations were also performed by varying the heating and cooling setpoint temperatures of ±2 °C and, hence, considering occupants preferences in thermal comfort. The energy consumption obtained by varying the setpoint temperatures during the three climatic scenarios is shown in Figure 10.
These changes in energy consumption will have a consequence on the environmental impact of the heating and cooling systems. The impact variations, expressed as the percentage difference between the impacts calculated with setpoint temperature at 20 °C (heating) and 26 °C (cooling) and the impacts with a setpoint variation of ±2 °C, are shown in Table 12.
It can be inferred that LCAb provided percentage variations of the heating impacts lower than those obtained with LCAcc, opposite trends were found for the environmental impact of the cooling system. In general, the reduction of 2 °C of the heating setpoint temperature led to a reduction of the heating impact ranging from −48% to −55% with LCAb and from −52% to −59% with LCAcc. In both cases, the maximum reduction was obtained for the profile h2v2. This profile registered the maximum variation also with the increase of setpoint temperature of +2 °C. In this case, impact variations from +61% to +77% and from +71% to +90% were obtained for LCAb and LCAcc, respectively.
With cooling, percentage variations of the impact from +62% to +77% and from +44% to +57% were encountered by reducing the setpoint temperature of 2°C with LCAb and LCAcc. Additionally, an augmentation equal to +2 °C of the cooling setpoint temperature produced an impact drop ranging from −47% to −57% and from −40% to −48%, for LCAb and LCAcc, respectively.
Unlike heating, the maximum variations were found for different profiles: c3v6 with LCAb, and for c2v5 (−2 °C) and the profiles c3v5 and c3v6 (+2 °C) with LCAcc.

4. Conclusions

A life cycle assessment was conducted for the heating and cooling systems of a residential building located in southern Italy. The indicators IPCC 2013 Global Warming Potential for short and long-term effect (GWP 20a and GWP 100a) and ReCiPe were adopted to perform the study, for a functional unit of 1 m2 of usable floor area.
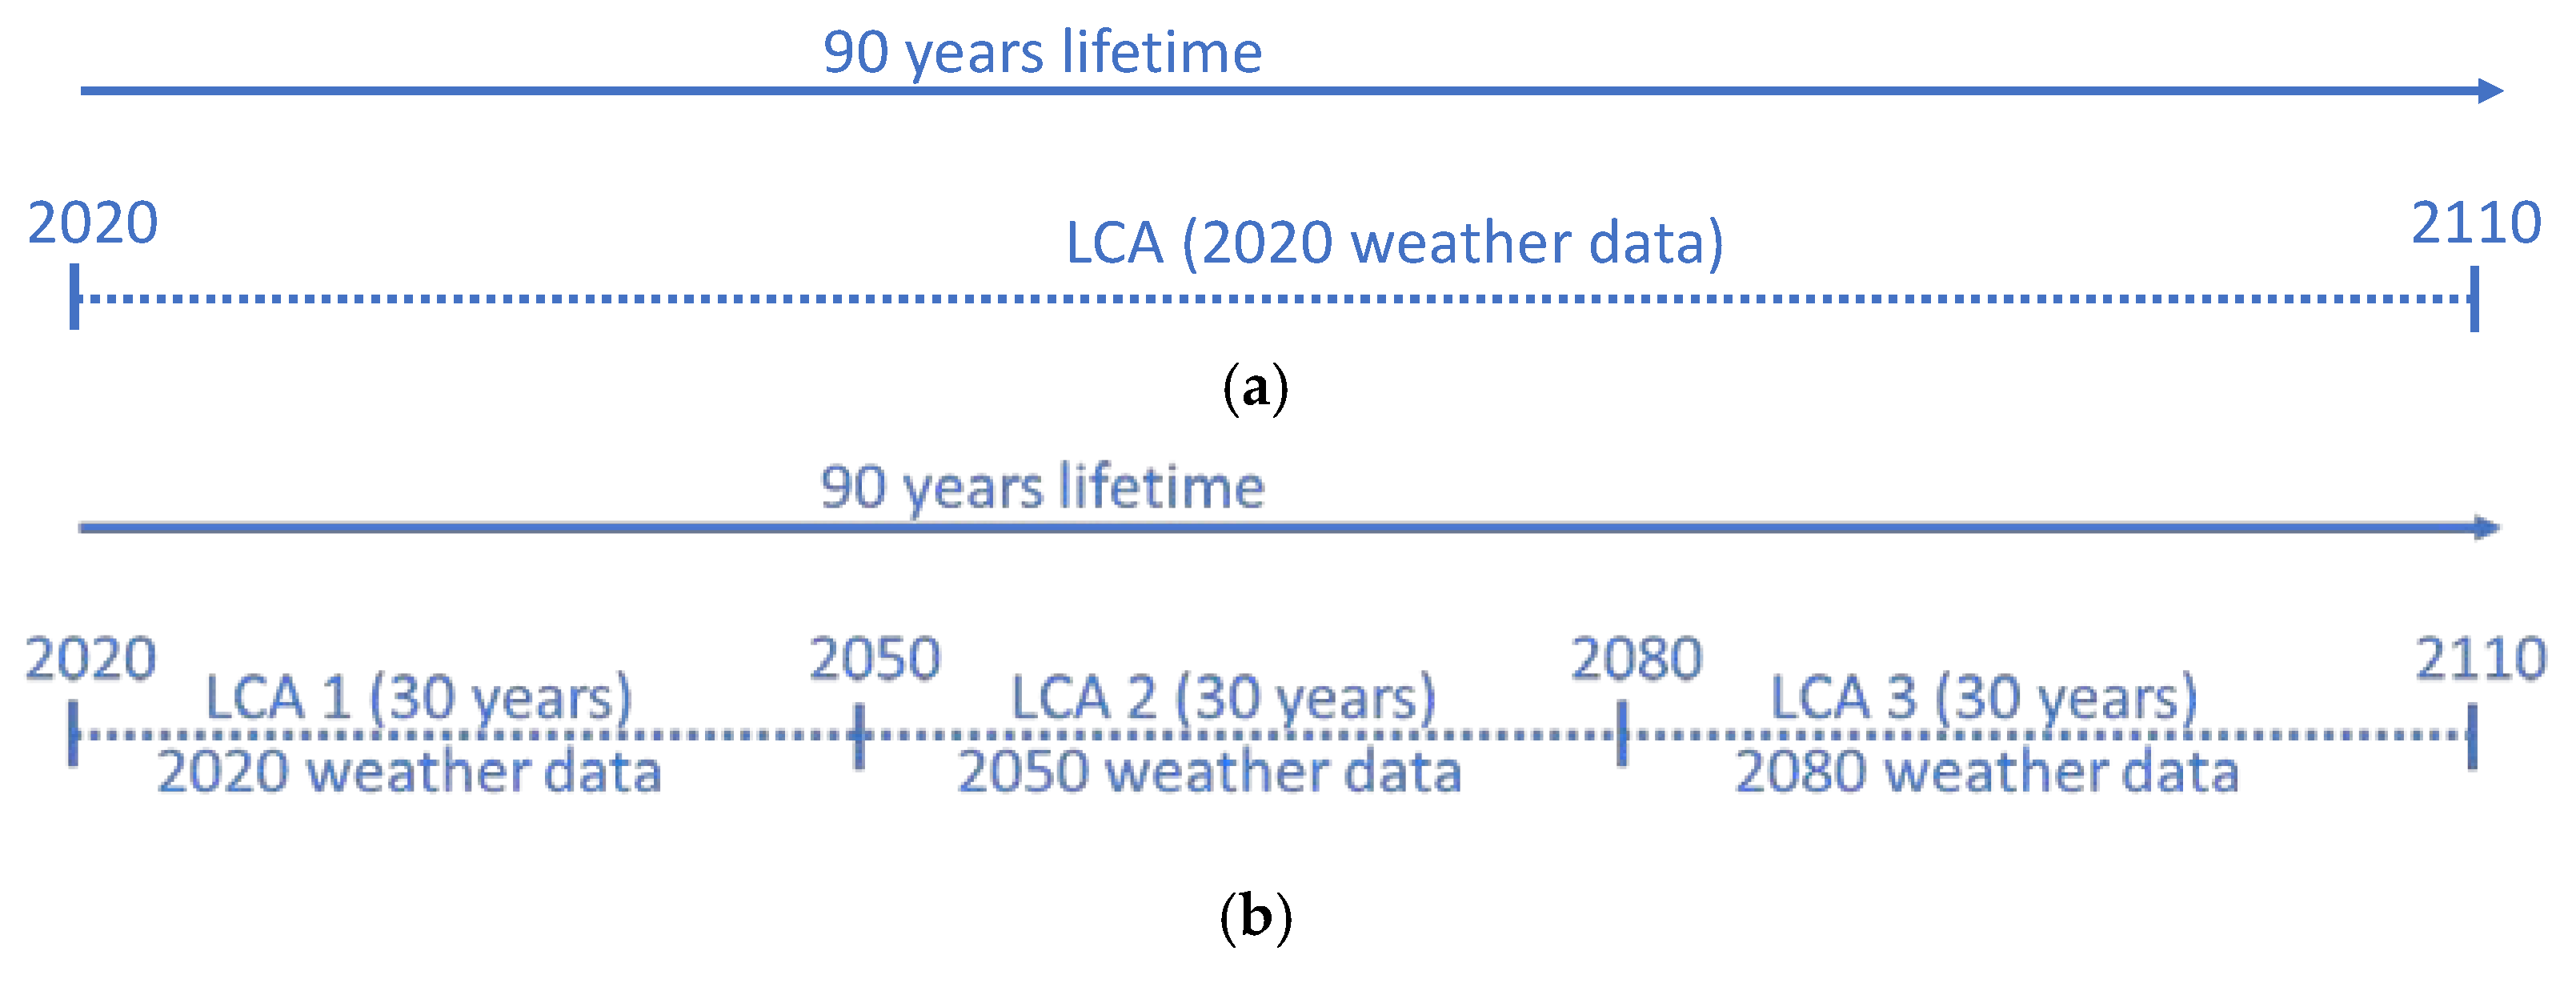
The novelty of the paper consists in the consideration of the effect of two factors usually neglected in such studies. In particular, the analysis was carried out for a lifetime of 90 years by considering the influence of both occupant behaviour and climate change on the operational stage of the systems (LCAcc). The comparison was made with the results of an LCA conducted in a conventional way (LCAb), namely ignoring the external influences such as climate change. In general, the percentage differences encountered with the GWP during the different stages were also found with the ReCiPe indicator.
Concerning the manufacturing and disposal stage, the results of the LCAb and LCAcc were the same. For both indicators, the environmental impact of the gas boiler was lower than that of the heat pump. This result is in accordance with that of previous studies (e.g., [17]). In particular, with the ReCiPe indicator, the heat pump appeared to be more degrading for the ecosystem quality, while the gas boiler for the resources category.
Nine usage profiles for the heating season and the same for the cooling were adopted, and significant differences were observed from one profile to another in both LCAs, with similar trends but different magnitude. The impacts caused by the heating operation were highest for LCAb, while those of cooling resulted greatest for LCAcc. These results can be justified by the fact that the effects of climate change were not considered in LCAb leading to an overestimation of the heating impacts and an underestimation of those caused by cooling. Regarding heating, the differences were more among the heating profiles (h1, h2, h3) than between one natural ventilation profile to another (v1, v2, v3). Impact values of the order of 800 kgCO2-eq/m2, 400 kgCO2-eq/m2, and 200 kgCO2-eq/m2 were found with LCAb for h1, h3, and h2, respectively. Maximum and minimum variations were observed between h1v1 and h2v2 (−70%), and between h1v1 and h3v1 (−48%). With LCAcc the maximum and minimum impacts were also found for h1v1 and h2v2, with values 24% and 26% lower than those found with LCAb, respectively. Unlike the heating system, the environmental impact of the cooling system varied among the three cooling usage profiles and from one ventilation profile to another. Only with LCAb it was possible to observe a decreasing trend of the impacts moving from c1 to c3 and from v4 to v6. Additionally, while the maximum impact with both LCAb and LCAcc was encountered for the profile c1v4, the minimum impact was found for the profile c2v6 with LCAb and the profile c2v5 with LCAcc. In general, the impact caused by the cooling operation with LCAb was always lower than that calculated with LCAcc in a measure ranging from −33% to −44%.
Regarding the total impact calculated during the entire lifetime, there is a huge difference between the cause of the heating and cooling impacts. In fact, while more than 90% of the heating impact is sourced from the operational stage, that of the cooling is mainly due to the manufacturing and disposal stage for the short-term effect (GWP 20a) and due to operational stage for long-term effect (GWP 100a). With the ReCiPe indicator, the operational stage was predominant for both heating and cooling systems.
The analysis of the annual impact of the system allowed a better understanding of the differences between LCAb and LCAcc and between the results of GWP and ReCiPe.
According to the GWP indicator, the annual impact provided by LCAb was always higher than that obtained with LCAcc. Impact variations between LCAb and LCAcc ranging from 3% to 14% were found. Additionally, the environmental impact of the heating was the main contributor of the annual impact for all the nine usage profiles with LCAb, and for six out nine profiles with LCAcc. With the ReCiPe indicator, the total impact calculated with LCAb was higher than LCAcc only with the first three profiles. Additionally, while with LCAb the impact of the heating was greater than the cooling impact for the first and last three profiles, with LCAcc the heating impact was predominant only for the first three profiles.
This study was the first attempt of including the influence of occupant behaviour and climate change on the assessment of the environmental impact of the heating and cooling systems. Both occupants’ behaviour and climate change appeared to highly affect the environmental performance of the systems. With the ongoing concern with climate change, more attention needs to be dedicated to the cooling demand that showed an increasing impact during the LCA analysis. These findings are important and informative for scientists and policymakers for future regulations and design criteria. A limitation of this investigation consists in the fact that one system typology for heating and cooling were considered and the energy simulations were carried out for a building. Moreover, the study was developed on a real case and conducted for its location in terms of climatic conditions. On the other hand, the outcomes of this study can be considered indicative of what could happen in other Mediterranean countries with similar systems. Moreover, the results of this study encourage further studies to analyse more in deep the influence of the occupant behaviour and consider different typologies of heating and cooling systems, the integration of renewable energy sources, and more climatic zones. As a consequence of these results, future studies on the environmental impacts of heating and cooling systems will have to carefully analyse the operational phase, adopting more realistic and contextualised usage profiles and also considering the influence of climate change.

Author Contributions

Conceptualization, G.F., E.B. and L.F.C.; methodology, G.F., E.B. and L.F.C.; software, G.F.; validation, L.F.C.; formal analysis, G.F.; investigation, G.F. and E.B.; resources, L.F.C. and M.D.S.; data curation, L.F.C.; writing—original draft preparation, G.F.; writing—review and editing, E.B., L.F.C., M.D.S. and L.B.; visualization, G.F.; supervision, L.F.C.; project administration, L.F.C. and M.D.S.; funding acquisition, L.F.C. and M.D.S. All authors have read and agreed to the published version of the manuscript.

Funding

This research was funded by the Calabria Region Government with the Gianmarco Fajilla’s Ph.D. scholarship (POR Calabria FSE/FESR 2014–2020) grant number H21G18000170006. A part of this publication has received funding from Secretaria Nacional de Ciencia y Tecnologia (SENACYT) under the project code FID18-056. This research was partially funded by the Ministerio de Ciencia, Innovación y Universidades de España (RTI2018-093849-B-C31—MCIU/AEI/FEDER, UE) and by the Ministerio de Ciencia, Innovación y Universidades—Agencia Estatal de Investigación (AEI) (RED2018-102431-T). This work is partially supported by ICREA under the ICREA Academia programme.

Institutional Review Board Statement

Not applicable.

Informed Consent Statement

Informed consent was obtained from all subjects involved in the study.

Data Availability Statement

Data are available upon request to the corresponding author.

Acknowledgments

The authors would like to thank the Catalan Government for the quality accreditation given to their research group (2017 SGR 1537). GREiA is a certified agent TECNIO in the category of technology developers from the Government of Catalonia.

Conflicts of Interest

The authors declare no conflict of interest.

References

  1. United Nations. The Sustainable Development Goals Report 2021; United Nations Department of Economic and Social Affairs Statistics Division: New York, NY, USA, 2021. [Google Scholar] [CrossRef]
  2. UN General Assembly. Transforming Our World: The 2030 Agenda for Sustainable Development; A/RES/70/1; UN General Assembly: New York, NY, USA, 2015. [Google Scholar]
  3. IPCC 2021: Summary for Policymakers. In Climate Change 2021: The Physical Science Basis. Contribution of Working Group I to the Sixth Assessment Report of the Intergovernmental Panel on Climate Change; Cambridge University Press: Cambridge, UK, 2021.
  4. European Commission. EU Green Deal 2020. Available online: https://ec.europa.eu/info/strategy/priorities-2019-2024/european-green-deal_en (accessed on 29 July 2021).
  5. Whitehelm Capital. Feature Article: The European Heat Sector-Challenges and Opportunities in a Hot Market; Whitehelm Advisers: London, UK, 2019. [Google Scholar]
  6. Castaño-Rosa, R.; Solís-Guzmán, J.; Marrero, M. Energy poverty goes south? Understanding the costs of energy poverty with the index of vulnerable homes in Spain. Energy Res. Soc. Sci. 2020, 60, 101325. [Google Scholar] [CrossRef]
  7. Castro, M.d.F.; Colclough, S.; Machado, B.; Andrade, J.; Bragança, L. European legislation and incentives programmes for demand Side management. Sol. Energy 2020, 200, 114–124. [Google Scholar] [CrossRef] [Green Version]
  8. Araújo, C.; Almeida, M.; Bragança, L.; Barbosa, J.A. Cost-benefit analysis method for building solutions. Appl. Energy 2016, 173, 124–133. [Google Scholar] [CrossRef] [Green Version]
  9. Rey-Hernández, J.M.; Yousif, C.; Gatt, D.; Velasco-Gómez, E.; San José-Alonso, J.; Rey-Martínez, F.J. Modelling the long-term effect of climate change on a zero energy and carbon dioxide building through energy efficiency and renewables. Energy Build. 2018, 174, 85–96. [Google Scholar] [CrossRef]
  10. Streimikiene, D.; Balezentis, T.; Alebaite, I. Climate change mitigation in households between market failures and psychological barriers. Energies 2020, 13, 2797. [Google Scholar] [CrossRef]
  11. Ramesh, T.; Prakash, R.; Shukla, K.K. Life cycle energy analysis of buildings: An overview. Energy Build. 2010, 42, 1592–1600. [Google Scholar] [CrossRef]
  12. Asdrubali, F.; Baldassarri, C.; Fthenakis, V. Life cycle analysis in the construction sector: Guiding the optimization of conventional Italian buildings. Energy Build. 2013, 64, 73–89. [Google Scholar] [CrossRef]
  13. Sartori, I.; Hestnes, A.G. Energy use in the life cycle of conventional and low-energy buildings: A review article. Energy Build. 2007, 39, 249–257. [Google Scholar] [CrossRef]
  14. Cabeza, L.F.; Rincón, L.; Vilariño, V.; Pérez, G.; Castell, A. Life cycle assessment (LCA) and life cycle energy analysis (LCEA) of buildings and the building sector: A review. Renew. Sustain. Energy Rev. 2014, 29, 394–416. [Google Scholar] [CrossRef]
  15. Shah, V.P.; Debella, D.C.; Ries, R.J. Life cycle assessment of residential heating and cooling systems in four regions in the United States. Energy Build. 2008, 40, 503–513. [Google Scholar] [CrossRef]
  16. Vignali, G. Environmental assessment of domestic boilers: A comparison of condensing and traditional technology using life cycle assessment methodology. J. Clean. Prod. 2017, 142, 2493–2508. [Google Scholar] [CrossRef]
  17. Greening, B.; Azapagic, A. Domestic heat pumps: Life cycle environmental impacts and potential implications for the UK. Energy 2012, 39, 205–217. [Google Scholar] [CrossRef]
  18. Llantoy, N.; Zsembinszki, G.; Palomba, V.; Frazzica, A.; Dallapiccola, M.; Trentin, F.; Cabeza, L.F. Life cycle assessment of an innovative hybrid energy storage system for residential buildings in Continental climates. Appl. Sci. 2021, 11, 3820. [Google Scholar] [CrossRef]
  19. Zsembinszki, G.; Llantoy, N.; Palomba, V.; Frazzica, A.; Dallapiccola, M.; Trentin, F.; Cabeza, L.F. Life cycle assessment (LCA) of an innovative compact hybrid electrical-thermal storage system for residential buildings in Mediterranean climate. Sustainability 2021, 13, 5322. [Google Scholar] [CrossRef]
  20. Karkour, S.; Ihara, T.; Kuwayama, T.; Yamaguchi, K.; Itsubo, N. Life cycle assessment of residential air conditioners considering the benefits of their use: A case study in Indonesia. Energies 2021, 14, 447. [Google Scholar] [CrossRef]
  21. Bazazzadeh, H.; Nadolny, A.; Safaei, S.S.H. Climate change and building energy consumption: A review of the impact of weather parameters influenced by climate change on household heating and cooling demands of buildings. Eur. J. Sustain. Dev. 2021, 10, 1–12. [Google Scholar] [CrossRef]
  22. Barbosa, R.; Vicente, R.; Santos, R. Climate change and thermal comfort in Southern Europe housing: A case study from Lisbon. Build. Environ. 2015, 92, 440–451. [Google Scholar] [CrossRef]
  23. Verichev, K.; Zamorano, M.; Carpio, M. Effects of climate change on variations in climatic zones and heating energy consumption of residential buildings in the southern Chile. Energy Build. 2020, 215, 109874. [Google Scholar] [CrossRef]
  24. Tootkaboni, M.P.; Ballarini, I.; Corrado, V. Analysing the future energy performance of residential buildings in the most populated Italian climatic zone: A study of climate change impacts. Energy Rep. 2021, 7, 8548–8560. [Google Scholar] [CrossRef]
  25. Ciancio, V.; Falasca, S.; Golasi, I.; de Wilde, P.; Coppi, M.; de Santoli, L.; Salata, F. Resilience of a building to future climate conditions in three European cities. Energies 2019, 12, 4506. [Google Scholar] [CrossRef] [Green Version]
  26. Berardi, U.; Jafarpur, P. Assessing the impact of climate change on building heating and cooling energy demand in Canada. Renew. Sustain. Energy Rev. 2020, 121, 109681. [Google Scholar] [CrossRef]
  27. Andric, I.; Al-Ghamdi, S.G. Climate change implications for environmental performance of residential building energy use: The case of Qatar. Energy Rep. 2020, 6, 587–592. [Google Scholar] [CrossRef]
  28. Yan, D.; Hong, T.; Dong, B.; Mahdavi, A.; D’Oca, S.; Gaetani, I.; Feng, X. IEA EBC Annex 66: Definition and simulation of occupant behavior in buildings. Energy Build. 2017, 156, 258–270. [Google Scholar] [CrossRef] [Green Version]
  29. O’Brien, W.; Wagner, A.; Schweiker, M.; Mahdavi, A.; Day, J.; Kjærgaard, M.B.; Carlucci, S.; Dong, B.; Tahmasebi, F.; Yan, D.; et al. Introducing IEA EBC Annex 79: Key challenges and opportunities in the field of occupant-centric building design and operation. Build. Environ. 2020, 178, 106738. [Google Scholar] [CrossRef]
  30. Lucon, O.; Ürge-Vorsatz, D.; Zain Ahmed, A.; Akbari, H.; Bertoldi, P.; Cabeza, L.F.; Eyre, N.; Gadgil, A.; Harvey, L.D.D.; Jiang, Y.; et al. Chapter 9, Buildings. In Climate Change 2014: Mitigation of Climate Change. Contribution of Working Group III to the Fifth Assessment Report of the Intergovernmental Panel on Climate Change; Cambridge University Press: Cambridge, UK, 2014; pp. 671–738. [Google Scholar]
  31. Carlucci, S.; De Simone, M.; Firth, S.K.; Kjærgaard, M.B.; Markovic, R.; Rahaman, M.S.; Annaqeeb, M.K.; Biandrate, S.; Das, A.; Dziedzic, J.W.; et al. Modeling occupant behavior in buildings. Build. Environ. 2020, 174, 106768. [Google Scholar] [CrossRef]
  32. Laskari, M.; de Masi, R.-F.; Karatasou, S.; Santamouris, M.; Assimakopoulos, M. On the impact of user behaviour on heating energy consumption and indoor temperature in residential buildings. Energy Build. 2021, 111657. [Google Scholar] [CrossRef]
  33. Fajilla, G.; De Simone, M.; Cabeza, L.F.; Bragança, L. Assessment of the impact of occupants’ behavior and climate change on heating and cooling energy needs of buildings. Energies 2020, 13, 6468. [Google Scholar] [CrossRef]
  34. Su, S.; Li, X.; Lin, B.; Li, H.; Yuan, J. A comparison of the environmental performance of cooling and heating among different household types in China’s hot summer-cold winter zone. Sustainability 2019, 11, 5724. [Google Scholar] [CrossRef] [Green Version]
  35. Negishi, K.; Tiruta-Barna, L.; Schiopu, N.; Lebert, A.; Chevalier, J. An operational methodology for applying dynamic life cycle assessment to buildings. Build. Environ. 2018, 144, 611–621. [Google Scholar] [CrossRef]
  36. Su, S.; Li, X.; Zhu, Y.; Lin, B. Dynamic LCA framework for environmental impact assessment of buildings. Energy Build. 2017, 149, 310–320. [Google Scholar] [CrossRef]
  37. O’Brien, W.; Tahmasebi, F.; Andersen, R.K.; Azar, E.; Barthelmes, V.; Belafi, Z.D.; Berger, C.; Chen, D.; De Simone, M.; D’Oca, S.; et al. An international review of occupant-related aspects of building energy codes and standards. Build. Environ. 2020, 179, 106906. [Google Scholar] [CrossRef]
  38. Köppen, W.P.; Geiger, R. Handbuch der Klimatologie; Gebrüder Borntraeger: Berlin, Germany, 1930. (In German) [Google Scholar]
  39. Italian Standardization Body. UNI/TS 11300-1 Energy Performance of Buildings, Part 1: Evaluation of Energy Need for Space Heating and Cooling; Italian Standardization Body: Milan, Italy; Rome, Italy, 2014. [Google Scholar]
  40. Mora, D.; Carpino, C.; De Simone, M. Energy consumption of residential buildings and occupancy profiles. A case study in Mediterranean climatic conditions. Energy Effic. 2018, 11, 121–145. [Google Scholar] [CrossRef]
  41. ASHRAE ANSI/ASHRAE. Guideline 14-2002 Measurement of Energy and Demand Savings; ASHRAE: Peachtree Corners, GA, USA, 2002. [Google Scholar]
  42. DesignBuilder. DesignBuilder Version 6.1.6.008. DesignBuilder Software Ltd. 2020. Available online: http://www.designbuilder.co.uk/ (accessed on 1 February 2020).
  43. Meteonorm. Meteonorm Global Meteorogical Database Version 7.1.8.; METEOTEST: Bern, Switzerland, 2012. [Google Scholar]
  44. Jentsch, M.F.; Bahaj, A.B.S.; James, P.A.B. Climate change future proofing of buildings-Generation and assessment of building simulation weather files. Energy Build. 2008, 40, 2148–2168. [Google Scholar] [CrossRef]
  45. Ciancio, V.; Salata, F.; Falasca, S.; Curci, G.; Golasi, I.; de Wilde, P. Energy demands of buildings in the framework of climate change: An investigation across Europe. Sustain. Cities Soc. 2020, 60, 102213. [Google Scholar] [CrossRef]
  46. Met Office. Met office HadCM3: Met Office Climate Prediction Model. Available online: https://www.metoffice.gov.uk/research/approach/modelling-systems/unified-model/climate-models/hadcm3 (accessed on 15 March 2020).
  47. Guinée, J.B.; Gorrée, M.; Heijungs, R.; Huppes, G.; Kleijn, R.; de Koning, A.; van Oers, L.; Wegener Sleeswijk, A.; Suh, S.; Udo De Haes, H.a. Life Cycle Assessment: An Operational Guide to the ISO Standards; Kluwer Academic Publishers: Dordrecht, Germany, 2001. [Google Scholar]
  48. ISO 14040:2006(en). Environmental Management-Life Cycle Assessment-Principles and Framework; ISO: Geneva, Switzerland, 2006. [Google Scholar]
  49. ISO 14044:2006(en). Environmental Management-Life Cycle Assessment-Requirements and Guidelines; ISO: Geneva, Switzerland, 2006. [Google Scholar]
  50. Frischknecht, R.; Jungbluth, N.; Althaus, H.; Doka, G.; Dones, R.; Heck, T.; Hellweg, S.; Hischier, R.; Nemecek, T.; Rebitzer, G.; et al. The ecoinvent database: Overview and methodological framework. Int. J. Life Cycle Assess. 2005, 10, 3–9. [Google Scholar] [CrossRef]
  51. Joint Research Centre European Commission. International Reference Life Cycle Data System (ILCD) Handbook: Analysing of existing Environmental Impact Assessment methodologies for Use in Life Cycle Assessment; Publications Office of the European Union: Luxembourg, 2010. [Google Scholar]
  52. Joint Research Centre European Commission. Recommendations for Life Cycle Impact Assessment in the European Context-Based on Existing Environmental Impact Assessment Models and Factors (International Reference Life Cycle Data System—ILCD Handbook); Publications Office of the European Union: Luxembourg, 2011; ISBN 9789279174513. [Google Scholar]
  53. Llantoy, N.; Chàfer, M.; Cabeza, L.F. A comparative life cycle assessment ( LCA ) of different insulation materials for buildings in the continental Mediterranean climate. Energy Build. 2020, 225, 110323. [Google Scholar] [CrossRef]
  54. Ben-Alon, L.; Loftness, V.; Harries, K.A.; Cochran Hameen, E. Life cycle assessment (LCA) of natural vs conventional building assemblies. Renew. Sustain. Energy Rev. 2021, 144, 110951. [Google Scholar] [CrossRef]
Figure 1. Life cycle assessment framework. Adapted from [48].
Energies 14 08356 g001
Figure 2. Life cycle assessment: (a) Considered as a benchmark (LCAb); and (b) proposed in this study (LCAcc).
Energies 14 08356 g002
Figure 3. Results per m2 of floor area during the manufacturing and disposal stage using the indicators: (a) IPCC GWP 20a and GWP 100a; and (b) ReCiPe.
Energies 14 08356 g003
Figure 4. Comparison of the results per m2 of floor area during the operational stage using the indicator IPCC GWP 20a and GWP 100a calculated: For heating with (a) LCAb; and (b) LCAcc; and for cooling with (c) LCAb; and (d) LCAcc.
Energies 14 08356 g004
Figure 5. Comparison of the results per m2 of floor area during the operational stage using the indicator ReCiPe calculated: For heating with (a) LCAb; and (b) LCAcc; and for cooling with (c) LCAb; and (d) LCAcc.
Energies 14 08356 g005aEnergies 14 08356 g005b
Figure 6. Comparison of the total results per m2 of floor area (manufacturing and disposal + operational stage) using the indicator IPCC GWP 20a and GWP 100a calculated: For heating with (a) LCAb; and (b) LCAcc; and for cooling with (c) LCAb; and (d) LCAcc.
Energies 14 08356 g006aEnergies 14 08356 g006b
Figure 7. Comparison of the total results per m2 of floor area (manufacturing and disposal + operational stage) using the indicator ReCiPe calculated: For heating with (a) LCAb; and (b) LCAcc; and for cooling with (c) LCAb; and (d) LCAcc.
Energies 14 08356 g007
Figure 8. Comparison of the annual results per m2 of floor area (manufacturing and disposal + operational stage) for heating and cooling calculated: using the indicator IPCC GWP 20a with (a) LCAb; and (b) LCAcc; and using the indicator IPCC GWP 100a with (c) LCAb; and with (d) LCAcc.
Energies 14 08356 g008
Figure 9. Comparison of the annual results per m2 of floor area (manufacturing and disposal + operational stage) for heating and cooling using the indicator ReCiPe calculated with: (a) LCAb; and (b) LCAcc.
Energies 14 08356 g009
Figure 10. Energy consumption [kWh/year] by varying the setpoint temperatures of ±2 °C for (a) heating; and (b) cooling.
Energies 14 08356 g010
Table 1. Daily heating, cooling, and natural ventilation schedules summary.
HeatingNatural Ventilation in Winter
h1: Continuous for 24 hv1: Continuous from 07:00 to 15:00
h2: Limited to the evening (from 19:00 to 22:00)v2: Limited to the morning hours (from 08:00 to 13:00)
h3: Discontinuous during the day (from 07:00 to 09:00 and from 19:00 to 22:00)v3: Intermittent but prolonged throughout the day
CoolingNatural Ventilation in Summer
c1: During the hottest hours of the day (from 12:00 to 18:00) in the living zone, and in two-time ranges (from 08:00 to 11:00, and from 14:00 to 17:00) in the bedroomsv4: Continuous from 07:00 to 19:00
c2: Limited to the afternoon (from 14:00 to 17:00) in the living and bedrooms zones, and the late evening (from 22:00 to 01:00) only in the bedroomsv5: Concentrated in the coldest hours of the day in the living and bedrooms area, and continuous for 24 h in the bathrooms
c3: Limited to the late afternoon (from 19:00 to 22:00) in the living zone, and from 22:00 to 07:00 in the bedroomsv6: Prolonged use in the coolest hours in the living and bedrooms area, and continuous for 24 h in the bathrooms
Table 2. Daily heating schedules (On = 1, Off = 0). Adapted from [33].
ProfileAll Rooms
h1 Energies 14 08356 i001
h2 Energies 14 08356 i002
h3 Energies 14 08356 i003
Table 3. Daily natural ventilation schedules in winter (Open = 1, Close = 0). Adapted from [33].
ProfileLiving ZoneBedrooms ZoneBathrooms Zone
v1 Energies 14 08356 i004 Energies 14 08356 i005 Energies 14 08356 i006
v2 Energies 14 08356 i007 Energies 14 08356 i008 Energies 14 08356 i009
v3 Energies 14 08356 i010 Energies 14 08356 i011 Energies 14 08356 i012
Table 4. Daily cooling schedules (On = 1, Off = 0). Adapted from [33].
ProfileLiving ZoneBedrooms Zone
c1 Energies 14 08356 i013 Energies 14 08356 i014
c2 Energies 14 08356 i015 Energies 14 08356 i016
c3 Energies 14 08356 i017 Energies 14 08356 i018
Table 5. Daily natural ventilation schedules in summer (Open = 1, Close = 0). Adapted from [33].
ProfileLiving ZoneBedrooms ZoneBathrooms Xone
v4 Energies 14 08356 i019 Energies 14 08356 i020 Energies 14 08356 i021
v5 Energies 14 08356 i022 Energies 14 08356 i023 Energies 14 08356 i024
v6 Energies 14 08356 i025 Energies 14 08356 i026 Energies 14 08356 i027
Table 6. Energy consumption [kWh/year] for heating and cooling with setpoint temperatures of 20 °C (heating) and 26 °C (cooling).
SeasonProfilesConsumption [kWh/year]
202020502080
Heatingh1v1229917561220
h1v2209916001103
h1v3228717511220
h2v1720534350
h2v2682505328
h2v3771572380
h3v11196906620
h3v21073809544
h3v31185899615
Coolingc1v4233367479
c1v5205310403
c1v6198314414
c2v4202312405
c2v5184271343
c2v6178276356
c3v4196322445
c3v5192343492
c3v6179323463
Table 7. Heating and cooling systems.
ComponentVariableValueUnit
Gas boilerNominal heat output24kW
Air-source heat pumpCapacity10kW
Table 8. Inventory of the heating and cooling systems.
ElementQuantityUnit of MeasurementLifespan (Years)ReplacementTotal Amount
Gas boiler1Unit204.54.5
Heat pump1Unit204.54.5
Table 9. Impact assessment during the manufacturing and disposal stage.
ElementUnitGWP 20aGWP 100aReCiPe
[kgCO2-eq/m2][kgCO2-eq/m2][Impact Point/m2]
Gas boiler4.529.9225.897.83
Heat pump4.5179.8180.9916.53
Table 10. Impact assessment during the operational stage for 90-year lifetime (LCAb).
SeasonProfileGWP 20aGWP 100aReCiPe
[kgCO2-eq/m2][kgCO2-eq/m2][Impact Point/m2]
Heatingh1v1856.55694.3967.04
h1v2782.13634.0661.21
h1v3852.15690.8266.69
h2v1268.33217.5321.00
h2v2254.12206.0119.89
h2v3287.11232.7522.47
h3v1445.65361.2834.88
h3v2399.82324.1331.29
h3v3441.40357.8434.55
Coolingc1v4119.20109.3822.33
c1v5104.9496.3019.66
c1v6101.3593.0018.98
c2v4103.2594.7419.34
c2v593.9286.1817.59
c2v690.9583.4617.03
c3v4100.2491.9818.77
c3v597.9489.8718.34
c3v691.6784.1217.17
Table 11. Impact assessment during the operational stage for 90-year lifetime (LCAcc).
SeasonProfileGWP 20aGWP 100aReCiPe
[kgCO2-eq/m2][kgCO2-eq/m2][Impact Point/m2]
Heatingh1v1655.08531.0651.27
h1v2596.45483.5346.68
h1v3653.05529.4251.11
h2v1199.24161.5215.59
h2v2188.20152.5714.73
h2v3213.95173.4516.74
h3v1338.14274.1226.46
h3v2301.31244.2723.58
h3v3335.16271.7026.23
Coolingc1v4183.79168.6534.42
c1v5156.54143.6429.32
c1v6157.88144.8829.57
c2v4156.24143.3729.26
c2v5135.82124.6425.44
c2v6138.03126.6625.85
c3v4164.09150.5730.73
c3v5174.92160.5232.76
c3v6164.48150.9330.81
Table 12. Impact variations by varying the setpoint temperatures of ±2 °C.
SeasonProfilesLCAbLCAcc
−2 °C+2 °C−2 °C+2 °C
[Variations (%) of Both GWP and ReCiPe]
Heatingh1v1−48+62−53+72
h1v2−50+64−54+75
h1v3−48+61−52+71
h2v1−54+75−58+87
h2v2−55+77−59+90
h2v3−53+72−57+84
h3v1−50+66−54+77
h3v2−52+70−56+82
h3v3−50+66−54+77
Coolingc1v4+62−49+47−42
c1v5+62−48+47−42
c1v6+66−50+49−43
c2v4+62−47+44−40
c2v5+68−49+57−42
c2v6+67−51+51−44
c3v4+68−50+47−40
c3v5+75−56+51−48
c3v6+77−57+53−48
Publisher’s Note: MDPI stays neutral with regard to jurisdictional claims in published maps and institutional affiliations.

