Article

Proposal of a Novel Mooring System Using Three-Bifurcated Mooring Lines for Spar-Type Off-Shore Wind Turbines

1
China Southern Power Grid Technology Co., Ltd., Guangzhou 510080, China
2
School of Civil and Hydraulic Engineering, Huazhong University of Science and Technology, Wuhan 430074, China
*
Authors to whom correspondence should be addressed.
Energies 2021, 14(24), 8303; https://doi.org/10.3390/en14248303
Submission received: 9 October 2021 / Revised: 11 November 2021 / Accepted: 11 November 2021 / Published: 9 December 2021
(This article belongs to the Special Issue Innovations in Floating Wind Turbine Design)

Abstract

:
Floating wind turbine vibration controlling becomes more and more important with the increase in wind turbine size. Thus, a novel three-bifurcated mooring system is proposed for Spar-type floating wind turbines. Compared with the original mooring system using three mooring lines, three-bifurcated sub-mooring-lines are added into the novel mooring system. Specifically, each three-bifurcated sub-mooring-line is first connected to a Spar-type platform using three fairleads, then it is connected to the anchor using the main mooring line. Six fairleads are involved in the proposed mooring system, theoretically resulting in larger overturning and torsional stiffness. For further improvement, a clump mass is attached onto the main mooring lines of the proposed mooring system. The wind turbine surge, pitch, and yaw movements under regular and irregular waves are calculated to quantitatively examine the mooring system performances. A recommended configuration for the proposed mooring system is presented: the three-bifurcated sub-mooring-line and main mooring line lengths should be (0.0166, 0.0111, 0.0166) and 0.9723 times the total mooring line length in the traditional mooring system. The proposed mooring system can at most reduce the wind turbine surge movement 37.15% and 54.5% when under regular and irregular waves, respectively, and can at most reduce the yaw movement 30.1% and 40% when under regular and irregular waves, respectively.

1. Introduction

Wind energy, as a popular, clean, and renewable energy resource, has been extensively exploited worldwide. By contrast with onshore wind turbines, offshore wind turbines are commonly used in better wind conditions; specifically, sea wind generally has a larger wind velocity and smaller turbulence intensity. Simultaneously, it is not essential to consider noise-associated problems resulting from offshore wind turbines due to the fact that they are installed away from urban areas [1]. Thus, offshore wind turbines are one of the hot research spots in wind engineering. However, most wind resources spread in sea areas where water depths are greater than 60 m [2]. Hence, it is urgently required to develop mature offshore floating wind turbines. Compared with submersible and tension-leg-platform foundations, the Spar-type platform has an average draft of 120 m and can be utilized in sea areas where the water depths are larger than 320 m [3]. Meanwhile, the Spar-type structure is simpler than the others and has smaller movements when under external loads; thus, it has been widely studied in past decades. Nowadays, as the wind turbine size increases, the excessive wind turbine vibration is affecting offshore floating wind turbine safety. Therefore, it is valuable and meaningful for real engineering to figure out how to effectively control the Spar-type floating wind turbine vibrations.
First, the blade pitch control system was found to be useful for wind turbine vibration control. In 2016, Lan et al. [4] realized controlling the wind turbine vibration through adaptive blade pitch control (sliding mode). Next, Yin et al. [5] proposed a novel electrical–hydraulic pitch control system for wind turbines, which consisted of a hydraulic pump, hydraulic motor, and pitch control gear. That pitch control system enabled wind turbines to harvest more wind energy as much as possible; as well, it reduced the wind turbine vibration by tuning the blade pitch angle. Subsequently, Zhang et al. [6] invented an adaptive super-twisting generator controller based on an integral blade pitch control strategy for floating wind turbines. Their numerical results showed that the invented controller could adaptively reduce the rotor speed of offshore wind turbines, thus controlling the wind turbine vibration. Innovatively, Li et al. [7] developed a dual multi-variable model-free adaptive individual pitch control system for wind turbines, which kept the dynamic balance between the load control and power control when under nominal conditions. Even in the actuator fault condition, that control system could react opportunely, achieving almost the same well performance in power and load control as those in the nominal condition. The above-mentioned pitch control strategies are effective in reducing the wind turbine vibrations. However, the cost of wind turbine vibration control through pitch control is power reduction. Generally, the blade pitch angle should be tuned to reduce the wind load on the blade. In this case, the total wind load on the wind turbine rotor reduces as well, resulting in smaller shaft torque and further smaller energy output. As well, frequent pitch control would reduce the pitch control system lifetime and increase its fault probability.
Then, some researchers applied a tuned mass damper (TMD) in the wind turbine nacelle to reduce its vibration. Alkmin et al. [8] applied a tuned liquid column damper in the wind turbine nacelle, which could reduce the tower top and nacelle vibration effectively. He et al. [9] applied the TMD in the floating wind turbine nacelle to control excessive floating wind turbine vibration under the coupling impact of wind and waves. The artificial fish swarm algorithm (AFSA) was utilized to globally optimize the TMD parameters. The numerical results in their studies showed that the optimized TMD can effectively reduce the wind turbine vibration. Differing with He et al. [9], Yang et al. [10] installed the TMD in a floating wind turbine platform. In the study of Yang et al. [10], the TMD reduces at most 50% of the wind turbine vibration. Innovatively, Liu et al. [11] installed the TMD in the wind turbine nacelle to control the wind turbine fore–aft vibration, and they utilized GPU (graphic processing unit)-accelerating technology and genetic algorithm to globally optimize the TMD parameters. The optimized TMD could reduce the tower bottom equivalent fatigue load by approximately 40%. Meanwhile, Chen et al. [12] utilized the artificial fish swarm algorithm (AFSA) to globally optimize the TMD parameters. Subsequently, to control both the wind turbine fore–aft and side–side vibrations, Jahangiri et al. [13] proposed a 3D pounding pendulum TMD, which performed better than using two independent TMDs to control the wind turbine vibrations in fore–aft and side–side directions, respectively. Importantly, the proposed pendulum TMD requires smaller space than using two TMDs. Although applying the TMD in a wind turbine can reduce its vibration effectively, the TMD generates an additional cost, resulting in a higher cost of electricity for the wind turbine. As well, the wind turbine tower should be strengthened after applying the TMD due to the larger nacelle mass. These limit the wind turbine TMD application in real engineering.
Subsequently, some researchers proposed to improve the offshore wind turbine platform to reduce the floating wind turbine vibration. For the Spar-type wind turbine, Wang et al. [14] added a heave plate on the wind turbine platform, which was found to be effective in controlling the platform heave movement. It could be explained that the Spar-type platform with a heave plate had a larger added mass coefficient in the heave direction than without a heave plate. Simultaneously, Chen et al. [15] also applied a heave plate on a wind turbine platform. Further, they optimized the structural parameters of the heave plate through dozens of numerical simulations. However, attaching a heave plate onto the Spar-type platform is complicated in real engineering. Interestingly, Zheng and Lei [16] combined the Spar-type platform and a fish cage, utilizing the fish cage to enlarge the platform damping, further controlling the platform movement. Ahn and Shin [17] numerically studied the movement characteristics of the Spar-type platform under wind and waves. Liu et al. [18] attached a clump mass onto the mooring lines to control the Spar-type platform movement. Next, Leimeister et al. [19] tried to control the wind turbine vibration through optimizing the Spar-type platform structural parameters. Recently, Yue et al. [20] reduced the floating Spar-type wind turbine vibration through adding a heave plate onto the floating platform, similar to Wang et al. [14] and Chen et al. [15]. As mentioned before, adding a heave plate would make the Spar-type platform more complicated, and attaching a clump mass on the mooring lines had small effects on the wind turbine pitch and yaw movements.
Therefore, this study reduces floating wind turbine movements through improving the Spar-type platform mooring system. Larger platform overturning and torsional stiffnesses are desired in the developed mooring system. When examining the performance of the developed mooring system, an experiment and numerical simulation can be conducted. However, an experiment can only test some typical cases because the mooring system configuration can hardly be randomly varied in experiments. As well, an actual wave maker can only generate waves within designed wave periods and height ranges. To this end, a numerical simulation is adopted. OpenFAST (developed by National Renewable Energy Laboratory) [21] is employed to simulate the wind and wave interactions of the floating Spar-type wind turbine.
In summary, this study develops the original Spar-type platform mooring system with three identical mooring lines and three fairleads. Specifically, the three-bifurcated sub-mooring-line is adopted to directly connect the Spar-type platform. Three fairleads on the platform are utilized to connect one sub-mooring-line. The three-bifurcated sub-mooring-line converges to a same joint; next, the main mooring line is used to connect the joint and anchor. In the proposed three-bifurcated mooring system, a total of six fairleads are involved on the Spar-type platform, with three of them higher than the others. Consequently, by contrast with the original mooring system, the developed three-bifurcated mooring system theoretically has larger overturning and torsional stiffnesses. Further, inspired by Liu et al. [18], a clump mass is attached onto the main mooring lines in the three-bifurcated mooring system to improve its resistance ability. The wind turbine surge, pitch, and yaw movements under regular and irregular waves are calculated and analyzed to quantitatively examine the performance of the proposed mooring systems as well as to optimize the three-bifurcated mooring system. The non-dimensional structural parameters of the proposed mooring systems are presented for wider application of this study.

2. Numerical Methods

This section introduces the numerical methods used in this study for calculating dynamic response of Spar-type offshore wind turbine under coupling impact of wind and waves. OpenFAST [21], developed by National Renewable Energy Laboratory (NREL), was utilized. Specifically, wind load on wind turbine rotor is computed using the blade element momentum method [22]. Regular and irregular waves are, respectively, simulated to examine wind turbine dynamic response under different wave conditions. Airy wave theory is employed to model regular waves [23], and Jonswap wave spectrum is utilized to generate irregular waves [24]. Wave load on Spar-type floating platform is calculated using potential flow theory. Subsequently, quasi-static mooring system model [25] is used to compute mooring line tensions. Finally, dynamic response of Spar-type wind turbine can be solved by regarding the wind turbine as a rigid body. Detailed formulations of the above-mentioned theories can be found in following subsections.

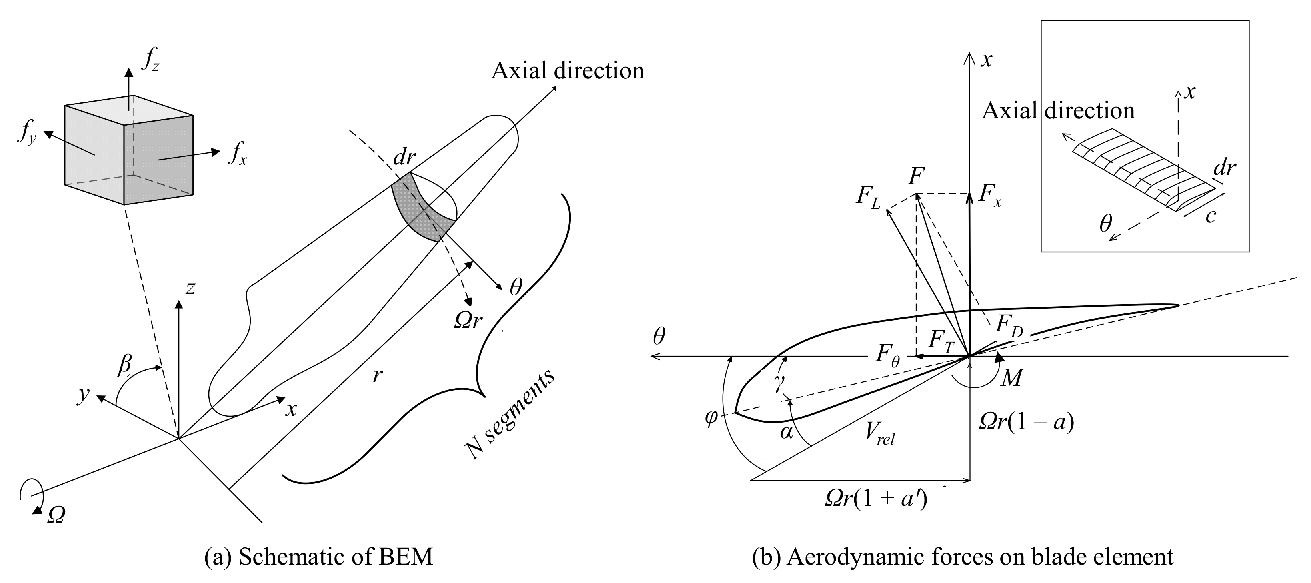
2.1. Blade Element Momentum Method

Blade element momentum method (BEM) [22] divides wind turbine blade into several independent blade elements along its axial direction. Wind load on each blade element can be calculated according to their airfoil characteristics; next, wind load on entire wind turbine blade can be solved by integrating wind loads on each blade element along blade axial direction. BEM is set up based on the following two assumptions:
  • For two-dimensional wind flow, aerodynamic lift and drag forces acting on blade element that has blade elements at its both sides are the same as those acting on isolated blade element;
  • There is no interaction between any two adjacent annular flows swept by two independent blade elements along blade axial direction; thus, aerodynamic forces on each blade element are only the functions of momentum variation ratio of annular flow.
Assuming that wind turbine blade is divided into N blade elements with dr representing width or axial length of each blade element, schematic of BEM is shown in Figure 1a. Aerodynamic forces on each blade element are presented in Figure 1b. Then, aerodynamic lift (dFL), drag (dFD), axial (dFT), and momentum (dM) forces of each blade element can be, respectively, calculated using following equations:
dL = 1 2 ρ BV rel 2 cC l dr ,
dD = 1 2 ρ BV r e l 2 cC d dr ,
dT = 1 2 ρ BC n V 1 2 ( 1 a ) 2 c dr sin 2 φ ,
dM = 1 2 ρ BC t V 1 ( 1 a ) ω r ( 1 + a ) c rdr sin φ cos φ ,
in which ρ is air density; B means the number of blades on wind turbine rotor, which is equal to 3 in this study; Vrel indicates local relative wind velocity for specified blade element; c denotes blade element chord length; Cl and Cd are lift and drag coefficients, respectively; Cn and Ct are normal and thrust coefficients, respectively; V1 represents incoming wind velocity; a and a′ are axial and tangential induce factors, respectively; φ is attack angle; Ω denotes rotor angular velocity; r means width or axial length of each blade element. Generally, Cl and Cd are inherent properties of blade element; next, Cn and Ct can be calculated as
C n = C l cos φ + C d sin φ ,
C t = C l sin φ C d cos φ ,
In Equations (3) and (4), a and a’ can be, respectively, calculated as
a = Bc ( C l cos φ + C d sin φ ) 8 π r sin 2 φ + Bc ( C l cos φ + C d sin φ ) ,
a = Bc ( C l sin φ C d cos φ ) 8 π r sin φ cos φ Bc ( C l sin φ C d cos φ ) ,

2.2. Wave Making Theory

2.2.1. Regular Wave

In this study, regular waves were modeled using Airy wave theory [23], which assumes that slightly nonlinear wave surface approximately has linear cosine profile. Simultaneously, water flows are assumed to be theoretically ideal, indicating that they are incompressible and have no vortex and viscosity, enabling that wave flow field can be predicted by solving a velocity potential function. When using Airy wave theory to model regular waves, wave surface elevation can be computed using
η = A sin ( ω t kx ) ,
where A is wave amplitude; ω means wave angular frequency, which can be calculated as ω = 2 π / T with T as wave period; k denotes wave number, which can be computed using k = 2 π / L with L as wave length. Subsequently, horizontal and vertical velocity and acceleration of water particles can be, respectively, calculated using
v x = η x = A ω ch k ( z + d ) sh kd sin ( ω t kx ) ,
v z = η z = A ω sh k ( z + d ) sh kd cos ( ω t kx ) ,
a x = η x = A ω 2 ch k ( z + d ) sh kd sin ( ω t kx ) ,
a z = η z = A ω 2 sh k ( z + d ) sh kd cos ( ω t kx ) ,
in which vx and vz are horizontal and vertical water particle velocities, respectively; x and z are horizontal and vertical distances of measured water particle, respectively; d denotes water depth; ax and az are horizontal and vertical water particle accelerations, respectively.
Wind turbine movements under irregular waves are extremely nonlinear, which makes it difficult to observe how floating wind turbine moves when under wave impacts, and it is hard to find inner relations between wind turbine dynamic response and incoming wave condition [26]. Hence, in this study, wind turbine dynamic response was examined under regular waves along with that under irregular waves.

2.2.2. Irregular Wave

In reality, real sea waves are generally irregular with complicated wave surface profile. To numerically model irregular waves, researchers found that irregular waves can be regarded as superposition of infinite linear regular waves with different wave amplitudes, periods, and initial phases [27]. That is, water surface elevation of irregular waves can be expressed as
η = n = 1 N a n cos ( ω n + ε n ) ,
where n denotes the nth regular wave; a n , ω n , and ε n are wave amplitude, angular frequency, and initial phase of the nth regular wave.
Assuming that the irregular wave consists of infinite number of regular waves, regular wave angular frequencies distribute between 0 and . Then, regular wave energy of the waves that has angular frequencies between ω and ω + d ω can be calculated using
E = ω ω + d ω 0.5 ρ ga n 2 ,
using S ( ω ) d ω to substitute E in Equation (15), Equation (15) becomes
S ( ω ) d ω = ω ω + d ω 0.5 ρ ga n 2 ,
Jonswap wave spectrum is popular in ocean engineering [24]. This study adopted Jonswap wave spectrum to model irregular waves. Finally, water surface elevation can be expressed as
η ( t ) = 1 2 π W ( ω ) 2 π S ζ 2 sided ( ω ) e j ω t d ω , { W ( ω ) = 0 , when   ω = 0 W ( ω ) = 2 ln [ U 1 ( ω ) ] { cos [ 2 π U 2 ( ω ) ] + j sin [ 2 π U 1 ( ω ) ] } , when   ω > 0 W ( ω ) = 2 ln [ U 1 ( ω ) ] { cos [ 2 π U 2 ( ω ) ] j sin [ 2 π U 1 ( ω ) ] } , when   ω > 0
in which W ( ω ) is the Fourier transform function for Gaussian white noise time series; U 1 and U 2 are two independent random numbers, which follow normal distribution.

2.3. Potential Flow Theory

There are mainly two theories for calculating floating body hydrodynamic forces (i.e., Morison’s equation and potential flow theory). Compared with Morison’s equation, potential flow theory can counter the effects of wave radiation and wave diffraction; thus, potential flow theory can more accurately predict floating body hydrodynamic forces than Morison’s equation when wave radiation and wave diffraction effects can hardly be neglected (e.g., wave radiation and diffraction effects can be neglected when floating body is slender and cylindrical). For higher accuracy, this study adopted potential flow theory to calculate floating wind turbine hydrodynamic forces. Specifically, a potential function ϕ ( x , y , z ) is considered, whose governing equation can be expressed as
2 ϕ = 0 ,
When water free surface, structural surface, and seabed boundary condition are determined, entire wave velocity distribution in wave field can be computed by solving the above-mentioned potential function. Subsequently, floating wind turbine hydrodynamic force ( F WA ) can be calculated as
F WA = F W + F HS + F RD + F AM ,
in which F W denotes wave excitation force; F HS means the force resulted by static water pressure; F RD represents the force caused by wave radiation; and F AM indicates the force resulting from added water mass. These four parts of overall hydrodynamic force can be respectively computed using
F W = 1 N k = N 2 1 N 2 W k 2 π Δ t S ζ 2 sided ( ω ) X ( ω ,   β ) | ω = k Δ ω e j 2 π kn N ,
F HS = ρ gV 0 C Hydrostastic x ,
F RD = 0 t K 1 ( t τ ) x ˙ ( τ ) d τ ,
F AM = AM RP x ¨ ( τ ) ,
In Equation (20), W [ k ] means the Fourier transform result of white noise time series; S ζ 2 sided ( ω ) denotes wave spectrum (Jonswap wave spectrum in this study); and X ( ω ,   β ) is wave force matrix normalized by wave amplitude with β as inflow wave direction. In Equation (21), ρ gV 0 indicates floating wind turbine buoyancy with V 0 as submerged floating wind turbine volume; C Hydrostastic is hydrostatic recovery matrix; and x denotes floating wind turbine displacement along wave propagation direction. In Equation (22), K 1 means radiation kernel in potential flow theory; and x ˙ ( τ ) is floating wind turbine velocity along wave propagation direction. In Equation (23), AM RP is added mass coefficient of Spar-type floating platform; and x ¨ ( τ ) represents floating wind turbine acceleration along wave propagation direction.

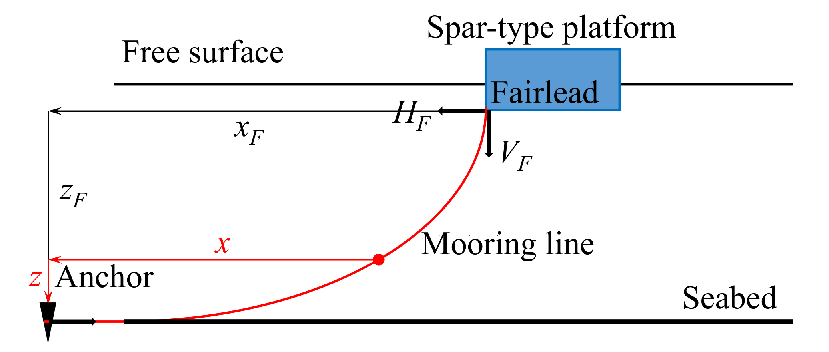
2.4. Quasi-Static Mooring System Model

This study regards mooring lines as catenaries and utilizes a quasi-static solver to solve deformation and tension of mooring lines [25]. The adopted quasi-static solver can counter distributed mass, mooring stress, and mooring elastic. When one mooring line partly lies on seabed, its governing equations can be expressed as
x F ( H F , V F ) = L B + H F w ln V F H F + 1 + V F H F 2 + H F L EA + C B w EA L B 2 + L B H F C B w Max L B H F C B w , 0 ,
z F ( H F , V F ) = H F w 1 + V F H F 2 1 + V F wL H F 2 + 1 EA V F L wL 2 2 ,
where x F and z F are horizontal and vertical distances from fairlead to anchor (see Figure 2), respectively; H F and V F are horizontal and vertical mooring tension components at fairlead, respectively; L B = L V F / ω denotes relaxation length of mooring lines with ω representing wet-weight per unit length of mooring line and L is unstretched length of mooring line; EA means mooring line axial stiffness; and C B is static friction coefficient between mooring line and seabed. By solving Equations (24) and (25), mooring tensions at fairlead can be computed.
Subsequently, deformation and tension of entire mooring line can be calculated further. For any position on mooring line, its horizontal and vertical distances to anchor are labeled as x and z, respectively; as well, its chord distance to anchor is labeled as s. Mooring tension of mooring line at specified position is labeled as Te. Te can be computed using
x ( s ) = { s , 0 s L B H F C B w s + C B w 2 EA [ s 2 2 s ( L B H F C B w ) + λ ( L B H F C B w ) ] , L B H F C B w < s L B L B + H F w ln [ w ( s L B ) H F + 1 + ( w ( s L B ) H F ) 2 ] + H F s EA + C B w 2 EA [ λ ( L B H F C B w ) L B 2 ] , L B < s L ,
z ( s ) = { 0 , 0 s L B H F w ln [ 1 + ( w ( s L B ) H F ) 2 1 ] + w ( s L B ) 2 2 E A L B s L
T e ( s ) = { Max [ H F + C B ω ( s L B ) , 0 ] , 0 s L B H F 2 + [ ω ( s L B ) ] 2 , L B < s L ,
λ = { L B H F C B ω , ( L B H F C B ω ) > 0 0 , otherwise ,

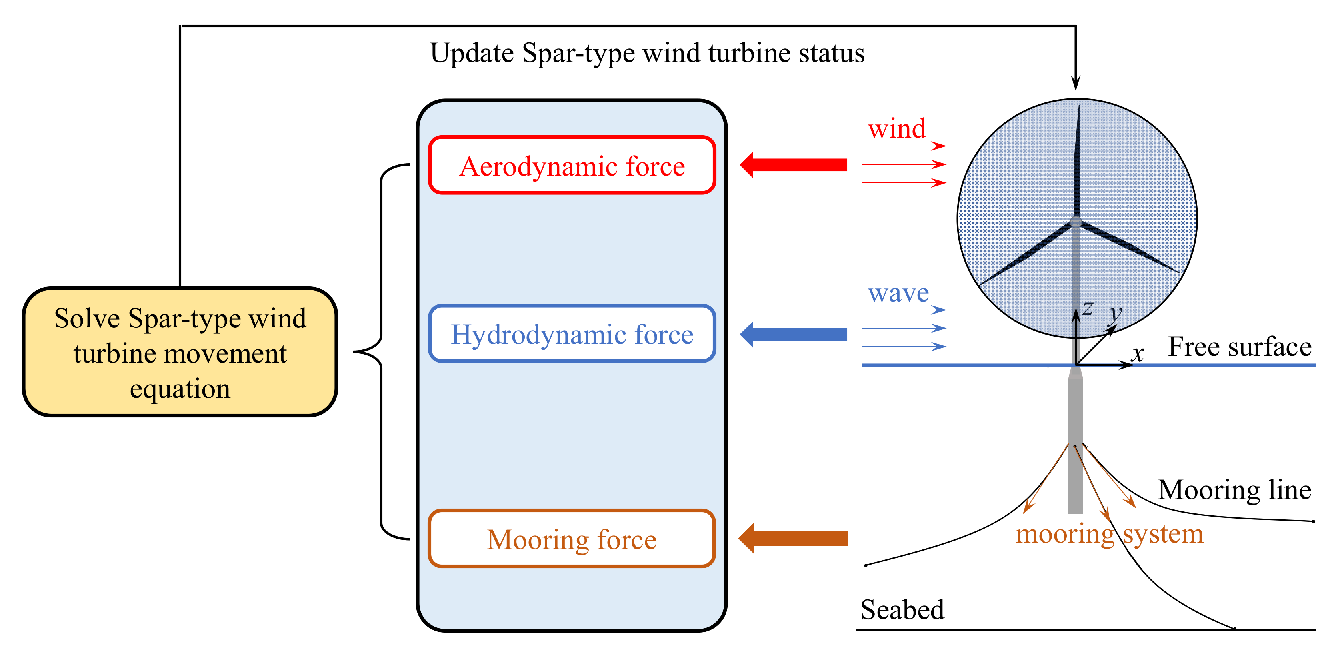
2.5. Movement Equation for Spar-Type Wind Turbine

In this study, Spar-type wind turbine is regarded as a rigid body due to that its structural deformation is significantly smaller than its displacement. When displacement is mainly studied, small structural deformation can be neglected. In this case, Spar-type wind turbine movement equation [28] can be expressed as
( M + A ) x ¨ ( t ) + C x ˙ ( t ) + Kx ( t ) = F WA + F Wind + F Line ,
where M and A are mass and added mass matrices of floating wind turbine; x ¨ ( t ) denotes floating wind turbine acceleration; C means floating wind turbine damping matrix; x ˙ ( t ) denotes floating wind turbine velocity; K represents stiffness matrix; x ( t ) is displacement; F WA is hydrodynamic force calculated in Section 2.3; F Wind denotes wind load calculated using BEM as introduced in Section 2.1; and F Line means mooring line tensions calculated in Section 2.4.
Figure 3 presents entire calculation flow chart for Spar-type wind turbine dynamic response under coupling impact of wind and waves. It can be roughly divided into four main steps: (i) evaluate wind load on rotor using BEM; (ii) calculate wave load on Spar-type platform using potential flow theory; (iii) evaluate mooring line tensions according to current mooring system status using quasi-static mooring system model; (iv) solve Spar-type wind turbine movement equation. At the end of each time step, wind turbine status updates according to the calculation results, and next time step starts. By iteratively running steps i–iv, Spar-type wind turbine dynamic response can be solved.

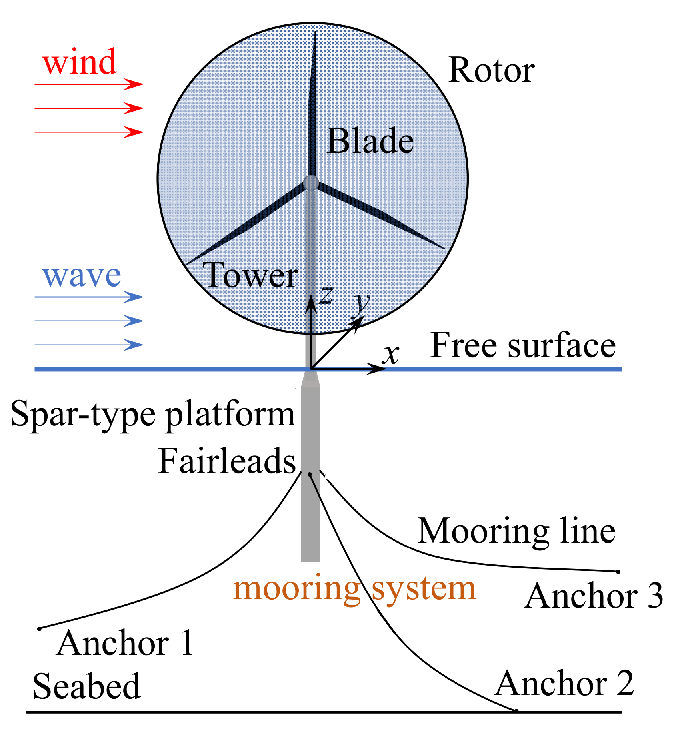
3. Spar-Type Wind Turbine

This section introduces the structural parameters of the OC3-Hywind Spar-type 5 MW offshore floating wind turbine [29], which is sketched in Figure 4. This wind turbine model was investigated due to there being a Chinese wind turbine manufactory entrusting our research group to develop the mooring system for the OC3-Hywind Spar-type platform so that their offshore floating wind turbine can survive in complicated offshore environmental conditions. Recently, Ahn and Shin [17] experimentally investigated the motion characteristics of the OC3-Hywind Spar-type floating offshore wind turbine. Innovatively, Leimeister et al. [19] numerically optimized the same offshore floating wind turbine that is adopted in this study utilizing global limit states. In the study of Leimeister et al. [19], the criteria stability, mean and dynamic displacements, and tower top acceleration were controlled by optimizing the wind turbine structural parameters. As well, Yue et al. [20] also tried to reduce the wind- and wave-resulted Spar-type offshore wind turbine vibrations by adding a heave plate onto the Spar-type platform. Hence, it can be said that, although the OC3-Hywind Spar-type 5 MW offshore floating wind turbine was proposed more than 10 years ago, it is still studied by researchers and engineers to this day, and it has engineering application potential in the future. That is why this study adopted the OC3-Hywind Spar-type 5 MW offshore floating wind turbine.
In Figure 4, a reference coordinate system is first defined as: positive x direction is parallel to the wind and wave propagation direction; positive z direction points upwards; positive y direction is parallel to the wind and wave propagation bi-direction, and (x, y, z) follows the right-hand rule; and the origin of the defined reference coordinate system is located at the center of the wind turbine tower on the free water surface. As can be seen in Figure 4, the wind turbine is constrained onto the seabed using three mooring lines; thus, it can move in six degrees of freedom (i.e., surge, sway, heave, roll, pitch, and yaw).
The key structural parameters of the wind turbine are summarized in Table 1. Specifically, the wind turbine energy output is 5 MW; rotor is upwind and has three blades; Spar-type platform draft is 120 m; tower bottom and hub elevations are 10 m and 90 m, respectively; nacelle has a dimension of (14.2 m, 2.3 m, 3.5 m) (length, width, height); rotor diameter is 126 m; rotor, nacelle, tower, Spar-type platform, and hub mass are 110,000, 350,000, 249,718, 7466,330, and 56,780 kg; the wind turbine is constrained using three mooring lines; fairlead draft is 70 m; mooring line length and diameter are 902 m and 0.09 m, respectively; mooring line density is 77.71 kg m–1; coordinates of fairleads 1, 2, and 3 are (–5.2 m, 0 m), (2.6 m, –4.5 m), and (2.6 m, 4.5 m) (x, y), respectively; water depth is 320 m; and coordinates of anchors 1, 2, and 3 are (–853.87 m, 0 m), (426.935 m, –739.47 m), and (426.935 m, 739.47 m) (x, y), respectively. It should be noted that the above-defined mooring system is slightly different compared to the one presented in the OC3 phase IV project [30]. The delta connection in the OC3 phase IV project is neglected here. The reason for this is because there is a Chinese offshore wind farm using a similar mooring system as that in the OC3 phase IV project but without a delta connection. The wind turbines sometimes move excessively when under the coupling impact of wind and waves. This study tries to develop novel mooring systems to solve the above-mentioned real engineering problems. Thus, the developed mooring system performance will be compared with that of the mooring system presented in the OC3 phase IV project but without a delta connection.
The environmental condition settings in this study are summarized in Table 2. C1–3 are regular waves. Their wave height and wave period ranges are (2.56–6.00) m and (7.00–10.00) s, respectively. C4–C6 are irregular waves. Their significant wave height and significant wave period ranges are (3.66–6.70) m and (8.6–13.6) s, respectively. The wind velocities in these cases remain the same value of 8 m s–1. These cases were determined based on the real wind and wave distributions at Nanao Island of China. In the following sections, the wind turbine dynamic responses under C1–3 and C4–6 are compared, respectively.

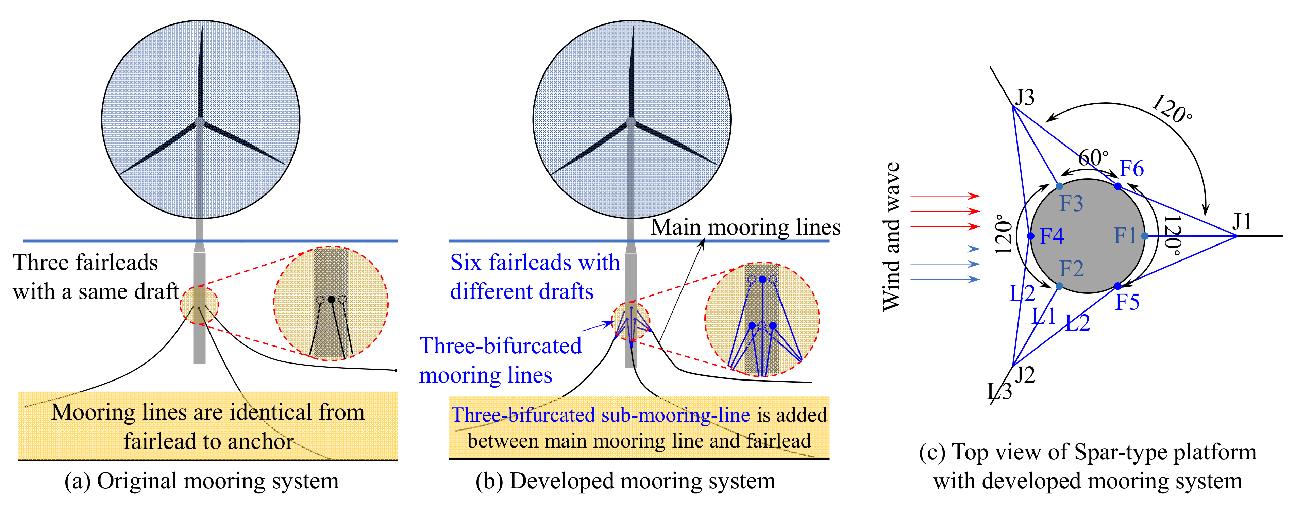
4. Three-Bifurcated Mooring System

For the first time, this study proposed a three-bifurcated mooring system, which was designed to improve the torsional and overturning stiffness of the OC3-Hywind Spar-type offshore wind turbine and to enhance the wind turbine wind- and wave-resistance ability. The proposed three-bifurcated mooring system is introduced in the following Section 4.1. To optimize the proposed mooring system, its key structural parameters were varied. The wind turbine dynamic responses with different mooring system configurations were calculated using OpenFAST and were compared with each other. The numerical results are presented in Section 4.2. Due to the fact that the surge, pitch, and yaw movements are larger than the sway, heave, and roll movements when the wind and waves both propagate along the x-axis, the wind turbine surge, pitch, and yaw movements are presented and analyzed to study the mooring system performance. More details can be found in the following subsections.

4.1. Case Settings

The wind turbine structural parameters have been summarized in Table 1, which are not varied in this study. The original mooring system with three mooring lines is developed. Specifically, in the original mooring system, three mooring lines are all identical from fairlead to anchor, and they are directly connected to three corresponding fairleads on the Spar-type platform, which have the same draft of 70 m, as can be seen in Figure 5a. In the developed mooring system, three-bifurcated sub-mooring-lines are added between the fairleads and main mooring lines, as can be seen in Figure 5b. To sketch the developed mooring system more clearly, a top view of the Spar-type platform with the developed mooring system is shown in Figure 5c, which demonstrates how the fairleads, sub-mooring-lines, and main mooring lines connect with each other. As can be seen, six fairleads (F1–6) are uniformly spread around the Spar-type platform. Among them, F1–3 have the same draft, and F4–6 have the same draft, while those of F1–3 are smaller than those of F4–6. That is, F1–3 are closer to the free water surface compared with F4–6. For both F1–3 and F4–6, the included angle between any two adjacent fairleads is always 120° (see Figure 5c). Assuming that F1–3 and F4–6 are all in the same plane, the included angle between any two adjacent fairleads is always 60°. Simultaneously, three imagined joints (J1–3) are spread uniformly around the Spar-type platform, which are utilized to connect the three-bifurcated sub-mooring-lines and main mooring lines. The included angle between any two adjacent joints is always 120°. When connecting those fairleads and joints using mooring lines, the mooring line type remains the same if the mooring lines start from the fairleads in the same group (i.e., F1–3 or F4–6). The sub-mooring-lines starting from F1–3 are labeled as L1, and those starting from F4–6 are labeled as L2. The main mooring lines are all labeled as L3. From Figure 5c, it can be observed that the developed mooring system has more fairleads, and they have different drafts. Hence, the developed mooring system theoretically has larger torsional and overturning stiffness compared with the original mooring system. Subsequently, the numerical analysis is carried out to examine the performance improvement of the developed mooring system.
To compare the performances of the original and developed mooring systems and to optimize the developed one, the anchor positions do not change during the mooring system optimization, which can be found in Table 1. Meanwhile, to control the effects from other mooring system structural parameters, the total mooring line mass remains the same as in the original mooring system. That is, the total mooring line length should be equal to 902.2 m when the mooring line diameter is 0.09 m. F1–3 have a draft of 60 m, and F4–6 have a draft of 70 m. F1–3 are 10 m higher than F4–6, which was empirically determined and was approximately equal to the Spar-type platform diameter (9.2 m). A diameter of L2 is 2 / 2 times the mooring line diameter in the original mooring system, which is 2 / 2 × 0.09 = 0.064 m. That is, the line density of the two parallel L2 mooring lines is equal to that of the mooring line in the original mooring system. By varying the mooring line lengths of L1–3, three different mooring system configurations are proposed and summarized in Table 3 (M1–3). As well, L1 and L2 = 0 m, L3 = 902.2 m is also considered as a control group. In Table 3, the lengths of L1 and L2 are well-designed so that both L1 and L2 can be stretched when the wind turbine is moving. As F1–3 are 10 m higher than F 4–6, L1 should be at least greater than 10 m. As well, considering the included angle between the mooring line and Spar-type platform, a minimum L1 length of 15 m is determined. Besides, L1 and L2 can hardly get any longer due to L3 becoming shorter and shorter as L2 increases. If L2 continuously increases, L3 would become too short to lie on the seabed. In this case, too much mooring line gravity acts on the Spar-type platform, resulting in the wind turbine tower bottom being submerged, which is not accepted in engineering. Thus, M1–3 are designed and studied.

4.2. Results and Discussions

4.2.1. Regular Waves

Floating wind turbines with different mooring systems (M0–3) under different regular waves (C1–3) are analyzed using OpenFAST up to 900 s. At the beginning of the simulation, the floating wind turbine starts to move under the coupling impact of the wind and waves; hence, the simulation results of the wind turbine dynamic response do not yet converge. To this end, this study abandons the former 600 s transient results and only analyzes the last 300 s results. As mentioned before, only the surge, pitch, and yaw wind turbine movements are investigated in this study due to them being larger than the sway, heave, and roll movements, enabling that the mooring system performance can be easily observed.
Figure 6 shows the wind turbine surge movements with different mooring systems (M0–3) when under regular waves (C1–3). From Figure 6, it can be directly observed that the floating wind turbine moves sinusoidally in the surge direction when under the coupling impact of the wind and regular waves. As well, the surge movement can be divided into two parts, which are lateral drift mainly resulting from the wind and dynamic oscillation around the equilibrium position after the drift mainly resulting from waves. Figure 6 shows that the wind turbine surge drifts with M0 are always larger than those with the developed mooring systems (M1–3) when under regular waves, implying that the developed mooring systems can effectively reduce the wind turbine surge drift. Specifically, the wind turbine mean surge drift with M0 is approximately 12 m in C1–3, while it reduces gradually from M3–M1. For M1, the wind turbine mean surge drift is approximately 9 m. That is, the developed mooring system can at most reduce the wind turbine surge drift by 25% in this study. Thus, it can be said that the developed mooring system performs well when the sub-mooring-lines are relatively short. From Figure 6, every time the sub-mooring-lines are lengthened, the mean surge drift increases by 1 m. As mentioned before, due to the draft difference between F1–3 and F4–6 being fixed (10 m), and the sub-mooring-line lengths should satisfy the included angle between the mooring lines and the Spar-type platform, the sub-mooring-lines can hardly be further shortened. Hence, the configuration (L1 = 15 m, L2 = 10 m, and L3 = 877.2 m) is a recommended mooring system configuration for the developed mooring system when the draft difference between F1–3 and F4–6 is 10 m. Besides, Figure 6 indicates that the oscillation amplitudes of the surge movements are almost at the same level. Hence, it can be inferred that the developed mooring system can effectively reduce the wind impact, while the wave impact can hardly be reduced by the developed mooring system.
To quantitatively examine the developed mooring system performance, the maximum, minimum, and average values of the surge movement time series, as shown in Figure 6, are calculated and presented in Figure 7. It can be seen that the average values of the surge movement time series are almost at the same level as long as the mooring systems are the same, quantitatively indicating that the wind turbine surge drift is mainly resulted by the wind load, which can hardly be affected by the wave conditions. When the mooring system configuration varies, the average values of the surge movement time series change also; specifically, the average value of M0 is the largest (mean value is equal to 12.30 m in C1–3), implying the largest wind turbine surge drift occurs when applying M0. For the developed mooring systems, the largest wind turbine surge drift occurs for M3 (mean value is equal to 11.1 in C1–3). As the sub-mooring-lines decrease, the developed mooring system performs better and better. For M1, the floating wind turbine only drifts 8.87 m, which reduces by 27.88% compared with the original mooring system. From Figure 6, it can be seen that the wind turbine moves sinusoidally and regularly in the surge direction; hence, the difference between the maximum and minimum values in Figure 7 can be roughly regarded as the surge movement amplitude. From Figure 7, the surge movement amplitudes are almost at the same level so long as the wave conditions are the same, quantitatively indicating that the wind turbine surge oscillating movement is mainly resulted by the wave load, which can hardly be controlled by the developed mooring system. When the wave condition varies, the surge movement amplitude changes also; specifically, the amplitude of C1 is the largest (mean value is equal to 3.21 m in M0–3), and the amplitude of C2 is the smallest (mean value is equal to 0.7 m in M0–3). Thus, it can be said that the wind turbine surge oscillating movement amplitude is sensitive to the wave height. The larger the wave height, the higher the wave energy will be, and the larger the surge oscillating movement amplitude will be.
Figure 8 shows the wind turbine pitch movements with different mooring systems (M0–3) when under regular waves (C1–3). From Figure 8, it can be directly observed that the floating wind turbine moves sinusoidally in the pitch direction when under the coupling impact of wind and regular waves. Similar to the surge movement, the pitch movement can also be divided into two parts, which are the constant drift in the pitch direction, mainly resulting from the wind, and the dynamic oscillation around the equilibrium position after the pitch drift, mainly resulting from waves. Figure 8 shows that the developed mooring system can hardly control the wind turbine pitch movement, either the wind part or wave part. Even when the wave height is relatively small, the pitch drifts of the wind turbines with the developed mooring systems are slightly larger than those of the wind turbines with the original mooring system (see Figure 8b). Every time when the sub-mooring-lines are lengthened, the wind turbine pitch drift increases by approximately 0.1° when under C2. Besides, for the pitch oscillating movement mainly resulting from waves, it can be observed that it is not controlled by the developed mooring systems. Although the pitch drifts for M0–3 under C2 exhibit slight differences from each other, the pitch oscillating movements do not show an obvious difference after applying the developed mooring system. Hence, it can be said that the developed mooring system can hardly reduce the wind turbine pitch movement.
Further, to quantitatively examine the developed mooring system performance, the maximum, minimum, and average values of the pitch movement time series, as shown in Figure 8, are calculated and presented in Figure 9. It can be seen that the average values of the pitch movement time series are almost at the same level for all of the cases, which are not affected by the wave condition and applied mooring system. From Figure 8, it can be seen that the wind turbine moves sinusoidally and regularly in the pitch direction; hence, the difference between the maximum and minimum values in Figure 9 can be roughly regarded as the pitch movement amplitude. From Figure 9, the pitch movement amplitudes are almost at the same level so long as the wave conditions are the same, quantitatively indicating that the wind turbine pitch oscillating movement is mainly resulted by the wave load, which can hardly be controlled by the developed mooring system. When the wave condition varies, the pitch movement amplitude changes also; specifically, the pitch amplitude of C1 is the largest (mean value is equal to 1.63° in M0–3), and the pitch amplitude of C2 is the smallest (mean value is equal to 0.37° in M0–3). Thus, it can be said that the wind turbine pitch oscillating movement amplitude is sensitive to the wave height. The larger the wave height, the higher the wave energy will be, and the larger the pitch oscillating movement amplitude will be.
Figure 10 shows the wind turbine yaw movements with different mooring systems (M0–3) when under regular waves (C1–3). From Figure 10, it can be directly observed that the floating wind turbine moves sinusoidally in the yaw direction when under the coupling impact of the wind and regular waves. Similar to the surge and pitch movement, the yaw movement can also be divided into two parts, which are the constant drift in the yaw direction, mainly resulting from the wind, and the dynamic oscillation around the equilibrium position after the yaw drift, mainly resulting from the waves. Figure 10 shows that the wind turbine yaw drifts with M0 are always larger than those with the developed mooring systems (M1–3) when under regular waves, implying that the developed mooring systems can effectively reduce the wind turbine yaw drift. Specifically, the wind turbine mean yaw drift with M0 is approximately 0.08° in C1–3, while it reduces gradually from M3–M1. For M1, the wind turbine mean yaw drift is approximately 0.07°. That is, the developed mooring system can at most reduce the wind turbine yaw drift by 12.5% in this study. Thus, it can be said that the developed mooring system performs well when the sub-mooring-lines are relatively short. From Figure 10, every time the sub-mooring-lines are lengthened, the mean yaw drift increases by 0.05°. As mentioned before, the sub-mooring-lines can hardly be further shortened. Hence, the configuration (L1 = 15 m, L2 = 10 m, and L3 = 877.2 m) is a recommended mooring system configuration for the developed mooring system when the draft difference between F1–3 and F4–6 is 10 m, which is consistent with the conclusion found in Figure 6. Besides, Figure 10 indicates that, differing with the trend of the yaw drift, the oscillation amplitudes of the yaw movements also decrease after applying the developed mooring systems, and it decreases as the of sub-mooring-line length increases. However, the yaw amplitude differences between M1–3 are extremely small. Therefore, to attain a smaller wind turbine surge movement, M1 should be applied, but not M3.
Subsequently, to quantitatively examine the developed mooring system performance, the maximum, minimum, and average values of the yaw movement time series, as shown in Figure 10, are calculated and presented in Figure 11. It can be seen that the average values of the yaw movement time series are almost at the same level so long as the mooring systems are the same, quantitatively indicating that the wind turbine yaw drift is mainly resulted by the wind load, which can hardly be affected by the wave conditions. When the mooring system configuration varies, the average values of the yaw movement time series change also; specifically, the average value of M0 is the largest (mean value is equal to 0.082° in C1–3), implying the largest wind turbine yaw drift occurs when applying M0. For the developed mooring systems, the largest wind turbine yaw drift occurs for M3 (mean value is equal to 0.077° in C1–3). As the sub-mooring-line length decreases, the developed mooring system performs better and better. For M1, the floating wind turbine only drifts 0.071°, which reduces by 13.41% compared with the original mooring system. From Figure 10, it can be seen that the wind turbine moves sinusoidally and regularly in the yaw direction; hence, the difference between the maximum and minimum values in Figure 11 can be roughly regarded as the yaw movement amplitude. From Figure 11, the yaw movement amplitudes are also controlled by the developed mooring systems. Differing with the yaw drift, the yaw amplitude decreases as the sub-mooring-line length increases. However, the differences between yaw amplitude for M1–3 are extremely small. When determining which configuration for the developed mooring system is better, the surge movement reduction should be primarily considered. Thus, M1 should be the recommended configuration. Simultaneously, due to the yaw oscillating movement mainly resulting from the wave load, the yaw amplitudes are different when under different wave conditions, resulting in further different mooring system performances. Especially in C2, the developed mooring system reduces the yaw amplitude at most by 22.3% compared with the original mooring system.
In total, the floating wind turbine surge, pitch, and yaw movements can be roughly divided into two parts. On one hand, the wind turbine drifts away from its static equilibrium position under the wind impact; on the other hand, the wind turbine moves sinusoidally and regularly under the wave impact. The developed mooring system can effectively control the floating wind turbine surge and yaw movements; however, it nearly has no effect on the wind turbine pitch movement. Quantitatively, the surge drift reduces by at most 27.88% after applying the developed mooring system, but the surge amplitude almost has no sensitivity on the developed mooring system. The yaw drift and amplitude reduce by at most 13.41% and 22.3% after applying the developed mooring system. The numerical results show that the torsional stiffness increases in the developed mooring system. A possible explanation for why the pitch movement is not controlled by the developed mooring system is that the gravity center of the entire floating wind turbine is above the free water surface, so the overturning stiffness increase in the developed mooring system is neglectable when F1–3 are still lower than the gravity center. In this subsection, the recommended mooring system configuration is determined as M1 (L1 = 15 m, L2 = 10 m, and L3 = 877.2 m).

4.2.2. Irregular Waves

In this subsection, the floating wind turbine surge, pitch, and yaw movements are investigated. It is known that the wind turbine will move irregularly when under irregular waves; thus, the movement times series is analyzed using fast Fourier transform [31] first. Then, the mooring system performance is examined in the frequency domain.
Figure 12 shows the wind turbine surge movement in the frequency domain with M0–3 when under C4–6. The left column in Figure 12 presents the wind turbine surge movement amplitudes corresponding to different frequencies. It can be observed that the fundamental frequency of the wind turbine surge movement is near 0.01 Hz. The right column in Figure 12 presents the wind turbine surge movement amplitudes corresponding to the fundamental frequency. The reason for why only the surge movement amplitude corresponds to the fundamental frequency is that the amplitudes corresponding to the fundamental frequency are significantly larger than those corresponding to other frequencies. This results in the surge movement time series profile being mainly governed by the fundamental frequency. Thus, in this study, only the amplitudes corresponding to the fundamental frequency are studied. From Figure 12, it can be obviously seen that the wind turbine surge movement amplitude decreases significantly after applying the developed mooring system, and the developed mooring system performs best when using the M1 configuration. This is consistent with the conclusion attained in Section 4.2.1. Quantitatively, in Figure 12b, the wind turbine surge movement amplitude with M0 is approximately 1.43 m. The amplitude with M3 is approximately 1.21 m; further, as the of sub-mooring-line length decreases, the amplitude with M1 is approximately 0.92 m. The M1 developed mooring system reduces the wind turbine surge movement by 35.66% when under irregular waves, indicating well vibration control performance.
Figure 13 shows the wind turbine pitch movement in the frequency domain with M0–3 when under C4–6. Similar to Figure 12, the left column in Figure 13 presents the wind turbine pitch movement amplitudes corresponding to different frequencies. It is difficult to find the fundamental frequency of the wind turbine pitch movement due to there being many peaks at almost the same high level. To ensure consistency between the surge, pitch, and yaw movements, the pitch amplitudes corresponding to the fundamental frequency of the surge movement are found and presented in Figure 13 (right column). From Figure 13, it can be seen that the wind turbine pitch movement amplitudes have little sensitivity on the applied mooring system, which nearly remain the same as the change of sub-mooring-line length. However, in Figure 13f, it can be seen that the wind turbine pitch movement amplitude decreases after applying the developed mooring system. Specifically, the pitch amplitude with M0 is approximately 0.07°. It reduces to approximately 0.058° when with M3. As the sub-mooring-line length increases, the pitch amplitude decreases further, which is equal to 0.05° when with M1. Although, sometimes, the developed mooring system can control the wind turbine pitch movement (when under C6), the pitch amplitude changes are extremely small in most cases (when under C4 and C5). Consequently, it should be conservatively said that the developed mooring system can hardly control the wind turbine pitch movement.
Figure 14 shows the wind turbine yaw movement in the frequency domain with M0–3 when under C4–6. Similar to Figure 12 and Figure 13, the left column in Figure 14 presents the wind turbine yaw movement amplitudes corresponding to different frequencies. Simultaneously, owing to that it is difficult to find the fundamental frequency of the wind turbine yaw movement, to ensure consistency between the surge, pitch, and yaw movements, the yaw amplitudes corresponding to the fundamental frequency of the surge movement are found and presented in Figure 14 (right column). From Figure 14, it can be obviously seen that the wind turbine yaw movement amplitude decreases after applying the developed mooring system. This is consistent with the conclusion attained in Section 4.2.1. Quantitatively, in Figure 14f, the wind turbine yaw amplitude with M0 is approximately 0.006°, which decreases after applying the developed mooring system. The yaw amplitude with M3 is approximately 0.005°, and it is 0.004° when with M1. The M1 developed mooring system reduces the wind turbine yaw movement by nearly 33.33% when under irregular waves, implying well vibration control performance. Besides, for larger frequencies, the corresponding yaw amplitudes also decrease after applying the developed mooring system, supporting the conclusion that the developed mooring system can control the yaw movement again.
Generally, similar conclusions as those in Section 4.2.1 are drawn through irregular wave cases (C4–6). Specifically, the developed mooring system can effectively control the floating wind turbine surge and yaw movements; however, it nearly has no effect on the wind turbine pitch movement. Quantitatively, the surge and yaw amplitude corresponding to the fundamental frequency (0.01 Hz) reduces by 35.66% and 33.33%, respectively, when using the M1 developed mooring system. Section 4.2.1 has demonstrated the possible reason for why the pitch movement is not controlled by the developed mooring system. In this subsection, the M1 configuration (L1 = 15 m, L2 = 10 m, and L3 = 877.2 m) is determined as the recommended developed mooring system configuration again, which has larger torsional stiffness compared with the original one.

5. Further Developed Three-Bifurcated Mooring System

The developed three-bifurcated mooring system is found to be effective in controlling the wind turbine surge and yaw movements. In this section, that model is further developed for more improvement. Section 5.1 introduces how the three-bifurcated mooring system is developed. Subsequently, to examine its performance, it is applied onto the floating wind turbine introduced in Section 3. The numerical results (wind turbine surge, pitch, and yaw movements) are presented and compared with the original mooring system and the M1 developed mooring system. More details can be found in the following subsections.

5.1. Case Settings

In the study of Liu et al. [18], a clump mass was attached onto the mooring lines, which performs much better than the original mooring system. Simultaneously, they proposed a recommended configuration for their proposed mooring system. Specifically, the clump mass was set to be 7061.74 kg, which was 1/10 of mooring line total mass. The clump mass was attached onto the mooring line 0.3 L away from the fairlead with L as the total mooring line length. Figure 15a sketches the proposed mooring system with the clump mass. In this study, the clump mass is attached onto the developed mooring system, as can be seen in Figure 15c. As mentioned before, the mooring lines in the three-bifurcated mooring system have the same total mass as in the original one. Thus, the clump mass in this study is also 7061.74 kg. It should be noted that the total mooring line length in the three-bifurcated mooring system is L1 + L3; hence, the clump mass in this study should be attached onto the mooring line 0.3(L1 + L3) away from the fairlead (F1–3). To examine the performance of the three-bifurcated mooring system with the clump mass (labeled as M4), it is compared with the original mooring system (M0), mooring system with clump mass (labeled as P5), and three-bifurcated mooring system (M1). The wind and wave conditions are summarized in Table 2.

5.2. Results and Discussions

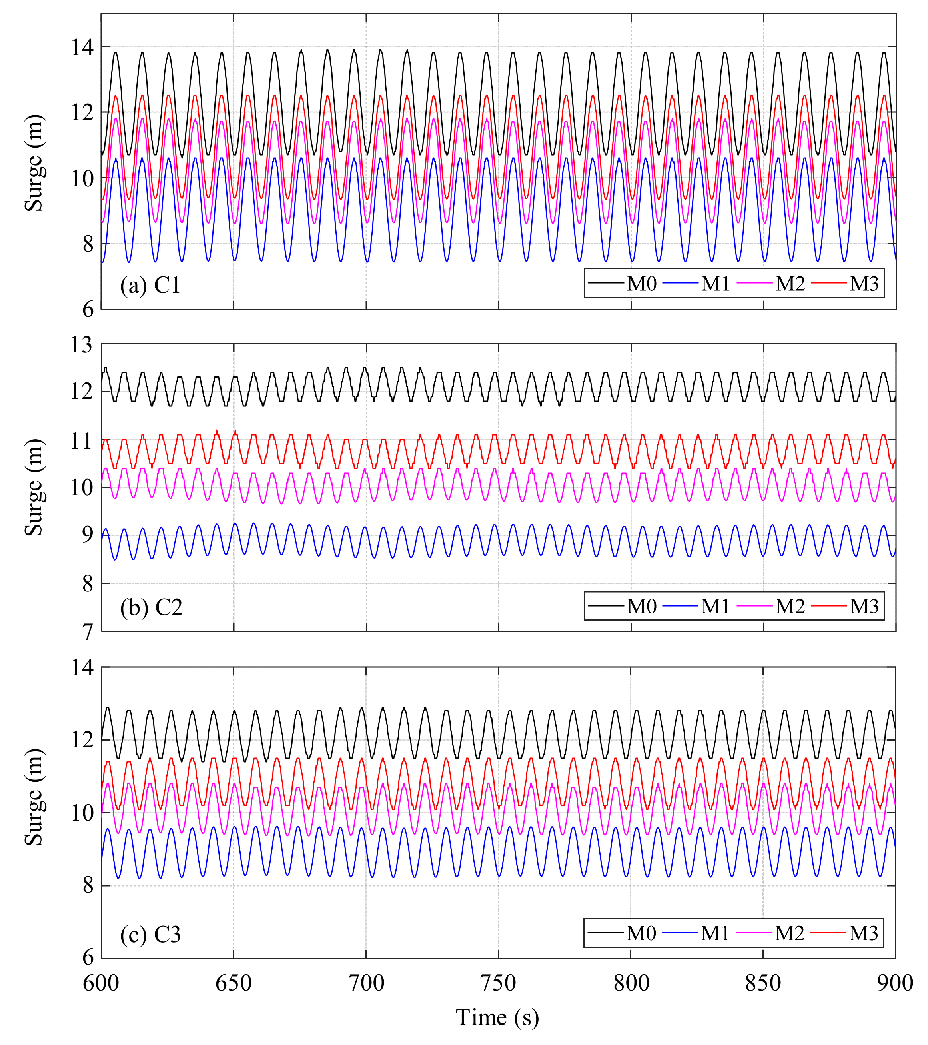
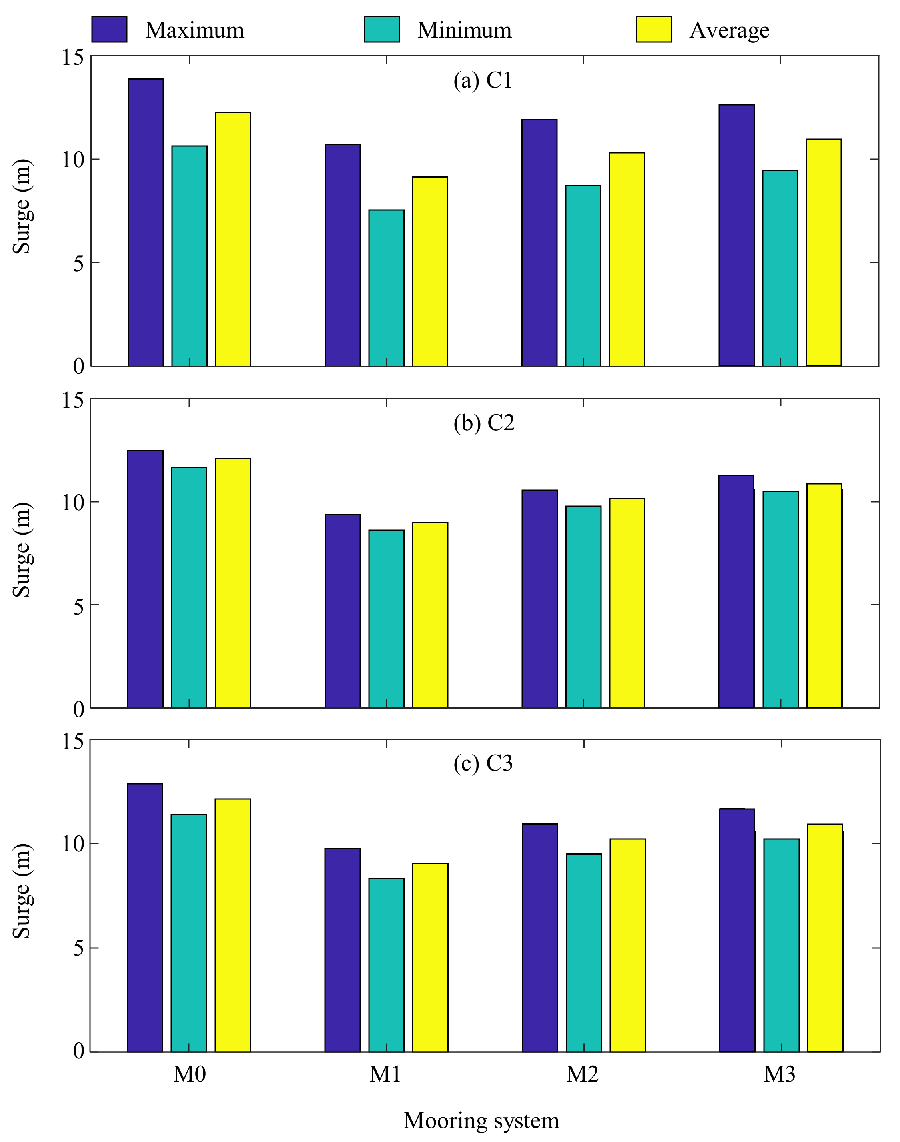
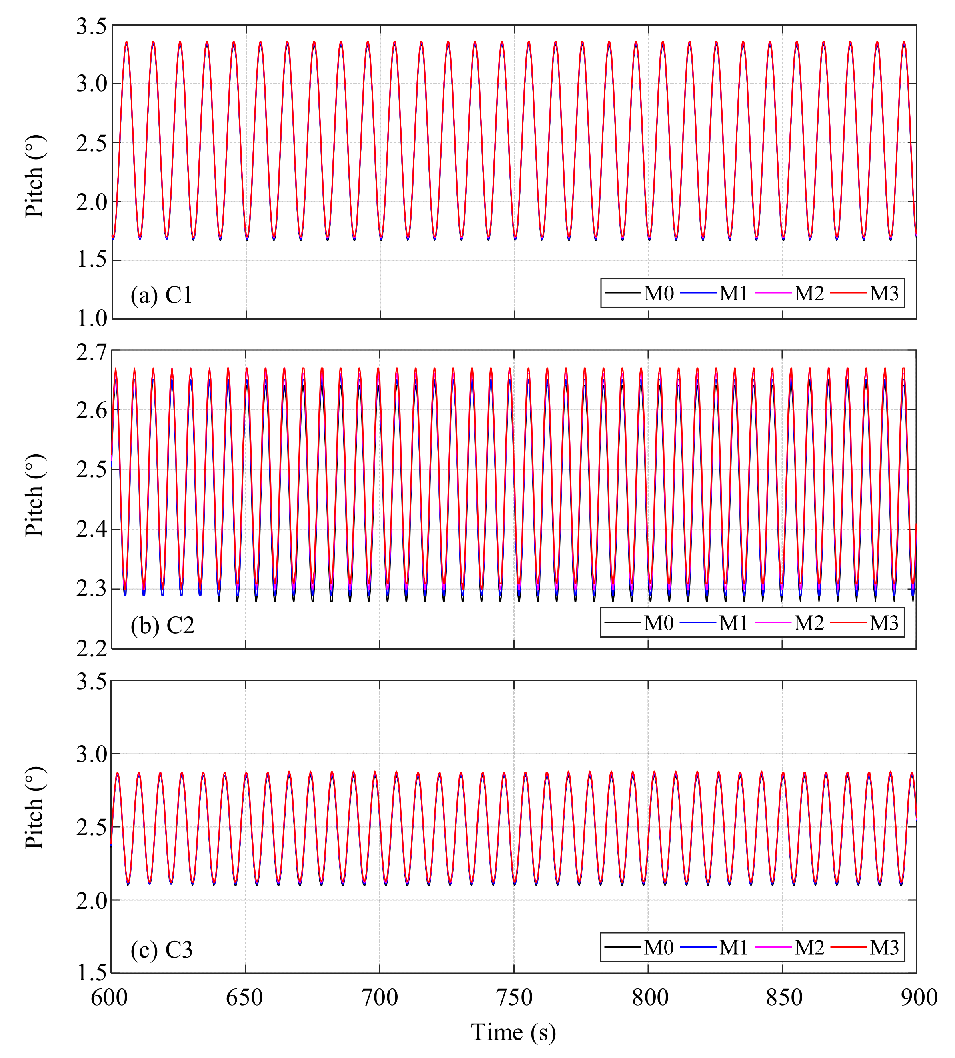
5.2.1. Regular Waves

Figure 16 shows the wind turbine surge movements with different mooring systems (M0, P5, M1, and M4) when under regular waves (C1–3). From Figure 16, it can be directly observed that the wind turbine surge drifts with M0 are always larger than those with P5, M1, and M4 when under regular waves. The surge drift with M1 is slightly larger than that with P5; hence, it can be inferred that increasing the total mooring line length could be more effective in wind turbine vibration controlling compared with optimizing the connection way of mooring lines. After attaching the clump mass in M1, M4 performs better than M1, implying that attaching a clump mass in the developed three-bifurcated mooring system can further improve its resistance ability. The surge drifts with M1 and M4 are approximately 8.7 m and 7.7 m, respectively. M4 further reduces 11.5% the wind turbine surge drift compared with M1. Besides, Figure 16 indicates that the surge movement oscillation amplitudes are almost at the same level. Hence, it can be inferred that P5, M1, and M4 can effectively reduce the wind impact on the wind turbine surge movement, while the wave impact can hardly be reduced by them. This supports the conclusion drawn in Section 4.2.1 again.
To quantitatively examine the difference between the mooring systems, the maximum, minimum, and average values of the surge movement time series, as shown in Figure 16, are calculated and presented in Figure 17. It can be seen that the average values are almost at the same level for the same mooring system, quantitatively indicating that the wind turbine surge drift is mainly resulted from the wind load, which can hardly be affected by the wave conditions. When the mooring system varies, the average values change also; specifically, the average value of M0 is the largest (mean value is equal to 12.30 m in C1–3), implying the largest wind turbine surge drift occurs when applying M0. For P5, M1, and M4, the largest wind turbine surge drift occurs for M1 (mean value is equal to 8.87 m in C1–3). Next, after applying the clump mass in M1, the wind turbine only drifts 7.73 m in surge direction. It can be said that M4 reduces the surge drift 37.15% compared with M0, and further reduces surge drift 12.85% compared with M1. From Figure 17, the surge movement amplitudes are almost at the same level for the same wave condition, quantitatively indicating that the wind turbine surge oscillating movement is primarily resulted from the wave load, which can hardly be controlled by varying the mooring system.
Figure 18 shows the wind turbine pitch movements with different mooring systems (M0, P5, M1, and M4) when under regular waves (C1–3). From Figure 18, it can be seen that attaching a clump mass and using three-bifurcated sub-mooring-lines can both hardly control the wind turbine pitch movement, resulting in M4 also hardly being able to reduce the wind turbine pitch movement. As mentioned before, a possible explanation for this is that the gravity center of the entire floating wind turbine is higher than the fairleads of the mooring systems. Thus, controlling the wind turbine pitch movement through changing the fairlead position up to the gravity center of the entire wind turbine may be feasible. Further, to quantitatively examine the mooring systems (M0, P5, M1, and M4), the maximum, minimum, and average values of the pitch movement time series, as shown in Figure 18, are calculated and presented in Figure 19. It can be observed that the maximum differences between the pitch drift (average value) and pitch amplitude (maximum–minimum) are approximately 2% and 3%, respectively (see Figure 19b). Thus, it can be quantitatively said that attaching a clump mass and using three-bifurcated sub-mooring-lines can both hardly reduce the wind turbine pitch movement.
Figure 20 shows the wind turbine yaw movements with different mooring systems (M0, P5, M1, and M4) when under regular waves (C1–3). From Figure 20, it can be directly observed that the wind turbine yaw drifts with M0 are always larger than those with P5, M1, and M4 when under regular waves. The yaw drift with M1 is slightly smaller than that with P5; hence, it can be inferred that using the three-bifurcated sub-mooring-lines could increase the torsional stiffness of the mooring system, and it is more effective in wind turbine yaw vibration controlling compared with attaching a clump mass onto the mooring lines. After attaching a clump mass in M1, M4 performs better than M1 and P5, implying that attaching a clump mass in the developed three-bifurcated mooring system can further improve its resistance ability. Besides, Figure 20 indicates that the surge movement oscillation amplitudes can also be reduced by attaching a clump mass or using three-bifurcated mooring lines, which is consistent with the conclusion drawn in Section 4.2.1. During this process, not only the yaw drift mainly resulted from the wind load is reduced; the yaw oscillation mainly resulted from the wave load is controlled also.
To quantitatively examine the difference between the mooring systems, the maximum, minimum, and average values of the yaw movement time series, as shown in Figure 20, are calculated and presented in Figure 21. When the mooring system varies, the average values of the yaw movement time series change also; specifically, the average value of M0 is the largest (mean value is equal to 0.082° in C1–3), implying the largest wind turbine yaw drift occurs when applying M0. The yaw drifts for P5 and M1 are 0.08° and 0.077°, respectively, implying better yaw movement controlling performance of the developed mooring system using three-bifurcated mooring lines. After applying a clump mass in M1, the yaw drift of M4 further decreases to 0.074°, which reduces 9.8% compared with the original mooring system, and further reduces 3.4% compared with the three-bifurcated mooring system. From Figure 21, the yaw movement amplitudes are also controlled by the mooring systems. In Figure 21a,c, M4 reduces 30.1% yaw amplitude compared with the original mooring system. P5 and M1 reduce 10.7% and 22.3% yaw amplitude, respectively, indicating 11.6% improvement in M1 compared with P5.
In total, the wind turbine pitch movement can hardly be controlled by attaching a clump mass and using the three-bifurcated mooring system. For the surge movement, attaching a clump mass is better, which approximately reduces 11.4% more wind turbine surge drift compared with using the three-bifurcated mooring line. For the yaw movement, using the three bifurcated mooring line is better, which approximately reduces 11.6% more wind turbine yaw movement compared with attaching a clump mass. Therefore, combining these two models is feasible and desired. The combined model M4 can finally reduce 37.15% surge movement and 30.1% yaw movement compared with the original mooring system.

5.2.2. Irregular Waves

In this subsection, the floating wind turbine surge, pitch, and yaw movements are investigated. Different mooring systems (M0, P5, M1, and M4) are applied, respectively. The movement times series is analyzed using fast Fourier transform [31] first. Then, the mooring system performance is examined in the frequency domain.
Figure 22 shows the wind turbine surge movement in the frequency domain with M0, P5, M1, and M4 when under C4–6. Similar with Figure 12, Figure 13 and Figure 14, the left column in Figure 22 also presents the wind turbine surge movement amplitudes corresponding to different frequencies, and the right column in Figure 22 presents the wind turbine surge movement amplitudes corresponding to the fundamental frequency (0.01 Hz). From Figure 22, it can be obviously seen that the wind turbine surge movement amplitude decreases significantly after applying the developed mooring systems. Specifically, the surge amplitudes corresponding to the fundamental frequency with M0, P5, M1, and M4 are 1.43 m, 0.81 m, 0.92 m, and 0.65 m, respectively. Similar with the conclusion drawn in Section 5.2.1, attaching a clump mass is more effective in controlling wind turbine surge movement, and attaching a clump mass reduces 11.96% more surge amplitude compared with using three-bifurcated mooring lines. After applying a clump mass in M1, M4 reduces 29.34% more surge amplitude compared with M1, and M4 finally reduces 54.5% surge amplitude compared with the original mooring system.
Figure 23 shows the wind turbine pitch movement in the frequency domain with M0, P5, M1, and M4 when under C4–6. From Figure 13, it can be seen that the wind turbine pitch movement amplitudes have little sensitivity on the applied mooring system (see Figure 23c). Attaching a clump mass and using the three-bifurcated mooring lines can both hardly reduce wind turbine pitch movement, as concluded in Section 5.2.1. Thus, it can be theoretically inferred that the combined model M4 should show little difference with P5 and M1. However, in Figure 23, M4 is found to be more effective than P5 and M1. This is possibly resulted from numerical error. Totally, the wind turbine pitch movement can hardly be controlled by tuning the mooring system.
Figure 24 shows the wind turbine yaw movement in the frequency domain with M0, P5, M1, and M4 when under C4–6. From Figure 24, it can be obviously seen that the wind turbine yaw movement amplitude decreases after applying the three-bifurcated mooring system. However, the yaw movement can hardly be reduced by attaching a clump mass. Interestingly, after attaching a clump mass in M1, M4 performs greatly better than M1. Specifically, the yaw amplitude with M0, M1, and M4 are approximately 0.006°, 0.004°, and 0.0034°, respectively. M4 reduces 15% more yaw amplitude compared with M1, and reduces 40% yaw amplitude compared with M0.
Generally, similar conclusions as those in Section 5.2.1 are drawn through irregular wave cases (C4–6). Specifically, the developed mooring systems can effectively control the floating wind turbine surge and yaw movements; however, it nearly has no effect on the wind turbine pitch movement. For the pitch movement, attaching a clump mass is more effective than using the three-bifurcated mooring lines, and the former can reduce 11.96% more pitch amplitude than the latter. After applying a clump mass in M1, M4 can reduce the surge movement by 54.5%. For the yaw movement, using the three-bifurcated mooring lines and attaching a clump mass performed similarly, and they both reduce the yaw movement. Hence, after applying a clump mass in M1, M4 can reduce 15% more yaw movement than M1, and can reduce 40% more yaw amplitude compared with M0.

6. Conclusions

In this study, a novel three-bifurcated mooring system is proposed for Spar-type offshore floating wind turbines. Specifically, a three-bifurcated sub-mooring-line is utilized to connect the Spar-type platform; hence, three fairleads are utilized to connect one sub-mooring-line. Three-bifurcated sub-mooring-lines converge to the same joint; next, the main mooring line is used to connect the joint and anchor. In the three-bifurcated mooring system, a total of six fairleads are involved on the Spar-type platform. Compared with the three fairleads utilized in the original mooring system, six fairleads theoretically have larger torsional stiffness. Further, inspired by Liu et al. [18], a clump mass is attached onto the main mooring lines in the three-bifurcated mooring system to improve its resistance ability. The wind turbine surge, pitch, and yaw movements under regular and irregular waves are calculated and analyzed to quantitatively examine the performance of the proposed mooring systems as well as to optimize the three-bifurcated mooring system. From the numerical results, the following conclusions are drawn:
  • The floating wind turbine surge, pitch, and yaw movements can be divided into two parts; specifically, one of them is the drift movement resulting from wind, which moves the wind turbine away from its static equilibrium position, and the other one is the oscillating movement resulting from waves, which makes the wind turbine move sinusoidally around the new equilibrium position after drift;
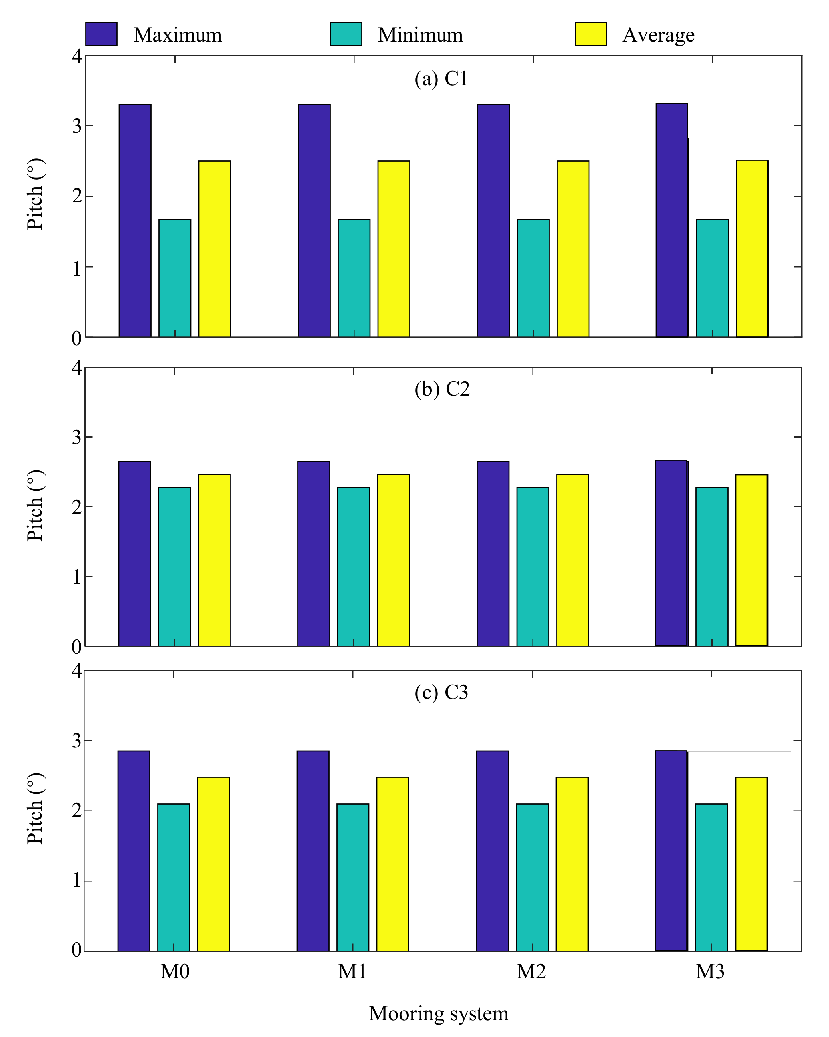
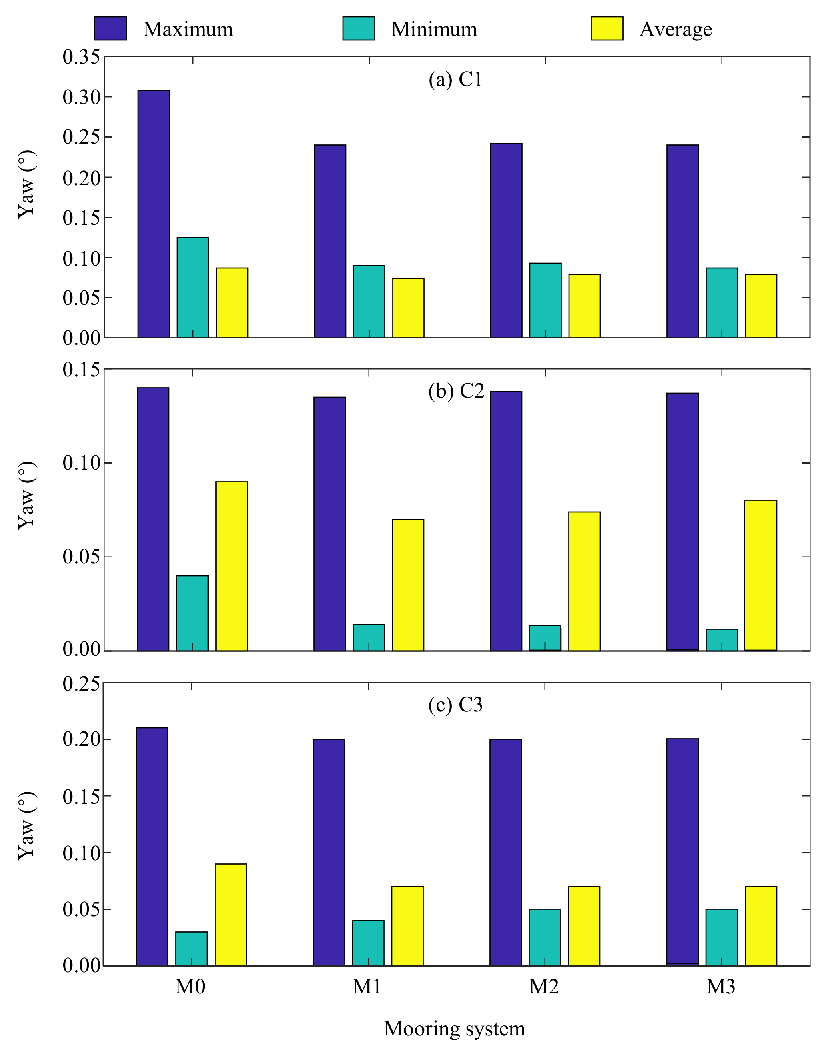
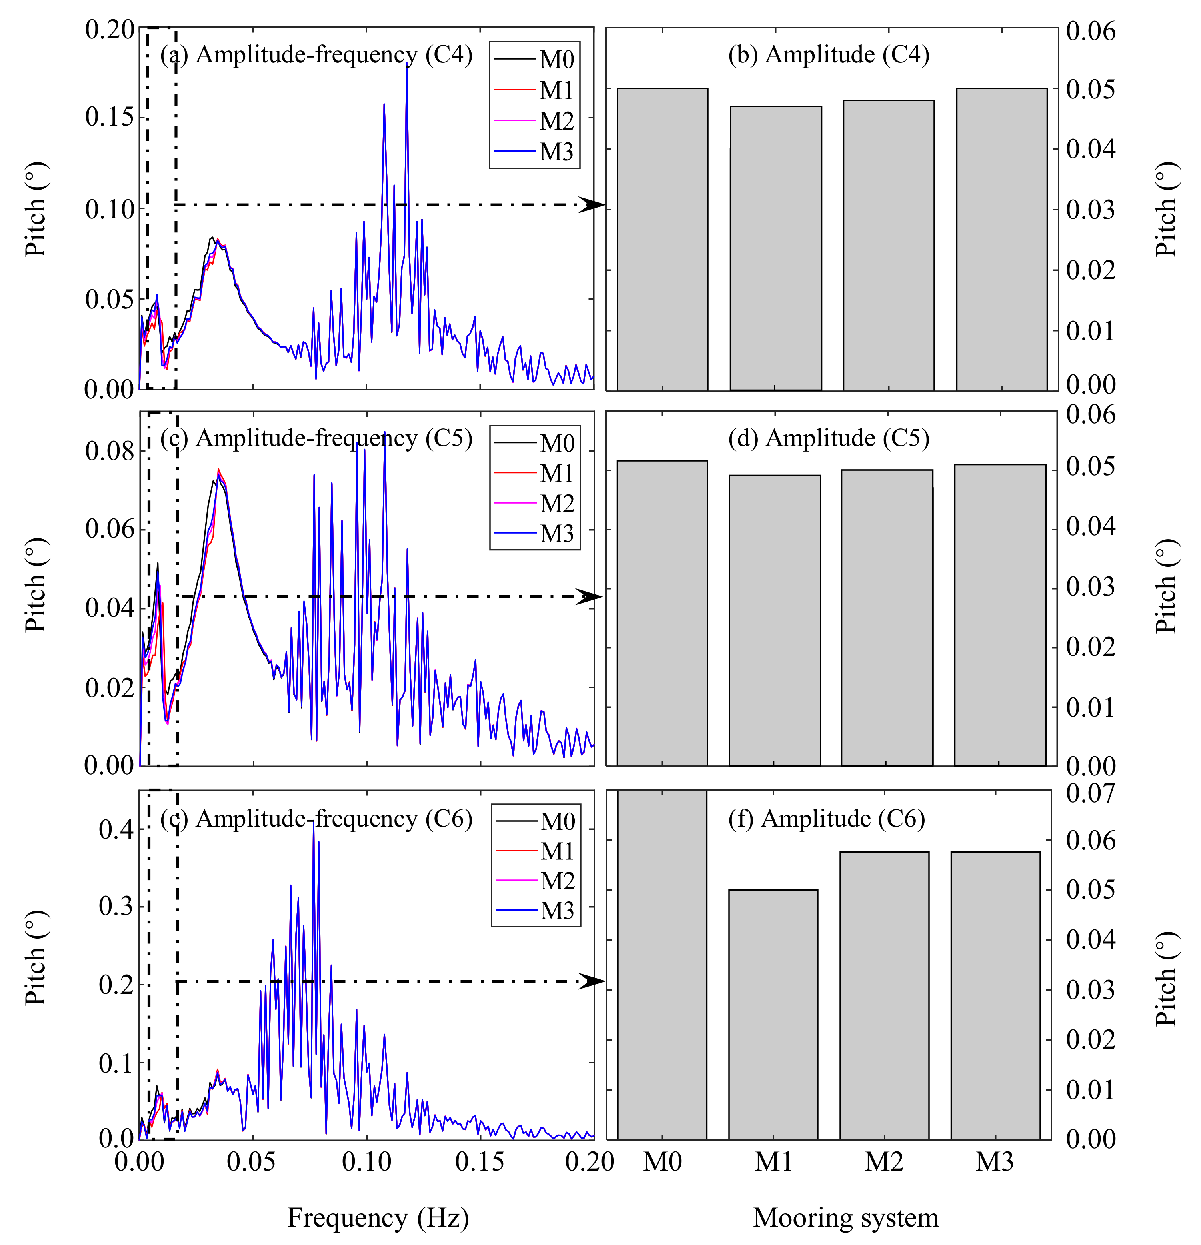
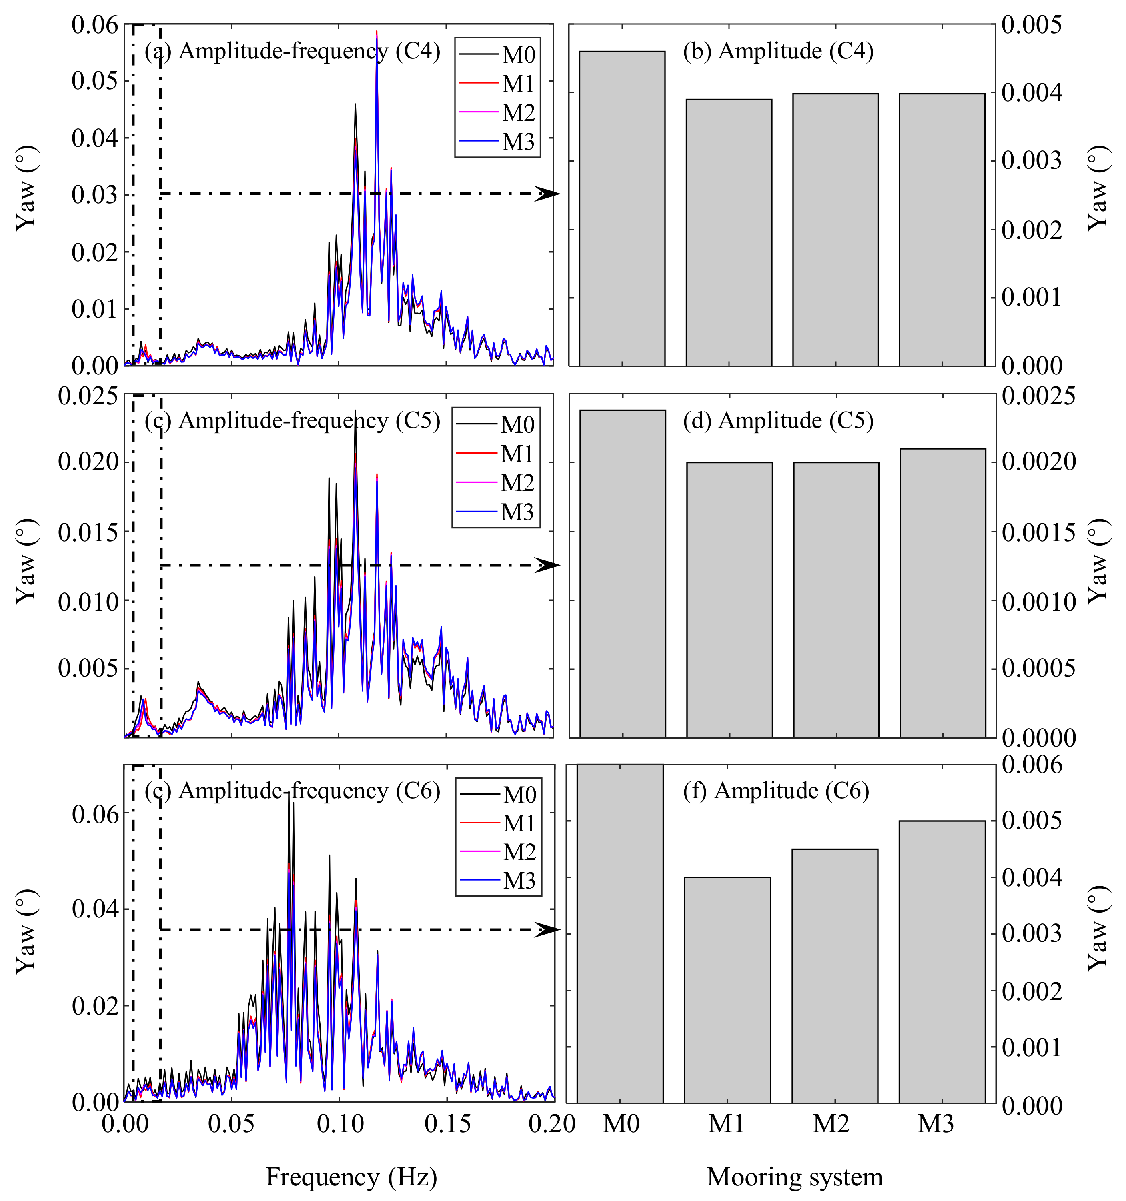
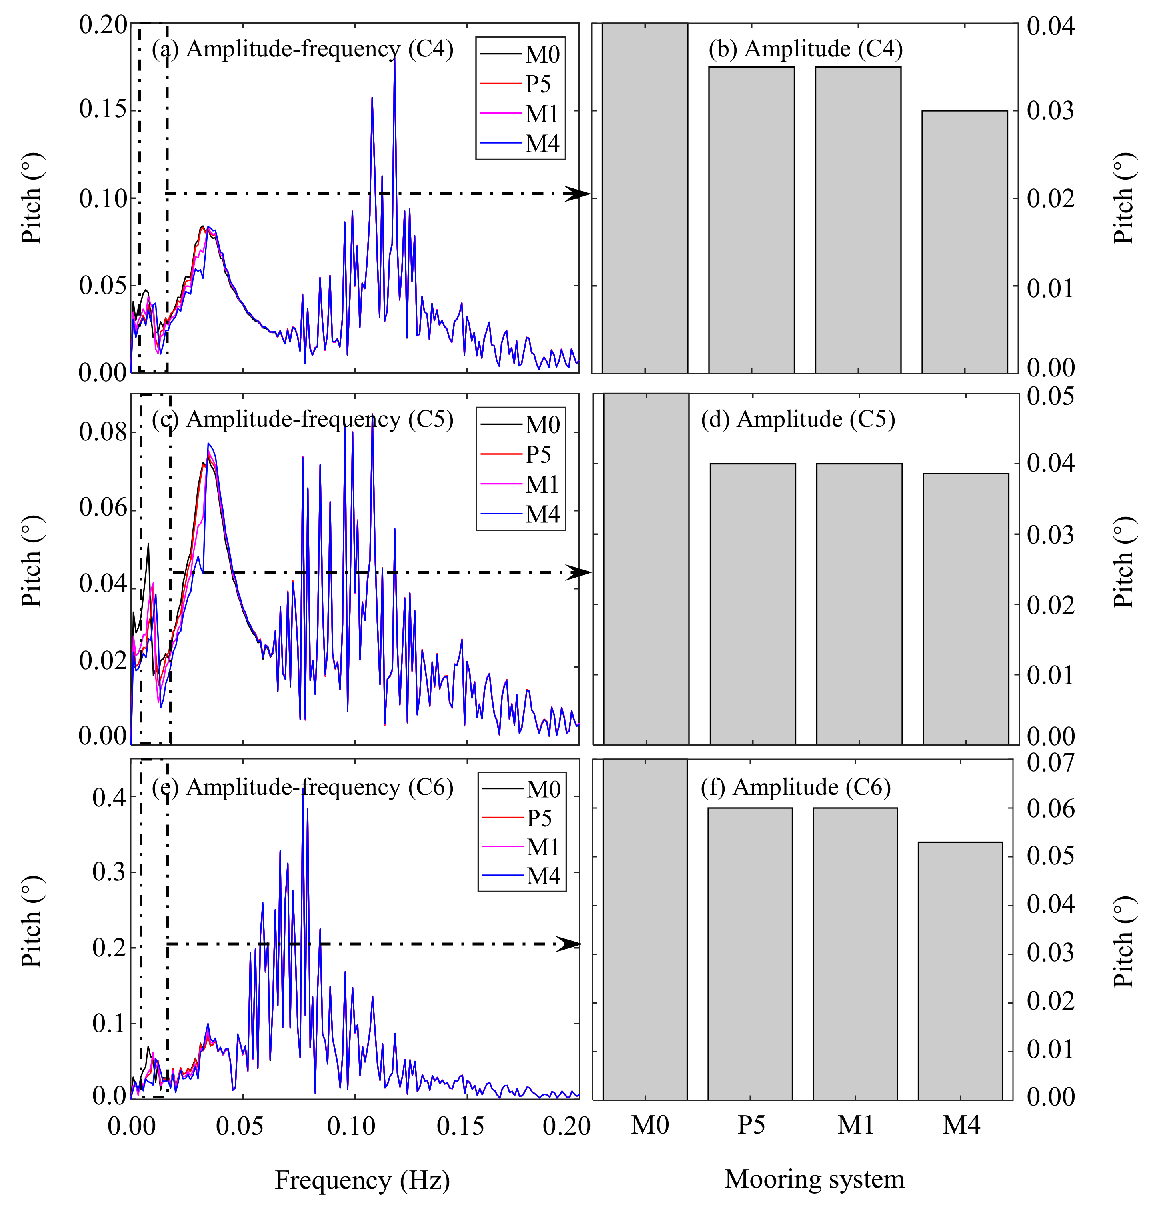
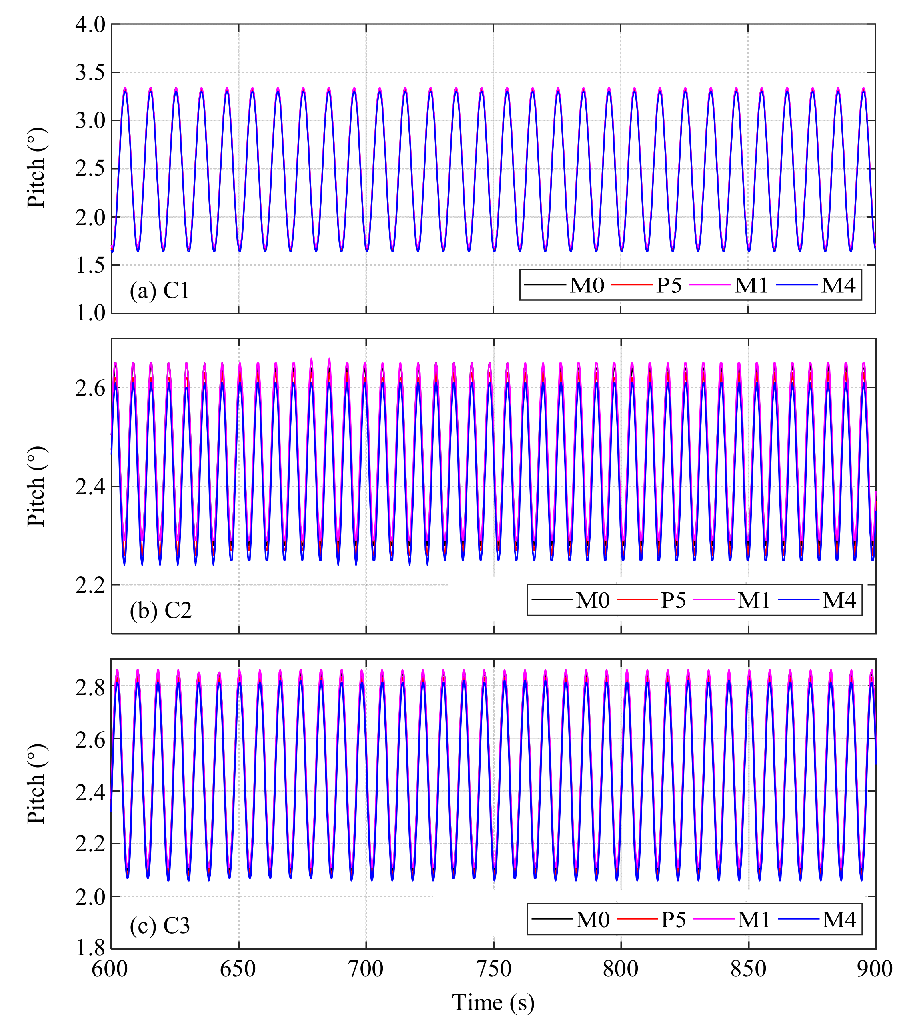
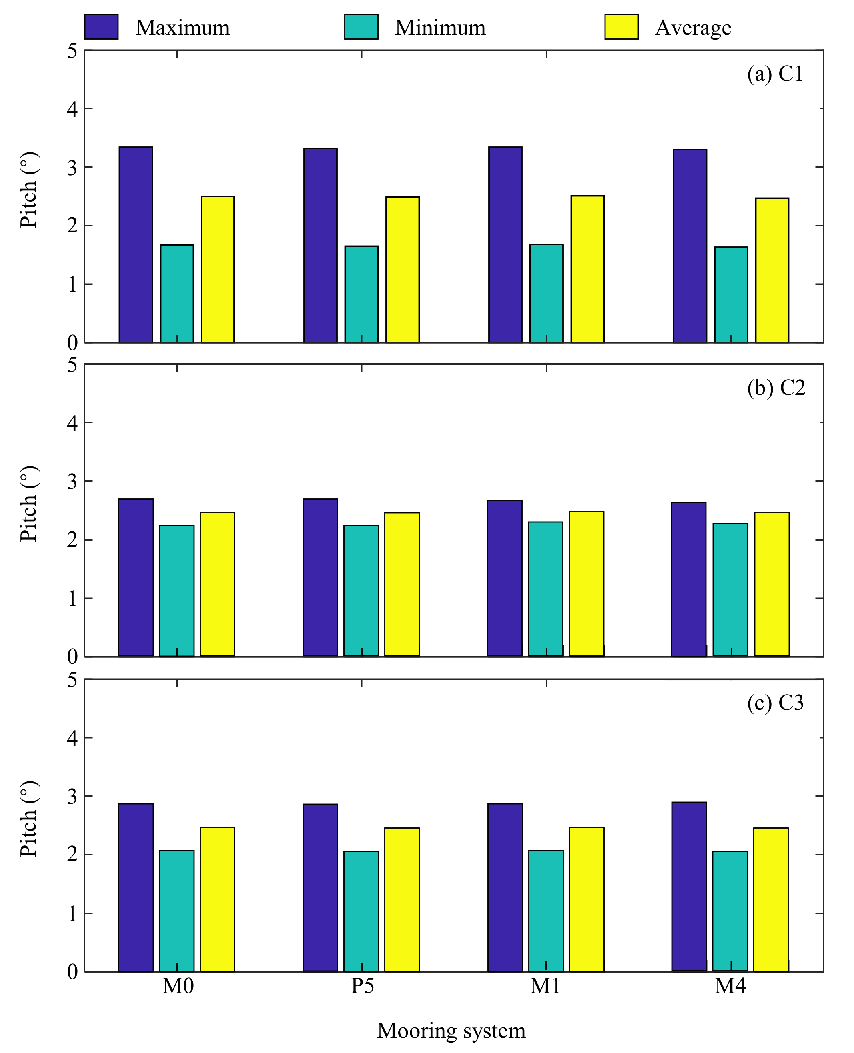
  • Optimizing the mooring system properly can effectively control the wind turbine surge and yaw movements; however, it can hardly control the wind turbine pitch movement. A possible explanation is that the gravity center of the entire wind turbine is significantly higher than the fairleads; hence, tuning the mooring system with the remaining fairlead positions lower than the wind turbine gravity center has a negligible effect on its overturning stiffness;
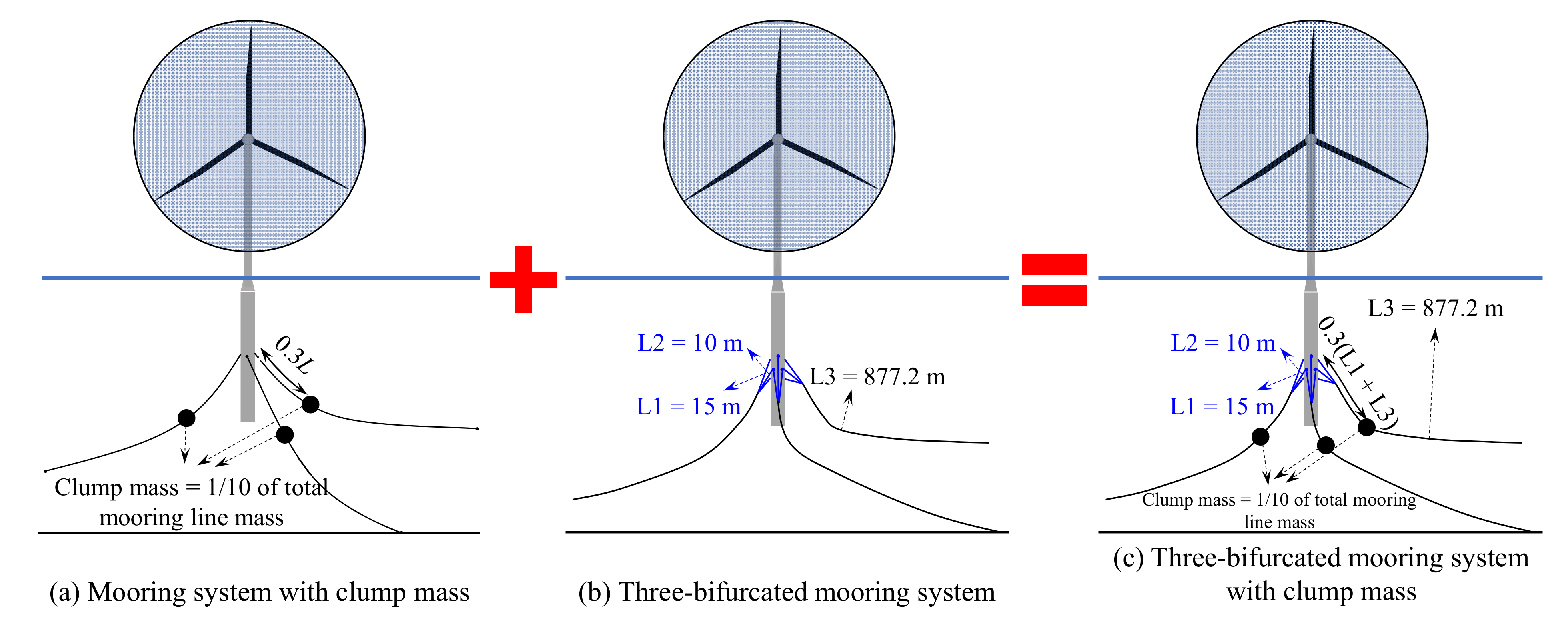
  • Through a performance study of the different three-bifurcated mooring system configurations, a recommended configuration is presented. In detail, L1, L2, and L3 should be 0.0166, 0.0111, and 0.9723 times the total mooring line length in the original mooring system. In this study, L1, L2, and L3 are 15 m, 10 m, and 877.2 m, respectively, with the total mooring line length in the original mooring system being 902.2 m;
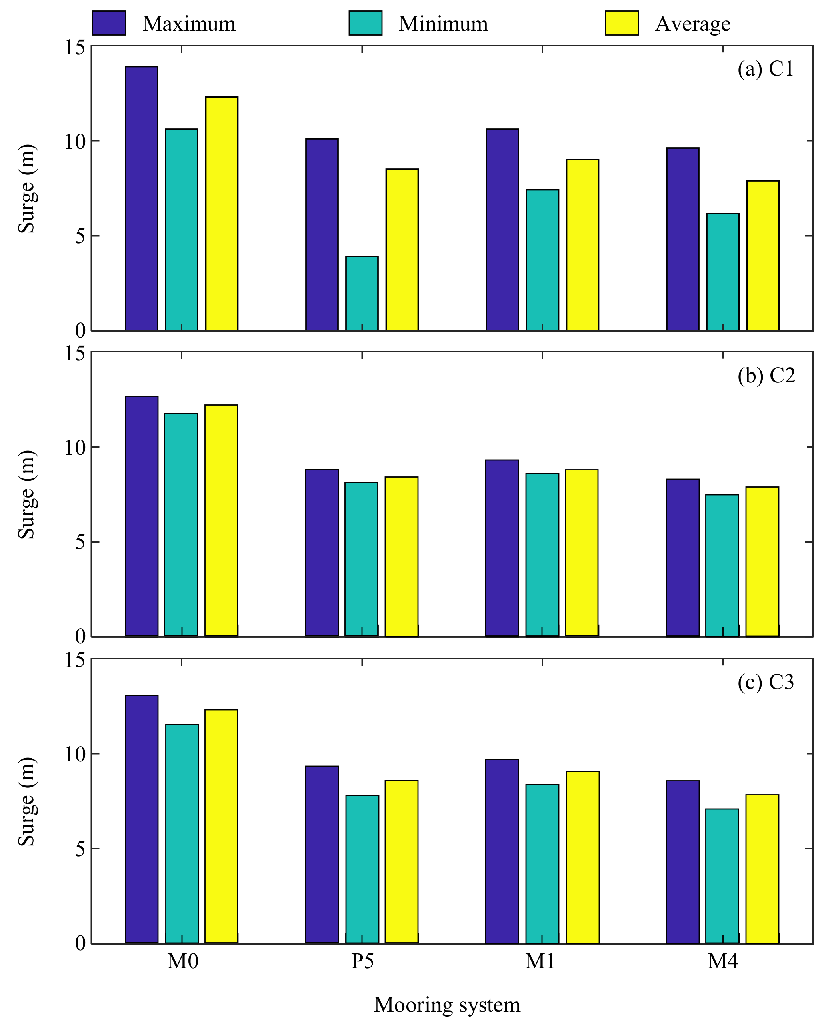
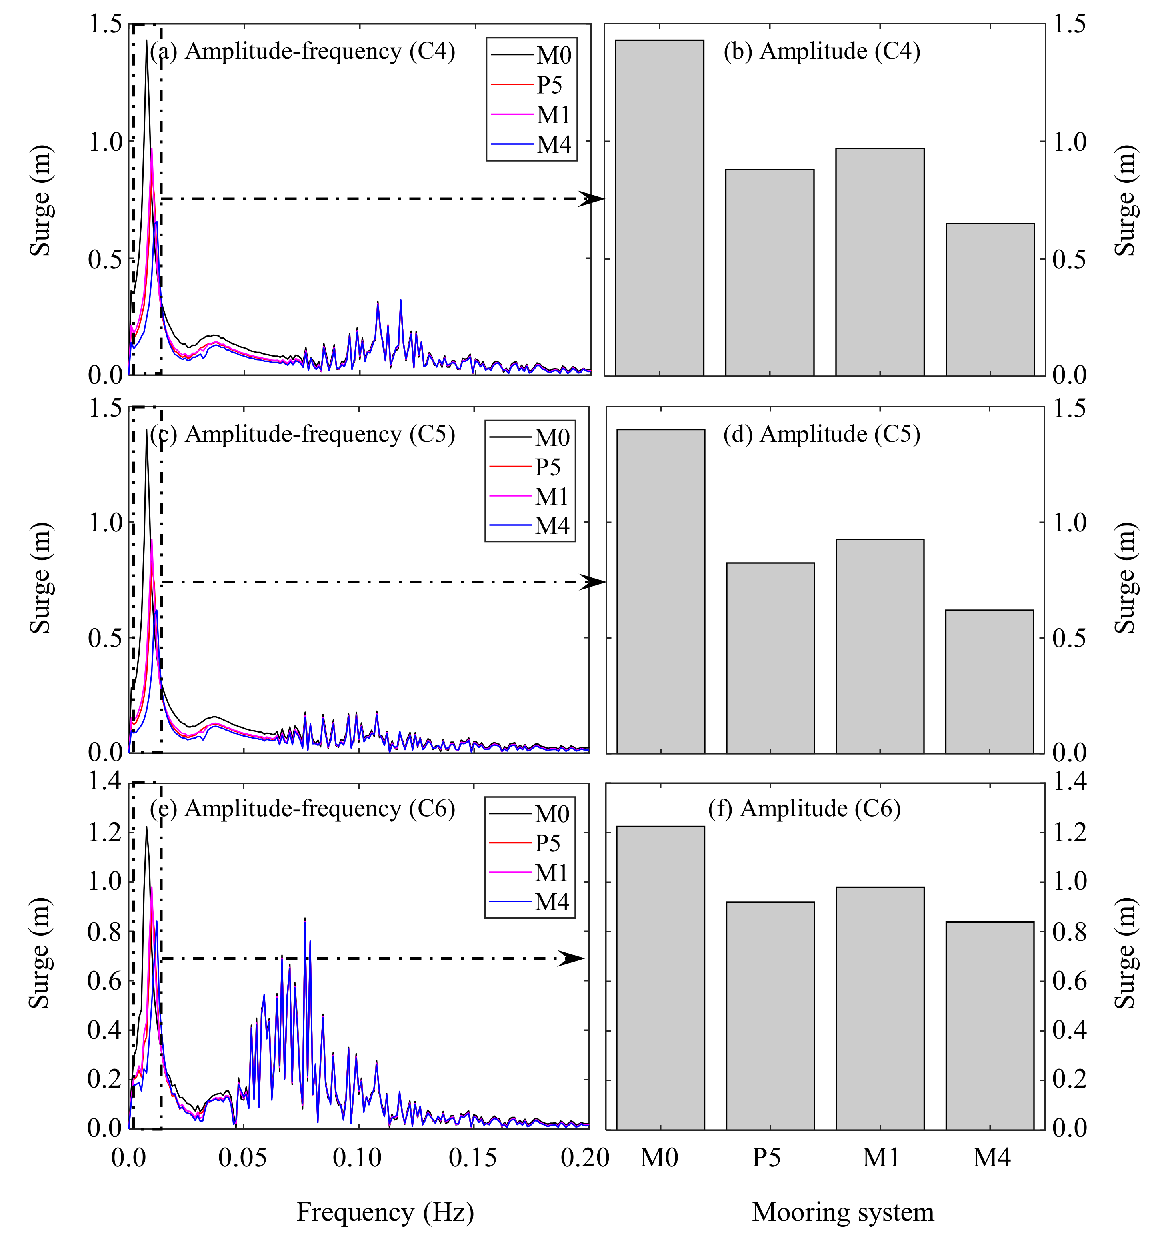
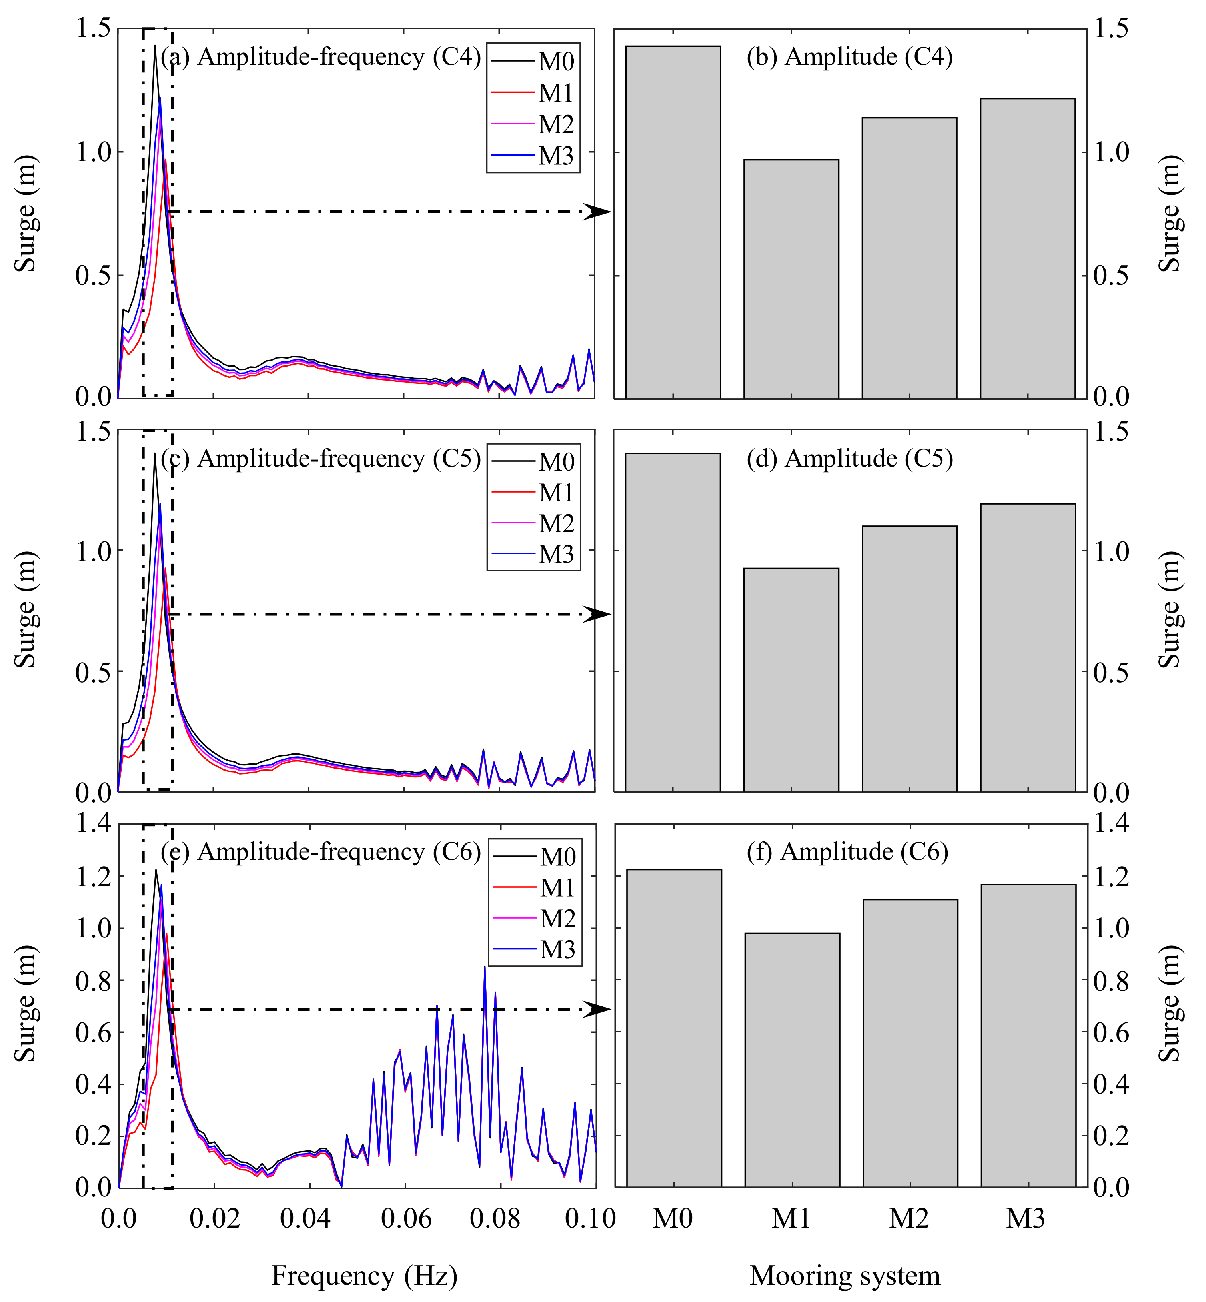
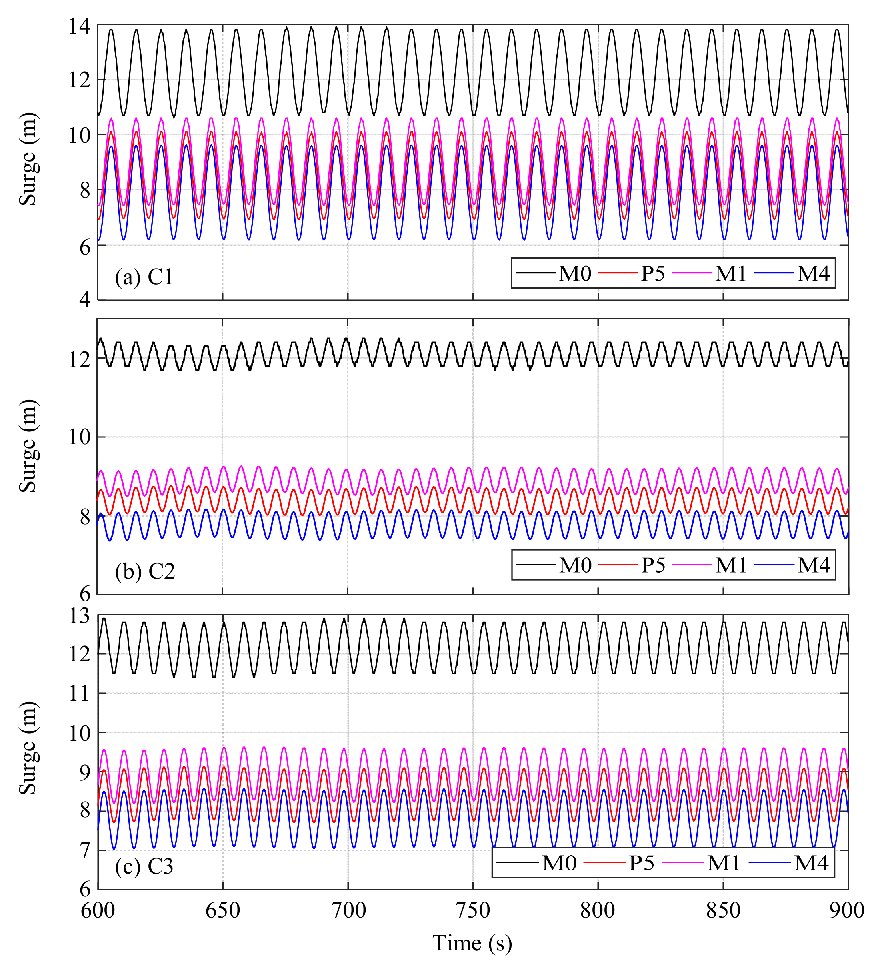
  • For the wind turbine surge movement, the three-bifurcated mooring system can, respectively, reduce it 27.88% and 35.66% when under regular and irregular waves compared with the original mooring system; the three-bifurcated mooring system with a clump mass can reduce it 37.15% and 54.5%, respectively, when under regular and irregular waves compared with the original mooring system;
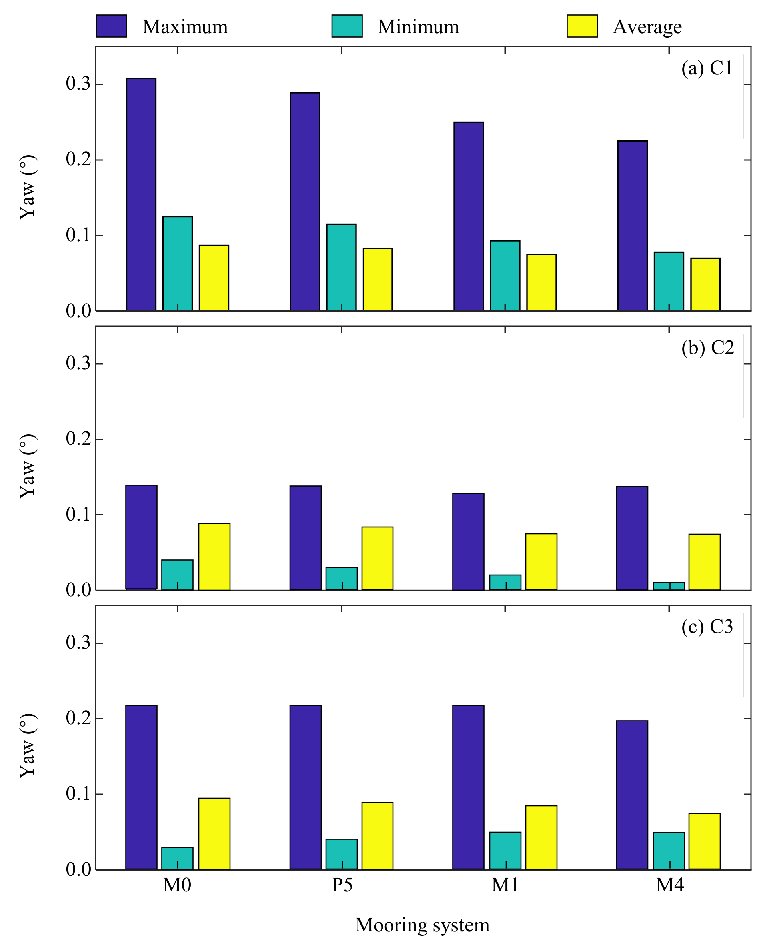
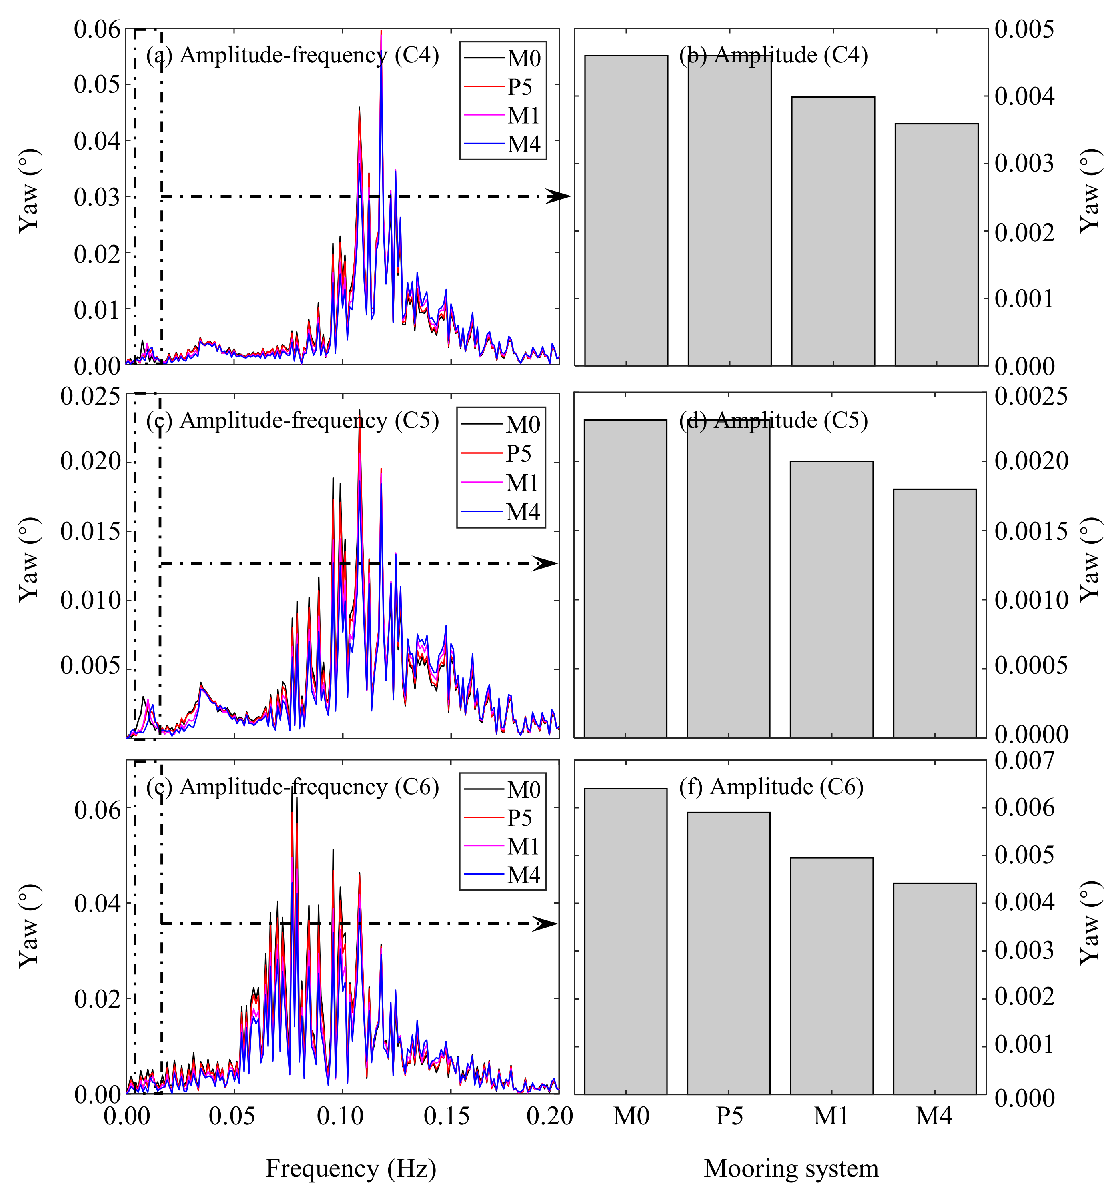
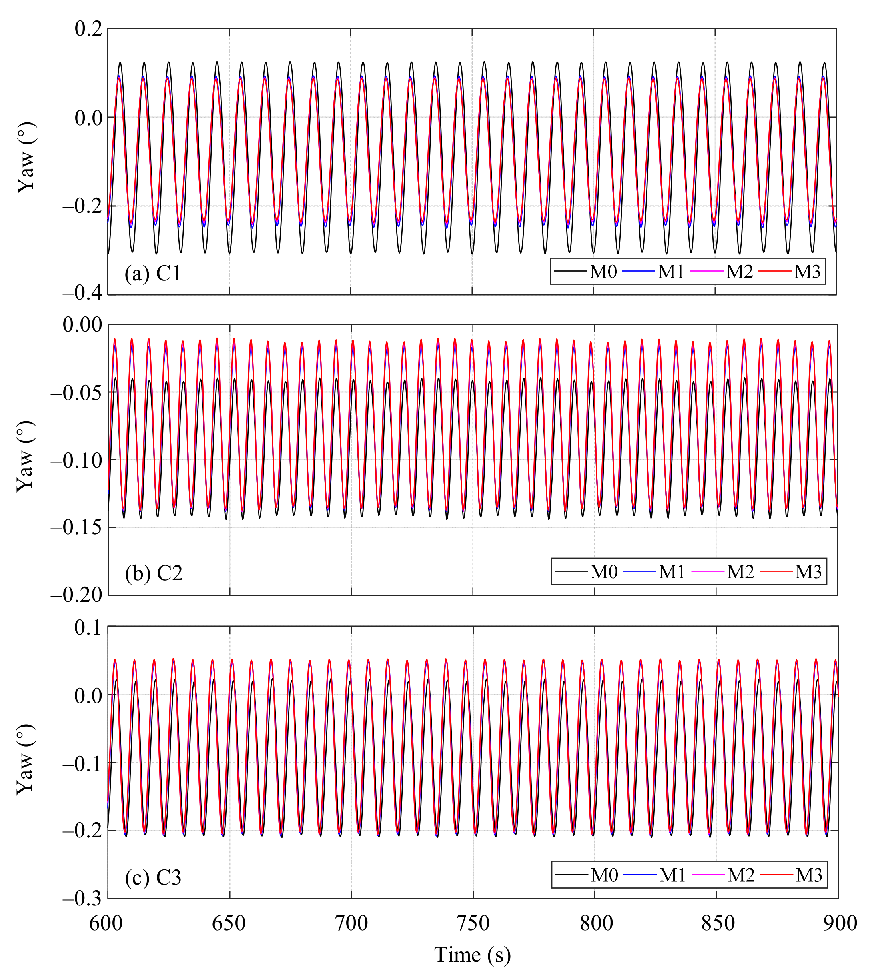
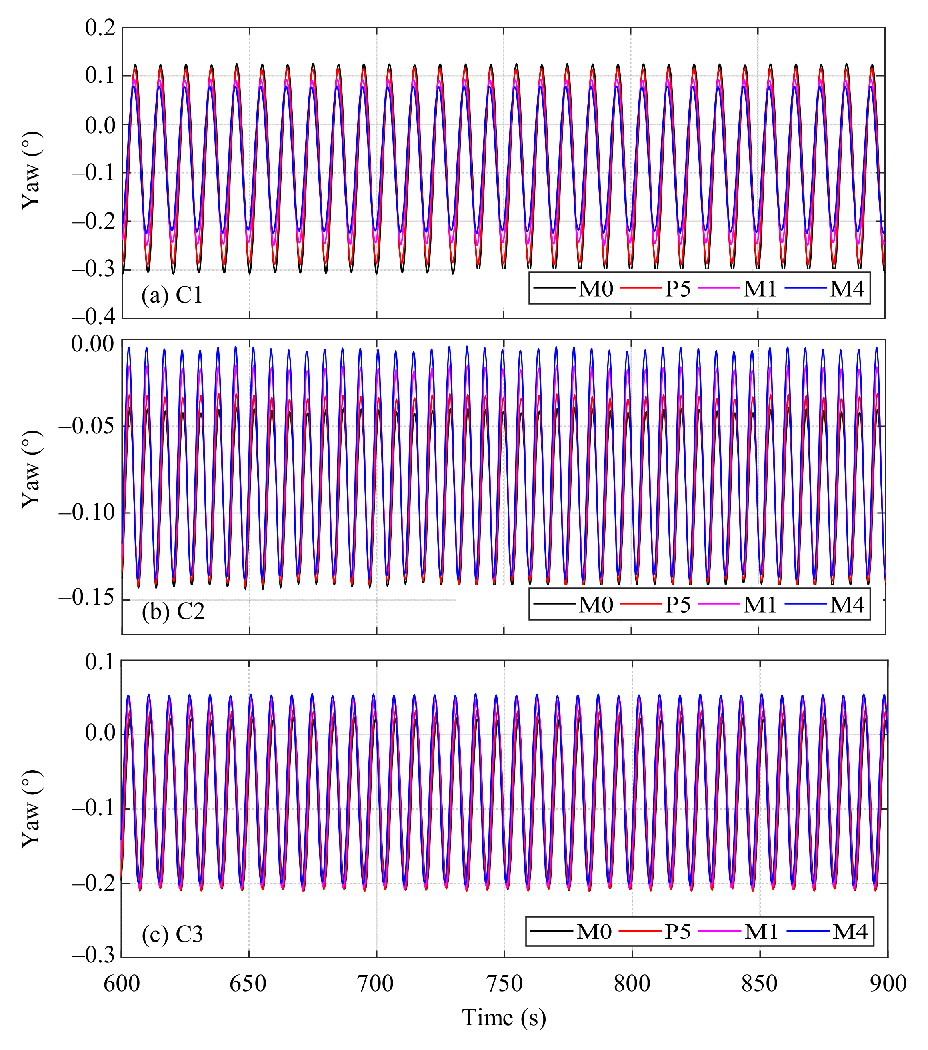
  • For the wind turbine yaw movement, the three-bifurcated mooring system can reduce it 22.3% and 33.33%, respectively, when under regular and irregular waves compared with the original mooring system; the three-bifurcated mooring system with a clump mass can reduce it 30.1% and 40%, respectively, when under regular and irregular waves compared with the original mooring system.
Although the floating wind turbine surge and yaw movements have been effectively controlled in this study by the proposed three-bifurcated mooring system, there are still some problems unsolved: (i) three empirically proposed mooring system configurations were examined in this study, and the best one was regarded as the recommended configuration. This is not accurate. Thus, in future studies, an accurate optimization algorithm should be applied to systematically optimize the structural parameters of the three-bifurcated mooring system; (ii) the developed three-bifurcated mooring system should be compared with the original mooring system presented in the OC3 phase IV project that has a delta connection in our future work; (iii) the wind turbine becomes larger and heavier, which requires larger mooring systems to support. When a wind turbine is larger (e.g., 10 MW wind turbine), how the proposed three-bifurcated mooring system performs and how to tune the proposed three-bifurcated mooring system properly for better performance can be investigated in future research; (iv) this study presents the idea of the three-bifurcated mooring system. Before applying it in real engineering, more work should be carefully done in the future (e.g., solving potential engineering application problems through conducting experiments, mooring line tension and fatigue analysis involving second order waves, fine structural parameter design according to IEC or DNV standards, and frequency behavior of floating support). At the current stage, it is valuable to increase the mooring system performance by losing a little system simplicity. The authors hope that the proposed three-bifurcated mooring system can help engineers and scientists to control floating wind turbine movement.

Author Contributions

Conceptualization, S.L.; methodology, Z.L.; software, S.L.; validation, Y.Y.; formal analysis, C.W.; investigation, Y.T.; resources, S.L.; data curation, S.L.; writing—original draft preparation, Y.Y.; writing—review and editing, Y.T.; visualization, Y.T.; supervision, S.L.; project administration, Y.Y.; funding acquisition, Z.L. All authors have read and agreed to the published version of the manuscript.

Funding

This work is supported by research grants from the National Key R&D Program of China under Grant 2019YFB1504402.

Institutional Review Board Statement

Not applicable.

Informed Consent Statement

Not applicable.

Conflicts of Interest

The authors declare no conflict of interest.

References

  1. Liu, Z.; Fan, S.; Wang, Y.; Peng, J. Genetic-algorithm-based layout optimization of an offshore wind farm under real seabed terrain encountering an engineering cost model. Energy Convers. Manag. 2021, 245, 114610. [Google Scholar] [CrossRef]
  2. Costoya, X.; Castro, M.D.; Carvalho, D.; Feng, Z.; Gomez-Gesteira, M. Climate change impacts on the future offshore wind energy resource in China. Renew. Energ. 2021, 175, 731–747. [Google Scholar] [CrossRef]
  3. Shah, K.A.; Meng, F.; Li, Y.; Nagamune, R.; Zhou, Y.; Ren, Z.; Jiang, Z. A synthesis of feasible control methods for floating offshore wind turbine system dynamics. Renew. Sust. Energ. Rev. 2021, 151, 111525. [Google Scholar] [CrossRef]
  4. Lan, J.; Patton, R.J.; Zhu, X. Fault-tolerant wind turbine pitch control using adaptive sliding mode estimation. Renew. Energy. 2016, 116, 219–231. [Google Scholar] [CrossRef]
  5. Yin, X.; Zhang, W.; Jiang, Z.; Pan, L. Adaptive robust integral sliding mode pitch angle control of an electro-hydraulic servo pitch system for wind turbine. Mech. Syst. Signal Process. 2019, 133, 105704. [Google Scholar] [CrossRef]
  6. Zhang, C.; Gutierrez, S.; Plestan, F.; Leon-Morales, J.D. Adaptive super-twisting control of floating wind turbines with collective blade pitch control. IFAC-PapersOnLine 2019, 52, 117–122. [Google Scholar] [CrossRef]
  7. Li, J.; Wang, S. Dual multivariable model-free adaptive individual pitch control for load reduction in wind turbines with actuator faults. Renew. Energ. 2021, 174, 293–304. [Google Scholar] [CrossRef]
  8. Alkmin, M.; Morais, M.; Fabro, A.T. Vibration reduction of wind turbines using tuned liquid column damper using stochastic analysis. J. Phys. Conf. Ser. 2016, 744, 012178. [Google Scholar]
  9. He, J.; Jin, X.; Xie, S.Y.; Cao, L.; Lin, Y.; Wang, N. Multi-body dynamics modeling and TMD optimization based on the improved AFSA for floating wind turbines. Renew. Energ. 2019, 141, 305–321. [Google Scholar] [CrossRef]
  10. Yang, J.; He, E.M.; Hu, Y.Q. Dynamic modelling and vibration suppression for an offshore wind turbine with a tuned mass damper in floating platform. Appl. Ocean Res. 2019, 83, 21–29. [Google Scholar] [CrossRef]
  11. Liu, Z.; Wang, Y.; Hua, X.; Zhu, H.; Zhu, Z. Optimization of wind turbine TMD under real wind distribution countering wake effects using GPU acceleration and machine learning technologies. J. Wind. Eng. Ind. Aerodyn. 2021, 208, 104436. [Google Scholar] [CrossRef]
  12. Chen, Y.; Jin, X.; Liu, H.; Li, F.; Luo, M. Large scale wind turbine TMD optimization based on Blade-Nacelle-Tower-Foundation coupled model. Ocean Eng. 2021, 239, 109764. [Google Scholar] [CrossRef]
  13. Jahangiri, V.; Sun, C.; Kong, F. Study on a 3D pounding pendulum TMD for mitigating bi-directional vibration of offshore wind turbines. Eng. Struct. 2021, 241, 112383. [Google Scholar] [CrossRef]
  14. Wang, Y.; Xu, X.; Liu, G. Analysis of effect of heave plate on vertical motion performance of truss spar platform. China Pet. Mach. 2017, 45, 46–50. [Google Scholar]
  15. Chen, D.; Gao, P.; Huang, S.; Fan, K.; Zhuang, N.; Liao, Y. Dynamic response and mooring optimization of Spar-type substructure under combined action of wind, wave, and current. Renew. Sustain. Energy 2017, 9, 063307. [Google Scholar] [CrossRef]
  16. Zheng, X.; Lei, Y. Stochastic response analysis for a floating offshore wind turbine integrated with a steel fish farming cage. Appl. Sci. 2018, 8, 12–29. [Google Scholar] [CrossRef] [Green Version]
  17. Ahn, H.J.; Shin, H. Model test and numerical simulation of OC3 spar type floating offshore wind turbine. Int. J. Nav. Arch. Ocean 2019, 11, 1–10. [Google Scholar] [CrossRef]
  18. Liu, Z.; Tu, Y.; Wang, W.; Qian, G. Numerical analysis of a catenary mooring system attached by clump mass for improving the wave-resistance ability of a Spar buoy-type floating offshore wind turbine. Appl. Sci. 2019, 9, 1075. [Google Scholar] [CrossRef] [Green Version]
  19. Leimeister, M.; Kolios, A.; Collu, M.; Thomas, P. Design optimization of the OC3 phase IV floating spar-buoy, based on global limit states. Ocean Eng. 2020, 202, 107186. [Google Scholar] [CrossRef]
  20. Yue, M.; Liu, Q.; Li, C.; Ding, Q.; Cheng, S.; Zhu, H. Effects of heave plate on dynamic response of floating wind turbine Spar platform under the coupling effect of wind and wave. Ocean Eng. 2020, 201, 107103. [Google Scholar] [CrossRef]
  21. OpenFAST. Available online: https://www.nrel.gov/wind/nwtc/openfast.html (accessed on 28 September 2021).
  22. Liu, Z.; Wang, Y.; Nyangi, P.; Zhu, Z.; Hua, X. Proposal of a novel GPU-accelerated lifetime optimization method for onshore wind turbine dampers under real wind distribution. Renew. Energ. 2021, 168, 516–543. [Google Scholar] [CrossRef]
  23. Roux, J.P.L. An extension of the Airy theory for linear waves into shallow water. Coast. Eng. 2008, 55, 295–301. [Google Scholar] [CrossRef]
  24. Neelamani, S.; Al-Anjari, N. Experimental investigations on wave induced dynamic pressures over slotted vertical barriers in random wave fields. Ocean Eng. 2021, 220, 108482. [Google Scholar] [CrossRef]
  25. Barreiro, A.; Crespo, A.J.C.; Dominguez, J.M.; Garcia-Feal, O.; Zabala, I.; Gomez-Gesteira, M. Quasi-static mooring solver implemented in SPH. J. Ocean Eng. Mar. Energy 2016, 2, 381–396. [Google Scholar] [CrossRef] [Green Version]
  26. Liu, Z.; Wang, Y. Numerical studies of submerged moored box-type floating breakwaters with different shapes of cross-sections using SPH. Coast. Eng. 2020, 158, 103687. [Google Scholar] [CrossRef]
  27. Wu, Q.; Yang, J.; Guo, X.; Liu, L. Influence of irregular waves on the dynamic response of a vertical transport system for deep sea mining. Ocean Eng. 2021, 229, 108443. [Google Scholar] [CrossRef]
  28. Han, W.; Hu, Z.; Xiang, Y. Dynamic performance investigation of a Spar-type floating wind turbine under different sea conditions. China Ocean Eng. 2018, 32, 256–265. [Google Scholar]
  29. Jonkman, J.; Musial, W. Offshore Code Comparison Collaboration (OC3) for IEA Task 23 Offshore Wind Technology and Development; National Renewable Energy Laboratory (NREL): Golden, CO, USA, 2010. [Google Scholar]
  30. Jonkman, J. Definition of the Floating System for Phase IV of OC3; National Renewable Energy Laboratory (NREL): Golden, CO, USA, 2010. [Google Scholar]
  31. Liu, Z.; Wang, Y.; Hua, X. Numerical studies and proposal of design equations on cylindrical oscillating wave surge converter under regular waves using SPH. Energy Convers. Manag. 2020, 203, 112. [Google Scholar] [CrossRef]
Figure 1. (a) Schematic of BEM; (b) aerodynamic forces on blade element.
Energies 14 08303 g001
Figure 2. Schematic of mooring system with one mooring line.
Energies 14 08303 g002
Figure 3. Flow chart of Spar-type wind turbine dynamic response analysis.
Energies 14 08303 g003
Figure 4. Schematic of OC3-Hywind Spar-type 5 MW offshore floating wind turbine.
Energies 14 08303 g004
Figure 5. Schematics of original and developed mooring systems: (a) original mooring system; (b) developed mooring system; (c) top view of Spar-type platform with developed mooring system.
Energies 14 08303 g005
Figure 6. Wind turbine surge movement time series with M0–3 when under: (a) C1; (b) C2; (c) C3.
Energies 14 08303 g006
Figure 7. Maximum, minimum, and average values of wind turbine surge movement time series with M0–3 when under: (a) C1; (b) C2; (c) C3.
Energies 14 08303 g007
Figure 8. Wind turbine pitch movement time series with M0–3 when under: (a) C1; (b) C2; (c) C3.
Energies 14 08303 g008
Figure 9. Maximum, minimum, and average values of wind turbine pitch movement time series with M0–3 when under: (a) C1; (b) C2; (c) C3.
Energies 14 08303 g009
Figure 10. Wind turbine yaw movement time series with M0–3 when under: (a) C1; (b) C2; (c) C3.
Energies 14 08303 g010
Figure 11. Maximum, minimum, and average values of wind turbine yaw movement time series with M0–3 when under: (a) C1; (b) C2; (c) C3.
Energies 14 08303 g011
Figure 12. Wind turbine surge movement in frequency domain with M0–3 when under: (a) amplitude-frequency (C4); (b) amplitude (C4); (c) amplitude-frequency (C5); (d) amplitude (C5); (e) amplitude-frequency (C6); (f) amplitude (C6).
Energies 14 08303 g012
Figure 13. Wind turbine pitch movement in frequency domain with M0–3 when under: (a) amplitude-frequency (C4); (b) amplitude (C4); (c) amplitude-frequency (C5); (d) amplitude (C5); (e) amplitude-frequency (C6); (f) amplitude (C6).
Energies 14 08303 g013
Figure 14. Wind turbine yaw movement in frequency domain with M0–3 when under: (a) amplitude-frequency (C4); (b) amplitude (C4); (c) amplitude-frequency (C5); (d) amplitude (C5); (e) amplitude-frequency (C6); (f) amplitude (C6).
Energies 14 08303 g014
Figure 15. Schematics of the (a) mooring system with clump mass, (b) three-bifurcated mooring system, and (c) three-bifurcated mooring system with clump mass.
Energies 14 08303 g015
Figure 16. Wind turbine surge movement time series with M0, P5, M1, and M4 when under: (a) C1; (b) C2; (c) C3.
Energies 14 08303 g016
Figure 17. Maximum, minimum, and average values of wind turbine surge movement time series with M0, P5, M1, and M4 when under: (a) C1; (b) C2; (c) C3.
Energies 14 08303 g017
Figure 18. Wind turbine pitch movement time series with M0, P5, M1, and M4 when under: (a) C1; (b) C2; (c) C3.
Energies 14 08303 g018
Figure 19. Maximum, minimum, and average values of wind turbine pitch movement time series with M0, P5, M1, and M4 when under: (a) C1; (b) C2; (c) C3.
Energies 14 08303 g019
Figure 20. Wind turbine yaw movement time series with M0, P5, M1, and M4 when under: (a) C1; (b) C2; (c) C3.
Energies 14 08303 g020
Figure 21. Maximum, minimum, and average values of wind turbine yaw movement time series with M0, P5, M1, and M4 when under: (a) C1; (b) C2; (c) C3.
Energies 14 08303 g021
Figure 22. Wind turbine surge movement in frequency domain with M0, P5, M1, and M4 when under: (a) amplitude-frequency (C4); (b) amplitude (C4); (c) amplitude-frequency (C5); (d) amplitude (C5); (e) amplitude-frequency (C6); (f) amplitude (C6).
Energies 14 08303 g022
Figure 23. Wind turbine pitch movement in frequency domain with M0, P5, M1, and M4 when under: (a) amplitude-frequency (C4); (b) amplitude (C4); (c) amplitude-frequency (C5); (d) amplitude (C5); (e) amplitude-frequency (C6); (f) amplitude (C6).
Energies 14 08303 g023
Figure 24. Wind turbine yaw movement in frequency domain with M0, P5, M1, and M4 when under: (a) amplitude-frequency (C4); (b) amplitude (C4); (c) amplitude-frequency (C5); (d) amplitude (C5); (e) amplitude-frequency (C6); (f) amplitude (C6).
Energies 14 08303 g024
Table 1. Structural parameters of OC3-Hywind Spar-type 5 MW offshore floating wind turbine.
ParameterValue
Wind turbineEnergy output5 MW
Hub elevation90 m
Hub mass56,780 kg
Nacelle dimension(14.2, 2.3, 3.5) m
Nacelle mass350,000 kg
Number of blades3
Rotor diameter126 m
Rotor mass110,000 kg
Rotor typeUpwind
Tower bottom elevation10 m
Tower mass249,718 kg
Spar-type platformPlatform draft120 m
Platform mass7,466,330 kg
Mooring systemAnchor 1(–853.87, 0) m
Anchor 2(426.935, –739.47) m
Anchor 3(426.935, 739.47) m
Fairlead 1(–5.2, 0) m
Fairlead 2(2.6, –4.5) m
Fairlead 3(2.6, 4.5) m
Fairlead draft70 m
Mooring line diameter0.09 m
Mooring line length902 m
Number of mooring lines3
EnvironmentWater depth320 m
Table 2. Environmental condition settings.
Case NameWave Height (m)Wave Period (s)Wind Speed (m s–1)Wave Type
C16.0010.008Regular
C22.567.008Regular
C34.008.008Regular
C46.708.68Irregular
C53.669.78Irregular
C69.1413.68Irregular
Table 3. Different developed mooring system configurations for optimization.
NameL1 (m)L2 (m)L3 (m)
M000902.2
M11510877.2
M21813871.2
M32015867.2
Publisher’s Note: MDPI stays neutral with regard to jurisdictional claims in published maps and institutional affiliations.

