Article

Open-Source Tool for Transforming CityGML Levels of Detail

Institute of Energy Efficiency and Sustainable Building (E3D), RWTH Aachen University, 52074 Aachen, Germany
*
Author to whom correspondence should be addressed.
Energies 2021, 14(24), 8250; https://doi.org/10.3390/en14248250
Submission received: 15 November 2021 / Revised: 1 December 2021 / Accepted: 4 December 2021 / Published: 8 December 2021
(This article belongs to the Special Issue Bottom-Up Urban Building Energy Modelling)

Abstract

:
Urban Building Energy Modelling (UBEM) requires adequate geometrical information to represent buildings in a 3D digital form. However, open data models usually lack essential information, such as building geometries, due to a lower granularity in available data. For heating demand simulations, this scarcity impacts the energy predictions and, thereby, questioning existing simulation workflows. In this paper, the authors present an open-source CityGML LoD Transformation (CityLDT) tool for upscaling or downscaling geometries of 3D spatial CityGML building models. With the current support of LoD0–2, this paper presents the adapted methodology and developed algorithms for transformations. Using the presented tool, the authors transform open CityGML datasets and conduct heating demand simulations in Modelica to validate the geometric processing of transformed building models.

1. Introduction

In 2018, about 55% of the world’s population resided in urban areas. This number is projected to increase up to 68% by 2050 [1]. According to the United Nations, an increase in urbanisation will also increase energy demands in different parts of the world [2]. As urbanisation is closely related to the economic, social and environmental aspects of sustainable development, it is necessary to develop strategies addressing climate change and ever rising energy demands [3,4]. Although there are wide debates about whether cities amplify or reduce the anthropogenic impact on the environment, understanding the energy trends of urban areas is of strategic importance for transforming towards a sustainable and low carbon future [5,6]. Urban energy analysis, a technique to quantify energy demands, is often used in the design, operations and commissioning phases of an urban area. At times costly and labour intensive, the technique allows urban planners and simulation scientists to efficiently predict energy trends across large areas by incorporating varied principles and methods of information sciences [7]. Over the past decades, many urban energy simulation models and programs have been developed, enhanced and are in use throughout the scientific community [8]. Using different modelling techniques, the data models used for simulations often vary in their respective geometric and semantic definitions. For energy analysis, these models predominantly require additional energy-specific data in the form of enrichment as it lacks essential information required for energy predictions. Moreover, due to multiple inconsistencies and limited availability of these models, data interoperability is a critical issue in all stages of a simulation process [9]. Data models such as CityGML are sometimes openly available for a few cities and municipalities [10]. However, if openly available, these models are generally less detailed and, in many instances, cannot be directly used for simulations. As large amounts of open data lack higher geometrical granularities within data models, facilitating the geometric transformations, from lower to higher granularity or vice versa, is a must for efficient usage of open data. In this paper, the authors present the CityGML LoD Transformation (CityLDT) tool for transforming CityGML datasets from lower to higher and higher to lower geometric granularities.
The remainder of this paper is structured as follows: The “Literature Review” chapter highlights different energy modelling techniques, an enrichment approach, factors influencing energy model predictions and, the considered data model CityGML with respect to its corresponding Levels of Detail, Application Domain Extension and availability. The review presented in Section 2 forms the basis of developing CityLDT; the “Aims of Research” chapter describes the challenges of using CityGML models and further introduces the CityLDT tool; the “Methodology and Implementation” chapter highlights the methods adapted to transform CityGML LoDs; the “Tool Validation” chapter gives an overview of three use cases demonstrating the applicability of the tool; the “Discussion” chapter highlights the significance of CityLDT in UBEM-based studies and further discusses the availability of the tool. This is followed by the “Conclusion” chapter.

2. Literature Review

This chapter provides an introduction to UBEM and BEM, their usage and individual modelling techniques, an archetype-based enrichment approach, the state-of-the-art highlighting some factors influencing energy simulations and, further details over the OGC open-standard CityGML. For developing and validating the CityLDT tool, this literature review served as a basis.

2.1. UBEM and BEM

Urban Building Energy Modelling (UBEM), an analytical method to model buildings on city-levels, is often considered as a comprehensive and advantageous strategy to understand the overall energetic behaviour of urban areas. Using UBEM-based approaches, a prognosis of energy demands, retrofitting requirements and energy saving potentials can be made. UBEM inherits many methodologies and principles from Building Energy Modelling (BEM) but is usually used at a larger scale. For energy analysis, UBEM requires input data such as building geometrical detailing, construction data, 3D models, building physics data, Heating, Ventilation and Air Conditioning (HVAC), occupancy profiles, and system descriptions [11,12,13,14]. Generally, building models in UBEM are less detailed than in BEM [15,16].
In BEM, the modelling techniques mainly comprise of black-box models (empirical or statistical-based), and grey-box models (both physics and statistical-based) and white-box models (forward modelling or physics-based) [17,18,19]. For UBEM, two more categories are defined, namely, top-down and bottom-up [9,14,19]. The top-down approach includes econometric and technological models [20] by employing the statistical information and macroeconomic variables for determining energy demand projections [19]. It is suitable for an aggregated and broad level large-scale analysis as it couples variables such as gross domestic product, fuel costs, and income to the energy sector [20,21]. A top-down approach also subdivides the measured energy use at an urban level using statistical relationships established between individual building properties (such as age and area), occupancy patterns, and population [22]. The top-down approaches often lack details relating to the current and future technologies that could influence the energy demand of a building [23]. Apart from the top-down approach, a bottom-up approach is also commonly used in UBEM. The bottom-up approach requires an extensive amount of detailed information about each buildings along with substantial computational resources [22]. Developed using a bottom-up approach, the models consider and articulate building clusters with similar characteristics (geometric and non-geometric parameters) at different modelling levels [17]. In bottom-up models, the description of the individual building is based on the type of input data, i.e., dwelling properties, building physics and energy use [24,25]. On regional and national levels, the bottom-up approach extrapolates the estimated energy consumption of a representative set of individual houses and the approach consists of two distinct methodologies: a statistical method and an engineering-based method [23]. Using a bottom-up approach, some approaches also allow modelling of large groups of residential buildings and uses the information from public building registers, weather measurements, and hourly smart-meter consumption data [26]. According to Costanzo et al. [20], the advantage of bottom-up over top-down approaches is their ability to analyse energy demand by end-users and provide detailed technological interventions to improve the energy efficiency of buildings. Bottom-up models are also generally referred to as "urban building energy models" in some of the existing literature [27,28,29,30,31,32,33].

2.2. Archetype-Based Approach

In many of the bottom-up UBEM-based physical approaches, enrichment of pure geometrical models is considered an important step [12,19]. For an efficient simulation workflow, parameters such as heating and cooling schedules, and material properties, etc., are enriched directly in the input data model. Approaches made by previous studies [21,29,34,35,36,37,38,39] relate to pre-defined archetypes for enrichment. An archetype is defined by selecting a sample building with measured data or by using statistical building-related data [40]. Previously, Reinhart and Davila [28] describe the available building archetypes in different countries and further explain the process of enriching building models with archetype information. A recent article by Hao and Hong [41] also states that a detailed building characterisation, including physical properties, geometry information, and energy use data should be used as input for UBEM by establishing building archetypes. Using an archetype-based approach, the geometrical models are enriched with specific attributes based on their years of construction and building usages. Some databases and sources [42,43,44,45,46,47] require years of construction and building usages for assigning digital models with energy specific building information for an archetype-based enrichment. The information about the years of construction and building usages is, therefore, a requirement for an archetype-based enrichment and should be included directly in the input data models. The usability of an archetype-based enrichment also increases the dependence on precise building-related information. However, an inclusion of specific information into the data models results in a more complex and lengthy process for the urban energy community.

2.3. State-of-the-Art

A basic UBEM approach applies virtual 3D models of heat and mass flows to predict energy demand along with assessing the indoor and outdoor environmental conditions at an urban scale [28]. Energy model predictions are largely influenced by factors such as input data models [48,49], building geometries [50,51,52], construction properties [36,53], occupancy [54,55,56], urban form [57,58,59], densification [60,61], and micro-climate [31,62], etc. Although different factors contribute to developing UBEM workflows, virtual 3D models are mostly considered as a starting point for simulations. Virtual 3D city models are currently being used in many different applications and have become general-purpose tools for storing, exchanging and distributing geo-spatial information [63]. For computing the energy performance of the buildings, 3D geometrical data models are generally used as an input for building geometries, years of construction, building usages, roof types, etc. One such virtual 3D city model, particularly the Open Geospatial Consortium (OGC) standardised and open data format of City Geographical Markup Language (CityGML) [16,64], has provided a significant boost in the development and visualisation of urban energy data [65].

2.4. CityGML

CityGML, an open XML-based data format, is used to represent cities and urban areas for storage and exchange of geometrical data for individual buildings. CityGML facilitates the representation of semantic and topological information at a city level and is commonly used in energy-related applications [66]. With the CityGML Core Module concept exists a number of thematic modules for representing buildings with their interior and exterior structures. For energy simulations, generally, the CityGML Building Module is considered. CityGML also uses surface geometry representation for depicting different building elements. The data models defined in CityGML use uniform spatial reference system definitions. They contain information related to building footprints, geometries, numbers of floors above/below ground, years of construction, and roof types, etc. Figure 1 gives an overview of the basic structure of a building represented in CityGML format. Each building is modelled with an outer shell and interior rooms. The outer shell consists of individual outer wall surfaces and the building roof surfaces. The interior rooms include the geometric definition of the interior wall surfaces along with ceiling and floor surfaces.

2.5. CityGML—Levels of Detail

For representing real objects with geometric and semantic detailing, CityGML models support the concept of Levels of Detail (LoD) [66]. Depending upon the amount of information present in the models, datasets in CityGML can be represented in five LoDs. Starting from LoD0, building models are represented by a regional and landscape scale representation with the lowest accuracy [9]. The LoD0 models consist of semantic information, the footprint and height of a building and representations of the roof; however, it does not include any information on building installations and city furniture (city furniture objects are immovable objects such as traffic lights and signs, advertising columns, lanterns, benches or delimitation stakes [66]). LoD1, generally an extrusion of the LoD0 model, represents the buildings in a single geometry block with a flat roof surface. For LoD1, the volume of a building is estimated using the building height and flat roof area. Upscaling from LoD1 by including more information, the LoD2 building models represent detailed roof information. For energy simulations, the information of roof surfaces is important to calculate the actual volume of a building. Cities and urban areas, often represented as LoD2 models, are also prominently used in energy-related analysis. Compared to LoD2, the LoD3 models are much more detailed. The LoD3 models are used to represent buildings with an exterior architecture and landscape scale. These models include information about windows, openings and exterior installations for different buildings. For a detailed interior architectural representation, it is common to use the LoD4 models. The LoD4 models are quite detailed; however, these are generally not used for simulations. Recently, the LoD4 is also excluded from CityGML 3.0 and the indoor representation is allowed at all LoD levels [68]. Figure 2 gives an overview of the five LoDs in CityGML.

2.6. CityGML—Application Domain Extensions

Virtual 3D CityGML models are used for many different applications ranging from traffic noise simulations [69], flood analysis [70], Building Energy Performance Simulation (BEPS) [71], and many others. Depending upon the desired application, CityGML geometric models are extended using the Application Domain Extension (ADE) mechanisms. This extension facilitates the extensive usage of the geometrical model by many use cases and simulations. Though there exist many different types of ADEs [66,72,73], for energy simulations, the energy ADE [74] and the utility network ADE [75] are generally used.

2.7. CityGML—Usage and Availability

In recent years, published articles such as [76,77,78,79,80,81,82,83,84,85,86,87] have made use of CityGML models for energy performance simulations. Some studies facilitate energy demand calculation simulation environments such as Modelica [88,89,90,91] and EnergyPlus [80,92,93]. Although widely used for energy simulations, the availability of these geometric data models is always in question. In a taxonomic review, Malhotra et al. [9] recently concluded that CityGML along with EnergyPlus is most prominently used in UBEM-based studies. Their article also emphasises that the usage, enrichment and further storage of enriched open datasets in the form of CityGML Energy ADE and gbXML will help simulation scientists in efficiently developing, validating and maintaining energy simulation workflows and tools. Moreover, due to a lack of availability and simplified geometrical approaches, Carnieletto et al. [94] recently highlighted the difficulties in calibrating and validating UBEM-based approaches using models developed in CityGML, GeoJSON, CityJSON. Rosser et al. [95] also mention that it is challenging to develop urban housing stock models for energy simulation as it requires a range of information for accurately representing the characteristics of each building. Their article further mentions that the development of nation-wide data is planned for the future [96,97]; however, it is not available for countries such as the United Kingdom. Braun et al. [98] describe the challenges, such as missing information, geometric inconsistencies and inaccuracies, faced when creating energy models from a CityGML model for the city of Stuttgart, Germany. Chen et al. [13] evaluate the availability of public datasets in San Francisco and recognise a lack of common parameters while mapping data into CityGML. Although there exists many difficulties in developing and accessing open-CityGML datasets, some countries, municipalities and governmental organisations do provide open access to the data in LoD1 and LoD2 [10]. Table 1 gives an overview of the availability of open-source 3D CityGML data in different LoDs.

3. Aim of Research

As shown in Table 1, the datasets representing cities are most commonly available in LoD1 and 2. Although some countries also provide access to LoD3, these are not included in the scope of this paper and are mostly restricted in access. Instead, the LoD0 models alongside LoD1 and 2 are used in the rest of the paper. As previously mentioned, the LoD0 CityGML models are a two and a half dimensional Digital Terrain Model and can be used to visualise building footprints and/or the geographical occurrence of a building. The applications of LoD0 might be limited but is generally used for digital cartography [108], floor plan generation [109] and others. In LoD1, the buildings are represented as block models with prismatic buildings and flat roofs [110]. The LoD1 models differ from LoD2 as it does not include differentiated roof structures and thematically differentiated surfaces. Due to simplified geometrical definitions, easier imports into different tools, and feasible transformations from other data models, the LoD1 is also commonly used despite its mentioned shortcomings [111,112,113]. Previous studies from Malhotra et al. [49], De Jaeger et al. [48,50,51], Faure et al. [27], Geiger et al. [114] and Monien et al. [52] demonstrate the impact and deviations of building geometries and CityGML LoDs for UBEM use cases. The deviations, in simulation results, between LoD1 and LoD2 can sometimes also occur due to varying wall/roof ratios. Due to varied applications and a generalised availability of open CityGML datasets in LoD1 and LoD2 [10], it is necessary to enable the transformation of CityGML models from one LoD model to another.
Previously, an article by Fan and Meng [115] presented an approach for deriving 3D building models in different CityGML LoDs. Implemented using Matlab, their approach primarily focused on downscaling higher LoD models into lower LoD models. The presented approach in their article did not include any information over upscaling CityGML LoDs. Another method by Deng and Cheng [116] also presented an automatic transformation of different CityGML LoDs. In their workflow, a new exterior shell extraction algorithm is developed using a ray tracing-based algorithm. They classify building surfaces as interior or exterior and also include an additional LoD called LoD3.5. Other techniques proposed by Li et al. [117] and Sun et al. [118] also allow the transformation of different LoDs, but these are generally limited to downscaling higher LoDs to lower ones. Moreover, most of the previously mentioned techniques are not available as open source nor updated in recent years. Therefore, in this paper, the authors introduce an open-source CityGML LoD Transformation (CityLDT) tool.
CityLDT allows the input of CityGML LoD0, 1 and 2 models. Depending on the input data, a transformation to the desired LoD can be achieved using the tool. CityLDT enhances the interoperability of CityGML LoDs, thereby, increasing its usability in a number of use cases. Due to a modular structure, CityLDT can be incorporated into different workflows and tool chains. Detailed explanations of the developed algorithms along with the tool’s functionalities, accessibility, structure and limitations are given in the next sections. Furthermore, three use cases are described highlighting the usability of the tool. In this paper, a bottom-up UBEM-based archetype approach is also used to simulate CityGML building models for heating demand computations.

4. Methodology and Implementation

An analysis using an advanced search on the academic platform “Web of Science” [119] shows an increasing trend in UBEM-based published articles from 2010 to 2021. Using keywords "UBEM", "GIS", "heating demand simulation", "CityGML", "LoD", a further analysis depicted in Figure 3 over the usage of openly available data shows that more than 96% of the studies, i.e., 7803, do not use open data. Between 2010 and 2021, only 572 articles make use of open-access data for UBEM. This fact can be caused by less or no availability of open data models, supporting workflows, or even due to a lack in interoperability within the data models itself. If a software or workflow limits the usage of detailed input data, a workflow to transform the model’s LoD should be openly available. This paper, therefore, focuses on these transformations using only CityGML building models. Figure 3 gives an overview of the number of publications from 2010 to 2021 with or without using open-source input data. As the analysis was made in mid-2021, the number of publications for 2021 is comparatively lower than the one in 2020.
With lower or higher detailing, virtual 3D data models can also be generated using different techniques and methodologies [120]. As simulation scientists focus on the interoperability of different data models, many recent studies increasingly focus on transforming Building Information Modelling (BIM)-based Industry Foundation Classes (IFC) models into Geographical Information System (GIS)-based CityGML models. Biljecki et al. [121] recently suggested an extension, in the form of CityGML ADE, to prevent loss of information while converting IFC to CityGML. Zadeh et al. [122] also suggest an integration of BIM and GIS data for practical applications such as operation and maintenance on an urban scale and for designing district energy centres. Studies such as Jusuf et al. [123], Colucci et al. [124], Tauscher et al. [125], Adouane et al. [126], Zhu et al. [127], Donkers [128] also explain the requirements, processes and implementations of combining the domains of Building Information Modelling and Geographical Information System together. Although previous studies focus on transforming from one domain to another, not many highlight the importance of interoperable data processing within the considered data model itself. If thoroughly explained, data models in different granularities can be used over a wide range of applications. Therefore, this paper presents algorithms and use cases for transforming CityGML models between LoD0, 1 and 2.
The transformation from one LoD to another can be achieved using the presented CityGML LoD Transformation (CityLDT) tool, which provides a user-friendly and self-explanatory Graphical User Interface (GUI) enabling users from all domains and expertise. With an objective of simplified transformation of CityGML data models between different LoDs, users may consider LoD0, 1 and 2 as input for the tool. A support for LoD3 and 4 is foreseen by the authors as future work. CityLDT is being developed and tested using Python programming and supports version 3.5 and higher. Using CityLDT, data models are transformed by either (i) upscaling from lower to higher LoD or (ii) downscaling from higher to lower LoD. Within both approaches, the output data models are exported in the identical CityGML version as the input model. As demonstration objects, the FZK House [129] in LoD0-2 is further used in Section 4.2 and Section 4.3. A representation of the FZK House in different LoDs is also previously shown in Figure 2 (Section 1). In this paper, the visualisation of CityGML models is made using the FZK Viewer [130]. The algorithms used for transforming CityGML models comply with the SIG3D “Modelling Guide for 3D Objects” [131]. Section 4.1 gives an overview of the import options of CityLDT. Section 4.2 and Section 4.3 explain the two approaches used to transform the LoDs. Section 4.4 highlights the optional user inputs to edit the input model. Furthermore, Section 4.5 describes the export options for the transformed CityGML models.

4.1. Import

As input, CityLDT facilitates the selection of a single CityGML dataset or a number of datasets by selecting a single folder. It also allows users to select individual building models along with the option of selecting all the models present in the dataset. The import of the CityGML dataset also highlights the model’s LoD. This is displayed to the user for a simplified selection. Currently, both building and building parts (a building part is a sub-division of a building that is homogeneous related to its physical, functional or temporal aspects and may be considered as a building [131].) are considered as a single building and a building part cannot be transformed individually. Figure 4 gives an overview of the CityLDT’s input window.

4.2. Upscaling from Lower to Higher LoD

In CityLDT, upscaling the CityGML models from lower to higher granularity requires an extraction of parameters from the input model and, sometimes, user-based parametric inputs. Some attributes, such as the bldg:GroundSurface(the “bldg” namespace refers to the definition of class Building in CityGML; it includes different sub-classes for defining the geometrical definitions of individual buildings with various granularities [131]) are considered from the input model; however, parameters such as bldg:measuredHeight (the building height is similar to the “measured height” as defined in the modelling Guide for 3D Objects [131]), if not present, are either calculated using other geometrical parameters (only for LoD1) or must be provided by the user. Section 4.2.1 and Section 4.2.2 explain the approaches used for upscaling the LoD of the models.

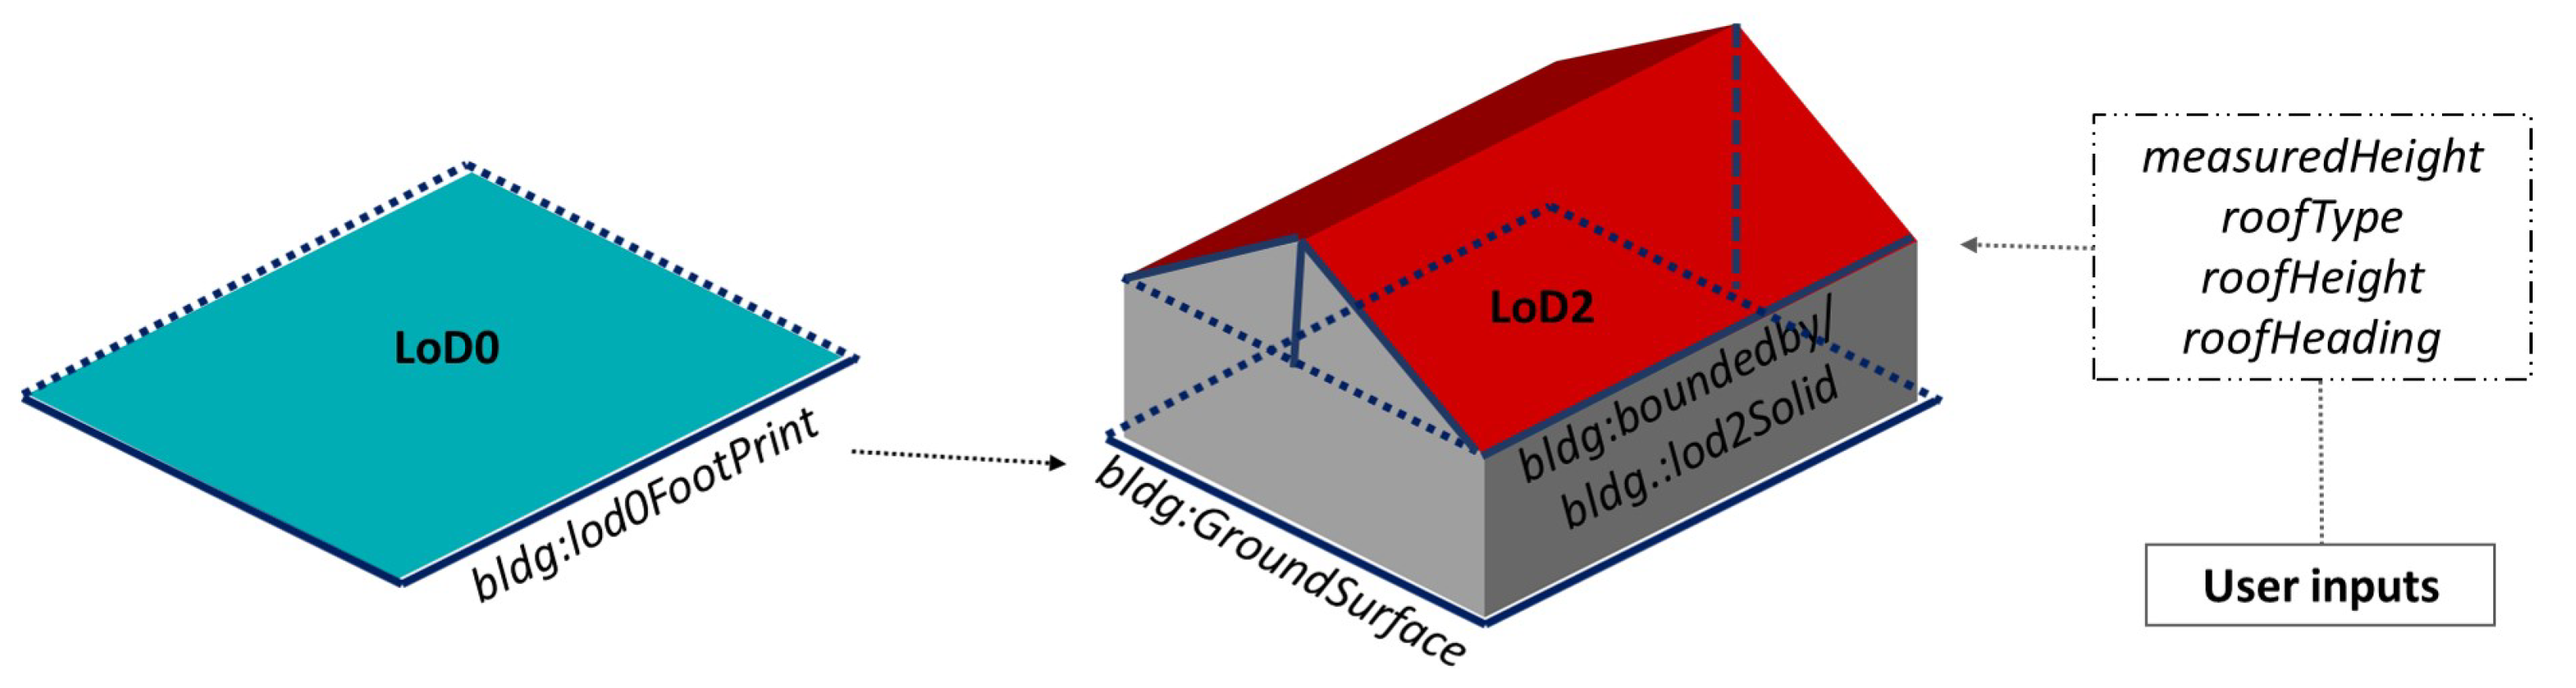
4.2.1. Upscaling LoD0 Models

The CityGML modelling guide [131] states that buildings in LoD0 are represented by the footprint or roof outline using a horizontal polygon with a well defined absolute and constant height. The LoD0 models sometimes might not contain the required information for representing a building with higher detailing [131]. For upscaling the LoD0 into LoD1 and LoD2, initially the groundSurface coordinates are extracted from the bldg:lod0FootPrint element of the LoD0 model. As there are no designated groundSurface elements in the LoD1 model, this information is added to a bldg:lod1Solid element. Whereas, for LoD2, this information is added to the bldg:boundedBy/bldg:GroundSurface element.
After defining the base of the building, the 3D structure requires the building height. The bldg:measuredHeight element, which defines the height of a building, is used from the input model. If not present, it must be provided by the user. The extracted or user-defined height of the building is then added to the bldg:measuredHeight element of LoD1 and LoD2 models. If desired by the user, it is also possible to change/overwrite an existing bldg:measuredHeight element.
For the 3D structure of LoD1 building models, the geometric parameters are modelled as an extrusion of the ground surface using the bldg:measuredHeight. The coordinates defining the extruded geometry of the building (including wall surfaces and flat roof) are added to the bldg:lod1Solid element. Contrary to LoD1, the modelling of LoD2 representation requires the definition of a roof type for the building. This is extracted from bldg:roofType element of the LoD0 model. If not available in LoD0, it can be provided by the user. In case no roof type information is present in the input model nor defined by the user, a building with a flat roof is created. Certain roof types such as dual-pent, gabled, etc., also require the information about roof height (defined as a bldg:roofHeight element in CityGML) from the user. The roof height refers to the minimum eaves height, which is the point where the external walls, if projected upwards, meet the lowest point of the upper surface of the roof [132,133]. If a user-provided roof type consists of a tilt, the orientation of the roof is also required. The roof orientation refers to the heading of the longer side of the roof surface with respect to the building. Currently, the generation of six different types of roofs, namely, monopitch, dual-pent, gabled, hipped, pavilion and flat, is supported in CityLDT. An integration of other roof types is also foreseen in the future. All information about the building geometry is stored within the LoD2 model using the bldg:lod2Solid and bldg:boundedBy elements. Figure 5 gives an overview of upscaling a LoD0 model.

4.2.2. Upscaling LoD1 Models

Similar to upscaling LoD0, the ground surface coordinates of LoD1 models are extracted for upscaling into LoD2. Since there are no specific groundSurface elements in LoD1, the coordinates having the minimum elevation are considered as the ground surface polygon. The height is either taken from the bldg:measuredHeight element or is calculated (if not present) using the building geometry. Furthermore, if the information about the type and height of roof is missing, it must be provided by the user. Otherwise, the building is created with a flat roof. In the case of upscaling from LoD1, the information about the intersection of the building/building part with the terrain (if available) is also included in the desired LoD2 model. Building elements such as bldg:lod2Solid and bldg:boundedBy are used to store most of the geometrical definitions of the building. Figure 6 gives an overview of upscaling an LoD1 model.
Section 4.3 provides a brief overview of the downscaling approach developed in CityLDT.

4.3. Downscaling from Higher to Lower LoD

Downscaling the models of higher LoD is less complex compared to upscaling. Although there exist some similarities in downscaling, the individual transformations from higher to lower detailing are highlighted in Section 4.3.1 and Section 4.3.2.

4.3.1. Downscaling LoD2 Models

Transformation of a LoD2 model to a LoD1 and LoD0 requires the information of ground surface coordinates from the building’s bldg:boundedBy/bldg:GroundSurface element. This ground surface is necessary to define the geographical location of the building. For LoD0, the extracted ground surface coordinates (from the LoD2 model) are added to the bldg:lod0FootPrint element. Whereas for LoD1, these coordinates are added to the bldg:lod1Solid.
As CityGML datasets generally include the bldg:measuredHeight element, if present, it is also preserved in the LoD0 model. In case the height is not included in the original dataset, it is calculated using the building geometry and individual wall surface coordinates. For this, the distance between the lowest and highest vertices (with respect to sea level) is calculated and added to the desired model as a bldg:measuredHeight element. If the height of storeysbelowGround is present in the original LoD2 model, the calculation of measuredHeight does not include the total height of below ground storeys but only the combined height for storeysaboveground is considered. Similarly, if the number of storeysbelowGround is present, the height of individual storeys below ground is calculated using the distance between the lowest and highest vertices and is excluded from total height of the building.
While transforming into LoD1 and LoD0, the geometrical definitions of the LoD2 model are not included. These definitions consist of all surfaces defined in an LoD2 model as bldg:lod2Solid and bldg:boundedBy elements. Moreover, the terrainIntersection element, an important parameter of a building or building part, is mostly present in LoD2 models. For transforming the LoD2 models in LoD0, this attribute is not included; however, for LoD1, it transforms into the LoD1 terrainIntersection element. Figure 7 provides an overview of downscaling the LoD2 model to LoD1 and LoD0.

4.3.2. Downscaling LoD1 Models

For downscaling from LoD1 to LoD0, the ground surface coordinates of the considered building are searched for within the bldg:lod1Solid element. Since there is no designated groundSurface within the LoD1 model, the one with the lowest average elevation is considered. The coordinates are further added to the bldg:lod0FootPrint element. Similar to the downscaling of LoD2 models, the height of the building is either extracted from the bldg:measuredHeight element or is calculated using the building geometry. The terrainIntersection (if available) is not considered in the LoD0 model. Figure 8 gives an overview of downscaling the LoD1 model to LoD0.
For lowering the granularity of data models, no user-based geometric or parametric inputs are required and it can be performed for one or more than one building consecutively. The next section highlights some of the optional user-inputs to enhance the building models.

4.4. Optional Inputs

Along with the granularity transformation, CityLDT also supports some optional user-inputs. This allows users to export data models as per their requirements and applications. The users can export the transformed models by either using attributes of the initially selected input model or by modifying the existing attributes. The following inputs can be provided by the users:
  • Building Function: The building function, referring to the actual usage of the building, plays a significant role in analysing the energetic performance of a building. In a bottom-up archetype-based approach, the building function is important to precisely enrich the building models with statistical data. Based on the usage of the building, the occupancy, heating/cooling schedules, etc., are used for simulations. In CityGML, the building function is stored in the bldg:function element and is generally defined with the help of external definable dictionaries known as code lists [66]. In CityLDT, users can input the building function based on the CityGML standard definitions.
  • Year of Construction: The bldg:yearOfConstruction element includes the first year of a buildings’ construction. Previously CityGML models representing cities included the years of construction within the open datasets; however, this is now changed as per the analysis made by the authors. This parameter is also important for an archetype-based enrichment. Some cities and municipalities also provide the years of construction of different buildings in separate databases [134]. If available, these could be added to the data models using CityLDT.
  • Storeys above/below ground: The storeys above ground refer to the number of above ground floors of a building, whereas the storeys below ground refer to the floors below the ground surface. In CityGML, both of these parameters are stored as individual elements. The storeys above/below ground are important for simulating apartment buildings, multi-family houses and/or terraced houses as they generally consist of more than one floor. This parameter can be added/modified using CityLDT.
The next section highlights the export options within CityLDT.

4.5. Export

CityLDT supports the CityGML versions 1.0 and 2.0 for generating the transformed data models. The 2.0 version of CityGML is an application schema of OGC’s Geographical Markup Language (GML) version 3.1.1 [135]. For storing the transformed building parameters, users can define the desired output directory. If not defined, the path of the selected input directory is considered and a new folder is created and added. In total, there are three export options available to store the transformed models.
  • Only transformed building models: While exporting the transformed building models, the non-transformed buildings are not included in the output. The transformed models are, however, combined and stored as a single dataset for output.
  • Transformed and non-transformed models: For exporting both transformed and non-transformed, new datasets can be generated comprising all building models from the input dataset. This might be important for datasets containing both LoD1 and LoD2 together. If required for simulations, the building models in LoD1 can be transformed and combined with the LoD2 models.
  • Transformed building into individual CityGML datasets: This option enables the users to store the transformed building models as individual datasets containing one model per dataset.
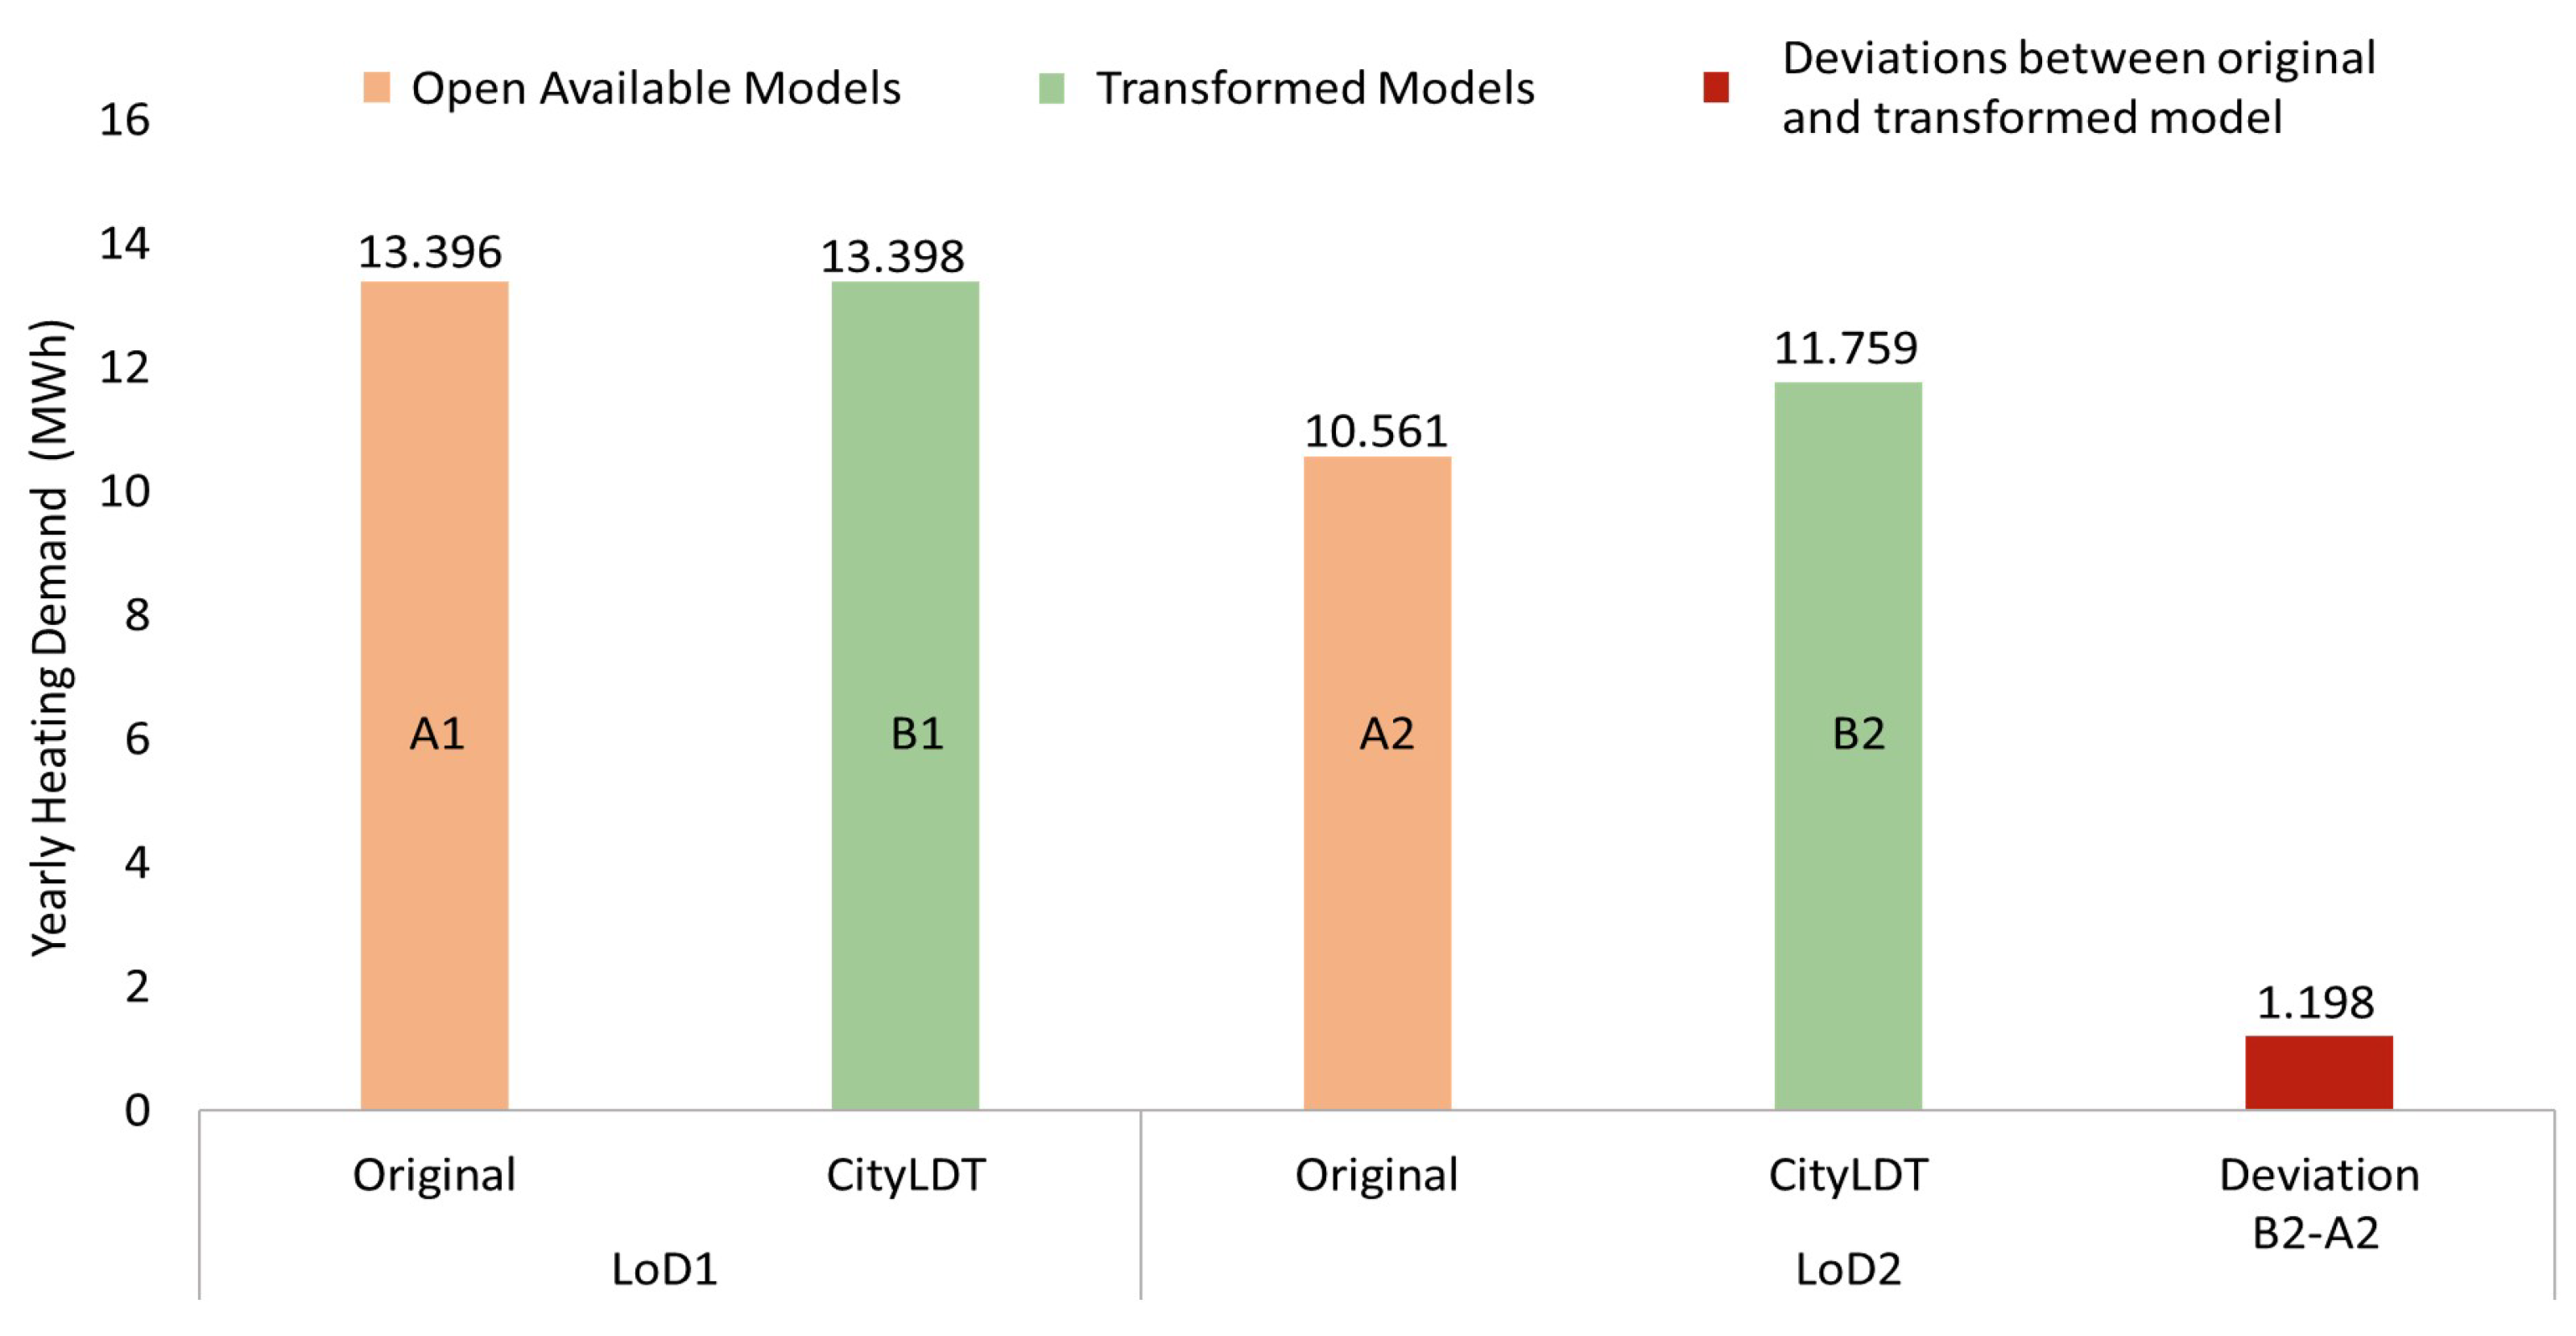
The next chapter highlights three use cases to demonstrate the implementation and application of CityLDT.

5. Tool Validation

The CityGML LoDs are intended to differentiate multi-scale representations of semantic 3D city models [136]. An increase or decrease in the geometric detailing within a model often impacts its required storage space, complexity and usage. For energy performance simulations, models with more geometric detailing, i.e., higher LoDs, are generally considered. As the availability of detailed models is limited, integrating workflows to transform from lower to higher LoD is necessary. Based on the individual applications, the flexibility to transform the LoDs is also important for standardising approaches, workflows and data usage in the field of UBEM. Therefore, to increase the acceptance of CityGML in geo-spatial applications, CityLDT allows users to transform CityGML LoDs in a user-friendly manner. For demonstrating the applicability of the tool, this section highlights three use cases. Section 5.1: Considering an open CityGML dataset for the city of Vienna, Austria. As the open dataset consists of building models in LoD2, the models are transformed to LoD1 and LoD0 and are further compared. Section 5.2: A sample building model, FZK House [129], from the CityGML Wiki [99] is transformed from LoD0 to LoD2. The building model is further simulated using a Modelica-based approach. Section 5.3: A cluster of 500 building models in LoD1 for Hamburg, Germany, is transformed to LoD2 and is simulated using a Modelica-based approach. For both Section 5.2 and Section 5.3, the heating demand simulation is performed using an archetype-based bottom-up UBEM approach, and the results are compared to the simulation results of the (originally available) open data model in a similar granularity/LoD.

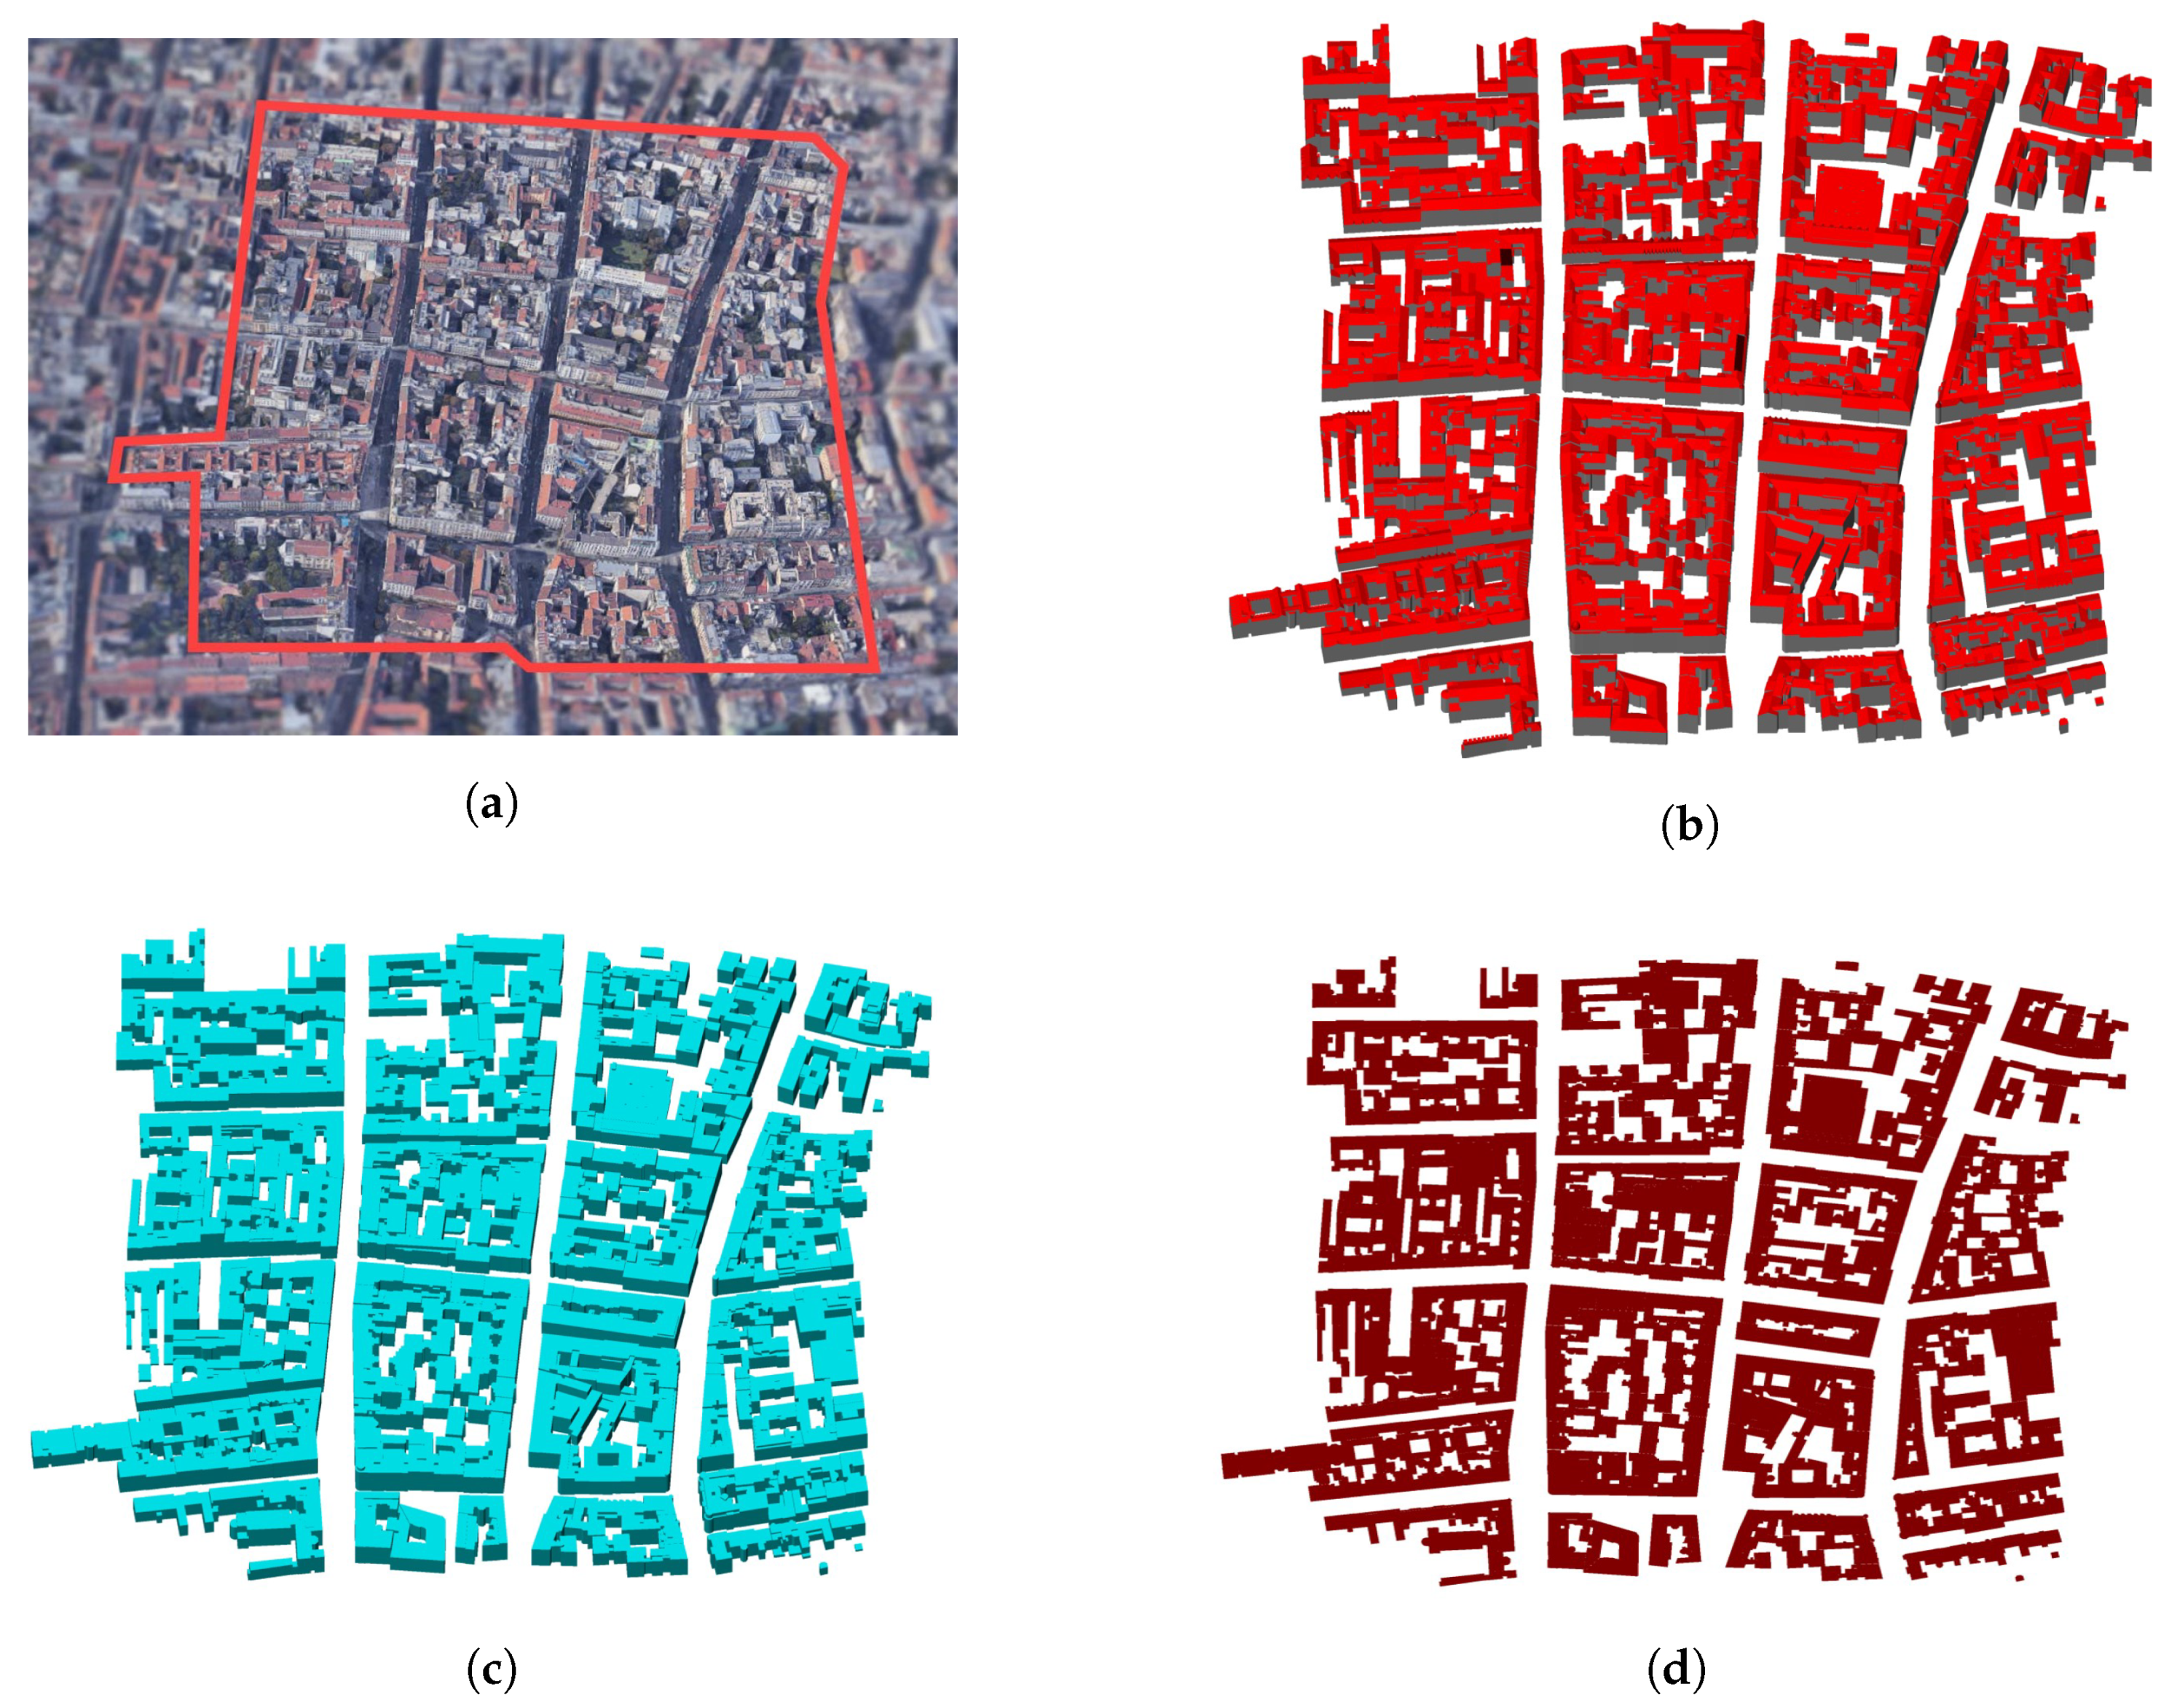
5.1. Open Data Vienna

With a population of nearly 1.8 million inhabitants, Vienna is the capital and largest city of Austria. It is composed of 23 districts [137]. For different districts of Vienna, open CityGML LoD2 building models are available under the Open data Initiative of the Austrian government [138]. Most of the available data are geo-referenced according to the MGI/Austria GK East projection (EPSG code: 31256) [137]. For the CityLDT use case, a small district within the city is considered. As open data mainly consists of LoD2 building models, these are transformed into LoD1 and LoD0, respectively. Figure 9 gives an overview of the district in different LoDs used for the CityLDT transformation.
The district, considered for transformations, consists of 307 building models and 1205 building parts with different roof surfaces such as flat, gabled, and mono-pitch, etc. Some buildings consist of dome-shaped roofs. For such buildings, a flat roof is created instead, as currently, there exists a limitation of modelling buildings with pre-defined roof types in CityLDT. In the future, the algorithms to model other roof types are foreseen. Both the original and transformed models consist of a similar number of buildings and building parts. The transformation of LoD2 models into LoD1 is achieved in 2.97 s and from LoD2 into LoD0 in 2.56 s. The transformations also change the required storage-spaces of the datasets in different LoDs. Initially, the considered LoD2 model has a required storage size of 37 MB. If transformed to LoD1, this decreases to 13 MB and for LoD0 it further decreases to 2 MB. This reduction in the required storage-space can be quite significant while transforming datasets of a complete city for further processing.

5.2. FZK House

For testing the geometrical upscaling within CityLDT, the (previously mentioned) FZK House [129] available in LoD0–4 on the official CityGMLWiki [99], is considered for transformation. In order to validate the geometrical transformations, the open and developed models are simulated to deduce the current heating demand. The LoD0 model of the FZK House is upscaled to a higher granularity of LoD1 and LoD2. To upscale LoD0 into LoD1 (further referred to as B1), the measured height is added to the model. For upscaling to LoD2 (further referred to as B2), parameters such as roof type, roof height and roof heading are added to the input model. Figure 10 gives an overview of the LoD0 model transformed to LoD2 (B2) along with the user-defined inputs.
Using a bottom-up archetype-based approach, the openly available LoD1 (further referred as A1), LoD2 (further referred as A2) and the transformed (B1 and B2) models are enriched with energy specific parameters. For such an archetype-based approach, the authors consider the TABULA Episcope project [140] for European buildings. With archetypes for buildings in 21 countries, a standard parametric definition is made for the residential buildings stock based on the years of construction and building usages. In case of the FZK House, the year of construction is pre-defined as 2015 and the building function refers to a residential building. Building specific information for year 2015 using a Single Family House (SFH) archetype is enriched within the geometric model. The enrichment of the building model is performed using the open source tool TEASER (version 0.6.9) [35]. Using Modelica [141] libraries such as AixLib [90], Buildings [142], BuildingSystems [143] and IDEAS [91], the TEASER tool allows generation of ready-to-simulate Modelica simulation models of a single building or an urban scale. For simulating both the derived and open-access versions of the FZK House, the AixLib (version 0.7.3) and Dymola (version 2018) [144,145] are used for Modelica model generation and simulation, respectively. Hourly weather data for the year 2015 are considered using the Test Reference Year (TRY) for Hamburg [146]. Once simulated, the LoD1 (A1 and B1) and LoD2 (A2 and B2) models show similar heating demand profiles. Although slightly higher in case of B2, the simulation values differ from A2 due to an addition of the roof height as user-based input. The additional roof height increases the building volume. This change in the building volume thereby increases the heating demand requirement of the simulated building. The simulation of all the four building models, on a standard laptop, is achieved in a total of approximately 30 min. Figure 11 provides an overview of the simulation results for the open and transformed models. Since the deviation between the open and upscaled LoD1 models is quite small (<0.02%), it is not represented in Figure 11.

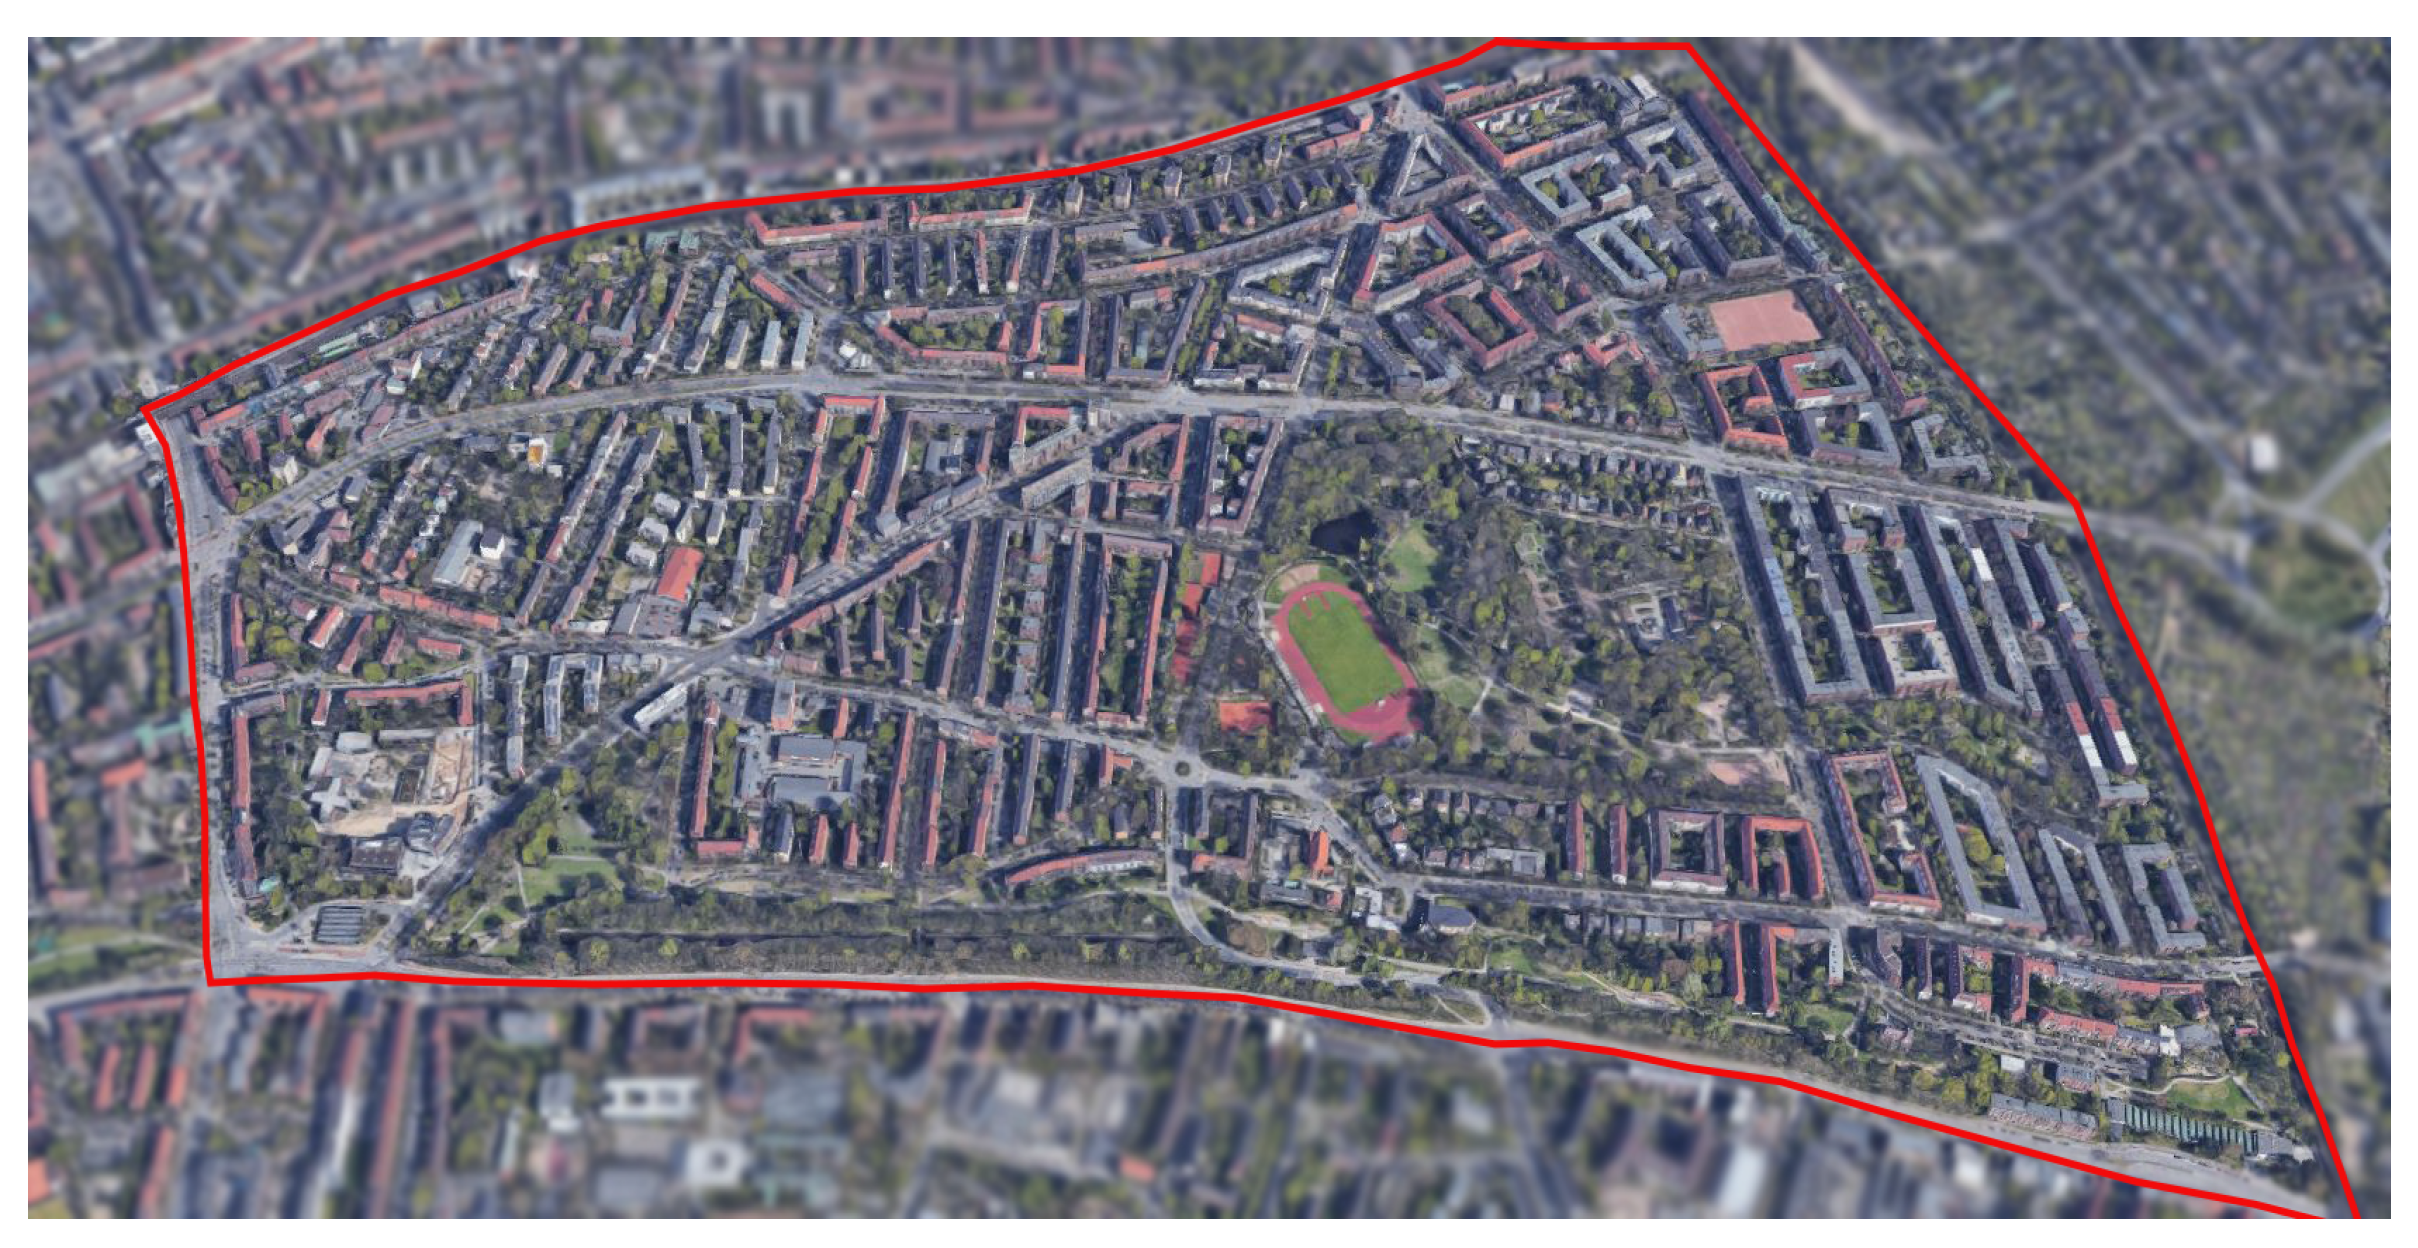
5.3. Open Data Hamburg

A 3D representation of the buildings for Hamburg, Germany, is available as open-source in LoD1 and LoD2 [147]. First published in 2013 and often updated on a yearly basis, the data are made available by the Hamburg State Office for Geoinformation and Surveying [147]. The open 3D models, representing individual buildings, are widely used for urban and spatial planning, architecture and property marketing. Recent studies [77,148,149,150,151] use CityGML LoD1 and LoD2 datasets for urban energy analysis. In this paper, the authors consider a district from the geographical location of Hamburg Hamm. The representation of buildings within the selected district is openly available as LoD1 (further referred as OD1) and LoD2 (further referred as OD2) models. Using CityLDT, the OD1 dataset is upscaled into LoD2 (further referred as TD2) for heating energy demand simulation. The transformation of all LoD1 models into LoD2 is performed in 3.45 s. Figure 12 and Figure 13a,b demonstrate the selected district using Google maps, the open 3D LoD1 models and the upscaled LoD2 models, respectively.
The LoD1 (OD1) and LoD2 (OD2 and TD2) datasets individually consist of 544 building models, categorised as residential buildings. In the open datasets (OD1 and OD2), the buildings are modelled with different roof types; however, while transforming to TD2, only flat roofs are considered in the new model. OD1, OD2 and TD2 further categorise the 544 building with 183 building parts. Both buildings and building parts are considered as individual buildings for simulations. Using TEASER [35] and the Modelica Library AixLib [90], OD1, OD2 and TD2 are transformed into ready-to-simulate Modelica models. The authors use these models to compute the heating demands over a period of one year using the Modelica environment Dymola [144]. In the open datasets, sometimes the orientation of the buildings are modelled incorrectly. For such inconsistencies, workflows including 3Dis CityEditor [152], CityDoctor [153], Galdos CityGML INspector [154] can be used to inspect and correct the building geometries. In this paper, however, such buildings are not considered for computations. Moreover, for some buildings, the polygon normal of the individual surfaces are modelled in the opposite direction whereas, for some, the polygons do not have closed surfaces and correct linear rings. Therefore, for each granularity, the simulations of 491 buildings are carried out amounting to a total of 1473 simulations. On a standard laptop, the generation of Modelica models, enrichment of energy specific data and heating demand simulation of all 1473 buildings is completed in a combined real time of approximately 21 h. For simulations, hourly weather data are considered using the Test Reference Year (TRY) for Hamburg and year 2015 [146]. Figure 14 provides an overview of the dynamic simulation results for OD1, OD2 and TD2.
Figure 15 further compares the heating demands of LoD1 and LoD2 models. For LoD1, only the simulation of open models (OD1) is included as these models are upscaled to LoD2 (TD2). The upscaled TD2 is further compared to openly available LoD2 (OD2) models. For each time-step (in hours), the simulation results (in MWh) for all buildings are aggregated to compute a representative comparison (in MWh) for a period of one year.
The simulation results of open LoD1 models (OD1) are comparatively much higher than the open LoD2 (OD2) and the transformed LoD2 models (TD2). As mentioned previously, some deviations between the LoD 1 and 2 occur due to varying wall/roof ratios. Further information over the factors influencing these deviations is highlighted comprehensively in previous literature [27,48,49,50,51,52,114,155] and is, therefore, deemed outside the scope of this paper. Although there exist slight discrepancies in the computations of LoD2 open and transformed data (both in Section 5.2 and Section 5.3), these could be minimised by a detailed one-to-one parameter mapping for the individual buildings. If modelled similarly, the simulation results, as per the authors would perfectly coincide with each other as the (transformed) buildings would be modelled with similar roof types and building volumes.

6. Discussion

Suitable for representing individual buildings or urban areas, data models such as CityGML can be used in multiple UBEM-related workflows and tool chains [9]. As mentioned previously, a CityGML LoD2 model is commonly considered for urban heating demand simulations, resulting from sufficient detailing and lower complexity in pre- and post-processing of building geometries. Using extensions such as the Energy ADE [74] and Utility Network ADE [75], the CityGML LoD2 models are used for building/district energy as well as network simulations. Different workflows, such as CityATB [156], GML Toolbox [157], CityDoctor [153], or Feature Manipulation Engine (FME) [158] and simulation environments, such as EnergyPlus [92], Modelica [141] with supporting libraries, facilitate the import of CityGML LoD2 models. Whilst gaining popularity in UBEM, the availability of open CityGML data is comparatively low [10,159,160]. If available, CityGML building models often do not contain adequate detailing for heating demand simulations, thereby, restricting its usage. Simulating models with lower geometric detailing impacts the overall computational analysis resulting in imprecise energy demand predictions. As previously highlighted in Section 5.2 and Section 5.3, the data models with less detail cannot be used appropriately for energy performance simulations. When comparing LoD1 and LoD2 models, high deviations are recognised in heating demands. These deviations impact the standardisation of UBEM-based approaches alongside questioning the reliability of developments made within the urban energy community. For a city-wide simulation, deviations within energy predictions might even increase exponentially for a higher number of buildings. Therefore, algorithms facilitating the upscaling or downscaling of the geometric definitions are of high importance and should be available as open-source.
In this paper, the authors highlight the technical implementation and usability of the CityGML LoD Transformation tool. The tool facilitates the transformation of geometric granularities within CityGML datasets. Available in varied LoDs, this transformation, i.e., upscaling or downscaling the granularity, of CityGML data models is crucial. The open-source CityLDT tool currently supports an import and export of LoD0-2. It allows users to upscale 3D CityGML models where less/no detailed data exist and can also be used to downscale models for applications such as flood simulations, geographical mapping or for storage and exchange in databases. The CityLDT is developed using Python programming (version 3.5+), and its interface enables users to import, select, edit and export data models in LoD0-2. The algorithms developed in CityLDT use mathematical equations and geometrical theorems to process the building geometries. With a modular architecture and simplified development tracking, the tool can be integrated and extended for other simulation workflows and tool chains. Due to its open-source nature, published under the MIT license, it is transparent, flexible and versatile. The source-code is available here: https://gitlab.e3d.rwth-aachen.de/e3d-software-tools/cityldt (accessed on 4 December 2021).
The methods and algorithms developed within CityLDT are extensive and rely on multiple mathematical computations. Although the development process is endeavoured to be kept open-source, the authors acknowledge that the tool is being developed primarily using the Python environments “PyCharm 2020.1.1” [161] and “Visual Studio Code” with some extensions [162]. The users, in seldom cases, might encounter minor compilation errors within other environments as different environments use varied internal libraries and solvers. Moreover, the current implementation of CityLDT majorly requires manual inputs from the users of the tool. The high dependency on user-inputs, in some cases, might lead to inappropriate model transformations. In future, the authors would like to further automate the transformation process by incorporating external databases and libraries. For manual inputs, an inclusion of pre-defined checking algorithms to eliminate any unintentional human errors is also foreseen by the authors.
In many UBEM-based studies, the possibility to replicate simulation results and workflows is comparatively low. This is often due to granularities and detailing of the considered input data model. Using CityLDT, the reproducibility of studies can be increased as the tool allows users to develop suitable data models, in its required LoD, for usage into multiple use cases.

7. Conclusions and Future Work

Urban planning and resource management generally require a transformation of the built environment into 3D spatial representations. This transformation facilitates systematic analysis of urban areas for their energetic behaviours [163]. Often clustered together, the 3D representation of individual buildings is commonly developed in the form of data models that differ based on their purposes, stakeholders and application requirements. Requiring a broad availability of data, geometrical data models along with precise energy specific information benefit urban planners, researchers and scientists to simulate and predict energy demands in cities and city-quarters. For urban energy analysis, however, open data models do not generally include the geometric detailing required to represent individual buildings in their respective geographical contexts. As previously mentioned in Section 3, studies such as [115,116,117,118], do allow transforming CityGML building models; however, these are primarily limited to downscaling higher LoD models to lower ones. Moreover, the algorithms are mostly available with a restricted access. Therefore, this paper introduces the open-source CityGML LoD Transformation tool for transforming CityGML data models in LoD0-2. With a user-friendly GUI, CityLDT allows users to transform and edit individual buildings as well as large urban areas. In this paper, the authors downscale LoD2 to LoD1 or LoD 0 and upscale LoD0 or LoD 1 to LoD2. The tool currently supports CityGML version 1.0 and 2.0 in LoD0-2. Furthermore, development of algorithms to process and transform LoD3 and 4 along with the inclusion of CityGML3.0 is foreseen by the authors. Using Modelica, the authors simulate downscaled and upscaled models in order to validate geometries of the transformed models. Once simulated and compared to a model in a similar granularity, the results (largely) coincide for the transformed and openly available data. Although the authors do acknowledge slight deviation in the simulation results, these could be minimised by a one-to-one mapping for building parameters. Moreover, the usage of other simulation workflows and an integration of processing more complex surface geometries is foreseen as future work. With some refinements in the simulation workflow, adjusted net volume calculations, consideration of other roof types and more precise archetype assignment through geometrical analysis of the CityGML building models, neighbouring buildings and net leased area, the authors envision further improvements in the simulation results. In the future, the authors would also like to make use of the tool in different research projects and further investigate the deviation in simulation results as well as individual building geometries. Currently, CityLDT supports the import of existing CityGML datasets; however, in the future, the flexibility to develop new building models in varied LoDs is also planned. Furthermore, the usage of external databases and pre-defined archetypes to generate CityGML models is envisioned by the authors.

Author Contributions

Conceptualisation, A.M., S.R., J.F., C.v.T.; methodology, software development and testing, validation of results, writing—original draft preparation formal analysis, A.M. and S.R.; resources, supervision, writing—review and editing, J.F. and C.v.T. All authors have read and agreed to the published version of the manuscript.

Funding

This research received no external funding.

Institutional Review Board Statement

Not applicable.

Informed Consent Statement

Not applicable.

Data Availability Statement

The open development of CityLDT Tool is available on GitLab: https://gitlab.e3d.rwth-aachen.de/e3d-software-tools/cityldt (accessed on 4 December 2021).

Conflicts of Interest

The authors declare no conflict of interest.

Abbreviations

The following abbreviations are used in this manuscript:
BEPSBuilding Energy Performance Simulation
UBEMUrban Building Energy Modelling
BEMBuilding Energy Modelling
HVACHeating, Ventilation and Air Conditioning
CityGMLCity Geographical Markup Language
gbXMLGreen Building XML
ADEApplication Domain Extension
LoDLevels of Detail
OGCOpen Geospatial Consortium
CityLDTCityGML LoD Transformation
BIMBuilding Information Modelling
GISGeographical Information System
IFCIndustry Foundation Classes
GUIGraphical User Interface
GMLGeographical Markup Language
MBMegabytes

References

  1. United Nations. World Urbanization Prospects 2018; ST/ESA/SER.A/421; United Nations Department for Economic and Social Affairs: New York, NY, USA, 2018; pp. 1–38. [Google Scholar]
  2. United Nations. Transforming Our World: The 2030 Agenda for Sustainable Development; A/RES/70/1; United Nations, Department of Economic and Social Affairs: New York, NY, USA, 2015; pp. 1–35. [Google Scholar]
  3. Shan, S.; Genç, S.Y.; Kamran, H.W.; Dinca, G. Role of green technology innovation and renewable energy in carbon neutrality: A sustainable investigation from Turkey. J. Environ. Manag. 2021, 294, 113004. [Google Scholar] [CrossRef] [PubMed]
  4. Wang, J.A.; Yu, C.; Cao, S.J. Technology pathway of efficient and climate-friendly cooling in buildings: Towards carbon neutrality. Indoor Built Environ. 2021, 30, 1307–1311. [Google Scholar] [CrossRef]
  5. Da Schio, N.; Brekke, K.F. The relative carbon footprint of cities. In Working Paper du Programme Villes et Territoires; SciencesPO, Observatory of European Institutions: Paris, France, 2013; pp. 1–27. [Google Scholar]
  6. Gendron, C. Beyond environmental and ecological economics: Proposal for an economic sociology of the environment. Ecol. Econ. 2014, 105, 240–253. [Google Scholar] [CrossRef]
  7. Bazjanac, V. IFC BIM-Based Methodology for Semi-Automated Building Energy Performance Simulation; Technical Report; Lawrence Berkeley National Lab. (LBNL): Berkeley, CA, USA, 2008. [Google Scholar]
  8. Crawley, D.B.; Hand, J.W.; Kummert, M.; Griffith, B.T. Contrasting the capabilities of building energy performance simulation programs. Build. Environ. 2008, 43, 661–673. [Google Scholar] [CrossRef] [Green Version]
  9. Malhotra, A.; Bischof, J.; Nichersu, A.; Häfele, K.H.; Exenberger, J.; Sood, D.; Allan, J.; Frisch, J.; van Treeck, C.; O’Donnell, J.; et al. Information Modelling for Urban Building Energy Simulation—A Taxonomic Review. Build. Environ. 2021. [Google Scholar] [CrossRef]
  10. Malhotra, A.; Bischof, J.; Allan, J.; O’Donnell, J.; Schwengler, T.; Joachim, B.; Schweiger, G. A Review on Country Specific Data Availability and Acquisition Techniques for City Quarter Information Modelling for Building Energy Analysis. In Proceedings of the BauSIM 2020—8th Conference of IBPSA Germany and Austria, Graz, Austria, 23–25 September 2020; pp. 543–549. [Google Scholar]
  11. Krarti, M. Chapter 9—Analysis of Large-Scale Energy Efficiency Programs. In Optimal Design and Retrofit of Energy Efficient Buildings, Communities, and Urban Centers; Krarti, M., Ed.; Butterworth-Heinemann: Oxford, UK, 2018; pp. 547–610. [Google Scholar] [CrossRef]
  12. Ferrando, M.; Causone, F.; Hong, T.; Chen, Y. Urban building energy modeling (UBEM) tools: A state-of-the-art review of bottom-up physics-based approaches. Sustain. Cities Soc. 2020, 62, 102408. [Google Scholar] [CrossRef]
  13. Chen, Y.; Hong, T.; Luo, X.; Hooper, B. Development of City Buildings Dataset for Urban Building Energy Modeling. Energy Build. 2018, 183, 252–265. [Google Scholar] [CrossRef] [Green Version]
  14. Hong, T.; Chen, Y.; Luo, X.; Luo, N.; Lee, S.H. Ten questions on urban building energy modeling. Build. Environ. 2020, 168, 106508. [Google Scholar] [CrossRef] [Green Version]
  15. Liu, X.; Wang, X.; Wright, G.; Cheng, J.C.P.; Li, X.; Liu, R. A State-of-the-Art Review on the Integration of Building Information Modeling (BIM) and Geographic Information System (GIS). ISPRS Int. J. Geoinf. 2017, 6, 53. [Google Scholar] [CrossRef] [Green Version]
  16. Kolbe, T.H.; Gröger, G.; Plümer, L. CityGML: Interoperable Access to 3D City Models. In Geo-Information for Disaster Management; Springer: Berlin/Heidelberg, Germany, 2005; pp. 883–899. [Google Scholar]
  17. Li, X.; Wen, J. Review of building energy modeling for control and operation. Renew. Sustain. Energ. Rev. 2014, 37, 517–537. [Google Scholar] [CrossRef]
  18. Foucquier, A.; Robert, S.; Suard, F.; Stéphan, L.; Jay, A. State of the art in building modelling and energy performances prediction: A review. Renew. Sustain. Energ. Rev. 2013, 23, 272–288. [Google Scholar] [CrossRef] [Green Version]
  19. Ali, U.; Shamsi, M.H.; Hoare, C.; Mangina, E.; O’Donnell, J. Review of urban building energy modeling (UBEM) approaches, methods and tools using qualitative and quantitative analysis. Energy Build. 2021, 246, 111073. [Google Scholar] [CrossRef]
  20. Costanzo, V.; Evola, G.; Marletta, L. Urban Heat Stress and Mitigation Solutions: An Engineering Perspective; Routledge: London, UK, 2021. [Google Scholar]
  21. Cerezo, C.; Sokol, J.; AlKhaled, S.; Reinhart, C.; Al-Mumin, A.; Hajiah, A. Comparison of four building archetype characterization methods in urban building energy modeling (UBEM): A residential case study in Kuwait City. Energy Build. 2017, 154, 321–334. [Google Scholar] [CrossRef]
  22. Buckley, N.; Mills, G.; Reinhart, C.; Berzolla, Z.M. Using urban building energy modelling (UBEM) to support the new European Union’s Green Deal: Case study of Dublin Ireland. Energy Build. 2021, 247, 111115. [Google Scholar] [CrossRef]
  23. Swan, L.G.; Ugursal, V.I. Modeling of end-use energy consumption in the residential sector: A review of modeling techniques. Renew. Sustain. Energy Rev. 2009, 13, 1819–1835. [Google Scholar] [CrossRef]
  24. Johari, F. Urban Building Energy Modeling: A Systematic Evaluation of Modeling and Simulation Approaches. Ph.D. Thesis, Uppsala University, Uppsala, Sweden, 2021. [Google Scholar]
  25. Kavgic, M.; Mavrogianni, A.; Mumovic, D.; Summerfield, A.; Stevanovic, Z.; Djurovic-Petrovic, M. A review of bottom-up building stock models for energy consumption in the residential sector. Build. Environ. 2010, 45, 1683–1697. [Google Scholar] [CrossRef]
  26. Hedegaard, R.E.; Kristensen, M.H.; Pedersen, T.H.; Brun, A.; Petersen, S. Bottom-up modelling methodology for urban-scale analysis of residential space heating demand response. Appl. Energy 2019, 242, 181–204. [Google Scholar] [CrossRef]
  27. Faure, X.; Johansson, T.; Pasichnyi, O. Impacts of the level of details, shadowing and thermal zoning on urban building energy modelling (UBEM) on a district scale. In Proceedings of the 20th European Roundtable on Sustainable Consumption and Production, Graz, Austria, 8–10 September 2021; pp. 133–152. [Google Scholar] [CrossRef]
  28. Reinhart, C.F.; Cerezo Davila, C. Urban building energy modeling—A review of a nascent field. Build. Environ. 2016, 97, 196–202. [Google Scholar] [CrossRef] [Green Version]
  29. Cerezo Davila, C.; Reinhart, C.F.; Bemis, J.L. Modeling Boston: A workflow for the efficient generation and maintenance of urban building energy models from existing geospatial datasets. Energy J. 2016, 117, 237–250. [Google Scholar] [CrossRef]
  30. Langevin, J.; Reyna, J.L.; Ebrahimigharehbaghi, S.; Sandberg, N.; Fennell, P.; Nägeli, C.; Laverge, J.; Delghust, M.; Mata, É.; Van Hove, M.; et al. Developing a common approach for classifying building stock energy models. Renew. Sustain. Energ. Rev. 2020, 133, 110276. [Google Scholar] [CrossRef]
  31. Romano, P.; Prataviera, E.; Carnieletto, L.; Vivian, J.; Zinzi, M.; Zarrella, A. Assessment of the Urban Heat Island Impact on Building Energy Performance at District Level with the EUReCA Platform. Clim. J. 2021, 9, 48. [Google Scholar] [CrossRef]
  32. Li, W.; Zhou, Y.; Cetin, K.S.; Yu, S.; Wang, Y.; Liang, B. Developing a landscape of urban building energy use with improved spatiotemporal representations in a cool-humid climate. Build. Environ. 2018, 136, 107–117. [Google Scholar] [CrossRef]
  33. Gatt, D.; Yousif, C.; Cellura, M.; Camilleri, L.; Guarino, F. Assessment of building energy modelling studies to meet the requirements of the new Energy Performance of Buildings Directive. Renew. Sustain. Energ. Rev. 2020, 127, 109886. [Google Scholar] [CrossRef]
  34. Nouvel, R.; Brassel, K.H.; Bruse, M.; Duminil, E.; Coors, V.; Eicker, U.; Robinson, D. SimStadt, a new workflow-driven urban energy simulation platform for CityGML city models. In Proceedings of the International Conference CISBAT 2015 Future Buildings and Districts Sustainability from Nano to Urban Scale, LESO-PB, EPFL, Lausanne, Switzerland, 9–11 September 2015; pp. 889–894. [Google Scholar]
  35. Remmen, P.; Lauster, M.; Mans, M.; Fuchs, M.; Osterhage, T.; Müller, D. TEASER: An open tool for urban energy modelling of building stocks. J. Build. Perform. Simul. 2016, 11, 84–98. [Google Scholar] [CrossRef]
  36. Sokol, J.; Davila, C.C.; Reinhart, C.F. Validation of a Bayesian-based method for defining residential archetypes in urban building energy models. Energy Build. 2017, 134, 11–24. [Google Scholar] [CrossRef]
  37. Pasichnyi, O.; Wallin, J.; Kordas, O. Data-driven building archetypes for urban building energy modelling. Energy J. 2019, 181, 360–377. [Google Scholar] [CrossRef]
  38. Ali, U.; Shamsi, M.H.; Hoare, C.; Mangina, E.; O’Donnell, J. A data-driven approach for multi-scale building archetypes development. Energy Build. 2019, 202, 109364. [Google Scholar] [CrossRef]
  39. Mohammadiziazi, R.; Copeland, S.; Bilec, M.M. Urban building energy model: Database development, validation, and application for commercial building stock. Energy Build. 2021, 248, 111175. [Google Scholar] [CrossRef]
  40. Ballarini, I.; Corgnati, S.P.; Corrado, V. Use of reference buildings to assess the energy saving potentials of the residential building stock: The experience of TABULA project. Energy Policy 2014, 68, 273–284. [Google Scholar] [CrossRef]
  41. Hao, S.; Hong, T. The Application of Urban Building Energy Modeling in Urban Planning. In Rethinking Sustainability towards a Regenerative Economy; Springer: Cham, Switzerland, 2021; pp. 45–63. [Google Scholar]
  42. Loga, T.; Stein, B.; Diefenbach, N. TABULA building typologies in 20 European countries—Making energy related features of residential building stocks comparable. Energy Build. 2016, 132, 4–12. [Google Scholar] [CrossRef]
  43. Shimoda, Y.; Fujii, T.; Morikawa, T.; Mizuno, M. Residential end-use energy simulation at city scale. Build. Environ. 2004, 39, 959–967. [Google Scholar] [CrossRef]
  44. Heiple, S.; Sailor, D.J. Using building energy simulation and geospatial modeling techniques to determine high resolution building sector energy consumption profiles. Energy Build. 2008, 40, 1426–1436. [Google Scholar] [CrossRef] [Green Version]
  45. Marston, A.; Garforth, P.; Fleichammer, G.; Baumann, O. Urban Scale Modelling–How Generalised Models Can Help Communities Halve Their Energy Use in 30 Years. In Proceedings of the 2014 ASHRAE/IBPSA-USA Building Simulation Conference, Atlanta, GA, USA, 10–12 September 2014. [Google Scholar]
  46. Mata, É.; Kalagasidis, A.S.; Johnsson, F. Building-stock aggregation through archetype buildings: France, Germany, Spain and the UK. Build. Environ. 2014, 81, 270–282. [Google Scholar] [CrossRef] [Green Version]
  47. Famuyibo, A.A.; Duffy, A.; Strachan, P. Developing archetypes for domestic dwellings—An Irish case study. Energy Build. 2012, 50, 150–157. [Google Scholar] [CrossRef] [Green Version]
  48. De Jaeger, I.; Reynders, G.; Saelens, D. Quantifying Uncertainty Propagation For The District Energy Demand Using Realistic Variations On Input Data. In Proceedings of the Building Simulation 2019: 16th Conference of IBPSA, Rome, Italy, 2–4 September 2019; pp. 3636–3643. [Google Scholar] [CrossRef]
  49. Malhotra, A.; Shamovich, M.; Frisch, J.; van Treeck, C. Parametric Study of the Different Level of Detail of CityGML and Energy-ADE Information for Energy Performance Simulations. In Proceedings of the IBPSA Building Simulation 2019, Rome, Italy, 2–4 September 2019; pp. 3429–3436. [Google Scholar] [CrossRef]
  50. De Jaeger, I.; Reynders, G.; Callebaut, C.; Saelens, D. A building clustering approach for urban energy simulations. Energy Build. 2020, 208, 109671. [Google Scholar] [CrossRef]
  51. Jaeger, I.; Reynders, G.; Ma, Y.; Saelens, D. Impact of building geometry description within district energy simulations. Energy J. 2018, 158, 1060–1069. [Google Scholar] [CrossRef]
  52. Monien, D.; Strzalka, A.; Koukofikis, A.; Coors, V.; Eicker, U. Comparison of building modelling assumptions and methods for urban scale heat demand forecasting. Future Cities Environ. 2017, 3, 2. [Google Scholar] [CrossRef]
  53. Risch, S.; Remmen, P.; Müller, D. Influence of data acquisition on the Bayesian calibration of urban building energy models. Energy Build. 2021, 230, 110512. [Google Scholar] [CrossRef]
  54. Zhang, Y.; Bai, X.; Mills, F.P.; Pezzey, J.C. Rethinking the role of occupant behavior in building energy performance: A review. Energy Build. 2018, 172, 279–294. [Google Scholar] [CrossRef]
  55. Hong, T.; Yan, D.; D’Oca, S.; Chen, C.f. Ten questions concerning occupant behavior in buildings: The big picture. Build. Environ. 2017, 114, 518–530. [Google Scholar] [CrossRef] [Green Version]
  56. Ding, Y.; Han, S.; Tian, Z.; Yao, J.; Chen, W.; Zhang, Q. Review on occupancy detection and prediction in building simulation. In Building Simulation; Springer: Berlin/Heidelberg, Germany, 2021; pp. 1–24. [Google Scholar]
  57. Hong, T.; Luo, X. Modeling building energy performance in urban context. In Proceedings of the 2018 Building Performance Analysis Conference and SimBuild Co-Organized by ASHRAE and IBPSA-USA, Chicago, IL, USA, 26–28 September 2018; pp. 26–28. [Google Scholar]
  58. Quan, S.J.; Li, Q.; Augenbroe, G.; Brown, J.; Yang, P.P.J. Urban data and building energy modeling: A GIS-based urban building energy modeling system using the urban-EPC engine. In Planning Support Systems and Smart Cities; Springer: Berlin/Heidelberg, Germany, 2015; pp. 447–469. [Google Scholar]
  59. Quan, S.J.; Li, C. Urban form and building energy use: A systematic review of measures, mechanisms, and methodologies. Renew. Sustain. Energ. Rev. 2021, 139, 110662. [Google Scholar] [CrossRef]
  60. Trepci, E.; Maghelal, P.; Azar, E. Effect of densification and compactness on urban building energy consumption: Case of a Transit-Oriented Development in Dallas, TX. Sustain. Cities Soc. 2020, 56, 101987. [Google Scholar] [CrossRef]
  61. Buckley, N.; Mills, G.; Letellier-Duchesne, S.; Benis, K. Designing an Energy-Resilient Neighbourhood Using an Urban Building Energy Model. Energies 2021, 14, 4445. [Google Scholar] [CrossRef]
  62. Lepore, M. Urban microclimate parameters for buildings energy strategies. VITRUVIO-Int. J. Archit. Technol. Sustain. 2016, 1, 1–10. [Google Scholar] [CrossRef]
  63. Semmo, A.; Trapp, M.; Kyprianidis, J.E.; Döllner, J. Interactive visualization of generalized virtual 3D city models using level-of-abstraction transitions. In Computer Graphics Forum; Wiley Online Library: Hoboken, NJ, USA, 2012; Volume 31, pp. 885–894. [Google Scholar]
  64. Gröger, G.; Plümer, L. CityGML—Interoperable semantic 3D city models. ISPRS J. Photogram. Remote Sens. 2012, 71, 12–33. [Google Scholar] [CrossRef]
  65. Würstle, P.; Santhanavanich, T.; Padsala, R.; Coors, V. The Conception of an Urban Energy Dashboard using 3D City Models. In Proceedings of the Eleventh ACM International Conference on Future Energy Systems, Melbourne, Australia, 22–26 June 2020; pp. 523–527. [Google Scholar]
  66. Gröger, G.; Kolbe, T.H.; Nagel, C.; Häfele, K.H. OGC City Geography Markup Language (CityGML) Encoding Standard, Version: 2.0.0; OGC 12-019, Technical Report; Open Geospatial Consortium: Rockville, MD, USA, 2012. [Google Scholar]
  67. Häfele, K.H.; Benner, J. STREAMER Deliverable 6.5: Advance Mapping Structures and Standards; Technical Report; Streamer Consortium, 2015; Available online: https://www.streamer-project.eu/Downloads/D6.5.pdf (accessed on 4 December 2021).
  68. Kutzner, T.; Chaturvedi, K.; Kolbe, T.H. CityGML 3.0: New functions open up new applications. PFG J. Photogramm. Remote Sens. Geoinf. Sci. 2020, 88, 43–61. [Google Scholar] [CrossRef] [Green Version]
  69. Lu, L.; Becker, T.; Löwner, M.O. 3D complete traffic noise analysis based on CityGML. In Advances in 3D Geoinformation; Springer: Berlin/Heidelberg, Germany, 2017; pp. 265–283. [Google Scholar]
  70. Tymkow, P.; Karpina, M.; Borkowski, A. 3D GIS for flood modelling in river valleys. Int. Arch. Photogramm. Remote Sens. 2016, 41, 175–178. [Google Scholar] [CrossRef] [Green Version]
  71. Saran, S.; Wate, P.; Srivastav, S.; Krishna Murthy, Y. CityGML at semantic level for urban energy conservation strategies. Ann. GIS 2015, 21, 27–41. [Google Scholar] [CrossRef]
  72. Biljecki, F.; Kumar, K.; Nagel, C. CityGML Application Domain Extension (ADE): Overview of developments. Open Geospat. Data Softw. Stand. 2018, 3, 15. [Google Scholar] [CrossRef] [Green Version]
  73. Malhotra, A.; Frisch, J.; van Treeck, C. Technical Report: Literature Review Concerning IFC, gbXML and CityGML Data Models for Energy Performance Simulation; RWTH Aachen University: Aachen, Germany, 2019. [Google Scholar]
  74. Agugiaro, G.; Benner, J.; Cipriano, P.; Nouvel, R. The Energy Application Domain Extension for CityGML: Enhancing interoperability for urban energy simulations. Open Geospat. Data Softw. Stand. 2018, 3, 2. [Google Scholar] [CrossRef]
  75. Kutzner, T.; Kolbe, T.H. Extending Semantic 3D City Models by Supply and Disposal Networks for Analysing the Urban Supply Situation. Lösungen für eine Welt im Wandel, Dreiländertagung der SGPF, DGPF und OVG, 36. Wissenschaftlich-Technische Jahrestagung der DGPF; Deutsche Gesellschaft für Photogrammetrie, Fernerkundung und Geoinformation e.V.: Bern, Switzerland, 2016. [Google Scholar]
  76. Allacker, K.; Castellani, V.; Baldinelli, G.; Bianchi, F.; Baldassarri, C.; Sala, S. Energy simulation and LCA for macro-scale analysis of eco-innovations in the housing stock. Int. J. Life Cycle Assess. 2019, 24, 989–1008. [Google Scholar] [CrossRef] [Green Version]
  77. Munoz, E.; Dochev, I.; Seller, H.; Peters, I. Constructing a Synthetic City for Estimating Spatially Disaggregated Heat Demand. Int. J. Microsimul. 2016, 9, 66–88. [Google Scholar]
  78. Ballarini, I.; Corrado, V. A new methodology for assessing the energy consumption of building stocks. Energies 2017, 10, 1102. [Google Scholar] [CrossRef] [Green Version]
  79. Frayssinet, L.; Berthou, T.; Duplessis, B.; Kuznik, F.; Hubert, J.-L.; Roux, J.-J.; Claude, U.; Lyon, B.; Umr, C.; Orvanne, L. Incertitude de s imulation à l’échelle du quartier: Comparaison de deux modèles et analyse de sensibilité. In Proceedings of the Conférence IBPSA France, Bordeaux, Italy, 15–16 May 2018; pp. 1–8. [Google Scholar]
  80. Zheng, Z.; Chen, J.; Luo, X. Parallel computational building-chain model for rapid urban-scale energy simulation. Energy Build. 2019, 201, 37–52. [Google Scholar] [CrossRef]
  81. Wang, H.; Pan, Y.; Luo, X. Integration of BIM and GIS in sustainable built environment: A review and bibliometric analysis. Autom. Constr. 2019, 103, 41–52. [Google Scholar] [CrossRef]
  82. Rossknecht, M.; Airaksinen, E. Concept and Evaluation of Heating Demand Prediction Based on 3D City Models and the CityGML Energy ADE—Case Study Helsinki. ISPRS Int. J. Geoinf. 2020, 9, 602. [Google Scholar] [CrossRef]
  83. Zirak, M.; Royapoor, M.; Gilbert, T. Cross-Platform Energy Modeling for Scalable Urban Energy Simulation: A Case-Study. In Proceedings of the International Conference on Innovative Applied Energy (IAPE 2019), Oxford, UK, 14–15 March 2019; pp. 2–7. [Google Scholar]
  84. Chatzinikolaou, E.; Pispidikis, I.; Dimopoulou, E. A Semantically Enriched and Web-Based 3D Energy Model Visualization and Retrieval for Smart Building Implementation Using CityGML and Dynamizer ADE. ISPRS Ann. Photogramm. Remote Sens. Spat. Inf. Sci. 2020, VI-4/W1-20, 53–60. [Google Scholar] [CrossRef]
  85. Krüger, A.; Kolbe, T.H. Building analysis for urban energy planning using key indicators on virtual 3D city models—The energy atlas of Berlin. Int. Arch. Photogramm. Remote Sens. 2012, XXXIX-B2, 145–150. [Google Scholar] [CrossRef] [Green Version]
  86. Nouvel, R.; Mastrucci, A.; Leopold, U.; Baume, O.; Coors, V.; Eicker, U. Combining GIS-based statistical and engineering urban heat consumption models: Towards a new framework for multi-scale policy support. Energy Build. 2015, 107, 204–212. [Google Scholar] [CrossRef]
  87. Agugiaro, G. Energy planning tools and CityGML-based 3D virtual city models: Experiences from Trento (Italy). Appl. Geomat. 2016, 8, 41–56. [Google Scholar] [CrossRef]
  88. Wetter, M.; van Treeck, C.; Hensen, J. New Generation Computational Tools for Building and Community Energy Systems. IEA EBC Annex 60. 2013. Available online: https://scholar.google.com/scholar?hl=en&as_sdt=0%2C5&q=New+generation+computational+tools+for+building+and+community+energy+++systems&btnG= (accessed on 4 December 2021).
  89. Wetter, M.; Fuchs, M.; Grozman, P.; Helsen, L.; Jorissen, F.; Lauster, M.; Müller, D.; Nytsch-geusen, C.; Picard, D.; Sahlin, P.; et al. IEA EBC Annex 60 Modelica Library—An international collaboration to develop a free open-source model library for buildings and community energy systems. In Proceedings of the BS2015, Hyderabad, India, 7–9 December 2015; pp. 395–402. [Google Scholar]
  90. Müller, D.; Lauster, M.; Constantin, A.; Fuchs, M.; Remmen, P. AixLib—An open-source Modelica library within the IEA-EBC Annex 60 framework. In Proceedings of the Central European Symposium on Building Physics 2016 and BauSIM 2016, Dresden, Germany, 14–16 September 2016; pp. 3–11. [Google Scholar]
  91. Jorissen, F.; Reynders, G.; Baetens, R.; Picard, D.; Saelens, D.; Helsen, L. Implementation and Verification of the IDEAS Building Energy Simulation Library. J. Build. Perform. Simul. 2018, 11, 669–688. [Google Scholar] [CrossRef]
  92. Crawley, D.B.; Lawrie, L.K.; Winkelmann, F.C.; Buhl, W.F.; Huang, Y.; Pedersen, C.O.; Strand, R.K.; Liesen, R.J.; Fisher, D.E.; Witte, M.J.; et al. EnergyPlus: Creating a new-generation building energy simulation program. Energy Build. 2001, 33, 319–331. [Google Scholar] [CrossRef]
  93. Hong, T.; Piette, M.A.; Chen, Y.; Lee, S.H.; Taylor-Lange, S.C.; Zhang, R.; Sun, K.; Price, P. Commercial Building Energy Saver: An energy retrofit analysis toolkit. Appl. Energy 2015, 159, 298–309. [Google Scholar] [CrossRef] [Green Version]
  94. Carnieletto, L.; Ferrando, M.; Teso, L.; Sun, K.; Zhang, W.; Causone, F.; Romagnoni, P.; Zarrella, A.; Hong, T. Italian prototype building models for urban scale building performance simulation. Build. Environ. 2021, 192, 107590. [Google Scholar] [CrossRef]
  95. Rosser, J.F.; Long, G.; Zakhary, S.; Boyd, D.S.; Mao, Y.; Robinson, D. Modelling urban housing stocks for building energy simulation using CityGML EnergyADE. ISPRS Int. J. Geoinf. 2019, 8, 163. [Google Scholar] [CrossRef] [Green Version]
  96. Robinson, D.; Stone, A. Solar radiation modelling in the urban context. J. Sol. Energy 2004, 77, 295–309. [Google Scholar] [CrossRef]
  97. Keirstead, J.; Jennings, M.; Sivakumar, A. A review of urban energy system models: Approaches, challenges and opportunities. Renew. Sustain. Energ. Rev. 2012, 16, 3847–3866. [Google Scholar] [CrossRef] [Green Version]
  98. Braun, R.; Weiler, V.; Zirak, M.; Dobisch, L.; Coors, V.; Eicker, U. Using 3D CityGML models for building simulation applications at district level. In Proceedings of the 2018 IEEE International Conference on Engineering, Technology and Innovation (ICE/ITMC), Stuttgart, Germany, 17–20 June 2018; IEEE: Piscataway, NJ, USA, 2018; pp. 1–8. [Google Scholar]
  99. SIG3D. CityGML Wiki: Open Data Initiatives. 2019. Available online: https://www.citygmlwiki.org/index.php/Open_Data_Initiatives (accessed on 11 November 2021).
  100. Federal Office of Topography (Swisstopo). swissBUILDINGS3D 2.0; Federal Office of Topography: Wabern, Germany, 2021. [Google Scholar]
  101. Technical University of Munich. 2015. Available online: https://www.asg.ed.tum.de/gis/offene-daten/ (accessed on 8 November 2021).
  102. New York City Department of Information Technology & Telecommunications. NYC 3-D Building Model; City of New York: New York, NY, USA, 2016. [Google Scholar]
  103. BuildZero. Open City Model. 2019. Available online: https://buildzeroapp.com/ (accessed on 10 November 2021).
  104. Towards Data Science, J.T.S. Open-Source CityGML 3D Semantical Building Models in 2020. 2020. Available online: https://towardsdatascience.com/tagged/citygml (accessed on 10 November 2021).
  105. Wysocki, O. Awesome CityGML. 2021. Available online: https://github.com/OloOcki/awesome-citygml (accessed on 8 November 2021).
  106. Geoportal: Republic of Estonia (Land Board). 3D Data. 2021. Available online: https://geoportaal.maaamet.ee/eng/ (accessed on 9 November 2021).
  107. Ledoux, H.; Biljecki, F.; Dukai, B.; Kumar, K.; Peters, R.; Stoter, J.; Commandeur, T. 3dfier: Automatic reconstruction of 3D city models. J. Open Source Softw. 2021, 6, 2866. [Google Scholar] [CrossRef]
  108. Fissore, F.; Pirotti, F. Migration of digital cartography to CityGML; A web-based tool for supporting simple ETL procedures. Int. Arch. Photogramm. Remote Sens. 2018, 42, 193–200. [Google Scholar] [CrossRef] [Green Version]
  109. Konde, A.; Tauscher, H.; Biljecki, F.; Crawford, J. Floor plans in CityGML. ISPRS Ann. Photogramm. Remote Sens. Spat. Inf. Sci. 2018, 4, 25–32. [Google Scholar] [CrossRef] [Green Version]
  110. Isikdag, U.; Zlatanova, S. Towards defining a framework for automatic generation of buildings in CityGML using building Information Models. In 3D Geo-Information Sciences; Springer: Berlin/Heidelberg, Germany, 2009; pp. 79–96. [Google Scholar]
  111. Pepe, M.; Costantino, D.; Alfio, V.S.; Angelini, M.G.; Restuccia Garofalo, A. A CityGML Multiscale Approach for the Conservation and Management of Cultural Heritage: The Case Study of the Old Town of Taranto (Italy). ISPRS Int. J. Geoinf. 2020, 9, 449. [Google Scholar] [CrossRef]
  112. Aditya, T.; Laksono, D. LOD 1: 3D CityModel for Implementing SmartCity Concept. In Proceedings of the 2017 International Conference on Information Technology, Singapore, 27–29 December 2017; pp. 136–141. [Google Scholar]
  113. Chen, S.; Zhang, W.; Wong, N.H.; Ignatius, M. Combining CityGML files and data-driven models for microclimate simulations in a tropical city. Build. Environ. 2020, 185, 107314. [Google Scholar] [CrossRef]
  114. Geiger, A.; Nichersu, A.; Hagenmeyer, V. Sensitivity of input data in building heating energy demand simulation. In Proceedings of the BauSIM 2020, Graz, Austria, 23–25 September 2020. [Google Scholar]
  115. Fan, H.; Meng, L. Automatic derivation of different levels of detail for 3D buildings modeled by CityGML. In Proceedings of the 24th International Cartography Conference, Santiago, Chile, 15–21 November 2009; pp. 15–21. [Google Scholar]
  116. Deng, Y.; Cheng, J.C. Automatic transformation of different levels of detail in 3D GIS city models in CityGML. In Architecture and Design: Breakthroughs in Research and Practice; IGI Global: Hershey, PA, USA, 2019; pp. 1350–1370. [Google Scholar]
  117. Li, S.; Li, W.; Lin, Z.; Yi, S. Method for 3D City Building Continuous Transformation Based on an Improved LOD Topological Data Structure. ISPRS Int. J. Geoinf. 2019, 8, 504. [Google Scholar] [CrossRef] [Green Version]
  118. Sun, Q.; Zhou, X.; Hou, D. A Simplified CityGML-Based 3D Indoor Space Model for Indoor Applications. Appl. Sci. 2020, 10, 7218. [Google Scholar] [CrossRef]
  119. Clarivate Analytics. Web of Science. 2017. Available online: https://clarivate.com/webofsciencegroup/solutions/web-of-science/URL (accessed on 4 November 2021).
  120. Nouvel, R.; Zirak, M.; Dastageeri, H.; Coors, V.; Eicker, U. Urban energy analysis based on 3D city model for national scale applications. In Proceedings of the IBPSA Germany Conference, Aachen, Germany, 22–24 September 2014; Volume 8. [Google Scholar]
  121. Biljecki, F.; Lim, J.; Crawford, J.; Moraru, D.; Tauscher, H.; Konde, A.; Adouane, K.; Lawrence, S.; Janssen, P.; Stouffs, R. Extending CityGML for IFC-sourced 3D city models. Autom. Constr. 2021, 121, 103440. [Google Scholar] [CrossRef]
  122. Zadeh, P.A.; Wei, L.; Dee, A.; Pottinger, R.; Staub-French, S. BIM-CityGML data integration for modern urban challenges. J. Inf. Technol. Constr. 2019, 24, 318–340. [Google Scholar]
  123. Jusuf, S.K.; Mousseau, B.; Godfroid, G.; Soh, J.H.V. Path to an integrated modelling between IFC and CityGML for neighborhood scale modelling. Int. J. Urban Sci. 2017, 1, 25. [Google Scholar] [CrossRef] [Green Version]
  124. Colucci, E.; De Ruvo, V.; Lingua, A.; Matrone, F.; Rizzo, G. HBIM-GIS integration: From IFC to cityGML standard for damaged cultural heritage in a multiscale 3D GIS. Appl. Sci. 2020, 10, 1356. [Google Scholar] [CrossRef] [Green Version]
  125. Tauscher, H.; Lim, J.; Stouffs, R. A modular graph transformation rule set for IFC-to-CityGML conversion. Trans. GIS 2021, 25, 261–290. [Google Scholar] [CrossRef]
  126. Adouane, K.; Stouffs, R.; Janssen, P.; Domer, B. A model-based approach to convert a building BIM-IFC data set model into CityGML. J. Spat. Sci. 2020, 65, 257–280. [Google Scholar] [CrossRef]
  127. Zhu, J.; Wu, P.; Chen, M.; Kim, M.J.; Wang, X.; Fang, T. Automatically processing IFC clipping representation for BIM and GIS integration at the process level. Appl. Sci. 2020, 10, 2009. [Google Scholar] [CrossRef] [Green Version]
  128. Donkers, S. Automatic Generation of CityGML LoD3 Building Models from IFC Models. Ph.D. Thesis, Delft University of Technology, Delft, The Netherlands, 2013. [Google Scholar]
  129. Karlsruhe Institute of Technology (KIT), Institute for Applied Computer Science (IAI). CityGML Example FZK-Haus. 2017. Available online: https://www.citygmlwiki.org/index.php (accessed on 5 July 2021).
  130. KIT IAI. FZKViewer (6.2). 2021. Available online: https://www.iai.kit.edu/1302.php (accessed on 2 November 2021).
  131. Special Interest Group 3D. Modeling Guide for 3D Objects—Part 2: Modeling of Buildings (LoD1, LoD2, LoD3). 2013. Available online: https://files.sig3d.org/file/ag-qualitaet/201311_SIG3D_Modeling_Guide_for_3D_Objects_Part_2.pdf (accessed on 4 December 2021).
  132. Kulhavy, D.; Hung, I.K.; Unger, D.R.; Viegut, R.; Zhang, Y. Measuring Building Height Using Point Cloud Data Derived from Unmanned Aerial System Imagery in an Undergraduate Geospatial Science Course. High. Educ. Stud. 2021, 11, 105–113. [Google Scholar] [CrossRef]
  133. Malhotra, A.; Raming, S.; Frisch, J.; van Treeck, C. CtyBIT: CityGML Building Interpolation Tool for Energy Performance Simulations. In Proceedings of the 2021 European Conference on Computing in Construction (2021 EC3), Rhodes, Greece, 19–28 July 2021; pp. 245–252. [Google Scholar] [CrossRef]
  134. inkasPortal—GeoNet Online GmbH: Geoportal Städteregion Aachen. 12 July 2021. Available online: https://www.staedteregion-aachen.de/de/navigation/staedteregion/geoportal (accessed on 17 October 2021).
  135. Cox, S.; Daisey, P.; Lake, R.; Portele, C.; Whiteside, A. OpenGIS® Geography Markup Language (GML), Version 3.1.1; Project Document: OGC 03-105r1; OGC 12-019; Technical Report; Open Geospatial Consortium: Rockville, MD, USA, 2004. [Google Scholar]
  136. Biljecki, F.; Ledoux, H.; Stoter, J. An improved LOD specification for 3D building models. Comput. Environ. Urban Syst. 2016, 59, 25–37. [Google Scholar] [CrossRef] [Green Version]
  137. Agugiaro, G. First steps towards an integrated CityGML-based 3D model of Vienna. ISPRS Ann. Photogramm. Remote Sens. Spat. Inf. Sci. 2016, 3, 139–146. [Google Scholar] [CrossRef] [Green Version]
  138. Open Data Österreich. Katalog Generalisiertes Dachmodell (LOD2.1) Wien. 2021. Available online: https://www.data.gv.at/ (accessed on 6 November 2021).
  139. Google Maps. 2021. Available online: https://www.google.com/maps (accessed on 1 November 2021).
  140. Loga, T.; Diefenbach, N.; Stein, B.; Dascalaki, E.; Balaras, C.; Droutsa, K.; Ignjatovic, D. Typology approach for building stock energy assessment. In Main Results of the TABULA Project. Final Project Report: Appendix Volume; Intelligent Energy Europe, Institut Wohnen und Umwelt: Darmstadt, Germany, 2012. [Google Scholar]
  141. Mattsson, S.E.; Elmqvist, H.; Otter, M. Physical system modeling with Modelica. Control Eng. Pract. 1998, 6, 501–510. [Google Scholar] [CrossRef]
  142. Wetter, M.; Zuo, W.; Nouidui, T.S.; Pang, X. Modelica buildings library. J. Build. Perform. Simul. 2014, 7, 253–270. [Google Scholar] [CrossRef]
  143. Nytsch-Geusen, C.; Huber, J.; Ljubijankic, M.; Rädler, J. Modelica BuildingSystems- eine Modellbibliothek zur Simulation komplexer energietechnischer Gebäudesysteme. Bauphysik 2013, 35, 21–29. [Google Scholar] [CrossRef]
  144. Dassault Systèmes. Dymola® (Version 2020). 2020. Available online: https://www.3ds.com/products-services/catia/products/dy-mola/ (accessed on 12 December 2020).
  145. Dempsey, M. Dymola for multi-engineering modelling and simulation. In Proceedings of the 2006 IEEE Vehicle Power and Propulsion Conference, Windsor, UK, 6–8 September 2006; IEEE: Piscataway, NJ, USA, 2006; pp. 1–6. [Google Scholar]
  146. DWD. Deutscher Wetterdienst. 2017. Available online: https://www.wetterdienst.de/ (accessed on 9 January 2021).
  147. Behörde für Kultur und Medien. 3D-Stadtmodell LoD1-DE/LoD2-DE Hamburg. 2021. Available online: https://transparenz.hamb-urg.de/ (accessed on 5 July 2021).
  148. Ebertshäuser, S.; Both, P.; Malhotra, A.; Fichter, E.; Frisch, J.; van Treeck, C.; Nie, Y.; Remmen, P.; Streblow, R.; Müller, D. EnEff-Stadt-ModelSIM: Entwicklung einer Bidirektionalen Schnittstelle zur Modellbasierten Kopplung Kommunaler Planungs-, Simulations- und Analyseprozess; Karlsruher Institut für Technologie (KIT): Karlsruhe, Germany, 2020. [Google Scholar]
  149. Dochev, I.; Seller, H.; Peters, I. Assigning energetic archetypes to a digital cadastre and estimating building heat demand. An example from Hamburg, Germany. Environ. Clim. Technol. 2020, 24, 233–253. [Google Scholar] [CrossRef]
  150. Biljecki, F.; Dehbi, Y. Raise the roof: Towards generating LoD2 models without aerial surveys using machine learning. ISPRS Ann. Photogramm. Remote Sens. Spat. Inf. Sci. 2019, 4, 27–34. [Google Scholar] [CrossRef] [Green Version]
  151. Kolbe, T.H.; Moshrefzadeh, M.; Chaturvedi, K.; Donaubauer, A. The Data Integration Challenge in Smart City Projects; Technical Report; Lehrstuhl für Geoinformatik: München, Germany, 2020. [Google Scholar]
  152. 3Dis. 3Dis CityEditor. 2020. Available online: https://www.3dis.de/URL (accessed on 3 October 2021).
  153. Coors, V.; Betz, M.; Duminil, E. A Concept of Quality Management of 3D City Models Supporting Application-Specific Requirements. PFG-J. Photogramm. Remote Sens. Geoinf. Sci. 2020, 88, 3–14. [Google Scholar] [CrossRef] [Green Version]
  154. Galdosinc. Galdos CityGML Inspector. 2020. Available online: https://www.galdosinc.com/ (accessed on 3 March 2021).
  155. Malhotra, A.; Shamovich, M.; Frisch, J.; van Treeck, C. Urban Energy Simulations using Open CityGML Models: A Comparative Analysis. Energy Build. 2021, 111658. [Google Scholar] [CrossRef]
  156. Malhotra, A.; Raming, S.; Frisch, J.; van Treeck, C. CityATB (CGML ATB): CityGML Analysis Toolbox for Energy Performance Simulations. In Proceedings of the BauSIM2020: 8th Conference of IBPSA Germany and Austria, IBPSA, Graz, Austria, 23–25 September 2020; pp. 194–201. [Google Scholar] [CrossRef]
  157. Benner, J. GML Toolbox. 2020. Available online: https://www.iai.kit.edu/english/1650.php (accessed on 2 March 2021).
  158. Safe Software Inc. FME Software Copyright (c); Safe Software Inc.: Surrey, BC, Canada, 2019. [Google Scholar]
  159. Biljecki, F.; Chew, L.Z.X.; Milojevic-Dupont, N.; Creutzig, F. Open government geospatial data on buildings for planning sustainable and resilient cities. arXiv 2021, arXiv:2107.04023. [Google Scholar]
  160. Moos, N.; Juergens, C.; Redecker, A.P. Geo-Spatial Analysis of Population Density and Annual Income to Identify Large-Scale Socio-Demographic Disparities. ISPRS Int. J. Geoinf. 2021, 10, 432. [Google Scholar] [CrossRef]
  161. JetBrains. PyCharm 2020.1.1. 2020. Available online: https://www.jetbrains.com/ (accessed on 5 March 2020).
  162. Microsoft. Visual Studio Code 1.62.3. 2020. Available online: https://code.visualstudio.com/ (accessed on 9 March 2020).
  163. Krietemeyer, B.; El Kontar, R. A method for integrating an UBEM with GIS for spatiotemporal visualization and analysis. In Proceedings of the 10th Annual Symposium on Simulation for Architecture and Urban Design Conference SimAUD, Atlanta, GA, USA, 7–9 April 2019; pp. 87–94. [Google Scholar]
Figure 1. Overview of a building represented in CityGML format. Image adapted from: [9,67].
Energies 14 08250 g001
Figure 2. The five different Levels of Detail (LoD) in CityGML. Image adapted from [9,49].
Energies 14 08250 g002
Figure 3. Publication trend from 2010 to 2021 for Urban Building Energy Modelling-based studies with and without using open data based on the World of Science [119] academic search platform.
Energies 14 08250 g003
Figure 4. Overview of the main window of CityLDT.
Energies 14 08250 g004
Figure 5. An overview of upscaling LoD0 models to LoD1 and LoD2.
Energies 14 08250 g005
Figure 6. An overview of upscaling LoD1 models to LoD2.
Energies 14 08250 g006
Figure 7. An overview of downscaling LoD2 models to LoD1 and LoD0.
Energies 14 08250 g007
Figure 8. An overview of downscaling LoD1 models to LoD0.
Energies 14 08250 g008
Figure 9. (a) Visual representation of the selected buildings in Vienna using an underlying image from Google Maps [139]. Image adapted to highlight the considered area; (b) representation of open LoD2 CityGML building models; (c) LoD1 models transformed from LoD2 models; (d) representations of the transformed LoD0 CityGML building models. The LoD0 models are transformed from LoD2 models.
Energies 14 08250 g009
Figure 10. An overview of the transformed LoD0 to LoD2 model (B2) of FZK House along with the user inputs considered for the transformation.
Energies 14 08250 g010
Figure 11. Comparison of heating demand simulation (MWh) for open (A1 and A2) and upscaled (B1 and B2) for a period of one year.
Energies 14 08250 g011
Figure 12. Visualisation of a district in Hamburg Hamm using an underlying image from Google Maps [139]. Image adapted in order to highlight the considered urban area.
Energies 14 08250 g012
Figure 13. (a) Representation of open LoD1 CityGML building models (OD1); (b) representations of the transformed LoD2 CityGML building models (TD2).
Energies 14 08250 g013
Figure 14. Overview of dynamic heating demand simulation (in MWh) for the open LoD1 (OD1), LoD2 (OD2) and the transformed CityLDT LoD2 (TD2) models.
Energies 14 08250 g014
Figure 15. Comparison of heating demands (in MWh) for the open LoD1 (OD1), LoD2 (OD2) and the transformed CityLDT LoD2 (TD2) CityGML models over a period of one year.
Energies 14 08250 g015
Table 1. Overview of available open-source 3D CityGML data. Information accessed from [99,100,101,102,103,104,105,106]. “&” denotes the availability of the different LoDs. In some datasets, the number of LoD1 models is higher than the LoD2. This is denoted as “1 > 2”.
CountryCity/StateLoDYear
AustraliaAdelaide1 & 22020
Melbourne1 & 2-
AustriaLinz22011
Vienna1 & 22016
BelgiumBrussels22014
CanadaMontrèal22009
EstoniaEstonia1 & 22021
FinlandHelsinki1 & 22013
Espoo1, 2 & 32013
FranceLyon22012
Bordeaux1, 22019
GermanyBerlin22019
Brandenburg1 & 22020
Hamburg1 & 22020
Hannover1 & 22019
Ingolstadt32021
Niedersachsen1 & 22019
Nordrhein-Westfalen1 & 22020
Postdam22017
Sachsen1 & 22020
Thüringen1 & 22019
IrelandDublin22018
JapanHokota1 >22013
Iwaki1 >22020
Kiryu1 >22020
Koriyama1 >22020
Utsunomiya1 >22020
Sapporo1 >22020
Shirakawa1 >22020
Tokyo1 >22020
NetherlandsAmsterdam 11-
Delft 11-
Leiden 11-
Zwolle 11-
Den Haag22013
Rotterdam1 & 22020
PolandAll12019
SwitzerlandZürich1 & 22019
Switzerland in 3D 2,322013–2019
UKCambridge12021
London1 & 2-
USANew York 4,51 & 22019
BuildZero Open City Model 612019
1 Open datasets created with 3dfier [107]. 2 Datasets available for Zürich, Bern, Luzern, Uri, Schwyz, Unterwalden, Glarus, Zug, Freiburg, Solothurn, Basel, Schaffenhausen, Appenzell, Sankt Gallen, Aargau, Thurgau, Ticino, Vaud, Valais, Neuchâtel, Genéva, Jura. Made accessible by the Federal Office of Topography (swisstopo) [100]. 3 Acquisition of data for different states from 2013 to 2019. 4 LoD1 developed by the Technical University of Munich [101]. 5 LoD2 developed by the New York City Department of Information Technology and Telecommunications (DoITT) [102]. 6 Datasets available for Alabama, Alaska, Arizona, Arkansas, California, Colorado, Connecticut, Delaware, District of Columbia, Florida, Georgia, Hawaii, Idaho, Illinois, Indiana, Iowa, Kansas, Kentucky, Louisiana, Maine, Maryland, Massachusetts, Michigan, Minnesota, Mississippi, Missouri, Montana, Nebraska, Nevada, New Hampshire, New Jersey, New Mexico, New York, North Carolina, North Dakota, Ohio, Oklahoma, Oregon, Pennsylvania, Rhode Island, South Carolina, South Dakota, Tennessee, Texas, Utah, Vermont, Virginia, Washington, West Virginia, Wisconsin, Wyoming. Developed by BuildZero [103].
Publisher’s Note: MDPI stays neutral with regard to jurisdictional claims in published maps and institutional affiliations.

