
Effects of Experimental Parameters on Condensation Heat Transfer in Plate Fin Heat Exchanger

 ,
,
Abstract
:1. Introduction
2. Experimental System
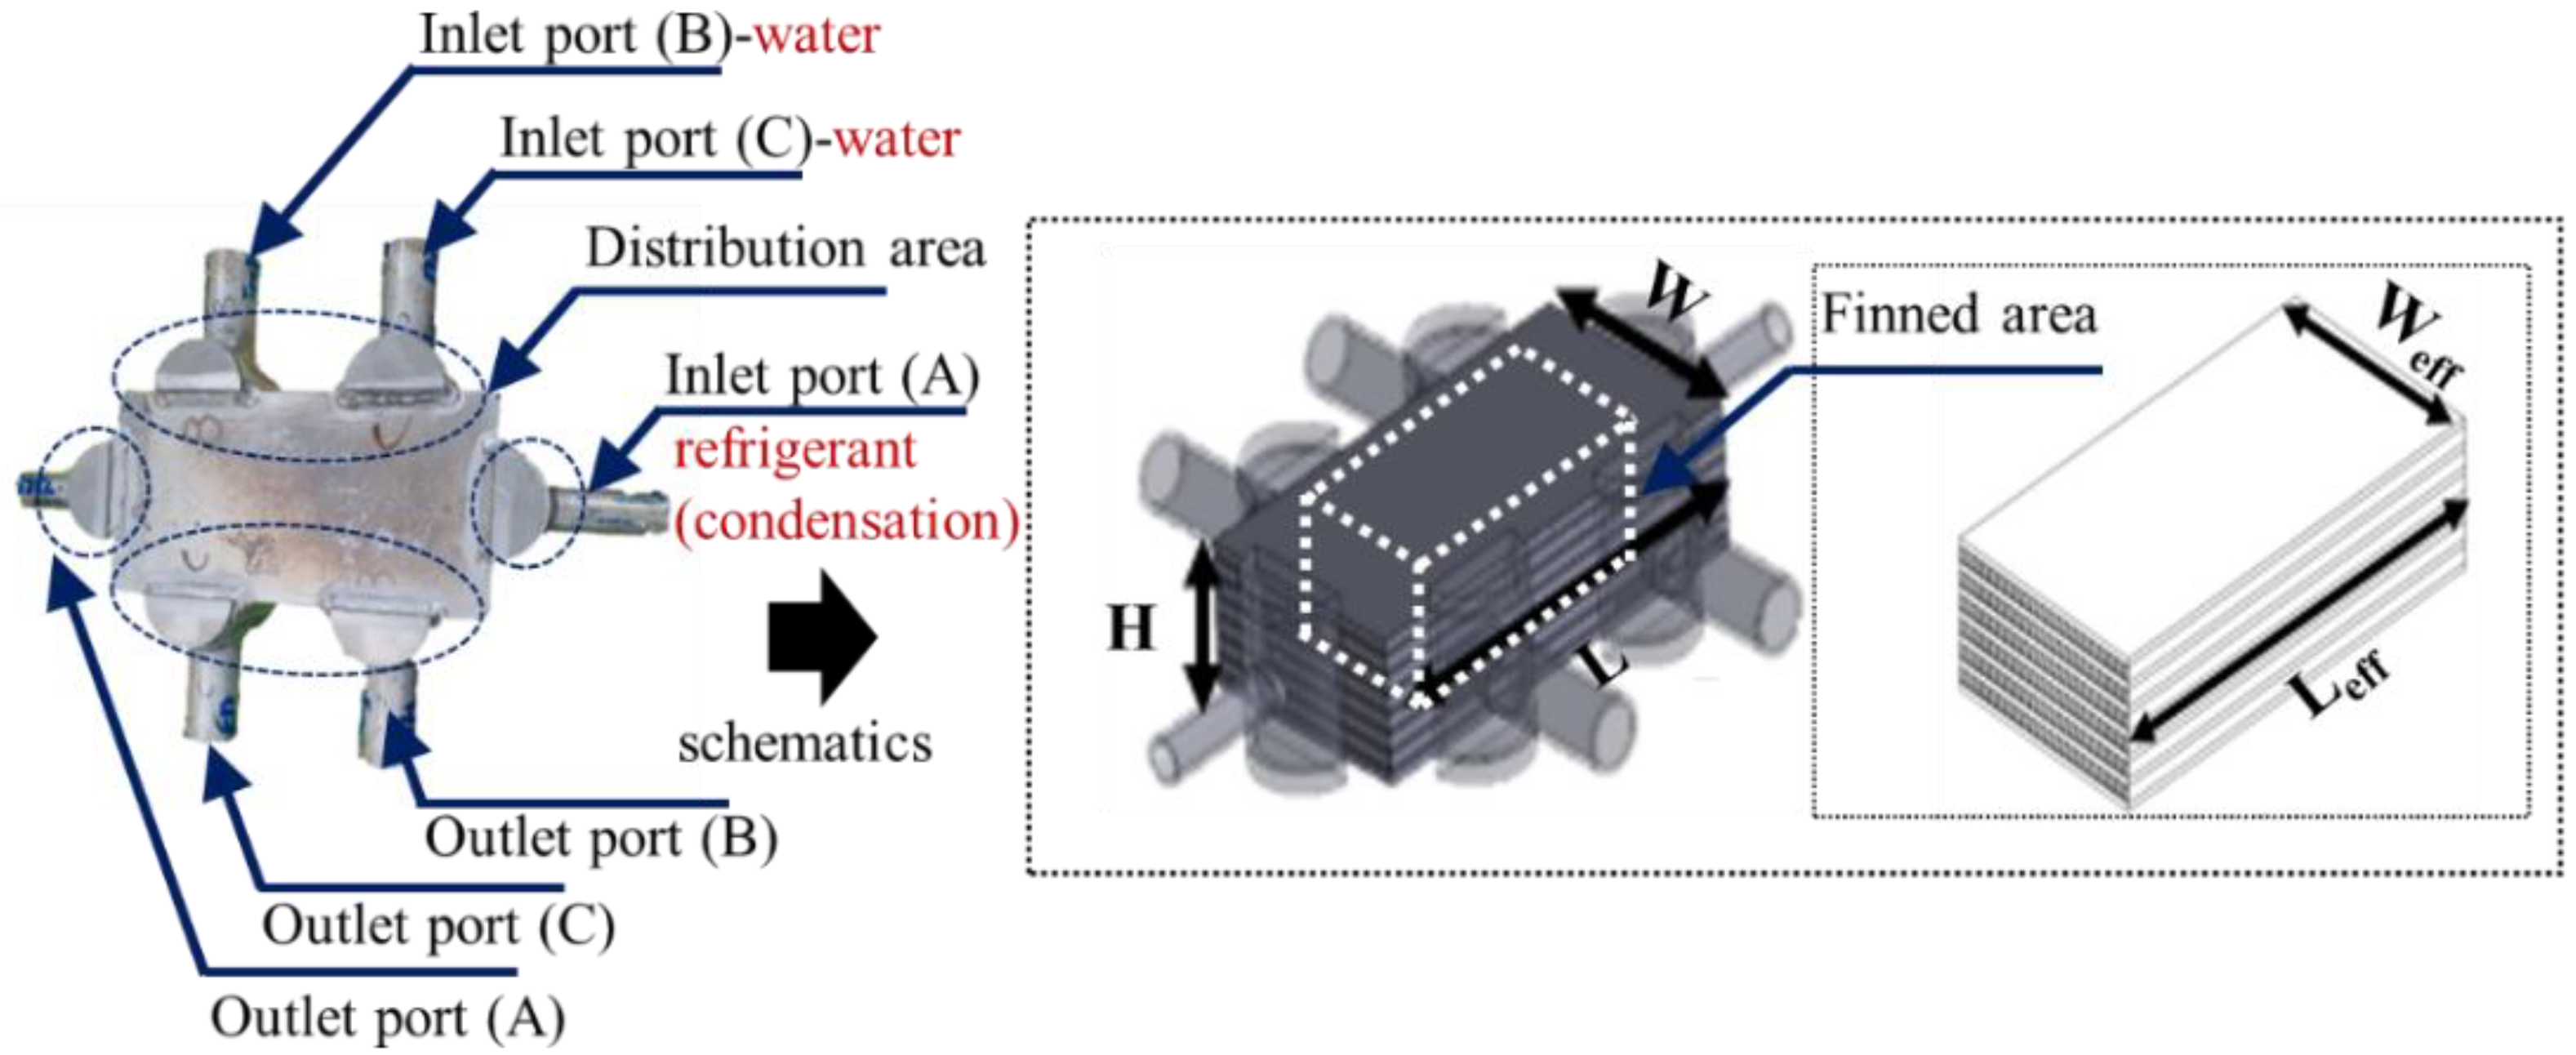
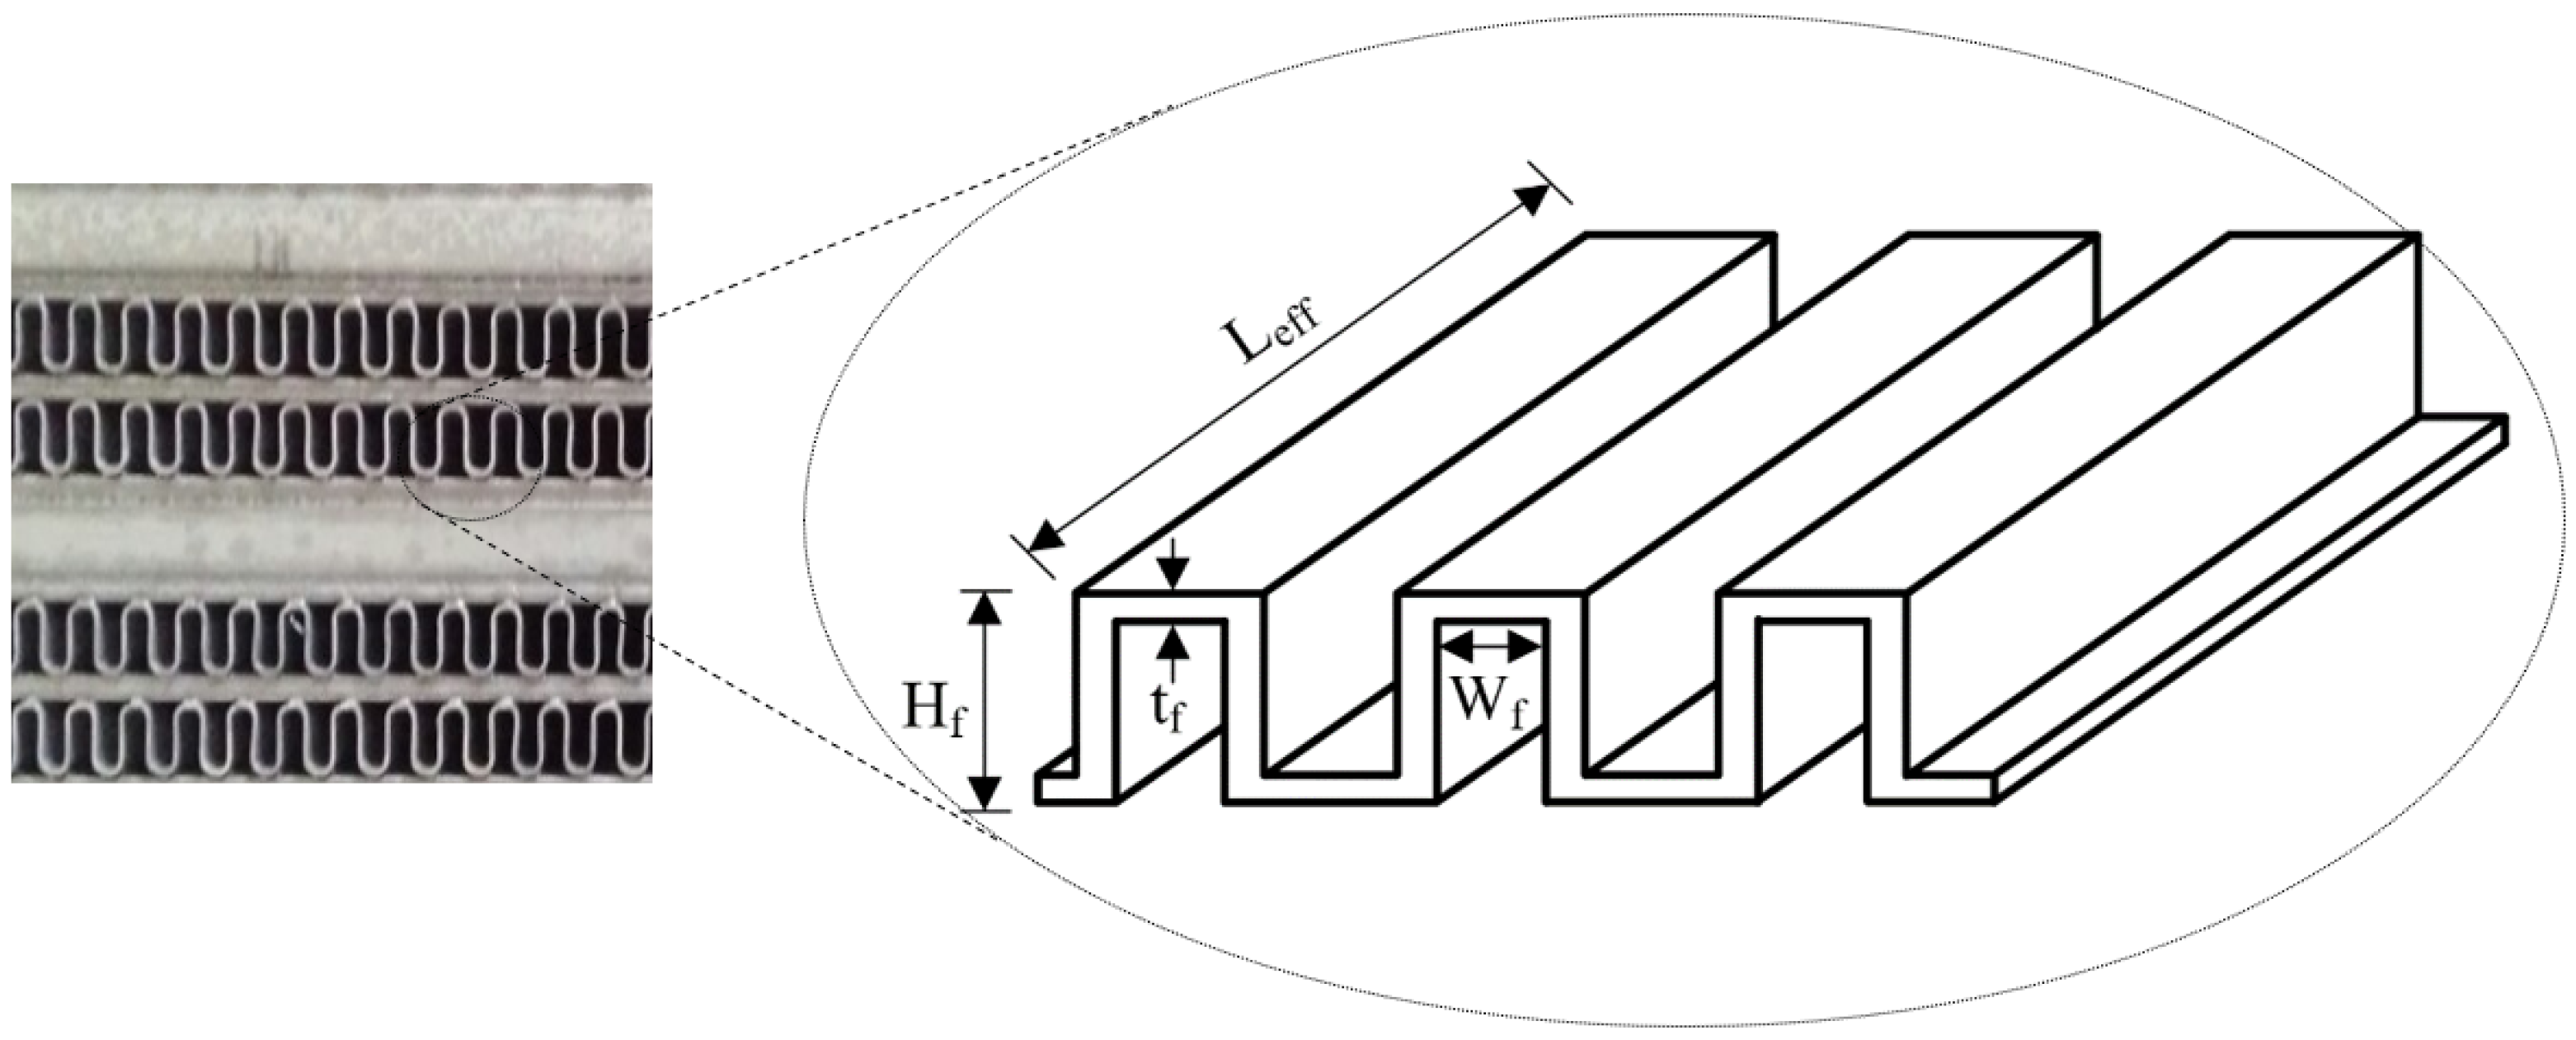
2.1. Plate–Fin Heat Exchanger (PFHE)
2.2. Experimental System Description
3. Single-Phase Heat Transfer in Two-Stream PFHE
3.1. Analysis Methodology
3.2. Heat Transfer Correlation (Single-Phase)
4. Condensation Heat Transfer in Two-Stream PFHE
4.1. Analysis Methodology
4.2. Condensation Heat Transfer Characteristics
4.2.1. Effect of Mass Flux
4.2.2. Effect of Heat Flux
4.2.3. Effect of Saturation Pressure
4.2.4. Heat Transfer Correlation (2-Stream Condensation)
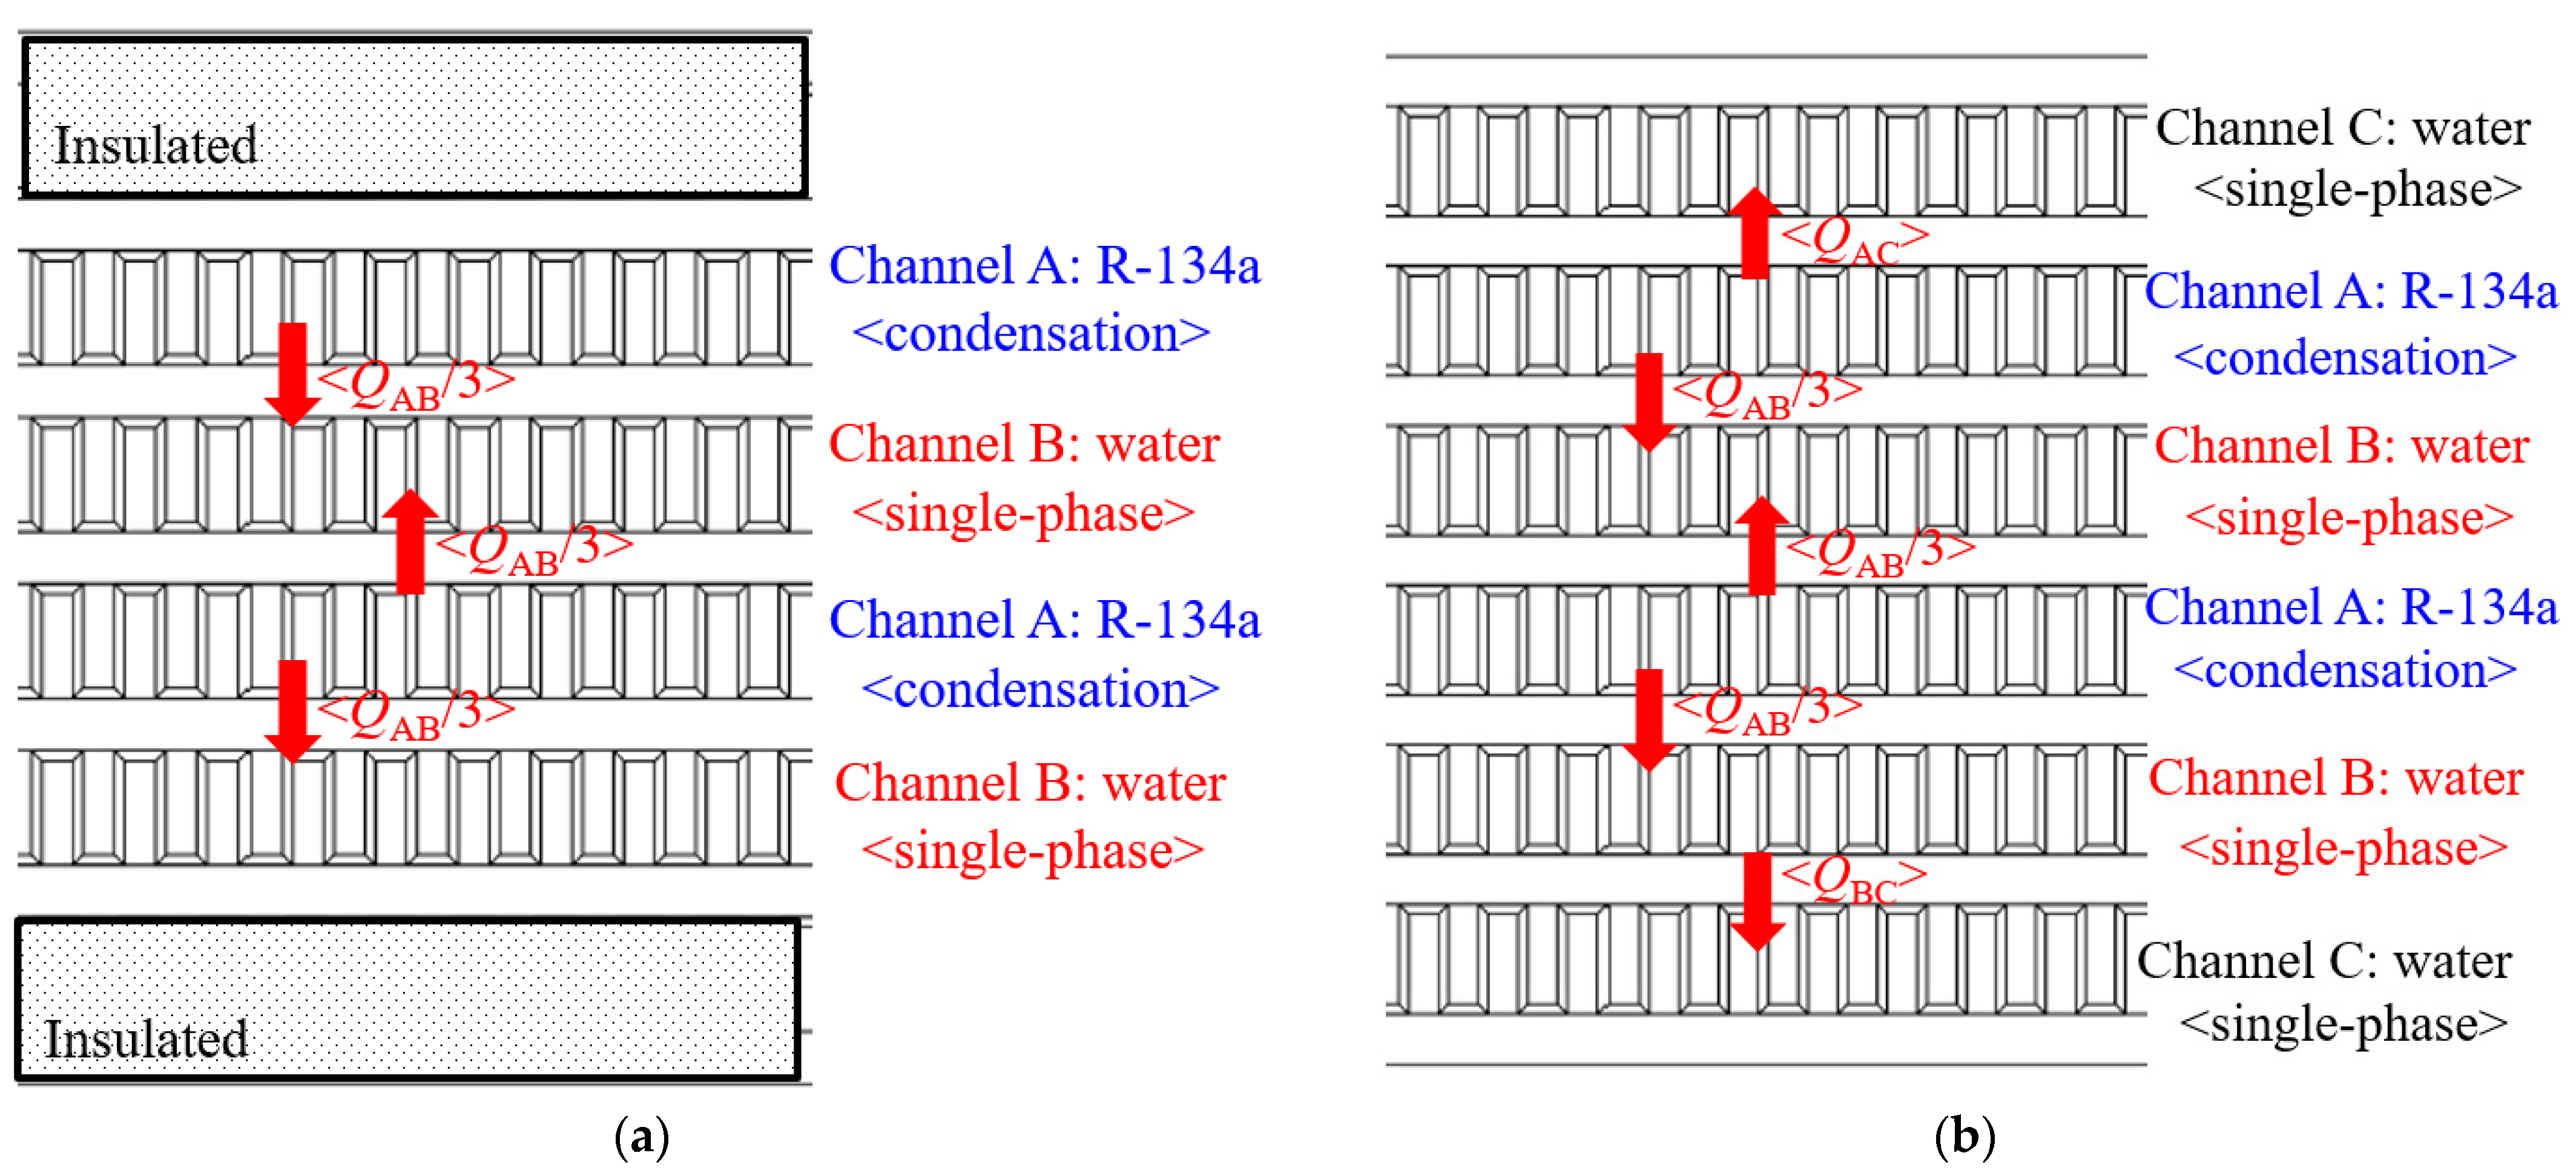
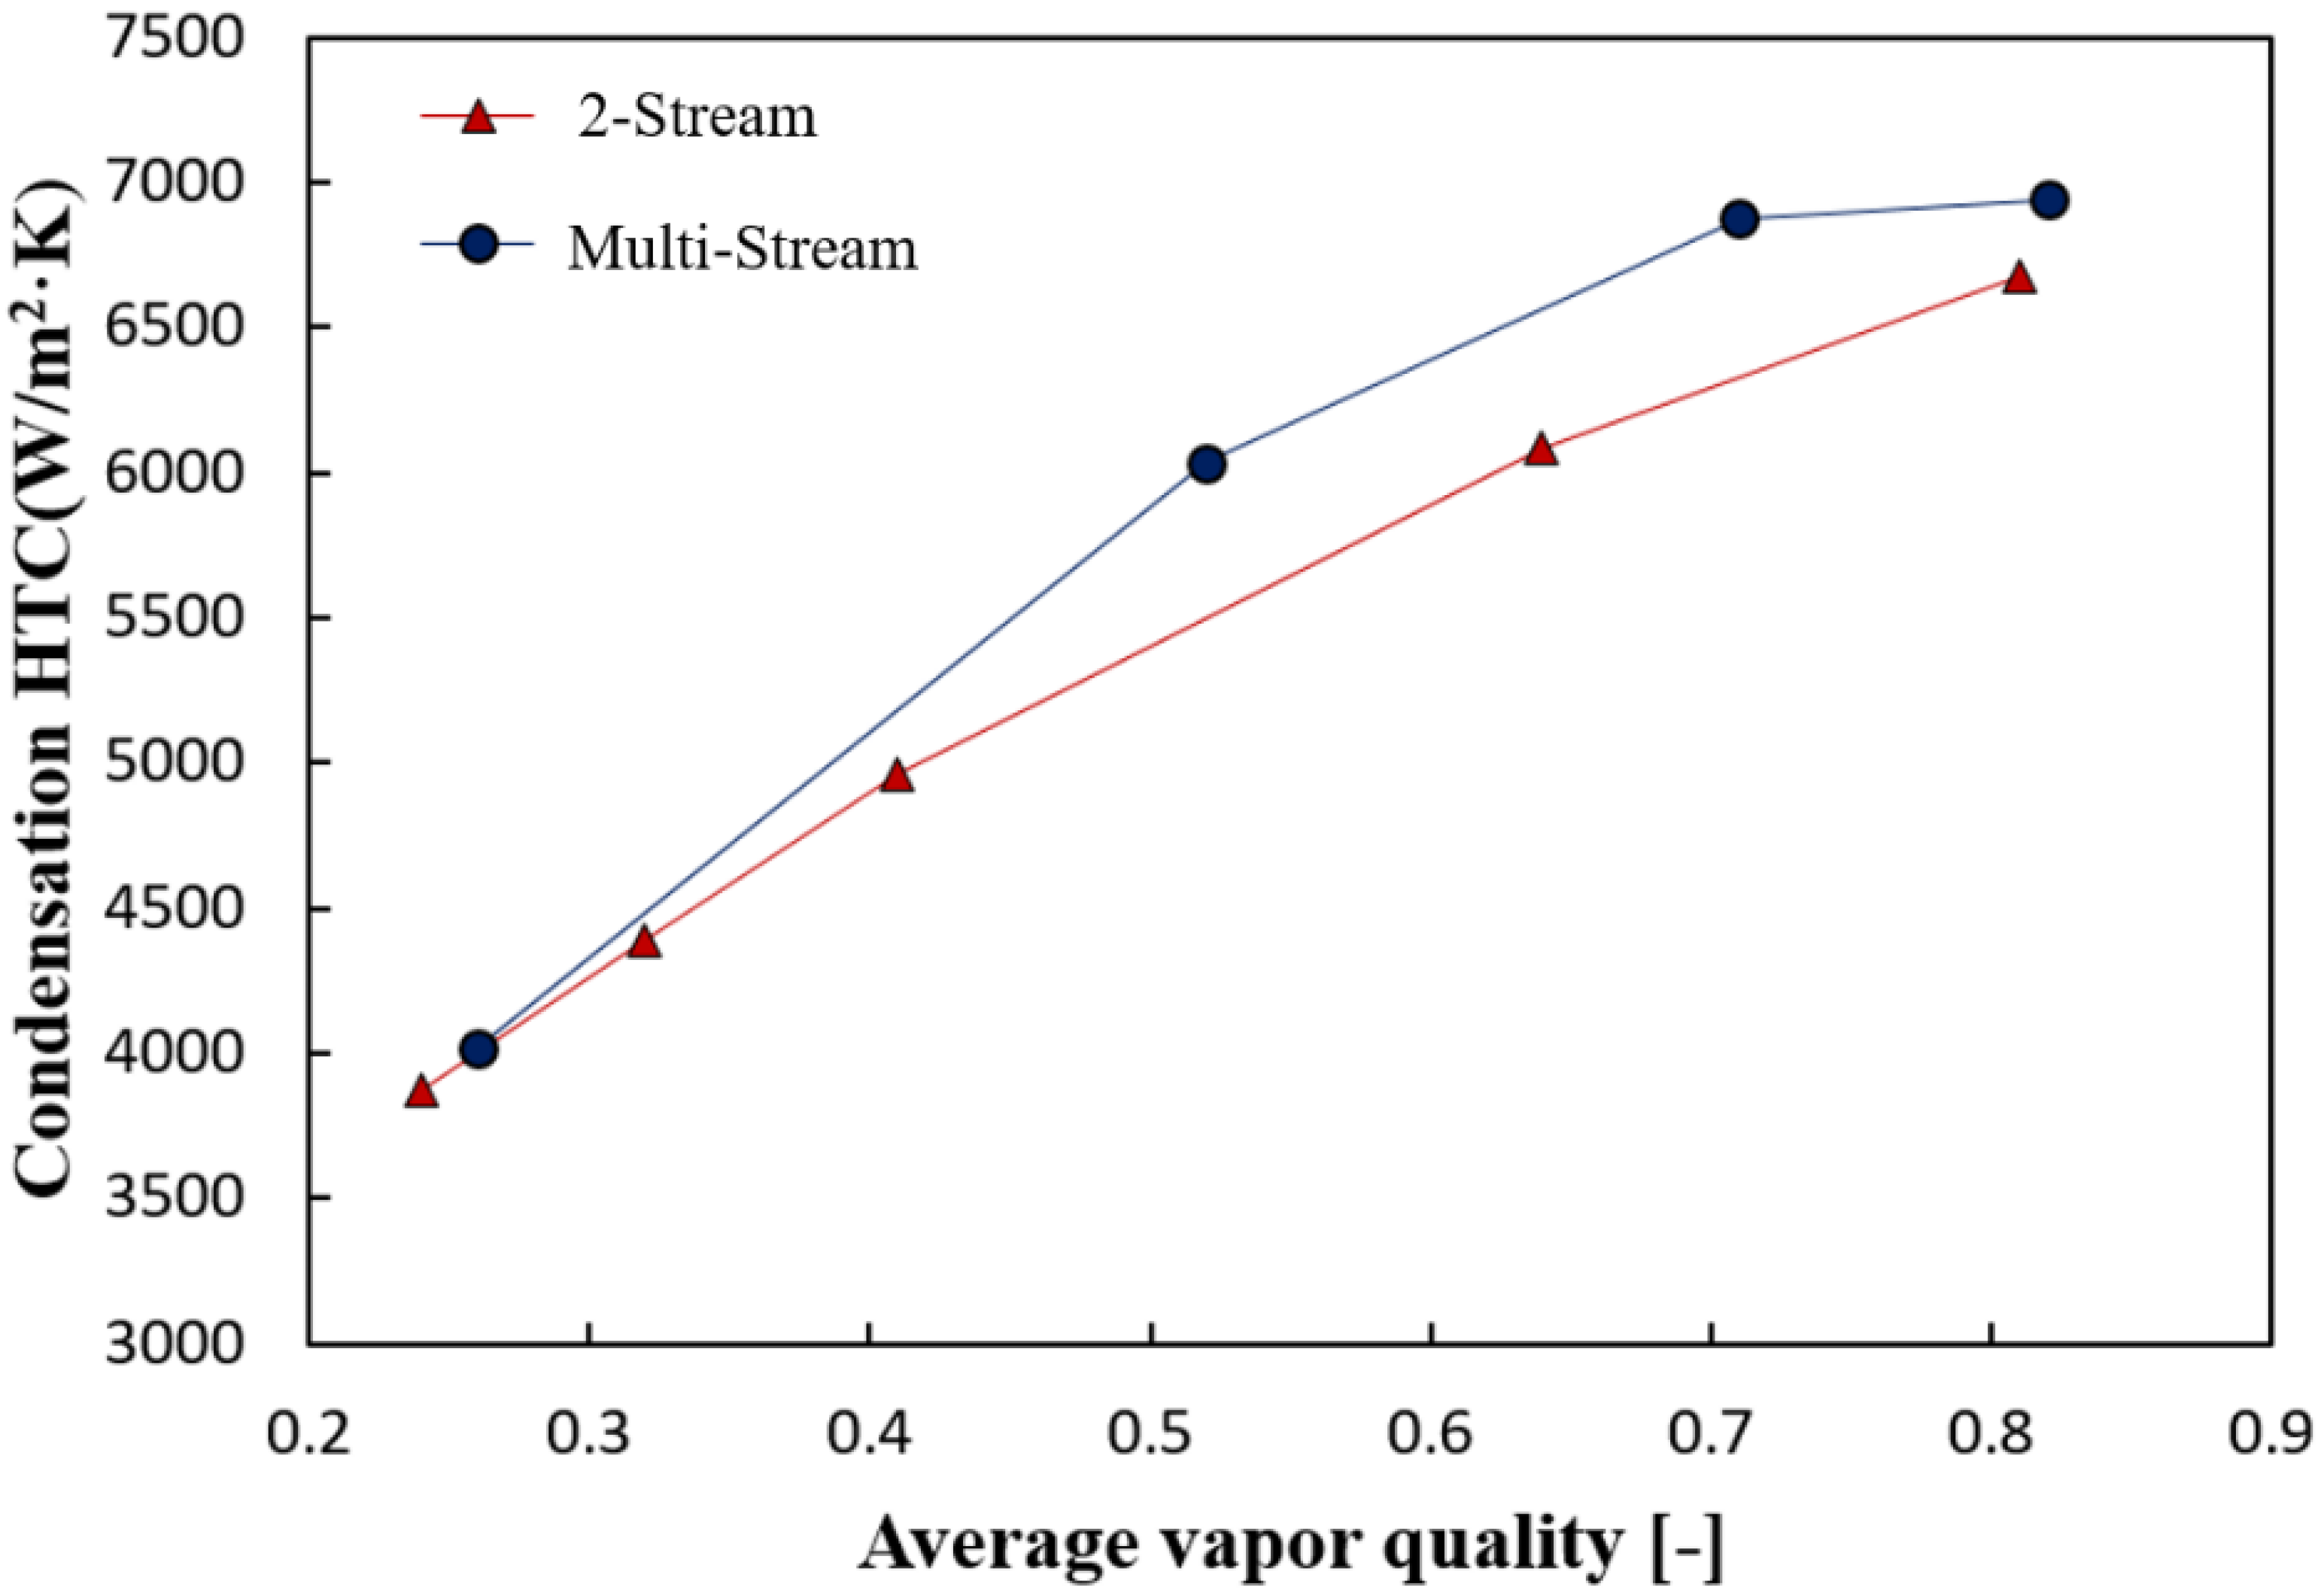
5. Condensation Heat Transfer in Multi-Stream PFHE
5.1. Analysis Methodology
5.2. Comparison with Two-Stream Case
6. Conclusions
- A higher mass flux results in a higher condensation HTC, and a higher vapor quality results in a higher condensation HTC. The main reason for this comes from shear stress. Both conditions commonly cause the higher velocity which results in the higher shear stress at the interface of vapor and liquid.
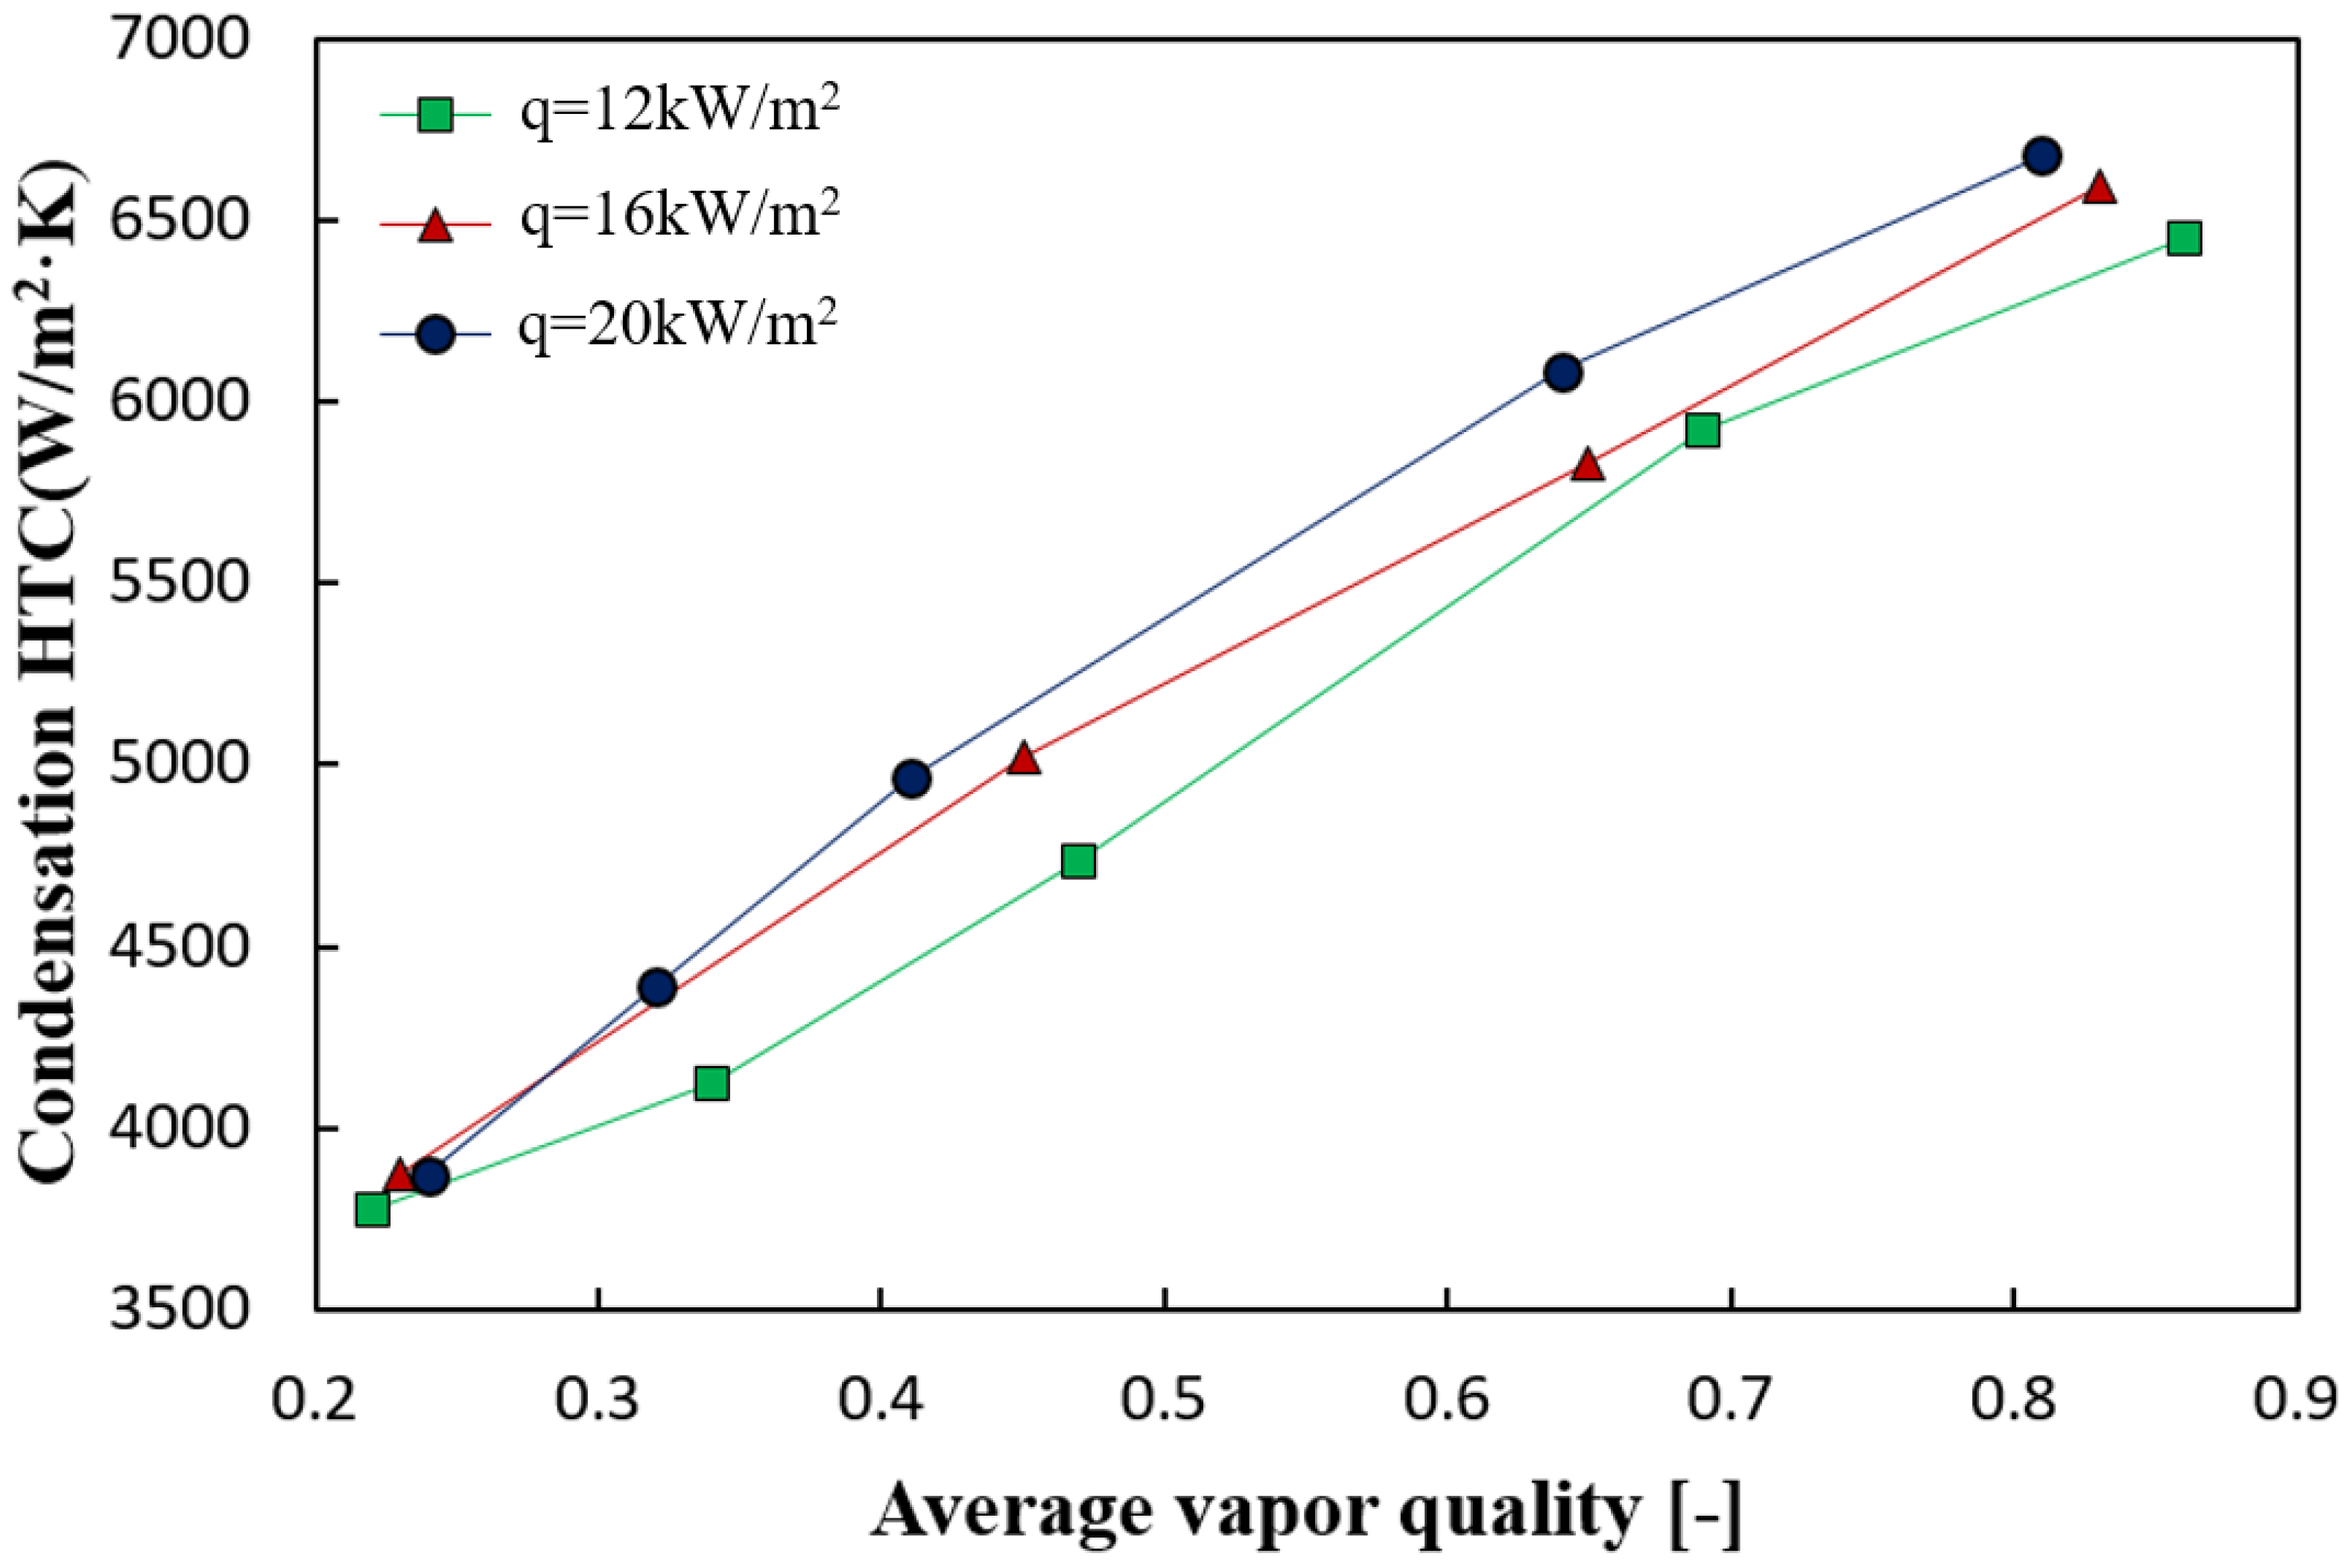
- The condensation HTC tends to increase with increasing heat flux owing to the enhanced turbulence of the flow. The effect of heat flux on the condensation HTC was rather minor compared to that of the mass flux.
- The condensation HTC tends to decrease as the saturation pressure increases because of three major reasons: the thickness of liquid layer, shear stress, and thermal conductivity of liquid. The specific volume of gas and viscosity of liquid are changed according to the saturation pressure. Therefore, thickness of liquid layer and shear stress, which affect turbulence, are expected to be affected.
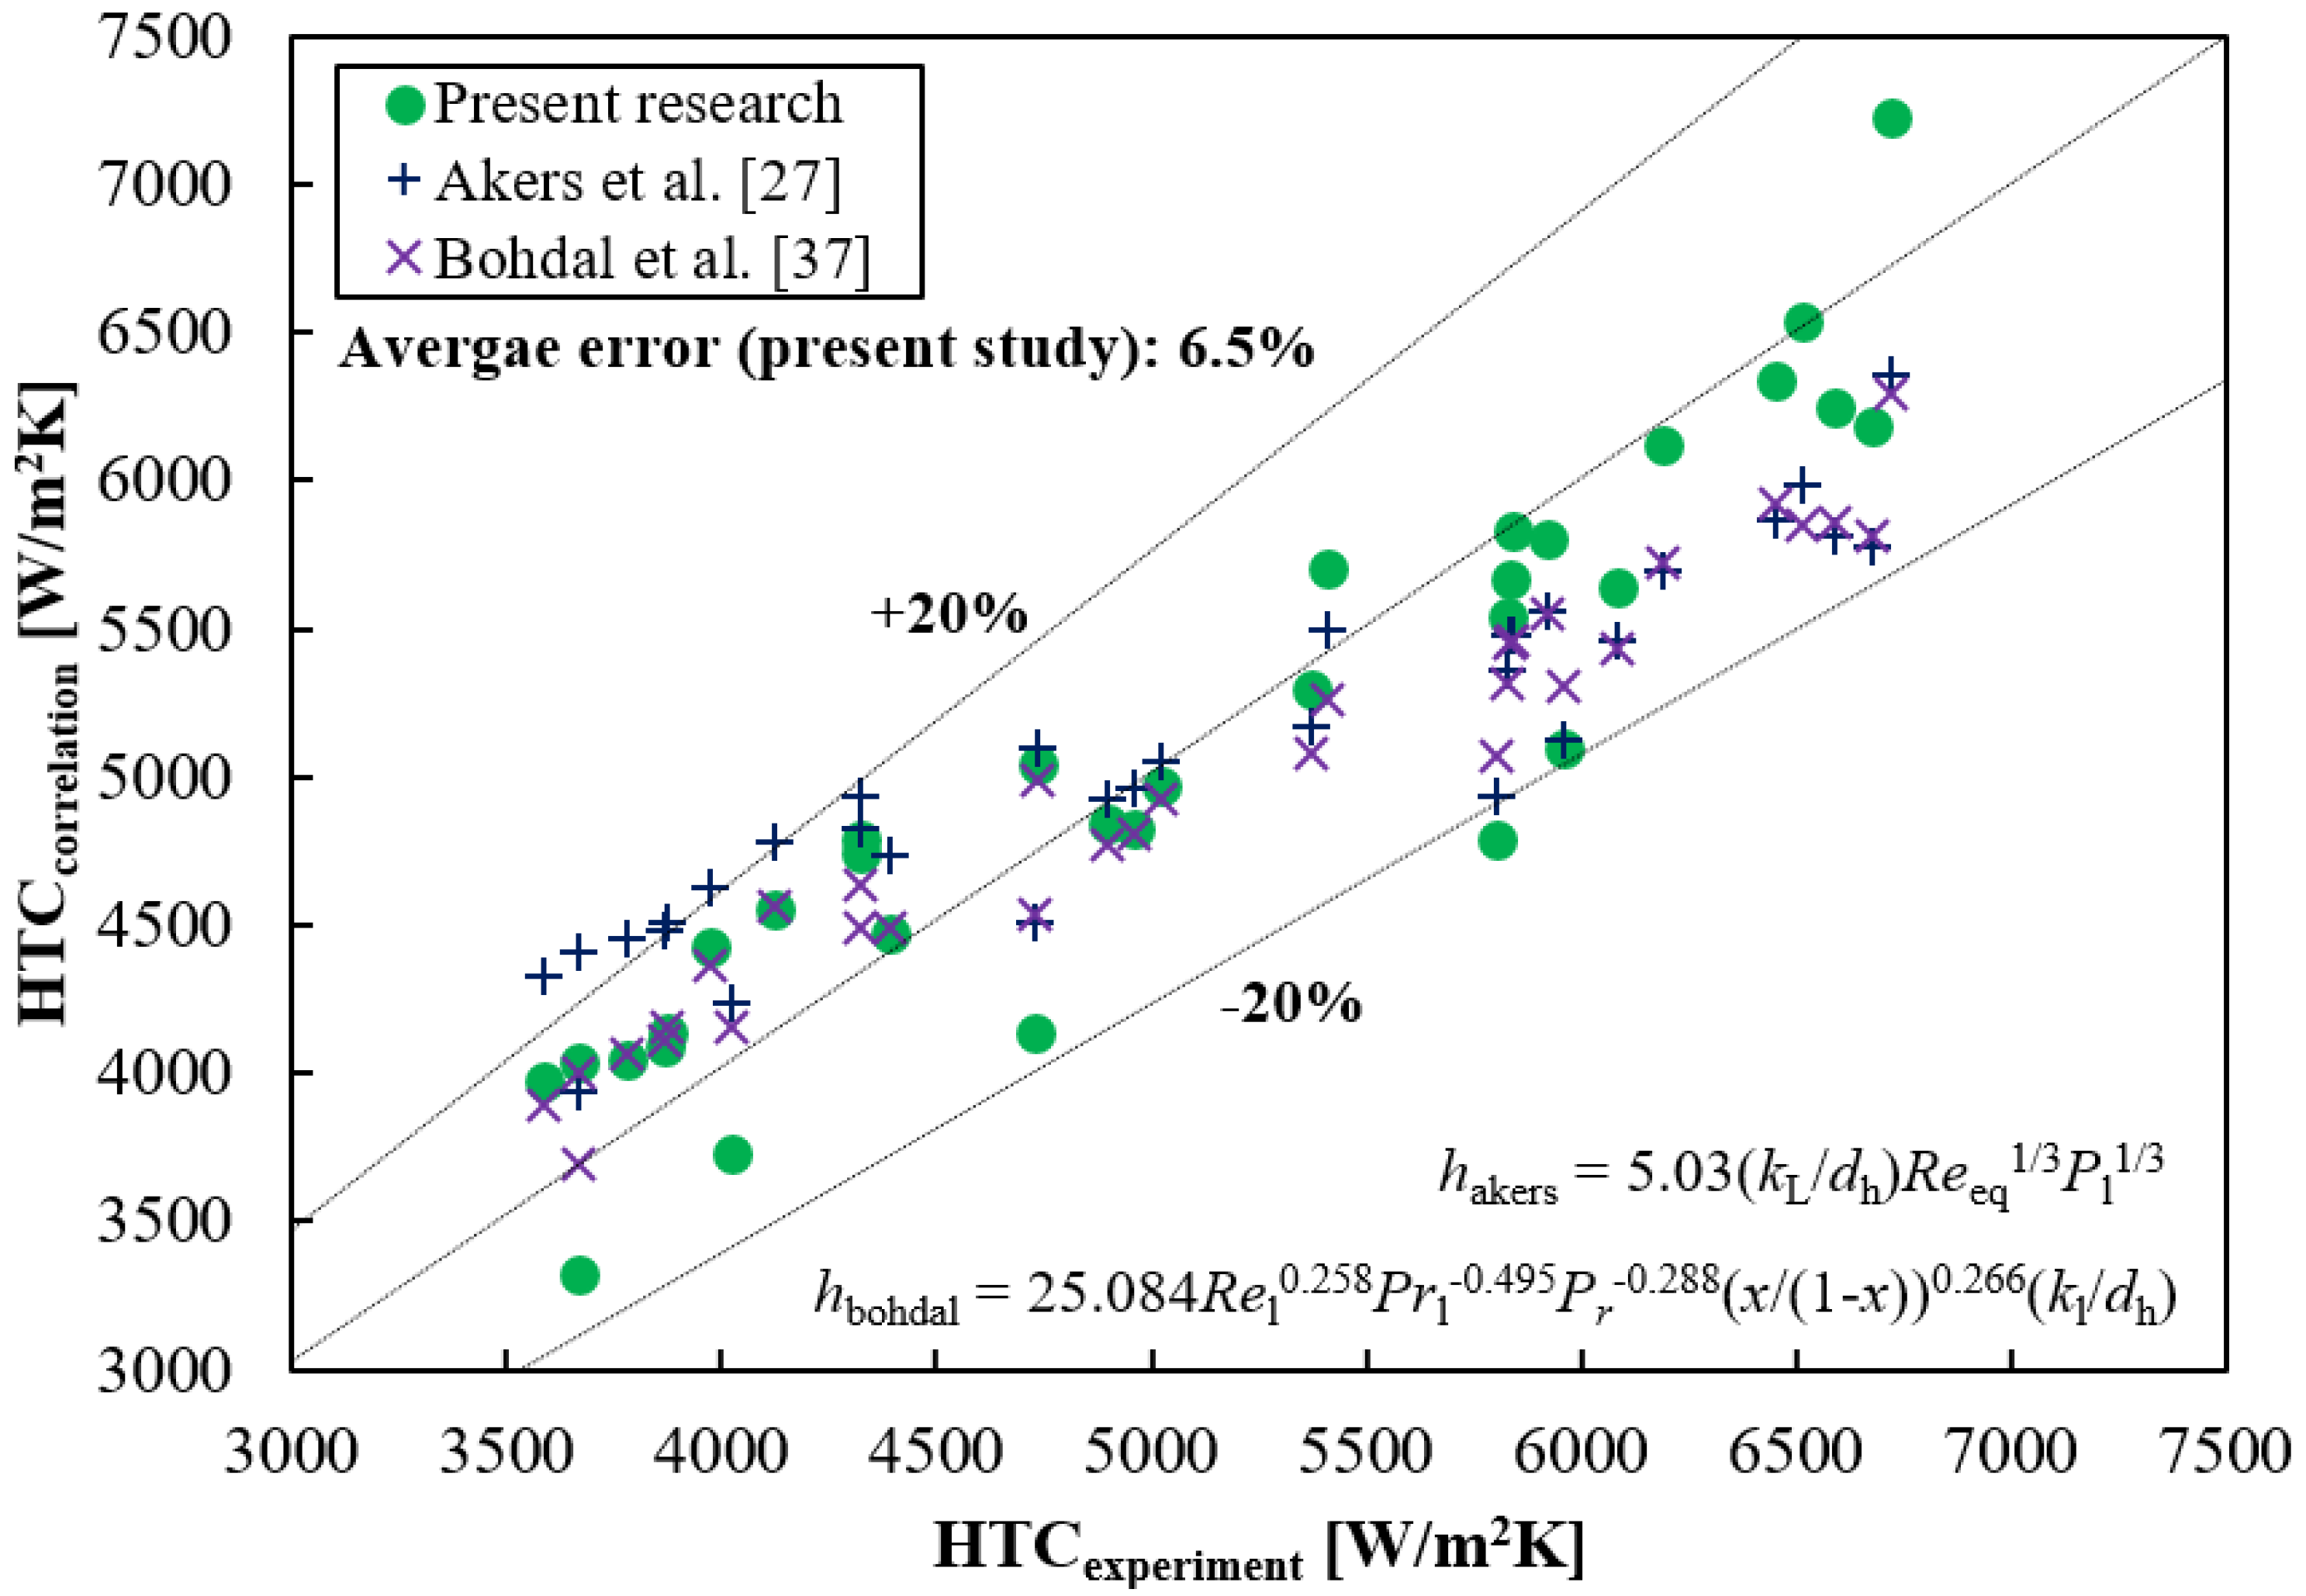
- The mass flux is the most influential parameter among the heat flux and saturation pressure. Thus, the equivalent mass flux of the refrigerant (or equivalent Reynolds number) is dominant in the derived correlation model.
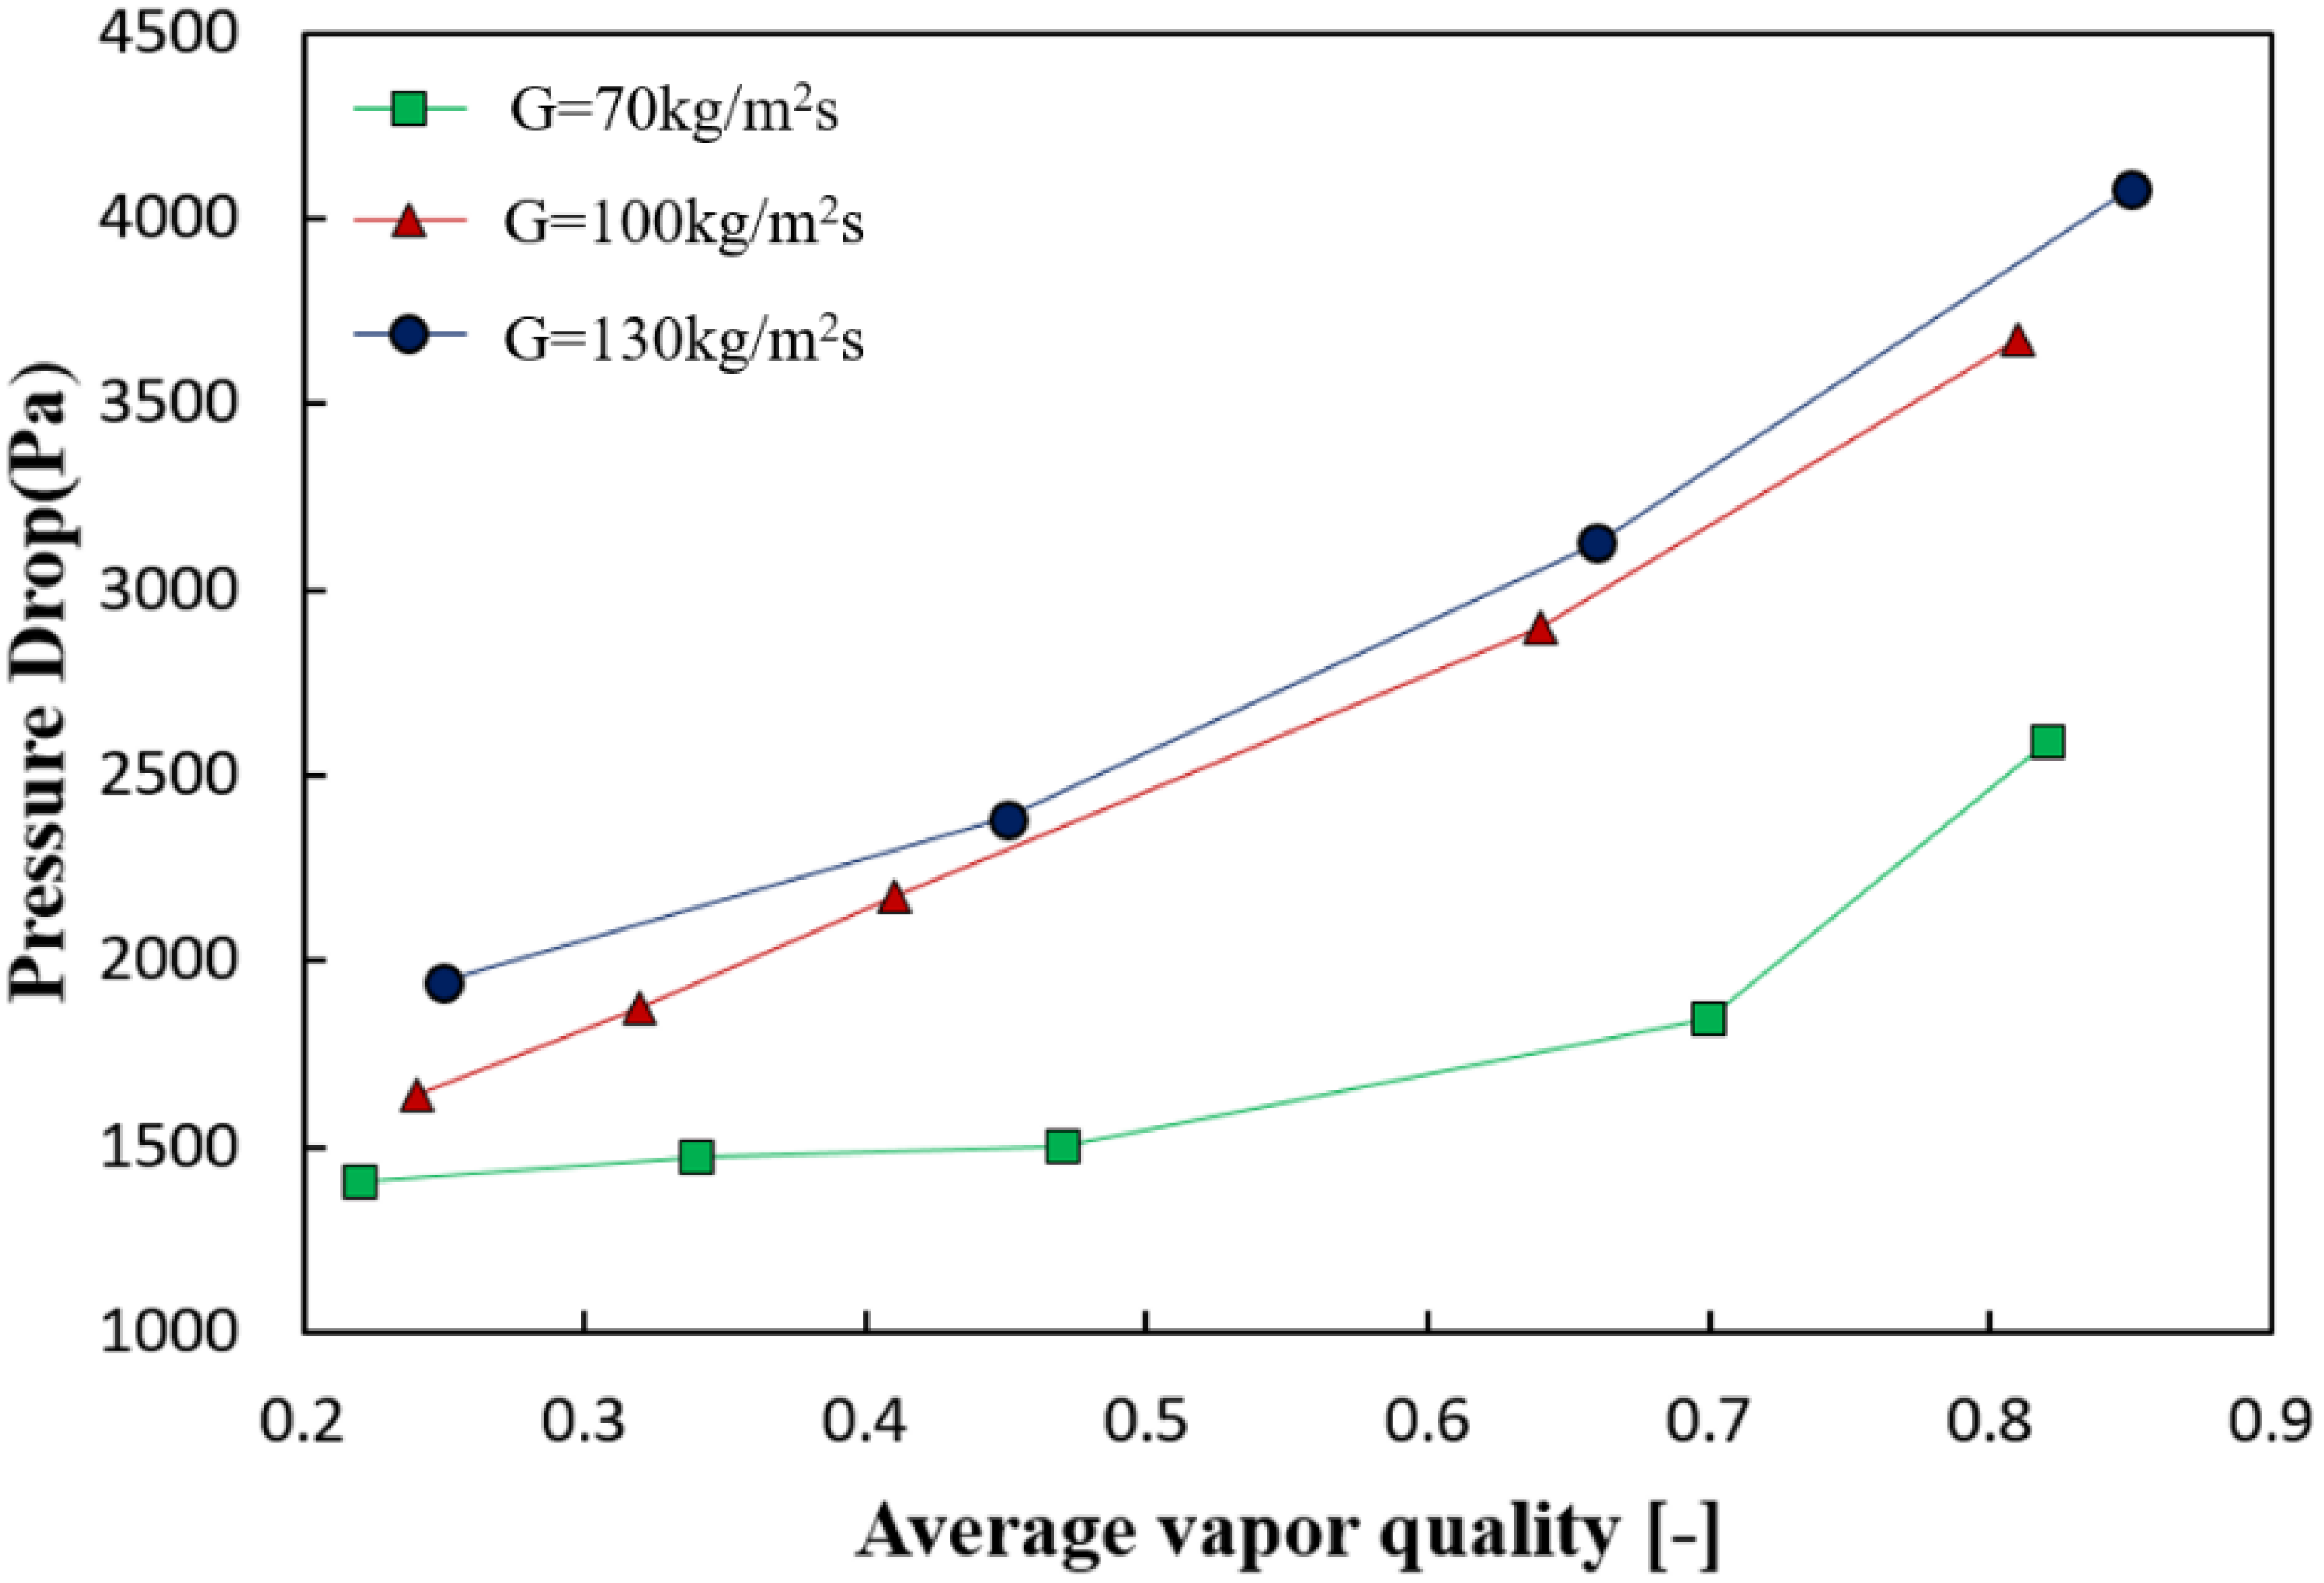
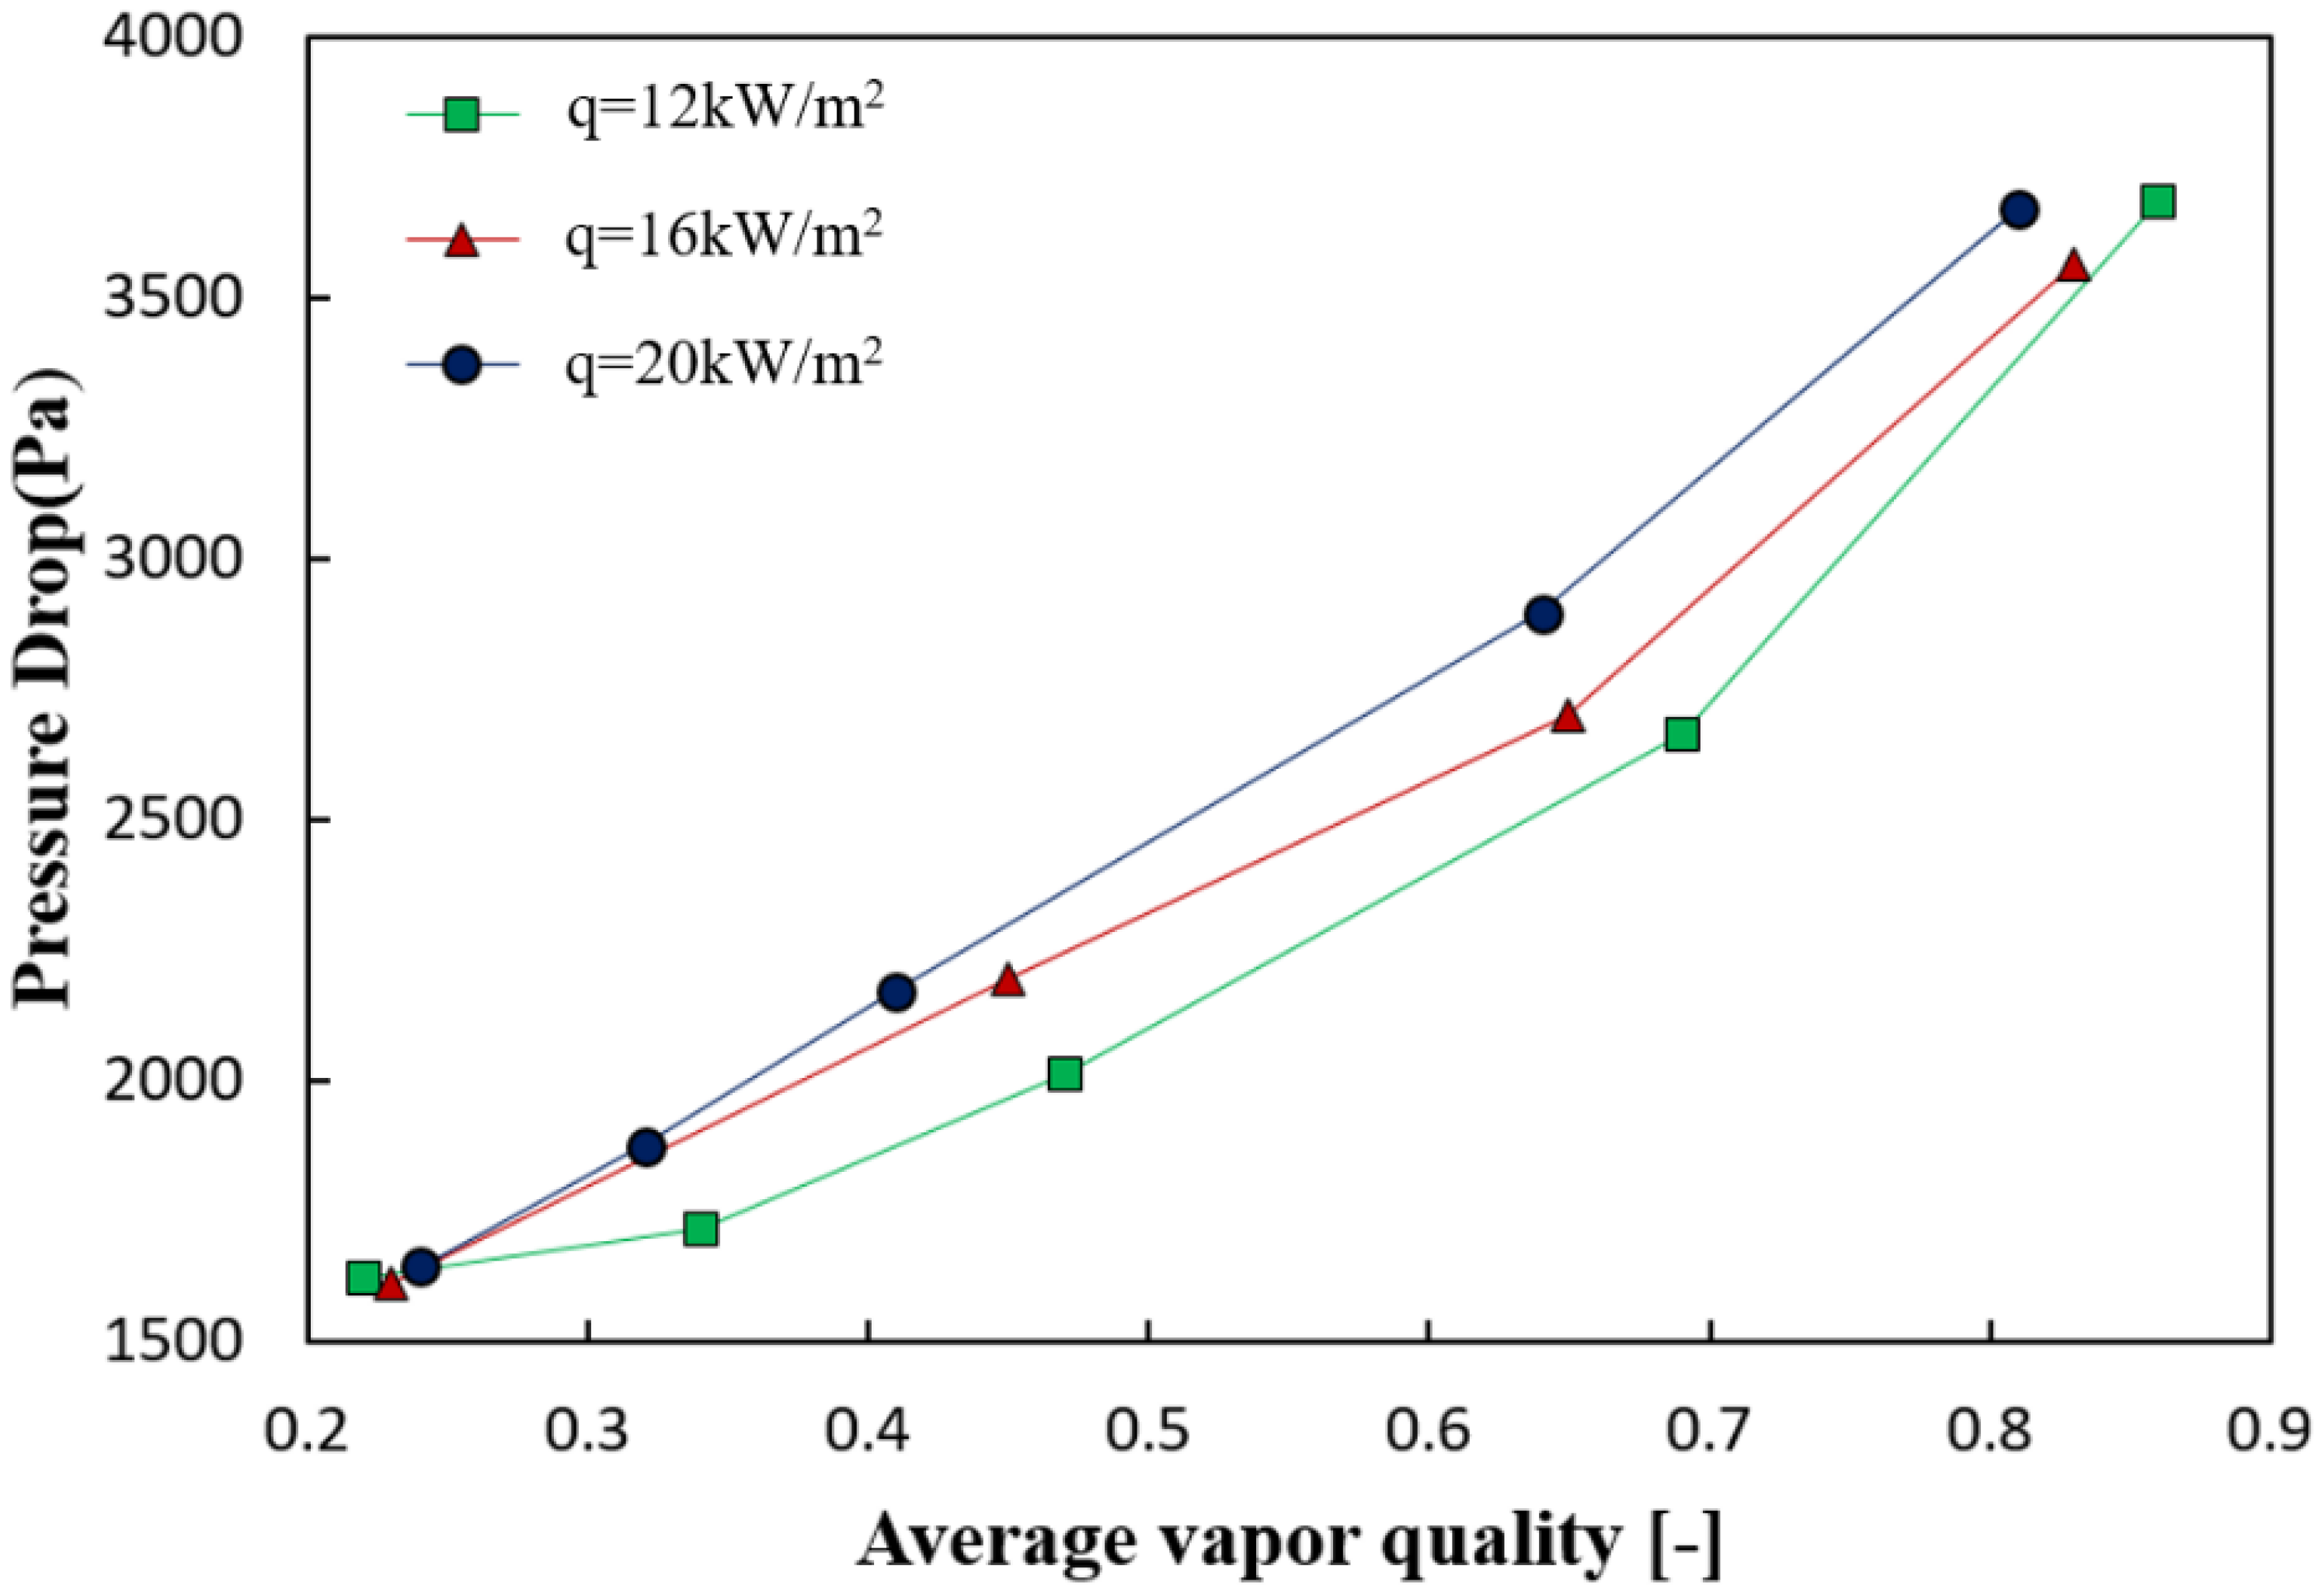
- The pressure drop in the test section tended to increase as the vapor quality increased, and the increment increased as the vapor became dominant.
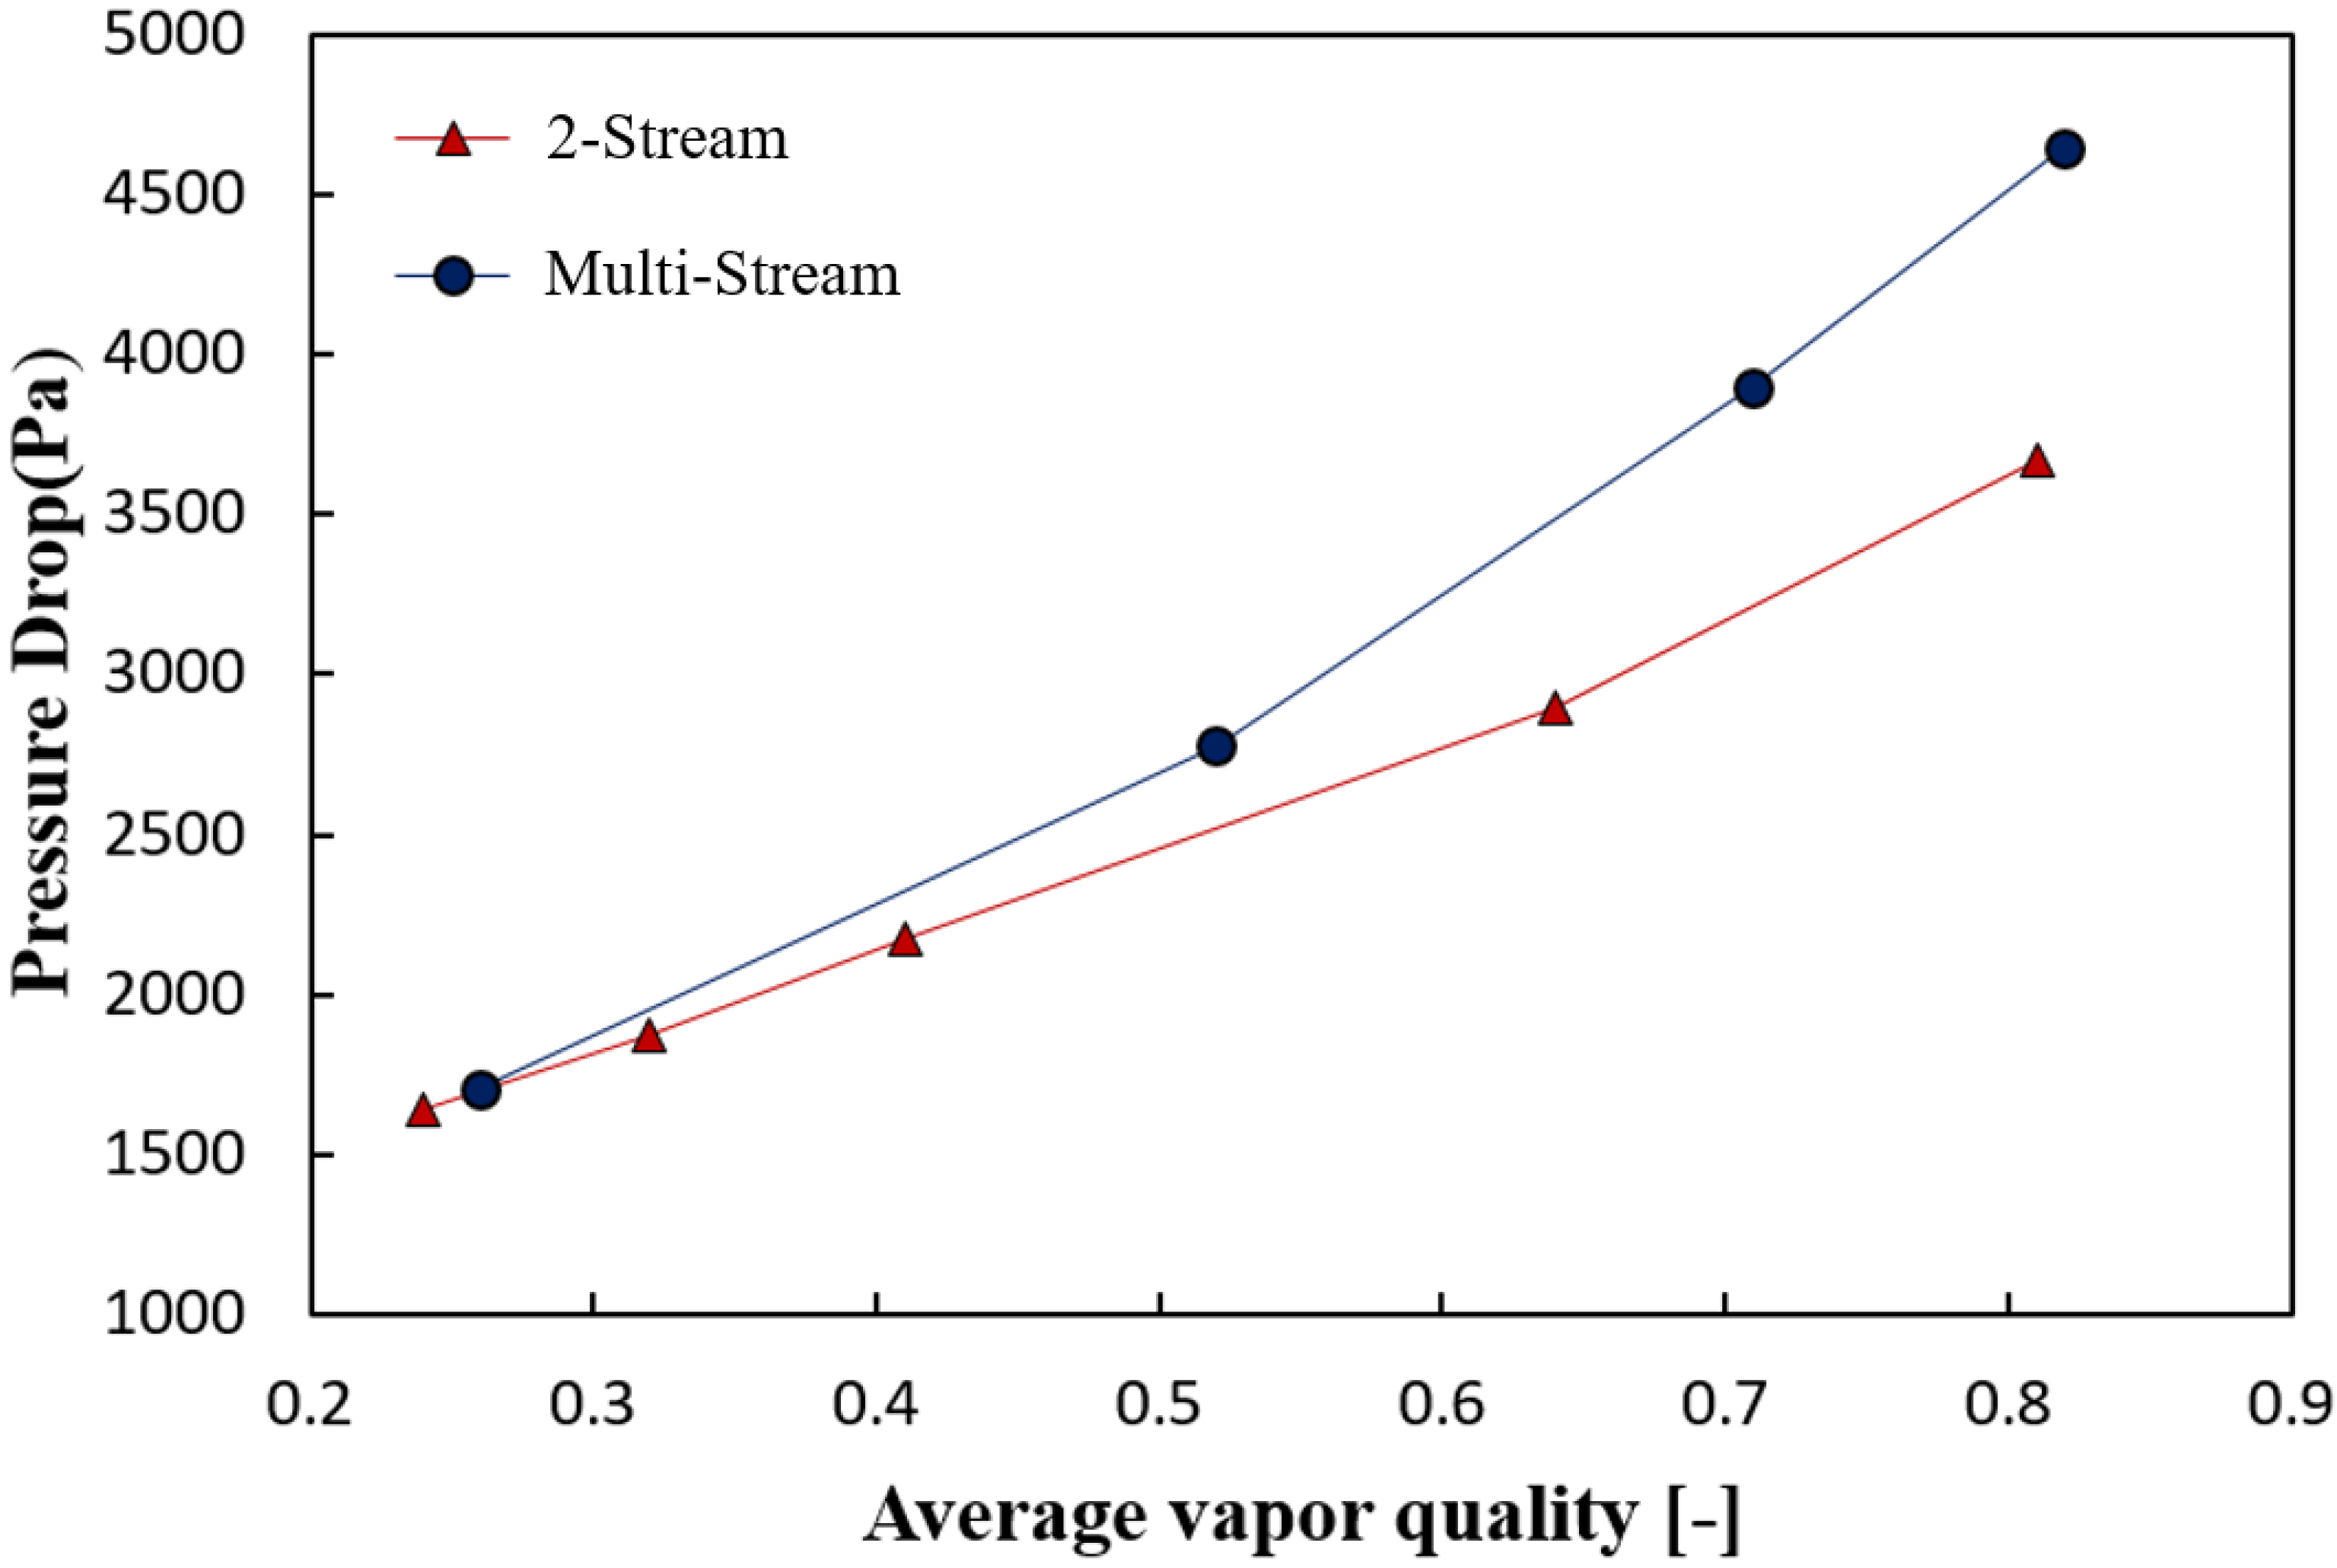
- The multi-stream PFHE comprises an additional heat transfer surface. Having one more heat transfer surface for the multi-stream PFHE at the top side can be associated with the active formation of droplets. Therefore, the condensation HTC in the multi-steam PFHE can be increased. For the same reason, the average pressure drop in the multi-stream is 15% more than that of the two-stream PFHE.
Author Contributions
Funding
Institutional Review Board Statement
Informed Consent Statement
Acknowledgments
Conflicts of Interest
Glossary
| Nomenclature | |
| A | Area [m2] |
| C1 | Wilson plot coefficient in Equation (4) [-] |
| C2 | Wilson plot coefficient in Equation (5) [-] |
| Cp | Specific heat capacity [J/kg∙K] |
| Dh | Hydraulic diameter [m] |
| Mass flux [kg/m2∙s] | |
| HTC | Heat transfer coefficient [W/m2∙K] |
| h | Condensation or convection heat transfer coefficient [W/m2∙K] |
| k | Thermal conductivity [W/m∙K] |
| Mass flow rate [kg/s] | |
| n | Wilson plot coefficient in Equation (3) [-] |
| Nu | Nusselt number [-] |
| Pr | Prandtl number [-] |
| Q | Heat transfer rate [W] |
| R | Thermal resistance [K/W] |
| Re | Reynolds number [-] |
| T | Temperature [K] |
| t | Thickness [m] |
| U | Overall heat transfer coefficient [W/m2∙K] |
| x | Vapor quality [-] |
| Viscosity [Pa∙s] | |
| Density [kg/m3] | |
| Fin efficiency [-] | |
| Subscripts | |
| AB | Between A and B |
| BC | Between B and C |
| AC | Between A and C |
| c | Cool side |
| cond | Conduction |
| eq | Equivalent |
| f | Fins |
| h | Hot side |
| i | Inlet |
| l | Liquid |
| LMTD | Logarithmic Mean Temperature Difference |
| o | Outlet |
| ov | Overall |
| p | Primary |
| t | Tube |
| w | Water side |
References
- Carey, V.P. Two-phase flow in small-scale ribbed and finned passages for compact evaporators and condensers. Nucl. Eng. Des. 1993, 141, 249–268. [Google Scholar] [CrossRef]
- Kew, P.A.; Cornwell, K. Correlations for the prediction of boiling heat transfer in small-diameter channels. Appl. Therm. Eng. 1997, 17, 705–715. [Google Scholar] [CrossRef]
- Jige, D.; Sugihara, K.; Inoue, N. Evaporation heat transfer and flow characteristics of vertical upward flow in a plate-fin heat exchanger. Int. J. Refrig. 2021, in press. [Google Scholar] [CrossRef]
- Yoo, J.W.; Nam, C.W.; Yoon, S.H. Experimental study of propane condensation heat transfer and pressure drop in semicircular channel printed circuit heat exchanger. Int. J. Heat Mass Transf. 2022, 182, 121939. [Google Scholar] [CrossRef]
- Amaranatha Raju, M.; Ashok Babu, T.P.; Ranganayakulu, C. Investigation of flow boiling heat transfer and pressure drop of R134a in a rectangular channel with wavy fin. Int. J. Therm. Sci. 2020, 147, 106055. [Google Scholar] [CrossRef]
- Sakamatapan, K.; Kaew-On, J.; Dalkilic, A.S.; Mahian, O.; Wongwises, S. Condensation heat transfer characteristics of R-134a flowing inside the multiport minichannels. Int. J. Heat Mass Transf. 2013, 64, 976–985. [Google Scholar] [CrossRef]
- Yan, Y.-Y.; Lio, H.-C.; Lin, T.-F. Condensation heat transfer and pressure drop of refrigerant R-134a in a plate heat exchanger. Int. J. Heat Mass Transf. 1999, 42, 993–1006. [Google Scholar] [CrossRef]
- Aliabadi, M.K.; Hormozi, F. Performance analysis of plate-fin heat exchangers: Different fin configurations and coolants. J. Thermophys. Heat Transf. 2013, 27, 515–525. [Google Scholar] [CrossRef]
- Koestoer, R.A.; Novianto, S.; Pamitran, A.S. Heat transfer of single phase flow with natural refrigerant (R-290) in microchannel. AIP Conf. Proc. 2019, 2062, 020058. [Google Scholar] [CrossRef]
- Taler, D.; Taler, J. Simple heat transfer correlations for turbulent tube flow. E3S Web Conf. 2017, 13, 1–7. [Google Scholar] [CrossRef] [Green Version]
- Khan, M.S.; Zou, R.; Yu, A. Computational simulation of air-side heat transfer and pressure drop performance in staggered mannered twisted oval tube bundle operating in crossflow. Int. J. Therm. Sci. 2021, 161, 106748. [Google Scholar] [CrossRef]
- Lim, J.; Song, K.S.; Kim, D.; Lee, D.C.; Kim, Y. Condensation heat transfer characteristics of R245fa in a shell and plate heat exchanger for high-temperature heat pumps. Int. J. Heat Mass Transf. 2018, 127, 730–739. [Google Scholar] [CrossRef]
- Hao, J.H.; Chen, Q.; Ren, J.X.; Zhang, M.Q.; Ai, J. An experimental study on the offset-strip fin geometry optimization of a plate-fin heat exchanger based on the heat current model. Appl. Therm. Eng. 2019, 154, 111–119. [Google Scholar] [CrossRef]
- Hornyik, K. Heat Exchangers-Thermal-Hydraulic Fundamentals and Design. Nucl. Technol. 1982, 58, 556. [Google Scholar] [CrossRef]
- Guo, K.; Zhang, N.; Smith, R. Design optimisation of multi-stream plate fin heat exchangers with multiple fin types. Appl. Therm. Eng. 2018, 131, 30–40. [Google Scholar] [CrossRef] [Green Version]
- Zohuri, B. Compact Heat Exchangers Design for the Process Industry. In Compact Heat Exchangers; Springer International Publishing: Cham, Switzerland, 2017; pp. 57–185. ISBN 9789896540821. [Google Scholar]
- Taylor, M.A. Plate-Fin Heat Exchangers: Guide to Their Specification and Use; Heat Transfer and Fluid Flow Services: Amersham, UK, 1987. [Google Scholar]
- Prasad, B.S.V. Fin efficiency and mechanisms of heat exchange through fins in multi-stream plate-fin heat exchangers: Formulation. Int. J. Heat Mass Transf. 1996, 39, 419–428. [Google Scholar] [CrossRef]
- Prasad, B.S.V. Fin efficiency and mechanisms of heat exchange through fins in multi-stream plate-fin heat exchangers: Development and application of a rating algorithm. Int. J. Heat Mass Transf. 1997, 40, 4279–4288. [Google Scholar] [CrossRef]
- Sunden, B. Design Methodology for Multistream Plate-Fin Heat Exchangers in Heat Exchanger Networks. Heat Transf. Eng. 2001, 22, 3–11. [Google Scholar] [CrossRef]
- Kays, W.M.; London, A.L. Compact Heat Exchangers; McGraw-Hill: New York, NY, USA, 1984. [Google Scholar]
- Picon-Nuñez, M.; Polley, G.T.; Torres-Reyes, E.; Gallegos-Muñoz, A. Surface selection and design of plate–fin heat exchangers. Appl. Therm. Eng. 1999, 19, 917–931. [Google Scholar] [CrossRef]
- Ramezanpour Jirandeh, R.; Ghazi, M.; Sotoodeh, A.F.; Nikian, M. Plate-fin heat exchanger network modeling, design and optimization—A novel and comprehensive algorithm. J. Eng. Des. Technol. 2021, 19, 1017–1043. [Google Scholar] [CrossRef]
- Fernández-Seara, J.; Uhía, F.J.; Sieres, J.; Campo, A. A general review of the Wilson plot method and its modifications to determine convection coefficients in heat exchange devices. Appl. Therm. Eng. 2007, 27, 2745–2757. [Google Scholar] [CrossRef] [Green Version]
- Fernández-Seara, J.; Uhía, F.J.; Sieres, J.; Campo, A. Experimental apparatus for measuring heat transfer coefficients by the Wilson plot method. Eur. J. Phys. 2005, 26. [Google Scholar] [CrossRef]
- Fernández-Seara, J.; Uhía, F.J.; Sieres, J. Laboratory practices with the wilson plot method. Exp. Heat Transf. 2007, 20, 123–135. [Google Scholar] [CrossRef]
- Akers, W.W.; Deans, H.A.; Crosser, O.K. Condensing heat transfer within horizontal tubes. Chem. Eng. Progr. 1958, 54, 171–176. [Google Scholar]
- Zhang, J.; Kærn, M.R.; Ommen, T.; Elmegaard, B.; Haglind, F. Condensation heat transfer and pressure drop characteristics of R134a, R1234ze(E), R245fa and R1233zd(E) in a plate heat exchanger. Int. J. Heat Mass Transf. 2019, 128, 136–149. [Google Scholar] [CrossRef]
- Goss, G.; Passos, J.C. Heat transfer during the condensation of R134a inside eight parallel microchannels. Int. J. Heat Mass Transf. 2013, 59, 9–19. [Google Scholar] [CrossRef]
- Jassim, E.W.; Newell, T.A.; Chato, J.C. Refrigerant pressure drop in chevron and bumpy style flat plate heat exchangers. Exp. Therm. Fluid Sci. 2006, 30, 213–222. [Google Scholar] [CrossRef]
- Shin, J.S.; Kim, M.H. An Experimental Study of Flow Condensation Heat Transfer Inside Circular and Rectangular Mini-Channels. Heat Transf. Eng. 2005, 26, 36–44. [Google Scholar] [CrossRef]
- Yang, C.Y.; Webb, R.L. Condensation of R-12 in small hydraulic diameter extruded aluminum tubes with and without micro-fins. Int. J. Heat Mass Transf. 1996, 39, 791–800. [Google Scholar] [CrossRef]
- Soliman, M.; Schuster, J.R.; Berenson, P.J. A General Heat Transfer Correlation for Annular Flow Condensation. J. Heat Transfer 1968, 90, 267–274. [Google Scholar] [CrossRef]
- Charnay, R.; Bonjour, J.; Revellin, R. Experimental investigation of R-245fa flow boiling in minichannels at high saturation temperatures: Flow patterns and flow pattern maps. Int. J. Heat Fluid Flow 2014, 46, 1–16. [Google Scholar] [CrossRef]
- Rahman, M.M.; Kariya, K.; Miyara, A. An experimental study and development of new correlation for condensation heat transfer coefficient of refrigerant inside a multiport minichannel with and without fins. Int. J. Heat Mass Transf. 2018, 116, 50–60. [Google Scholar] [CrossRef]
- Tao, X.; Infante Ferreira, C.A. Heat transfer and frictional pressure drop during condensation in plate heat exchangers: Assessment of correlations and a new method. Int. J. Heat Mass Transf. 2019, 135, 996–1012. [Google Scholar] [CrossRef]
- Bohdal, T.; Charun, H.; Sikora, M. Heat transfer during condensation of refrigerants in tubular minichannels. Arch. Thermodyn. 2012, 33, 3–22. [Google Scholar] [CrossRef]


| Parameters | Mark | Value |
|---|---|---|
| PFHE height (mm) | H | 66.18 |
| PFHE length (mm) | L | 244 |
| PFHE width (mm) | W | 124 |
| Effective length (mm) | Leff | 80 |
| Effective width (mm) | Weff | 40 |
| Staking pattern | n/a | C–A–B–A–B–C |
| Fin type | n/a | Plain fin |
| Fin hydraulic diameter (mm) | Dh | 1.47 |
| Fin height (mm) | Hf | 6.4 |
| Fin thickness (mm) | tf | 0.5 |
| Fin frequency (Fin Per Inch) | n/a | 19 |
| Flow path width (mm) | Wf | 0.84 |
| Parameter | Experiment Condition |
|---|---|
| Pressure (Model PSC, Sensys) | ±0.25% F.S |
| Temperature (PT-100) | ±0.25 ℃ |
| Water flow rate (Turbine flowmeter, Corea Flow) | ±1.0% F.S |
| Heat flux (Electric heater) | ±3.0% Reading |
| Heat transfer rate (Calculated) | ±6% |
| Heat transfer coefficient (Calculated) | ±10% |
| Parameter | Experiment Condition |
|---|---|
| Quality (average of inlet and outlet) | 0.2~0.9 |
| Mass flux | 70~130 kg/m2s |
| Heat flux | 12~20 kW/m2 |
| Saturation pressure | 1.08~1.27 MPa [abs] |
Publisher’s Note: MDPI stays neutral with regard to jurisdictional claims in published maps and institutional affiliations. |
© 2021 by the authors. Licensee MDPI, Basel, Switzerland. This article is an open access article distributed under the terms and conditions of the Creative Commons Attribution (CC BY) license (https://creativecommons.org/licenses/by/4.0/).
Share and Cite
Seol, S.-H.; Lee, S.-G.; Son, C.-H.; Yoon, J.-H.; Eom, I.-S.; Park, Y.-M.; Yoon, J.-I. Effects of Experimental Parameters on Condensation Heat Transfer in Plate Fin Heat Exchanger. Energies 2021, 14, 7681. https://doi.org/10.3390/en14227681
Seol S-H, Lee S-G, Son C-H, Yoon J-H, Eom I-S, Park Y-M, Yoon J-I. Effects of Experimental Parameters on Condensation Heat Transfer in Plate Fin Heat Exchanger. Energies. 2021; 14(22):7681. https://doi.org/10.3390/en14227681
Chicago/Turabian StyleSeol, Sung-Hoon, Sun-Geun Lee, Chang-Hyo Son, Ji-Hoon Yoon, In-Seob Eom, Young-Min Park, and Jung-In Yoon. 2021. "Effects of Experimental Parameters on Condensation Heat Transfer in Plate Fin Heat Exchanger" Energies 14, no. 22: 7681. https://doi.org/10.3390/en14227681
APA StyleSeol, S.-H., Lee, S.-G., Son, C.-H., Yoon, J.-H., Eom, I.-S., Park, Y.-M., & Yoon, J.-I. (2021). Effects of Experimental Parameters on Condensation Heat Transfer in Plate Fin Heat Exchanger. Energies, 14(22), 7681. https://doi.org/10.3390/en14227681