Article

Simulation of Coupled Power and Gas Systems with Hydrogen-Enriched Natural Gas

1
IEK-10: Energy Systems Engineering, Institute of Energy and Climate Research, Forschungszentrum Jülich, 52428 Jülich, Germany
2
Faculty of Mechanical Engineering, RWTH Aachen University, 52062 Aachen, Germany
*
Author to whom correspondence should be addressed.
Energies 2021, 14(22), 7680; https://doi.org/10.3390/en14227680
Submission received: 10 October 2021 / Revised: 9 November 2021 / Accepted: 13 November 2021 / Published: 16 November 2021
(This article belongs to the Special Issue Progress in Power-to-Gas Energy Systems)

Abstract

:
Due to the increasing share of renewable energy sources in the electrical network, the focus on decarbonization has extended into other energy sectors. The gas sector is of special interest because it can offer seasonal storage capacity and additional flexibility to the electricity sector. In this paper, we present a new simulation method designed for hydrogen-enriched natural gas network simulation. It can handle different gas compositions and is thus able to accurately analyze the impact of hydrogen injections into natural gas pipelines. After describing the newly defined simulation method, we demonstrate how the simulation tool can be used to analyze a hydrogen-enriched gas pipeline network. An exemplary co-simulation of coupled power and gas networks shows that hydrogen injections are severely constrained by the gas pipeline network, highlighting the importance and necessity of considering different gas compositions in the simulation.

1. Introduction

The mitigation of climate change requires the rapid decarbonization of all sectors [1]. In recent decades, great progress has been made in the electricity sector by increasing the share of renewable energies [2]. The decarbonization process, however, is not exclusively limited to the electrical energy sector. The focus is therefore now shifting to other sectors, for example, industry and transport, in order to reach the Paris goals on climate change. In the past, different energy sectors mainly operated separately or independently. However, with the increasing use of inter-sectoral flexibility options, different energy sectors are set to be coupled more closely and should therefore be analyzed as a whole [3,4]. An integrated assessment of the electricity and gas sectors is therefore particularly important. In this paper, we establish a simulation tool framework that is capable of solving hydrogen-enriched natural gas flow simulation problems.

1.1. The Role of Natural Gas (NG) in Future Energy Systems

Natural gas is an important energy carrier used to generate heat or electricity. In 2019, 10.2% of the total electricity consumption in Germany was covered by natural gas-based generation [5]. In 2020, natural gas storage in Germany amounted to around 23.9 billion cubic meters, which corresponds to roughly 250 TWh of energy [6]. Due to the increasing share of renewable power generation, long-term storage with power-to-gas (PtG) will most likely become necessary and cost-efficient [7]. The gas sector therefore has great potential to provide enormous storage capacity for the power network. Moreover, PtG technologies can provide flexibility to the electrical network [8]. The conversion of electrical energy into chemical energy is an essential part of every PtG technology and is achieved using water electrolysis [9]. In addition to the impacts on the power sector, hydrogen generated from electrolysis can be a key factor in the decarbonization of heavy industries such as steel or chemistry [10].

1.2. Blending Hydrogen into Existing NG Infrastructure

Hydrogen generated using electrolysis can either be directly stored or be transported using pipeline network systems. It can also be further converted into methane using methanation reactions. In order to predominantly utilize the existing gas transmission infrastructure, the feasibility of blending hydrogen into the natural gas network is being intensively investigated [11]. Due to different infrastructure states and regulations, the maximum permitted levels of hydrogen concentration in the natural gas transmission system vary from country to country [12]. German regulations currently allow for up to 10% hydrogen concentration in the natural gas network. In the future, up to 20% is planned, and the German Technical and Scientific Association for Gas and Water (DVGW) estimates that up to 50% hydrogen concentration is feasible [13]. In a recent study, the impact of higher and fluctuating hydrogen concentrations of up to 50% on a variety of industrial combustion systems was investigated [14]. Therefore, in order to simulate future gas networks with uncertain hydrogen concentrations, it is important to take gas mixture properties into consideration.

1.3. Simulation of Hydrogen-Enriched NG Network

Natural gas is typically a mixture of gases, in which the major component is methane. Depending on sources and locations, the compositions of natural gas can vary significantly. In the study [15], it is stated that only around 23% of industrial plants have a real-time natural gas mixture quality measurement, while more than 50% of them only have weekly or monthly data available. In addition, more than 70% of the customers suffer from poor natural gas supply quality about once a month [15]. Natural gas composition must therefore be considered as a factor that has a significant impact on network operation safety. However, in many publications such as [16,17], the properties of natural gas are not listed, which makes it difficult to reproduce their results. When considering the injection of hydrogen into the natural gas network, the impact of gas composition is even greater.
Several research studies were carried out with respect to the steady-state simulation methods for hydrogen-enriched natural gas networks. For example, Abdolahi et al. used several equations of state (EOS) to model the natural gas mixture, whereas the heating values were not considered [18]. In the work by Giulio et al., an analysis was performed to evaluate the gas heating values with respect to the hydrogen injection into the natural gas pipelines, while the impact of the gas mixture properties on the gas flow calculation was not the main focus [19]. Pellegrino et al. established a simulation framework for the hydrogen-enriched natural gas network using the virial EOS (cf. [20]), but the height difference between the pipeline inlet and outlet was not considered [21].
In addition, there are a number of tools available that can be used to analyze the hydrogen-enriched natural gas network. PSS®SINCAL (cf. [22]), SAInt (cf. [23]), and MYNTS (cf. [24]), for example, are well established tools that are capable to run complex simulations for gas pipeline networks. Nevertheless, they are closed-source software and therefore hard to extend with functionalities for the specific requirements of analysis. TransiEnt is a Modelica library that is capable of steady-state and dynamic simulations of coupled-power, gas, and heat networks [25]. However, it is currently only supported in Dymola, which is a commercial software development environment for Modelica. There is a relatively new Python package—so-called pandapipes—that can handle different gas mixture properties for gas network simulation. The nodal difference of gas mixture compositions, however, has not yet been considered [26].

2. Modeling of Gas Pipeline Systems

2.1. Modeling of Gas Pipelines

A gas network typically consists of pipelines, compressor stations, valves, and regulator stations. For simulation purposes, a number of additional virtual components are necessary, for example, short pipes and fictitious resistances. However, the working principle of these components is similar to that of normal pipelines. As the pipeline is the dominant component in a gas network, the modeling of pipelines is explained in detail in this section.
Steady-state gas flows can be calculated using pipeline equations. There are several pipeline equations that can be used to calculate volumetric gas flow rates, although they are mostly derived from the isothermal Euler equation (Equation (1), cf. [27,28]).
d p d x f 2 D ρ v | v | ρ g sin θ = 0
After calculating the integral and substituting the constant parameters with real values, the steady-state volumetric flow rate in a pipeline can be calculated as in Equation (2) (cf. [16,29]). Unless stated otherwise, the gas volumetric flow rates will be converted to the ones under standard reference conditions of 15 °C (288.15 K) and 1 bar (101,325 Pa), which correspond to T s t and P s t in the pipeline equation [30]. The unit of the standardized volumetric flow rate is sm 3 / s .
Q = C T s t P s t D 2.5 η | P i 2 P j 2 E | L G T a Z f 0.5
where C = π R 16 M a i r is a constant, which is around 13.29, D is the pipe diameter, η is the pipe efficiency, f is the friction factor, G is the gas specific gravity, L is the pipe length, P s t is the reference pressure, P i is the inlet pressure, P j is the outlet pressure, Q is the volumetric flow rate, T a is the average temperature, T s t is the reference temperature, and Z is the compressibility factor. In Equation (2), E represents the potential
E = 0.06843 G ( H j H i ) P a 2 T a Z
where H i and H j are the inlet and outlet height, respectively. The average pressure P a and average temperature T a can be calculated using the following formulas (cf. [16]):
P a = 2 3 P i + P j P i P j P i + P j
T a = T s + T i T j ln T i T s T j T s
The friction factor is a very important variable for calculating gas flow rates. There are various ways to calculate the pipeline friction factor that involve different levels of computational complexity and accuracy. However, the friction factor does not change significantly in the fully turbulent zone [31], which is also the case in this paper. Because the actual friction factor needs to be calculated or calibrated using pipeline efficiency, this paper uses the simplest method for pipeline friction, which is only related to the pipeline diameter D (cf. [16,29]).
f = 0.093902 D 1 3
η is the efficiency of the pipe to convert the theoretical friction factor into an actual one, taking other sources of friction into account, for example, valves and tees. The aging of the pipeline and corrosion or rust inside also contribute additional friction to the gas transmission system. Therefore, the real gas flow rate in a pipe is generally lower than the one calculated by flow equations where η = 1 . To account for such extra flow reductions, the efficiency factor η is usually chosen between 0.75 and 0.95, while experience shows that for an old pipeline it can be reduced to lower than 0.7 [32]. However, Mohitpour et al. suggested η values between 0.92 and 0.97, which are much higher than the ones mentioned above (cf. [33]). In principle, η should be chosen according to actual gas network pipelines. In the remaining part of this paper, all pipeline friction factors are set to 0.85, which is a good assumption for a common pipeline operating status.
By reviewing Equation (2), it can be seen that most constants are preset pipeline parameters. It therefore can be simplified further using algebraic transformations, as shown below in Equation (7):
Q = C p i p e | P i 2 P j 2 E | G Z 0.5
where C p i p e reflects constants and pipeline parameters
C p i p e = C T b P b D 2.5 η 1 L T a f 0.5
Typically, as shown in Equation (2), pipeline network simulations are based on volumetric flow rate conservation, which means the sum of all gas volumetric flows injected into or flowing out of one node equals zero. However, considering variant gas compositions in pipelines makes this assumption invalid. To deal with this issue, mass flow conservation is adopted in this work.

2.2. Thermal Formulation

Temperature is another important state variable in a gas network simulation. To calculate the temperature profile alongside a gas pipeline, an extra equation based on the first law of thermodynamics is needed (Equation (9), cf. [27,28]):
Q m d h + v 2 2 d x + U l ( T T s ) π D + Q m g sin θ = 0
where Q m is the gas mass flow rate, h is its specific enthalpy, v is the velocity of gas flow, U l is the heat transfer coefficient of the pipeline, g is the gravitational acceleration, and sin θ = H j H i L .
When considering a steady-state simulation, the change of velocity can be ignored ( d v d x = 0 ). By further assuming the gas enthalpy as a function of pressure and temperature, the change of enthalpy d h can be rewritten as Equation (10) [27]:
d h = h T p d T + h p T d p
with h p T = T p h h T p , Equation (9) can be rewritten as Equation (11).
d T d x + μ J T d p d x + U l Q m c p ( T T s ) π D + g sin θ c p = 0
To simplify the calculation, here the potential energy term is ignored. By substituting d p d x with the help of Equations (1) and (2), Equation (11) can be written in the form of Equation (12) (cf. [16,21]):
d T d x = μ J T f Z s R Q m | Q m | 2 D P A 2 T + g sin α ρ U l π D Q m c p ( T T s )
After calculating the integral and simplification, the gas pipeline outlet temperature can then be calculated using the following equation:
T j = α α + β T s T s e ( α + β ) L + T i e ( α + β ) L
where α = U L Q m c p and β = μ J T Z R f Q m | Q m | 2 P a D A 2 .

2.3. Calculation of Gas Mixture Properties

As we can see in Equation (7), there are two properties that are directly related to the gas composition: the gas specific gravity G and the compressibility factor Z. For the purpose of simulating the gas network, these values are typically obtained using empirical models. In the case of the compressibility factor, for example, Papay’s equation [17,21] (Equation (14)) or AGA [34] (Equation (15)) are used, where p r = p / p c and T r = T / T c . These approaches are suitable when calculating the compressibility factor of typical natural gas. However, the critical point conditions ( p c and T c ) used in the formula are constants, assuming that the gas mixture properties do not change during network operation. However, this assumption is no longer valid when considering hydrogen blended into the natural gas network. Therefore, an automated calculation with variant gas composition is not possible using these empirical models.
z ( p , T ) = 1 3.52 p r e 2.26 T r + 0.247 p r 2 e 1.878 T r
z ( p , T ) = 1 + 0.257 p r 0.533 p r T r
Now consider the gas specific gravity and heating value of the gas mixture. According to the DVGW technical regulation [35], natural gas is defined as H-gas and L-gas with respect to its composition. The properties of these two types of gases are shown in Table 1. It can be seen that heating values and specific gravity vary considerably, which makes an accurate calculation more difficult. Therefore, a comprehensive gas mixture property calculation is used in this paper.
To calculate the gas mixture properties, the “thermo” python package is used [36]. The gas mixture properties are calculated using the Peng–Robinson EOS (PREOS) for a mixture of any number of compounds. The mathematical formulations can be found in the package repository or in the referenced literature [37,38].
The gas mixture heating values are calculated using another package named “Cantera” [39], based on the combustion data GRI-Mech 3.0 [40]. Limited to the available gas species data in this source, hydrocarbon species with over 3 carbon atoms (e.g., butane, pentane) are considered as methane in the heating value calculation.
H V = i R H i x i j P H j x j
It is first used to balance all the chemical reaction equations of complete combustion based on the composition of the gas mixture. The corresponding heating value (HV) can be subsequently calculated using Equation (16) (cf. [41]), where R is the set of all reactants (all gas species in the gas mixture and O2) and P represents all products. H stands for the enthalpy, and x is the mole fraction of a single gas species in R or P . In this paper, the higher heating value (HHV) of the gas mixture is used, which assumes all water content in the end product is in a liquid state.
The natural gas composition used in this work is listed in Table A1 [42].

2.4. Solution Flow

In this tool, a gas network is modeled as a set of nodes and pipelines. The network nodes are classified into three types: reference nodes, supply nodes, and demand nodes. For the reference nodes, pressures are known and gas flows need to be calculated to balance network demand. For supply nodes and demand nodes, the gas flows are known and pressures need to be calculated. The passive sign convention system is used in this tool, with negative flows representing supply and positive ones representing consumption.
The simulation method presented in this paper combines conventional pipeline equations with comprehensive modeling of gas mixture and utilizes the Newton–Raphson (NR) method to solve steady-state gas flow calculation problems iteratively. As can be seen in Figure 1, the first step of the NR method is the initialization of network variables, which in this case are the initial estimates of unknown nodal pressures. In an electrical power flow simulation, a “flat-start” initialization is typically applied. In contrast, the pressures at both ends of a pipeline must not be the same; otherwise, this will result in zero flow in the pipeline and thus a poorly conditioned Jacobian matrix. From experience, pressures at pipeline outlets are initialized as 0.98 of those at inlets. To avoid the duplicated assignment of initial estimates, the initialization algorithm assigns pipeline outlet pressures starting from reference nodes until each node has a pressure value. Based on the initial estimates, the physical properties of the gas mixture inside pipelines can be calculated. For each iteration step, the Jacobian matrix is updated, which is later used to calculate the state variables. Afterward, the new gas mixture composition and its properties are calculated. Since the approach presented here is aimed at solving the static flow problem, flows entering a node with different compositions are assumed to be completely mixed at the node. Therefore, the gas mixture composition in a pipeline is always considered to be the same as the one at its inlet. As long as the error after one iteration step is bigger than the set tolerance, the program iterates over to set pressures to the nodes and simultaneously updates the gas mixture properties to be used for the pipelines. If the error remains within the tolerance, the simulation has converged and results are saved.

3. Simulation and Results

3.1. Study Case 1: Impacts of Different Calculation Methods on a Single Pipeline with Variable Gas Mixture Composition

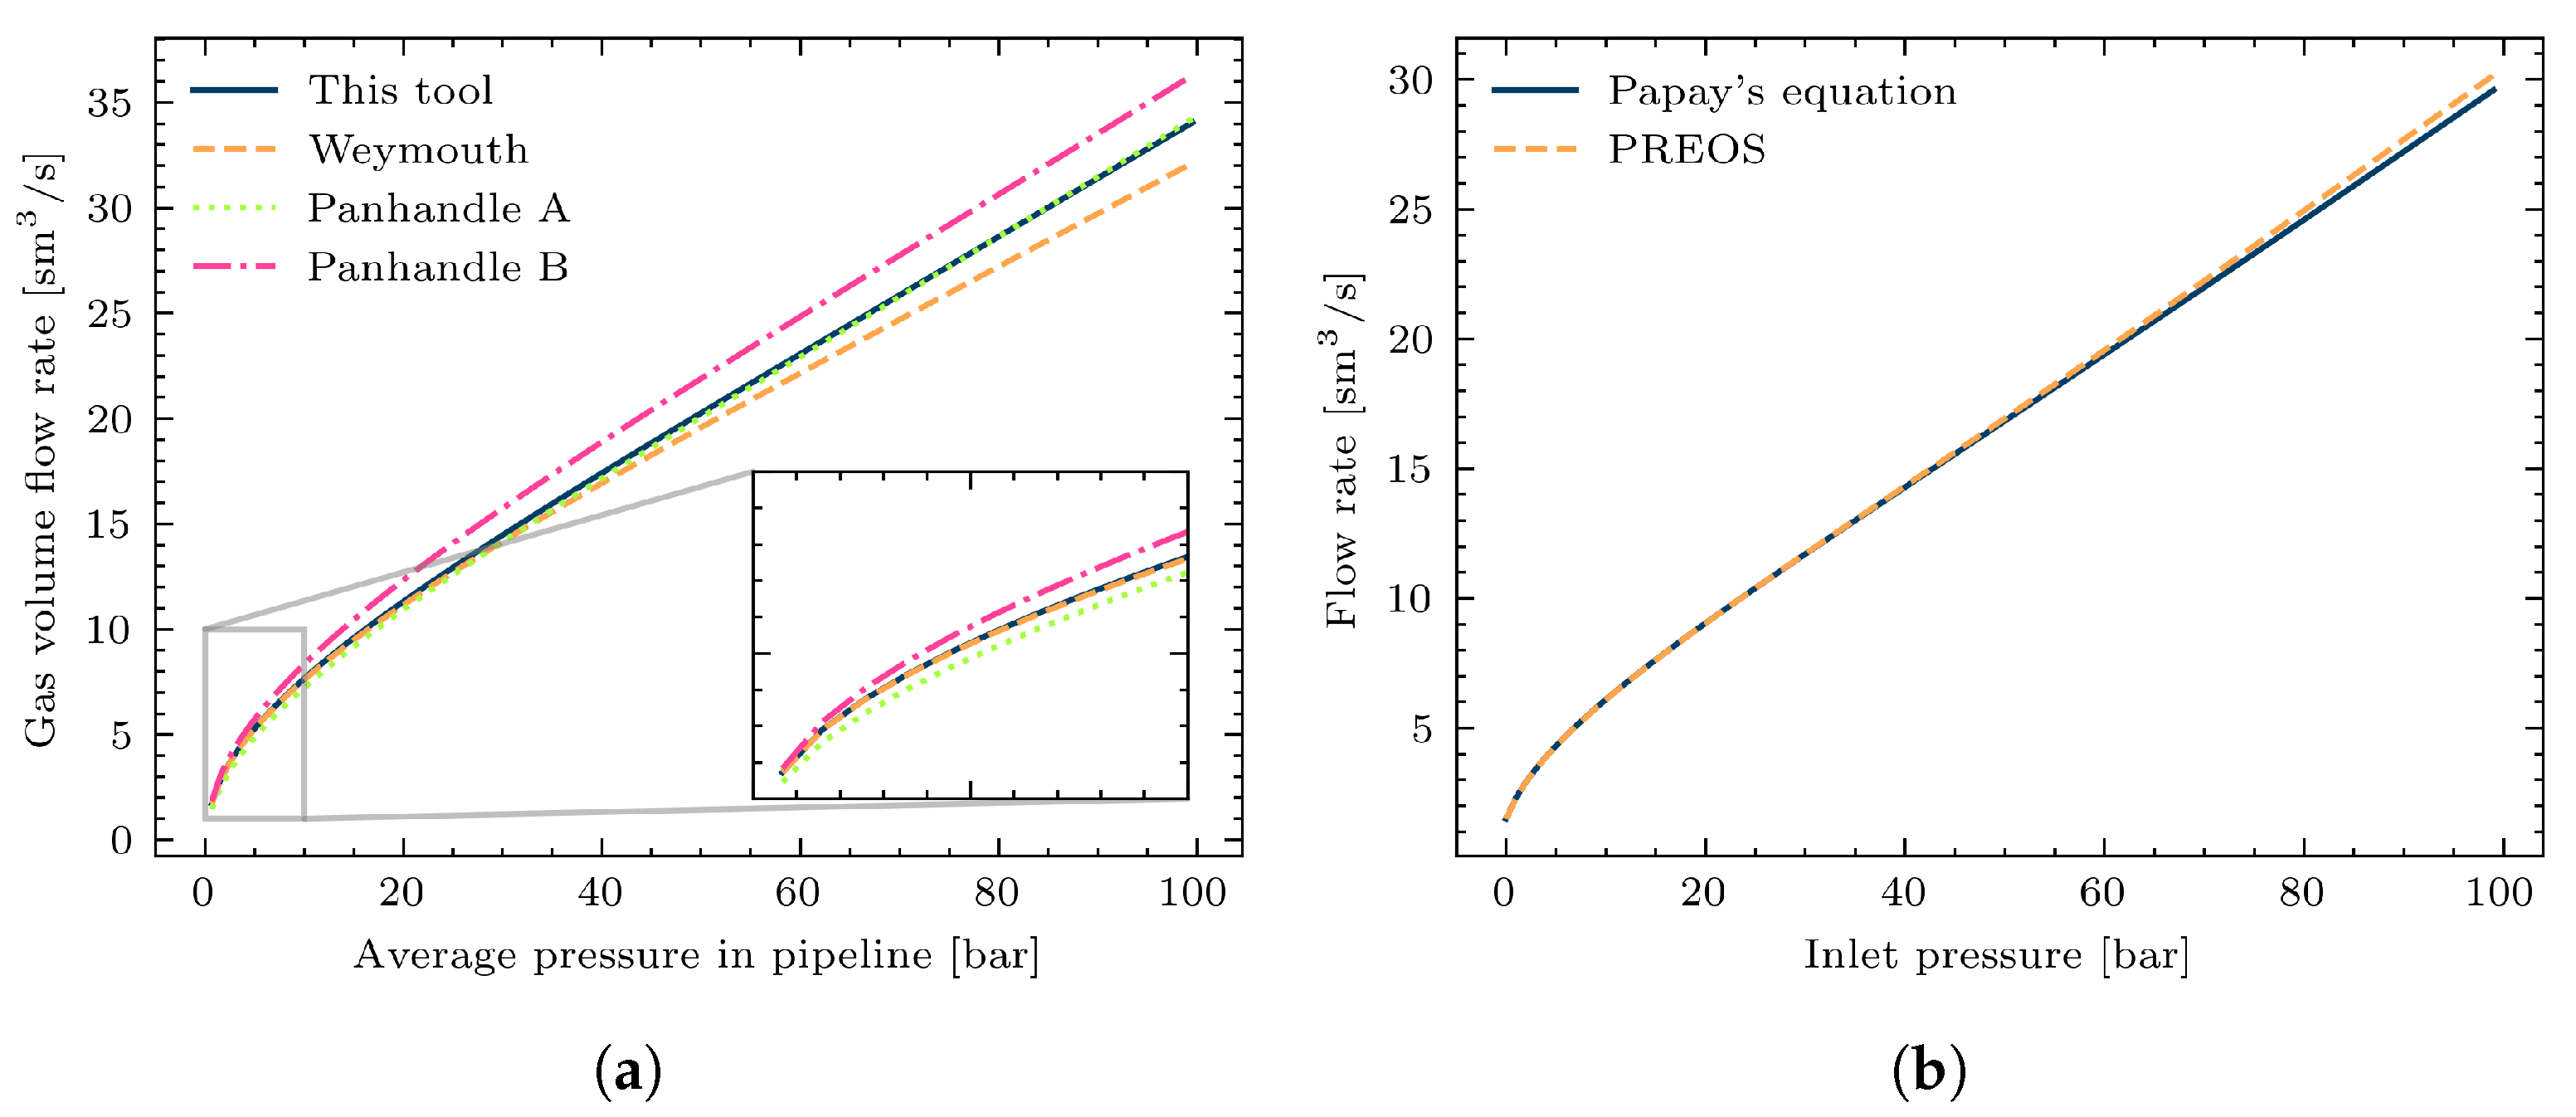
Since the pipeline is the dominant component in a gas network, in the first study case the simplest case is considered, which is the analysis of different gas compositions in one single pipeline. The main purpose of this study case is to stress the importance of taking the gas composition into account when performing a pipeline flow calculation with respect to hydrogen blended into natural gas. To achieve this, PREOS is used in this study to calculate the gas mixture properties, which is proved to be one of the most accurate methods to model the natural gas mixture [43]. Since the assumption made for Equation (6) is only valid for systems with higher pressures, only high-pressure gas pipelines are considered in this section. In Germany, the pressure level of high-pressure gas networks is defined as an operational range between 1 and 100 bar [44]. Therefore, in this paper, the analyzed pressure range is also set between 1 and 100 bar. As described in previous sections, multiple pipeline flow equations are available. A comparison of the most popular methods is shown in Figure 2a to give an overview of these different methods. It can be noted that at lower pressures (from 1 to 10 bar), the calculation results of different methods do not differ significantly. Within a higher pressure range (from 10 to 100 bar), the Panhandle B method tends to overestimate the flow rates, while the Weymouth method underestimates them. The flow rates calculated with the method used in this tool lie in the middle range of all analyzed methods, both in the lower pressure range and in the higher pressure range.
Typically, simulations of gas pipeline networks are based on constant gas properties, which is no longer accurate when the properties change significantly, for example, when the operation conditions deviate strongly from the nominal value or when complex systems with different gas mixtures are simulated. As shown in Figure 2b, a comparison between the Papay’s equation and the PREOS is made. The calculation results from these two alternatives appear to be quite similar. However, at a higher pressure, the calculated flow rates with Papay’s equation, which is based on constant critical conditions, are around 2% lower than those using PREOS which is a more accurate method for calculating gas properties.
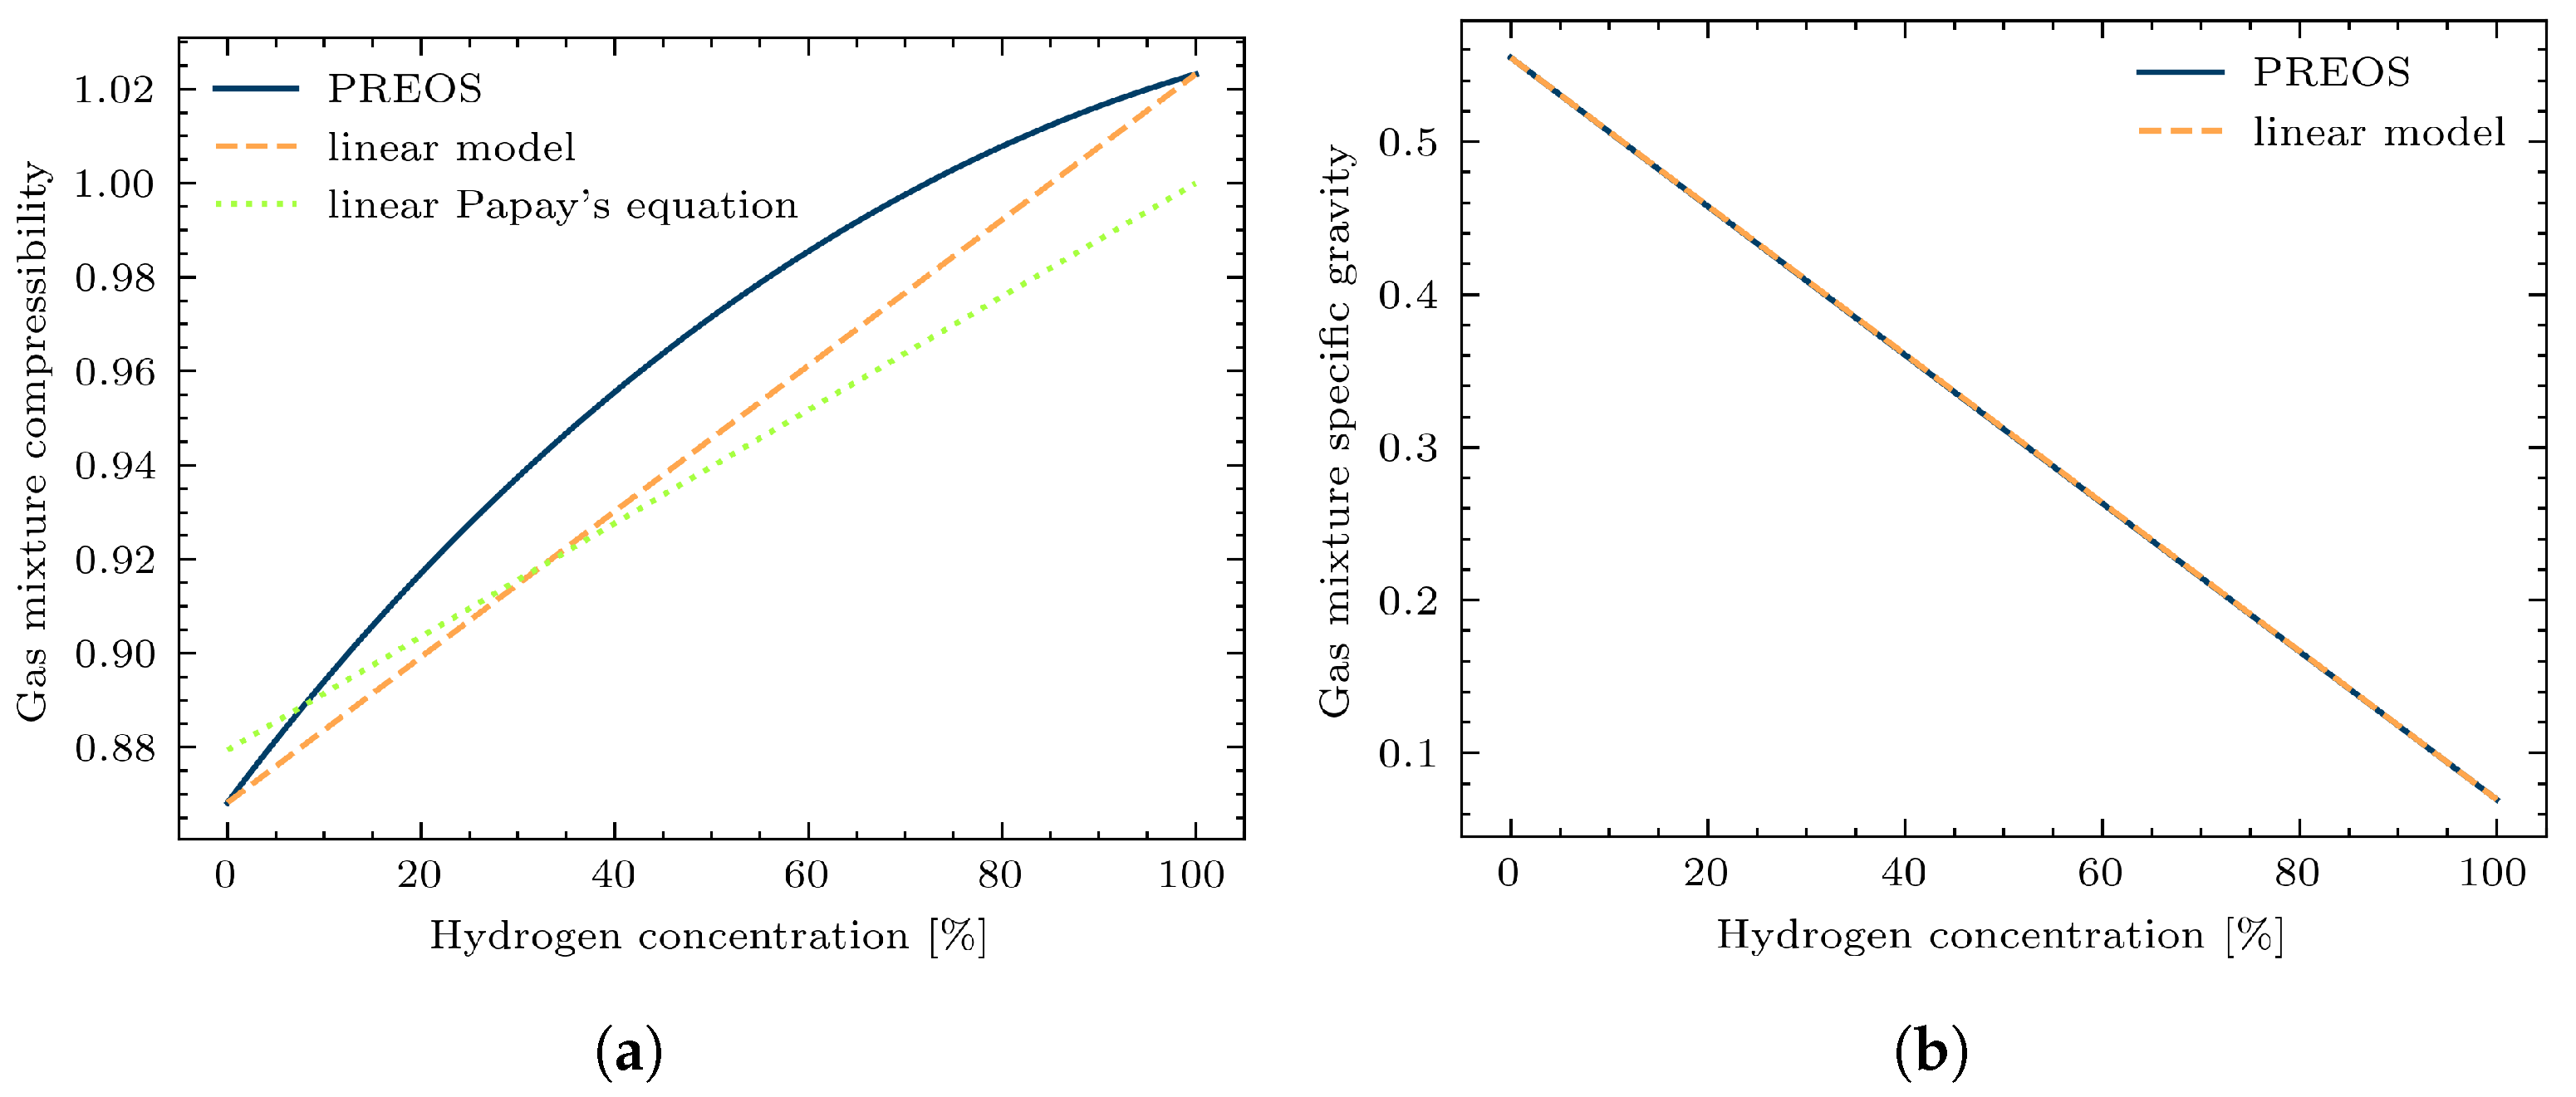
The pipeline transmission is generally restricted by the minimum and maximum permitted volumetric flow rates and the maximum permitted pressure. Therefore, it is important to investigate how the flow rate and pressure change when different gas compositions are applied to the pipeline. Now consider a binary gas mixture of CH4 and H2. The simplified pipeline equation (Equation (7)) shows that the gas flow rate is dependent on the compressibility factor Z and the specific gravity G of the gas mixture. As shown in Figure 3a, the gas compressibility factor increases in a non-linear fashion with increasing hydrogen concentration. If we consider a 20% hydrogen concentration in the gas mixture, the corresponding compressibility factor is around 2% greater than the one calculated with the linear mole fraction model. When using Papay’s equation, it is difficult to calculate the T c and P c of the gas mixture; thus, a simple linear mole fraction method is used. As shown in Figure 3a, at low hydrogen concentrations, this method works well, but when the hydrogen concentration is increased further, the error also becomes bigger. Obuba et al. showed that Papay’s method tends to underestimate the Z-factor [45], an observation that also corresponds to the results shown in this figure.
Turning now to the gas specific gravity G. As shown in Figure 3b, the gas-specific gravity is linearly related to the hydrogen concentration, and the calculation results obtained from using PREOS and the linear mole fraction model are nearly identical.
After analyzing the gas properties of gas mixtures with different hydrogen concentrations, the pipeline flow calculation results are shown here. In the practical gas network operation, the energy requirement of the demand side has to be met. Therefore, the actual gas flow rate may vary due to variations in the heating values of the gas mixture. In this study case, a constant energy demand at the pipeline outlet is assumed in order to analyze the pressure drops throughout the pipeline with respect to different hydrogen concentrations.
As shown in Figure 4, when considering a certain amount of energy demand, the pressure drop in the pipeline increases with increasing hydrogen concentration. At around 90% hydrogen concentration, however, there is a turning point in the pressure drop curve. Looking back to Equation (7) and Figure 3a, the reason for this turning point is that the increase of the compressibility factor Z slows down when the hydrogen concentration increases.
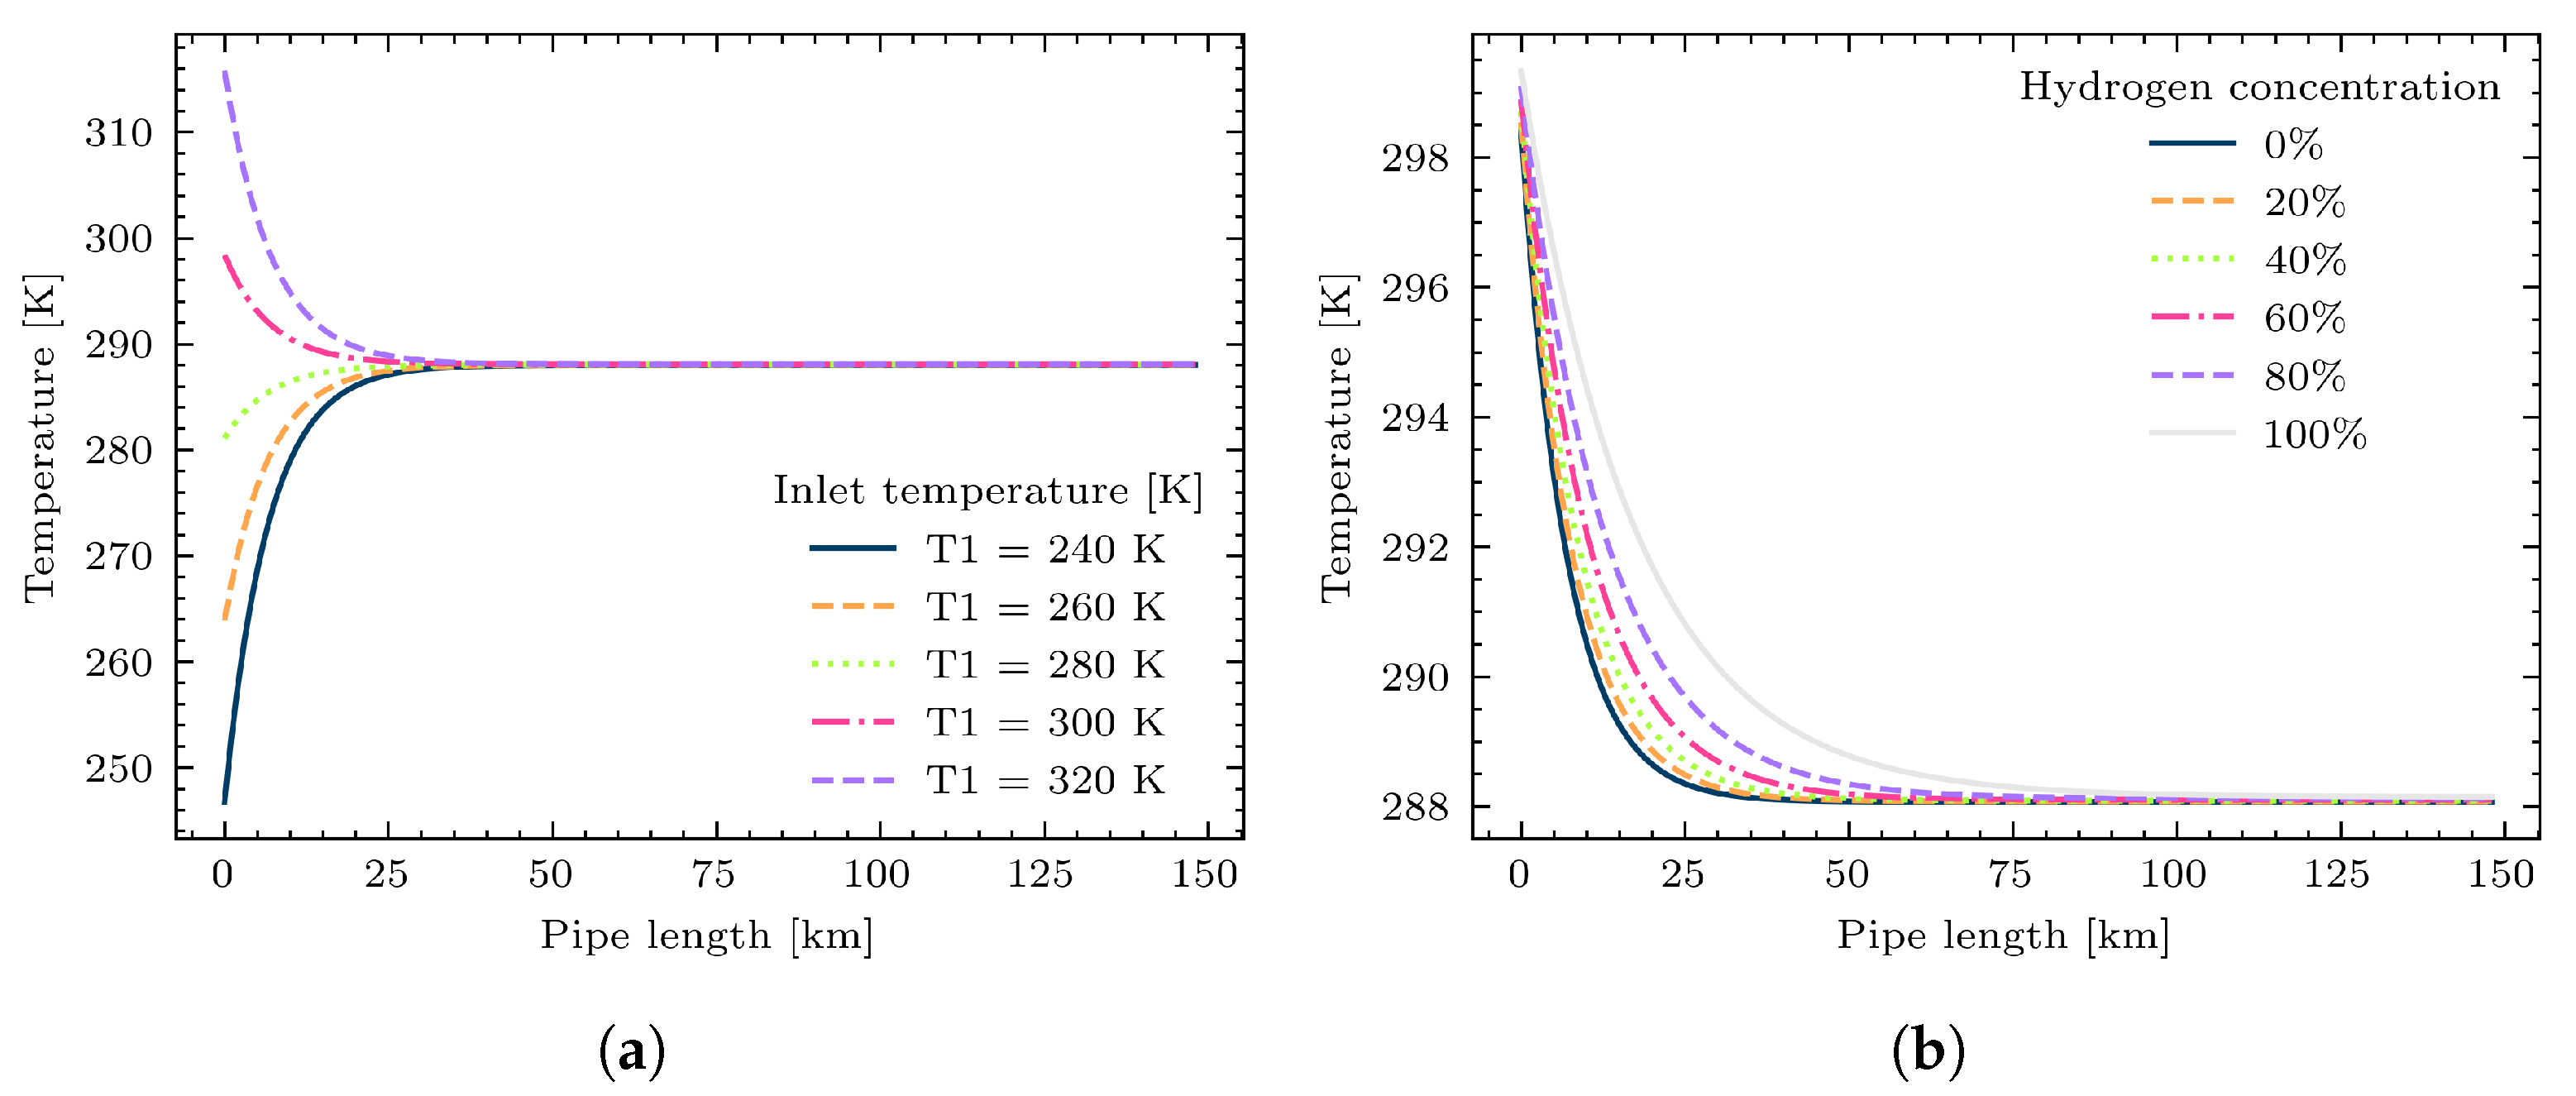
Besides the nodal pressure and the flow rate inside pipelines, the temperature of the transmitted gas mixture is also an important variable for gas network simulation. In Figure 5a, simulations are run to illustrate the temperature profile inside a pipeline with respect to the different inlet temperatures. It can be noted that the gas mixture temperature tends to be the same as its ambient temperature after a long-distance transmission. In Figure 5b, several simulations are run assuming different hydrogen concentration rates inside the pipeline. In the case of natural gas, the gas mixture temperature is assumed to be the same as the ambient temperature if the pipeline is longer than 25 km. However, with the increase of hydrogen concentration inside the pipe, the descent rate of the temperature becomes lower and the temperature difference between the pipe inlet and outlet has to be taken into consideration in certain cases.
Gas transmission in the pipeline network is based on pressure control. The results presented in this section show that in order to keep the same energy flow in one pipeline, gas flow rates and pressure drops also change when the hydrogen concentration changes in the pipeline.
Since the volumetric flow rate is the most important variable to be analyzed, only the volumetric flow will be analyzed and shown in the rest of the paper.

3.2. Study Case 2: A Simple Gas Network with Hydrogen Injection

In the previous study case, simulations are performed on a simple pipeline model to illustrate the importance and necessity of taking gas mixture properties into account as part of a hydrogen-enriched natural gas network simulation. Considering the possibility of blending hydrogen into the natural gas network, if the hydrogen injection occurs at the demand side, the hydrogen concentration could be gradually increased and therefore cause risky conditions on a local level. In this section, a number of simulations are performed on a hydrogen-enriched natural gas network, to analyze the impacts caused by different hydrogen concentrations in the network or nodal hydrogen injections into the network.
To reproduce the network behavior with the utmost accuracy, a compatible network size for both gas and power grids should be considered. In this work, the gas grid is synthetically generated based on the CIGRE high-voltage transmission benchmark grid [46], ignoring some buses and connections.
The synthetically generated simple gas network model consists of 8 nodes and 8 branches as shown in Figure 6. Node 1 and node 2 are set as reference nodes, where the nodal pressure values are known. At these nodes, the pressures remain constant, while the flow rates are variable to be able to balance the network demands. The other nodes are defined as demand nodes, where the flow rates are predefined. The demand can be also converted into energy demand using the gas mixture heating values.
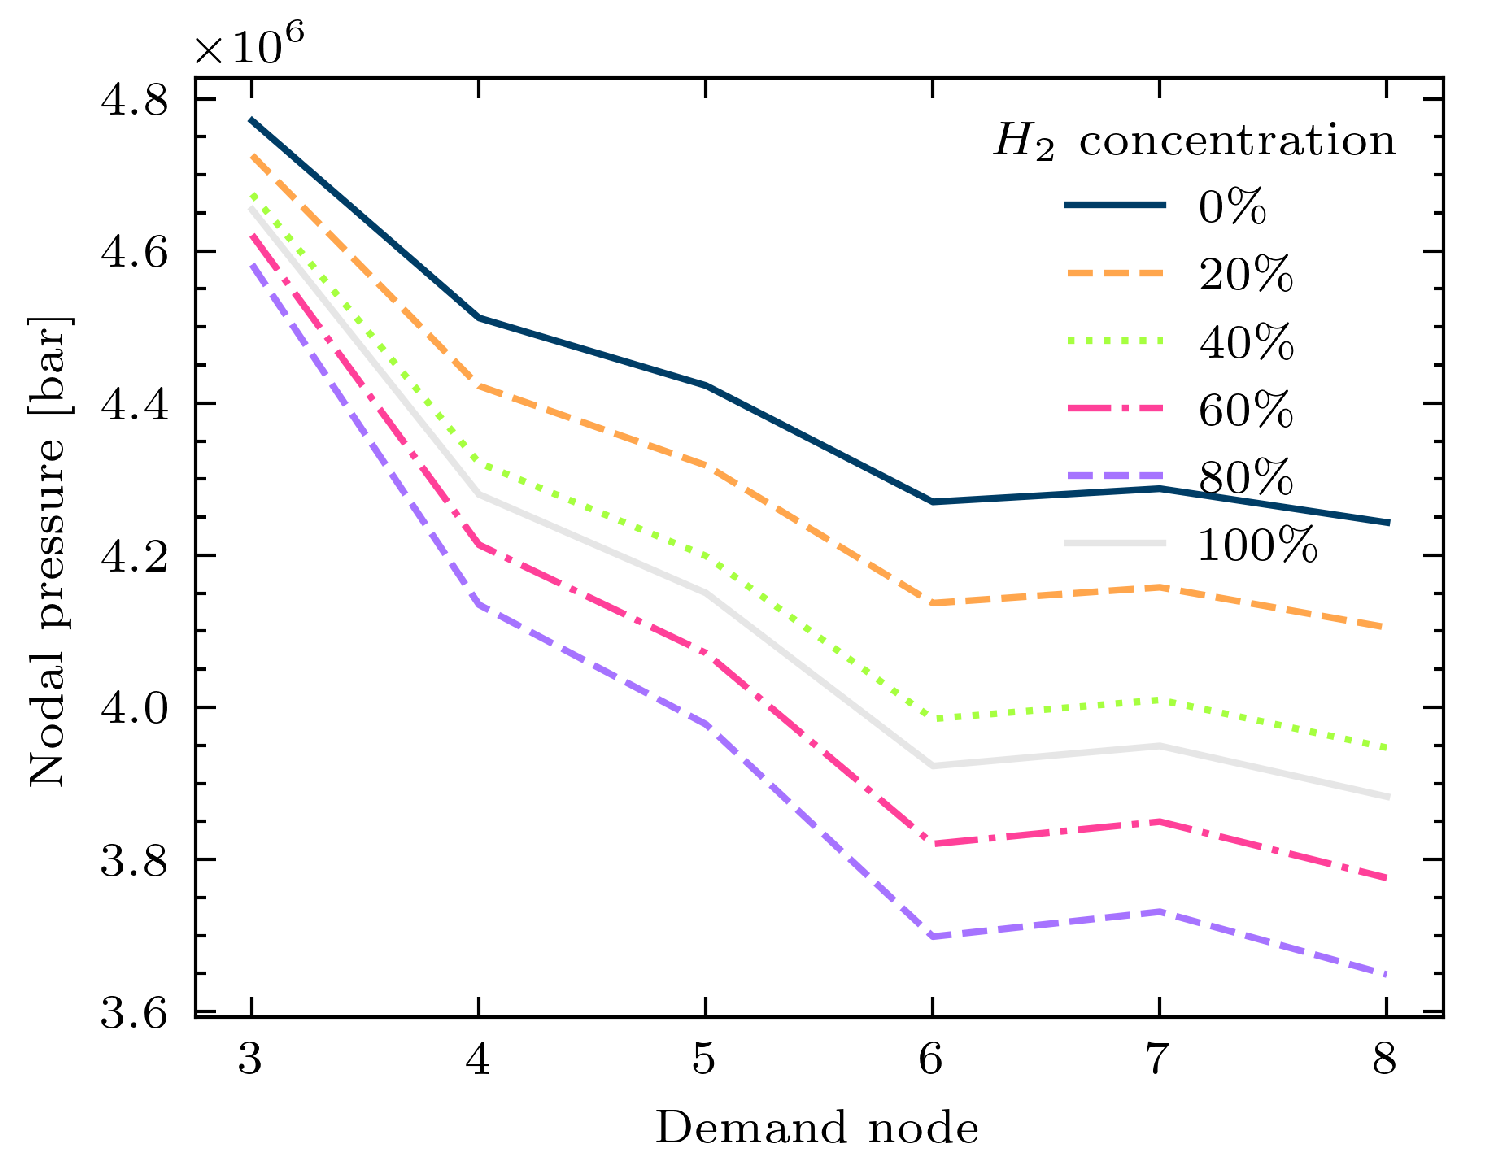
As shown in Figure 7, when nodal energy demands stay the same, the overall pressure at all demand nodes will be lower when the hydrogen concentration is higher. However, from 80% to 100% hydrogen concentration, the nodal pressures increase slightly, which corresponds to the results shown in Figure 4.
Water electrolysis is one of the most promising electrical flexibility options so far as it can generate hydrogen by electrolyzing water. To analyze the impacts of electrolyzer operation on the natural gas network, it is assumed that a known amount of hydrogen is fed into the natural gas network at the network nodes. In this study case, the distribution of injected hydrogen in the network is analyzed to see if the maximum permitted hydrogen concentration in the pipeline is exceeded.
Now assume there are three electrolyzers, which are accordingly located at nodes 3, 4, and 5. The energy flow rates of hydrogen blending into the natural gas grid are assumed as 35 MW, which corresponds to around 2.9 sm 3 / s . In this case, different gas injections are considered to be fully mixed at conjunction nodes. The corresponding simulation results are shown in Figure 8. As shown in the figure, a relatively high hydrogen concentration of around 29.6% occurs in pipeline 3. In pipelines 2, 4, and 6, the hydrogen concentration also reaches around 13%, which is already critical with respect to current technical regulations. It should be noted, however, that although the assumed hydrogen injection rate is relatively high given the current status of real-world implementation, the total energy delivered with hydrogen covers only around 1.88% of the total energy demand in this system. Therefore, when the total hydrogen share in the gas transmission system is increased, it is important to monitor the hydrogen concentration in pipelines in order to ensure a secure operation.

3.3. Study Case 3: A Simple Example of a Simulation of Coupled Power and Gas Networks

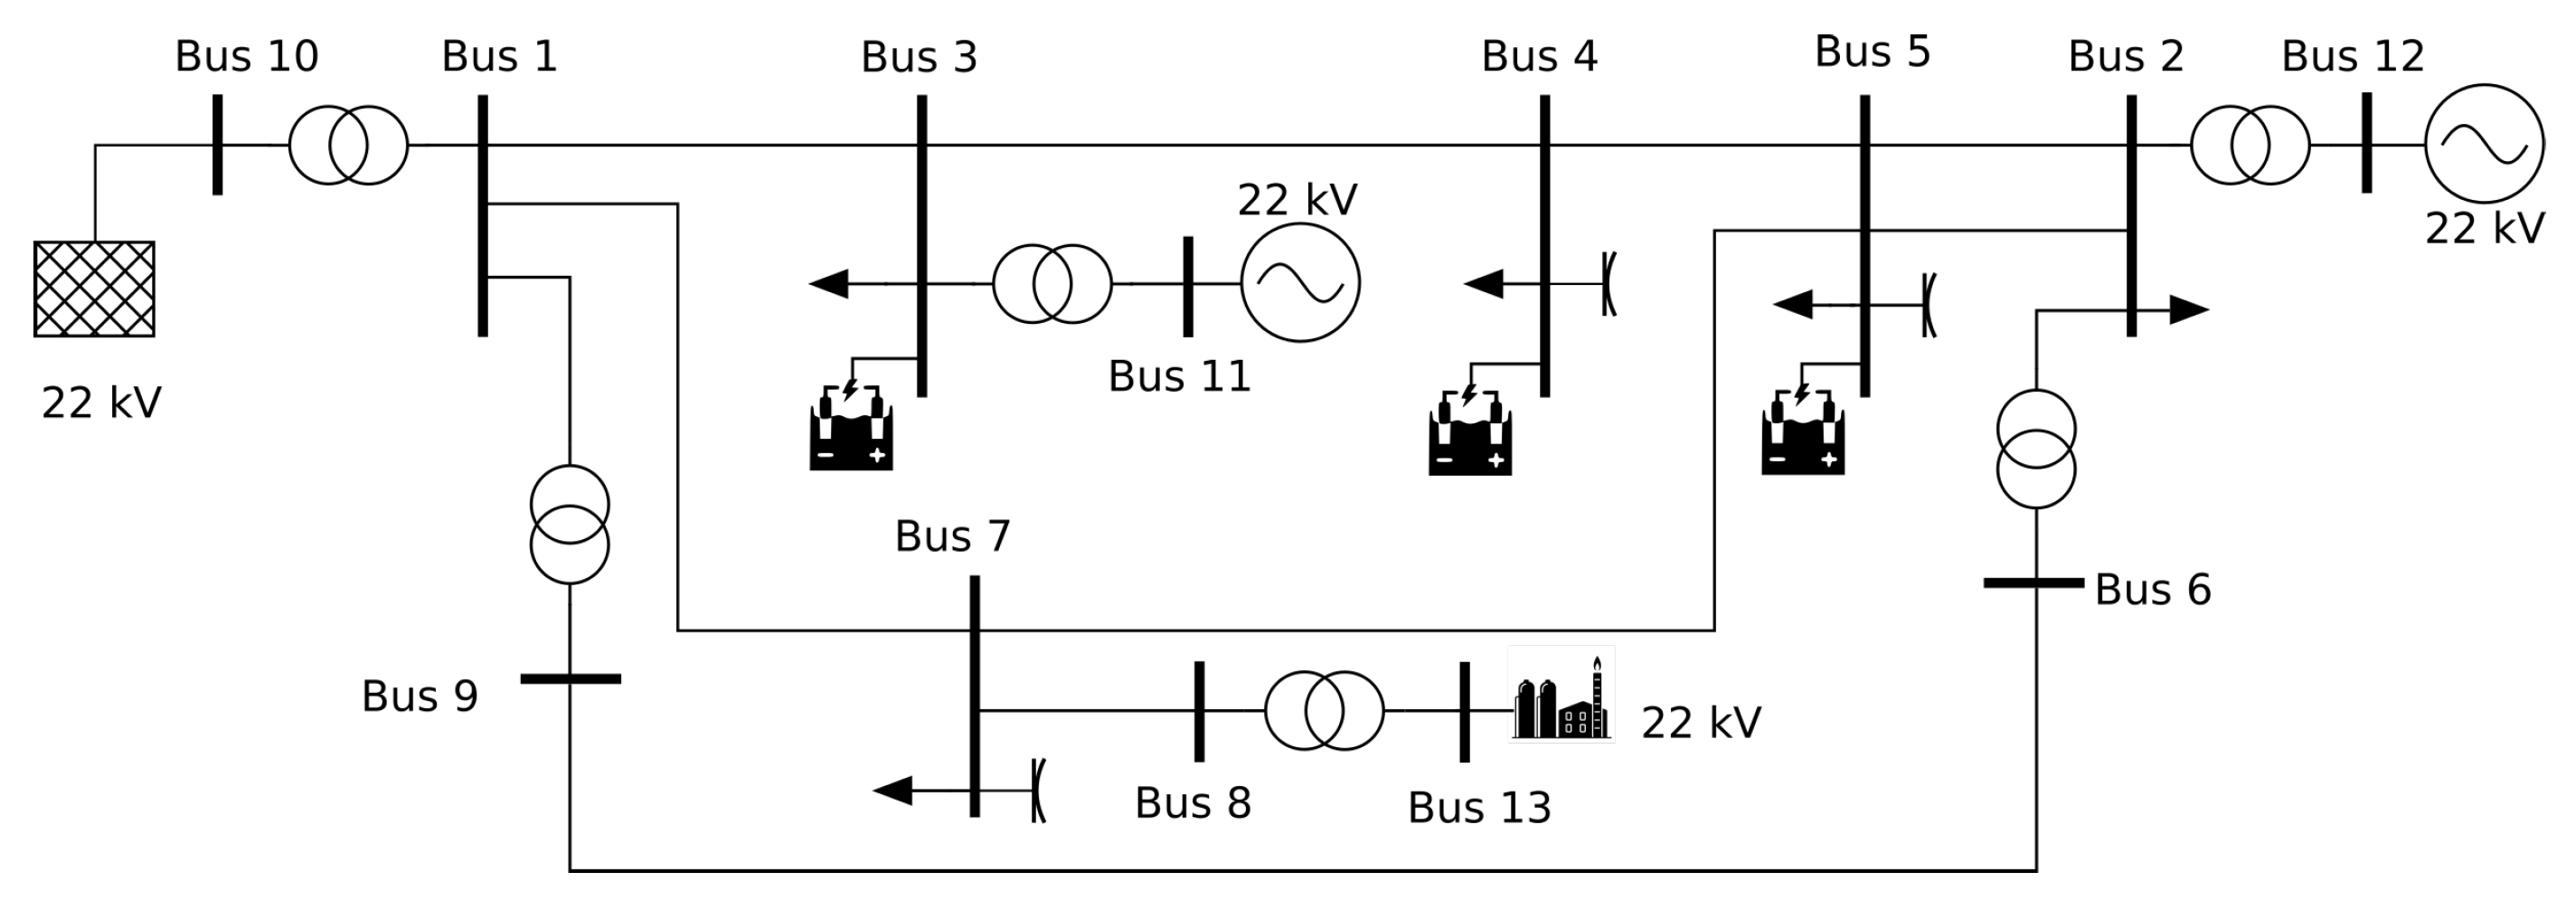
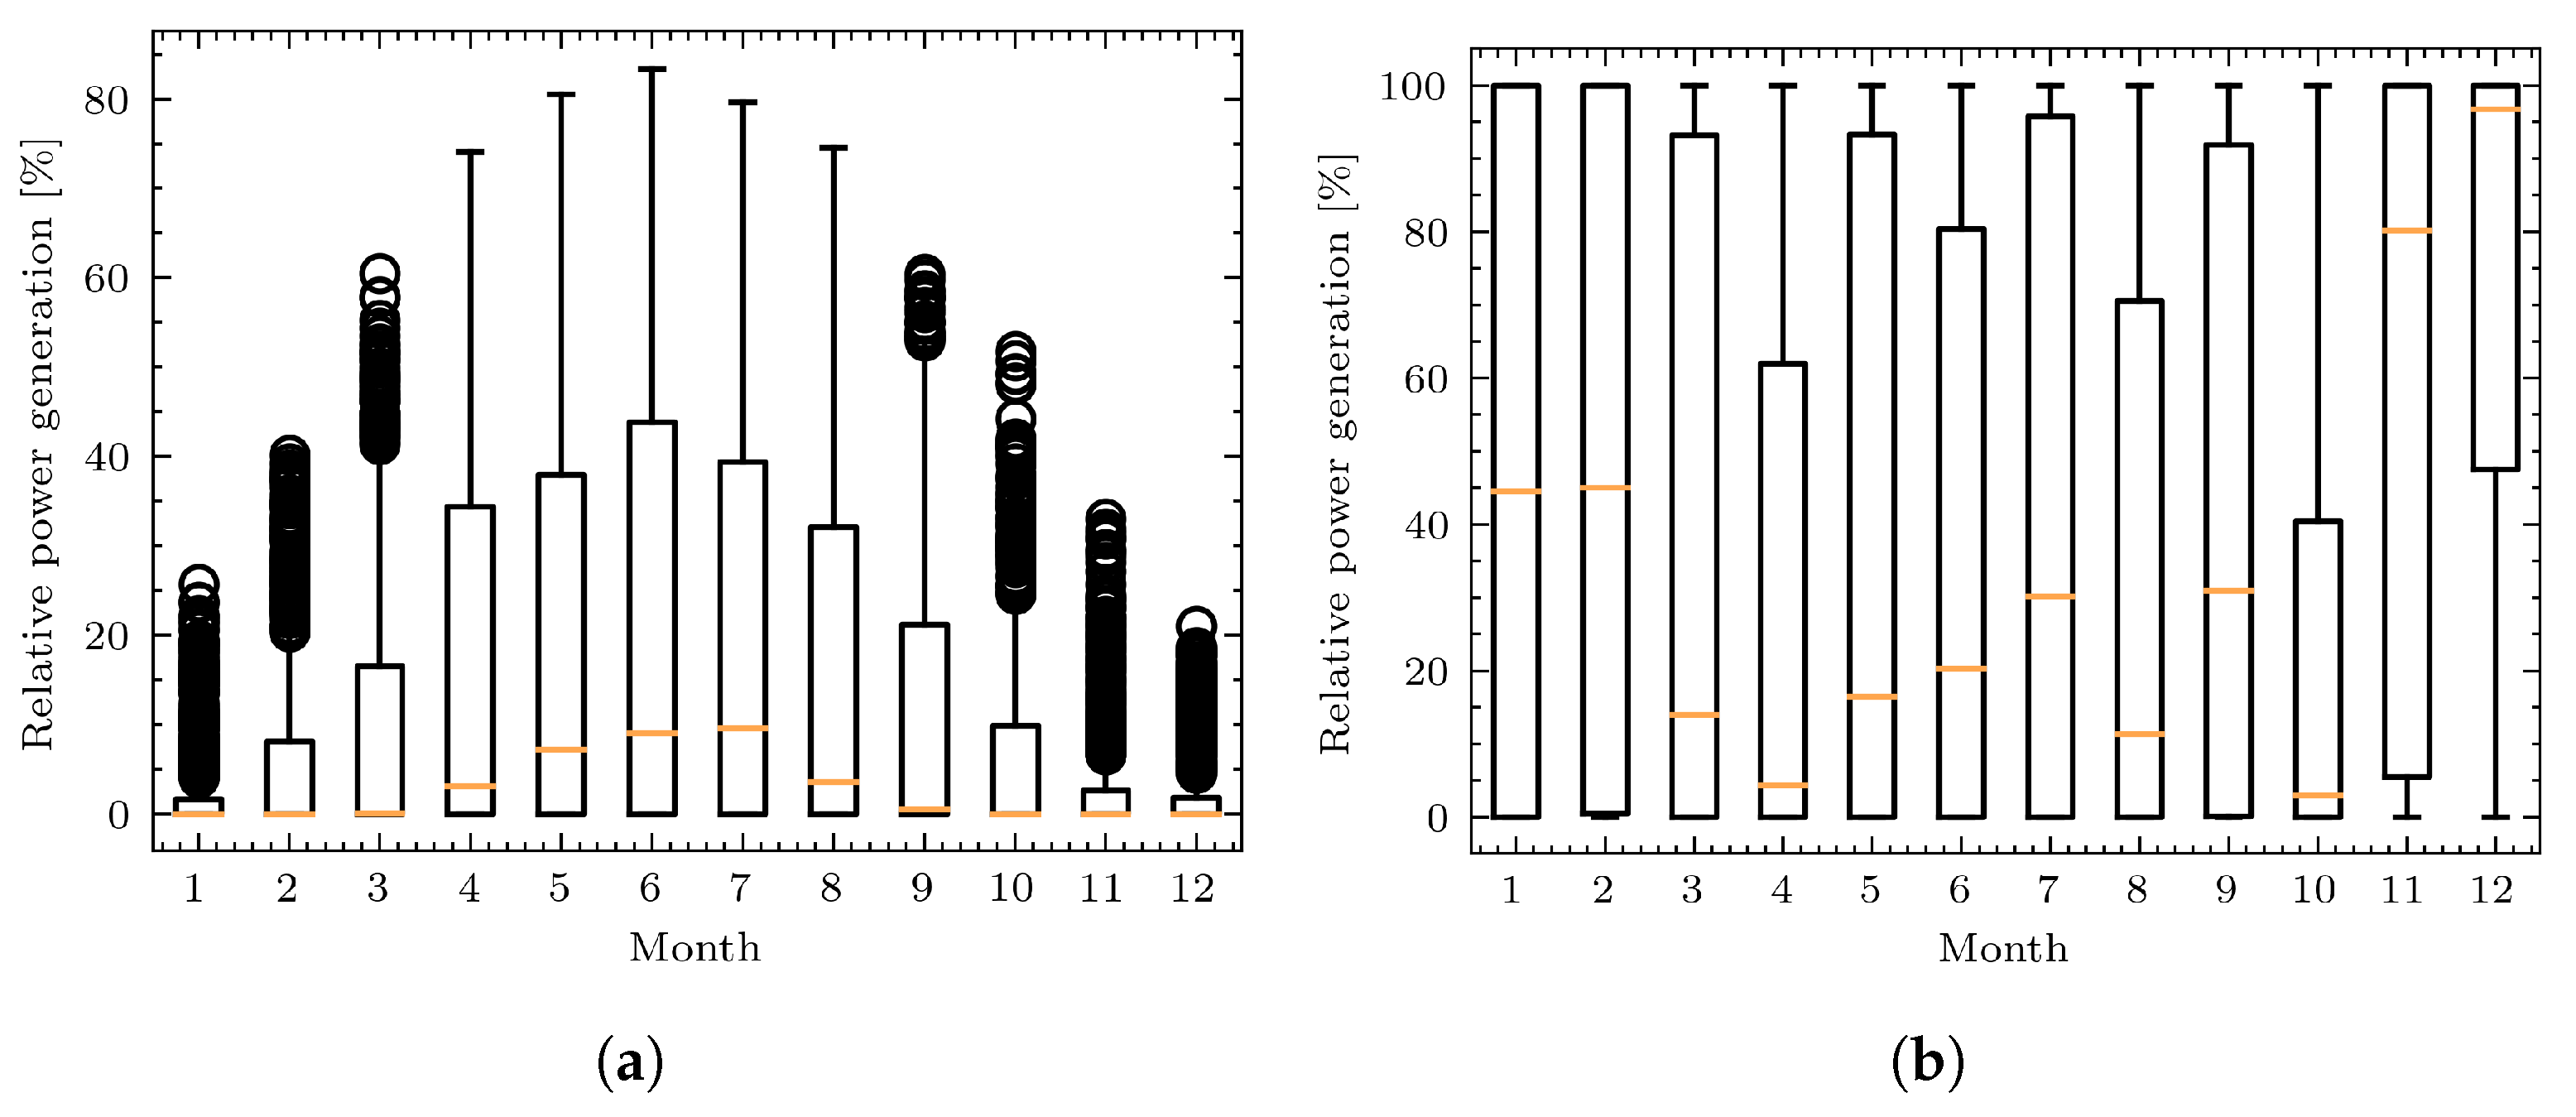
A number of studies analyzed the technical and economical performances of water electrolyzers considering different PV and wind penetration levels [47,48]. However, these studies focused mainly on the electrolyzer and its power consumption rather than on the grid perspective. In this part, a simple analysis is performed by coupling the power grid (Figure 9) and gas grid (Figure 6). To this end, a quasi-dynamic simulation is performed based on a time-series simulation. The energy demands in both networks are calculated using standard demand profiles, which are taken from [49,50] and assume an annual demand of 400 MWh and 600 MWh, based on the scenario defined in the original power system model [46]. To include the generation of renewable energy, weather data from 2015 are used [51]. The wind and PV generation profiles are calculated using the above-mentioned weather data and formulas taken from [52,53]. The total installed generation capacity of wind and PV generation units is set at 500 MW with a wind and PV ratio of 50–50%. Furthermore, renewable energy generation is considered to be equally distributed at each node. In Figure 10, the PV and wind generation are plotted as box plots [54] to show their seasonal behavior. The orange lines in the middle represent the median value of the power generation of each month. The lower and upper bounds of the boxes represent the lower and upper quartiles of monthly generation. The whiskers extend from the box and cover the major range of the data. The outliers refer to the data past the end of the whiskers, which are the peaks and valleys of power generation. It can be seen that although PV has a peak generation in the summer and the maximum total generation of renewable energy usually occurs in warmer seasons, the relatively high continuous generation of renewable energy occurs during winter. Therefore, two scenarios are assumed based on the above-mentioned renewable generation, which correspond to June and December, meaning that the PV-rich and wind-rich seasons can be considered.
To investigate the impact of coupling both networks, the combination of three water electrolyzers and one gas-fired power plant is analyzed (see Figure 6 and Figure 9). The water electrolyzers are considered to be installed at nodes 3, 4, and 5, each with a maximum power consumption rate of 20 MW and an efficiency of 80%. A simple scheduling method is applied to ensure that the electrolyzers are only operated at times when the generation of renewable energies exceeds its nodal power demand. The gas-fired power plant is assumed at node 8, which consumes gas and produces electrical power with an efficiency of 60%. Here, instead of changing settings on the power grid side, a constant volumetric flow rate of gas consumption is assumed so that the impact of the time-variant hydrogen concentration in the natural gas grid can be illustrated.
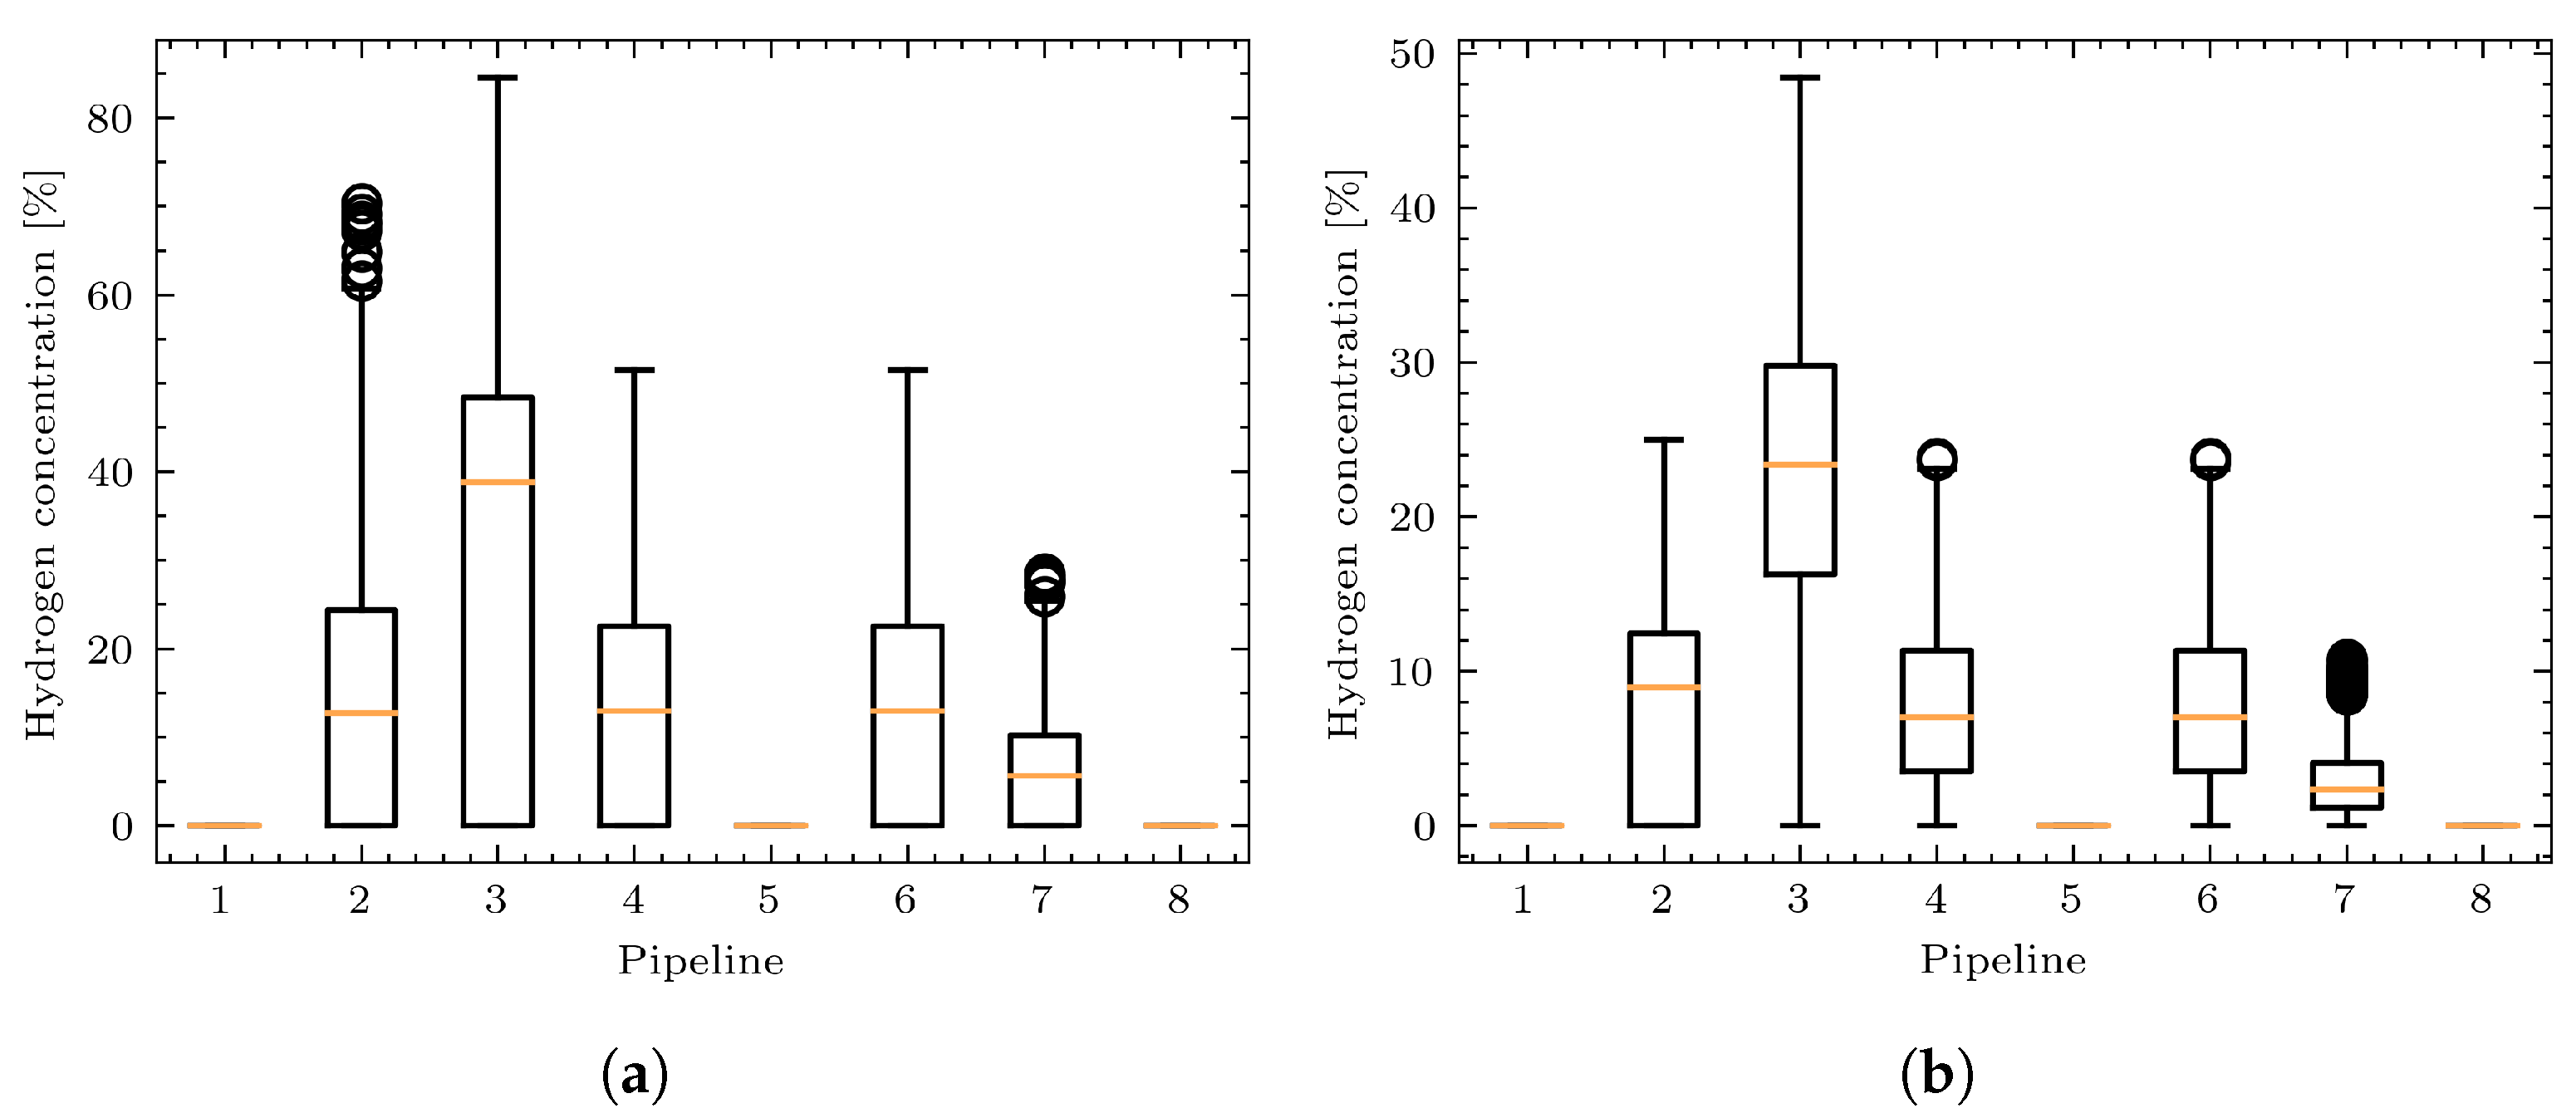
Two simulations are run separately for June and December 2015 with a sampling time of one hour. The results are shown in Figure 11 and Figure 12. By comparing the results from Figure 11a,b, it is clear that the hydrogen concentrations in June are much higher than those in December. This result can be explained by the fact that the gas demand is usually rather low in summer while generation spikes of renewable energies are rather common. Because natural gas is mostly used for space heating purposes, the gas demand increases during colder days. Although more hydrogen is produced in the winter, the energy supplied with hydrogen does not play a major role.
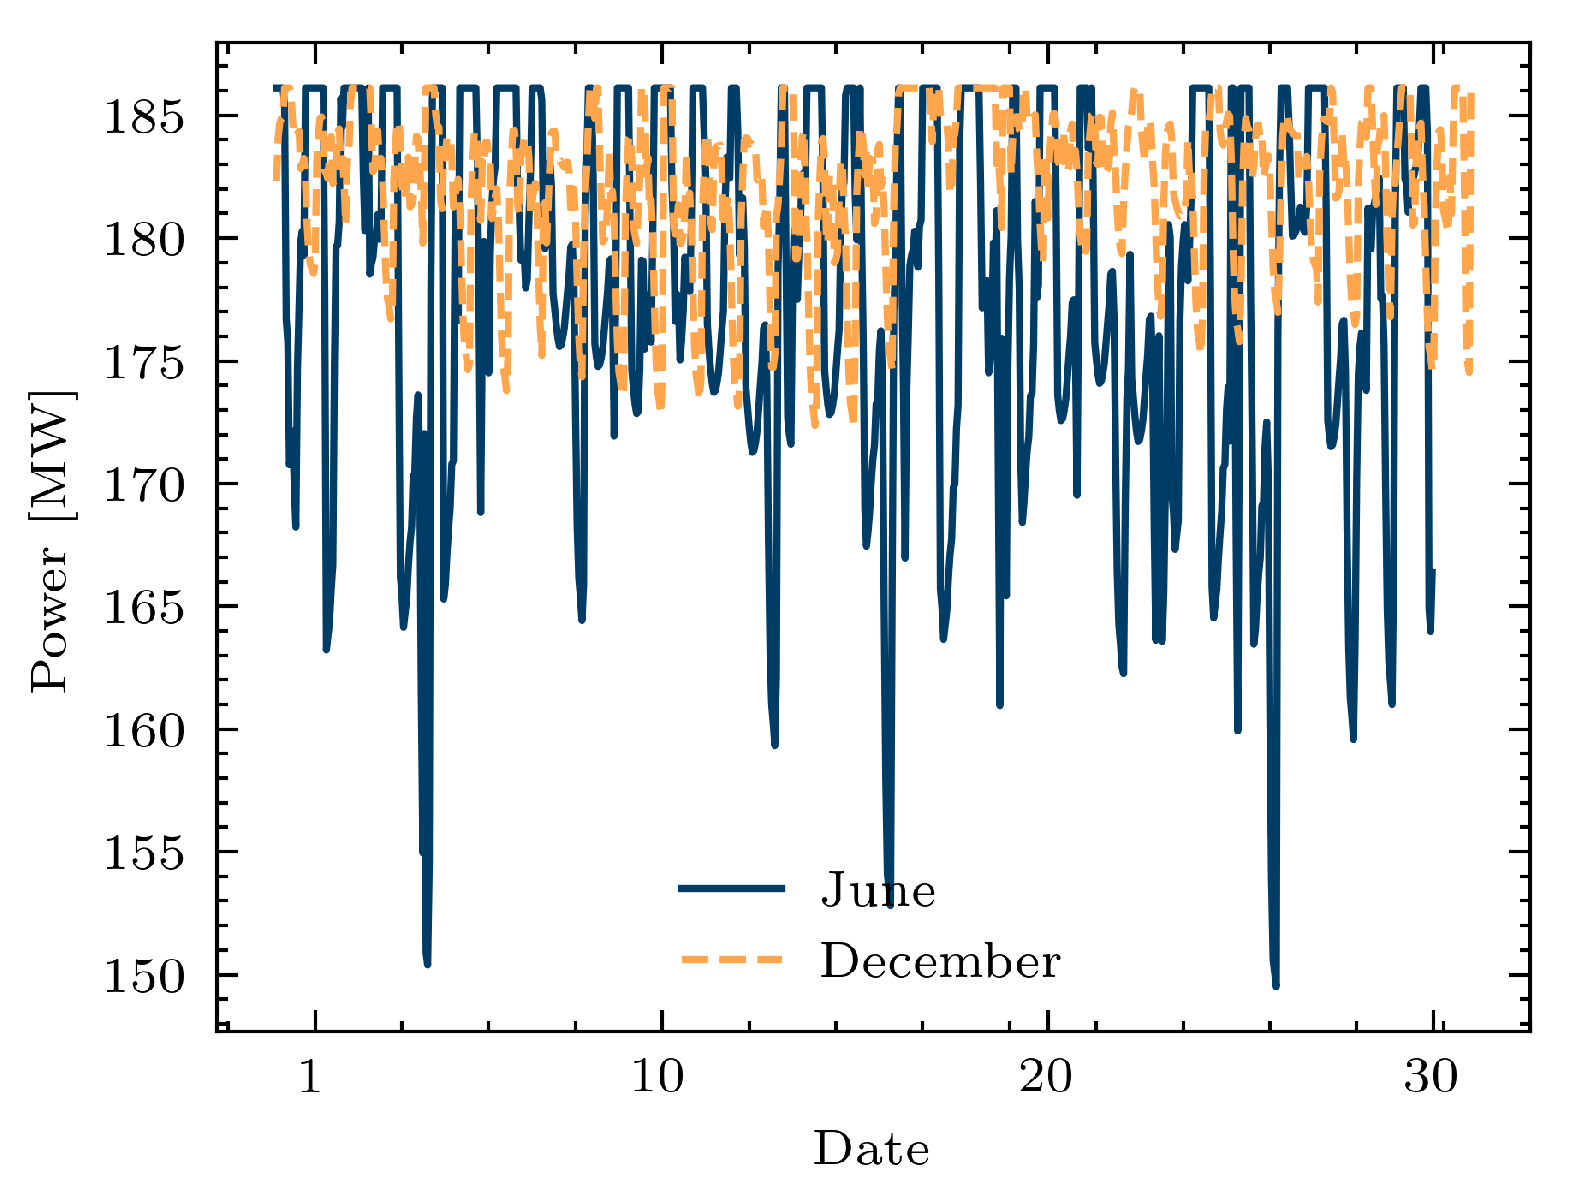
In Figure 12, the power generation of the gas-fired power plant at node 8 is analyzed. It should be noted that the power generation in June is not stable, which can vary up to 20%. This is caused by the high concentration of hydrogen that occurs in pipeline 7, which directly supplies node 8. This further indicates that directly blending hydrogen into the natural gas network is theoretically impractical during summer. Although the power generation in December is relatively more stable, a difference of over 5% is still possible. Therefore, to ensure a secure operation of the power grid coupled with the hydrogen-enriched natural gas network, the heating values of the gas mixture should be taken into consideration.

4. Conclusions

The gas sector can provide seasonal storage capacity and additional flexibility to the power sector in an integrated power and gas system. To accurately analyze the impacts caused by coupling power and gas networks, appropriate modeling and simulation approaches are needed. In this paper, a simulation method and a corresponding tool are presented that are capable to simulate hydrogen-enriched natural gas networks. To achieve this, the Peng–Robinson equation of states is applied to calculate the gas mixture properties.
In the previous section, several study cases were developed and simulated to demonstrate the importance and necessity of modeling variant gas compositions. First, different modeling approaches were analyzed by applying them to a single pipeline. By analyzing the results, it can be concluded that hydrogen injection can pose challenges to the gas pipeline network. The gas mixture composition has a significant impact on the static gas flow calculation, which can represent the long-term gas network operation. With a potentially high penetration of hydrogen in the natural gas network, the gas volumetric flow rate and nodal pressure might vary due to the different hydrogen concentrations in gas pipelines. In addition, when the hydrogen concentration in the natural gas network system increases, the heating value of the transported gas mixture decreases. Therefore, in order to maintain a sufficient energy supply, the volumetric flow rates have to be increased, which in turn leads to increasing pressure drops throughout the pipelines Therefore, local pipeline congestion may occur in the future, which should be analyzed in advance during network planning.
The method is then applied to a simple network, where nodal hydrogen injections take place. The simulation results further confirm the findings from the previous study case. Moreover, the presented method and tool can also be used to calculate hydrogen concentration in pipelines, which is an important state variable in the analysis of hydrogen-enriched natural gas networks. Furthermore, the simulation results also provide information about the heating value of the gas mixture, which is very helpful for real-world applications, where very little real-time measurement data are currently available.
Finally, a coupled power and gas network is simulated and analyzed. This study case shows that the power and gas demand varies greatly on a seasonal level. The feasibility of blending hydrogen directly into the natural gas grid is therefore investigated using the developed simulation tool. Due to the relatively lower gas demand in summer, the permitted amount of synthetic hydrogen in the gas grid is rather limited. Therefore, a more reasonable option is to store the synthetically generated hydrogen separately or together with natural gas in warmer seasons. In winter, the gas demand is higher due to the greater heating demand. Blending hydrogen into the gas grid is therefore more feasible.

Author Contributions

Conceptualization, Y.L., T.P. and A.B.; methodology, Y.L., T.P. and A.B.; software, Y.L.; validation, Y.L.; formal analysis, Y.L.; investigation, Y.L.; resources, Y.L.; data curation, Y.L.; writing—original draft preparation, Y.L.; writing—review and editing, Y.L., T.P. and A.B.; visualization, Y.L.; supervision, T.P. and A.B.; project administration, T.P. and A.B.; funding acquisition, T.P. and A.B. All authors have read and agreed to the published version of the manuscript.

Funding

This research was funded by Operational Program for the promotion of investments in growth and employment for North Rhine-Westphalia from the European fund for regional development (OP EFRE NRW) grant number EFRE-0400111.

Acknowledgments

T.P. gratefully acknowledges funding by the center of excellence “Virtual Institute-Power to Gas and Heat” (EFRE-0400111) by the “Operational Program for the promotion of investments in growth and employment for North Rhine-Westphalia from the European fund for regional development” (OP EFRE NRW) through the Ministry of Economic Affairs, Innovation, Digitalization and Energy of the State of North Rhine-Westphalia.

Conflicts of Interest

The authors declare no conflict of interest.

Abbreviations

The following abbreviations are used in this manuscript:
DVGWGerman Technical and Scientific Association for Gas and Water
EOSEquation of state
HVHeating value
HHVHigh heating value
NGNatural gas
NRNewton–Raphson
PREOSPeng–Robinson equation of state
PtGPower-to-gas
PVPhotovoltaics

Nomenclature

Cconstant, π R 16 M a i r , which is around 13.29,
Dpipe diameter (m),
η pipe efficiency (dimensionless),
ffriction factor (dimensionless),
Ggas specific gravity (dimensionless),
ggravitational acceleration ( m / s 2 ),
H i inlet height (m),
H j outlet height (m),
H V heating value ( J / sm 3 ),
H H V higher heating value ( J / sm 3 ),
hspecific enthalpy (J/kg),
Lpipe length (m),
P s t reference pressure (Pa),
P i inlet pressure (Pa),
P j outlet pressure (Pa),
p c critical pressure (K),
p r pseudo-reduced pressure (dimensionless),
Qvolumetric flow rate ( sm 3 / s ),
Q m mass flow rate (kg/s)
T a average temperature (K),
T c critical pressure (K),
T r pseudo-reduced pressure (dimensionless),
T s ambient temperature (K),
T s t reference temperature (K),
U l heat transfer coefficient ( W / ( m 2 · K ) ),
vgas flow velocity (m/s),
Zcompressibility factor (dimensionless),
θ slope angle (dimensionless)

Appendix A

Table A1. Typical natural gas composition [42].
Gas SpeciesTypical Analysis (Mole %)Range (Mole %)
Methane94.787.0–98.0
Ethane4.21.5–9.0
Propane0.20.1–1.5
Iso-butane0.02trace–0.3
Butane0.02trace–0.3
Iso-pentane0.01trace–0.04
Pentane0.01trace–0.04
Hexanes plus0.01trace–0.06
Nitrogen0.50.2–5.5
Carbon dioxide0.30.05–1.0
Oxygen0.01trace–0.1
Hydrogen0.02trace–0.05

References

  1. Rockström, J.; Gaffney, O.; Rogelj, J.; Meinshausen, M.; Nakicenovic, N.; Schellnhuber, H.J. A roadmap for rapid decarbonization. Science 2017, 355, 1269–1271. [Google Scholar] [CrossRef] [Green Version]
  2. Wiser, R.; Jenni, K.; Seel, J.; Baker, E.; Hand, M.; Lantz, E.; Smith, A. Expert elicitation survey on future wind energy costs. Nat. Energy 2016, 1, 16135. [Google Scholar] [CrossRef]
  3. Mancarella, P. MES (multi-energy systems): An overview of concepts and evaluation models. Energy 2014, 65, 1–17. [Google Scholar] [CrossRef]
  4. Pesch, T.C. Multiskalare Modellierung Integrierter Energie- und Elektrizitätssysteme; Schriften des Forschungszentrums Jülich. Energie & Umwelt/Energy & Environment; Verlag des Forschungszentrums Jülich: Jülich, Germany, 2019; Volume 485. [Google Scholar]
  5. Fraunhofer-Gesellschaft. Energy-Charts. Available online: https://energy-charts.info/index.html?l=en&c=DE (accessed on 9 November 2020).
  6. Energie Informationsdienst. Underground Gas Storage in Germany; DVV Media Group GmbH: Hamburg, Germany, 2020. [Google Scholar]
  7. Thema, M.; Sterner, M.; Lenck, T.; Götz, P. Necessity and Impact of Power-to-gas on Energy Transition in Germany. Energy Procedia 2016, 99, 392–400. [Google Scholar] [CrossRef] [Green Version]
  8. Clegg, S.; Mancarella, P. Storing renewables in the gas network: Modelling of power–to–gas seasonal storage flexibility in low–carbon power systems. IET Gener. Transm. Distrib. 2016, 10, 566–575. [Google Scholar] [CrossRef]
  9. Schiebahn, S.; Grube, T.; Robinius, M.; Tietze, V.; Kumar, B.; Stolten, D. Power to gas: Technological overview, systems analysis and economic assessment for a case study in Germany. Int. J. Hydrog. Energy 2015, 40, 4285–4294. [Google Scholar] [CrossRef]
  10. Dolci, F. Green Hydrogen Opportunities in Selected Industrial Processes. JRC Tech. Rep. 2018. Available online: https://publications.jrc.ec.europa.eu/repository/handle/JRC114766 (accessed on 20 September 2021).
  11. Melaina, M.W.; Antonia, O.; Penev, M. Blending Hydrogen into Natural Gas Pipeline Networks: A Review of Key Issues; National Renewable Energy Laboratory: Golden, CO, USA, 2013.
  12. Fuel Cells and Hydrogen Joint Undertaking. Development of Business Cases for Fuel Cells and Hydrogen Applications for Regions and Cities: Hydrogen Injection into the Natural Gas Grid. Available online: https://www.fch.europa.eu/sites/default/files/FCH%20Docs/171121_FCH2JU_Application-Package_WG5_P2H_Hydrogen%20into%20gas%20grid%20%28ID%202910558%29%20%28ID%202911642%29.pdf (accessed on 20 September 2021).
  13. German Bundestag. Critical Values for Hydrogen (H2) in the Natural Gas Infrastructure. Available online: https://www.bundestag.de/resource/blob/646488/a89bbd41acf3b90f8a5fbfbcb8616df4/WD-8-066-19-pdf-data.pdf (accessed on 8 November 2020).
  14. Leicher, J.; Nowakowski, T.; Giese, A.; Görner, K. Power-to-gas and the consequences: Impact of higher hydrogen concentrations in natural gas on industrial combustion processes. Energy Procedia 2017, 120, 96–103. [Google Scholar] [CrossRef]
  15. Leicher, J.; Giese, A.; Görner, K.; Werschy, M.; Krause, H.; Dörr, H. Natural gas quality fluctuations–surveys and statistics on the situation in Germany. Energy Procedia 2017, 120, 165–172. [Google Scholar] [CrossRef]
  16. Martinez-Mares, A.; Fuerte-Esquivel, C.R. A Unified Gas and Power Flow Analysis in Natural Gas and Electricity Coupled Networks. IEEE Trans. Power Syst. 2012, 27, 2156–2166. [Google Scholar] [CrossRef]
  17. Ekhtiari, A.; Dassios, I.; Liu, M.; Syron, E. A Novel Approach to Model a Gas Network. Appl. Sci. 2019, 9, 1047. [Google Scholar] [CrossRef] [Green Version]
  18. Abdolahi, F.; Mesbah, A.; Boozarjomehry, R.B.; Svrcek, W.Y. The effect of major parameters on simulation results of gas pipelines. Int. J. Mech. Sci. 2007, 49, 989–1000. [Google Scholar] [CrossRef]
  19. Guandalini, G.; Colbertaldo, P.; Campanari, S. Dynamic modeling of natural gas quality within transport pipelines in presence of hydrogen injections. Appl. Energy 2017, 185, 1712–1723. [Google Scholar] [CrossRef]
  20. Poling, B.E.; Prausnitz, J.M.; O’Connell, J.P. The Properties of Gases and Liquids, 5th ed.; McGraw-Hill: New York, NY, USA; London, UK, 2000. [Google Scholar]
  21. Pellegrino, S.; Lanzini, A.; Leone, P. Greening the gas network – The need for modelling the distributed injection of alternative fuels. Renew. Sustain. Energy Rev. 2017, 70, 266–286. [Google Scholar] [CrossRef]
  22. Siemens. PSS®SINCAL—Simulation Software for Analysis and Planning of Electric and Pipe Networks. Available online: https://assets.new.siemens.com/siemens/assets/public.1537970929.31ece3a2-e9cc-4528-b9f9-6bf61b613de2.ref-no-69-ps-c-pss-sincal-brochure-hires-intl-sept2018.pdf (accessed on 9 November 2020).
  23. Pambour, K.A.; Cakir Erdener, B.; Bolado-Lavin, R.; Dijkema, G.P. SAInt–A novel quasi-dynamic model for assessing security of supply in coupled gas and electricity transmission networks. Appl. Energy 2017, 203, 829–857. [Google Scholar] [CrossRef]
  24. Merkuryev, Y. (Ed.) SIMULTECH 2016: Proceedings of the 6th International Conference on Simulation and Modeling Methodologies, Technologies and Applications; IEEE: Piscataway, NJ, USA, 2016. [Google Scholar]
  25. Andresen, L.; Dubucq, P.; Peniche Garcia, R.; Ackermann, G.; Kather, A.; Schmitz, G. Status of the TransiEnt Library: Transient Simulation of Coupled Energy Networks with High Share of Renewable Energy. In Proceedings of the 11th International Modelica Conference, Linköping Electronic Conference Proceedings, Versailles, France, 21–23 September 2015; Linköping University Electronic Press: Linköping, Sweden, 2015; pp. 695–705. [Google Scholar]
  26. Lohmeier, D.; Cronbach, D.; Drauz, S.R.; Braun, M.; Kneiske, T.M. Pandapipes: An Open Source Piping Grid Calculation Package for the Application in Coupled Multi-Energy Grid Simulations. Sustainability 2020, 12, 9899. [Google Scholar] [CrossRef]
  27. Chaczykowski, M.; Osiadacz, A.J. Comparative assesment of steady-state pipeline gas flow models / Analiza porównawcza modeli przepływu gazu w rurociągu w stanach ustalonych. Arch. Min. Sci. 2012, 57, 23–38. [Google Scholar] [CrossRef] [Green Version]
  28. Bales, P.; Kolb, O.; Lang, J. Hierarchical Modelling and Model Adaptivity for Gas Flow on Networks. In Computational science-ICCS 2009; Allen, G., Ed.; Lecture Notes in Computer Science; Springer: Berlin, Germany, 2009; Volume 5544, pp. 337–346. [Google Scholar]
  29. Coelho, P.M.; Pinho, C. Considerations about equations for steady state flow in natural gas pipelines. J. Braz. Soc. Mech. Sci. Eng. 2007, 29, 262–273. [Google Scholar] [CrossRef] [Green Version]
  30. German Technical and Scientific Association for Gas and Water. Gas Infrastructure-Quality of Gas-Group H, German version EN 16726:2015+A1:2018; Beuth Verlag GmbH: Berlin, Germany, 2019. [Google Scholar]
  31. Schroeder, D.W., Jr. A tutorial on pipe flow equations. In Proceedings of the PSIG Annual Meeting, Bonita Springs, FL, USA, 11–14 May 2010. [Google Scholar]
  32. Osiadacz, A.J. Simulation and Analysis of Gas Networks; Gulf Publishing Company: Houston, TX, USA, 1987. [Google Scholar]
  33. Mohitpour, M.; Thompson, W.; Asante, B. The Importance of Dynamic Simulation on the Design and Optimization of Pipeline Transmission Systems. In Proceedings of the First International Pipeline Conference, Calgary, AB, Canada, 9–13 June 1996; Yoon, M., Mensik, M., Mohitpour, M., Eds.; American Society of Mechanical Engineers: New York, NY, USA, 1996; pp. 1183–1188. [Google Scholar]
  34. Farzaneh-Gord, M.; Khamforoush, A.; Hashemi, S.; Namin, H. Computing Thermal Properties of Natural Gas by Utilizing AGA8 Equation of State. Int. J. Chem. Eng. Appl. 2010, 1, 20–24. [Google Scholar] [CrossRef] [Green Version]
  35. German Technical and Scientific Association for Gas and Water. DVGW G 260-Gas Quality; Wirtschafts- und Verlagsgesellschaft Gas und Wasser mbH: Bonn, Germany, 2013. [Google Scholar]
  36. Caleb Bell and Contributors (2016–2021) Thermo: Chemical Properties Component of Chemical Engineering Design Library (ChEDL). GitHub Repository. Available online: https://github.com/CalebBell/thermo (accessed on 12 September 2021).
  37. Peng, D.Y.; Robinson, D.B. A New Two-Constant Equation of State. Ind. Eng. Chem. Fundam. 1976, 15, 59–64. [Google Scholar] [CrossRef]
  38. Robinson, D.B.; Peng, D.Y.; Chung, S.Y.K. The development of the Peng—Robinson equation and its application to phase equilibrium in a system containing methanol. Fluid Phase Equilibria 1985, 24, 25–41. [Google Scholar] [CrossRef]
  39. Goodwin, D.G.; Speth, R.L.; Moffat, H.K.; Weber, B.W. Cantera: An Object-Oriented Software Toolkit for Chemical Kinetics, Thermodynamics, and Transport Processes, 2018. GitHub Repository. Available online: https://github.com/Cantera/cantera (accessed on 12 September 2021).
  40. Smith, G.P.; Golden, D.M.; Frenklach, M.; Moriarty, N.W.; Eiteneer, B.; Goldenberg, M.; Bowman, C.T.; Hanson, R.K.; Song, S.; Gardiner, W.C., Jr.; et al. GRI-MECH 3.0. Available online: http://combustion.berkeley.edu/gri-mech/version30/text30.html (accessed on 12 September 2021).
  41. Klein, S.A.; Nellis, G. Thermodynamics; Cambridge University Press: New York, NY, USA, 2012. [Google Scholar]
  42. Enbridge Gas. Chemical Composition of Natural Gas. Available online: https://www.enbridgegas.com/about-enbridge-gas/learn-about-natural-gas (accessed on 2 October 2021).
  43. Moiseeva, E.F.; Malyshev, V.L. Compressibility factor of natural gas determination by means of molecular dynamics simulations. AIP Adv. 2019, 9, 055108. [Google Scholar] [CrossRef] [Green Version]
  44. Bundesnetzagentur. Definitionen der Daten für den Gasbereich. Available online: https://www.bundesnetzagentur.de/SharedDocs/Downloads/DE/Sachgebiete/Energie/Unternehmen_Institutionen/DatenaustauschUndMonitoring/MaStR/DefinitionenDatenGasbereich.pdf?__blob=publicationFile&v=3 (accessed on 15 October 2020).
  45. Obuba, J.; Ikiesnkimama, S.S.; Ubani, C. Natural Gas Compressibility Factor Correlation Evaluation for Niger Delta Gas Fields. IOSR J. Electr. Electron. Eng. 2013, 6, 01–10. [Google Scholar] [CrossRef]
  46. Strunz, K.; Abbasi, E.; Fletcher, R.; Hatziargyriou, N.; Iravani, R.; Joos, G. TF C6.04.02: TB 575–Benchmark Systems for Network Integration of Renewable and Distributed Energy Resources; CIGRE: Paris, France, 2014. [Google Scholar]
  47. Davis, W.; Martín, M. Optimal year-round operation for methane production from CO2 and water using wind and/or solar energy. J. Clean. Prod. 2014, 80, 252–261. [Google Scholar] [CrossRef]
  48. de Boer, H.S.; Grond, L.; Moll, H.; Benders, R. The application of power-to-gas, pumped hydro storage and compressed air energy storage in an electricity system at different wind power penetration levels. Energy 2014, 72, 360–370. [Google Scholar] [CrossRef]
  49. Bundesverband der Energie- und Wasserwirtschaft. Standardlastprofile Strom. Available online: https://www.bdew.de/energie/standardlastprofile-strom/ (accessed on 16 September 2021).
  50. Bundesverband der Energie- und Wasserwirtschaft. Standardlastprofile Gas. Available online: https://www.bdew.de/energie/standardlastprofile-gas/ (accessed on 16 September 2021).
  51. Pfenninger, S.; Staffell, I. Long-term patterns of European PV output using 30 years of validated hourly reanalysis and satellite data. Energy 2016, 114, 1251–1265. [Google Scholar] [CrossRef] [Green Version]
  52. Quaschning, V. Understanding Renewable Energy Systems, revised edition ed.; Routledge Taylor & Francis Group Earthscan from Routledge: London, UK; New York, NY, USA, 2016. [Google Scholar]
  53. Zhou, W.; Yang, H.; Fang, Z. A novel model for photovoltaic array performance prediction. Appl. Energy 2007, 84, 1187–1198. [Google Scholar] [CrossRef]
  54. McGill, R.; Tukey, J.W.; Larsen, W.A. Variations of box plots. Am. Stat. 1978, 32, 12–16. [Google Scholar]
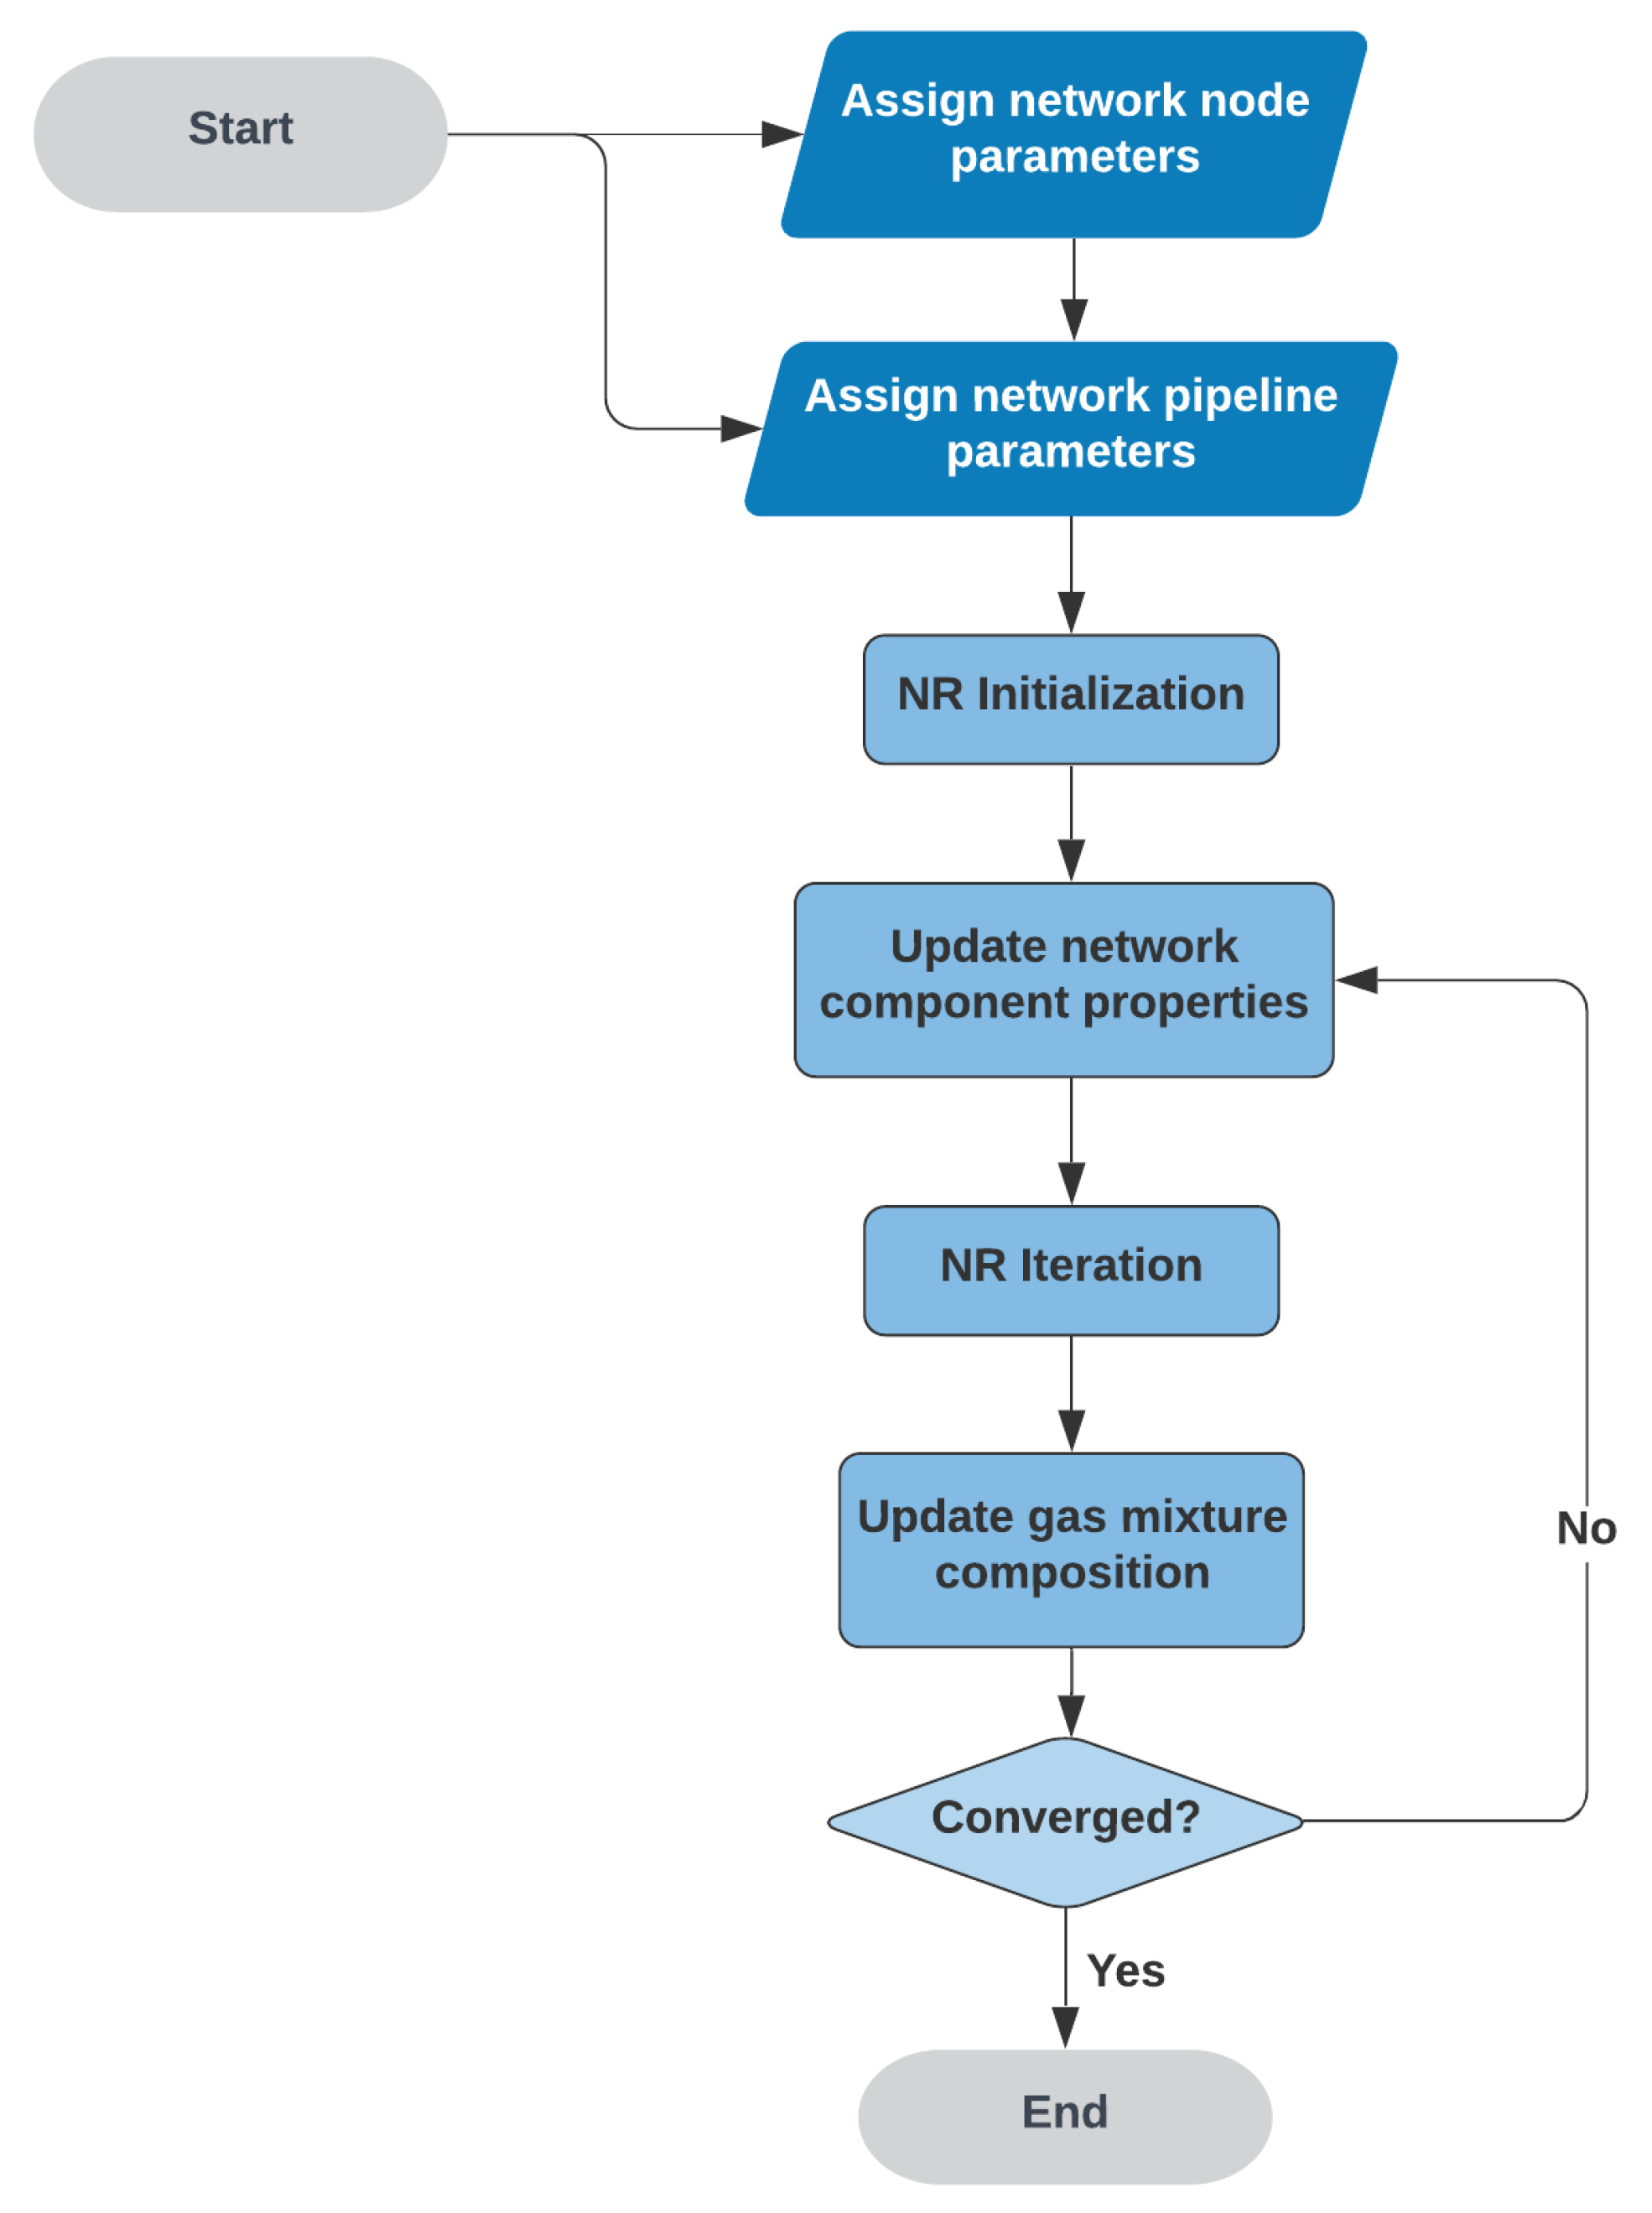
Figure 1. Flow chart of the solving process.
Energies 14 07680 g001
Figure 2. (a) Comparison between different pipeline flow rate calculation methods. (b) Comparison of flow rate calculation with constant gas properties and those calculated using PREOS.
Energies 14 07680 g002
Figure 3. (a) Gas mixture compressibility in the relation to the injection of hydrogen. (b) Gas mixture specific gravity in relation to the injection of hydrogen.
Energies 14 07680 g003
Figure 4. Pressure drop throughout a pipeline in relation to different hydrogen concentrations.
Energies 14 07680 g004
Figure 5. (a) Temperature profile throughout a gas pipe with different pipeline inlet temperatures. (b) Temperature profile throughout a gas pipe with different hydrogen concentrations.
Energies 14 07680 g005
Figure 6. Artificial gas grid.
Energies 14 07680 g006
Figure 7. Pressure at demand nodes with respect to different hydrogen concentrations in the network.
Energies 14 07680 g007
Figure 8. Hydrogen concentration in pipelines with respect to the injection of hydrogen at three nodes.
Energies 14 07680 g008
Figure 9. CIGRE high-voltage transmission grid (cf. [46]).
Energies 14 07680 g009
Figure 10. (a) Relative PV power generation in relation to installed generation capacity. (b) Relative wind power generation in relation to installed generation capacity.
Energies 14 07680 g010
Figure 11. (a) Hydrogen concentration in pipelines in June. (b) Hydrogen concentration in pipelines in December.
Energies 14 07680 g011
Figure 12. Gas-fired power plant generation with constant volumetric flow consumption.
Energies 14 07680 g012
Table 1. Properties of natural gas in Germany [30].
Gas PropertiesUnitsL-GasH-Gas
Heating valueMJ/sm330.24–40.536–47.16
Specific gravity-0.55–0.75
Publisher’s Note: MDPI stays neutral with regard to jurisdictional claims in published maps and institutional affiliations.