Article

The Economics of Coking Coal Mining: A Fossil Fuel Still Needed for Steel Production

by
Adam Duda
1 and
Gregorio Fidalgo Valverde
2,*
1
Faculty of Mining, Safety Engineering and Industrial Automation, The Silesian University of Technology, 44-100 Gliwice, Poland
2
Department of Business Administration, Faculty of Mining, Energy and Materials, The University of Oviedo, 33004 Oviedo, Spain
*
Author to whom correspondence should be addressed.
Energies 2021, 14(22), 7682; https://doi.org/10.3390/en14227682
Submission received: 23 August 2021 / Revised: 5 November 2021 / Accepted: 11 November 2021 / Published: 17 November 2021
(This article belongs to the Topic Interdisciplinary Studies for Sustainable Mining)

Abstract

:
Coking coal has been on the European list of critical raw materials since 2014 due to its high economic importance and high supply risk. In 2017, coking coal narrowly missed passing the threshold of economic importance. However, out of caution, it remained on the list of critical raw materials, as the steel industry still needs it. It is likely to be phased out of the list below when it does not fully meet the required criteria. As there are no significant alternatives for this energy intensive industry and neither electrification nor material or energy efficiency improvements are yet available at a sufficient level of technological readiness, the European Union remains dependent on coking coal imports. Therefore, any coking coal mining project in Europe is of great importance and an important alternative to solving the problems of providing this raw material. In this study, the Dębieńsko coking coal project in Poland is analyzed using a scientifically proven methodology based on world-class analysis of coking coal projects submitted for financing to financial institutions.

1. Introduction

1.1. Coking Coal as a Critical Raw Material for EU

Raw materials are essential to the economy of the European Union. Uninterrupted and reliable access to these critical raw materials for European industry is a constant concern for the EU. To address this important challenge, the EU created a list of 14 critical raw materials in 2011 [1]. It was established as one of the priority actions of the 2008 Raw Materials Initiative [2] and addressed raw materials of high economic importance and high supply risk. The critical raw materials list (CRM) was to be updated regularly, at least every three years.
In 2014, coking coal was included for the first time, new to the analysis in addition to coking coal were silicon metal and phosphates [3]. For the first time, energy fossil resources were included in this list. However, biotic materials were not included in the revised list.
In terms of economic importance criteria, coking coal ranked second on the list, right after tungsten, due to its use in the metallurgical industry. In terms of supply risk (mismanagement), coking coal supply risk is high due to the high concentration of supply from China (53%) and Russia (8%). In addition, recycling of coking coal from primary uses was almost non-existent (0%), and the substitution index was 0.92, ranging from 0 to 1, where 1 indicates difficulty in substitution [3].
In 2017, the third list of 27 CRMs was published [4] based on a refined methodology [5]. Chromium, coking coal, and magnesite were not considered critical based on this assessment. However, coking coal was considered a borderline case. Although the assessment of the economic importance of coking coal was not positive, for precautionary reasons coking coal was maintained on the EU list of critical raw materials and thus included in the 2017 list. However, coking coal will be progressively removed from the list below if it does not meet all the assessment criteria to which raw materials designated as critical are subject.
The import reliance rate of coking coal in 2017 was 63%. This figure takes into account both global supply and actual EU domestic production when calculating the supply risk, and it is calculated as the result of dividing EU net imports by the sum of domestic production and EU net imports.
In the first list, substitution is included to reduce supply risks. However, it can also alter the potential consequences of supply shortages on the EU economy and includes an economic importance component [6]. The substitution index was then calculated separately for the economic importance and supply risk parameters, giving a value of 0.92 in both cases [4].
Coking coal has three main uses: as a fuel, chemical agent, and permeable support, with the steel industry, accounting for 95% of its use in the European Union. When used as a fuel or chemical, it can be replaced by other fuels such as gas, oil, or coal, but a substitute for coking coal as a permeable support has not yet been found [7]. Finally, the end-of-life recycling rate is 0% [4].

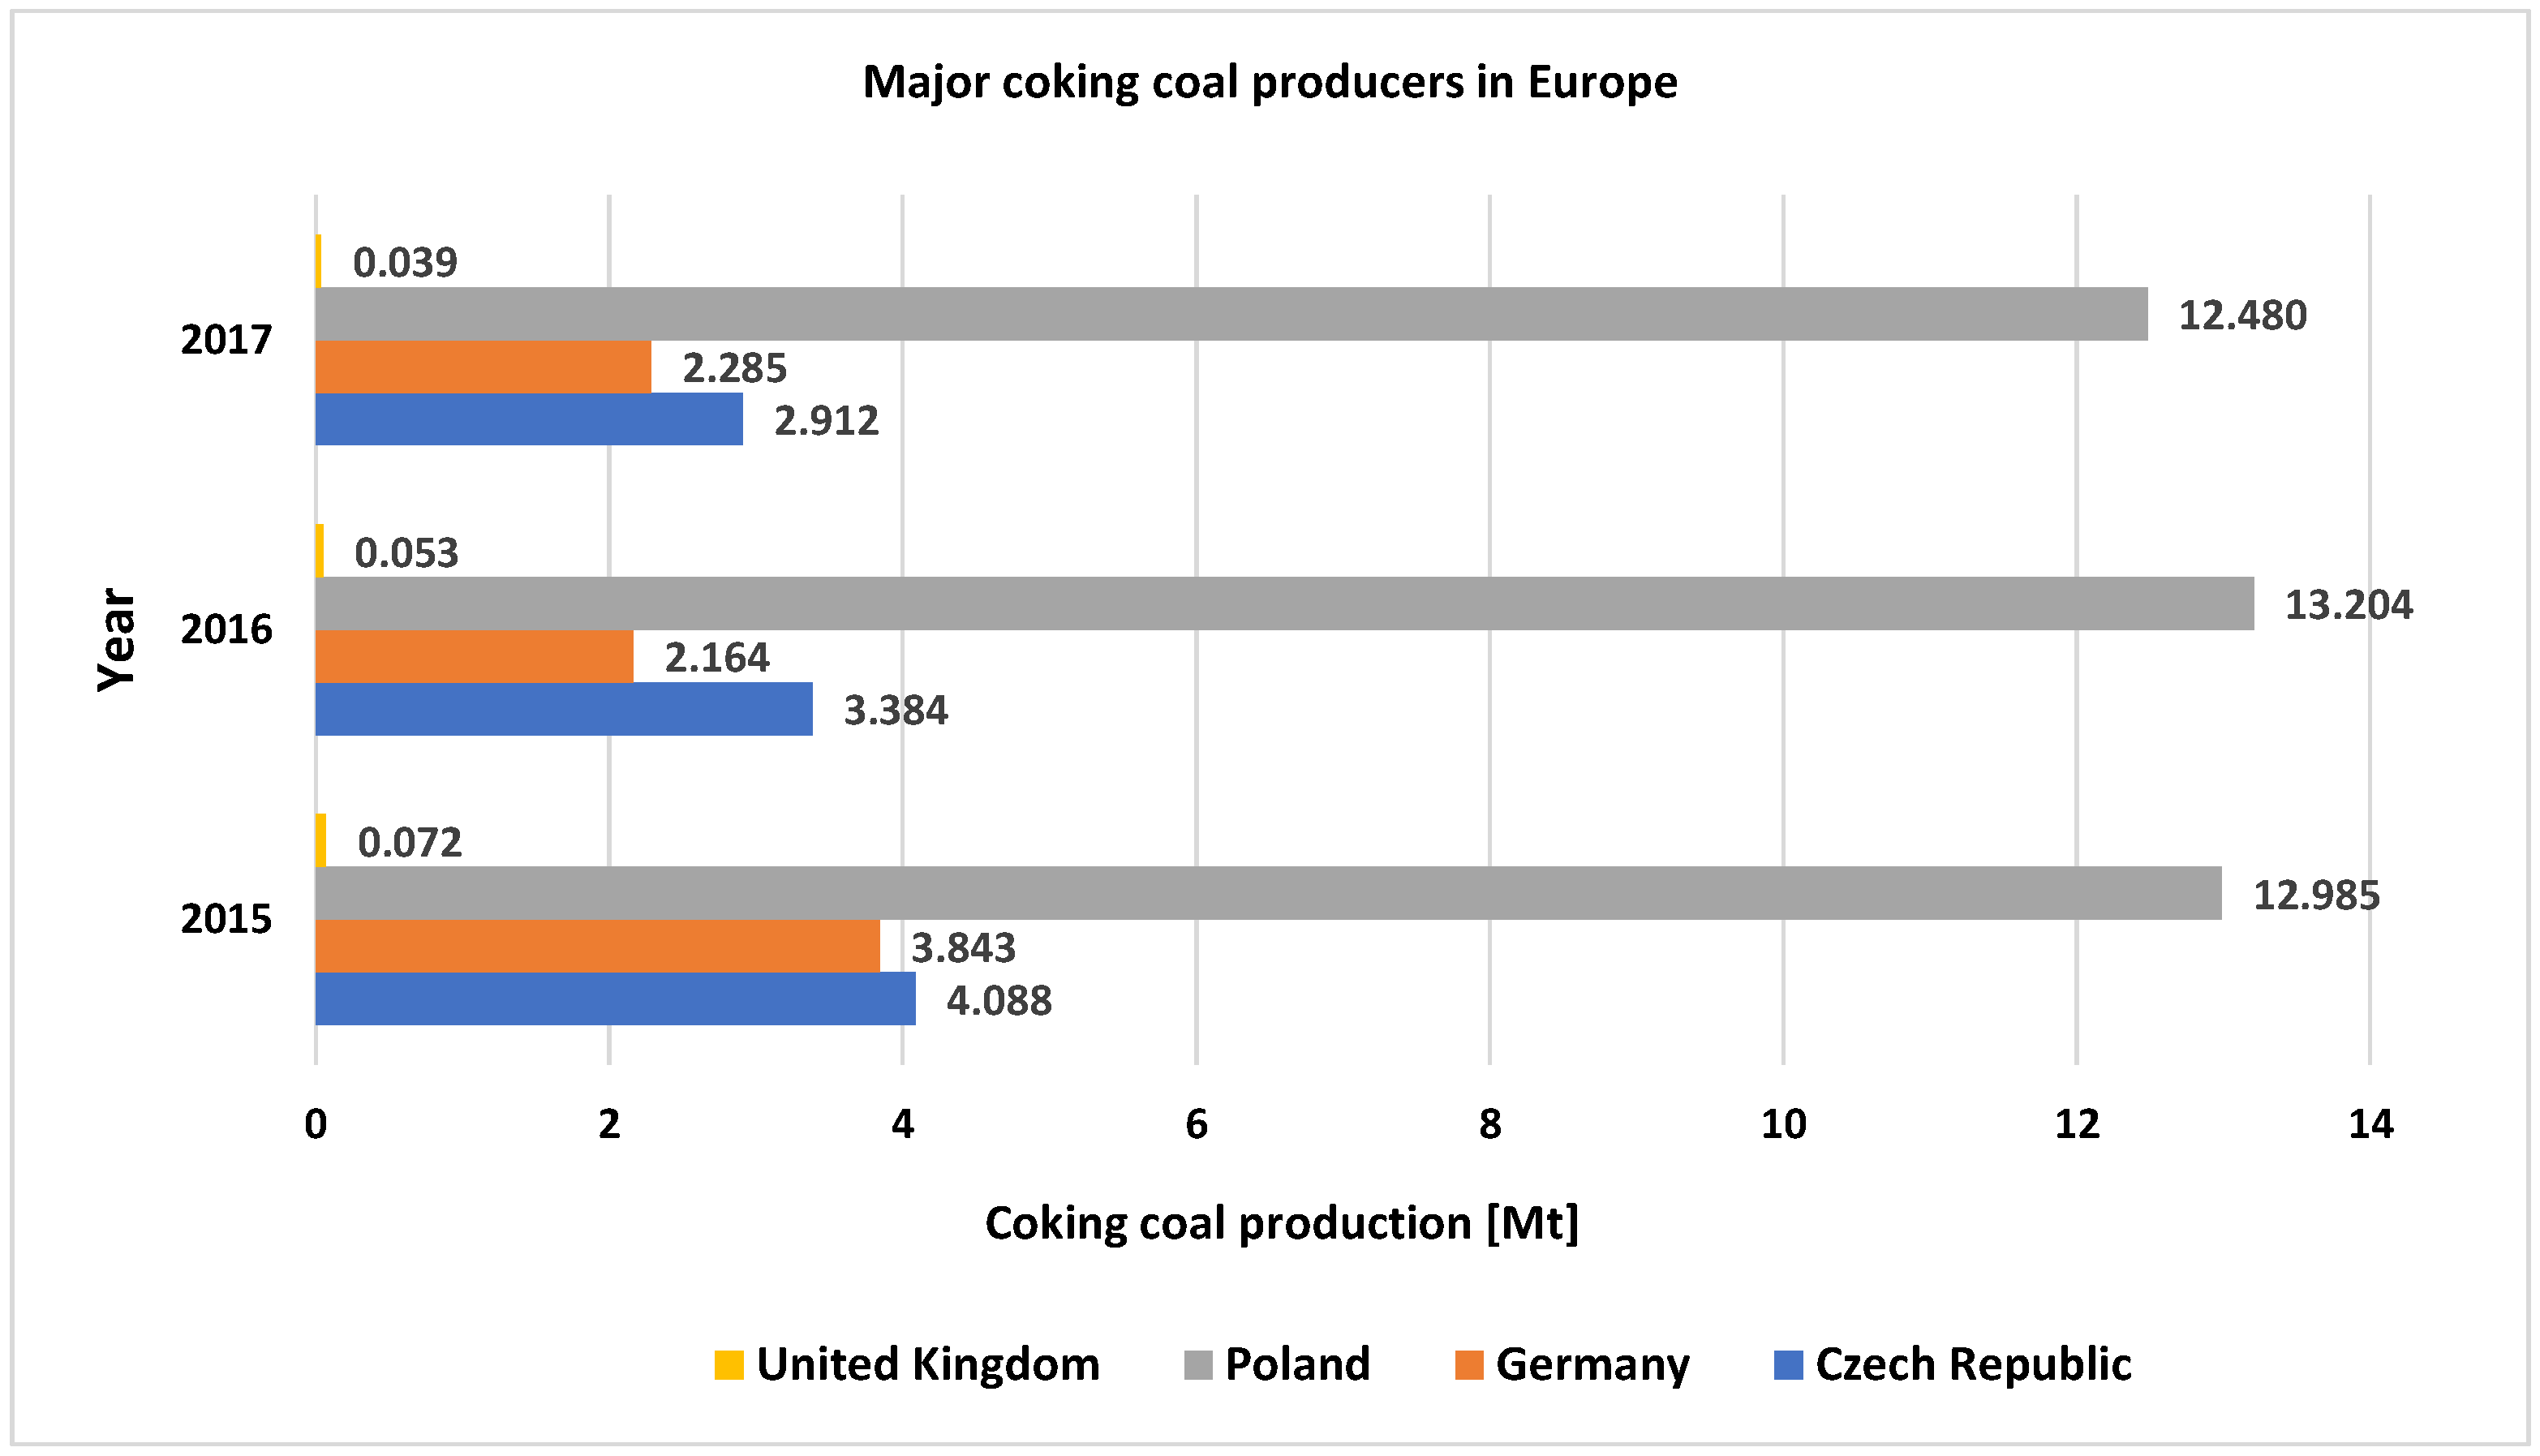
1.2. Coking Coal Production and Consumption

The International Energy Agency (IEA) reported that the downward trend in coking coal production in 2015 finally reversed in 2018, with total production of 1033 Mt. With the global consumption on the level of 997.9 Mt., almost half of the global production was from the People’s Republic of China, with an amount of 539.6 Mt. The increase of coking coal production was noticeable in Australia (the second largest world producer), the USA, Mongolia, and Mozambique, most of this growth being caused by the need to export. Total export amounted to 327.2 Mt, with Australia as the largest exporter (177.2 Mt). The total import of coking coal in 2017 was at the level of 294 Mt. The inequality between those two figures is due to the different methodologies of coal classification adopted by exporting and importing countries [8].
Figure 1 presents coking coal production within the European Union for 2015–2017 [9]. Poland is the largest producer, followed by Germany and the Czech Republic, but the distance between the production in these countries is very large. In contrast, the production of coking coal in the UK can be described as symbolic.
Table 1 presents the major European coking coal consumers in 2015–2017 [10]. Again, Poland is the leading consumer, but this time closely followed by Germany. The United Kingdom is in third place, closely followed by France and the Czech Republic.
According to the previous figures, throughout 2017, the EU relied on imports to supply 63% of their coking coal consumption. Given such premises, coking coal mine closures will likely affect the European steel industry, increasing the dependence on coking coal imports [11]. In order to ensure the necessary supply of coking coal for the EU steel industry, new mines need to be developed or new deposits need to be made available at existing mines.
The largest coking coal deposits in Europe are located in Poland, Ukraine, and the Czech Republic [12]. The 80% of hard coal deposits in the EU are located in the Upper Silesia Coal Basin, situated in Poland and the Czech Republic [13]. The remaining deposits are located in the Lublin Basin, in the south-eastern part of Poland near the border with Ukraine.
Ukraine, which is a priority partner for the EU, has proven reserves of coal of 56 billion tons [14], with deposits situated near the border with Poland and in the eastern part of the country, near the Russian border. These reserves rank Ukraine sixth in the world. Of the 56 billion tons, 30 percent is coking coal. In 2017, Ukrainian production of coking coal was on the level of 14.2 Mt.
Declining trends of non-coking coal production characterize the current situation of the Ukrainian coal industry: from 84 Mt in 2013 to 40 Mt in 2017 and coking coal production: from 24.2 Mt in 2013 to 14.2 Mt in 2017 [9]. The main factors contributing to such significant falls are mainly the hostilities in the eastern region of Ukraine and the poor condition of state-run mines built at the times of the Soviet Union [14].
In 2017, most of the Polish coking coal production came from a single company: Jastrzębska Spółka Węglowa, listed in the Warsaw Stock Exchange and comprising four mines producing coking coal and steam coal: Borynia-Zofiówka-Jastrzębie, Budryk, Knurów-Szczygłowice, and Pniówek. In 2017, they accounted for 10.7 Mt plus 4.1 Mt of coal for energy purposes. In 2018, they produced 10.4 Mt of coking coal, and during the first three quarters of 2019, they produced 7.6 Mt of coking coal, a slightly lower figure than for the same period in 2018 that accounted for 8.0 Mt [15].

1.3. Dębieńsko Coking Coal Project

In Europe, there is a vital coking coal project located in southern Poland: the Dębieńsko coking coal project. It is a high-quality coking coal deposit situated in the Upper Silesia Coal Basin, 40 km from Katowice and 30 km from the Czech Republic. Dębieńsko is bordered by two operating coal mines: Budryk Coal Mine and Knurów—Szczygłowice Coal Mine.
Dębieńsko coking coal project is strategically located near to the largest consumers of coking coal—metallurgical and coking plants situated, e.g., in the Czech Republic, Slovakia, Germany, Hungary, and Austria—all within 200–250 km from Dębieńsko. The nearest coke plant is located in Zdzieszowice, only 70 km from Dębieńsko, and is linked directly by railway. The location is strategic in Europe’s steelmaking heartland [16].
New World Resources Plc. (NWR) bought the Dębieńsko coking coal project in 2006. In 2007, the Ministry of Environment accepted the project plan and was granted a mining license for 50 years. NWR had several development projects in Poland and the Czech Republic. At the end of 2015, NWR’s coal reserves were estimated at 48 Mt, 4 Mt, located in the countries mentioned above [16]. The company’s location in the center of Europe is strategic because of the industries located in this area.
In 2013, NWR encountered the following problems: coal prices fell by nearly 25%, production decreased by 20%, costs rose by 10%, and revenues fell by 33%. Finally, NWR lost 182.6 M$. The impairment charges added up to 887.7 M$ to the loss. In 2016, Prairie Mining Ltd. acquired 100% shares of NWR Karbonia, an NWR subsidiary that controlled Dębieńsko, for a total of 2.20 M$.
Prairie Mining Limited is an Australian coal mining company listed in the Australian Securities and the London and Warsaw stock exchanges (ASX/LSE/WSE: PDZ). It is a modern company interested in exploration and production, which undertook two projects in Poland: Jan Karski Mine (Lublin Coal Basin) and Dębieńsko Mine (Upper Silesia). Located close to the raw materials resources and existing infrastructure, Prairie Mining Ltd. aspires to become a high-quality coal supplier with low delivery costs to European customers.
In this paper, the Dębieńsko coking coal project will be analyzed to determine if mining, a critical raw material still needed for steel production, can be of interest in Europe, as other alternatives for such an energy-intensive industry where electrification and other solutions such as materials and energy efficiency improvements are not available yet.

2. Materials and Methods

As the European Union is dependent on coking coal imports, Prairie Mining Ltd.’s plan for the Dębieńsko project is to produce 2.6 Mtpa of premium hard coking coal from the start of production. Prairie Mining Ltd. is going to use underground longwall mining, which has been used in Poland for a long time. The mine is projected to produce 4 Mtpa during the Run of Mine (RoM), with two longwalls to be mined simultaneously in different parts of the mine [17]. The total coal resources according to the Joint Ore Reserves Committee (JORC) Code [18] are shown in Table 2.
The production was planned to ramp up four years after the beginning. Table 3 shows the assumed production parameters.
In order to analyze these data, the work developed by Matyjaszek et al. [20] was used. It was based on five ready-to-go projects worldwide: Lublin in Poland, Kodiak in the USA, Amaam in Russia, Makhado in South Africa, and Crown Mountain in Canada. In this work, the authors develop an exhaustive analysis of coking coal mining investment, providing a tool to allow quick discrimination between feasible and non-feasible projects.
Precisely, they were able to establish a relationship between capital expenses (CAPEX) and clean coking coal production:
C a p e x   o p e n c a s t   ( M $ )   = 127.13 × C l e a n   c o a l   p r o d u c t i o n   ( Mtpa ) + 41.57
Operating costs were assessed based on the yield and the transport costs:
( a )   Yield   1 :   71 82 % .   Operating   costs : 44.8   $ / t   ( Lublin   &   Ammam ) . ( b )   Yield   2 :   49 52 % .   Operating   costs :   91.37   $ / t 99.89 $ / t   ( Crown   Mountain Kodiak ) . ( c )   Yield   3 :   23 % .   Operating   costs :   122.62   $ / t   ( Makhado ) .
Mining costs in $/t of saleable coal of the different projects were assessed based on the operating costs:
( a )   Mining   costs 1 :   13 19   $ / t .   Operating   costs : 44.8   $ / t   ( Lublin     Ammam ) . ( b )   Mining   costs   2 :   31 48   $ / t .   Operating   costs :   91.37   $ / t 99.89   $ / t   ( Crown   Mountain Kodiak ) . ( c )   Mining   costs   3 :   77   $ / t .   Operating   costs :   122.62   $ / t   ( Makhado ) .
    P r o c e s s i n g   c o s t s   ( $ / t ) = 17.747 × Y i e l d + 17.44
Also, they conclude that appropriate discount rates should be used, and disclosure of how price forecasting should be developed is described in the paper.
In turn, this paper is based on the seminal work by Suárez Sánchez et al. [21] and by Riesgo García et al. [22].
Suárez Sánchez et al. [21] analyzed investments in tungsten mining based on the analysis of five ready-to-go projects worldwide: Barruecopardo in Spain, Kilba in Australia, Hemerdon in the United Kingdom, Sangdong in South Korea, and King Island Scheelite in Tasmania. This analysis established relationships between the CAPEX and the operating expenses (OPEX) based on the mining and processing parameters.
For its part, Riesgo García et al. [22] analyzed rare earth mining projects worldwide, studying five ready-to-go projects again: Nechalacho in Canada, Zandkopsdrift in South Africa, Bear Lodge in the USA, Kvanefjeld in Greenland, and Dubbo Zirconia in Australia. They established a relation between CAPEX, processing tons and processing grade, and different relations for OPEX (mining costs, processing costs, and separating costs) with the mining tons, the processing tons and the different processing grades.
Later, a work by Sterba et al. [23] was also based on these seminal works. Sterba et al. analyzed the technical and economic magnitudes of lithium mining projects, based again on five ready-to-go projects worldwide: Whabouchi in Canada, Keliber in Finland, Cauchari-Olaroz in Argentina, Sonora in Mexico, and Pilgangoora in Australia. They established a correlation between the CAPEX and lithium carbonate production and different relations for the OPEX.
The seminal work by Riesgo García et al. [22], as well as the work by Sterba et al. [23], were contrasted by analyzing specific mining projects: in the first case, the Sarfartoq rare earth element project in Greenland [24], and in the second case, the Cínovec lithium mining project in the Czech Republic [25]. Thus, this paper will be based on a sound theoretical background, contributing with a specific analysis not yet developed in coking coal mining investment.
To estimate the financial outcomes, Net Present Value (NPV), Internal Rate of Return (IRR), and Payback Period (PP) will be determined in order to establish the feasibility of the project. As a specific funding scheme should be developed for any investment, the NPV should be determined using the weighted average cost of capital (WACC) [26]. Nevertheless, according to the AIM Rules—Guidance for Mining and Oil & Gas Companies [27], a 10% discount rate (post-tax) should be appropriate for this purpose.
Risk analysis techniques have long been recognized as powerful tools to help decision-makers successfully manage situations subject to uncertainty. In the first place sensitivity analysis, a risk assessment process that predicts the result using variables that affect the outcome, was developed using the software TopRank 7.5 (Palisade Corporation, New York, NY, USA). TopRank performs automated “what if” sensitivity analysis on Microsoft Excel spreadsheets to answer what variables affect the most. TopRank finds and varies all input cells that affect the output, with a result easy-to-understand through tornado charts, spider graphs, and other reports that identify and rank, which affect the outcome the most.
Mostly, sensitivity analysis is followed by an uncertainty analysis, which quantifies uncertainty in model outcomes.
An uncertainty analysis focuses on quantifying uncertainty in model outputs. To provide decision makers with useful information, it is necessary to generate a comprehensive range of potential outcomes and relative probabilities. This approach allows the best possible decisions to be made. A Monte Carlo simulation is typically used when conducting an uncertainty analysis on critical variables. This simulation approach involves a computerized mathematical technique that allows one to account for risks involved in the quantitative analysis and the decision making. @RISK 7.5 (Palisade Corporation, New York, NY, USA) was the software used for the simulation. @RISK has advanced capabilities for specifying and executing simulations of Excel models. Both Monte Carlo and Latin Hypercube sampling techniques are supported, and distributions of possible results may be generated for any cell or range of cells in the spreadsheet model. High-resolution graphics are used to present the output distributions: histograms, cumulative curves, and summary graphs.
In order to develop the economic analysis, the assumptions presented here were used. Table 4 presents the assumptions for the life of mine, yield, and clean coal production. They were taken from the scoping study for the fully permitted Debiensko mine [17].
Relating royalties and according to the Geological and Mining Law [28], a mining area is designated for each mineral in Poland. Within such an area, the mine obtains the right to extract minerals for a given time. This right is included in the concession to exploit the deposit granted by the minister responsible for environmental affairs. Granting a concession obliges the mine to pay an operating fee. This fee is calculated as the product of the exploitation rate and the extraction volume in a given year. The rate limits are determined by the minister responsible for the environment and depend on the type of mineral. The level of royalties for coking coal is 0.80 $/t.
Finally, metallurgical coal prices were relatively stable in 2018, starting at just over 250 $/t, drifting down to 175 $/t in August and recovering by year-end to around 200 $/t free on board (FOB) for Australian prime hard coking coal [29]. A conservative 100 $/t price will be considered to prevent drastic price reductions of 75 $/t in 2018.

3. Results and Discussion

3.1. Economic Analysis

The Capital expenses (CAPEX) estimation model for an opencast coking coal project was developed by Matyjaszek et al. [20], and calculated using Equation (1). Although this relationship was established for opencast coking coal mines, underground mines, CAPEX was always below this regression line to be applicable for a conservative analysis. Based on this, CAPEX was estimated at an upper limit of 372 $M.
Addressing operating costs (OPEX), as for the Dębieńsko project, Prairie Mining Ltd. estimated the total product yield to be about 68% LoM (Table 4), it is possible to estimate that the operating costs using Equation (2) can be at a level of nearly 45 $/t. Using Equation (2), as in coking coal projects with a yield of 71-82%, the operating costs can be valued at this level. In the Dębieńsko project, a rounded mining cost of 19 $/tof saleable coal can be considered according to Equation (3).
The low level of average operating costs is due, among other things, to the project’s location in a country with extensive mining sector experience and large coal reserves [20]. Dębieńsko is well connected to Poland’s central railway and the regional railway network between the Upper Silesia Coal Basin coal mine centers. Also meaningful is its direct connection to the main roads, especially highway A1 highway, which enables transport to the Baltic seaport in Gdańsk and the Czech Republic and other European countries/its motorways [17]. Some of the Silesian coal mines also use the port and waterway channel, located nearby, in Gliwice (25 km from Dębieńsko) to transport excavated coal by ships to Opole and Wrocław. Further development of water navigation is planned for this channel. Therefore, good location and the developed transport network allow reducing the transport costs. In the case of transport to Zdzieszowice coke plant within one day, the rail freight and handling costs are only 4.60 $/t, compared to the delivery cost to Australia within 59 days: 37.7 $/t, where the total delivery cost to Zdzieszowice is approximately 51 $/t [17].
The yield information is essential to determine the processing costs of coking coal projects, as it may be considered a critical factor in this case. With the yield known, it is possible to calculate the processing cost of marketable coal ($/t) using Equation (4) from Matyjaszek et al. [20]:
According to the Equation (4) and using a yield of 68%, it is possible to calculate the processing costs. In the Dębieńsko project, they are estimated as 5.4 $/t of saleable coal.

3.2. Financial Outcomes

Working capital was estimated as 50% of total costs, and the amortization was foreseen for 120 years, resulting in a 5% annual. Finally, taxes were considered at 19%.
With these values, the calculations for the cash-flows for the Dębieńsko project are presented in Table 5.
As is described in part 2 (Materials and Methods), NPV, IRR, and PP were calculated and presented in Table 6, showing that smaller Dębieńsko project has an after-tax internal rate of return more significant than the Lublin project although with a higher payback period.

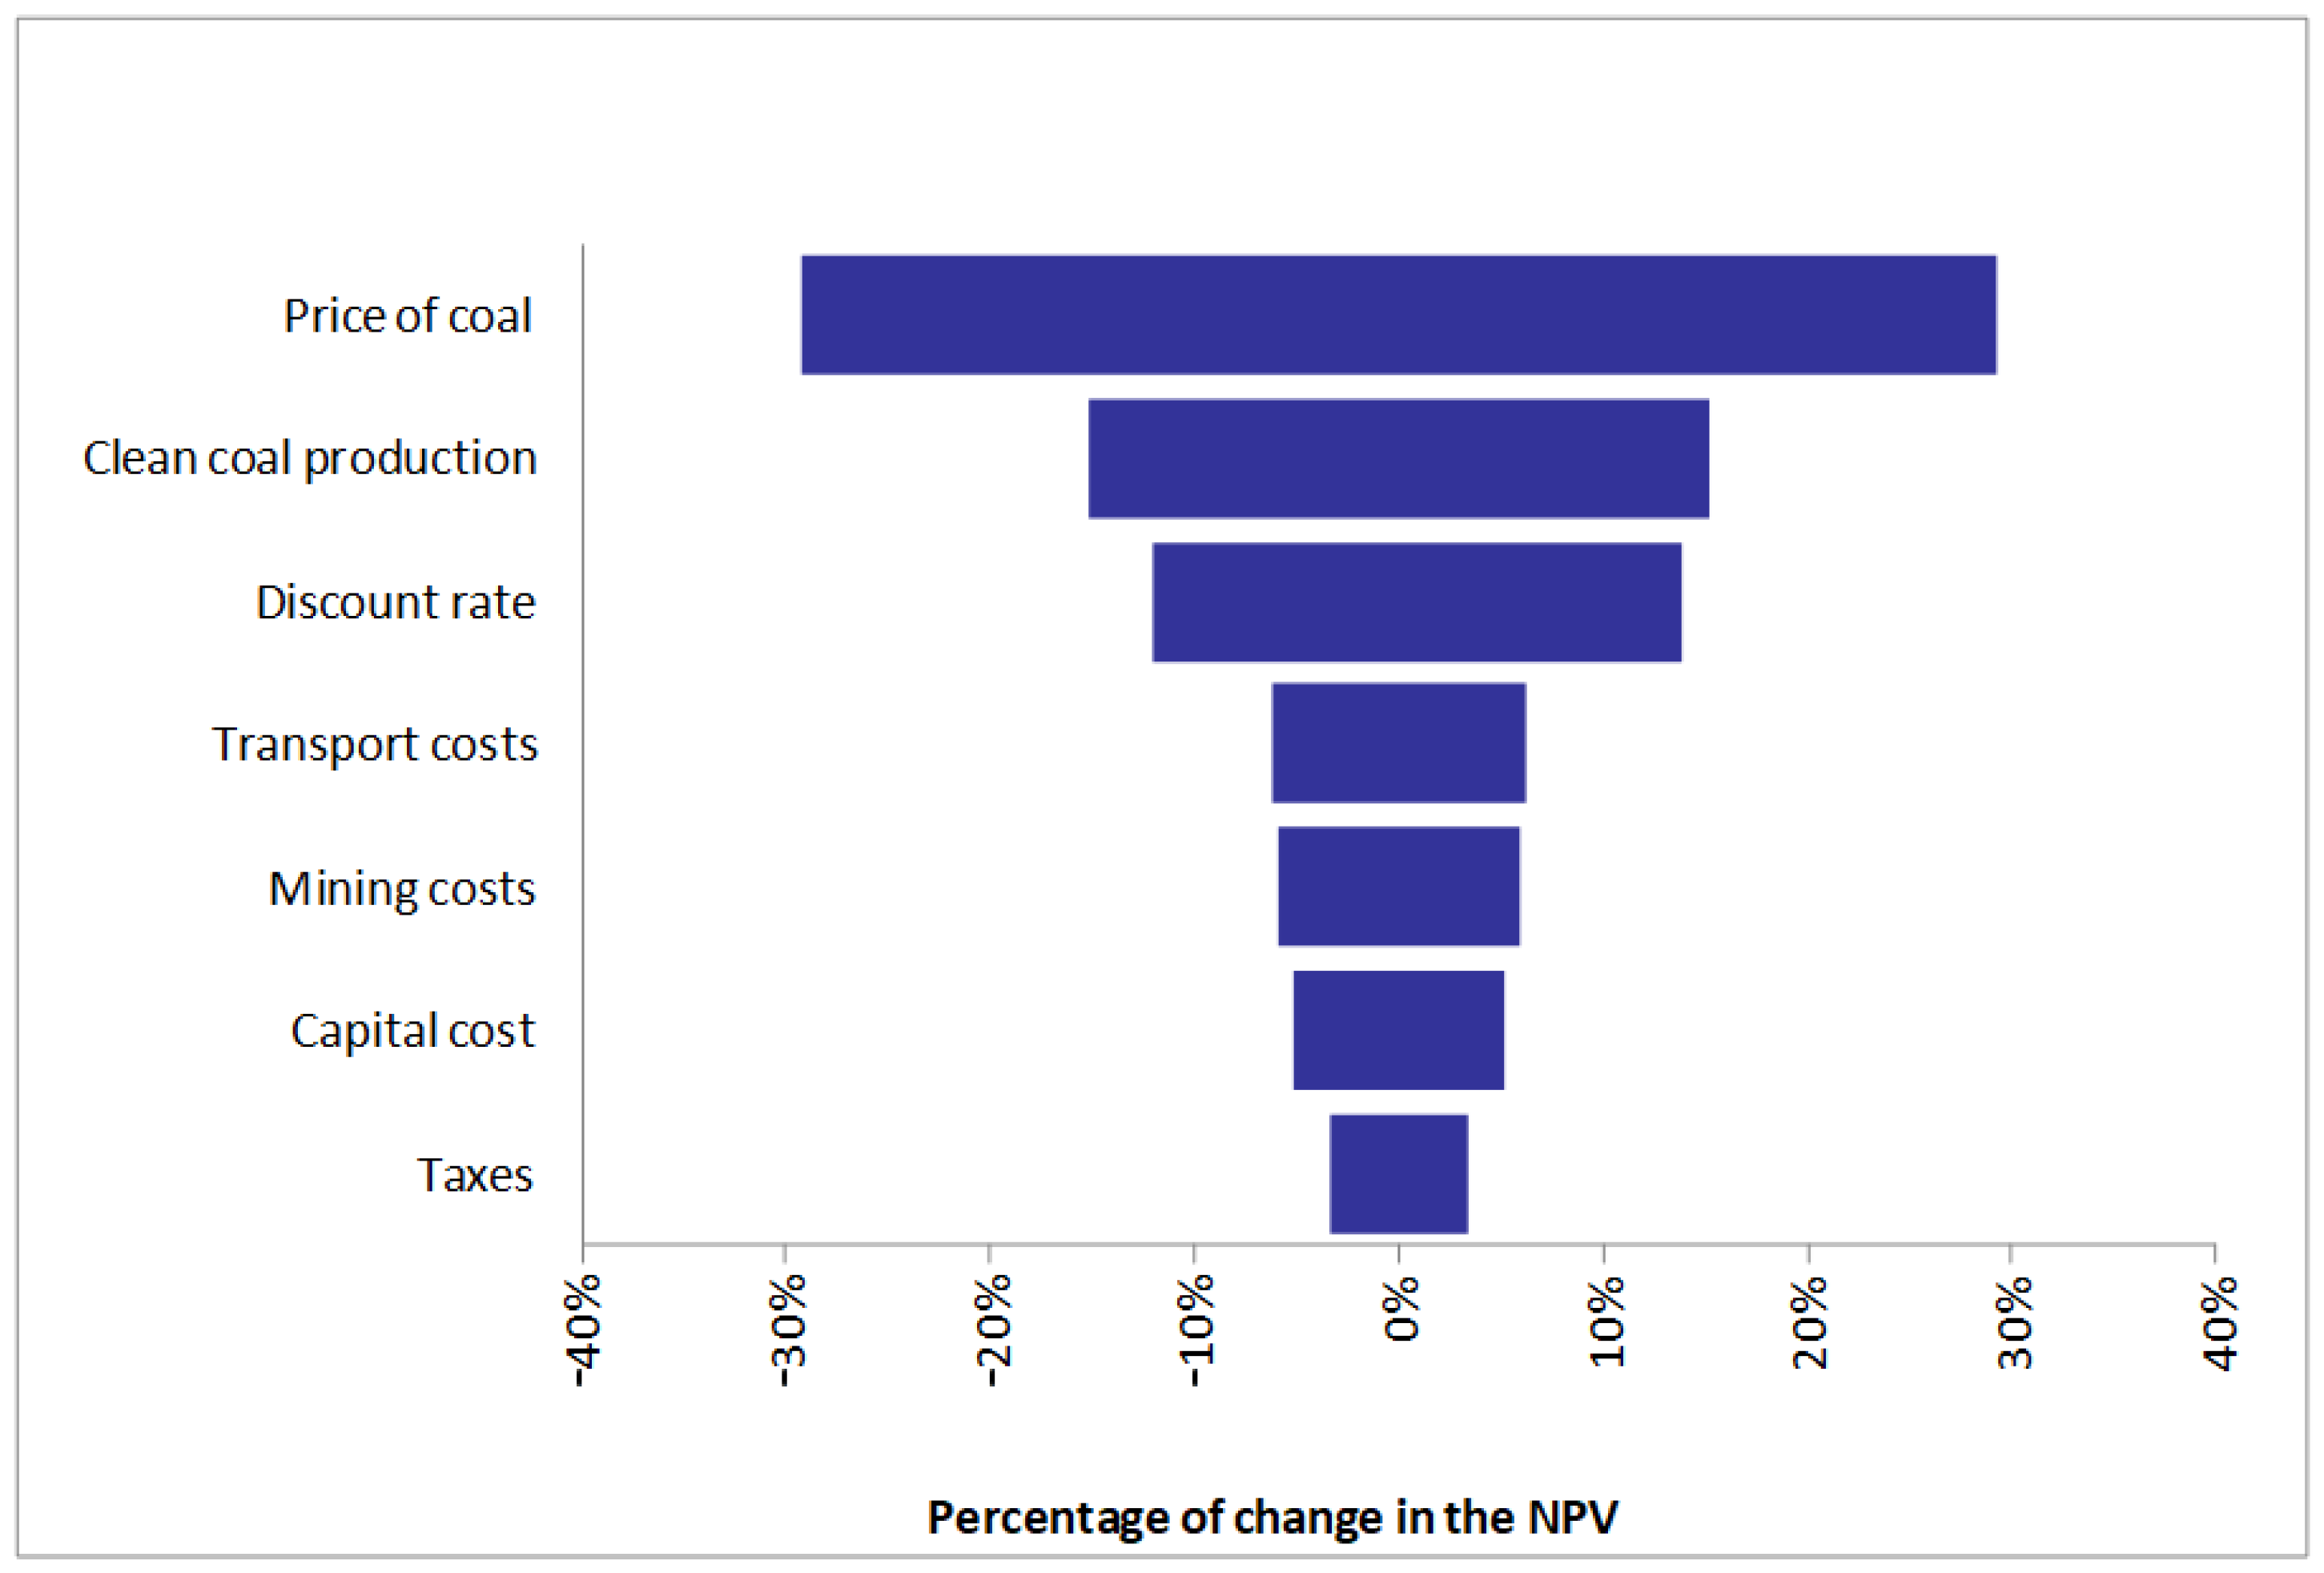
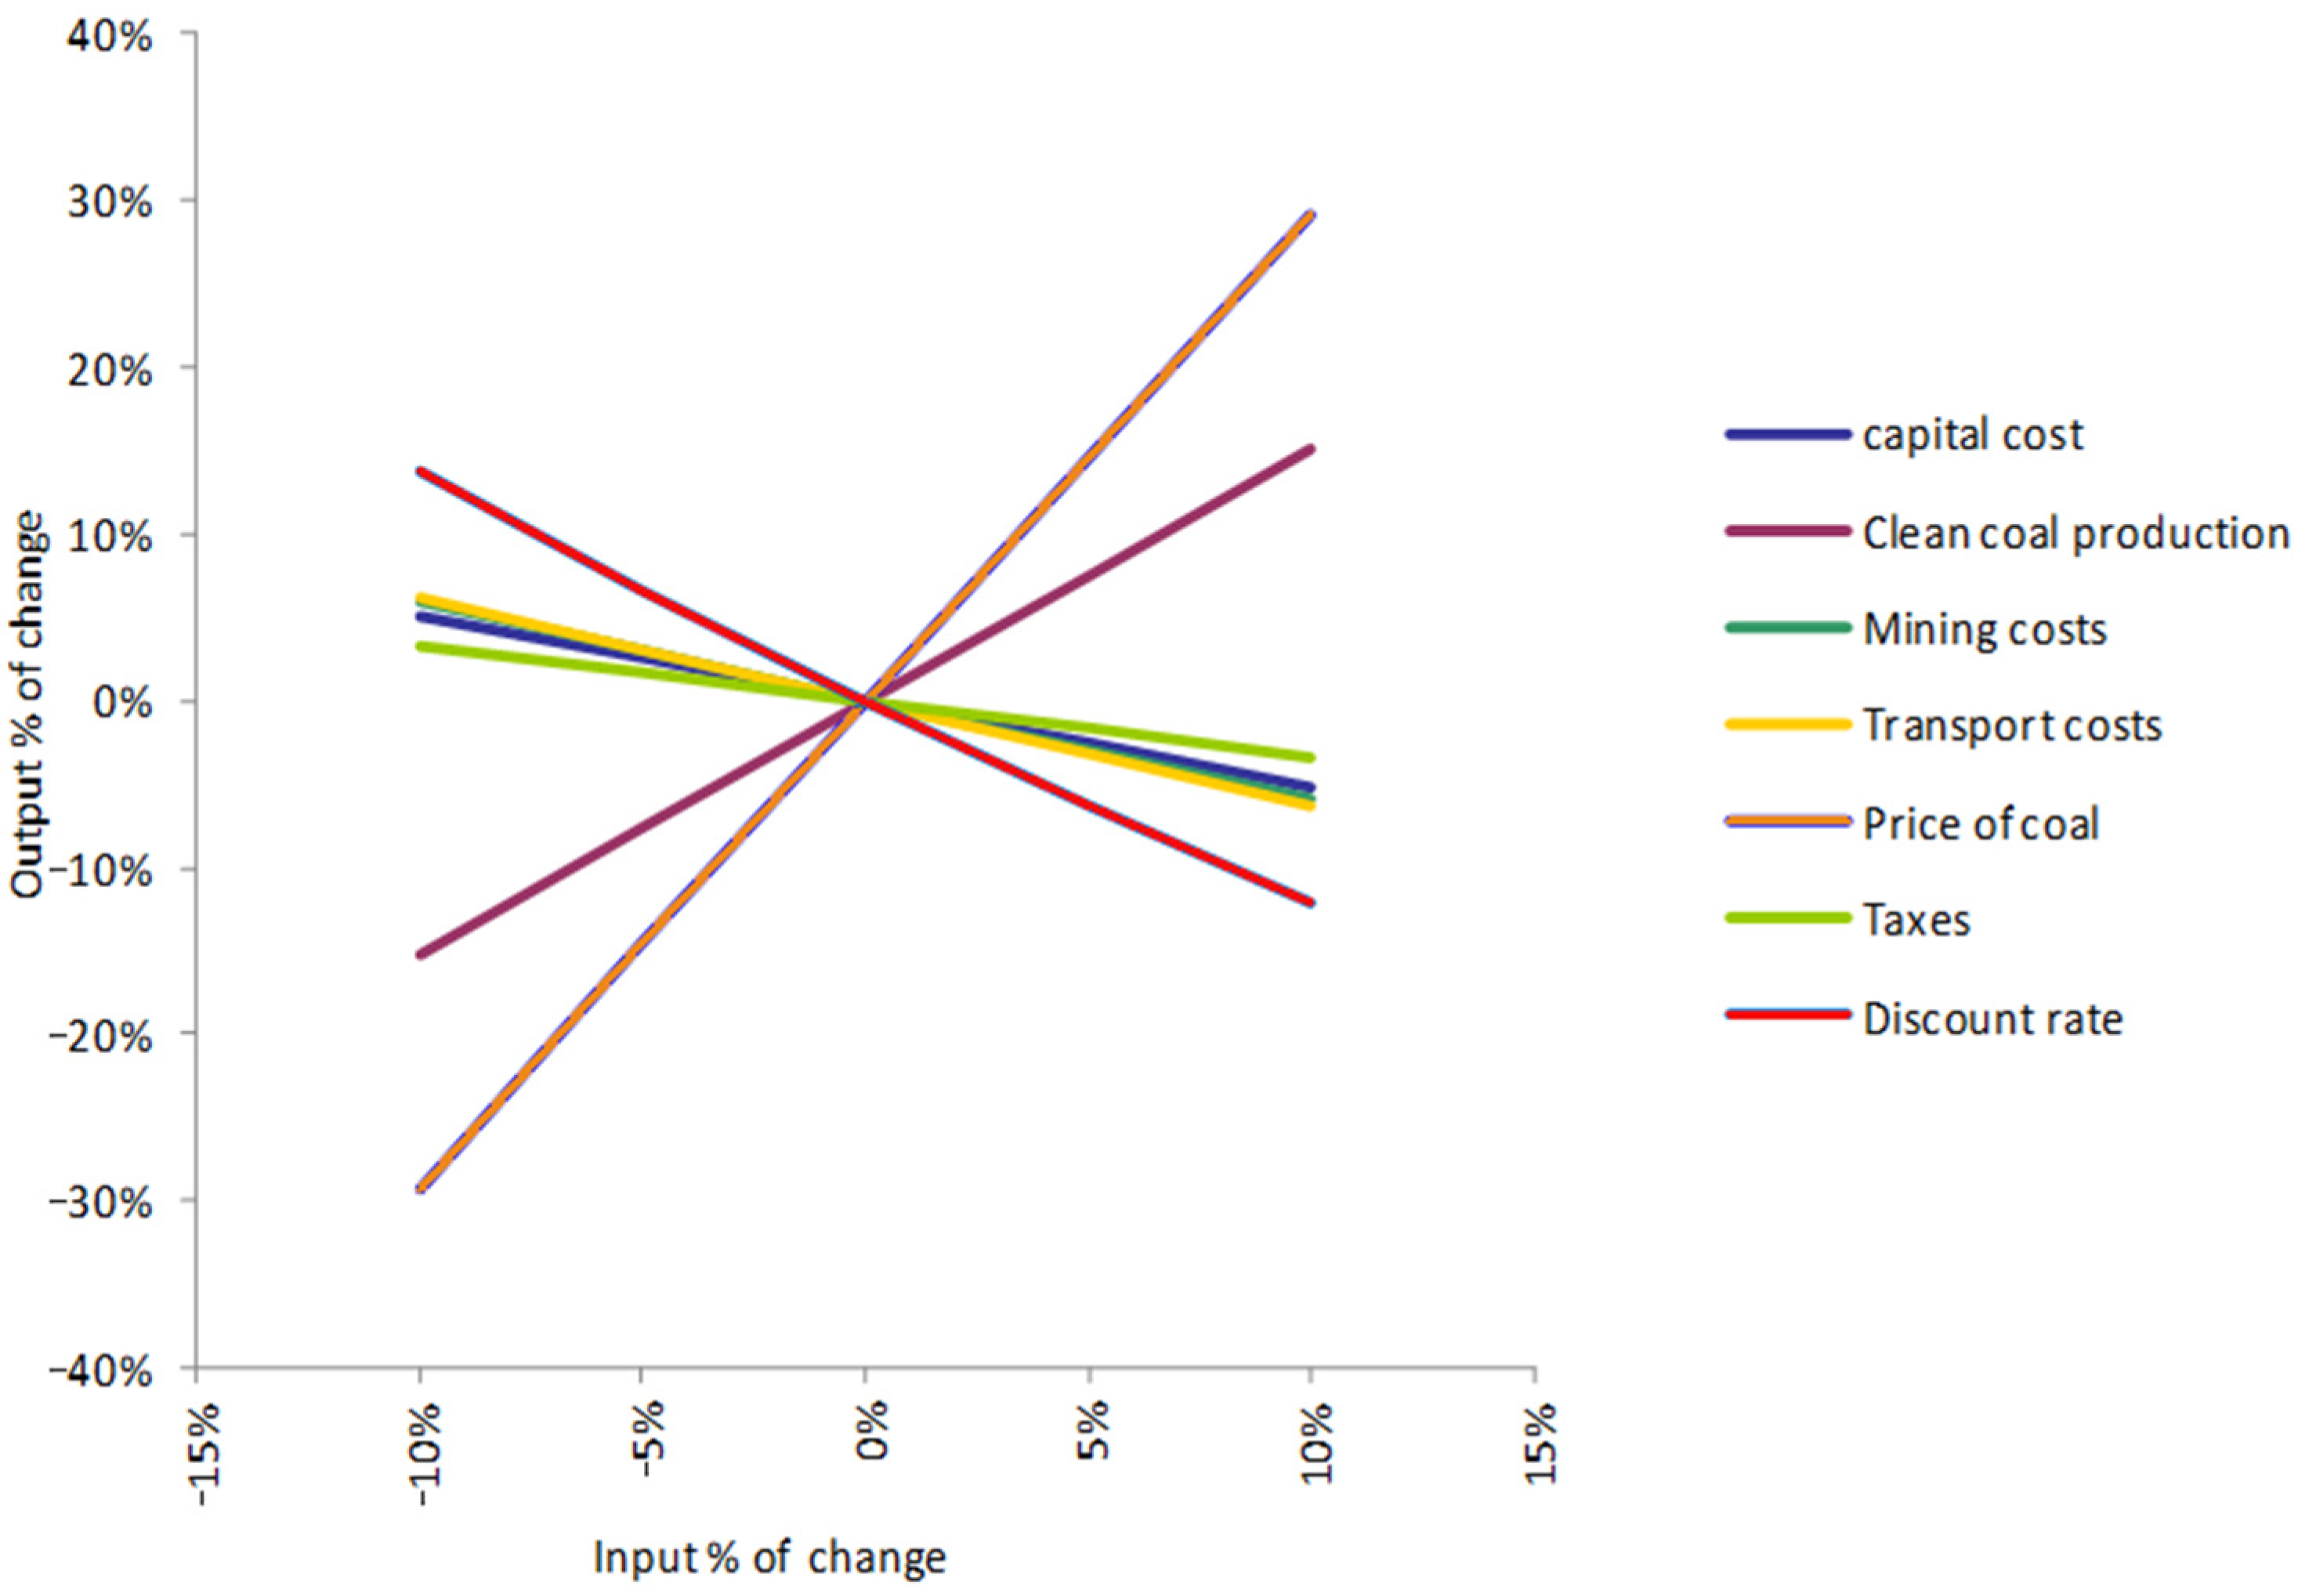
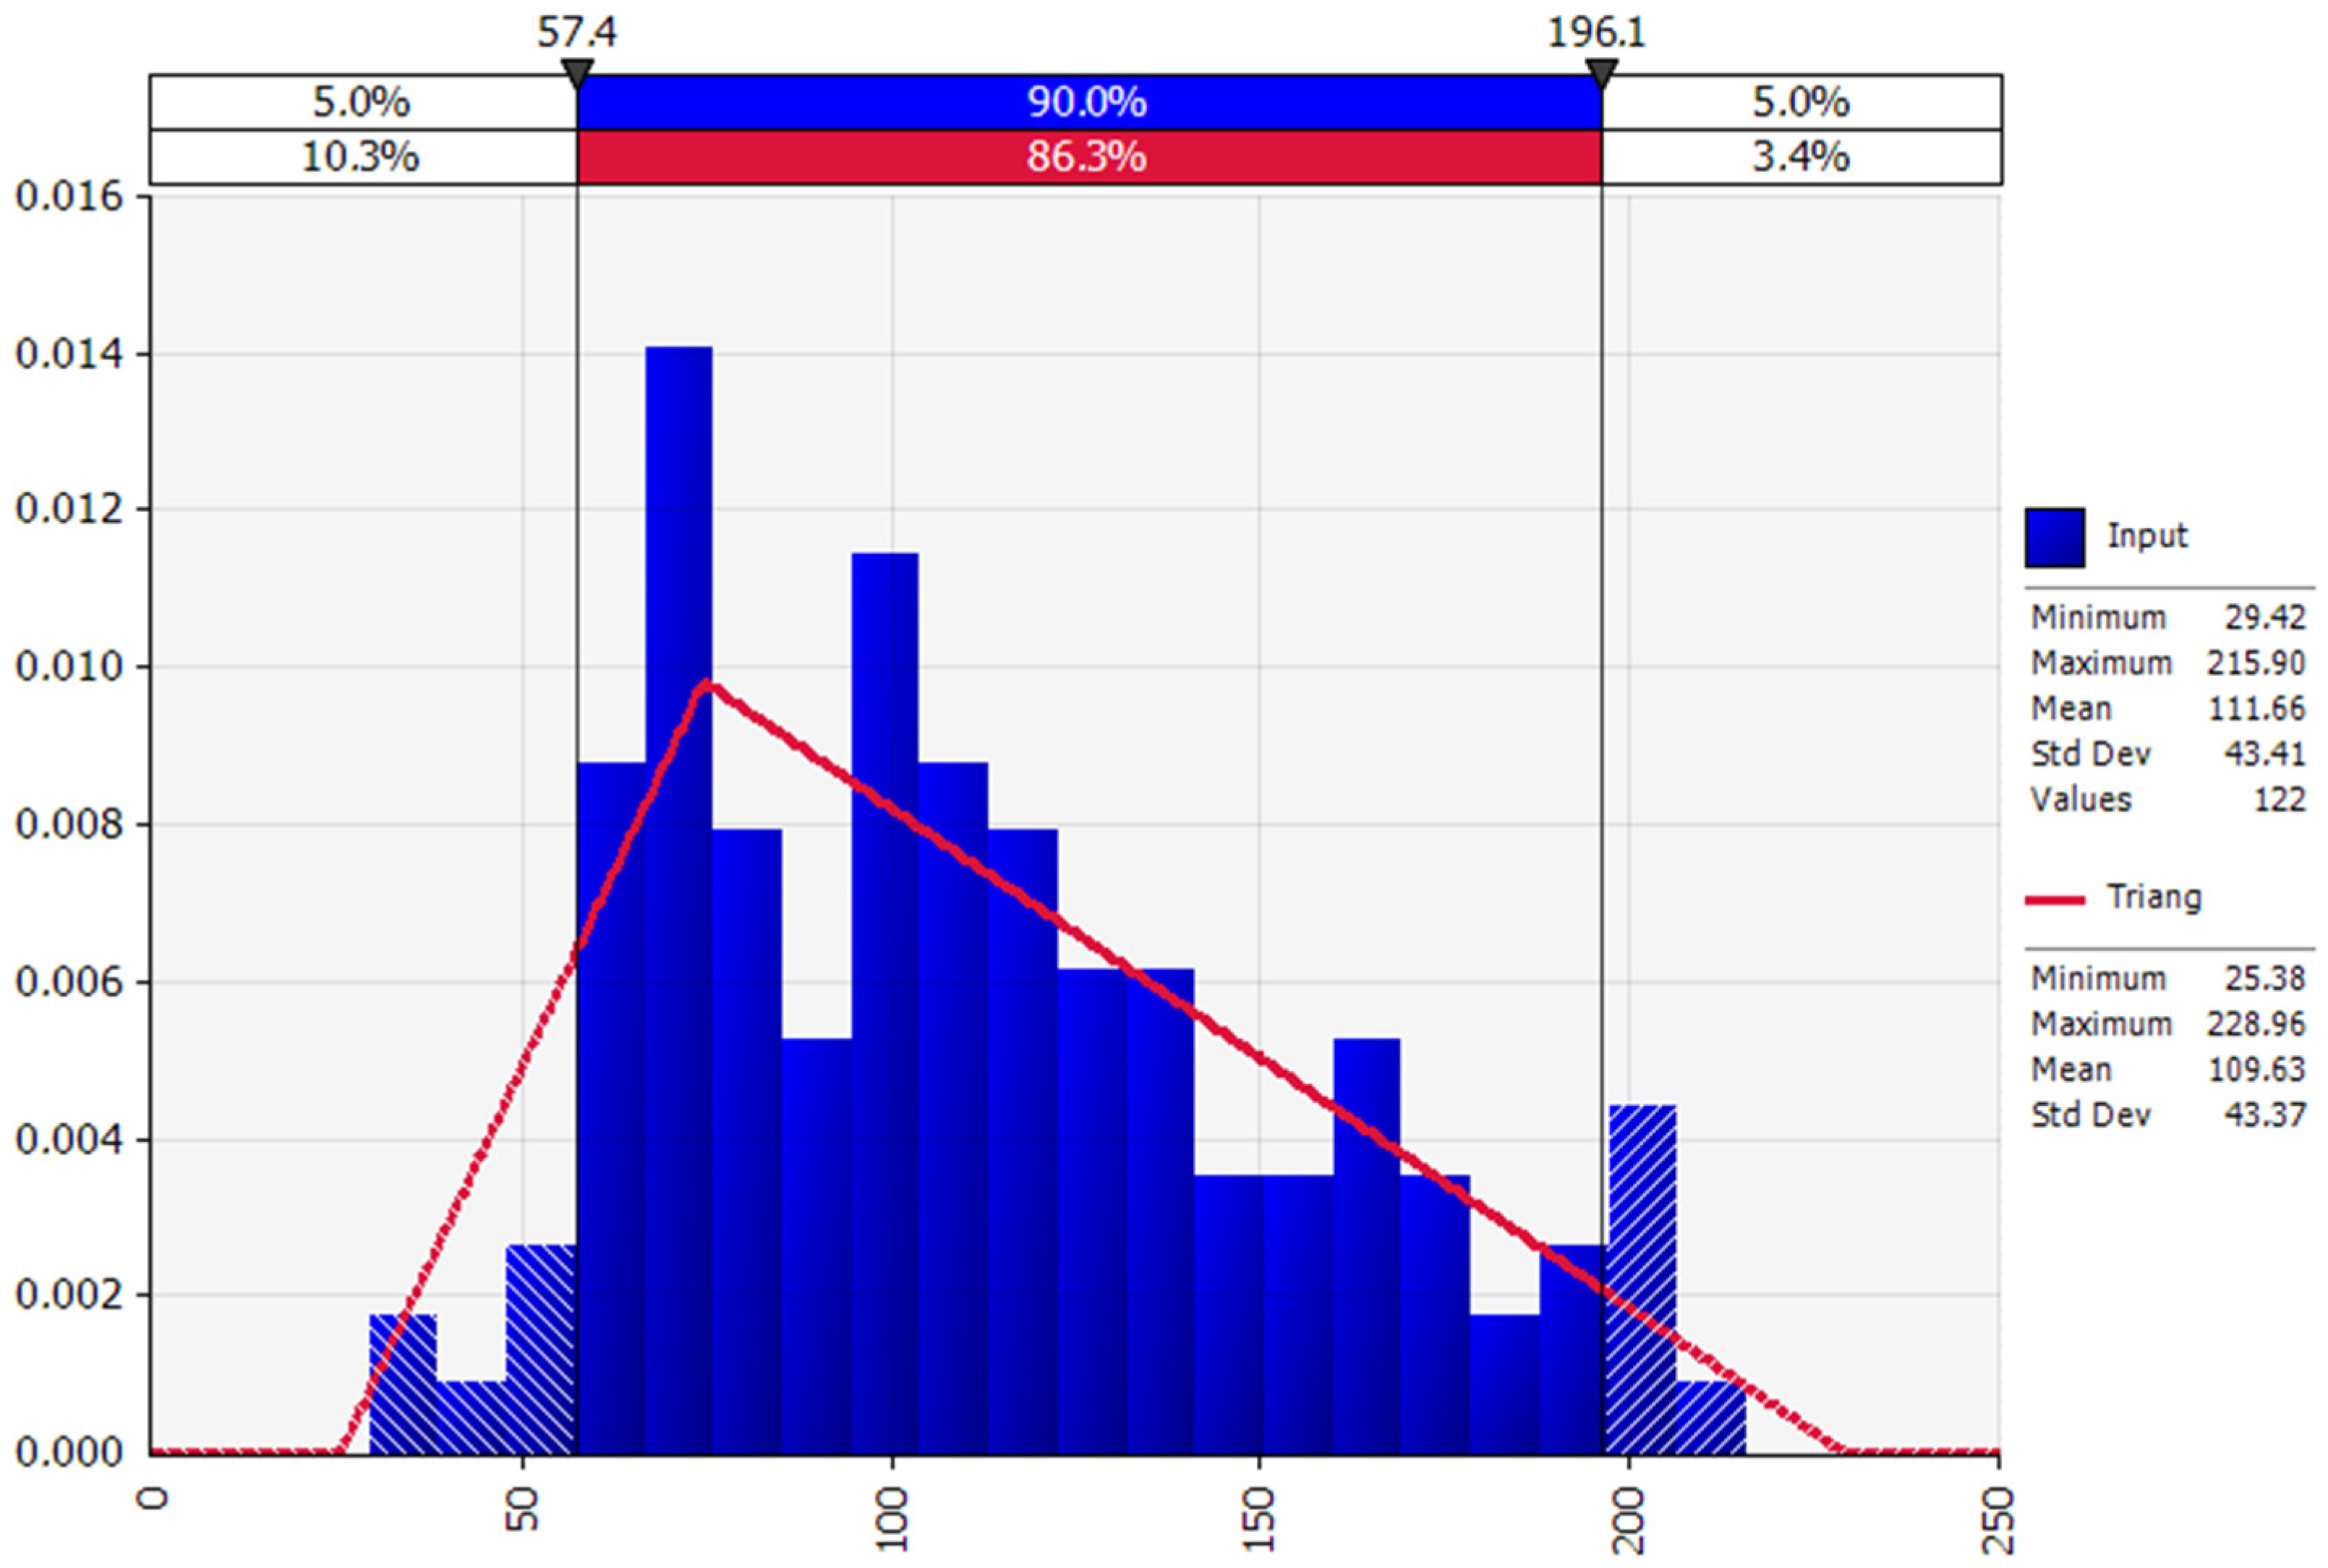
3.3. Sensitivity and Uncertainty Analysis

For presenting the results of the sensitivity analysis, a tornado graph was used. Figure 2 shows a ranking of the input distribution that impacts the output. The longer bars at the top of this graph present input variables that are the most significant, being the price of coal, the most significative variable. Changes of the seven most influencing variables in the range of ±10% and their impact on the outcome are presented.
Price of coking coal has, followed by clean coal production and the discount rate, a similar influence weight.
The impact of input values on the output values is presented in a spider graph (Figure 3). The more significant the impact, the steeper the line. The spider graph presents a percentage change in the output (NPV) in reaction to the percentage change in the input variables.
Given the sensitivity analysis results, only two variables will be considered for the Monte Carlo uncertainty analysis: the price of coal and clean coal production. In order to estimate future prices, prices of coking coal from Colombia FOB mid-volatile hard coking coal historical prices between 1991 and 2016 were used [30], as it was not possible to access more actual prices since payment for them is required.
The distribution of coking coal prices is presented in Figure 4, and a triangular distribution is the best possible fit for these values, according to @RISK. It is characterized by a minimum possible value, a most likely value and a maximum value, as presented in red in the figure, obtaining: RiskTriang (25;75;229).
Nevertheless, a minimum price of 50 will be used, as the number of monthly prices below this value is almost negligible, so that the function to use will be: RiskTriang (50;75;229).
Addressing current clean coal production, the expected production in one year is 2.600 Mt, a cumulative distribution will simulate this variable. Cumulative distributions have n points between minimum and maximum with cumulative ascending probability at each point. The parameters that will be used in this case are presented in Table 7. The expected clean coal production in one year is 2.600 Mt. However, the final production may not reach this figure for many reasons, so different probabilities are assigned for 2.400 and 2.500 Mt.
After the Monte Carlo analysis, the NPV distribution result is presented in Figure 5. The mean value of 954 M$ improves the Net Present Value calculated via the cash-flows of 660 M$, thus far outweighing the uncertainty analysis.

4. Conclusions

Coking coal is a critical raw material for the EU that is still needed by the steel industry. There are no clear alternative solutions for this electricity-intensive industry, as neither electrification nor improvements in materials or energy efficiency are yet available at a sufficient Technology Readiness Level (TRL). On the other hand, coking coal “substitution index” that measures the difficulty of replacing the material, scored and weighted across all applications, is 0.92 according to the EU, with values between zero and one, one being the least substitutable, and there is no possibility of recycling coking coal. These factors indicate that the European Union remains dependent on coking coal imports, with domestic production covering only 37% of its consumption.
Therefore, any coking coal mining project in Europe id an answer to the existing demand in Europe. Specifically, this article analyses the coking coal mining project in Poland called Dębieńsko, using a scientifically proven methodology based on a world-class analysis of coking coal mining projects that have been submitted to financial markets for financing.
The calculations made based on this world-class analysis of coking coal mining projects show that the internal although of smaller dimension, Dębieńsko project has an after-tax internal rate of return of 28.0%, more significant than 26.6% from Lublin project although with a higher payback period: five and three years, respectively.
Risk analysis techniques have long been recognized as powerful tools to help decision-makers successfully manage situations subject to uncertainty. The variable with the most significant impact on NPV is the coking coal price, followed by the clean coal production and the discount rate, with similar influence weights.
After modelling probability distributions for coking coal price and clean coal production, a Monte Carlo analysis was developed. The NPV distribution result has a mean value of 954 M$, thus improving the Net Present Value calculated via the cash-flows (660 M$), far outweighing the uncertainty analysis.
It is clear from the analysis of this project that its profitability is even higher than that of the most critical mining projects currently underway, such as Lublin, also in Poland. Also, Dębieńsko has successfully passed the most rigorous risk analysis that can be performed and is directly related to the price of this raw material.

Author Contributions

Conceptualization, G.F.V. and A.D.; Methodology, G.F.V.; Software, G.F.V.; Validation, G.F.V. and A.D.; Formal analysis, A.D.; Investigation, G.F.V. and A.D.; Resources, G.F.V. and A.D.; Data curation, G.F.V. and A.D.; Writing—original draft preparation, G.F.V. and A.D.; Writing—review and editing, G.F.V. and A.D.; Visualization, G.F.V.; Supervision, G.F.V.; Project administration, A.D. All authors have read and agreed to the published version of the manuscript.

Funding

This research and the APC was funded by the Technical Research Foundation “Luis Fernández Velasco”, grant number OE-17/2021.

Conflicts of Interest

The authors declare no conflict of interest.

References

  1. European Commission. Communication from the Commission to the European Parliament, the Council, the European Economic and Social Committee and the Committee of the Regions. Tackling the Challenges in Commodity Markets and on Raw Materials; European Commission: Brussels, Belgium, 2011. [Google Scholar]
  2. European Commission. The Raw Materials Initiative—Meeting Our Critical Needs for Growth and Jobs in Europe; European Commission: Brussels, Belgium, 2008. [Google Scholar]
  3. European Commission. On the Review of the List of Critical Raw Materials for the EU and the Implementation of the Raw Materials Initiative; European Commission: Brussels, Belgium, 2014. [Google Scholar]
  4. European Commission. Communication from the Commission to the European Parliament, the Council, the European Economic and Social Committee and the Committee of the Regions on the 2017 List of Critical Raw Materials for the EU; European Commission: Brussels, Belgium, 2017. [Google Scholar]
  5. European Commission. Methodology for Establishing the EU List of Critical Raw Materials. Guidelines; European Commission: Brussels, Belgium, 2017. [Google Scholar]
  6. Blengini, G.A.; Nuss, P.; Dewulf, J.; Nita, V.; Peirò, L.T.; Vidal-Legaz, B.; Latunussa, C.; Mancini, L.; Blagoeva, D.; Pennington, D.; et al. EU methodology for critical raw materials assessment: Policy needs and proposed solutions for incremental improvements. Resour. Policy 2017, 53, 12–19. [Google Scholar] [CrossRef] [Green Version]
  7. Díez, M.A.; Alvarez, R.; Barriocanal, C. Coal for metallurgical coke production: Predictions of coke quality and future requirements for cokemaking. Int. J. Coal Geol. 2002, 50, 389–412. [Google Scholar] [CrossRef]
  8. International Energy Agency (IEA). Available online: https://www.iea.org/data-and-statistics (accessed on 3 November 2021).
  9. Eurostat. Supply, Transformation and Consumption of Solid Fossil Fuels: Coking Coal Indigenous Production; European Commission: Luxembourg, 2019. [Google Scholar]
  10. Eurostat. Supply, Transformation and Consumption of Solid Fossil Fuels: Coking Coal Calculated Inland Consumption; European Commission: Luxembourg, 2019. [Google Scholar]
  11. Alves Dias, P.; Kanellopoulos, K.; Medarac, H.; Kapetaki, Z.; Miranda-Barbosa, E.; Shortall, R.; Czako, V.; Telsnig, T.; Vazquez-Hernandez, C.; Lacal Arántegui, R.; et al. EU Coal Regions: Opportunities and Challenges Ahead; Publications Office of the European Union: Luxembourg, 2018. [Google Scholar]
  12. Bertrand, G.; Cassard, D.; Arvanitidis, N.; Stanley, G. Map of critical raw material deposits in Europe. Energy Procedia 2016, 97, 44–50. [Google Scholar] [CrossRef] [Green Version]
  13. Vaněk, M.; Bora, P.; Maruszewska, E.W.; Kašparková, A. Benchmarking of mining companies extracting hard coal in the Upper Silesian Coal Basin. Resour. Policy 2017, 53, 378–383. [Google Scholar] [CrossRef]
  14. European Union. EU-Ukraine Relations—Factsheet; European Union External Action: Brussels, Belgium, 2019. [Google Scholar]
  15. Jastrzębska Spółka Węglowa SA. Available online: https://www.jsw.pl/en/ (accessed on 14 October 2021).
  16. Prairie Mining Limited. Projects. Available online: http://pdz.com.pl/projekty/debiensko/ (accessed on 1 October 2021).
  17. Prairie Mining Limited. Scoping Study Indicates Debiensko Mine Restart Will Deliver Lowest Cost Hard Coking Coal into Europe. Available online: http://www.pdz.com.au/uploads/1/7/9/6/17961663/170315_-_debiensko_scoping_study_final__website_.pdf (accessed on 15 October 2021).
  18. JORC Code. Australasian Code for Reporting of Exploration Results, Mineral Resources and Ore Reserves; Australasian Joint Ore Reserves Committee: Victoria, Australia, 2012. [Google Scholar]
  19. Prairie Mining Limited. Annual Report. Available online: http://www.pdz.com.au/company-reports (accessed on 15 October 2021).
  20. Matyjaszek, M.; Wodarski, K.; Krzemień, A.; Escanciano García-Miranda, C.; Suárez Sánchez, A. Coking coal mining investment: Boosting European Union’s raw materials initiative. Resour. Policy 2018, 57, 88–97. [Google Scholar] [CrossRef]
  21. Suárez Sánchez, A.; Krzemień, A.; Riesgo Fernández, P.; Iglesias Rodríguez, F.J.; Sánchez Lasheras, F.; de Cos Juez, F.J. Investment in new tungsten mining projects. Resour. Policy 2015, 46, 177–190. [Google Scholar] [CrossRef] [Green Version]
  22. Riesgo García, M.V.; Krzemień, A.; Manzanedo del Campo, M.Á.; Menéndez Álvarez, M.; Gent, M.R. Rare earth elements mining investment: It is not all about China. Resour. Policy 2017, 53, 66–76. [Google Scholar] [CrossRef]
  23. Sterba, J.; Krzemień, A.; Riesgo Fernández, P.; Escanciano García-Miranda, C.; Fidalgo Valverde, G. Lithium mining: Accelerating the transition to sustainable energy. Resour. Policy 2019, 62, 416–426. [Google Scholar] [CrossRef]
  24. Riesgo García, M.V.; Krzemień, A.; Sáiz Bárcena, L.C.; Diego Álvarez, I.; Castañón Fernández, C. Scoping studies of rare earth mining investments: Deciding on further project developments. Resour. Policy 2019, 64, 101525. [Google Scholar] [CrossRef]
  25. Sterba, J.; Krzemień, A.; Fidalgo Valverde, G.; Diego Álvarez, I.; Castañón Fernández, C. Energy-sustainable industrialized growth in the Czech Republic: The Cínovec lithium mining project. Resour. Policy 2020, 68, 101707. [Google Scholar] [CrossRef]
  26. Krzemień, A.; Riesgo Fernández, P.; Suárez Sánchez, A.; Diego Álvarez, I. Beyond the pan-european standard for reporting of exploration results, mineral resources and reserves. Resour. Policy 2016, 49, 81–91. [Google Scholar] [CrossRef]
  27. London Stock Exchange. AIM Rules—Guidance for Mining and Oil & Gas Companies; Stock Exchange AIM Notice: London, UK, 2006. [Google Scholar]
  28. Lipiński, A.; Lipińska, K. New polish geological and mining law. Pol. Yearb. Environ. Law 2011, 1, 57–84. [Google Scholar] [CrossRef]
  29. Euracoal. EURACOAL Market Report 2019 No.1; European Association for Coal and Lignite: Brussels, Belgium, 2019. [Google Scholar]
  30. SIMCO. Precios FOB Exportaciones Carbón Coquizable Colombia $/t; SIMCO: Bogotá, Colombia, 2016. [Google Scholar]
Figure 1. Major coking coal producers in Europe [9].
Energies 14 07682 g001
Figure 2. Tornado graph for Dębieńsko project financial outcome.
Energies 14 07682 g002
Figure 3. Spider graph of NPV.
Energies 14 07682 g003
Figure 4. Coking coal prices fitting distribution in $/t.
Energies 14 07682 g004
Figure 5. Results of the uncertainty analysis with values in kM$.
Energies 14 07682 g005
Table 1. Major coking coal consumers in Europe, presented in megatons [10].
CountryCoking Coal Consumption [Mt]
201520162017
Austria1.7311.8151.763
Belgium1.6771.6381.615
Czech Republic3.7043.1173.421
Finland1.2541.2131.261
France4.4654.3434.516
Germany11.71915.13215.825
Hungary1.3271.2231.320
Italy2.2462.4402.309
Netherlands4.4634.3544.393
Poland13.45713.17813.054
Romania14108
Slovakia2.7392.7182.720
Spain1.8341.8621.802
Sweden1.5921.5421.513
United Kingdom5.0632.7753.010
TOTAL57.28657.36158.534
Table 2. Dębieńsko hard coking coal (HCC) resources [18].
Dębieńsko HCC ResourcesIndicated [Mt]Inferred [Mt]Total
93208301
Table 3. Assumed production parameter of Dębieńsko project [19].
ParameterValue
Average RoM production4 Mtpa
Life of Mine (LoM) production104 Mt
Life of Mine Plant Feed Coal Production100.3 Mt
Average product yield67.8%
Life of Mine following the first production26 years
Average Sealable HCC production2.6 Mtpa
Total saleable production65 Mt
Table 4. Basic assumptions for the economic analysis [17].
ParameterValue
Life of Mine (LoM)26 years
Yield 68%
Clean coal production 2.600 Mtpa
Table 5. Cash-flow calculation in k$.
Year 0Year 1–20Year 20–26
Capital costs372,000
Working capital57,590
Mining costs 49,40049,400
Processing costs 14,04014,040
Transport costs 51,74051,740
Royalties 20802080
Total costs 65,52065,520
Revenue 260,000260,000
Earnings before interest, taxes, depreciation and amortization (EBITDA) 194,480194,480
Amortization 18,6000
Pre-tax benefit 175,880194,480
Taxes 33,41736,951
Post-tax benefit 142,463157,529
Cash Flows429,590161,063157,529
Table 6. Financial outcomes of the different projects.
ProjectAfter-Tax NPV (% Discount)After-Tax IRRPayback
Period (Years)
Lublin1390 M$ (8%)26.6%3
Dębieńsko660 M$ (10%)28.0%5
Table 7. Cumulative distribution parameters.
Points (X-Values)Probability
2.4000.2
2.5000.4
2.6000.2
Publisher’s Note: MDPI stays neutral with regard to jurisdictional claims in published maps and institutional affiliations.

