Article

The “My Electricity” Program as One of the Ways to Reduce CO2 Emissions in Poland

by
Piotr Olczak
1,*,
Agnieszka Żelazna
2,
Dominika Matuszewska
3 and
Małgorzata Olek
4
1
Mineral and Energy Economy Research Institute, Polish Academy of Sciences, Wybickiego St. 7A, 31-261 Kraków, Poland
2
Faculty of Environmental Engineering, Lublin University of Technology, 40B Nadbystrzycka Str., 20-618 Lublin, Poland
3
Faculty of Energy and Fuels, AGH University of Science and Technology, 30 Mickiewicza Ave., 30-059 Cracow, Poland
4
Faculty of Environmental and Power Engineering, Cracow University of Technology, 24 Warszawska, 31-155 Cracow, Poland
*
Author to whom correspondence should be addressed.
Energies 2021, 14(22), 7679; https://doi.org/10.3390/en14227679
Submission received: 30 September 2021 / Revised: 2 November 2021 / Accepted: 8 November 2021 / Published: 16 November 2021
(This article belongs to the Special Issue New Insights into Circular Economy and Sustainable Development)

Abstract

:
One way to reduce CO2 emissions is to replace conventional energy sources with renewable ones. In order to encourage prosumers to invest in renewable energy, EU Member States are developing renewable energy subsidy programs. In Poland, in the years 2019–2020, the “My Electricity” program was implemented, co-financing was up to 50% of eligible costs (max PLN 5000, i.e., EUR 1111), and the total cost of the program was 251 million euro. During this period, around 400,000 prosumer installations were created in Poland, including over 220,000 prosumer PV Installations under the My Electricity program. The total power of the installation under the “My Electricity” program was 1.295 GWp with an average installation power of 5.72 kWp. It is estimated that the micro-installations will produce approx. 1.4 TWh of electricity annually. Depending on the replaced source of electricity (coal, gas, mix), in the next 30 years, it will help to avoid 26.2–42.7 million Mg of greenhouse gases calculated as carbon dioxide equivalents (CO2eq). The coefficient of subsidy expenditure from the “My Electricity” program was 194 EUR/kWp, and in the next 30 years, it will be 6.52 EUR/MWh. The investment in PV will save EUR 1550 million, which would have to be incurred for the purchase of CO2 emission permits.

1. Introduction

Consequent to population growth and economic development, the demand for energy is constantly growing—the International Energy Agency predicts that the demand for electricity will increase by 30% in 2040, compared with the base year 2016 [1,2]. Unfortunately, attempts to create better living conditions for society involve serious problems related to fossil fuel combustion and its negative environmental impact: climate changes, acid rains, eutrophication, emissions of greenhouse gases (GHG), mercury and other pollutants, etc. [3,4]. Thus, there is also growing public awareness of the urgent need to solve these most pressing environmental problems related to energy production. The consequences of these changes caused the 2015 Paris agreement to limit global warming to well below 2 °C, compared with the pre-industrial era, in order to reduce the risk and damage caused by climate changes [5]. Considering this, the shift from fossil fuels to renewable energy sources seems to be a good and future-proof solution. At the same time, public policy has largely favoured wind and solar technologies for energy production among other technologies using renewable sources (RESs), which contributed to the growth of installations powered by these sources [6,7,8]. More importantly, many premises indicate that such a climate policy will determine future directions for actions [9,10,11], where solar energy technologies will have leading importance [12,13]. On the example of the European Union itself, it can be seen how the electricity generation capacity has changed from 1.9 GW to over 133 GW in 2010–2019. The year 2019 alone brought 16.5 GW of new installed capacity in the EU [14]. As a result, the power installed in photovoltaics both in the EU and United Kingdom could generate 5.2% of the final electricity demand (about 150 TWh) at the end of 2019 [15]. The efficiency of photovoltaic systems depends on several factors, including photovoltaic technology and its structure and components used, partial shading, losses related to soiling of the panels, as well as individual environmental factors for different latitudes such as the insolation, temperature, angular losses, etc. [16,17,18]. Poland, as one of the EU Member States, faces an urgent need to develop new solutions for the energy sector that would be appropriate in terms of environment, technology, and economy [19,20]. This is even more important in the context of the fact that the Polish energy mix is largely based on the use of fossil fuels (mainly coal) as an energy source—in 2020, in Poland, 70.18 TWh was generated from hard coal, while 34.42 TWh was generated from lignite, with total energy generation at the level of 140.56 TWh, which was 49.93% and 34.42%, respectively [21,22]. Data shows that in 2018 in Poland, greenhouse gas emissions were 415.9 million tons of carbon dioxide equivalents (CO2eq) [
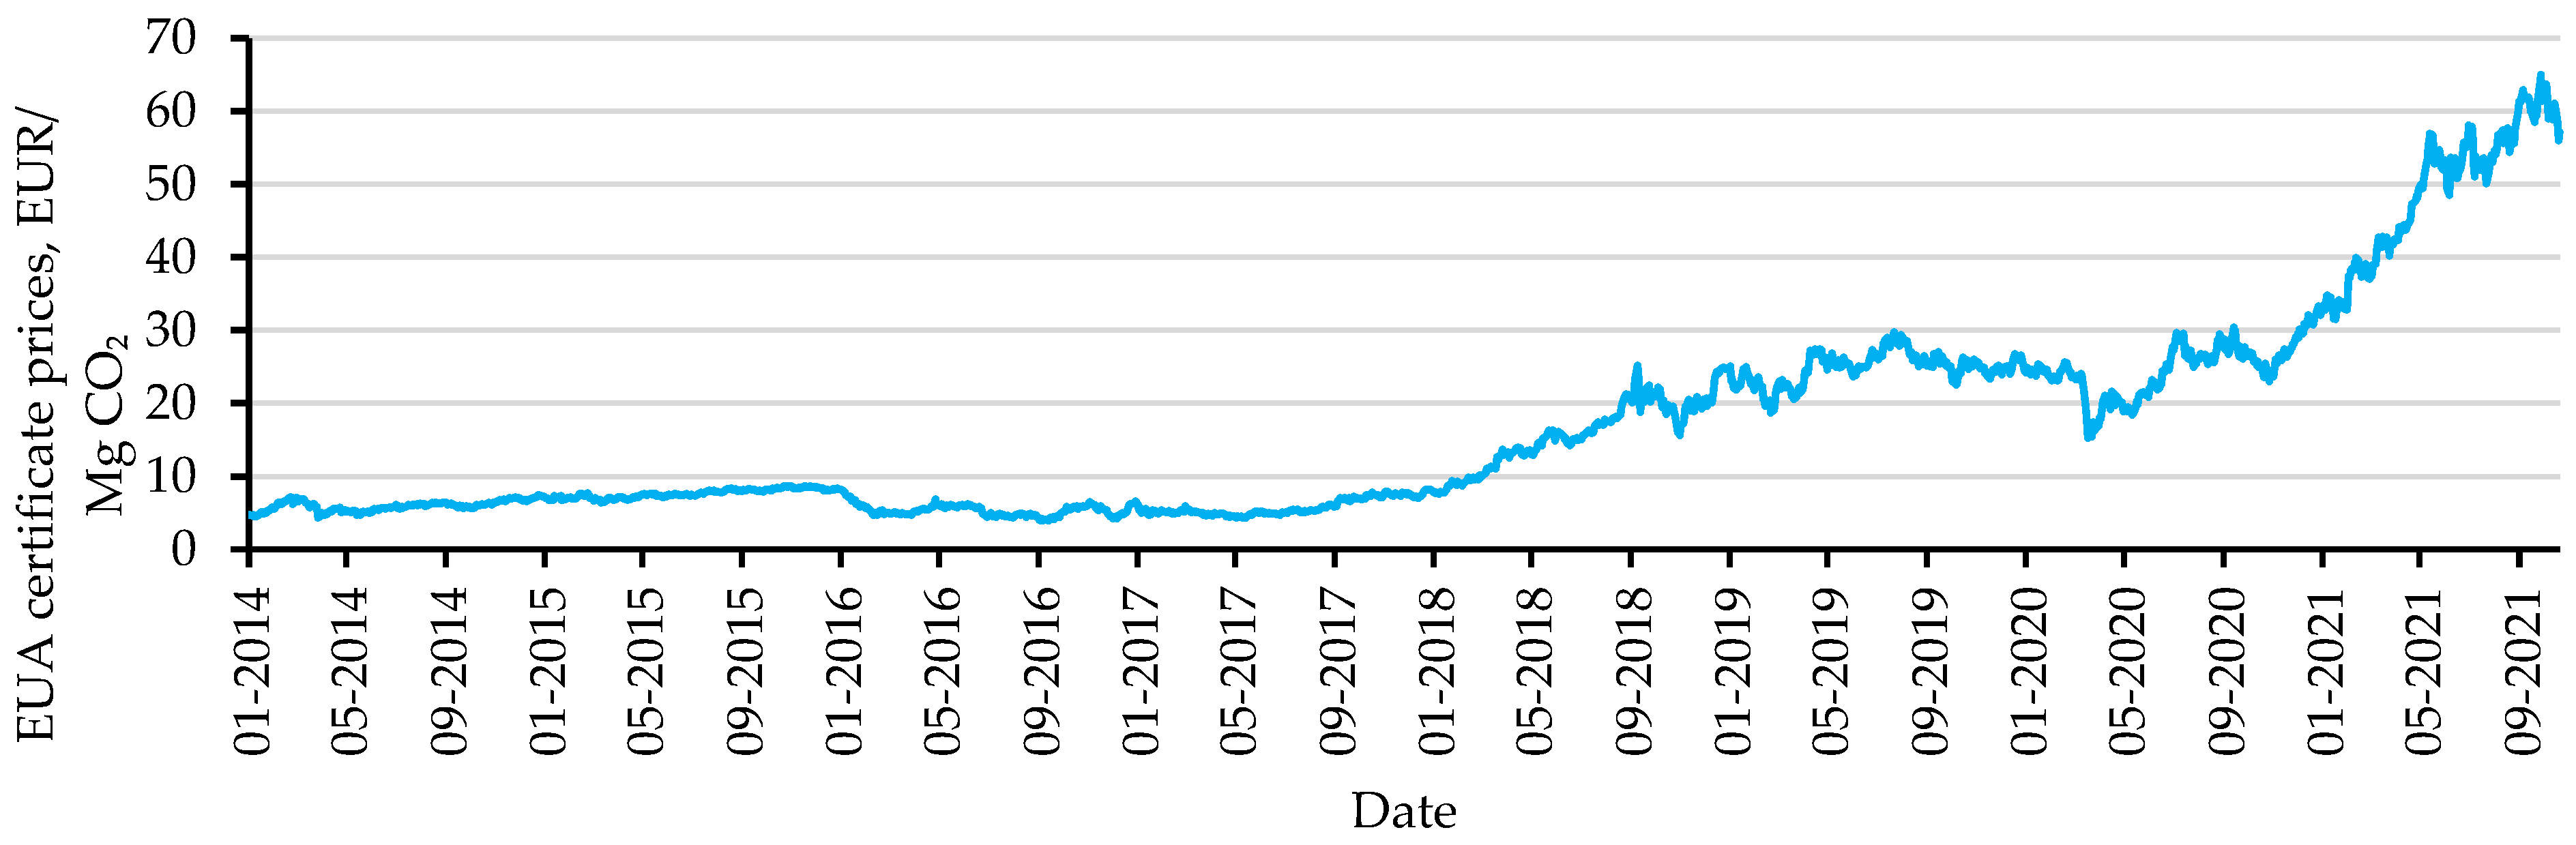
23]. The high and constantly growing prices of CO2 emission rights make coal power plants less and less profitable in operation [24,25]. The prices of CO2 emissions over the last few years are presented in Figure 1.
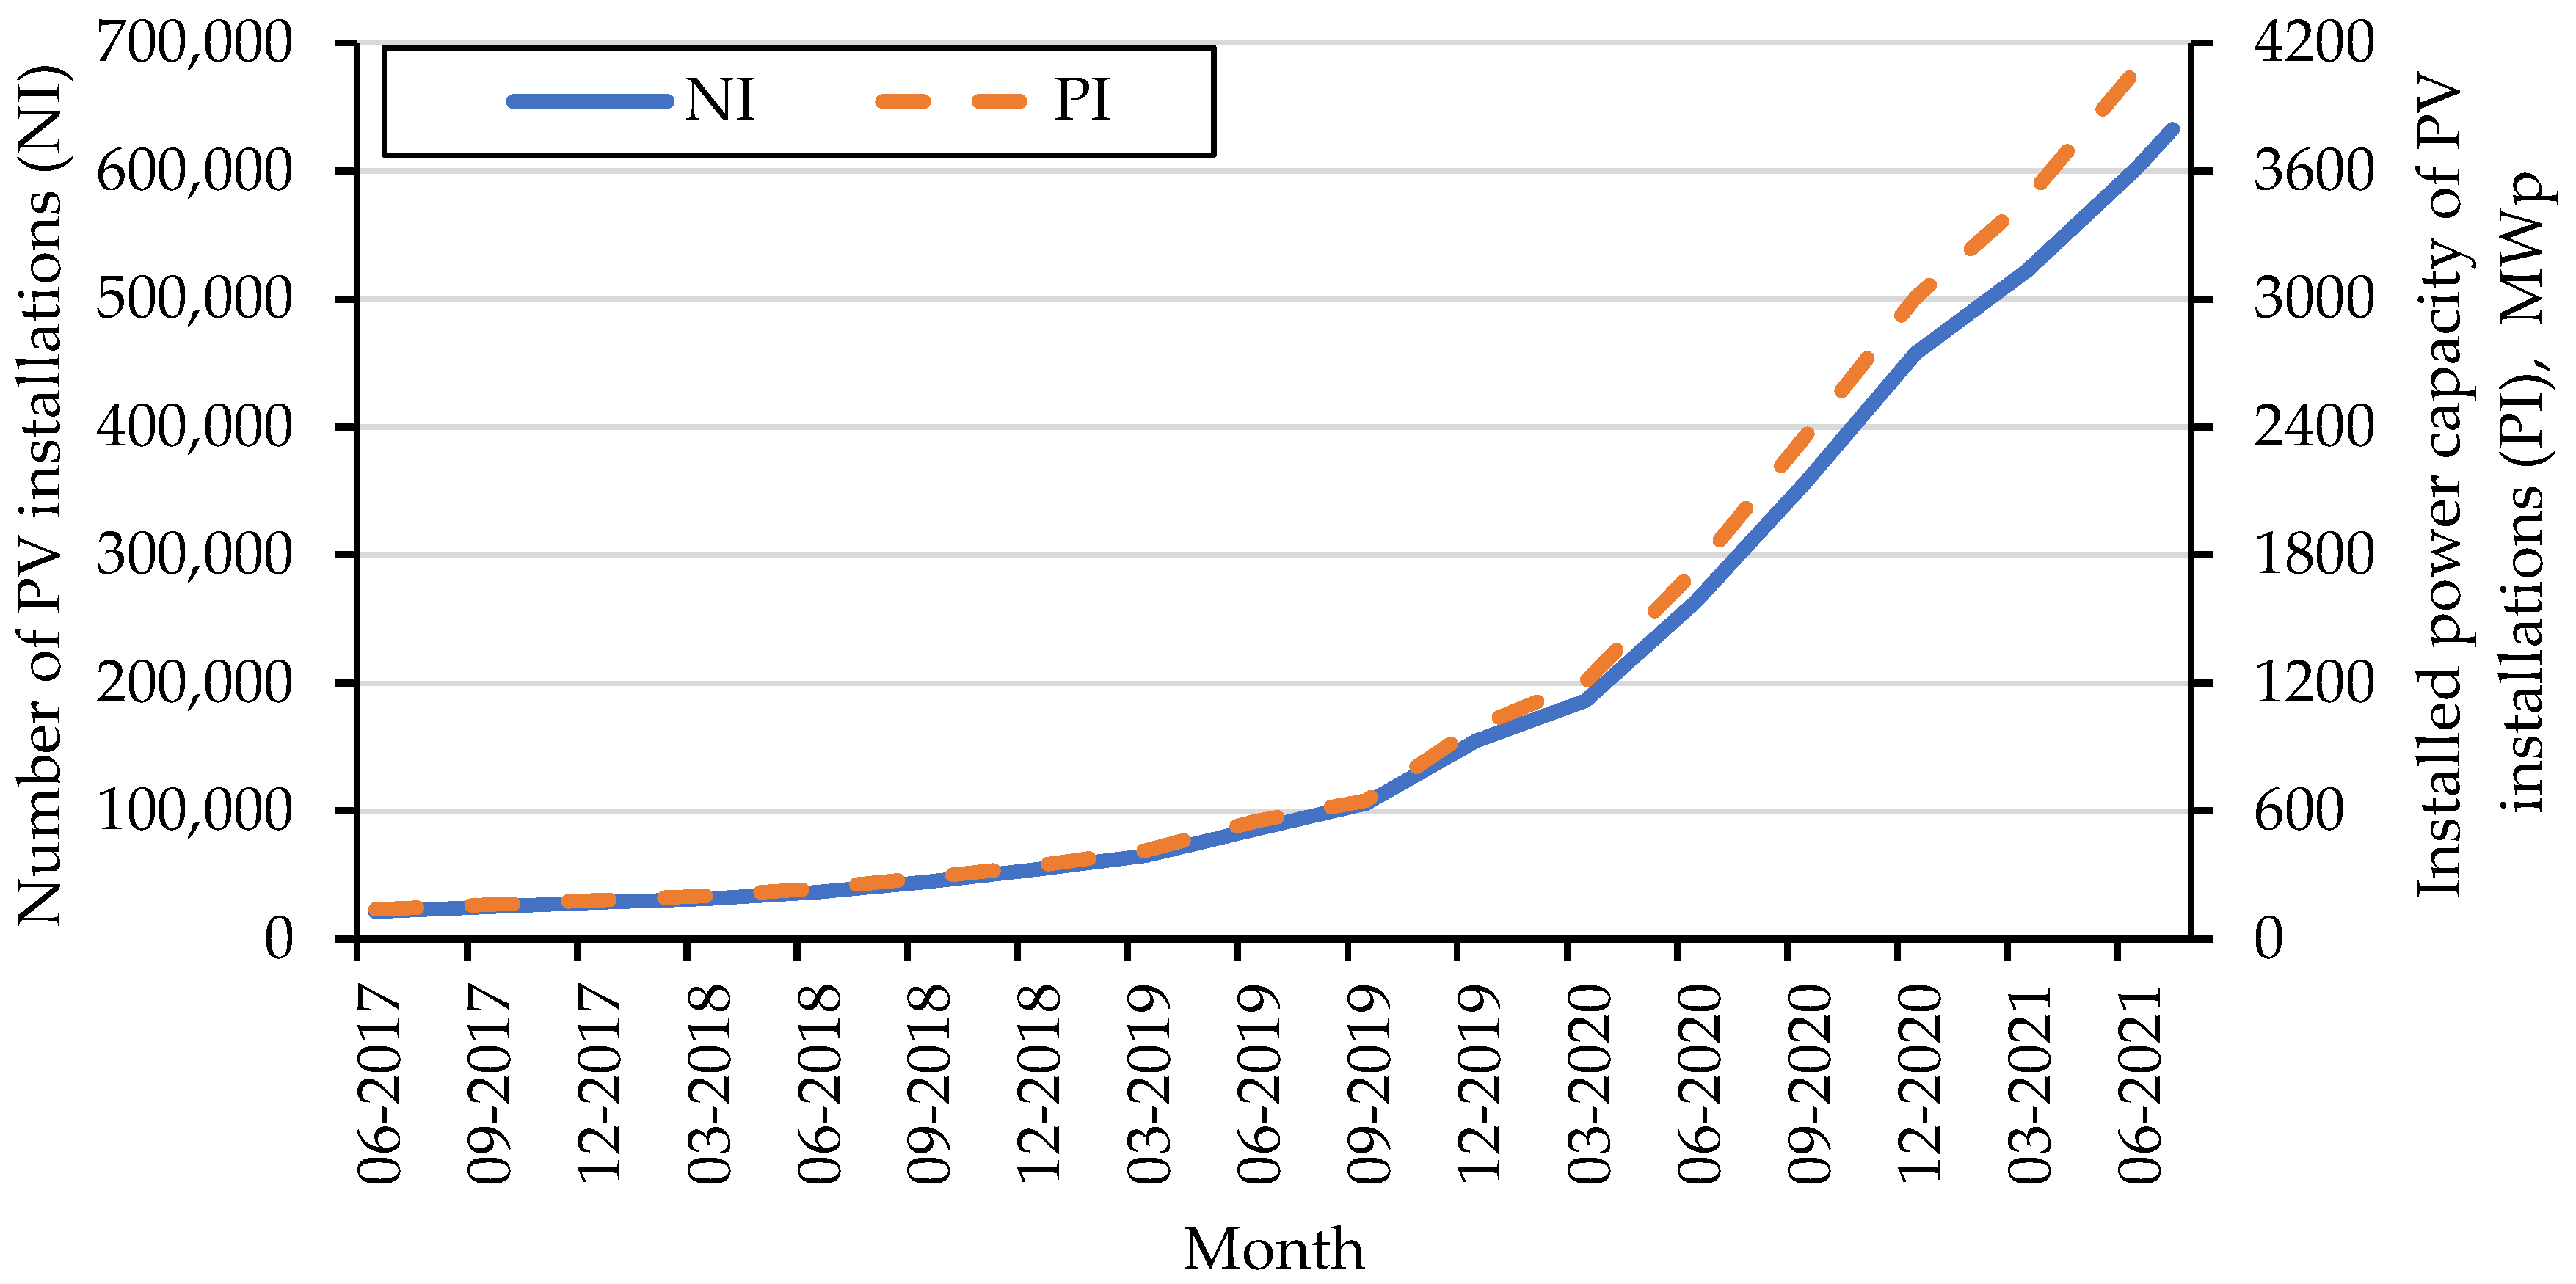
Analysing the current situation on the photovoltaic market in European countries with a temperate climate, Poland, immediately after Germany and The Netherlands, has the largest PV market [27]. With an estimated annual insolation value of 1000 kWh/m2 [28,29], the Polish photovoltaic sector is the fastest-developed renewable energy sector—with a total capacity of micro-installations of 4075.5 MW (data as of 31 June 2021). Comparing this with the total installed capacity as of 30 June 2017, it indicates almost a 25-fold increase in less than 4 years (Figure 2) [30]. As a result, Poland ranks fifth in terms of creating new PV installation capacities, closely behind Germany, Spain, The Netherlands, and France. Forecasts show that PV installations will continue to be popular in the future, and installed capacity may, with conservative estimates, increase by around 5–7 GWp by 2030 [31] and by around 10–16 GWp by 2040 [32,33].
The development of photovoltaics both in Poland and the entire EU was possible to a large extent through programs aimed at encouraging investors to invest in solar technologies [6,7]. At the same time, designing a renewable energy policy through various types of support programs, tax breaks, subsidies, is extremely important from the point of view of efficiency, environmental friendliness, as well as social equity [34]. The price effect pushes producers with high marginal costs from the market (which may be influenced by the high costs of carbon certificates in the case of conventional power plants) and a decrease in the wholesale energy price. On the other hand, consumers bear to a large extent hidden costs related to the development of RES since these subsidies are refinanced from taxes. As a result, the allocation of aid funds in RES is extremely important, and it is worth examining whether the mechanisms governing it are not defective, and there are no problems with the appropriate allocation of funds [7,35]. Olczak et al. [36] analysed the allocation of funds for photovoltaic micro-installations in Poland in terms of inequality between voivodeships in terms of their use. In the context of switching from conventional fossil technologies to generation using renewable sources, much is said about reducing GHG emissions during their operation [37]. However, when comparing the difference in GHG emissions between systems using fossil fuels and renewable sources, their operation time should be considered, as well as the entire life cycle, by conducting an appropriate life cycle analysis (LCA) for each of the compared systems [38]. Life cycle assessment (LCA) is a well-known method used to assess the environmental impact of a product or process throughout its entire life cycle (from its manufacture, through operation, to disposal) [39], and consists of four main parts: goal and scope definition, inventory analysis, impact assessment and interpretation [40].
There are numerous studies on PV LCAs in the literature [41,42,43,44,45]. Bracquene et al. [41] discussed how the eco-design of PV can contribute to reducing the environmental impact of photovoltaic panels. Müller et al. [42] conducted an LCA analysis of photovoltaic (PV) systems from sc-Si glass–backsheet and glass–glass modules produced in China, Germany, and the European Union (EU), considering current inventory data. Celik et al. [43] analysed two different structures of perovskite photovoltaic cells using the LCA with cradle-to-grave approach. Bogacka et al. [44] conducted a scenario analysis based on the LCA of the environmental impact of PV recycling. Ansanelli et al. [45] carried out an LCA to assess the environmental performance of a new process for recycling crystalline silicon (c-Si) solar panels at the end of life and to improve the circular economy of recovered materials.
Despite such extensive research linking LCA with PV, in the context of subsidy programs, it seems important to check whether the replacement of fossil fuels by PV will help to avoid emissions (if so, to what extent) in the next 30 years. The novelty of this study is the estimation of the effectiveness of a subsidy program for PV installations, taking into account the LCA analysis—the conclusions obtained as a result of this study may influence the actions of decision makers and support the design of such programs. The authors infer a significant gap as regards checking how the replacement of dirty energy sources by PV in an energy mix such as Poland will affect this transition and avoid emissions.
The paper is structured as follows: Section 2 focuses on presenting the characteristics of the results of the subsidiary program “My Electricity”, whose purpose was to partially refinance PV micro-installation in households in Poland. Data as of 14 July 2021 includes over 90% of installations covered by the program as part of the two editions which were carried out in 2019–2020. In 
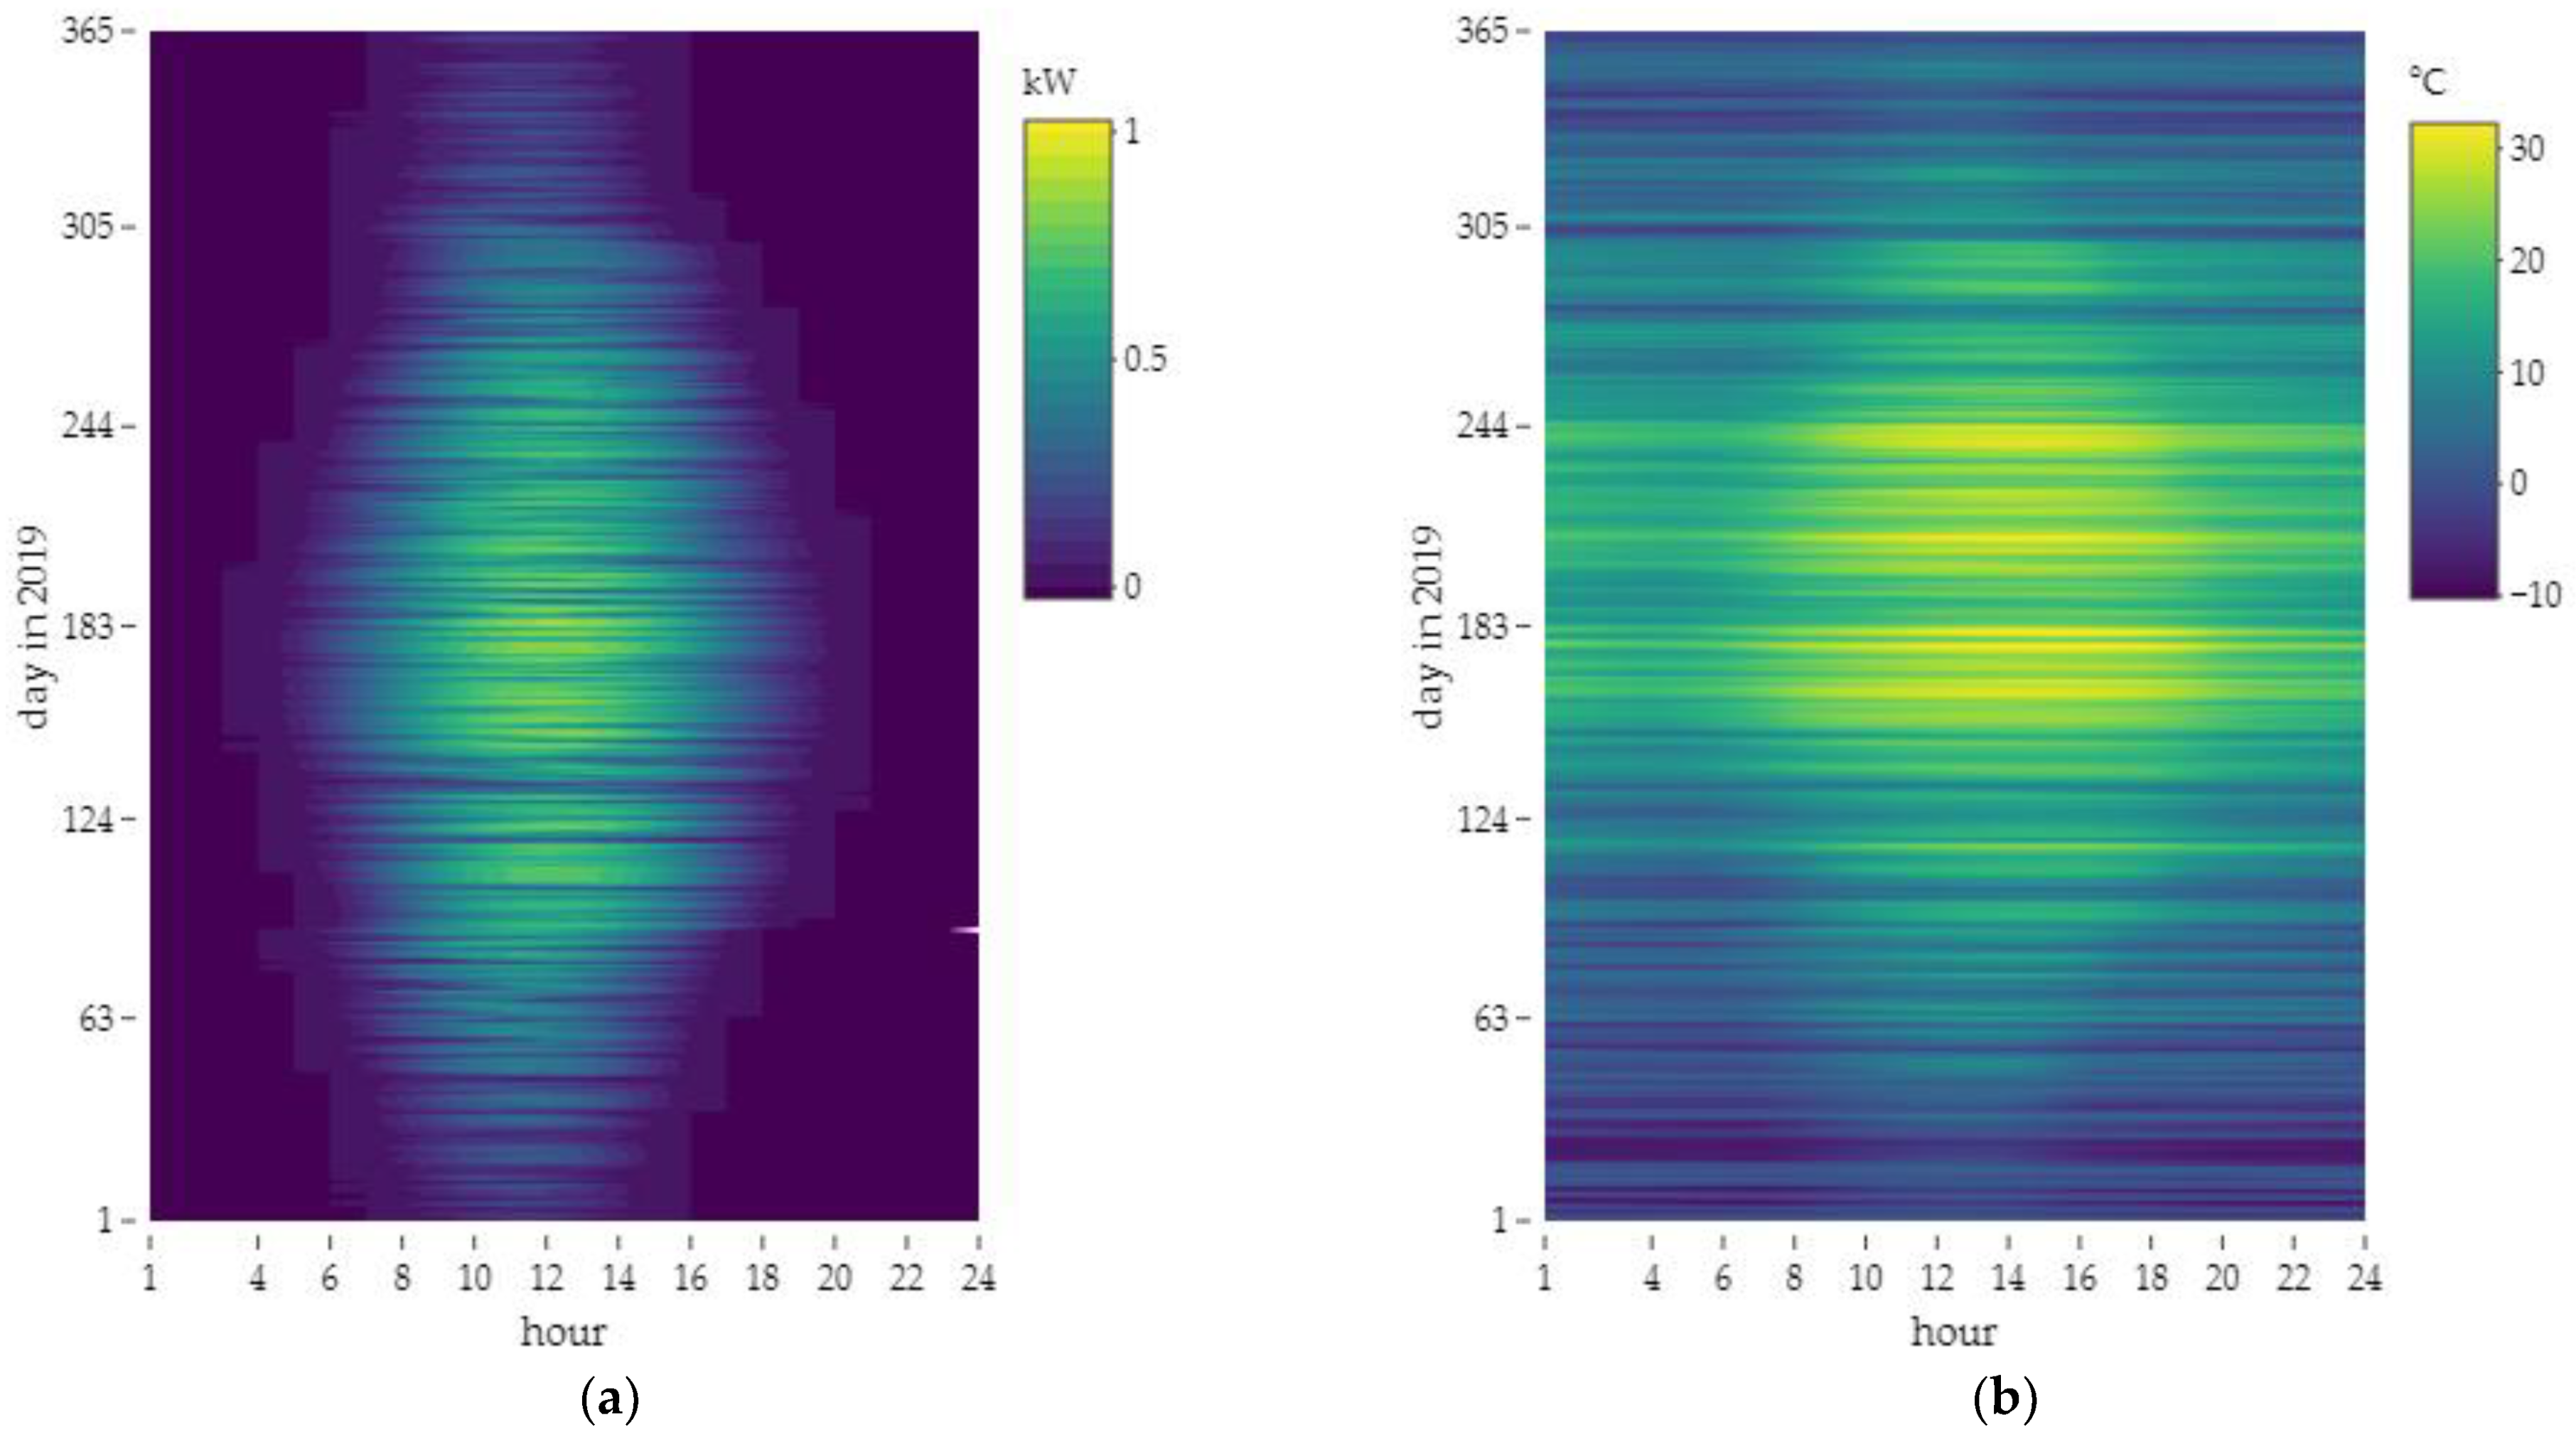
Section 3, research methodology is presented, including equations for PV electricity production, the subsidy amount for produced energy, and avoided CO2eq emission. In Section 4, an analysis of the subsidy program is conducted to evaluate the “My Electricity” program as one of the methods of reducing CO2eq emissions in Poland. This was achieved by determining the electricity produced in the first year and over 30 years and the cost of co-financing PV installations for electricity production per 1 MWh. LCA model calculations according to the IPCC GWP 100a method were used to estimate emissions for monocrystalline and polycrystalline PV systems. The unit GWP indicators obtained for hard coal, lignite, natural gas, and the Polish energy mix were used to determine the avoided emissions. Finally, Section 5 concludes the environmental impact of implementing the “My Electricity” program to avoid emissions in Poland over a 30-year perspective.

2. The Results Characteristics of the “My Electricity” Program

The My Electricity program was implemented in the years 2019–2020. The aim of the program was to increase the number of prosumers of PV micro-installations among households in Poland by over 200 thousand. The initial budget of the program was PLN 1 billion (Polish zlotys) at the end of 2020, and the budget was extended to approx. EUR 250 million (EUR 1 = PLN 4.5). According to the data as of 14 July 2021, the amount of funds spent was EUR 251 million; this value covers over 90% of the installations created under the program.
The main convenience for the beneficiaries was a non-returnable subsidy covering 50% of eligible costs up to a maximum of EUR 1111 per installation from the 2–10 kWp range. The eligible costs include the purchase of a new installation and its assembly. The installation is subject to control up to 3 years after the grant is awarded.
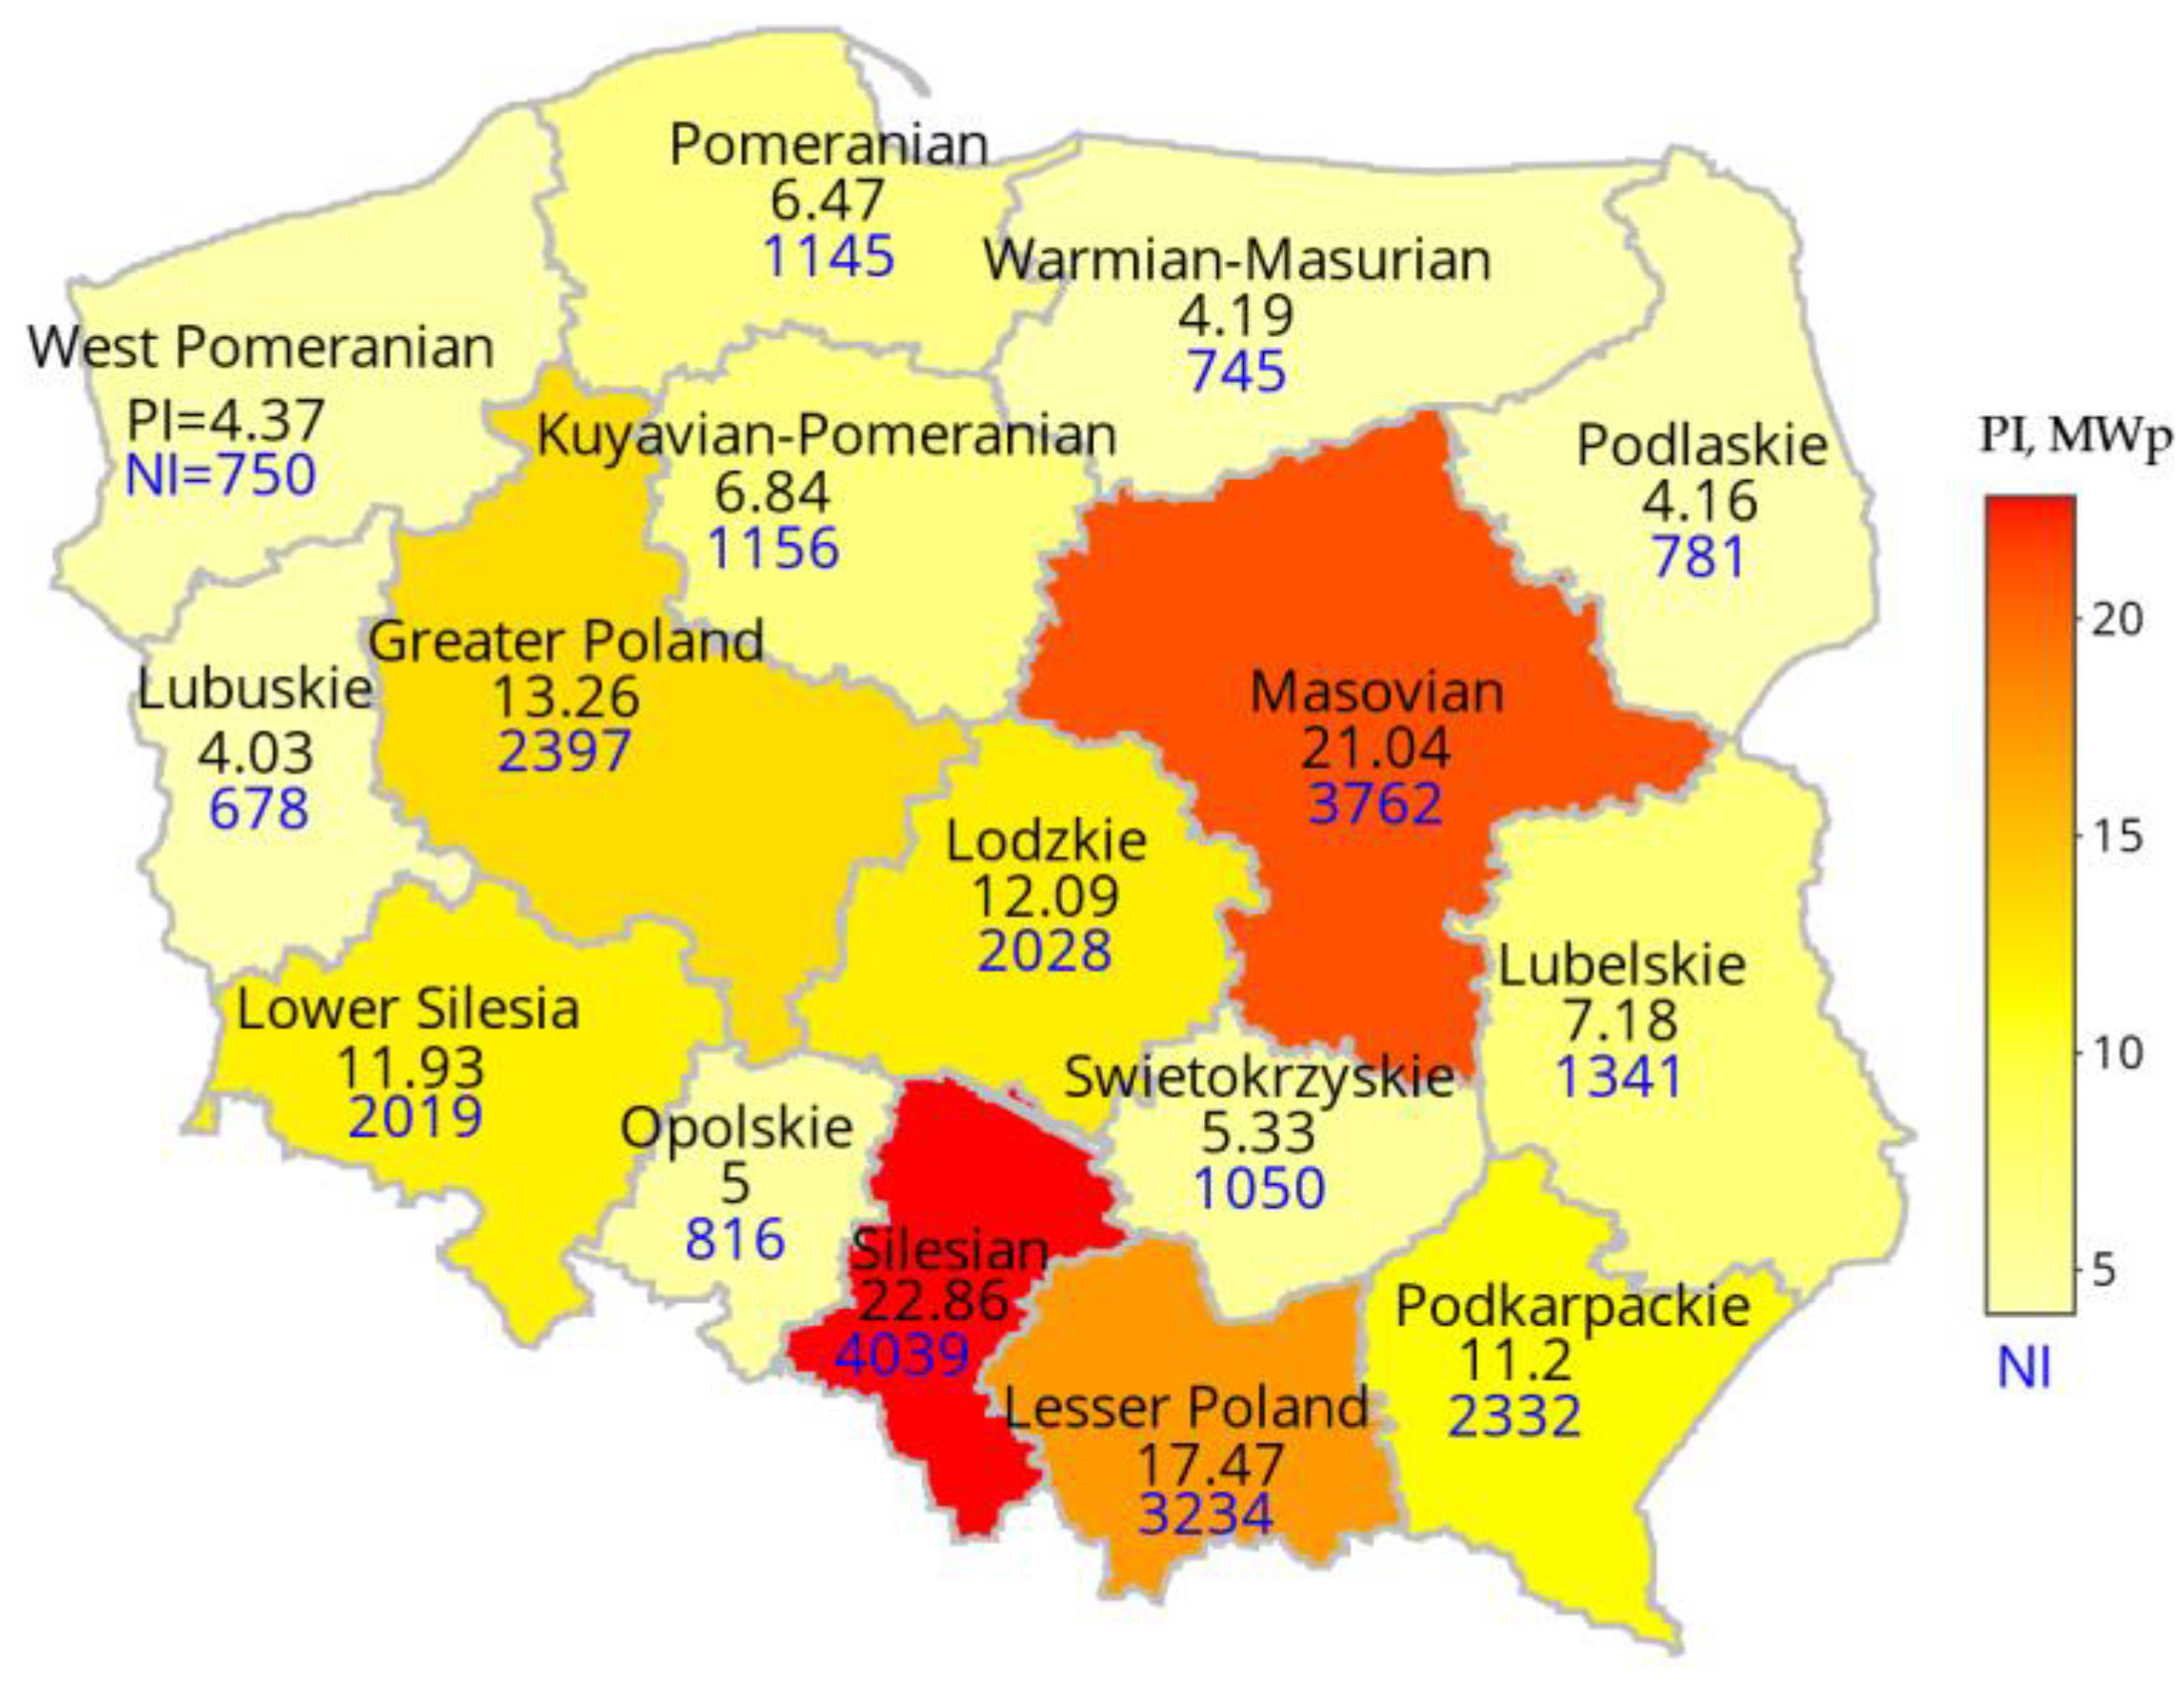
In the first round of the program, 28,457 installations were created (with a capacity of 158.4 MWp), i.e., approx. 15% of the total planned pool of installations for 2 years. The average power of the installation was 5.57 kWp, the median was 5.1 kWp, and the average subsidy amount was EUR 1102 (198 EUR/kWp). Detailed results by provinces are presented in Figure 3.
Most installations were built in the Silesian (4039), Masovian (3762), and Lesser Poland (3234) provinces with a total capacity of 61.4 MWp, the least in the Lubuskie (678), Warmian-Masurian (745), West Pomeranian (750) provinces, with a total capacity of 12.6 MWp. Less than 1000 installations were also built in the Podlaskie (781) and Opolskie (816) provinces. The average subsidy amount was PLN 4958 (EUR 890/kWp). The contrast in the number of installations is surprising—voivodeships with the highest number of installations are adjacent to the areas with the lowest number of installations.
As of 14 July 2021, 197.997 installations with a total capacity of 1137 MWp were built in the second round of the program [46]. This is about 8 times more installations than the first round. The average power of the installation is 5.73 kWp (+3% compared with round no. 1 [36]), and the median is 5.25 kWp. The average subsidy amount was EUR 1110 (193 EUR/kWp). Detailed results for individual voivodeships are presented in Figure 4.
Most installations were built in the Greater Poland Province (24,260) with a total capacity of 138.7 MWp. Similar values were achieved in the following voivodships: Silesian (23,121) Lesser Poland (21,747) and Masovian (21,482). The fewest installations were built in Podlaskie Province (4043), with a total capacity of 22.5 MWp.
In both rounds of the program, 226,454 installations with a total capacity of 1295 GWp were built. The average power of the installation is 5.72 kWp, and the median power is 5.22 kWp. The average grant amount is EUR 1109 (194 EUR/kWp). Detailed summary results for individual voivodships are presented in Figure 5.
In total, in both rounds, most installations were built in the following provinces: Silesian (27,160), Greater Poland (26,657), Masovian (25,244), and Lesser Poland (24,981), with a total capacity of 596 MWp. In the years 2019–2020, the least interest in co-financing photovoltaic installations under the “My Electricity” program was in the Podlaskie Province (4824). The total installed capacity in micro-installations in Podlaskie Province was 26.7 MWp. The differences in power in individual provinces result, from population, urbanisation, insolation of regions [47,48].
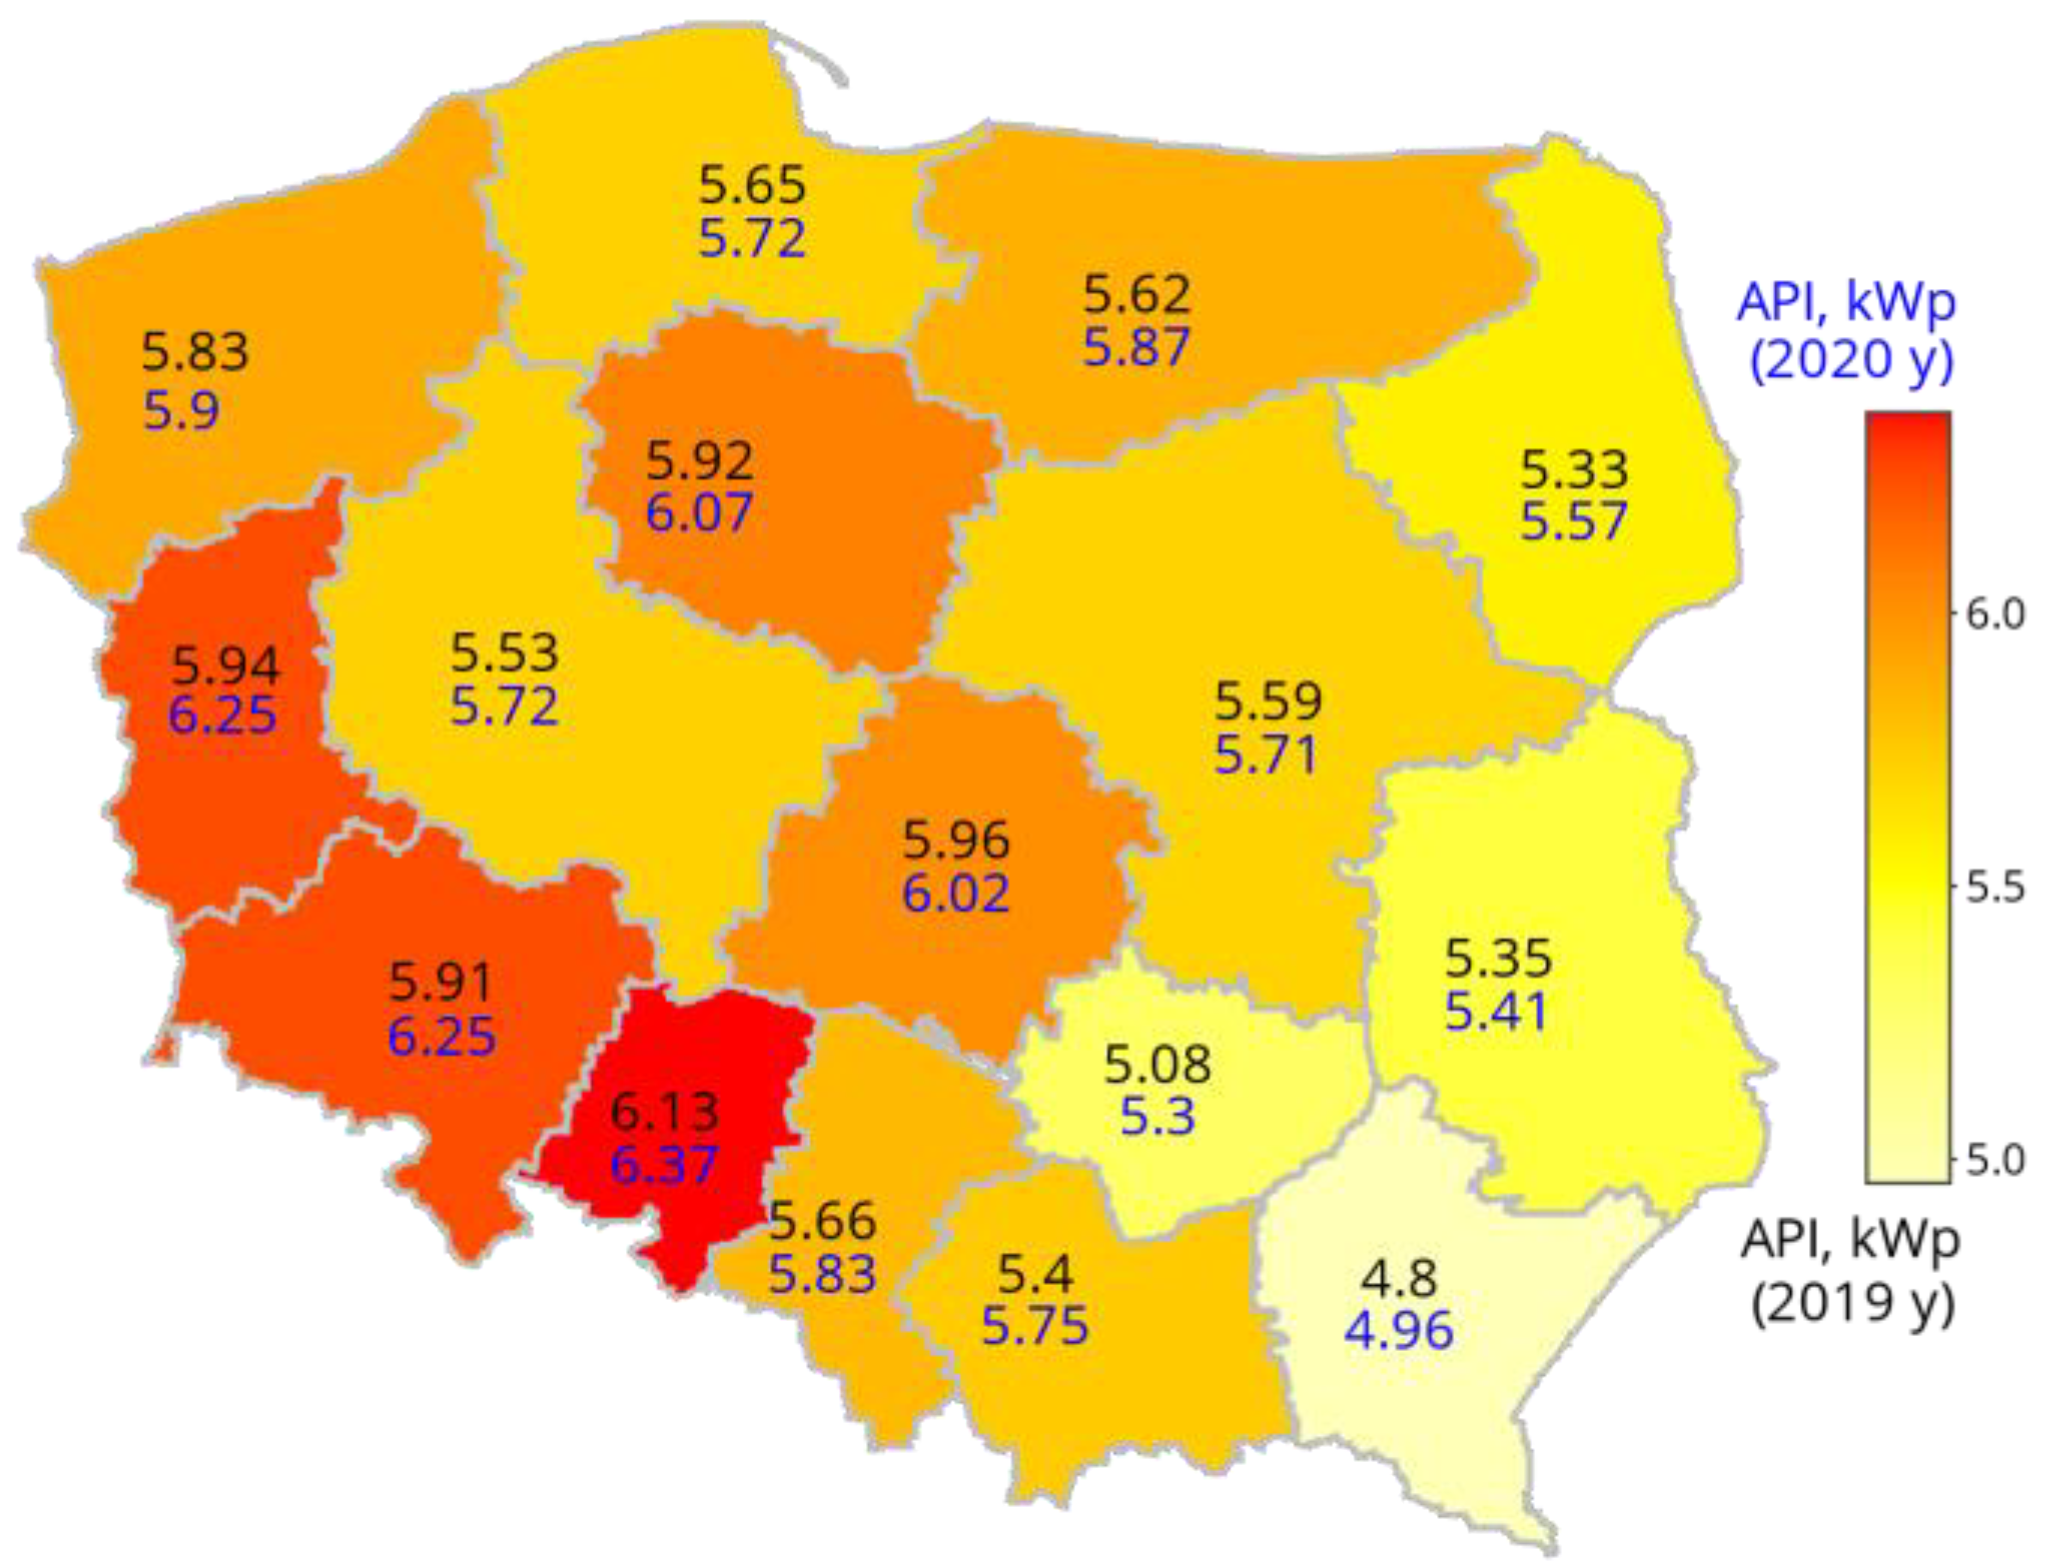
It can also be observed that in each province the average installation capacity increased (Figure 6), despite the fact that the subsidy system is the most financially effective at installation capacity close to 2 kWp [48].
According to the weighted power of PV installations created under the “My Electricity” program, determined on the basis of the total power of the installations and geographical coordinates, the centre of Poland was determined to be in the Łódzkie Province—for the place of Łask near Łódź with coordinates 51.61° N and 19.18° E.

3. Research Methodology

The methodology of the presented research was based on the detailed calculation of the possible reduction in carbon dioxide emission. The scope of avoided CO2 emissions depends mainly on the PV electricity production and the inputs related to the life cycle of examined energy systems, conventional energy sources, or energy mix.

3.1. PV Electricity Production

According to HOMER software, the output of PV panels was calculated with the employment of Equation (1) [49].
P P V ( τ ) = Y P V · F P V · G h ( τ ) G S T C · ( 1 + α p · ( T C T S T C ) )
where
P P V The power output of photovoltaic panels, kw/kwp;
τ Hour;
Y P V Rated capacity of the PV array, which implies that its output power under standard test conditions (1 kwp was used), kw/kwp;
F P V PV-derating factor, 0.90 [50];
G The available intensity of solar radiation incident on horizontal surface dependent on time, based on MERRA-II database, W/m2;
G S T C Incident radiation at Standard Test Conditions, 1 kw/m2;
α p Temperature coefficient of power, based on [51], %/°C;
T C PV cell temperature, based on Equation (2), °C;
T S T C PV cell temperature under standard test conditions (25 °C).
Equation (2) presents the PV cell temperature that is the temperature of the surface of the PV installation [52].
T C = T a ( τ ) + G h ( τ ) · T C . N O C T T a . N O C T G . N O C T ( 1 η c t a )  
where
T a Ambient temperature (from MERRA-II), °C;
G The available intensity of solar radiation incident on surface dependent on time, tilt angle and azimuth angle, W/m2;
T C . N O C T Nominal operating cell temperature according to [51], °C;
T a . N O C T The ambient temperature at which the NOCT is defined (20°C);
G . N O C T Solar radiation at which the NOCT is defined (0.8 kW/m2);
η C Temperature   efficiency   of   the   PV   panel ,   assumption   η C = η m p , based on [51,53];
t a Coefficient of transmittance and absorptance, 0.9 [54].
Unit productivity of PV installation arrived at by multiplying the power output of photovoltaic panels and the average efficiency of the inverter and electric installation (Equation (3)).
U P V P   ( τ ) = P P V ( τ ) · 1   h · η i n v e r t e r
where
U P V P Unit productivity of PV installation, kWh/kWp;
P P V The power output of photovoltaic panels, kW/kWp;
η i n v e r t e r The average efficiency of the inverter, 0.95 [55].
The value of U P V P was used to calculate the unit electricity production ( Y U P V P ) in a photovoltaic installation per year (Equation (4)). Additionally, the annual electricity production from a PV installation ( Y P V P I ) is given in Equation (5), 30-years electricity production from a PV installation ( 30 Y P V P I ) including yearly efficiency loss factor is given in Equation (6).
Y U P V P ( y e a r ) = τ = 1 8760 U P V P ( τ , y e a r )
where
Y U P V P Yearly unit electricity production in PV installation, kWh/kWp/year;
U P V P Unit productivity of PV installation, kWh/kWp.
Y P V P I ( y e a r ) = Y U P V P ( y e a r ) · P I
where
Y P V P I Yearly electricity production in PV installation, MWh/year;
P I The capacity of PV installations per province, MWp.
30 Y P V P I = y e a r = 1 30 Y U P V P ( y e a r ) · ( 1 y l · ( y e a r 1 ) ) · P I
where
Y P V P I Yearly electricity production in PV installation, MWh/year;
P I The capacity of PV installations per province, MWp;
y l Yearly efficiency loss factor, 0.0055 [51].
The value of the subsidy for produced energy (UDPV, euro/MWh) was calculated as follows (Equation (7)):
U D P V = D I y e a r = 1 30 Y P V P I ( y e a r )
where
Y P V P I Yearly electricity production in PV installation, MWh/year;
D I Sum of dotation per province, euro.

3.2. Description of Calculation Avoided CO2eq Emission Method

The avoided emission of CO2eq was calculated by the use of the life cycle assessment (LCA) method applied for the standard PV system supported by the “My Electricity” program. The general framework of LCA included in Intergovernmental Standardisation Organisation standards [56] was used to calculate CO2eq released during the lifetime of PV systems, using the cradle-to-grave approach [57]. The aim of the LCA analysis was to compare the emissions from the PV systems to the conventional energy sources dominating the Polish energy market, in particular hard coal, lignite, natural gas, and Polish energy mix, constituting the kinds of energy replaced by photovoltaics, as presented in relevant literature studies [58,59].
System boundaries of the PV systems analysed in the study included the production of 5.72 kWp installation (average power resulting from “My Electricity” program data) together with PV modules (including their market shares) and balance of system (BOS), transportation processes based on market reports including those about local producers and imported parts and servicing (washing, replacement of parts) [60].
The basic assumptions for LCA research were adopted from methodological guidelines and included service life of PV systems equal to 30 years, with partial replacement of inverter, while some elements of BOS such as metal construction for panels had a 60-year lifespan [57,61]. Life cycle inventory was based on the Ecoinvent database and leading producers’ data, including the efficiency of monocrystalline panels equal to 20.5% and for polycrystalline panels equal to 17.2%. Adaptation to local conditions was based on “My Electricity” program summary data, region-specific energy yield estimates with an included decrease in panel efficiency described in paragraph 3, and statistical reports on the PV market in Poland, which enabled estimation of transportation distances and kinds of PV panels mounted in 2019 and 2020. According to the market reports, the average share of monocrystalline panels rose from 79.5% in 2019 to 97.65% in 2020, while polycrystalline technology recorded the decrease in share from 20.5% to 2.35% [60,62,63], which was included in the study in accordance to the number of installations built in the analysed years.
The method of CO2eq calculations was Global Warming Potential 2013 (IPCC GWP 100a), enabling calculation of climate change potential on the basis of 204 characterisation factors for specific emissions to air. The life cycle model was built in SimaPro v.8.1 software by PRE Consultants, Amersfoort, The Netherlands, with included Ecoinvent 3.0 database by Ecoinvent Association, Zurich, Switzerland. Sensitivity analysis by the Monte Carlo method was performed with 1000 runs and a confidence interval of 95%. The emissions from energy generation processes were updated to the levels of 2019 and 2020 by the use of modified Ecoinvent unit processes [21,64].
Absolute GHG emission avoidance was calculated in previously mentioned four basic scenarios of energy sources replaced by PV electricity according to Equation adopted by [65].
Δ G H G = y = 1 30 ( G H G y R e p l G H G y P V )
where
Δ G H G      Avoided emissions of greenhouse gases, Mg CO2eq;
G H G y R e p l    GHG emissions of replaced energy source in successive years, Mg CO2eq;
G H G y P V     GHG emissions of PV systems built in the My Electricity program in successive years, Mg CO2eq.

4. Results

4.1. Results of PV Electricity Production

Based on MERRA-II data for the town of Łask near Łódź, a map chart of the intensity of solar radiation falling on the horizontal plane and a map chart of the outside temperature were drawn, as shown in Figure 7.
Similar data from the MERRA-II website were collected for all province capitals in Poland. Based on the data on the intensity of solar radiation and the outside temperature, detailed calculations of electricity productivity were made using Equations (1)–(5). There is no archived information on the arrangement of the panels in the databases relating to the “My Electricity” program, and therefore, it cannot be assumed that all installations are located in terms of ensuring maximum energy gains per year. The calculations used data on the total annual intensity of solar radiation registered on the horizontal plane (insolation).
The calculation results for each province in Poland in terms of insolation, yearly unit production electricity from PV (YUPVP), and the average annual temperature are presented in Table 1.
The highest value of insolation in relation to m2 of the panel area per year was obtained for the Lesser Poland Province, as 1257 kWh. Additionally, the highest productivity was found for the Lesser Poland Province (1104.32 kWh/kWp/year), and the lowest for the Warmian-Masurian Province (1025.71 kWh/kWp/year). The obtained values of yearly electricity production (YUPVP) were similar to the results presented by MERRA-II (YUPVP’). The convergence of values was greater than 99% (difference YUPVP and YUPVP’ < 1%).
On the basis of Formulas (5) and (6), electricity productivity was calculated in the first year and over 30 years. Based on information on the amount of co-financing for each province (DI), the cost of co-financing electricity production was calculated per 1 MWh. The results are presented in Table 2.
In the perspective of 30 years, the production of 1 MWh of energy from PV was subsidised in the amount of approximately 6.52 EUR on the national scale. The highest amount was co-financed for installations in the Podkarpackie Province (7.46 EUR/MWh), and the lowest in the Opolskie Province (5.78 EUR/MWh). The differences in the amount of co-financing result from weather conditions, as well as the average size of installations in individual provinces.

4.2. Results of Calculations Avoided CO2eq Emission

Results of LCA model calculations according to the IPCC GWP 100a method showed that the main elements influencing environmental burden in the climate change category are connected with the production of PV systems. Calculation of basic scenarios for monocrystalline and polycrystalline PV systems of 5.72 kWp resulted in estimated emissions of 9421.43 kg CO2eq and 8744.99 kg CO2eq, respectively. Over 82% of these values related to PV panels, while 12% corresponded to BOS and 5% to the servicing. Other unit processes such as transport and installing were characterised by relatively small shares within 1%, which is also reported in related previous studies [67]. These basic values were then differentiated between provinces on the basis of changing transportation distances, kinds of technology used in 2019 and 2020, as well as systems’ productivity. The results of individually calculated emissions per functional unit (1 kWh of energy generated by system) and over a 30-year perspective used in the study are presented in Table 3 and Figure 8.
As can be inferred, FU-GWP differs between provinces, first on the basis of various productivity of PV installation and then transport distances. The correlation between yearly electricity productivity can be observed on the base of Table 1 since the provinces such as Lower Silesia, Opolskie, Silesian, characterised by the highest productivity represent the lowest FU-GWP indicators. The outcomes of calculations are comparable to previous studies on PV systems working in temperate climate conditions [67,68,69], and smaller FU-GWP indicators result from the higher efficiencies of the analysed PV panels. At the same time, the calculated emission rate is similar to the literature results of the carbon emission rate for PV installations working under similar solar irradiation (1222 kWh/m2/year, Germany), equal to 55 g CO2eq/kWh [70].
Calculation of avoided emission ΔGHG, Mg CO2eq, was based on unit GWP indicators obtained for hard coal (0.966 kg CO2eq/kWh), lignite (1.164 kg CO2eq/kWh), natural gas (0.738 kg CO2eq/kWh), and Polish energy mix called MIX PL (0.804 kg CO2eq/kWh) compared with the data in Table 4 [21,64,71].
According to the data in Table 4 and Figure 9, provinces with the highest number of installations (Lesser Poland, Masovian, Greater Poland, Silesian) contribute to the highest possible reduction in CO2eq emission. The level of CO2eq avoided emission depends on the energy source replaced. The final effects of the “My Electricity” program in accordance with climate change are, therefore, hard to precisely estimate since CO2eq avoided emission is correlated with the predictions on shares of energy sources in the Polish market.
Comparison of the obtained results with previous studies on the existing support programs and their environmental impacts over the world show the potential of carbon emission avoidance determined by local conditions and the scope of calculations. One of the main factors can be defined as the characteristics of grid electricity (energy mix) determining both emission avoidance potential and energy payback time. Thus, in fossil-fuel-based countries, the support programs of photovoltaic technology have the potential to contribute to GHG reduction, while in countries with a high share of RES, such as the study by [58,72] using the example of Brazil, the policy should be more carefully defined, in spite of the fact that calculated GHG emissions from photovoltaics can be reduced by the use of PV panel manufactured in low-carbon economics. Still, in some case studies assessing PV distributed generation projects (1255.2 kWp) in the same country, the estimated environmental advantage is nearing 0.48 kg CO2eq/kWh and 19,900 Mg CO2eq over the project lifetime of 25 years [73].
According to data presented in [73] on the basics of household cases, many legislative and financial supports need to be implemented to ensure financial accessibility of novel technologies to domestic consumers and to encourage them to participate in balancing local energy demand and supply. A similar trend can be observed in this study, where the fast development of the PV market was stimulated by financial aspects. As presented in [73], average implicit abatement subsidy varies between countries and was estimated as 137–170 USD/1 Mg CO2eq (116–145 EUR/1 Mg CO2eq) for Germany, with avoidance potential 0.521 kg CO2eq/kWh [74]. It should be noted that higher avoidance potential in this study results from the energy mix and close to 0.748 kg CO2eq/kWh. Assuming that the energy produced from burning hard coal is replaced by energy from photovoltaics, the savings will amount to 35 million tons of CO2. With the current prices of CO2 emission allowances of around EUR 50 (Figure 1), the “My Electricity” program will save EUR 1550 million with an expenditure of EUR 251 million. Taking into account the total installation costs of 1010 EUR/kWp [75,76], they are still lower than the costs of CO2 emission rights over 30 years.

5. Conclusions

In the years 2019–2020, the Polish government offered prosumers a program of co-financing PV installations called “My Electricity”. The amount of the subsidy was up to max. 50% of eligible costs, up to a maximum amount of PLN 5000 (EUR 1111). In the assumed period, more than half of the photovoltaic micro-installations established in Poland received funding under the “My Electricity” program. The total cost of the subsidy program was EUR 251 million. Currently, the program continues as part of the third round from July 2021 with changed conditions, including a reduced maximum grant amount of EUR 667 for installations.
The average power of PV micro-installations with co-financing is 5.72 kWp. Most installations were built in the very industrialised Silesian Province (27,160), the lowest in the Podlaskie Province (4824). In total, installations with a total capacity of 1295 MWp were created under the “My Electricity” program. With the productivity of PV installations at the level of 1025–1104 kWh/kWp/year (differentiated by region), these installations will contribute to the production of approx. 38 TWh of green energy over 30 years.
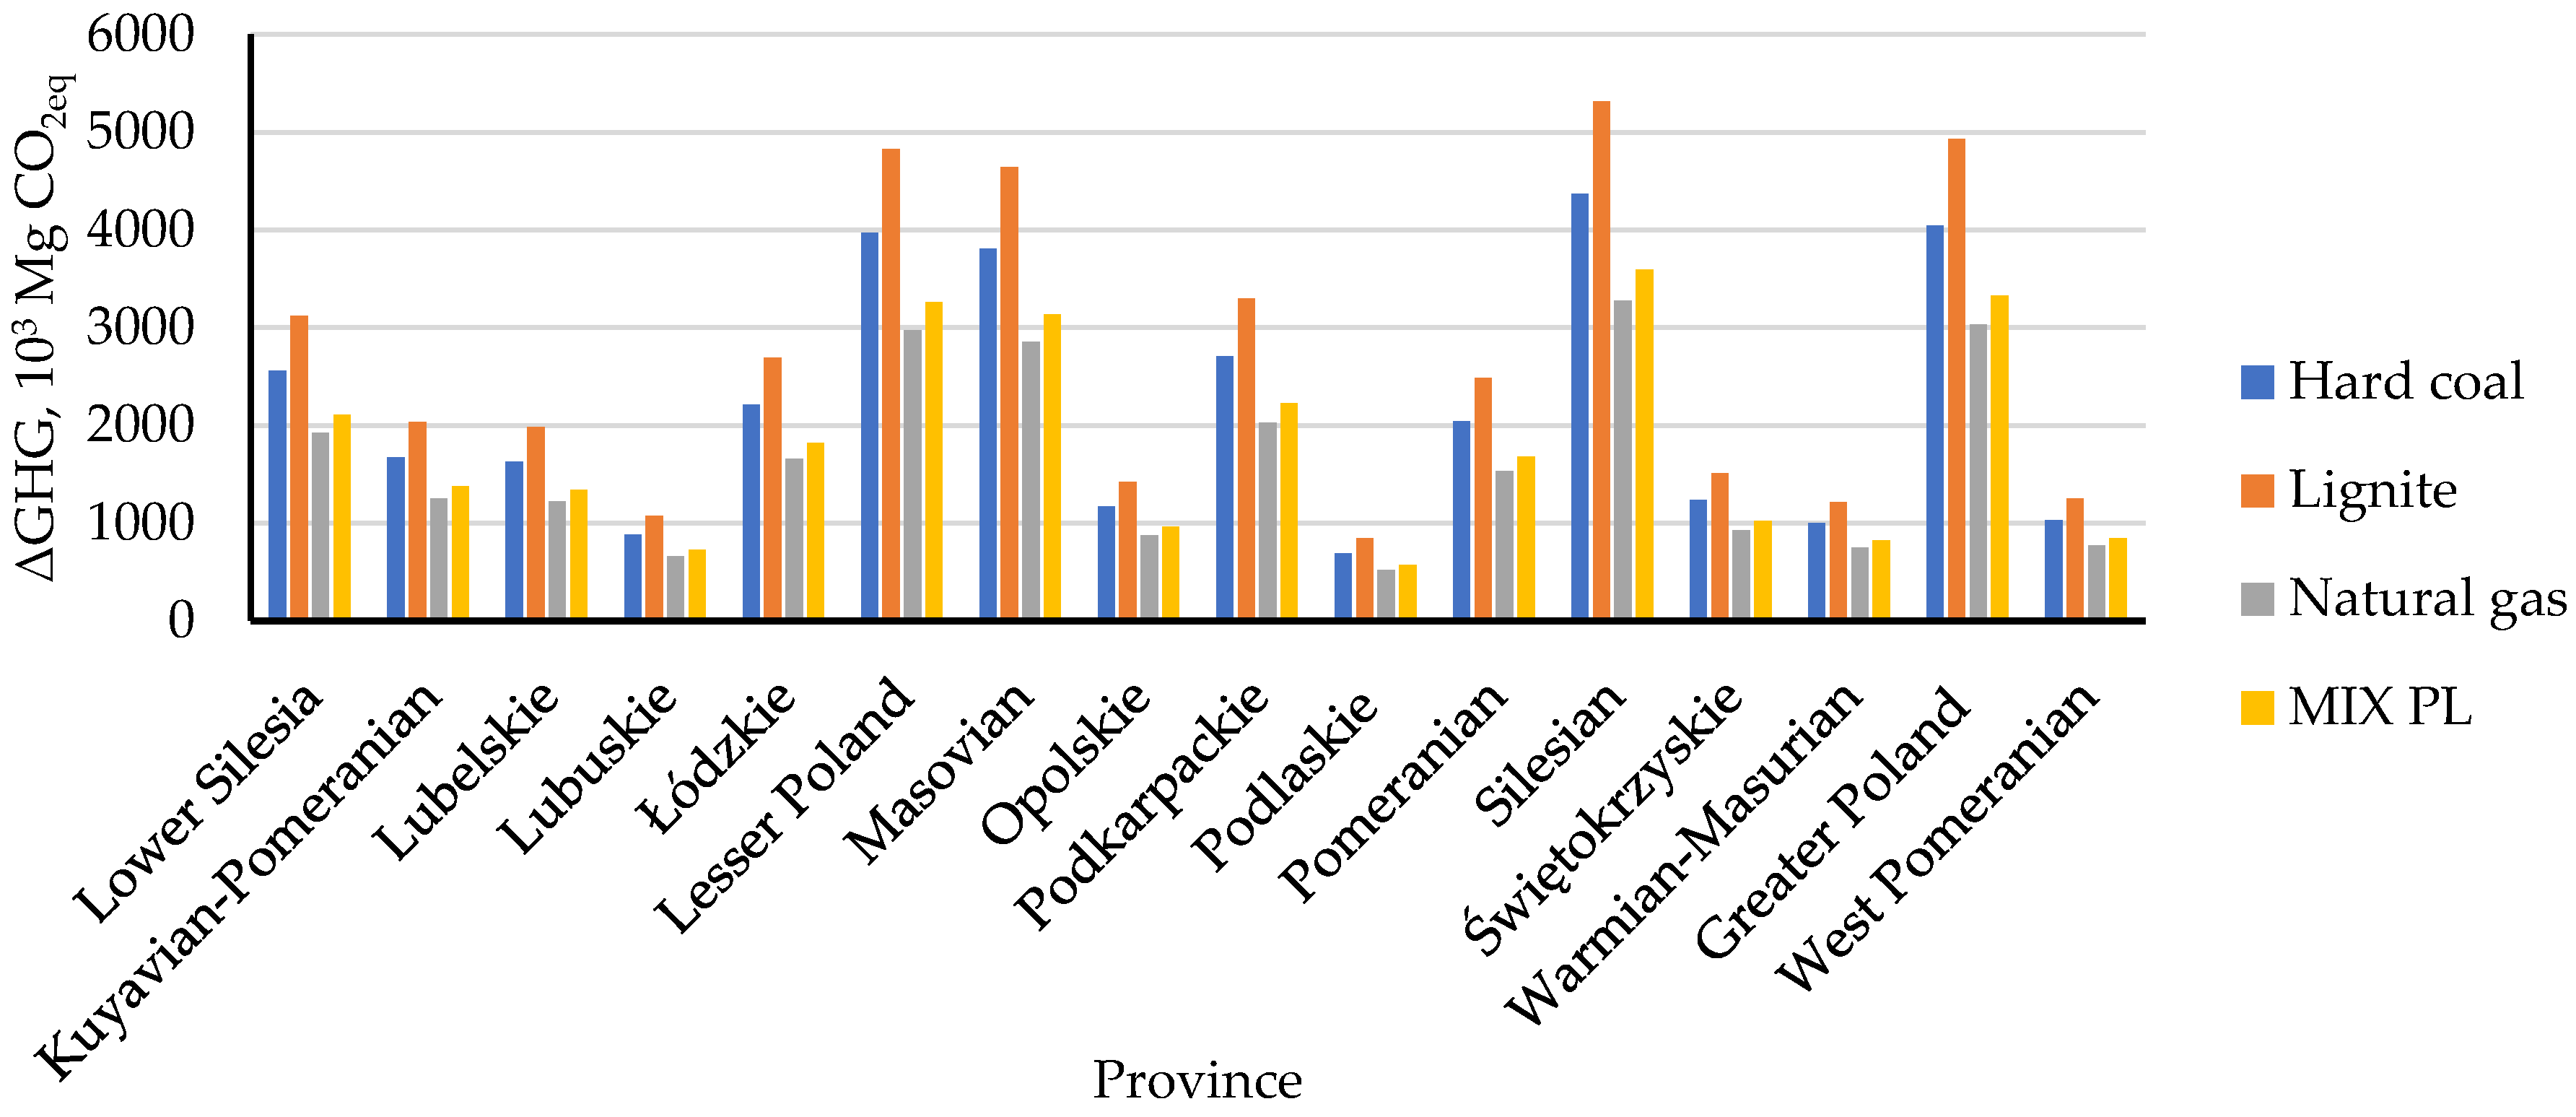
It is broadly recognised that PV systems can be treated as a source of green energy. The environmental effects of the “My Electricity” program implementation in Poland, measured by the avoided CO2eq emissions based on the IPCC GWP 100a indicator, are highly positive in light of the fact that the Polish power industry is still largely based on fossil fuels. The detailed LCA analysis of the installations allowed for the determination of CO2eq emissions at the average level of 9390.7 kg per system, while the average CO2eq emission per functional unit was 0.056 kg CO2eq/kWh, which corresponds to the Central European conditions of insolation. The particular indicators are influenced by the type of technology and location of the system, as stated in this study. Future analysis should consider the relationship between the size of the system and the CO2eq emissions to show the areas with the greatest effectiveness of support.
According to the analysis, while reducing the carbon footprint of energy units by 92–95%, PV systems built in the “My Electricity” program can contribute to the avoidance of 26–42·106 Mg of greenhouse gas emission in 30 years of life cycle perspective. This, together with the analysed economic aspects, leads to the conclusion that the use of this type of financial instrument is fully justified, in particular in the case of stimulating the development of energy markets with a large share of conventional energy sources.

Author Contributions

Conceptualisation, P.O., D.M. and A.Ż.; methodology, P.O. and A.Ż.; software, P.O. and A.Ż.; validation, D.M. and M.O.; formal analysis, D.M. and M.O.; investigation, P.O., D.M. and M.O.; resources, A.Ż. and P.O.; data curation, P.O., A.Ż., D.M. and M.O.; writing—original draft preparation, P.O., A.Ż., D.M. and M.O.; writing—review and editing, M.O.; visualisation, P.O. and A.Ż.; supervision, P.O.; project administration, P.O. and M.O. and funding acquisition, P.O., A.Ż., D.M. and M.O. All authors have read and agreed to the published version of the manuscript.

Funding

The publication was co-financed by the subsidies from: the Faculty of Environmental Engineering, Lublin University of Technology, statutory founds FD-20/IS-6/042; the Faculty of Energy and Fuels, AGH University of Science and Technology, No. 16.16.210.476; the Faculty of Environmental and Power Engineering, Cracow University of Technology.

Institutional Review Board Statement

Not applicable.

Informed Consent Statement

Not applicable.

Data Availability Statement

Not applicable.

Conflicts of Interest

The authors declare no conflict of interest.

References

  1. IEA. 2016 Snapshot of Global Photovoltaic Markets; IEA: Paris, France, 2017. [Google Scholar]
  2. IEA. World Energy Outlook 2017; IEA: Paris, France, 2017. [Google Scholar]
  3. Pestana, D.G.; Rodrigues, S.; Morgado-Dias, F. Environmental and economic analysis of solar systems in Madeira, Portugal. Util. Policy 2018, 55, 31–40. [Google Scholar] [CrossRef]
  4. Nishimura, A.; Hayashi, Y.; Tanaka, K.; Hirota, M.; Kato, S.; Ito, M.; Araki, K.; Hu, E.J. Life cycle assessment and evaluation of energy payback time on high-concentration photovoltaic power generation system. Appl. Energy 2010, 87, 2797–2807. [Google Scholar] [CrossRef]
  5. UNFCC Paris Agreement. Available online: https://unfccc.int/sites/default/files/english_paris_agreement.pdf (accessed on 14 July 2021).
  6. REN21 Renewables 2018 Global Status Report (Paris: REN21 Secretariat). Available online: http://www.ren21.net/gsr-2018/ (accessed on 12 November 2021).
  7. Abrell, J.; Kosch, M.; Rausch, S. Carbon abatement with renewables: Evaluating wind and solar subsidies in Germany and Spain. J. Public Econ. 2019, 169, 172–202. [Google Scholar] [CrossRef]
  8. Olczak, P.; Komorowska, A. An adjustable mounting rack or an additional PV panel? Cost and environmental analysis of a photovoltaic installation on a household: A case study in Poland. Sustain. Energy Technol. Assess. 2021, 47, 101496. [Google Scholar] [CrossRef]
  9. Fischer, C.; Newell, R.G. Environmental and technology policies for climate mitigation. J. Environ. Econ. Manag. 2008, 55, 142–162. [Google Scholar] [CrossRef] [Green Version]
  10. Meckling, J.; Sterner, T.; Wagner, G. Policy sequencing toward decarbonization. Nat. Energy 2017, 2, 918–922. [Google Scholar] [CrossRef]
  11. Mikhno, I.; Koval, V.; Shvets, G.; Garmatiuk, O.; Tamosiuniene, R. Green Economy in Sustainable Development and Improvement of Resource Efficiency. Cent. Eur. Bus. Rev. 2021, 10, 99–113. [Google Scholar] [CrossRef]
  12. European Commission. European Semester: Assessment of Progress on Structural Reforms, Prevention and Correction of Macroeconomic Imbalances, and Results of In-Depth Reviews under Regulation (EU); No 1176/2011; European Commission: Brussels, Belgium, 2019. [Google Scholar]
  13. Sawicka-Chudy, P.; Rybak-Wilusz, E.; Sibiński, M.; Pawelek, R.; Cholewa, M.; Kaczor, M. Analysis of possibilities and demand for energy in a public building using a tracking photovoltaic installation. E3S Web Conf. 2018, 49, 96. [Google Scholar] [CrossRef] [Green Version]
  14. Jaeger-Waldau, A. PV Status Report 2019; The Publications Office of the European Union: Luxembourg, 2019. [Google Scholar]
  15. Jäger-Waldau, A.; Kougias, I.; Taylor, N.; Thiel, C. How photovoltaics can contribute to GHG emission reductions of 55% in the EU by 2030. Renew. Sustain. Energy Rev. 2020, 126, 109836. [Google Scholar] [CrossRef]
  16. Micheli, D.; Alessandrini, S.; Radu, R.; Casula, I. Analysis of the outdoor performance and efficiency of two grid connected photovoltaic systems in northern Italy. Energy Convers. Manag. 2014, 80, 436–445. [Google Scholar] [CrossRef]
  17. Phinikarides, A.; Makrides, G.; Zinsser, B.; Schubert, M.; Georghiou, G.E. Analysis of photovoltaic system performance time series: Seasonality and performance loss. Renew. Energy 2015, 77, 51–63. [Google Scholar] [CrossRef]
  18. Woszczyński, M.; Rogala-Rojek, J.; Bartoszek, S.; Gaiceanu, M.; Filipowicz, K.; Kotwica, K. In Situ Tests of the Monitoring and Diagnostic System for Individual Photovoltaic Panels. Energies 2021, 14, 1770. [Google Scholar] [CrossRef]
  19. Sampaio, P.G.V.; González, M.O.A. Photovoltaic solar energy: Conceptual framework. Renew. Sustain. Energy Rev. 2017, 74, 590–601. [Google Scholar] [CrossRef]
  20. Arsawan, I.W.E.; Koval, V.; Duginets, G.; Kalinin, O.; Korostova, I. The impact of green innovation on environmental performance of SMEs in an emerging economy. E3S Web Conf. 2021, 255, 1012. [Google Scholar] [CrossRef]
  21. ENTSOE Generation by Fuel. Available online: http://energy.instrat.pl/generation_by_fuel (accessed on 14 July 2021).
  22. Kaszyński, P.; Komorowska, A.; Kamiński, J. Regional distribution of hard coal consumption in the power sector under selected forecasts of EUA prices. Gospod. Surowcami Miner.—Miner. Resour. Manag. 2019, 35, 113–134. [Google Scholar]
  23. Statista Greenhouse Gas Emissions in Poland from 2000 to 2018. Available online: https://www.statista.com/statistics/1064570/poland-greenhouse-gas-ghg-emissions/ (accessed on 14 July 2021).
  24. Brauers, H.; Oei, P.Y. The political economy of coal in Poland: Drivers and barriers for a shift away from fossil fuels. Energy Policy 2020, 144, 111621. [Google Scholar] [CrossRef]
  25. Carbon Tracker. Ostroleka C: Burning More Money Than Coal; Carbon Tracker: London, UK, 2018. [Google Scholar]
  26. Quandl EUA Certificate Prices. Available online: http://energy.instrat.pl/co2_prices (accessed on 20 June 2021).
  27. Zdyb, A.; Gulkowski, S. Performance assessment of four different photovoltaic technologies in Poland. Energies 2020, 13, 196. [Google Scholar] [CrossRef] [Green Version]
  28. Global solar Atlas GHI—Global Horizontal Irradiation. Available online: https://globalsolaratlas.info/map?c=11.609193,8.261719,3 (accessed on 12 September 2021).
  29. Olek, M.; Olczak, P.; Kryzia, D. The sizes of Flat Plate and Evacuated Tube Collectors with Heat Pipe area as a function of the share of solar system in the heat demand. E3S Web Conf. 2016, 10, 00139. [Google Scholar] [CrossRef]
  30. PTPiREE Micro-Installations in Poland. Available online: http://www.ptpiree.pl/energetyka-w-polsce/energetyka-w-liczbach/mikroinstalacje-w-polsce (accessed on 5 June 2021).
  31. Olczak, P.; Jaśko, P.; Kryzia, D.; Matuszewska, D.; Fyk, M.I.; Dyczko, A. Analyses of duck curve phenomena potential in polish PV prosumer households’ installations. Energy Rep. 2021, 7, 4609–4622. [Google Scholar] [CrossRef]
  32. Polityka Energetyczna Polski 2040, Zalacznik do Uchwaly nr 22/2021 Rady Ministrow z Dnia 2 Lutego 2021 r; Ministerstwo Klimatu i Srodowiska: Warsaw, Poland, 2021. (In Polish)
  33. Szczerbowski, R.; Kornobis, D. The proposal of an energy mix in the context of changes in Poland’s energy policy. Polityka Energetyczna 2019, 22, 5–18. [Google Scholar] [CrossRef]
  34. Wróbel, J.; Sołtysik, M.; Rogus, R. Selected elements of the Neighborly Exchange of Energy — Profitability evaluation of the functional model. Polityka Energetyczna 2019, 22, 53–64. [Google Scholar] [CrossRef]
  35. Abrell, J.; Rausch, S.; Streitberger, C. The economics of renewable energy support. J. Public Econ. 2019, 176, 94–117. [Google Scholar] [CrossRef] [Green Version]
  36. Olczak, P.; Kryzia, D.; Matuszewska, D.; Kuta, M. “My Electricity” Program Effectiveness Supporting the Development of PV Installation in Poland. Energies 2021, 14, 231. [Google Scholar] [CrossRef]
  37. Peng, J.; Lu, L. Investigation on the development potential of rooftop PV system in Hong Kong and its environmental benefits. Renew. Sustain. Energy Rev. 2013, 27, 149–162. [Google Scholar] [CrossRef]
  38. Wu, P.; Ma, X.; Ji, J.; Ma, Y. Review on Life Cycle Assessment of Greenhouse Gas Emission Profit of Solar Photovoltaic Systems. Energy Procedia 2017, 105, 1289–1294. [Google Scholar] [CrossRef]
  39. Curran, M.A. Life Cycle Assessment: A review of the methodology and its application to sustainability. Curr. Opin. Chem. Eng. 2013, 2, 273–277. [Google Scholar] [CrossRef]
  40. Sherwani, A.F.; Usmani, J.A. Varun Life cycle assessment of solar PV based electricity generation systems: A review. Renew. Sustain. Energy Rev. 2010, 14, 540–544. [Google Scholar] [CrossRef]
  41. Bracquene, E.; Peeters, J.R.; Dewulf, W.; Duflou, J.R. Taking Evolution into Account in a Parametric LCA Model for PV Panels. Procedia CIRP 2018, 69, 389–394. [Google Scholar] [CrossRef]
  42. Müller, A.; Friedrich, L.; Reichel, C.; Herceg, S.; Mittag, M.; Neuhaus, D.H. A comparative life cycle assessment of silicon PV modules: Impact of module design, manufacturing location and inventory. Sol. Energy Mater. Sol. Cells 2021, 230, 111277. [Google Scholar] [CrossRef]
  43. Celik, I.; Song, Z.; Cimaroli, A.J.; Yan, Y.; Heben, M.J.; Apul, D. Life Cycle Assessment (LCA) of perovskite PV cells projected from lab to fab. Sol. Energy Mater. Sol. Cells 2016, 156, 157–169. [Google Scholar] [CrossRef] [Green Version]
  44. Bogacka, M.; Pikoń, K.; Landrat, M. Environmental impact of PV cell waste scenario. Waste Manag. 2017, 70, 198–203. [Google Scholar] [CrossRef]
  45. Ansanelli, G.; Fiorentino, G.; Tammaro, M.; Zucaro, A. A Life Cycle Assessment of a recovery process from End-of-Life Photovoltaic Panels. Appl. Energy 2021, 290, 116727. [Google Scholar] [CrossRef]
  46. NFOŚiGW Mój Prąd. Available online: https://mojprad.gov.pl (accessed on 8 December 2020).
  47. Cader, J.; Olczak, P.; Koneczna, R. Regional dependencies of interest in the “My Electricity” photovoltaic subsidy program in Poland. Polityka Energetyczna—Energy Policy J. 2021, 24, 97–116. [Google Scholar] [CrossRef]
  48. Olczak, P.; Matuszewska, D.; Kryzia, D. “Mój Prąd” as an example of the photovoltaic one off grant program in Poland. Energy Policy J. 2020, 23, 123–138. [Google Scholar] [CrossRef]
  49. Anon Homer Energy. Available online: https://www.homerenergy.com/products/pro/docs/latest/how_homer_calculates_the_pv_array_power_output.html (accessed on 12 November 2021).
  50. Al Garni, H.Z.; Awasthi, A.; Ramli, M.A.M. Optimal design and analysis of grid-connected photovoltaic under different tracking systems using HOMER. Energy Convers. Manag. 2018, 155, 42–57. [Google Scholar] [CrossRef]
  51. Longi LR4-60HPH 360M. Available online: https://en.longi-solar.com/uploads/attach/20200423/5ea0f91d33235.pdf (accessed on 2 June 2020).
  52. Homer Energy. Available online: https://www.homerenergy.com/products/pro/docs/latest/how_homer_calculates_the_pv_cell_temperature.html (accessed on 12 November 2021).
  53. Khuong, P.M.; McKenna, R.; Fichtner, W. A cost-effective and transferable methodology for rooftop PV potential assessment in developing countries. Energies 2020, 13, 2501. [Google Scholar] [CrossRef]
  54. Duffie, J.A.; Beckman, W.A. Solar Engineering of Thermal Processes; John Willey and Sons: Hoboken, NJ, USA, 2006. [Google Scholar]
  55. Park, C.-Y.; Hong, S.-H.; Lim, S.-C.; Song, B.-S.; Park, S.-W.; Huh, J.-H.; Kim, J.-C. Inverter Efficiency Analysis Model Based on Solar Power Estimation Using Solar Radiation. Processes 2020, 8, 1225. [Google Scholar] [CrossRef]
  56. ISO. ISO 14040:2006 Environmental Management—Life Cycle Assessment—Principles and Framework; ISO: Geneva, Switzerland, 2006. [Google Scholar]
  57. Frischknecht, R.; Stolz, P.; Krebs, L.; de Wild Sholten, M.; Sinha, P. Life Cycle Inventories and Life Cycle Assessments of Photovoltaic Systems; IEA: New York, NY, USA, 2020. [Google Scholar]
  58. Constantino, G.; Freitas, M.; Fidelis, N.; Pereira, M.G. Adoption of Photovoltaic Systems Along a Sure Path: A Life-Cycle Assessment (LCA) Study Applied to the Analysis of GHG Emission Impacts. Energies 2018, 11, 2806. [Google Scholar] [CrossRef] [Green Version]
  59. Enano, N.J.; Barroca, R.; Montecastro, D. Avoided emissions resulting from grid-tied solar photovoltaic generation in the Philippines: An energy-based analysis. IOP Conf. Ser. Mater. Sci. Eng. 2021, 1088, 12053. [Google Scholar] [CrossRef]
  60. IEO. PV Market in Poland 2020; IEO: Warsaw, Poland, 2020. [Google Scholar]
  61. De Wild-Scholten, M.; Jongbluth, N.; Tuchschmid, M. Life Cycle Assessment of Photovoltaics: Update of Ecoinvent Data V2.0; Publisher: ECN, The Netherlands, 2008. [Google Scholar]
  62. SBF. Market of Micro PV Installations 2019; SBF: Cracow, Poland, 2020. [Google Scholar]
  63. SBF. Market of Micro PV Installations 2020; SBF: Cracow, Poland, 2021. [Google Scholar]
  64. KOBiZE. CO2, SO2, NOx, CO and Total Dust Emission Ratios for Electricity Based on the Information Contained in the National Database of Greenhouse Gas Emissions and Other Substances for 2019; KOBiZE: Warsaw, Poland, 2020. [Google Scholar]
  65. Pereira, L.; Wachsmuth, J.; Edwards, R. Methodology for Calculation of GHG Emission Avoidance. Available online: https://ec.europa.eu/clima/sites/clima/files/innovation-fund/20200605_calculations_en.pdf (accessed on 15 July 2021).
  66. NASA. Solar Radiation. Available online: https://power.larc.nasa.gov/data-access-viewer/ (accessed on 20 July 2020).
  67. Żelazna, A.; Zdyb, A.; Pawłowski, A. The Influence of Selected Factors on PV Systems Environmental Indicators. Annu. Set Environ. Prot. 2016, 18, 722–732. [Google Scholar]
  68. Zhang, F.; Zhou, Y.; Sun, W.; Hou, S.; Yu, L. CO2 capture from reheating furnace based on the sensible heat of continuous casting slabs. Int. J. Energy Res. 2018, 42, 2273–2283. [Google Scholar] [CrossRef]
  69. Asdrubali, F.; Baldinelli, G.; D’Alessandro, F.; Scrucca, F. Life cycle assessment of electricity production from renewable energies: Review and results harmonization. Renew. Sustain. Energy Rev. 2015, 42, 1113–1122. [Google Scholar] [CrossRef]
  70. Breyer, C.; Koskinen, O.; Blechinger, P. Profitable climate change mitigation: The case of greenhouse gas emission reduction benefits enabled by solar photovoltaic systems. Renew. Sustain. Energy Rev. 2015, 49, 610–628. [Google Scholar] [CrossRef]
  71. Wernet, G.; Bauer, C.; Steubing, B.; Reinhard, J.; Moreno-Ruiz, E.; Weidema, B. The ecoinvent database version 3 (part I): Overview and methodology. Int. J. Life Cycle Assess. 2016, 21, 1218–1230. [Google Scholar] [CrossRef]
  72. Vidal, M.A.; Faria, A.F.; Stach, A.H.M.; Neto, D.P.; Pinto, L.S.; Pinho, A.G. Quantification of CO2 emission reductions from energy efficiency actions and solar photovoltaic generation at the Federal Institute of Education, Science, and Technology of Goiás. In Proceedings of the 19th International Conference on Renewable Energies and Power Quality (ICREPQ’21), Almeria, Spain, 28–30 July 2021; p. 209. [Google Scholar]
  73. Dong, S.; Kremers, E.; Brucoli, M.; Rothman, R.; Brown, S. Improving the feasibility of household and community energy storage: A techno-enviro-economic study for the UK. Renew. Sustain. Energy Rev. 2020, 131, 110009. [Google Scholar] [CrossRef]
  74. Bakhtyar, B.; Ibrahim, Y.; Alghoul, M.A.; Aziz, N.; Fudholi, A.; Sopian, K. Estimating the CO2 abatement cost: Substitute Price of Avoiding CO2 Emission (SPAE) by Renewable Energyߣs Feed in Tariff in selected countries. Renew. Sustain. Energy Rev. 2014, 35, 205–210. [Google Scholar] [CrossRef]
  75. Olczak, P.; Olek, M.; Matuszewska, D.; Dyczko, A.; Mania, T. Monofacial and Bifacial Micro PV Installation as Element of Energy Transition—The Case of Poland. Energies 2021, 14, 499. [Google Scholar] [CrossRef]
  76. Wysokienapiecie.pl My Electricity 3.0: The Amount of the Subsidy and the Budget are Cut by Almost Half. Available online: https://wysokienapiecie.pl/38726-moj-prad-3-0-budzet-dotacje-o-niemal-polowe-mniejsze/ (accessed on 19 July 2021).
Figure 1. Prices of CO2 emission allowances in 2014–2021. Authors’ study based on [26].
Energies 14 07679 g001
Figure 2. Number of PV installations and installed power capacity of PV installation in Poland. Authors’ study based on [30].
Energies 14 07679 g002
Figure 3. The results of the 1st round of recruitment for the “My Electricity” program (carried out in 2019) number of installations (NI) and power of installations (PI). Authors’ study based on [46,47,48].
Energies 14 07679 g003
Figure 4. Results of the 2nd round of “My Electricity” recruitment carried out in 2020: number of installations (NI), power of installations (PI).
Energies 14 07679 g004
Figure 5. Total results of the 1st and 2nd rounds of the “My Electricity” recruitment carried out in 2019 and 2020: power of installations (PI); number of installations (NI).
Energies 14 07679 g005
Figure 6. Average installed capacity of installations under the “My Electricity” program (API), in year: 2019 (2019 y), 2020 (2020 y).
Energies 14 07679 g006
Figure 7. Weather data for the centre of Poland according to the weighted power of photovoltaic installations created under the “My Electricity” program, data for 2019: (a) solar radiation intensity on the horizontal plane; (b) outdoor temperature.
Energies 14 07679 g007
Figure 8. Monte Carlo results of FU-GWP calculated for the provinces with a confidence interval of 90%.
Energies 14 07679 g008
Figure 9. ΔGHG, 103 Mg CO2eq in four scenarios of replaced energy source.
Energies 14 07679 g009
Table 1. Insolation, yearly electricity productivity, and yearly average temperature outside per province. Authors’ study based on [66].
ProvinceInsolation (Yearly Sum of Gh)YUPVP (First Year)YUPVP’Yearly Average Ta
kWh/m2/yearkWh/kWp/yearkWh/kWp/year°C
Lower Silesia1253.91099.881036.69.93
Kuyavian-Pomeranian1185.71040.45979.89.44
Lubelskie1219.21070.711010.69.35
Lubuskie1179.41033.60973.610.09
Łódzkie1222.01072.051011.29.67
Lesser Poland1257.01104.321042.59.36
Masovian1206.21058.02998.29.46
Opolskie1250.51096.621033.79.86
Podkarpackie1241.51090.581029.29.42
Podlaskie1176.91035.67977.18.34
Pomeranian1229.81083.121025.79.60
Silesian1251.41099.541038.39.37
Świętokrzyskie1232.31082.701022.09.33
Warmian-Masurian1164.51025.71967.98.32
Greater Poland1210.91061.721000.010.00
West Pomeranian1230.51075.291016.210.58
YUPVP’—yearly electricity production directly from MERRA-II database [66].
Table 2. Globally electricity production and dotation per MWh per province.
ProvincePIYPVPI (First Year)Σ30 Years YPVPIDIUDPV
MWpGWhTWhmln EUREUR/MWh
Lower Silesia92.7102.02.8116.595.89
Kuyavian-Pomeranian63.966.51.8411.726.38
Lubelskie60.564.81.7912.416.94
Lubuskie34.235.30.976.106.25
Łódzkie82.288.22.4315.186.24
Lesser Poland142.6157.44.3527.736.38
Masovian143.6151.94.1928.006.68
Opolskie42.446.41.287.415.78
Podkarpackie98.7107.62.9722.167.46
Podlaskie 26.727.60.765.357.01
Pomeranian74.881.12.2414.526.49
Silesian157.7173.44.7930.146.30
Świętokrzyskie45.549.31.369.577.04
Warmian-Masurian38.839.81.107.376.70
Greater Poland 152.0161.44.4529.576.64
West Pomeranian38.141.01.137.186.34
sum (*mean)1294.31393.638.47250.986.52*
Table 3. Results of GWP indicator calculation: S-GWP—GWP indicator calculated for a PV system of 5.72 kWp, kg CO2eq; P-GWP—GWP indicator calculated for installations built during 2019 and 2020 in provinces, Mg CO2eq; FU-GWP—GWP per functional unit, Mg CO2eq/kWh.
ProvinceS-GWPP-GWPFU-GWP
kg CO2eqMg CO2eqkg CO2eq/kWh
Lower Silesia9390.0152,176.70.0542
Kuyavian-Pomeranian9390.7104,906.60.0570
Lubelskie9392.299,340.10.0555
Lubuskie9390.056,142.90.0579
Łódzkie9389.3134,929.50.0555
Lesser Poland9391.4234,129.00.0538
Masovian9391.4235,770.80.0563
Opolskie9390.769,609.40.0544
Podkarpackie9389.3162,013.80.0546
Podlaskie 9392.243,841.00.0577
Pomeranian9390.7122,801.50.0548
Silesian9390.7258,901.00.0541
Świętokrzyskie9391.474,704.50.0549
Warmian-Masurian9391.463,704.10.0579
Greater Poland 9390.7249,543.10.0561
West Pomeranian9389.362,540.30.0553
Table 4. ΔGHG, Mg CO2eq, calculated for provinces in Poland in 30 years perspective on the basis of individual GWP differences for the energy sources considered to be replaced, kg CO2eq/kWh.
ProvinceHard CoalLigniteNatural GasMIX PLHard CoalLigniteNatural GasMIX PL
kg CO2eq/kWh103 Mg CO2eq
Lower Silesia0.9121.1100.6830.7502562.13119.61920.52107.1
Kuyavian-Pomeranian0.9091.1070.6810.7471672.42037.41252.31374.5
Lubelskie0.9101.1090.6820.7491629.71984.81221.01339.8
Lubuskie0.9081.1060.6800.746880.81073.2659.3723.7
Łódzkie0.9101.1090.6820.7482212.32694.41657.41818.8
Lesser Poland0.9121.1100.6840.7503967.74830.72974.43263.3
Masovian0.9101.1080.6810.7483811.54642.72854.83133.0
Opolskie0.9121.1100.6830.7501166.81420.7874.5959.5
Podkarpackie0.9111.1100.6830.7492706.83296.02028.62225.9
Podlaskie 0.9081.1070.6800.746690.3841.0516.7567.2
Pomeranian0.9111.1090.6830.7492040.92485.31529.41678.2
Silesian0.9121.1100.6840.7504368.05318.23274.23592.3
Świętokrzyskie0.9111.1090.6830.7491239.01508.8928.41018.7
Warmian-Masurian0.9081.1060.6800.746998.81217.0747.7820.7
Greater Poland 0.9101.1080.6820.7484048.94931.73032.83328.3
West Pomeranian0.9111.1090.6820.7491029.01253.1770.9846.0
ΔGHG, 106 Mg CO2eq 35.02542.65526.24328.797
Publisher’s Note: MDPI stays neutral with regard to jurisdictional claims in published maps and institutional affiliations.

