Review

Review of Data and Data Sources for the Assessment of the Potential of Utility-Scale Hybrid Wind–Solar PV Power Plants Deployment, under a Microgrid Scope

1
Energy Department, CIEMAT, 28040 Madrid, Spain
2
Geography Department, Complutense University, 28040 Madrid, Spain
*
Author to whom correspondence should be addressed.
Energies 2021, 14(21), 7434; https://doi.org/10.3390/en14217434
Submission received: 30 August 2021 / Revised: 9 October 2021 / Accepted: 1 November 2021 / Published: 8 November 2021
(This article belongs to the Special Issue Analysis of Microgrid Integrated with Renewable Energy System)

Abstract

:
Utility-scale hybrid wind–solar PV power plants (which might include some storage as well) are an attractive option for the transition of conventional grids to incorporate high renewable energy (RE) shares. Along with lower generation costs, they offer increased dispatch capabilities and flexible operation. However, when assessing their potential, they present higher needs in terms of input data, as they are forced to consider both spatial and temporal variations to evaluate their techno-economic viability, as well as other common inputs such as economic, social or environmental data. The availability of the different data influences the type of analysis to be implemented. The microgrid approach of segmenting the information into layers will be adopted for the classification of data. Three different levels of analysis are sought: long-term energy scenarios, geo-spatial planning, and production cost estimation. The analysis of necessary data for each planning stage, and the available data sources for the assessment of utility-scale hybrid power plants, under this microgrid approach, is the main focus of this review.

1. Introduction

Most countries in the world are envisioning a transformation of their respective energy systems into those with a high renewable energy (RE) share. Although all forms of RE generation are being proposed, wind and solar photovoltaic (PV) generation are the most common ones nowadays. This deployment has been carried out supported and guided by public policies with private investment, and considering independent technology plants (either wind farms or PV plants), sometimes even on a competitive basis. Recently, an interest in utility-scale hybrid wind-solar PV power plant (HPP) has arisen, based on their particular benefits for a high RE share grid, such as: “optimized network use, higher yearly capacity factor, more stable power output, eased fulfillment of system-, site- and owner-specific power demand, more dispatchable generation, reduced infrastructure investment costs, and reduced electricity balancing costs” [1].
The European Union (EU), United States of America (USA), India, and Australia, for example, have manifested their interest and started the deployment of HPPs [1]. In [2] a database for wind + storage co-located projects can be found. In the same way, some wind turbine manufacturers such as Vestas, Siemens-Gamesa, and General Electric have HPP in their portfolios, and some developers such as Iberdrola are already developing these plants [3,4].
There has also been significant research interest in this topic: for example, [5] reviewed 550 relevant papers on PV-wind hybrids, and [6] references more than 150 papers related to the sizing process of hybrid systems.
Wind–solar PV hybrid evolution led to hybrid microgrids (MG) and hybrid smart grids, which are leading to virtual power plants (VPP) and other more innovative concepts appearing in the sector transformation.
Now, hybridization has reached the utility scale, and utility-scale HPPs are proposed. However, what is really a HPP and how do they connect to the aforementioned hybrid systems evolution? “HPP refers to a power-generating facility that converts primary energy into electrical energy and which consists of more than one power-generating modules connected to a network at one connection point. These might also include different forms of energy storage” [1]. This paper is focused on solar PV and wind HPPs, both with or without a storage system.
In [3] a deep analysis of existing publications and experiences in relation to utility-scale hybrid systems is undertaken to conclude with a taxonomy of three categories that will be adopted for the particular case of HPP:” co-located resources category involves multiple energy technologies that are locationally linked, but whose operations remain largely independent; in a virtual power plant, the operations of dispersed energy technologies are coordinated in order to leverage complementarities in their resource characteristics, the services they can provide, or both; and finally, in the full hybrid category multiple energy technologies are both locationally and operationally linked.
The HPP considered in this review is a plant in the multi-MW range, usually connected to the transmission line that, of course, includes both solar PV and wind generation but also a joint management and control of the plant, which might affect other components such as storage. According to the previous taxonomy, they would be full hybrids. But in this review, they will be considered as MG as well, and in the following paragraphs the reasons for and benefits of this MG approach are briefly introduced.
There are different definitions for a MG; however, many authors agree on three key components that MGs may share: generation and demand control systems, clearly defined boundaries, and island capabilities according to some of them [7]. According to this definition, strictly speaking, a HPP might not be considered as a MG, because it is not characterized by the capability of working in an isolated mode. However, it fulfills (or may fulfill) the other two components which might allow the consideration of a HPP as a MG. Furthermore, the capability of a HPP to operate in an isolated mode is something that is technically viable, as it has been shown in the so-called RE-diesel systems, and it is not difficult to envisage a near future where this capability is achieved also in grid-connected HPPs. So, on a broader approach, HPP will be considered as a type of MG, the utility’s segment, which includes MGs that may support the main grid of a large network or a concrete location, which represents around 5% of the 1618 MGs reviewed in [8]. In fact, the transformation that is taking place nowadays in the power systems is leading to a system of systems [9], where “the bulk power system comprises a suite of generation sources, the contributions of which are combined and coordinated to maximize the reliability, affordability, and sustainability of electricity supply” [3] (including HPPs among the generation sources).
The MG approach brings different advantages for the systematic assessment of the potential of the HPPs: all the existing knowledge for MGs may be used. One of them is using the information structure proposed for MGs. Some authors [7,10] have proposed a different layers structure, adapted from the European Committee for Electrotechnical Standardization (CENELEC)-Smart Grid working group [11]. In particular, in [7] the structure depicted in Figure 1 is proposed:
The six layers defined in this proposal are:
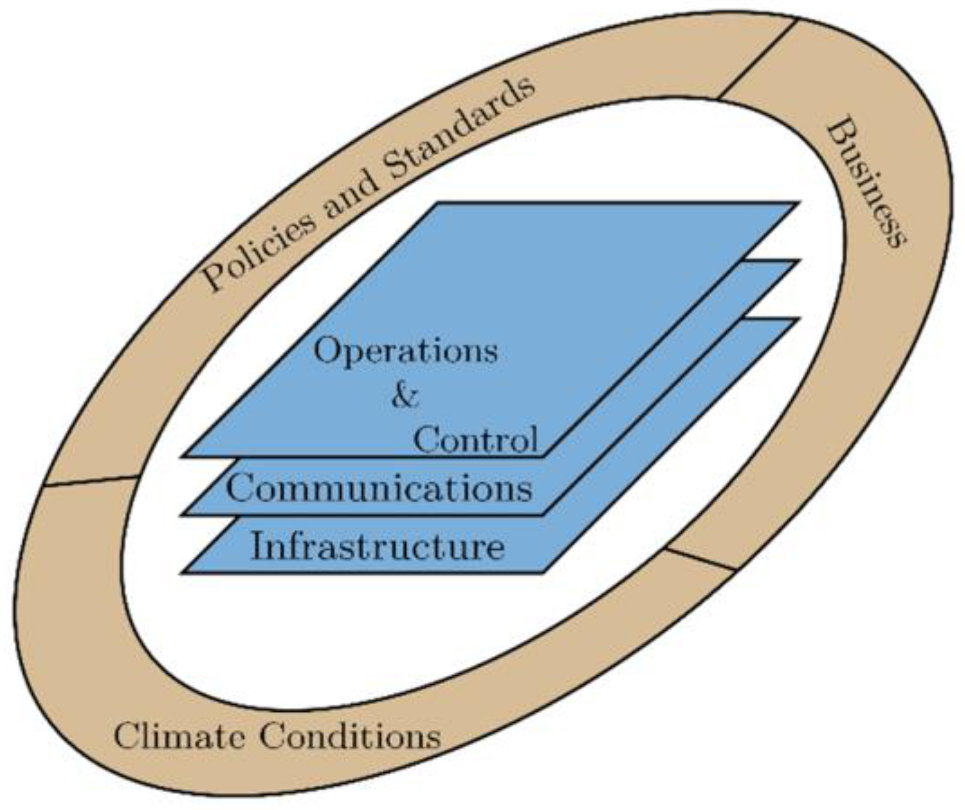
  • Climate conditions: related to location (such as resources);
  • Business: business models, which are strongly related to the next layer;
  • Policies and standards: regulatory issues, such as policies scenarios and technical standards;
  • Infrastructure: land use, grid, existing components, etc.;
  • Communications;
  • Operation and control.
These layers are intimately related to each other: policies define the regulations for the business models which, according to the climate conditions and the infrastructure resources, define the techno-economic feasibility for a particular operation and control strategy. But this relationship is bidirectional, as a change in the techno-economic conditions may induce a change in the feasibility of a particular business model, which may lead to a change in the regulations.
This MG layers structure shown in Figure 1 was proposed for interoperability of MGs; here it is adopted and adapted for the assessment as well. For this purpose, some adaptations are proposed: issues related with the design of the plant are considered to be part of the Business layer; and issues related with the site conditions (land use and cover, roads, airports, rivers, etc.) are considered to be part of the Infrastructure (also called Physical) layer
This view leads to the one proposed by the International Renewable Energy Association (IRENA) mentioning “four categories of major planning steps with different time horizons: generation expansion planning; geo-spatial planning; dispatch planning; and technical network studies” (subdivided into static and dynamic grid models); Figure 2 summarizes how these steps interact [12].
Each one of these four approaches in Figure 1 brings particular insights into the assessment of the potential of a HPP according to the layers structure in Figure 2: Long-term energy planning models determine the optimal long-term mix of technologies and the investment paths that lead to it, and it is mainly related to the Policies layer; geo-Spatial analysis is suitable for the assessment of the location-specific techno-economic performance of renewables, and the investment needs for clusters of RE, and has a straightforward relationship with Infrastructure layer; the dispatch or production costs level assesses the cost of optimal unit commitment and economic dispatch of a power system, and is strongly related to the Business layer; and finally the grid analysis aims to evaluate technical bottlenecks in a system so as to maintain the required levels of reliability and is mainly based on the operation and control layer. The climate conditions layer is related to the first three planning levels (Long-term planning, Geo-spatial and Production cost), but with different spatial detail and time resolutions, as shown in Figure 2. Different levels of analysis require different data and different sources, varying from a large scope (little detail) of the Long-term stage to the narrow scope (great detail) of the grid studies.
However, as the main interest of this review is the HPP plant level, the grid studies (both static and dynamic) will not be considered. This fourth step is related to the communication and operation and control layers (adopted from the MG approach), so they will not be considered either.

Scope of the Review

Therefore, it is a challenging task to assess the potential of HPP at a national level. This review is focused on the first action to complete this task: the identification of the data (and their main features) that are necessary for this assessment, including the existing sources for these data.
In order to narrow the scope of this review, only utility scale hybrid wind and solar PV plants (called here HPP) are included. The review will be as general as possible, but with the Spanish case assessment in mind. As there are so many aspects involved in this analysis, the review cannot be exhaustive, but it will be kept as representative as possible for each and every aspect. Some assumptions will be initially taken:
-
The MG layer structure in Figure 1 approach is adapted for the information categorization. In particular, four of these layers will be considered: climate conditions, Policy and Standards, Business, and, finally, infrastructure.
-
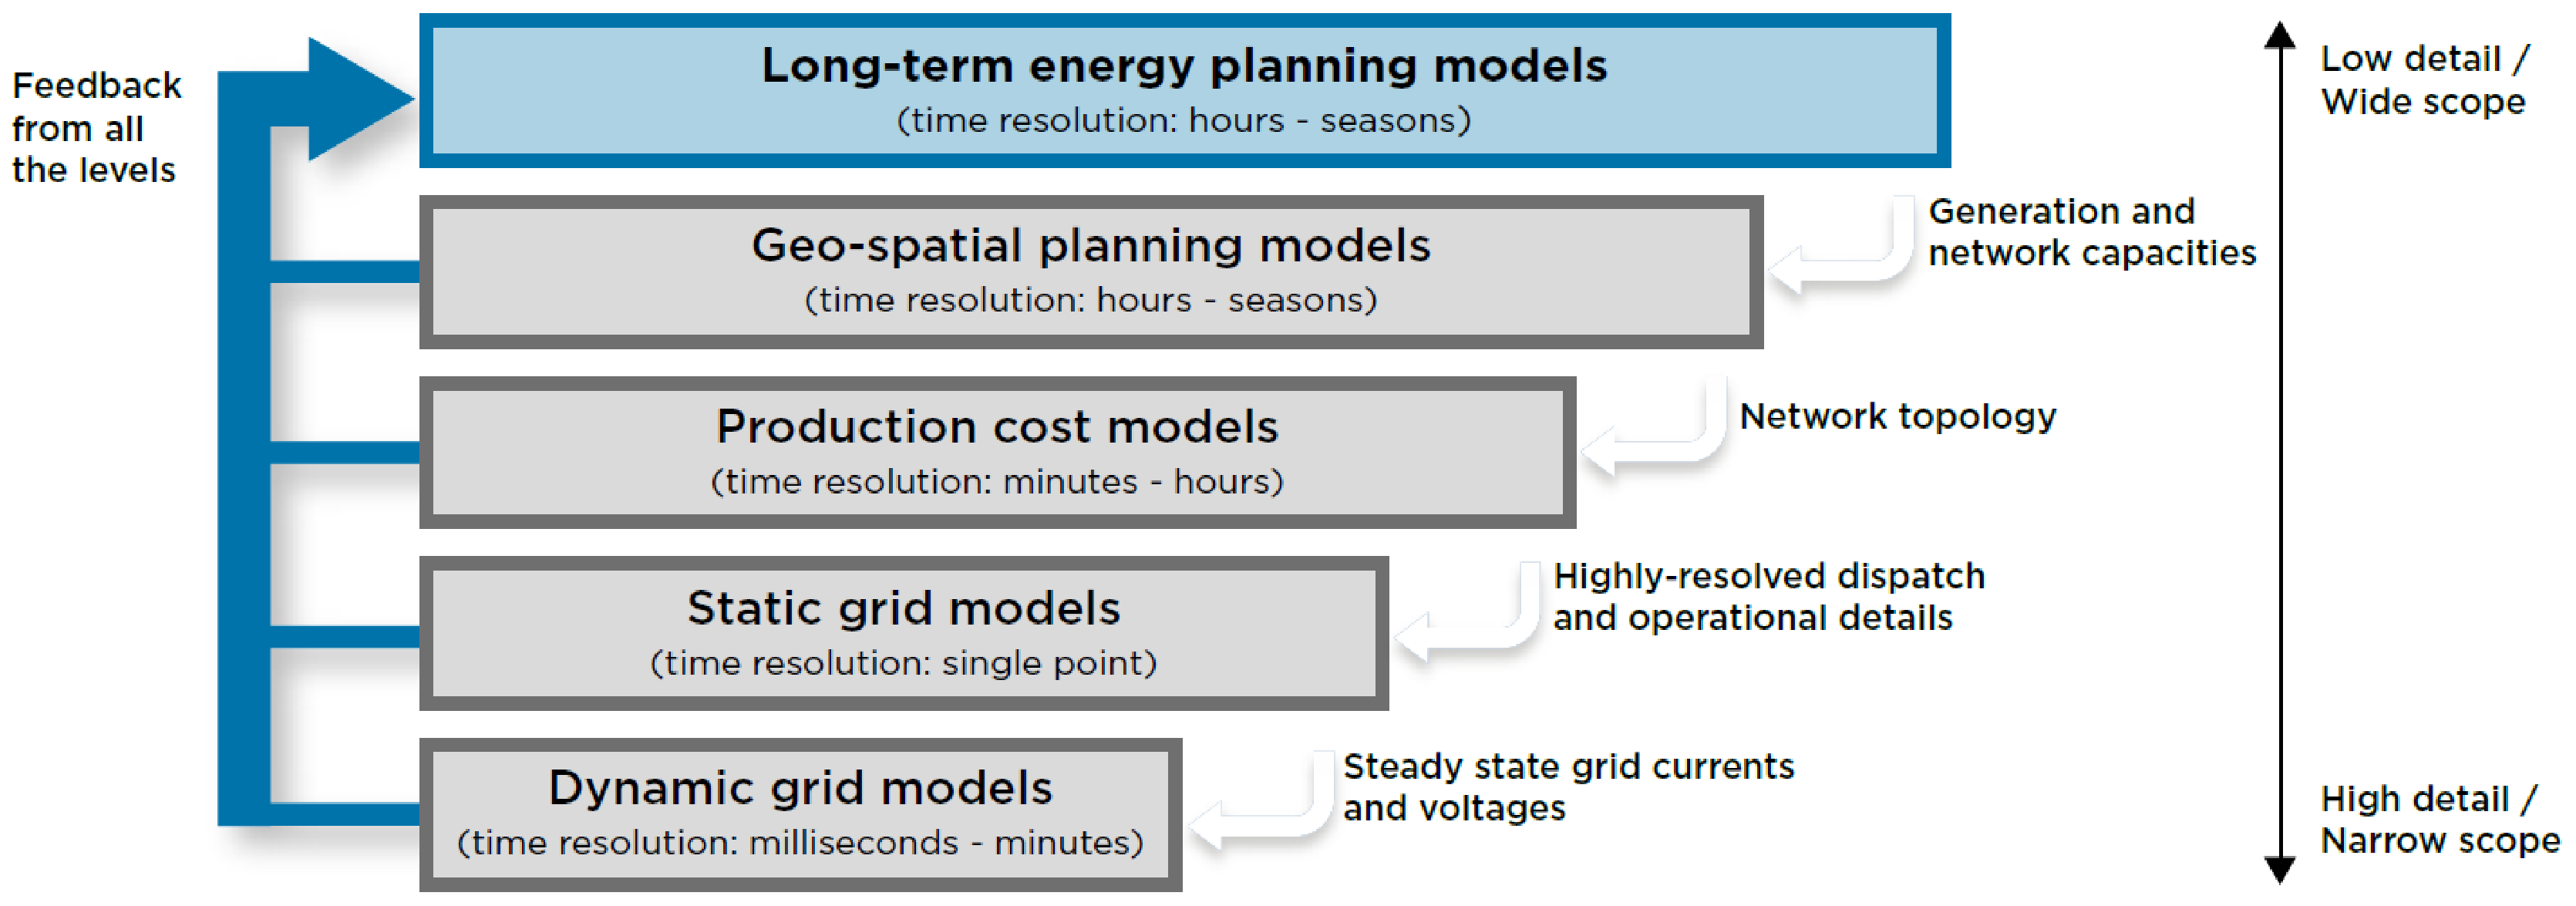
The three categories in Figure 2 (long-term planning, geo-spatial and Production cost) for planning power systems will be used as a reference to establish the different data needed for the different steps in the planning process.
The scope of the study that is being proposed is based on an individual HPP plant techno-economic feasibility analysis level, but connected to the global power system analysis as well. The structure of the paper is as follows: in Section 2 the proposed data for long-term energy planning models are reviewed; in Section 3 the same review will be carried out for the geo-spatial planning models; and the same in Section 4 but for production cost models. For Section 2 and Section 4 a reference tool will be identified in order to facilitate the identification of data.
In Section 5 the availability of sources for the different identified data will be covered. Finally, the conclusions will be presented in Section 6.
The intent of this review is twofold: first, to serve as the foundation for the HPP assessment study to be performed in Spain and, second, to facilitate similar assessment studies in other parts of the world.

2. Data in Long-Term Energy Scenarios (LTES)

Energy optimisation models are some of the most used instruments for modelling the transition to a decarbonized energy system, as they “make it possible to understand the links between thousands of processes and commodities and to obtain results involving them” [13]. A reference tool will be chosen to facilitate the identification of data at this level of analysis. There are plenty of tools for this level, and some thorough reviews can be found: IRENA [12] covers the four levels adopted in this publication, focusing mainly on LTES; in [14] the Joint Research Centre (JRC) shows a mapping of existing tools used at the European level [15].
In our case, The Integrated MARKAL-EFOM System (TIMES) has been selected. The Market Allocation model (MARKAL [16,17,18]) and EFOM [19] are two bottom-up energy models that inspired the structure of TIMES. TIMES has been selected for the following reasons: it is one of the most commonly mentioned in the literature [14]; and the modelling of the energy system for the Integrated National Energy and Climate Plan (INECP) 2021–2030 was completed with the TIMES-SINERGIA tool, which is the TIMES model used by Spain’s government to produce medium- and long-term energy scenarios, in conjunction with other tools, as depicted in the following Figure 3 [15]:
The characteristics of the data and the required analysis define the computational complexity. Because of this limitation, it is common to soft-link different models that address different levels of evaluation. For the elaboration of the INECP in Spain, different models were used to cover aspects such as social, environmental, grid, etc.

2.1. Brief Description of The Integrated MARKAL-EFOM System (TIMES) Model

The TIMES model generator was developed as part of the Energy Technology Systems Analysis Program (ETSAP) from the International Energy Agency (IEA) to create and study all kind of different energetic and environmental scenarios in order to analyse different courses of action at a national, regional or any other type of community level. Each TIMES model is based on a reference energy system (RES): a network depicting all possible flows of commodities, from resource extraction, distribution, transformation and end-use devices, to demand for useful energy services, including imports and exports. The RES consists of:
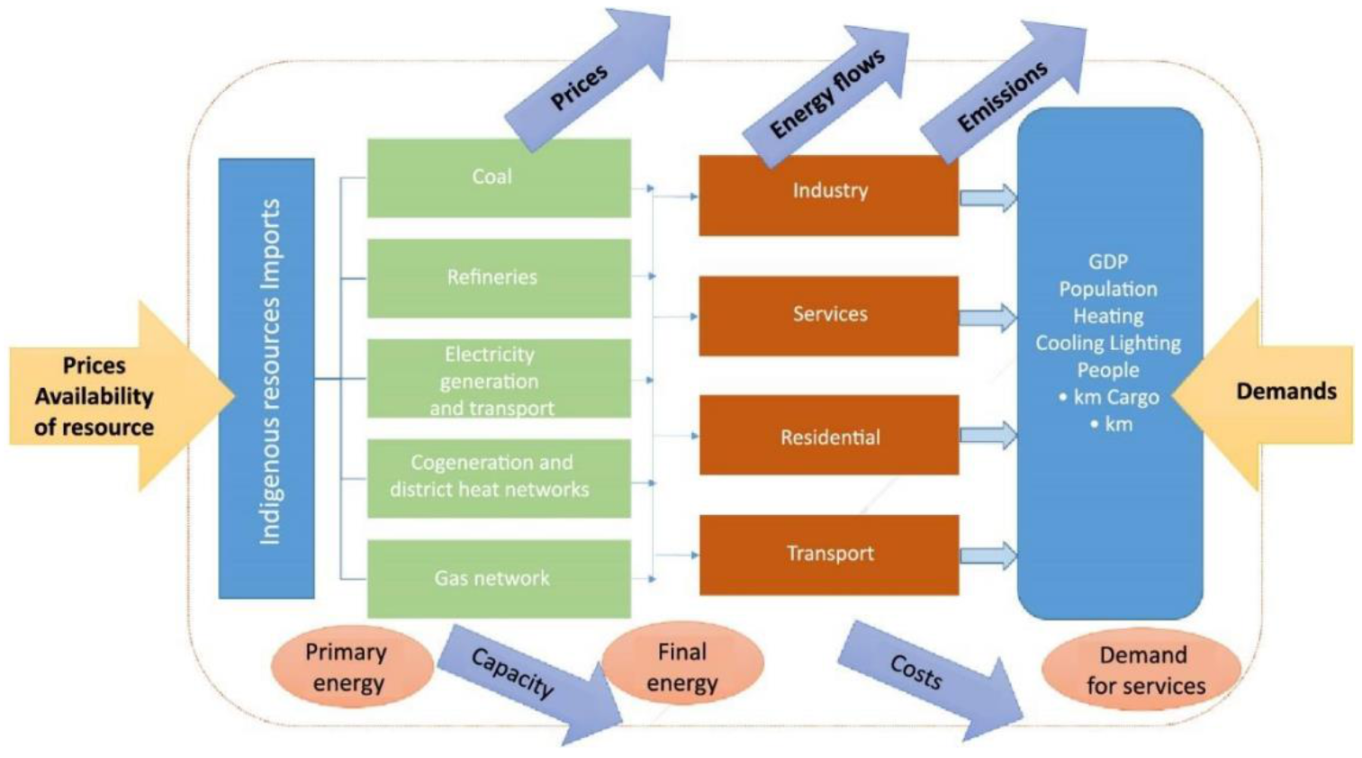
  • Technologies/processes that transform a number of commodities into another. Processes may be primary sources of commodities, intermediate transformation activities or end-use demand devices. Apart from their activity and capacity, they are defined by many technical, economic, and policy parameters as well as bounds.
  • Commodities in the form of energy carriers, materials, or emissions that act as inputs and outputs for the different technologies. They are modelled according to technical, economic, and policy parameters.
  • Commodity flows (inputs and outputs) are the link between technologies and commodities.
RE power plants are usually modelled in national or regional TIMES models by aggregating the overall installed stock for each type as single technologies, each one of them using a single type of input commodity and providing a common electricity commodity. This simplified modelling of renewable energies is mainly due to the availability of data, the search for an optimal solution time without necessarily compromising the solution and the commonly shared characteristics (life, costs, availability factor, etc.) among the defined groups.
To solve this, other approaches have been implemented. The MILP tool from Kris Poncelet is an algorithm that selects representative days’ profiles that manage to minimize the difference between the real load curve and that estimated by the model without the need for disaggregating into a larger number of timeslices (TS) [20], which will be described in Section 2.2.

2.2. Data Structure in TIMES Model

TIMES models are suited to explore possible energy future in the form of scenarios. Each scenario is defined by a set of inputs including energy services demands, resource supply curves, a policy setting and the description of the available energy technologies [21]. Demand scenarios, for example, are used for assigning the final demand of every commodity although the evolution of a set of drivers (gross domestic product (GDP), population, households, etc.) and the elasticity of these demands’ prices. Other scenarios may be policy-related (like subsidies, extra costs, taxes, limitations, etc.), technical ones or even supply curves.
TIMES solves any model by selecting the technologies, investments and trades for an optimised objective function: in this case, the most cost-effective (maximum producer and consumer surplus or minimum loss of it) solution for the chosen time horizon. Perfect foresight (perfect knowledge of the present and future) and competitive market (supply-demand equilibrium for every commodity) are assumed; market “imperfections” are introduced as exogenous user inputs via scenarios.
TIMES allows for any number of regions to be defined and interconnected, which could facilitate a relatively precise spatial analysis of an energy system. However, energy system models (ESM) like TIMES tend to define regions according to political borders, thus limiting the type of analysis that can be achieved with these tools. For this reason, integration of different Geographic Information System (GIS) tools have been used, especially when modelling variable RE systems, so as to estimate the potential of wind and solar energy in different locations. GIS might also be useful to define regions in TIMES with spatial criteria. Despite these advantages, both the high computational requirements and the lack of suitable data in larger energy systems make the task of finding the optional number of regions more difficult [20], compared the computational time for the European Swiss TIMES Electricity Model (EUSTEM) model of the Paul Scherrer Intitute (PSI) for 11 and 22 regions, and found that the latter was double that of the former with no significant differences in the solution.
For temporal resolution, timeslices (TS) are used. A TS is a portion of time, the period of time over which the energy demand and supply must be balanced. Lower numbers of TS result in longer TS and higher numbers of TS would results in shorter TS. Therefore, the selection of the number of TS usually results in a compromise between the optimal resolution for the ESM and the computational power available/appropriate solving times. A low-resolution model may incur some errors in the electricity mix when dealing with a system with a large share of variable renewable energies, typically related to the underestimation of needed balancing and flexible energy resources for reliability purposes, since it tends to flatten the demand curve for reducing costs. This was shown by [21] by comparing solutions from the same models using different TS, demonstrating how their 288-TS model exhibited considerably higher demand peaks than the 8-TS model. In order to optimally address these demands, the model installed costlier dispatchable technologies in the 288-TS versions (like hydro or flexible gas combined cycle, depending on the constraints established) instead of investing in more base-load technologies (like nuclear or base-load gas plants) that could indeed supply the 8-TS model. Increasing the resolution is not always the solution to these issues, however, since it may come to a point where further resolution refinement will not justify the computational cost. [20] also studied the computational time for the PSI’s EUSTEM model disaggregating its TS via averaging to typical days for a different number of TS. An exponential tendency was described for the solving time, to the point where it tripled from 672 to 1344 TS and from 672 to 2016 TS.
Figure 4 shows the data structure of the TIMES-SINERGIA model, where the different inputs (demands, prices, resource, etc.) and outputs (capacity, costs, emissions, energy flows, prices, etc.) are shown [15].
The layer structure is more suitable at a plant level. Therefore, it will be used only for the Geo-Spatial and Production cost assessment strategies. It has no sense at the Long-term assessment level, due to its very wide scope, in particular when complete analyses are performed, including all forms of energy, and even end use sectors in sector coupling strategies.

3. Data in Geo-Spatial Models

3.1. Geographic Information System (GIS) Models

The application of GIS in the field of energy analysis in general, and renewable energies in particular, has a long and productive trajectory. A detailed analysis of the literature in this field is beyond the scope of this article. Since the last century, the application of GIS in the assessment of renewable potential has been constant. To cite two examples, Voivontas [22] or Sorensen [23] are two classic references in this regard. Both authors approach from different points of view the usefulness of using GIS tools for decision-making and improving the knowledge of the energy potential, highlighting its value as a planning tool.
Subsequent studies, such as Domínguez and Amador [24], include a systematization of references in this field grouped into three categories: decisions support systems (DSS) based on GIS; RE and distributed generation of electricity; and decentralized generation for the rural electrification.
Some generation expansion models incorporate a greater amount of spatial detail by linking directly to GIS data, such as the Regional Energy Deployment System (ReEDS) and resource planning models (RPM) from the National Renewable Energy Laboratory (NREL), the Solar and wind energy integrated with transmission and conventional sources (SWITCH) model from the University of California or the Renewable Energy Mix (REMix) model from German Aerospace Centre (DLR) [12]. GIS tools have also been used for wind for large scale techno-economic assessment of wind energy potential (e.g., [25]), and solar resources and power potential mapping (e.g., [26]). A deeper analysis has been undertaken for GIS-based methods for selection of hybrid RE systems [27,28,29,30,31,32,33,34,35,36,37,38,39,40,41,42,43,44,45,46,47,48,49,50,51,52,53,54,55,56,57,58,59,60,61,62], as will be presented in Section 3.2.
Specific examples of actual GIS software often used in the RE context are ArcGIS, Quantum GIS (QGIS), gvSIG, ILWIS and Global Mapper [12], with ArcGIS being the most common, and QGIS being used much more infrequently. This is natural since the former acts as the de facto international standard in this technology. However, the development of open source applications, as is the case of QGIS, also has a promising future because they provide access to these systems for many projects with limited economic resources.

3.2. Data Layers in GIS Models

State-of-the-art tools also are beginning to incorporate GIS elements into system-level optimization models, but a generic method for such integration is not yet commonly available [12]. Therefore, since the GIS-based applications are usually specifically designed for each analysis, no reference model has been adopted for this geo-spatial assessment level. Instead, a search in the scientific literature has been carried out, in order to elaborate the list of the most commonly used data in geo-spatial models.
The presentation of the parameters has been carried out with the help of a table that reflects each most representative variable with its range of values, from the most to the least restrictive. The parameters have been reordered, adapting them to the MG layer structure (see Section 1): climate conditions (resources, temperature), business (costs and factors affecting costs) and Infrastructure (restrictions derived from site conditions).
For the variables categorized as climate conditions, both wind speed and solar radiation have been selected. For most of the authors, both variables are usually the most important when carrying out their analyses and knowing where to locate the farms, whether hybrid, wind, or solar. Sometimes other parameters are used to substitute for both variables, for example, diffuse radiation or wind and solar potentials. In addition, the height at which wind speed measurements are taken is important. The variables selected to reflect the studies have been expressed with their units of measurement.
The parameters that have been grouped as business reflect three important aspects in three variables. These aspects are the lifetime that the installed plant can work under optimal conditions, the space represented by the renewable structures already existing in the territory that is going to be analysis and the minimum area required for an installation, and lastly the costs, which approximate the cost of installing a typical plant. [29,30,33,34,38,51,52,53,54,55,56].
The Infrastructure layer is the one that includes most of the basic variables extracted from the literature, which is logical for GIS-based applications, where spatial constraints become particularly important. In this category, we have extracted those variables that are usually applied to this type of study, leaving aside those that are very specific, such as the case of aerosols found in the atmosphere [57].
The most characteristic variables in the Infrastructure layer are: digital elevation models (DEM), slopes (usually derived from these DEMs), land cover and land use, and distance to human settlements. To these have been added visibility, water bodies, airports, bird migration path, roughness, faults, roads, and electric grids [28,32,33,34,35,36,37,38,39,40,41,42,43,44,47,55,56,57,58,59,60,61,62].
The values for each parameter have been grouped together in ranges of values, showing the ranges for the values commonly appearing in the literature review, in order to gain a general idea. Bird migration paths have a value of “[X]” because the wind farms are an issue for them. For land cover and land use, priority should be given to areas where vegetation is sparse or where no productive activities are carried out. A summary of these parameters and their value ranges is shown in Table 1.
Calculation of costs for the wind and solar PV technologies is site-dependent. Therefore, for a Geo-spatial assessment the costs of these technologies should be detailed. In [25], the cost for wind generation is defined as a function of the distance to the grid, the type of terrain, etc. The available area for the installation establishes some upper power limits for the size of both wind and solar PV generation. In [25], the maximum number of wind turbines as a function of the available area is estimated.

4. Data in Production Cost Models

There are methodologies for the design of individual hybrid wind–PV systems and hybrid wind-PV MGs, which may be used as a basis for the design of HPPs, but design criteria and business plans may differ slightly. These methodologies usually involve at least two different stages in the design: the power system analysis (it would correspond to the aforementioned grid analysis level) and the techno-economic analysis (which would correspond to the Production cost level), such as shown in Figure 5.
Figure 5 shows how each stage uses different input data and produces different results, both of them being interconnected. The power system analysis is performed to determine the technical design and operating constraints to satisfy power system performance regulations; the identified constraints and other input data are applied in the techno-economic analysis to find the optimal MG configuration.
As mentioned before, even though both stages are necessary for an overall design process, the power system analysis requires more detailed information and requires higher computational complexity. Therefore, for an overall potential assessment, only the techno-economic analysis stage will be considered, and would correspond to the Production cost or Dispatch stage.
From the long list of sizing tools for RE power systems [64], the Hybrid Optimization Model for Electric Renewables (HOMER) has been selected as a reference in this work, as it is considered to be an international reference for the integration of RE in power systems [65]. HOMER follows the same evolution as wind–PV hybrid systems, as presented in Section 1: the HOMER software was developed at NREL as a model for the optimization of hybrid systems; and then continued at HOMER Energy as the Hybrid Optimization of Multiple Energy Resources for the optimization of MGs; now, owned wholly by Underwriters Laboratories (UL), a new service is been launched, HOMER Front, for utility-scale renewable hybrid power systems to evaluate their potential profitability, which is exactly the aim of this level of analysis.

4.1. Brief Hybrid Optimization Model for Electric Renewables (HOMER) Model Description

As depicted in Figure 5, HOMER establishes the feasible configurations, and classifies them according to the Net Present Cost, as a function of the inputs, which can be divided into three groups: demand and resources (demand profile, solar and wind resources, fuel, etc.), costs of technologies (capital, replacement, operation and maintenance (O&M), etc.) and project finance (inflation and discount rates, project lifetime, etc.). For each of the feasible configurations, the whole performance and economic models can be accessed as well.
Even though the HOMER tool does not appear in [12] at the Production cost level’s tools review, where other tools like IRENA’s Flextool or PLEXOS-Short Term (ST) appear, it is shown as an example in some case studies for this level in [66]. HOMER software has become an international reference for MG simulation, with hundreds of thousands of systems designed with the help of this software. However, its use in power systems has been generally restricted to small islands such as the Maldives, Kiribati, or Samoa [66], even though there are documented references of its use in larger islands like Hawaii [67], or even larger power systems, like Spain’s [68], but always working on a single-system concept.

4.2. Data Layers for the Production Cost Level

Figure 5 also shows the inputs and outputs that this level uses: Information on demand and resources, costs of technologies and project finance as main inputs; and feasible configurations from the performance and economic models as outputs.
As most MGs techno-economic analyses are for one individual MG, spatial resolution is not usually an issue, as the MG is considered to be in one point. There are, however, tools that consider the spatial distribution of the MG, but more from the layout point of view (influence of distances on cabling, costs, distribution feeders, and so on).
On the other hand, temporal resolution is a must in these tools. HOMER Pro, for example, allows the choice of the temporal resolution, with 1 min being the minimum, and 60 min the most commonly used [69]. Demands, resources (solar radiation, wind speed, temperature, etc.) and grid costs are the inputs that are affected by this time resolution.
In Table 2 the main data used in HOMER model are shown, under the adopted MG data layer structure.
Table 2 clearly shows the importance of the business layer data at this stage of the assessment, the Production cost estimation. No Policy layer data have been identified, although indirectly the parameters defining the business models are influenced by policies. On the other hand, only wind and solar PV parameters have been included, but there are more parameters defining the Storage component, when it is considered in the optimization. The dispatch strategy is indirectly defined under the business model for HPPs, depending on the strategy applied for the management of the energy.

5. Available Sources of Information for the Identified Data

The available data sources will be reviewed following the MG layer structure for the different assessment stages in Section 5.2, Section 5.3 and Section 5.4. However, the data sources for the long-term energy assessment stage will be addressed separately in Section 5.1, due to its different approach and scope.

5.1. Sources for Long-Term Energy Models: TIMES Case

Energy services demands are computed using the projection of macroeconomic drivers such as populations, GDP, number of households, etc. General equilibrium models such as GEM-E3 [70] are often used to obtain coherent GDP growth rates and official national or regional population projections from national or regional statistical services such as those in the statistical office of the EU (Eurostat) [71].
Resource supply curves for renewable technologies in TIMES models are obtained from diverse data sources, from large databases to technical data sheets for different products. For example, JRC-EU-TIMES is linked to ENSPRESO [72], an EU-28 wide database for technical potential for wind, solar and biomass energy for the period 2010–2050, and via a parameterization also with European meteorological-derived high-resolution renewable energy source generation time series (EMHIRES) [73].
The IDEES database from the JRC [74] is a common source of information for national and regional models, since they include final energy demand values for most types of fuels/energy resources and even classify them per sectorial activity and type of process. Their values usually serve as a reference for designing and calibrating the TIMES models.
Technical characterization of processes is obtained from a large variety of sources, including technical data sheets; it is worth noting that, since most TIMES models represent large, complex systems that need to be simplified in order to be computationally manageable and able to adapt to the energy consumption’s data resolution, processes are usually a representation of entire groups of technologies, whose characteristics may slightly differ. Definition of processes and their technical characteristics is, therefore, a delicate task.
Social aspects of the energy transition are difficult to integrate in optimization models such as TIMES models. However, they are increasingly important as the systems become more decentralized and social acceptance issues, prosumer behaviors and energy poverty concerns become fundamental aspects of the sustainable energy transition. Some attempts to link socioeconomic storylines and energy modeling exercises have been proposed in the literature [75].
Finally, the policy settings are introduced in TIMES models via scenarios. The detailed technological nature of TIMES allows the simulation of a wide variety of technologically oriented policies (technology options, subsidies to the different technologies), and broader policy targets (such as the implementation of EU Directives, broader international commitments such as the Paris agreement, carbon taxes, or permit trading system). These policies are translated into constraints that are applied to the model at different time horizons.

5.2. Climate Conditions Layer

Solar PV and wind technologies are considered in this paper, so both solar and wind resource characterization, with the temporal and spatial resolution, are necessary.

5.2.1. Existing Atlases

In a wind potential analysis at a regional or national level, measuring campaigns are not always available for each site and other options are used. Depending on the parameter, there are different data sources: for air density (either altitude or temperature and air pressure, on one hand, or direct air density estimation, on the other) (see Table 3 and Section 5.2.2); in order to establish the parameters for the characterization of the variation with height, land cover is commonly used (see Section 5.3), usually in the form of roughness. The main options for characterizing wind speed and direction would be using regional wind maps or reanalysis data. In Table 3 some of the existing wind and solar atlases are listed, along with some of their main features:
In the case of the solar resource, monthly maps have traditionally been developed from ground radiometric stations; these isoline maps allow the regionalization of the solar resource only in those areas with an adequate density of stations. Currently, as in the case of the wind resource, the modeling of the solar potential from satellite images [89,90,91,92,93] together with the reanalysis data is the most common way to analyze regional potentials.

5.2.2. Reanalysis Datasets from Satellite Observations

Numerical weather prediction (NWP) models can substitute the lack of observed data from a particular site. They provide the main meteorological parameters that are needed for a HPP feasibility assessment (such as solar radiation, wind speed, wind direction, air pressure, ambient temperature, etc.), and many more. Three of the most commonly used datasets are briefly presented in Table 4 [94]:
The temporal resolution of 1 hour of these datasets is, in general, sufficient for the potential assessment of HPPs; however, the horizontal grid spacing of 30 km or more is still quite large. The solution for these spatial resolution limitations is the use of some mesoscale and microscale models, in order to provide finer spatial resolutions. WAsP [106] is an example, but the Weather Research and Forecasting (WRF) model [107,108] is the most commonly used mesoscale model in order to produce forecasts or hindcasts, down to a grid spacing of only a few kilometers. This is considered as valid for the HPPs analysis for both wind and solar resource, as a customized version of WRF has been developed for solar forecasting applications (WRF-Solar) [109]. WRF is a free community model in the public domain but there are some commercial tools that offer microscale outputs based on their own models [108]. Examples for this are: UL, in the USA, may scale down to 200 m grid spacing [107]; EMD, in Europe, is able to downscale down 100 m grid spacing if WAsP is also included [110]. Other companies like Vortex [111] offer similar microscale wind data-level services.
For solar data there are also some particular added services, such as:
  • The aforementioned CM SAF: this is a collaborative alliance between a various European meteorological services to use the European Organisation for the Exploitation of Meteorological Satellites (EUMETSAT) satellite data to produce a large number of climatic datasets. These include several different solar radiation datasets (global and direct) with varying time resolution (from hourly to monthly) and for different geographical areas. Using the web user interface [97] it is possible to order data for different time intervals and for a user-defined region. A validation can be found in [112];
  • The Land Surface Analysis Satellite Application Facility (LSA SAF) [113] is another of EUMETSAT’s satellite application facilities that provides spatial solar radiation datasets with high time resolution, in this case using the Meteosat Second Generation satellites which cover Europe and Africa.
  • The Copernicus Atmosphere Monitoring Service (CAMS) [114] combines atmospheric modeling on aerosols, water vapour and ozone with satellite-based observations of clouds. The time series solar radiation service for both all-sky and clear-sky irradiation is jointly provided by DLR, Armines, and Transvalor. The CAMS Radiation Service is the operational follow-on activity of previous Monitoring Atmospheric Composition and Climate (MACC) project activities. These data sources provide (either through a web service similar to PVGIS, Soda or via a website) solar radiation datasets resolved in time to one location at a time.

5.3. Business Layer

The traditional business model of an energy production investment is predicated on the returns from selling the energy in the electricity markets; thus, the value of the asset is based on the price for which the energy is sold. RE investments become more attractive when the externality costs generated by conventional energy sources are taken into account, since renewable generation does not incur environmental and social costs [115].
In order to stimulate the technological progress of RE, bringing down the cost curve, aligning the market price with the true generation costs and filling the gaps that the private sector cannot do, governments have adopted different support mechanisms to make RE competitive in price and hence attractive for financers [115,116].
The most commonly used support mechanisms are tariff-based ones. Tariffs provide an economic incentive for the energy generated using RE sources. Among them, the so-called feed-in tariff (FIT) allows the generator to sell the electricity at a fixed price, in general a subsidized one [117,118]
Recently, in many countries, the FIT mechanisms are phasing out and being replaced by a kind of a hybrid support mechanism. This support is based on certain generation authorization (auctions/tenders or capacity building authorization) at a fixed or pure market price (merchant). The fixed tariff, usually in a bidding process mechanism, allows providing a stable revenue guarantee for the project developers (similar to the FIT mechanism) [119,120].
The Power Purchase Agreement (PPA) —with one customer such as a utility or a local authority— is a contract whereby the customer is obliged to pay a fixed price for the electricity provided, whether or not it is consumed. PPAs are established for the whole lifetime of the project. [120].
On the other hand, quantity-based mechanisms reward RE generation by imposing a quota or a share of RE production on electricity suppliers, (renewable purchase obligation, RPO). The project may also generate and sell RE certificates or carbon emission reduction certificates. This is usually accompanied by a RE market allowing for the trading of RE [117,118].
Tax-based instruments can take the form of production tax credits (PTC) [118] or investment tax credits. They are based on the balance of the initial investment with tax exemptions. In the PTC it takes the form of an amount for every kWh produced over a fixed period.
Ultimately, there are other kinds of value proposition to the business model not based on revenues coming from selling the energy, E.g., helping grid operators maintain a reliable electricity system (ancillary services), off-grid installations, heat conversion, etc. In addition, storage can increase revenues by exploiting temporal electricity price differences in the markets [120].
With respect to the energy prices in the different electricity markets, the main and most accurate sources of information are nominated electricity market operators (NEMO). Spain and Portugal’s NEMO is OMIE, in where relevant data about hourly electricity market prices can be found [121].
Within the EU, Eurostat collects the electricity prices for household consumers from the European countries. Its database contains bi-annual data (from 2007 onwards) [122]. It also includes price data from Iceland, Liechtenstein, Norway, Montenegro, North Macedonia, Albania, Serbia, Turkey, Bosnia and Herzegovina, Kosovo, Moldova, Georgia, and Ukraine, when available.
The IEA Energy prices database provides access to information on energy prices worldwide. Collected since 1999, the existing two databases are [123]:
  • Energy prices and taxes of the Organisation for Economic Co-operation and Development (OECD) countries (134) with data updated quarterly
  • World energy prices, with data updated annually.
Characterization of the business model will include some temporal description; it is not possible to use annual averages for the design of HPPs. For example: in the case of a PPA, even though it is defined by a fixed energy price, it is associated to a demand, which will have a temporal definition (even though it would be a constant one); or in the case of merchant, the energy price will be defined by the market, usually on an hourly basis.

5.4. Infrastructure and Site Conditions Layer

The main contribution of the infrastructure and site conditions data layer for the Geo-spatial assessment stage can be obtained as GIS layers, in the particular case of Spain, from the National Geographic Institute (IGN) [124], as it has the most complete source of data for the whole Spanish territory. The information can be found classified and ordered on their website, and finding a shapefile or raster is straightforward. The layers reflected in Table 5 are in its thematic geographic information section. All of them are in shapefile format except for the digital elevation model, which is in raster format.
For the airports layer, the company Spanish Airports and Air Navigation (AENA) [125] was used as the data source, as they were able to provide more precise information on a shapefile format on the airports and aerodromes throughout the national territory.
Another important contribution of resources is provided by the Ministry for Ecological Transition and the Demographic Challenge (MITECO) of Spain [126], as on 1 December 2020 a report was published in which environmentally sensitive areas for wind and solar photovoltaic energy, respectively, were listed, which would facilitate future analyses. Some of the variables used to create these maps are biosphere reserves, heritage assets or places of geological interest.
For the grid layout map, an EU grid layout map is publicly available on the European Network of Transmission System Operators for Electricity (ENTSO-e) web page [127]. The main available data of grid layout in Spain, the high voltage transmission system (this is the one used in HPPs in this review), is supplied by the Spanish Transmission System Operator (TSO) Red Eléctrica de España (REE). The whole REE layout in 2020 comprises more than 44,000 km of high voltage electricity lines (21,753 km of 440 kV, 19,887 km of 220 kV, 753 of 110/132/150 kV and 2079 km of lines below 110 kV), more than 5500 substation bays, and more than 92,000 MVA of transformer capacity. This information updated to January 2019 is available at the REE website [128]. Since 2020 and according to the EU Directive, all EU grid transmission and distribution companies must make public information about the access capacity to the different transmission network nodes. Then, detailed specifications provided by the National Commission for Markets and Competition (CNMC) were necessary to specify the precise calculation of the access capacities at each node. All these methodologies are detailed in the Circular #1/2021 issued by the CNMC [129]. All the information about the access and connection capacity to the power transmission network is updated monthly on the REE website [128].
In relation to the information about the already existing generating power plants, there is a register of electric power producers called Electra developed by the Spanish Ministry for the Ecologic Transition [130]. By technologies, the wind farms map is available in the Spanish Wind Energy Association (AEE) web site [131]. Open Power System Data (OPSD) develops a platform for free and open data for electricity system modeling, by Europa-Universität Flensburg, DIW Berlin, Technical University of Berlin, and Neon Neue Energieökonomi, including: a list of conventional power plants in European countries and a list of RE power stations [132].
Table 5 summarizes the main parameters for the infrastructure layer, their format and the data sources for the assessment of HPPs in the Spanish case study.

6. Conclusions

The data and the existing data sources necessary for the potential assessment of HPP at a national level have been reviewed. The HPPs have been considered as a special type of MG. The MG approach facilitates the information structure adopting a layer structure for data categorization. The MG approach has also been adopted for the selection of the reference tool at the Production cost analysis level.
As this review is intimately related to the type of assessment to be undertaken, three different levels of analysis have been considered: long-term, geo-spatial and Production cost strategies. The Long-term level will provide an overall scope of the energy system in which the HPPs are connected; the geo-spatial level will provide information on the physical installation capacity and will allow the mapping of the results; and the production cost analysis will inform research mainly on the techno-economic feasibility of each installation.
In the proposed study, this Production cost level is necessary as the techno-economic feasibility of each HPP must be calculated at a plant level for a particular business model, in order to attract private investment.
The geo-Spatial level will bring the production cost level and the site-dependent data, and the long-Term level will provide both of them with the contextual conditions which will influence the feasibility of the different business models. On the other hand, the Production cost level will inform the geo-spatial level about the techno-economic feasibility of a HPP at a particular site, according to some predefined indicators and according to some particular conditions. And the geo-spatial level will also give the long-term level the necessary information to compute the influence of the feasible HPPs on the overall system. Therefore, the adoption of both layers structures for data and assessment analyses show the feedback between them, the top-down and bottom-up approaches relationships, and the necessity of these studies to facilitate the HPPs planning. This is confirmed by the comparison of Table 2 and Table 3: the geo-spatial level is mainly involved with the Infrastructure level whereas the Production cost assessment level is related mainly with the business layer.
Different data define different analyses: depending on the available data, the analysis varies. For example, the Spanish Government has prepared a map for zone planning from different points of view for wind and solar installations, which provides useful input for a HPP assessment at the geo-spatial level [126]. Should this source not be available, this aspect would need a different analysis. The results of the review show how the available sources existing today open the door to levels of analysis, mainly at the geo-spatial assessment, which were unimaginable a few years ago. Datasets from reanalyses and satellite observations are the basis for this assessment at different layers.
However, computational needs for all assessment levels together may be quite demanding when performed at a national level, and splitting the assessment levels in different models may be convenient.

Author Contributions

Conceptualization, L.A. and Y.L.; methodology, L.A. and J.D.; LTES, Y.L. and A.P.; Geo-spatial, J.D. and M.F.; Production costs, L.A.; Sources: LTES, Y.L. and A.P.; Climate, J.N. and L.F.Z.; business, C.G.B.; infrastructure, J.D., M.F. and I.C.; writing—original draft preparation, All; writing—review and editing, All; supervision, L.A.; project administration, J.D. and I.C. All authors have read and agreed to the published version of the manuscript.

Funding

This research received no external funding.

Institutional Review Board Statement

Not applicable.

Informed Consent Statement

Not applicable.

Acknowledgments

The authors thank the different data sources listed in Table 3, Table 4 and Table 5 for producing and making them available. They also express their gratitude for the efforts of the reviewers and the editors teams, whose comments and suggestions substantially improved the overall quality of the manuscript.

Conflicts of Interest

The authors declare no conflict of interest.

References

  1. WindEurope. Renewable Energy Hybrid Plants–Exploring the Benefits and Market Opportunities. 2019. Available online: https://windeurope.org/wp-content/uploads/files/policy/position-papers/WindEurope-renewable-hybrid-power-plants-benefits-and-market-opportunities.pdf (accessed on 5 November 2021).
  2. WindEurope. Database for Wind + Storage Co-located Projects. Available online: https://windeurope.org/about-wind/database-for-wind-and-storage-colocated-projects/ (accessed on 5 November 2021).
  3. Murphy, C.A.; Schleifer, A.; Eurek, K. A taxonomy of systems that combine utility-scale renewable energy and energy storage technologies. Renew. Sustain. Energy Rev. 2021, 139, 110711. [Google Scholar] [CrossRef]
  4. Dykes, K.; King, J.; DiOrio, N.; King, R.; Gevorgian, V.; Corbus, D.; Blair, N.; Anderson, K.; Stark, G.; Turchi, C.; et al. Opportunities for Research and Development of Hybrid Power Plants; National Renewable Energy Laboratory: Golden, CO, USA, 2020. Available online: https://www.nrel.gov/docs/fy20osti/75026.pdf (accessed on 5 November 2021).
  5. Mazzeo, D.; Matera, N.; De Luca, P.; Baglivo, C.; Congedo, P.M.; Oliveti, G. A literature review and statistical analysis of photovoltaic-wind hybrid renewable system research by considering the most relevant 550 articles: An upgradable matrix literature database. J. Clean. Prod. 2021, 126070. [Google Scholar] [CrossRef]
  6. Lian, J.; Zhang, Y.; Ma, C.; Yang, Y.; Chaima, E. A review on recent sizing methodologies of hybrid renewable energy systems. Energy Convers. Manag. 2019, 199, 112027. [Google Scholar] [CrossRef]
  7. Carpintero-Rentería, M.; Santos-Martín, D.; Guerrero, J.M. Microgrids Literature Review through a Layers Structure. Energies 2019, 12, 4381. [Google Scholar] [CrossRef] [Green Version]
  8. Carpintero-Rentería, M.; Santos-Martín, D.; Chinchilla, M.; Rebollal, D. Microgrid Infrastructure Compendium Analysis with a Model Creation Tool and Guideline Based on Machine Learning Techniques. Energies 2019, 12, 4509. [Google Scholar] [CrossRef] [Green Version]
  9. ETIP-SNET. Smart Sector Integration, towards an EU System of Systems Building Blocks, Enablers, Architectures, Regulatory Barriers, Economic Assessment. April 2021. Available online: https://www.etip-snet.eu/wp-content/uploads/2021/03/ETIP-SNET-PP-Sector-Coupling-towards-an-EU-System-of-Systems-.pdf (accessed on 5 November 2021).
  10. Martin-Martínez, F.; Sánchez-Miralles, A.; Rivier, M. A literature review of Microgrids: A functional layer based classification. Renew. Sustain. Energy Rev. 2016, 62, 1133–1153. [Google Scholar] [CrossRef]
  11. CEN-CENELEC-ETSI. Smart Grid Coordination Group–Sustainable Processes. SG-CG/M490/E–Part E: Smart Grid use Case Management Process; CEN-CENELEC-ETSI; Commission of the European Communities: Brussels, Belgium, 2012. [Google Scholar]
  12. IRENA. Planning for the Renewable Future: Long-Term Modelling and Tools to Expand Variable Renewable Power in Emerging Economies; International Renewable Energy Agency: Abu Dhabi, United Arab Emirates, 2017; Available online: https://www.irena.org/-/media/Files/IRENA/Agency/Publication/2017/IRENA_Planning_for_the_Renewable_Future_2017.pdf (accessed on 5 November 2021).
  13. Connoly, D.; Lund, H.; Mathiesen, B.; Leahy, M. A review of computer tools for analysing the integration of renewable energy into various energy systems. Appl. Energy 2010, 87, 1059–1082. [Google Scholar] [CrossRef]
  14. Fernandez Blanco Carramolino, R.; Careri, F.; Kavvadias, K.; Hidalgo Gonzalez, I.; Zucker, A.; Peteves, E. Systematic Mapping of Power System Models: Expert Survey, EUR 28875 EN; Publications Office of the European Union: Luxembourg, 2017; ISBN 978-92-79-76462-2. Available online: https://publications.jrc.ec.europa.eu/repository/bitstream/JRC109123/jrc109123_109123_systematic_mapping_of_power_system_models_v17.pdf (accessed on 5 November 2021). [CrossRef]
  15. Spanish Ministry for Ecological Transition and Demographic Challenge (MITECO): Integrated National Energy and Climate Plan 2021–2030 (INECP 2021–2030). Available online: https://ec.europa.eu/energy/sites/default/files/documents/es_final_necp_main_en.pdf (accessed on 5 November 2021).
  16. Fishbone, L.G.; Giesen, G.; Hymmen, H.A.; Stocks, M.; Vos, H.; Wilde, D.; Zoelcher, R.; Balzer, C.; Abilock, H. Users Guide for MARKAL: A Multi-Period, Linear Programming Model for Energy Systems Analysis; BNL; KFA: Upton, NY, USA; Julich, Germany, 1983. [Google Scholar]
  17. Fishbone, L.G.; Abilock, H. Markal, A Linear Programming Model for Energy Systems Analysis: Technical Description of the BNL Version. Int. J. Energy Res. 1981, 5, 353–375. [Google Scholar] [CrossRef]
  18. Berger, C.; Dubois, R.; Haurie, A.; Lessard, E.; Loulou, R.; Waaub, J.-P. Canadian MARKAL: An Advanced Linear Programming System for Energy and Environment Modelling. INFOR 1992, 20, 114–125. [Google Scholar] [CrossRef]
  19. Voort, E.; van der Donni, E.; Thonet, C.; Bois d’Enghien, E.; Dechamps, C.; Guilmot, J.F. Energy Supply Modelling Package EFOM-12C Mark I, Mathematical Description; Commission of the European Communities, EUR-8896: Louvain-la-Neuve, Belgium, 1984. [Google Scholar]
  20. Panos, E. Acceleration Strategies for Speeding up the Solution Time of the TIMES Energy Systems Model Generator; Paul Scherrer Institute: Dublin, Ireland, 2019. [Google Scholar]
  21. Loulou, R.; Wright, E.; Giannakidis, G.; Noble, K. Energy Technology Systems Analysis Programme. 2016; Available online: https://iea-etsap.org/annex5/main.html (accessed on 31 October 2021).
  22. Voivontas, D.; Assimacopoulos, D.; Mourelatos, A.; Corominas, J. Evaluation of Renewable Energy potential using a GIS decision support system. Renew. Energy 1998, 13, 333–344. [Google Scholar] [CrossRef]
  23. Sorensen, B.; Meibom, P. GIS tools for renewable energy modelling. Energy Effic. Policy Environ. 1999, 16, 1262–1267. [Google Scholar] [CrossRef]
  24. Domínguez Bravo, J.; Amador, J. Geographical information systems applied in the field of renewable energy sources. Comput. Ind. Eng. Clust. Plan. Manag. Energy Infrastruct. Eng. Proj. 2007, 52, 322–326. [Google Scholar] [CrossRef]
  25. Grassi, S.; Chokani, N.; Abhari, R.S. Large scale technical and economical assessment of wind energy potential with a GIS tool: Case study Iowa. Energy Policy 2012, 45, 73–85. [Google Scholar] [CrossRef]
  26. Polo, J.; Bernardos, A.; Navarro, A.A.; Fernandez-Peruchena, C.M.; Ramírez, L.; Guisado, M.V.; Martínez, S. Solar resources and power potential mapping in Vietnam using satellite-derived and GIS-based information. Energy Convers. Manag. 2015, 98, 348–358. [Google Scholar] [CrossRef]
  27. Schneider, D.R.; Duic, N.; Bogdan, Z. Mapping the Potential for Decentralized Energy Generation Based on Renewable Energy Sources in the Republic of Croatia. Energy 2007, 32, 1731–1744. [Google Scholar] [CrossRef]
  28. Grassi, S. Integrated Spatial Optimization Model for Renewable Energy Planning. In AGILE PhD School; Citeseer: Princeton, NJ, USA, 2013. [Google Scholar]
  29. Bekele, G.; Palm, B. Feasibility Study for a Standalone Solar-Wind-Based Hybrid Energy System for Application in Ethiopia. Appl. Energy 2010, 87, 487–495. [Google Scholar] [CrossRef]
  30. Nguyen, K.Q. Alternatives to Grid Extension for Rural Electrification: Decentralized Renewable Energy Technologies in Vietnam. Energy Policy 2007, 35, 2579–2589. [Google Scholar] [CrossRef]
  31. Bahramara, S.; Moghaddam, M.P.; Haghifam, M.R. Optimal Planning of Hybrid Renewable Energy Systems Using HOMER: A Review. Renew. Sustain. Energy Rev. 2016, 62, 609–620. [Google Scholar] [CrossRef]
  32. Saraswat, S.; Digalwar, A.; Yadav, S.S.; Kumar, G. MCDM and GIS Based Modelling Technique for Assessment of Solar and Wind Farm Locations in India. Renew. Energy 2021, 169, 865–884. [Google Scholar] [CrossRef]
  33. Zappa, W.; van den Broek, M. Analysing the Potential of Integrating Wind and Solar Power in Europe Using Spatial Optimisation under Various Scenarios. Renew. Sustain. Energy Rev. 2018, 94, 1192–1216. [Google Scholar] [CrossRef]
  34. Anwarzai, M.A.; Nagasaka, K. Utility-Scale Implementable Potential of Wind and Solar Energies for Afghanistan Using GIS Multi-Criteria Decision Analysis. Renew. Sustain. Energy Rev. 2017, 71, 150–160. [Google Scholar] [CrossRef]
  35. Ifaei, P.; Karbassi, A.; Jacome, G.; Yoo, C. A Systematic Approach of Bottom-up Assessment Methodology for an Optimal Design of Hybrid Solar/Wind Energy Resources—Case Study at Middle East Region. Energy Convers. Manag. 2017, 145, 138–157. [Google Scholar] [CrossRef]
  36. Ruiz-Arias, J.A.; Terrados, J.; Perez-Higueras, P.; Pozo-Vazquez, D.; Almonacid, G. Assessment of the Renewable Energies Potential for Intensive Electricity Production in the Province of Jaen, Southern Spain. Renew. Sustain. Energy Rev. 2012, 16, 2994–3001. [Google Scholar] [CrossRef]
  37. Rumbayan, M.; Abudureyimu, A.; Nagasaka, K. Mapping of Solar Energy Potential in Indonesia Using Artificial Neural Network and Geographical Information System. Renew. Sustain. Energy Rev. 2012, 16, 1437–1449. [Google Scholar] [CrossRef]
  38. Yue, C.-D.; Wang, S.-S. GIS-Based Evaluation of Multifarious Local Renewable Energy Sources: A Case Study of the Chigu Area of Southwestern Taiwan. Energy Policy 2006, 34, 730–742. [Google Scholar] [CrossRef]
  39. Angelis-Dimakis, A.; Biberacher, M.; Dominguez, J.; Fiorese, G.; Gadocha, S.; Gnansounou, E.; Guariso, G.; Kartalidis, A.; Panichelli, L.; Pinedo, I.; et al. Methods and Tools to Evaluate the Availability of Renewable Energy Sources. Renew. Sustain. Energy Rev. 2011, 15, 1182–1200. [Google Scholar] [CrossRef]
  40. Mondal, M.A.H.; Denich, M. Assessment of Renewable Energy Resources Potential for Electricity Generation in Bangladesh. Renew. Sustain. Energy Rev. 2010, 14, 2401–2413. [Google Scholar] [CrossRef]
  41. Fritz, S.; Bravo, J.D. Aplicación de los SIG al Estudio Integral de las Energías Renovables en la Comarca de la Sierra de Alcaraz y el Campo de Montiel (Albacete); Instituto Agronómico del Mediterráneo Zaragoza-Universitat de Lleida: Zaragoza, Spain, 2012; Volume MSc. [Google Scholar]
  42. Janke, J.R. Multicriteria GIS Modeling of Wind and Solar Farms in Colorado. Renew. Energy 2010, 35, 2228–2234. [Google Scholar] [CrossRef]
  43. Latinopoulos, D.; Kechagia, K. A GIS-Based Multi-Criteria Evaluation for Wind Farm Site Selection. A Regional Scale Application in Greece. Renew. Energy 2015, 78, 550–560. [Google Scholar] [CrossRef]
  44. Mathieu, P.-P. Space for Renewable Energy. In Proceedings of the Solar Resource from the Local Level to Global Scale in Support of the Resource Management of Renewable Electricity Generation; EC Joint Research Centre: Ispra, Italia; 2004. [Google Scholar]
  45. Jebaraj, S.; Iniyan, S. A Review of Energy Models. Renew. Sustain. Energy Rev. 2006, 10, 281–311. [Google Scholar] [CrossRef]
  46. Del Rio, P.; Unruh, G. Overcoming the Lock-out of Renewable Energy Technologies in Spain: The Cases of Wind and Solar Electricity. Renew. Sustain. Energy Rev. 2007, 11, 1498–1513. [Google Scholar] [CrossRef]
  47. Belmonte, S.; Núñez, V.; Viramonte, J.G.; Franco, J. Potential Renewable Energy Resources of the Lerma Valley, Salta, Argentina for Its Strategic Territorial Planning. Renew. Sustain. Energy Rev. 2009, 13, 1475–1484. [Google Scholar] [CrossRef]
  48. Lewis, G.M. High Value Wind: A Method to Explore the Relationship between Wind Speed and Electricity Locational Marginal Price. Renew. Energy 2008, 33, 1843–1853. [Google Scholar] [CrossRef]
  49. Martins, F.R.; Pereira, E.B.; Abreu, S.L. Satellite-Derived Solar Resource Maps for Brazil under SWERA Project. Sol. Energy 2007, 81, 517–528. [Google Scholar] [CrossRef]
  50. Ramachandra, T.V.; Shruthi, B.V. Spatial Mapping of Renewable Energy Potential. Renew. Sustain. Energy Rev. 2007, 11, 1460–1480. [Google Scholar] [CrossRef]
  51. Arnette, A.; Zobel, C.W. An Optimization Model for Regional Renewable Energy Development. Renew. Sustain. Energy Rev. 2012, 16, 4606–4615. [Google Scholar] [CrossRef]
  52. Arnette, A.N. Integrating Rooftop Solar into a Multi-Source Energy Planning Optimization Model. Appl. Energy 2013, 111, 456–467. [Google Scholar] [CrossRef]
  53. Quijano, H.R.; Botero, B.S.; Domínguez, B.J. MODERGIS Application: Integrated Simulation Platform to Promote and Develop Renewable Sustainable Energy Plans, Colombian Case Study. Renew. Sustain. Energy Rev. 2012, 16, 5176–5187. [Google Scholar] [CrossRef]
  54. San Cristóbal, J.R. Multi-Criteria Decision-Making in the Selection of a Renewable Energy Project in Spain: The Vikor Method. Renew. Energy 2011, 36, 498–502. [Google Scholar] [CrossRef]
  55. Rodrigues, M.; Montañés, C.; Fueyo, N. A Method for the Assessment of the Visual Impact Caused by the Large-Scale Deployment of Renewable-Energy Facilities. Environ. Impact Assess. Rev. 2010, 30, 240–246. [Google Scholar] [CrossRef]
  56. Díaz-Cuevas, P.; Domínguez-Bravo, J.; Prieto-Campos, A. Integrating MCDM and GIS for Renewable Energy Spatial Models: Assessing the Individual and Combined Potential for Wind, Solar and Biomass Energy in Southern Spain. Clean Technol. Environ. Policy 2019, 21, 1855–1869. [Google Scholar] [CrossRef]
  57. Charabi, Y.; Gastli, A. Spatio-Temporal Assessment of Dust Risk Maps for Solar Energy Systems Using Proxy Data. Renew. Energy 2012, 44, 23–31. [Google Scholar] [CrossRef]
  58. Vandenbergh, M.; Neirac, F.P.; Turki, H. A GIS Approach for the Siting of Solar Thermal Power Plants Application to Tunisia. J. Phys. IV 1999, 9, 223–228. [Google Scholar] [CrossRef]
  59. Abebe, B. GIS Renewable Resources Assessment and Optimization for the Electrification of Autonomous Regions. Ph.D. Thesis, Universidad de Zaragoza, Zaragoza, Spain, 2012. [Google Scholar]
  60. Mourmouris, J.C.; Potolias, C. A Multi-Criteria Methodology for Energy Planning and Developing Renewable Energy Sources at a Regional Level: A Case Study Thassos, Greece. Energy Policy 2013, 52, 522–530. [Google Scholar] [CrossRef]
  61. Guo, J.; Fast, V.; Teri, P.; Calvert, K. Integrating Land-Use and Renewable Energy Planning Decisions: A Technical Mapping Guide for Local Government. ISPRS Int. J. Geo-Inf. 2020, 9, 324. [Google Scholar] [CrossRef]
  62. Aydin, N. GIS-Based Site Selection Approach for Wind and Solar Energy Systems: A Case Study from Western Turkey. Master, Thesis, Middle East Technical University, Ankara, Turkey, 2009. [Google Scholar]
  63. Lee, H.-J.; Vu, B.H.; Zafar, R.; Hwang, S.-W.; Chung, I.-Y. Design Framework of a Stand-Alone Microgrid Considering Power System Performance and Economic Efficiency. Energies 2021, 14, 457. [Google Scholar] [CrossRef]
  64. Booth, S.; Reilly, J.; Butt, R.; Wasco, M.; Monohan, R. Microgrids for Energy Resilience: A Guide to Conceptual Design and Lessons from Defense Projects; National Renewable Energy Laboratory: Golden, CO, USA, 2019. Available online: https://www.nrel.gov/docs/fy19osti/72586.pdf (accessed on 5 November 2021).
  65. Micangeli, A.; Del Citto, R.; Kiva, N.; Santori, G.; Gambino, V.; Kiplagat, J.; Viganò, D.; Fioriti, D.; Poli, D. Energy Production Analysis and Optimization of Mini-Grid in Remote Areas: The Case Study of Habaswein, Kenya. Energies 2017, 10, 2041. [Google Scholar] [CrossRef] [Green Version]
  66. Mi1 Asami Miketa. Introduction and Workshop Overview. Long Term Planning with a High Share of Variable Renewable Energy. 2019. Available online: https://www.irena.org/-/media/Files/IRENA/Agency/Events/2019/March/8---Asami-Miketa---Long-term-Planning-with-high-share-of-VRE_ENG.pdf?la=en&hash=E3B3553C0BF1CEF5ADBD91108FD6E6ED10D75E19 (accessed on 5 November 2021).
  67. Burman, K.; Keller, J.; Kroposki, B.; Lilienthal, P.; Slaughter, R.; Glassmire, J. Renewable Power Options for Electrical Generation on Kaua’i: Economics and Performance Modeling; National Renewable Energy Laboratory: Golden, CO, USA, 2011. Available online: https://www.osti.gov/biblio/1029422 (accessed on 5 November 2021). [CrossRef] [Green Version]
  68. Arribas, L. Review of 100% Renewable Energy-Only Hybrid System; Microgrid Deployment Workshop: Barcelona, Spain, 2014. [Google Scholar]
  69. Chang, M.; Zink Thellufsen, J.Z.; Zakeri, B.; Pickering, B.; Pfenninger, S.; Lund, H.; Østergaard, P.A. Trends in tools and approaches for modelling the energy transition. Appl. Energy 2021, 290, 116731. [Google Scholar] [CrossRef]
  70. Capros, P.; van Regemorter, D.; Paroussos, L.; Karkatsoulis, P.; Fragkiadakis, C.; Tsani, S.; Charalampidis, I.; Revesz, T. GEM-E3 Model Documentation. JRC Tech. Rep. 2013, 26034, 1–154. Available online: https://doi.org/10.2788/47872 (accessed on 5 November 2021).
  71. Eurostat. Database-Population and Demography-Eurostat [WWW Document]. 2021. Available online: https://ec.europa.eu/eurostat/web/population-demography/demography-population-stock-balance/database (accessed on 26 August 2021).
  72. Ruiz Castello, P.; Nijs, W.; Tarvydas, D.; Sgobbi, A.; Zucker, A.; Plli, R.; Camia, A.; Tiel, C.; Hoyer-Klick, C.; Dalla Longa, F.; et al. JRC Publications Repository-ENSPRESO—An open data, EU-28 wide, transparent and coherent database of wind, solar and biomass energy potentials [WWW Document]. 2019. Available online: https://publications.jrc.ec.europa.eu/repository/handle/JRC116900 (accessed on 26 August 2021).
  73. Gonzalez-Aparicio, I. Joint Research Centre Data Catalogue-European Meteorological Derived High Resolution RES Generation Time Series for Present and Future Scenarios-European Commission [WWW Document]. Available online: https://data.jrc.ec.europa.eu/collection/id-0055 (accessed on 8 October 2021).
  74. Mantzos, L.; Matei, N.A.; Rozsai, M.; Tchung-Ming, S.; Wiesenthal, T. JRC-IDEES: Integrated Database of the European Energy Sector: Methodological Note; Publications Office of the European Union: Mercier, Luxembourg, 2017. [Google Scholar]
  75. Fortes, P.; Alvarenga, A.; Seixas, J.; Rodrigues, S. Long-term energy scenarios: Bridging the gap between socio-economic storylines and energy modeling. Technol. Forecast. Soc. Chang. 2015, 91, 161–178. [Google Scholar] [CrossRef]
  76. Global Wind Atlas Homepage. Available online: https://globalwindatlas.info/ (accessed on 29 September 2020).
  77. Hahmann, A.N.; Sīle, T.; Witha, B.; Davis, N.N.; Dörenkämper, M.; Ezber, Y.; García-Bustamante, E.; González Rouco, J.F.; Navarro, J.; Olsen, B.T.; et al. The Making of the New European Wind Atlas—Part 1: Model Sensitivity. Geosci. Model Dev. 2020, 13, 5073–5078. [Google Scholar] [CrossRef]
  78. Dörenkämper, M.; Olsen, T.B.; Witha, B.; Hahmann, A.N.; Davis, N.N.; Barcons, J.; Ezber, Y.; García-Bustamante, E.; González-Rouco, J.F.; Navarro, J.; et al. The Making of the New European Wind Atlas—Part 2: Production and Evaluation. Geosci. Model Dev. 2020, 13, 5079–5102. [Google Scholar] [CrossRef]
  79. New European Wind Atlas Homepage. Available online: https://map.neweuropeanwindatlas.eu/ (accessed on 29 September 2020).
  80. POWER Project Homepage. Available online: https://power.larc.nasa.gov/ (accessed on 29 September 2020).
  81. World Bank Group. Global Solar Atlas 2.0: Validation Report. Energy Sector Management Assistance Program Washington, D.C.: World Bank Group. 2019. Available online: http://documents.worldbank.org/curated/en/507341592893487792/Global-Solar-Atlas-2-0-Validation-Report (accessed on 5 November 2021).
  82. Solargis Homepage. Available online: https://solargis.com/ (accessed on 5 November 2021).
  83. Huld, T.; Müller, R.; Gambardella, A. A new solar radiation database for estimating PV performance in Europe and Africa. Sol. Energy 2012, 86, 1803–1815. [Google Scholar] [CrossRef]
  84. Huld, T.; Müller, R.; Gracia-Amillo, A.; Pfeifroth, U.; Trentmann, J. Surface Solar Radiation Data Set-Heliosat, Meteosat-East (SARAH-E)-Edition 1.1, Satellite Application Facility on Climate Monitoring. Satell. Appl. Facil. Clim. Monit. 2017. Available online: https://climatedataguide.ucar.edu/climate-data/surface-solar-radiation-data-set-heliosat-sarah-edition-1 (accessed on 31 October 2021). [CrossRef]
  85. Wald, L.; Albuisson, M.; Best, C.; Delamare, C.; Dumortier, D.; Gaboardi, E.; Hammer, A.; Heinnemann, D.; Kift, R.; Kunz, S.; et al. SoDa: A project for the integration and exploitation of networked solar radiation databases. In Environmental Communication in the Information Society; International Society for Environmental Protection: Vienna, Austria, 2002; pp. 713–720. [Google Scholar]
  86. Soda Homepage. Available online: http://www.soda-pro.com (accessed on 5 November 2021).
  87. Meteonorm: Global Meteorological Database Version 8. Software and Data for Engineers, Planers and Education. 2020. Available online: https://meteonorm.meteotest.ch/assets/downloads/mn80_theory.pdf (accessed on 5 November 2021).
  88. NSRDB Data Viewer Web Page. Available online: https://maps.nrel.gov/nsrdb-viewer/ (accessed on 5 November 2021).
  89. Sengupta, M.; Xie, Y.; Lopez, A.; Habte, A.; Maclaurin, G.; Shelby, S. The National Solar Radiation Data Base (NSRDB). Renew. Sustain. Energy Rev. 2018, 89, 51–60. [Google Scholar] [CrossRef]
  90. Perez, R.; Ineichen, P.; Moore, K.; Kmiecik, M.; Chain, C.; George, R.; Vignola, F. A new operational model for satellite-derived irradiances: Description and validation. Sol. Energy 2002, 73, 307–317. [Google Scholar] [CrossRef] [Green Version]
  91. Rigollier, C.; Lefèvre, M.; Wald, L. The method Heliosat-2 for deriving shortwave solar radiation from satellite images. Sol. Energy 2004, 77, 159–169. [Google Scholar] [CrossRef] [Green Version]
  92. Polo, J.; Perez, R. Solar Radiation Modeling from Satellite Imagery. In Solar Resources Mapping. Green Energy and Technology; Polo, J., Martín-Pomares, L., Sanfilippo, A., Eds.; Springer: Cham, Switzerland, 2019. [Google Scholar] [CrossRef]
  93. Sengupta, M.; Habte, A.; Wilbert, S.; Gueymard, C.; Remund, J. Best Practices Handbook for the Collection and Use of Solar Resource Data for Solar energy Applications, 3rd ed.; National Renewable Energy Laboratory: Golden, CO, USA, 2021; pp. 1–348. [Google Scholar]
  94. Brower, M.C.; Barton, M.S.; Lledó, L.; Dubois, J. Study of Wind Speed Variability Using Global Reanalysis Data. 2013. Available online: https://aws-dewi.ul.com/assets/A-Study-of-Wind-Speed-Variability-Using-Global-Reanalysis-Data1.pdf (accessed on 3 July 2021).
  95. Suranjana, S.; Moorthi, S.; Pan, H.-L.; Wu, X.; Wang, J.; Nadiga, S.; Tripp, P.; Kistler, R.; Woollen, J.; Behringer, D.; et al. The NCEP Climate Forecast System Reanalysis. Bull. Am. Meteor. Soc. 2010, 91, 1015–1057. [Google Scholar] [CrossRef]
  96. The NCEP Climate Forecast System Version 2 (CFSv2). Available online: https://cfs.ncep.noaa.gov/ (accessed on 5 November 2021).
  97. Gelaro, R.; McCarty, W.; Suárez, M.J.; Todling, R.; Molod, A.; Takacs, L.; Randles, C.A.; Darmenov, A.; Bosilovich, M.G.; Reichle, R.; et al. The Modern-Era Retrospective Analysis for Research and Applications, Version 2 (MERRA-2). J. Clim. 2017, 30, 5419–5454. [Google Scholar] [CrossRef]
  98. ECMWF—Climate Reanalysis Web Page. Available online: https://www.ecmwf.int/en/research/climate-reanalysis (accessed on 25 September 2021).
  99. Hersbach, H.; Bell, B.; Berrisford, P.; Hirahara, S.; Horányi, A.; Muñoz-Sabater, J.; Nicolas, J.; Peubey, C.; Radu, R.; Schepers, D.; et al. The ERA5 global reanalysis. Q. J. R. Meteorol. Soc. 2020, 146, 1999–2049. [Google Scholar] [CrossRef]
  100. CM SAF SARAH. Available online: https://www.eumetsat.int/cm-saf (accessed on 5 November 2021).
  101. Renewables Ninja Web Tool. Available online: www.renewables.ninja (accessed on 3 July 2021).
  102. Gualtieri, G. Reliability of ERA5 Reanalysis Data for Wind Resource Assessment: A Comparison against Tall Towers. Energies 2021, 14, 4169. [Google Scholar] [CrossRef]
  103. PVGIS Web Page. Available online: https://ec.europa.eu/jrc/en/pvgis (accessed on 5 November 2021).
  104. Meteonorm Web Page. Available online: https://meteonorm.com (accessed on 5 November 2021).
  105. Boilley, A.; Wald, L. Comparison between meteorological re-analyses from ERA-Interim and MERRA and measurements of daily solar irradiation at surface. Renew. Energy 2015, 75, 135–143. [Google Scholar] [CrossRef]
  106. WAsP Homepage. Available online: https://www.wasp.dk/ (accessed on 29 September 2020).
  107. Weather Research and Forecasting Model. WRF Homepage. Available online: https://www.mmm.ucar.edu/weather-research-and-forecasting-model (accessed on 3 July 2021).
  108. Powers, J.G.; Klemp, J.B.; Skamarock, W.C.; Davis, C.A.; Dudhia, J.; Gill, D.O.; Coen, J.L.; Gochis, D.J.; Ahmadov, R.; Peckham, S.E.; et al. The Weather Research and Forecasting Model: Overview, System Efforts, and Future Directions. Bull. Am. Meteorol. Soc. 2017, 98, 1717–1737. [Google Scholar] [CrossRef]
  109. Jimenez, P.; Hacker, J.P.; Dudhia, J.; Haupt, S.E.; Ruiz-Arias, J.A.; Gueymard, C.; Thompson, G.; Eidhammer, T.; Deng, A. WRF-Solar: An augmented NWP model for solar power predic- tion. Model description and clear sky assessment. Bull. Am. Meteor. Soc. 2016, 97, 1249–1264. [Google Scholar] [CrossRef]
  110. EMD International. EMD-WRF Global On-demand Mesoscale Services ERA5, ERA-Interim, MERRA2 and CFSR. Technical note. 2017. Available online: http://help.emd.dk/knowledgebase/content/TechNotes/TechNote_6_EMD-WRF_On-Demand.pdf (accessed on 3 July 2021).
  111. Vortex Homepage. Available online: https://vortexfdc.com/ (accessed on 5 November 2021).
  112. Pfenninger, S.; Staffell, I. Long-term patterns of European PV output using 30 years of validated hourly reanalysis and satellite data. Energy 2016, 114, 1251–1265. [Google Scholar] [CrossRef] [Green Version]
  113. Eumetsat Home Page. Available online: https://www.eumetsat.int/lsa-saf (accessed on 5 November 2021).
  114. CAMS. Available online: http://www.soda-pro.com/web-services/radiation/cams-radiation-service (accessed on 5 November 2021).
  115. Taylor, M. Energy Subsidies: Evolution in the Global Energy Transformation to 2050, International Renewable Energy Agency, Abu Dhabi. 2020. Available online: https://www.irena.org/-/media/Files/IRENA/Agency/Publication/2020/Apr/IRENA_Energy_subsidies_2020.pdf (accessed on 5 November 2021).
  116. IRENA. Financial Mechanisms and Investment Frameworks for Renewables in Developing Countries. 2012. Available online: https://www.irena.org/-/media/Files/IRENA/Agency/Publication/2013/IRENA-report---Financial-Mechanisms-for-Developing-Countries.pdf (accessed on 5 November 2021).
  117. OECD. Renewable Energies in the Middle East and North Africa: Policies to Support Private Investment. 2013. Available online: https://read.oecd-ilibrary.org/finance-and-investment/renewable-energies-in-the-middle-east-and-north-africa/support-mechanisms-for-the-renewable-energy-sector-in-the-middle-east-and-north-africa_9789264183704-6-en#page31 (accessed on 5 November 2021).
  118. Abolhosseini, S.; Heshmati, A.; The Main Support Mechanisms to Finance Renewable Energy Development, IZA Discussion Papers, No. 8182, Institute for the Study of Labor (IZA), Bonn. 2014. Available online: https://www.econstor.eu/bitstream/10419/98967/1/dp8182.pdf (accessed on 5 November 2021).
  119. Kim, K.-K.; Lee, C.-G. Evaluation and optimization of feed-in tariffs. Energy Policy 2012, 49, 192–203. Available online: https://www.sciencedirect.com/science/article/abs/pii/S0301421512004831?via%3Dihub (accessed on 5 November 2021). [CrossRef]
  120. Rövekamp, P.; Schöpf, M.; Wagon, F.; Weibelzahl, M.; Fridgen, G. Renewable electricity business models in a post feed-in tariff era. Energy 2021, 216, 0360–5442. [Google Scholar] [CrossRef]
  121. OMIE Web Page. Available online: https://www.omie.es/en (accessed on 5 November 2021).
  122. Eurostat Databrowser Web Page. Available online: https://ec.europa.eu/eurostat/databrowser/view/nrg_pc_204/default/table?lang=en (accessed on 5 November 2021).
  123. IEA Energy Prices: Overview, IEA, Paris. 2021. Available online: https://www.iea.org/reports/energy-prices-overview (accessed on 5 November 2021).
  124. National Geographic Institute (IGN): Cartography and Geographic Data Webpage. Available online: https://www.ign.es/web/ign/portal/cbg-area-cartografia (accessed on 5 November 2021).
  125. AENA Homepage. Available online: https://www.aena.es/en/passengers/passengers.html (accessed on 5 November 2021).
  126. Directorate General for Environmental Quality and Assessment. Environmental Zoning For The Implementation of Renewable Energy: Wind And Photovoltaics. Available online: https://www.miteco.gob.es/es/calidad-y-evaluacion-ambiental/temas/evaluacion-ambiental/zonificacion_ambiental_energias_renovables.aspx (accessed on 5 November 2021). (In Spanish).
  127. ENTSOE Maps Download Webpage. Available online: https://www.entsoe.eu/data/map/downloads/ (accessed on 5 November 2021).
  128. REE. Transmission Grid Map for the Iberian Peninsula. Available online: https://www.ree.es/sites/default/files/01_ACTIVIDADES/Documentos/Mapas-de-red/mapa_transporte_iberico_2018.pdf (accessed on 5 November 2021).
  129. OFFICIAL STATE BULLETIN. Circular 1/2021, of 20 January, of the National Markets and Competition Commission, Which Establishes the Methodology and Conditions for the Access and Connection to the Transmission and Distribution Networks of Electricity Production Facilities. 22 January 2021. Available online: https://www.cnmc.es/sites/default/files/3332956_6.pdf (accessed on 5 November 2021). (In Spanish).
  130. MINETUR. Electra. Register of Electricity Producers. Available online: https://sedeaplicaciones.minetur.gob.es/electra/ (accessed on 5 November 2021). (In Spanish).
  131. AEE. Wind Farms Map. Available online: https://aeeolica.org/en/about-wind-energy/map-of-wind-farms-in-spain/ (accessed on 5 November 2021).
  132. Open Power System Data Homepage. Available online: https://open-power-system-data.org/data-sources (accessed on 5 November 2021).
Figure 1. Microgrid (MG) layer structure (from Figure 2 in [7]).
Energies 14 07434 g001
Figure 2. Analyses for energy system planning with feedback (from Figure 4 in [12]).
Energies 14 07434 g002
Figure 3. Sketch of the tools used to produce Spain’s Integrated National Energy and Climate Plan (INECP) 2021–2030 (from Figure B.1 in [15]).
Energies 14 07434 g003
Figure 4. Diagram of TIMES-SINERGIA inputs and outputs (from Figure B.2 in [15]).
Energies 14 07434 g004
Figure 5. A MG design framework (from Figure 1 in [63]).
Energies 14 07434 g005
Table 1. Parameters extracted from the review of articles, adapted to the layers structure.
Climate ConditionsInfrastructure
ParametersValueParametersValueParametersValue
Wind Speed (m/s)[2.5–35.6]Settlements (km)[0.25–10]Visibility (% of pixel)[0–31]
Solar daily Global Irradiation (kWh/m2-day)[4.5–6.7]Renewables Energies Facilities[Existing areas]Electric Grid (km)[0.1–40]
Temperature (°C)[17–31.1]Land Cover[Better in areas without vegetation]Water bodies (km)[0.4-28]
BusinessLand Use[Better in not productive areas]Airports (km)[3.5–28]
ParametersValueSlope solar (°)[0–5.71]Bird Migration Path[X]
Useful Life (years)[25–30]Slope wind (°)[0–35]Roughness[1.5]
Minimal area (km2)[4]DEM solar (m)[300–1500]Faults (m)[200]
Installation cost ($/kW)[4000–5000]DEM wind (m)[500–2000]Roads (km)[0.3–40]
Table 2. Hybrid Optimization Model for Electric Renewables (HOMER) Data structure as a reference for Production cost assessment level under the microgrid (MG) layer structure.
Climate ConditionsBusiness
ParametersTime ResolutionParametersUnitParametersUnit
Wind Speed (m/s)HourlyInstallation cost €/kWAnemometer heightm
Solar Radiation (W/m2)Hourly O&M costs€/kW-yearHub heightm
Temperature (°C)Hourly Replacement costs€/kWWT power curve-
InfrastructureGrid energy costs (sale/buy)€/kWhPV PR%
ParametersUnitGrid capacitykWPPALoad data
Useful Life yearsInflation%MerchantPrice series
Roughness (Land cover)mDiscount rate%
AltitudemProject Lifetimeyears
Table 3. Main characteristics of the existing sources for wind and solar resources data.
ResourceSourceTime ResolutionSpatial ResolutionComponentHeights
(m)
Planning LevelCoverage OthersReference
WindGlobal Wind AtlasYear250 mWS, Weibull distribution10, 50, 100, 200LTES, Geo-spatial WorldRoughness length, altitude[76]
New European Wind Atlas (NEWA)30 minMeso
3 km
Micro
250 m 1
WS, WD, T, ρ and 23 others 10, 50, 75 100, 150, 200, 250 and 500DispatchEuropeClimate means[77,78,79]
NASA–POWERMonth30 kmWS and many others50LTES, Geo-spatialWorld [80]
SolarGlobal Solar AtlasMonth250 mGHI, DNI, DHI--LTES, Geo-spatialWorldPV output, PV optimum tilt,
T (2 m.)
[81,82]
Solargis30 minSelected locationDispatch
PVGISMonth5 kmGHI, GIOA--LTES, Geo-spatialAfrica, Europe,
Partially America & Asia
PV output, PV optimum tilt horizon profile, TMY[83,84]
Daily, HourlySelected locationIrradiance on fixed/tracking plane
Soda1 min to 1 month250 mGHI, GTI, DNI, DHI--DispatchAfrica, Europe, partially America & AsiaTMY, UV, PAR,
AI forecast
[85,86]
15 min. maps3 km--Dispatch
Meteonorm1 minSelected locationGHI, GTI, DNI, DHI--DispatchWorldTMY, many other meteorological parameters[87]
NASA—POWERMonth30 kmGHI, DHI, DNI--LTES, Geo-spatialWorldMany other meteorological parameters[80]
NREL5 min4 kmGHI, DHI, DNI--LTES, Geo-spatialWorld [88]
1 Not yet available. WS = Wind Speed; WD = Wind Direction; T = Air Temperature; ρ = Air Density, GHI = Global Horizontal Irradiance, GTI = Global Tilted Irradiance, DNI = Direct Normal Irradiance, DHI = Diffuse Horizontal Irradiance, GIOA = Global Irradiance Optimum Angle, TMY = Typical Meteorological Year, UV = Ultraviolet irradiance, PAR = Photosynthetically Active Radiation.
Table 4. Most commonly used datasets main characteristics.
Dataset AcronymDataset Whole NameTime PeriodTime ResolutionHorizontal ResolutionVariablesReference
CFSRClimate Forecast System Reanalysis1979–nowmost: 6 h;
some: 1 h
38 kmWS: 10 m[95,96]
MERRA-2Modern-Era Retrospective Analysis for Research and Applications1993–now1 h50 kmWS, WD: 50 m[97] a
ECMWF/ERA5European Center for Medium-Range Weather Forecast/ECMWF Reanalysis v51979–now1h31 kmWS, WD: 10 and 100 m [98,99] b
a Hourly data wind speed from MERRA2 and hourly solar radiation datasets from the Climate Monitoring Satellite Application Facility (CM SAF) SARAH [100] can be accessed freely through the web service [101], b ERA5 wind speed data validation can be found in [102]. ERA5 hourly solar radiation data are used by PVGIS [103] for high-latitude areas and by Meteonorm [104]. A comparison of daily solar irradiation provided by MERRA and ERA-Interim (the predecessor of ERA5) can be found in [105].
Table 5. Sources and Geographic Information System (GIS) layers for the Spanish case.
ParametersFormatSource
Airports shapefileAENA
Rivers shapefileIGN
Power StationshapefileREE, AEE, Electra, IGN
Land CovershapefileIGN
CoastlineshapefileIGN
Settlements shapefileIGN
Natura 2000shapefileIGN
Roads shapefileIGN
Power SubstationshapefileREE, IGN
Water bodies shapefileIGN
Electric Grid shapefileREE, IGN
DEM rasterIGN
Environmental Zoning (Wind)rasterMITECO
Environmental Zoning (Solar)rasterMITECO
Publisher’s Note: MDPI stays neutral with regard to jurisdictional claims in published maps and institutional affiliations.

