Article

Development of Stable Mixed Microbiota for High Yield Power to Methane Conversion

1
Department of Biotechnology, University of Szeged, 6726 Szeged, Hungary
2
Institute of Plant Biology, Biological Research Centre, 6726 Szeged, Hungary
3
Institute of Biophysics, Biological Research Centre, 6726, Szeged, Hungary
4
Department of Oral Biology and Experimental Dentistry, University of Szeged, 6720 Szeged, Hungary
*
Author to whom correspondence should be addressed.
Energies 2021, 14(21), 7336; https://doi.org/10.3390/en14217336
Submission received: 21 September 2021 / Revised: 27 October 2021 / Accepted: 30 October 2021 / Published: 4 November 2021
(This article belongs to the Special Issue Seasonal Energy Storage with Power-to-Methane Technology)

Abstract

:
The performance of a mixed microbial community was tested in lab-scale power-to-methane reactors at 55 °C. The main aim was to uncover the responses of the community to starvation and stoichiometric H2/CO2 supply as the sole substrate. Fed-batch reactors were inoculated with the fermentation effluent of a thermophilic biogas plant. Various volumes of pure H2/CO2 gas mixtures were injected into the headspace daily and the process parameters were followed. Gas volumes and composition were measured by gas-chromatography, the headspace was replaced with N2 prior to the daily H2/CO2 injection. Total DNA samples, collected at the beginning and end (day 71), were analyzed by metagenome sequencing. Low levels of H2 triggered immediate CH4 evolution utilizing CO2/HCO3 dissolved in the fermentation effluent. Biomethanation continued when H2/CO2 was supplied. On the contrary, biomethane formation was inhibited at higher initial H2 doses and concomitant acetate formation indicated homoacetogenesis. Biomethane production started upon daily delivery of stoichiometric H2/CO2. The fed-batch operational mode allowed high H2 injection and consumption rates albeit intermittent operation conditions. Methane was enriched up to 95% CH4 content and the H2 consumption rate attained a remarkable 1000 mL·L−1·d−1. The microbial community spontaneously selected the genus Methanothermobacter in the enriched cultures.

1. Introduction

The energy needs of civilized human lifestyle and the global population are increasing rapidly. The majority of this energy is provided currently from fossil energy carriers. Exploitation of fossil sources is associated with greenhouse gas (GHG) emission, which is the primary source of global climate change endangering the biosphere and overall quality of life on Earth. These are the driving forces for the increase of the contribution of renewable energy in the overall energy spectrum. Photovoltaics (PV), wind, hydro, and biomass are the major sources available [1,2]. The particularly rapid growth in energy production via PV and wind is much appreciated although the fluctuating nature of electricity generation using these forms of incoming solar energy presents additional challenges for the distribution and utilization systems [3,4]). Smart electricity grids and flexible storage technologies are being developed to balance the energy losses and grid imbalances due to the deranged production and utilization of electricity [5].
The mass-based energy content and carbon-free nature of hydrogen makes H2 an excellent energy storage medium. H2 can be produced in various ways [6], water electrolysis being the most commonly employed among them [7]. Conversion to a hydrogen economy [8,9,10] is an attractive scenario, which could help restore the rapidly deteriorating climate conditions. The primary hurdles to large scale H2 use include underdeveloped storage and transport technologies, which are still costly and energy demanding [8,10].
Methane (CH4) is also an excellent potential energy delivery material but it can contribute to GHG emission, due to its carbon content, unless generated via a renewable energy conversion process [11,12]. A significant advantage of CH4 as an energy carrier is the efficient and advanced storage and transport pipeline system developed for natural gas, the fossil and thus less environmentally friendly form of CH4 [13,14]. Biogas, a mixture of CH4 (60–70), carbon dioxide (30–40%), and 1–2% of other gases [15], is generated during the anaerobic decomposition (AD) of biomass, a renewable form of stored solar energy continuously supplied on Earth via photosynthesis [16,17]. AD of biomass is carried out by a complex microbial community, biogas is formed in the last step of the multifarious biochemical process by methanogenic microbes. Based on their substrate preference, methanogens are classified in three groups, i.e., acetotrophic, hydrogenotrophic, and methylotrophic methanogens, all belonging in the phylum Euryarchaeota within the kingdom Archaea [18]. Hydrogenotrophic methanogens reduce carbon dioxide (CO2) to CH4 when the appropriate reducing power, i.e., H2 or low redox potential electrons, is available. H2 can be obtained from water electrolysis powered by renewable electricity, closing the circular character of this energy conversion process, called Power-to-Methane (P2M) [7,15,19,20]. P2M is accomplished either within the biogas producing AD reactor, i.e., in situ P2M, or in a separate reactor vessel, i.e., ex situ P2M, or in a combination thereof [15,19]. The advantages and disadvantages of the various reactor arrangements have been discussed extensively [15,21,22,23]. Methanogens, the key players in the P2M process can be employed in sterile, pure cultures [24,25,26,27] or in a mixed anaerobic microbial community [13,28,29,30,31,32,33,34]. An inexpensive, readily available source of the anaerobic methanogen community is the fermentation effluent of the biogas reactor itself, which is enriched in methanogens during the course of P2M [28,35].
A lab-scale proof of concept is presented in this study, in which the fermentation residue of an industrial thermophilic AD reactor is used to catalyze the P2M conversion of H2 and CO2 while the alterations of the microbial community under the selection pressure of the experimental conditions are established.

2. Materials and Methods

2.1. Fermentation System

The total volume of each batch reactor was 160 mL (Wheaton glass serum bottle, Z114014 Aldrich) and contained 40 mL fermentation effluent from the thermophilic industrial biogas plant Bátortrade Kft. Nyírbátor, Hungary. The main substrates at Bátortrade are animal waste (39.1%), manure (29.7%), agricultural waste (18.9%), and ensilaged green plant material (12.3%). The effluent, containing the “start” microbial community, was sieved on a 1 mm filter to remove the larger particles. In each set of experiments 3 control reactors, containing only the “start” inoculum, were included. The various reactors were operated in 3 parallel biological replicates. The reactors were sealed with butyl septa and aluminum crimps and the headspace was replaced with flushing by N2 gas (Messer nitrogen 4.5) for 5 min. H2 and CO2 were injected manually and daily into the head-space with disposable plastic syringes. The reactors received varying volumes of daily H2 doses, which were nominally 20, 40, and 60 mL of pure H2 gas, respectively. The amount of the injected gas was verified by gas chromatography (GC) as corresponding to 18.0, 31.5 and 43.5 v/v% actual initial H2 concentration in the head-space. The gas composition in the reactor head-space was determined daily by GC and after the measurements the reactors were degassed by purging with N2 for 5 min and the internal pressure was adjusted to atmospheric level. The reactors were incubated in a thermostated rotary shaker at 55 °C.

2.2. Volatile Organic Acid Analysis

Samples for organic acid analysis were pretreated according to Szuhaj et al. [28].
The concentrations of volatile organic acids were measured with HPLC (Hitachi Chromaster) equipped with a refractive index detector Chromaster 5450. The separation was performed on an Agilent Hi-Plex H column. The temperature of the column and detector were 50 °C and 41 °C, respectively. The eluent was 0.02 M H2SO4 (0.6 mL·min−1).

2.3. Gas Composition Analysis

The gas composition of the reactor headspace was measured every day by GC. The CH4 and H2 contents were determined with an Agilent 6890N GC (Agilent Technologies, Santa Clara, CA, USA) equipped with an HP Molesive 5 Å (30 m × 0.53 mm × 25 µm) column and a TCD detector. The temperature of the injector was 150 °C and application was made in split mode 1.1:1. The column temperature was maintained at 47 °C. The carrier gas was Linde HQ argon 5.0, with the flow rate set at 9.6 mL·min−1.
The amount of CO2 was determined with a Shimadzu GC 2010 (Shimadzu Corporation) equipped with a TCD detector and a HP PlotQ (30 m × 0.5 mm × 40 µm) column. The chromatograph was operated in split injection mode (rate 4:1). The temperature of the inlet was 200 °C. The column and the detector temperature were maintained at 90 °C and 150 °C, respectively. The carrier gas was Messer nitrogen 4.5 at 1.25 mL·min−1. The samples were injected with the help of a gastight microsyringe (Hamilton). The conversion efficiency of H2 to CH4 was calculated by the modified theoretical equation [28,30,36].
η = ( r C H 4 A r C H 4 B ) ( r H 2 A r H 2 D ) × 4 × 100
where “A” is the experimental reactor and
  • η = conversion efficiency of H2 to CH4 (%)
  • r C H 4 A = CH4 production of reactor A (mL·L−1·d−1)
  • r C H 4 B   = CH4 production of control reactor (mL·L−1·d−1)
  • r H 2 A   = injected amount of H2 to reactor A (mL·L−1·d−1)
  • r H 2 D   = residual amount of H2 in reactor A (mL·L−1·d−1)

2.4. Determination of Fermentation Parameters

oDM: The organic dry matter content was quantified by drying the biomass at 105 °C overnight and weighing the residue, giving the dry mass content. Further heating of this residue at 550 °C provided the organic dry matter (oDM) content.
pH: The pH was measured with a Radelkis OP-211/2 equipped with an OP-0808P pH electrode immediately after the daily GC analysis.

2.5. Total DNA Isolation for Metagenomics

The composition of the microbial community was investigated twice during the experimental period from each reactor and controls, i.e., at the starting point (inoculation) and at the end of cultivation. For total community DNA isolation 2 mL samples were taken from each reactor. DNA extractions were carried out using the Zymo Research Fecal DNA kit (D6010, Zymo Research, Irvine, CA, USA). Bead beating was performed by Vortex Genie 2, bead size: 0.1 mm, beating time: 15 min, beating speed: max, and in other details the Zymo Research kit protocol was followed. The quantity of DNA was estimated using a NanoDrop ND-1000 spectrophotometer (NanoDrop Technologies, Wilmington, NC, USA) and a Qubit 2.0 Fluorometer (Life Technologies, Carlsbad, CA, USA). DNA purity was tested by agarose gel electrophoresis and on an Agilent 2200 TapeStation instrument (Agilent Technologies).

2.6. Shotgun Sequencing

The recommendations of the Ion Torrent PGM™ sequencing platform were closely followed (Life Technologies, USA). The preparation of sample libraries was done according to the Life Technologies IonXpress fragment plus library protocol (4471269). Ion device library quantitation kit (4468802) and Step One Real Time PCR (Applied Biosystems) were used to quantify the samples. The Ion PGM Template OT2 200 kit (4480974) was used with OneTouch 2 and Ion OneTouch ES devices. The barcoding was done by IonXpress barcode kit (4471250). Sequencing was performed with Ion PGM 200 Sequencing kit (4474004) on Ion Torrent PGM 316 chip.
Raw sequences are available on NCBI Sequence Read Archive (SRA) under the submission number: PRJNA625695.

2.7. Raw Sequence Filtering

The Galaxy Europe server was employed to pre-process the raw sequences (i.e., sequence filtering, mapping, quality checking) [37]. Low-quality reads were filtered by Prinseq [38] (min. length: 60; min. score: 15; quality score threshold to trim positions: 20; sliding window used to calculated quality score:1). Filtered sequences were checked with FastQC.

2.8. Read-Based Metagenome Data Processing and Statistical Analysis

The filtered sequences were further analyzed by Kaiju, applying the default greedy run mode on Progenomes2 database [39,40]. MEGAN6 was used to investigate microbial communities and export data for statistical calculation. The results were plotted with iTOL (Interactive Tree of Life) [41]. The microbial changes of the communities were estimated as the log2 fold changes (log2FC):
log 2 FC = log 2 ( abundance   X abundance   START / CONTROL )

3. Results

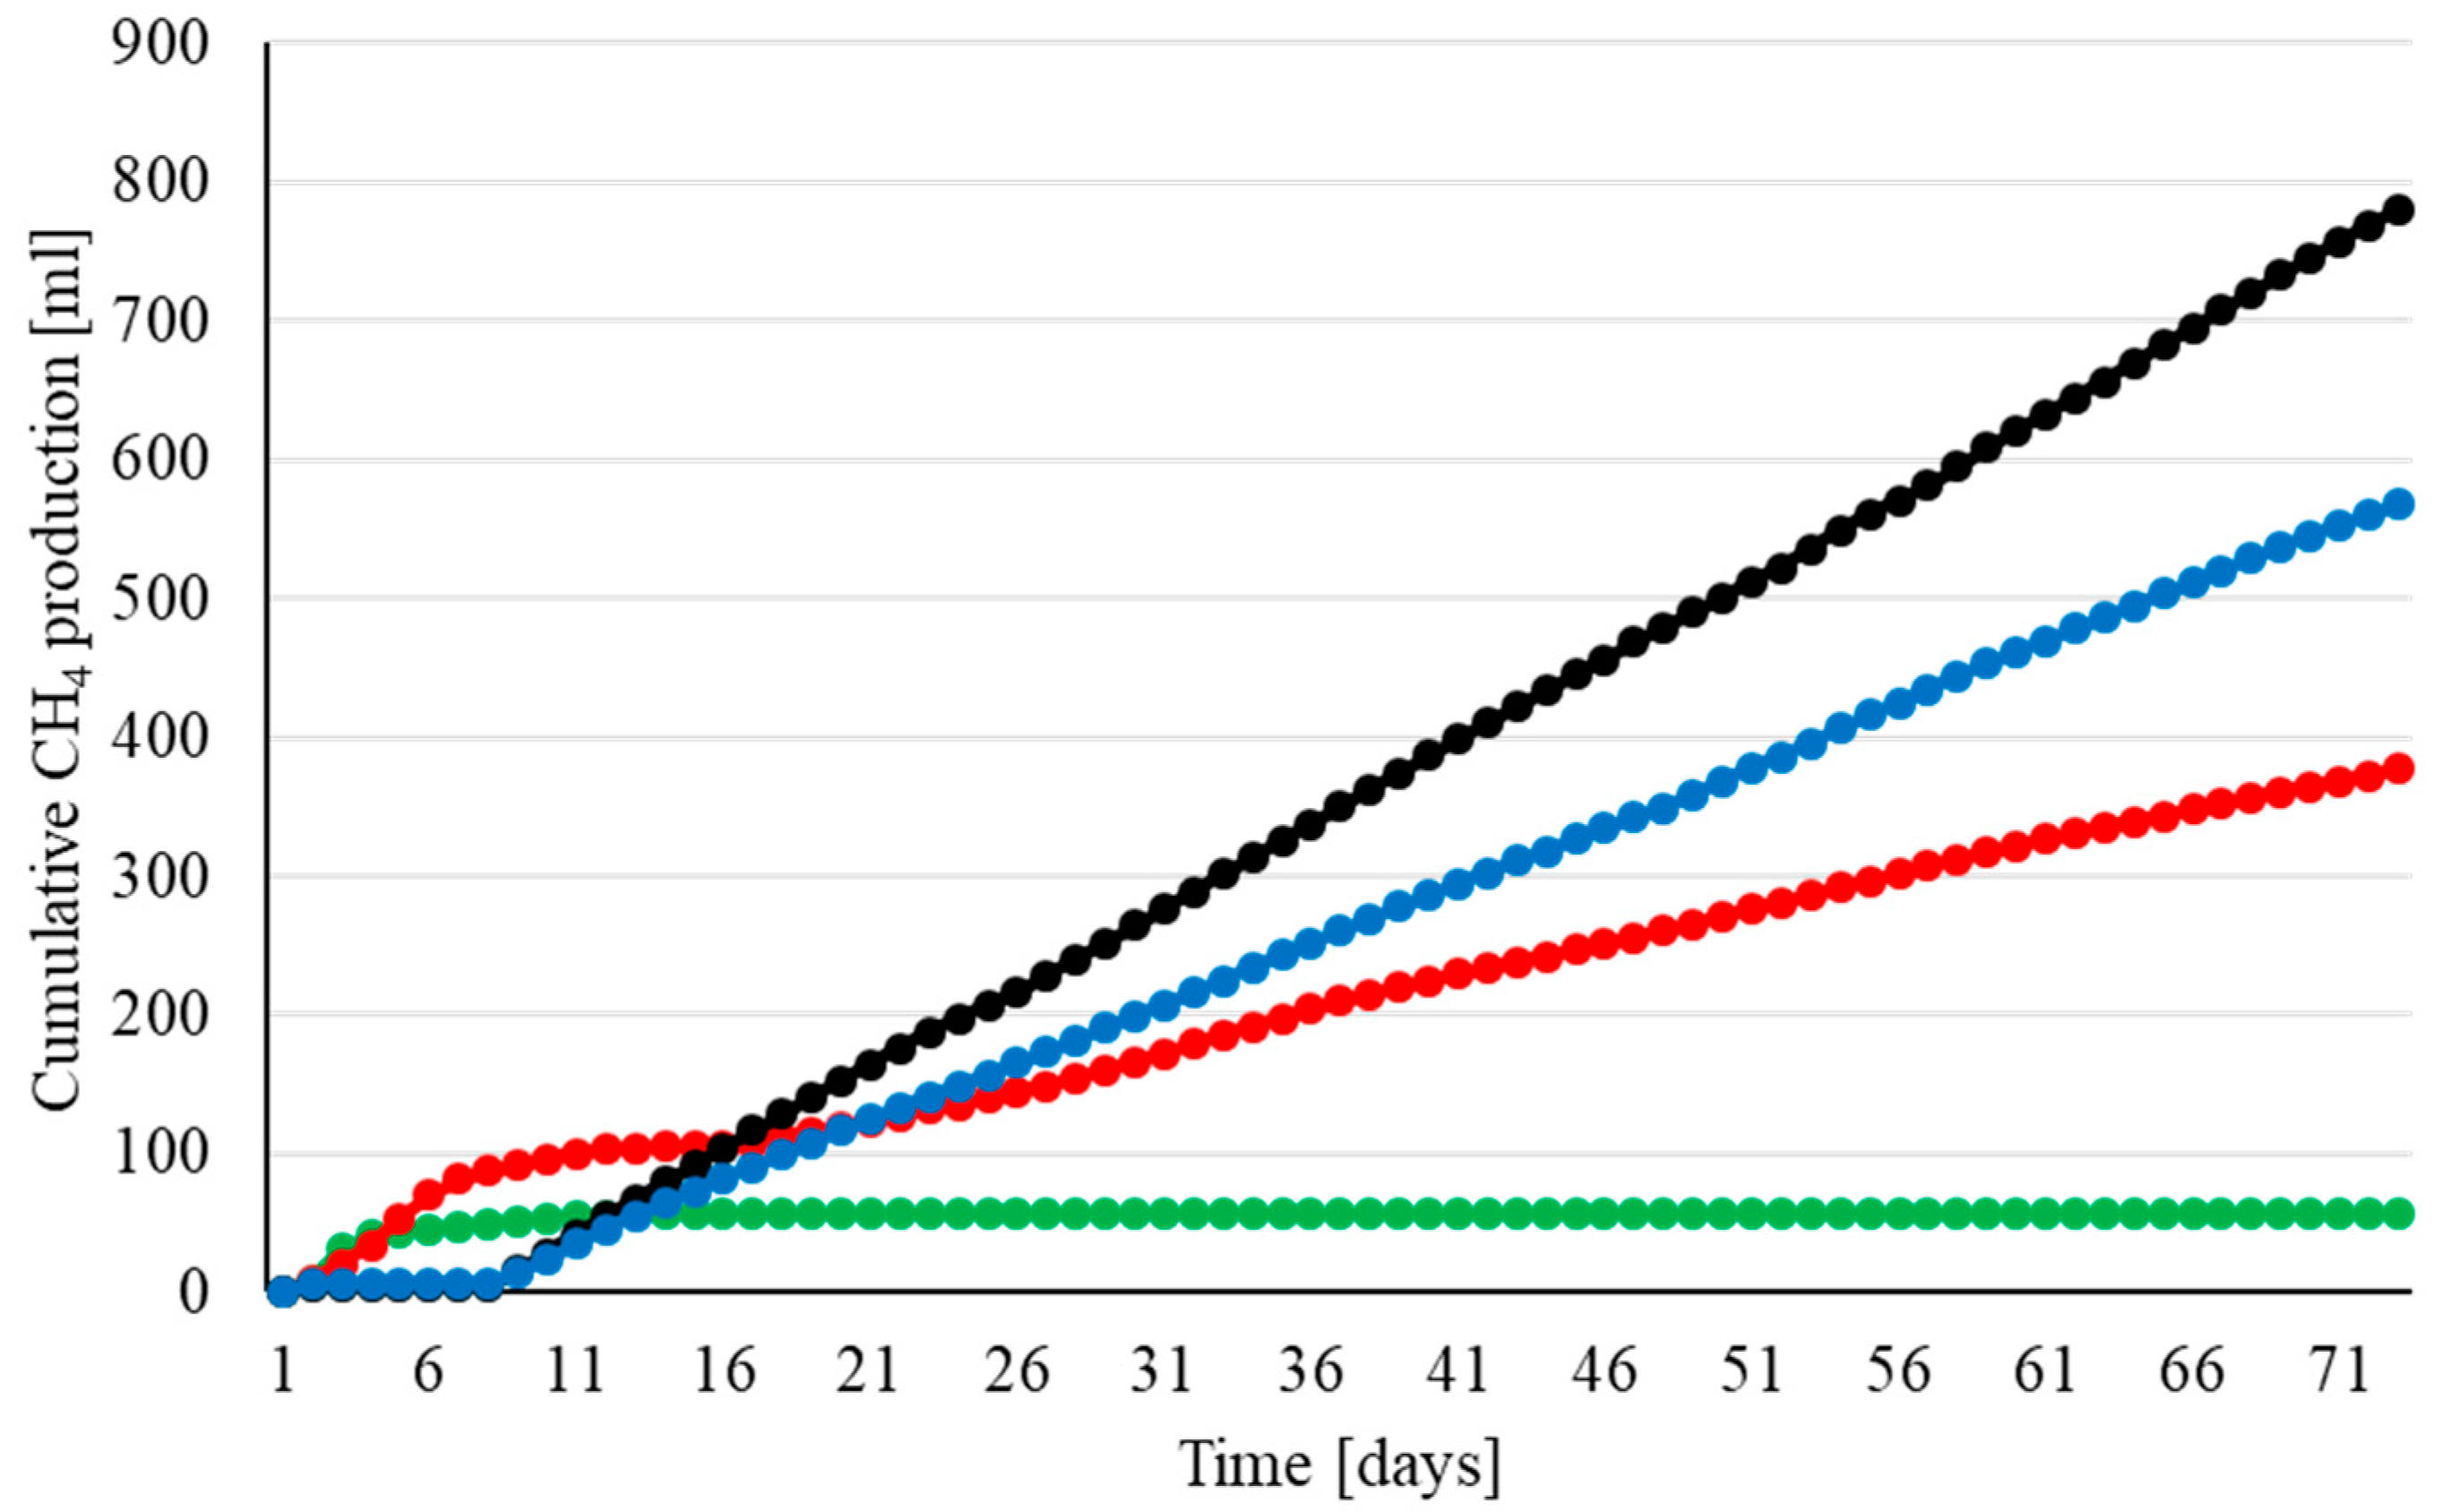
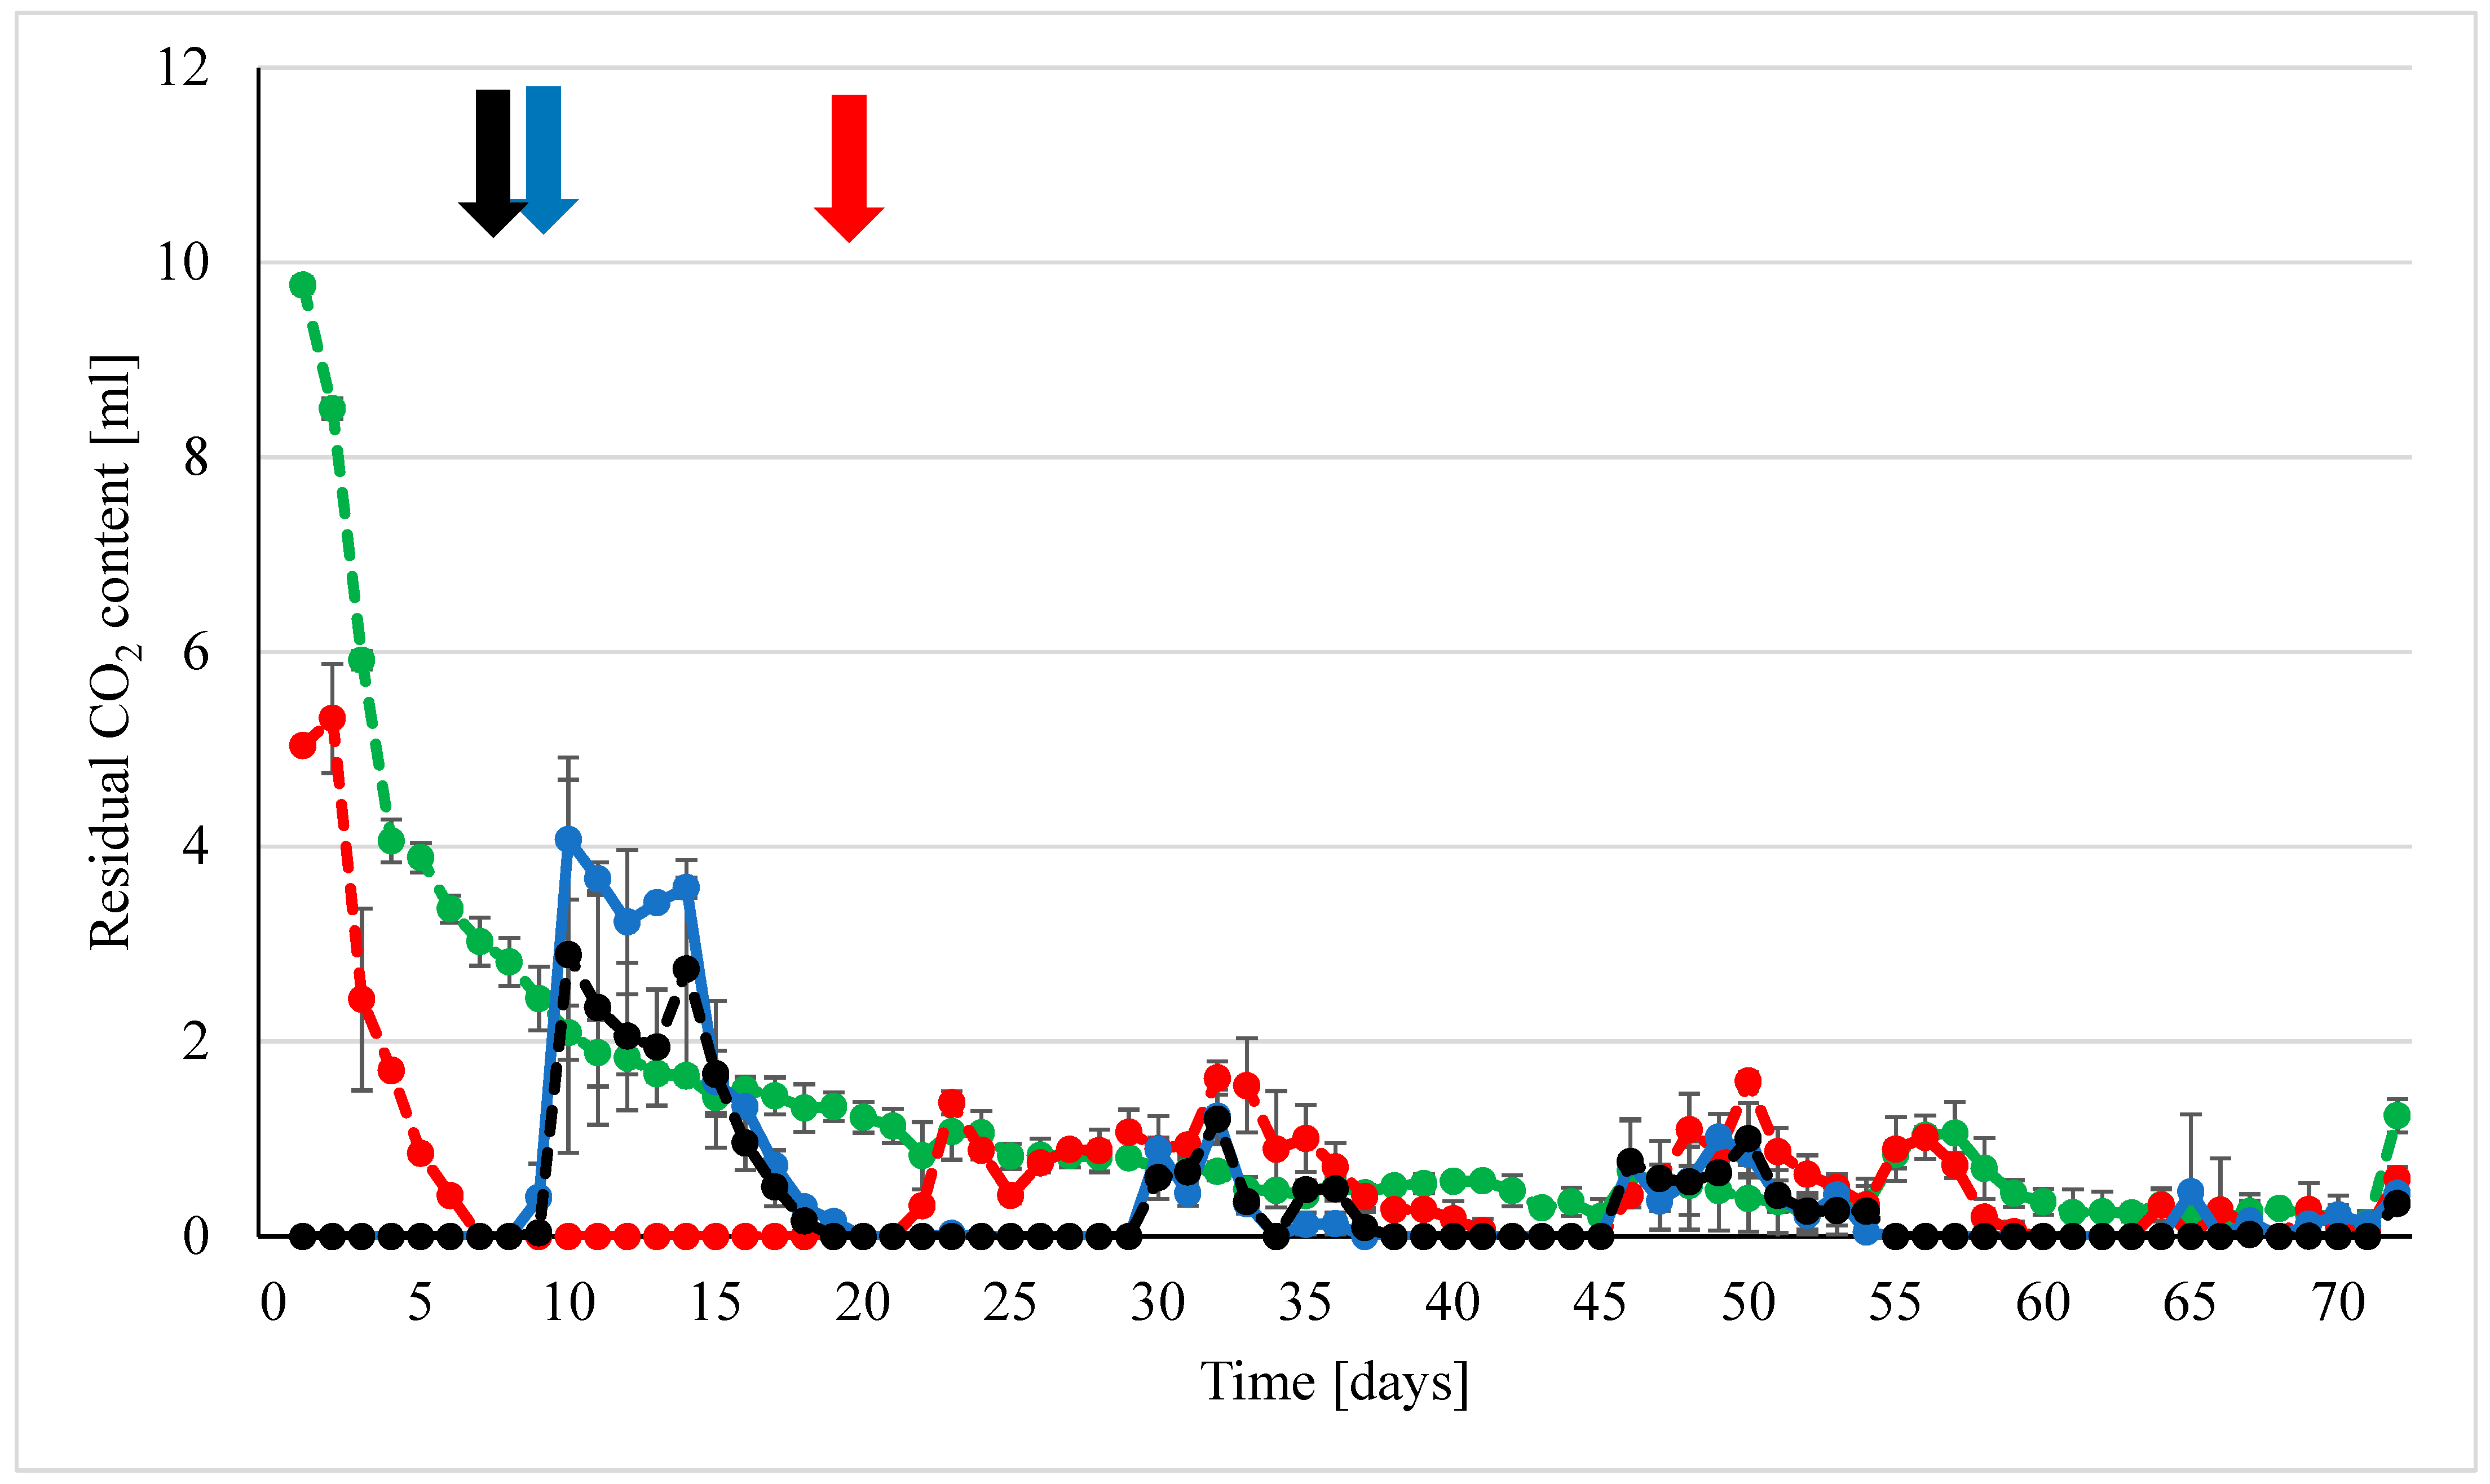
3.1. Methanogenesis by H2 and H2 + CO2

The mixed AD community was first supplied with various amounts of H2 in order to eliminate the dissolved CO2/HCO3 in the AD fermentation effluent (Figure 1).
The control samples (green curve) evolved a small amount of residual CH4 during day 1–2, but CH4 generation ceased afterwards indicating the cessation of biogas formation due to the preceding depletion of degradable organic substrates. The reactors received varying volumes of daily H2 doses, which were nominally 20, 40, and 60 mL of pure H2 gas, shown with red, blue and black curves, respectively, corresponded to 18.0, 31.5, and 43.5 v/v% actual initial H2 concentration in the head-space. The daily H2 doses were completely consumed within 24 h in all reactors. The microbial community quickly consumed the dissolved CO2/HCO3 as well, indicating high biological activity. The reactors receiving 18 v/v% of H2 started to produce CH4 intensively, implying sufficient level of a hydrogenotrophic methanogen activity for the bioconversion reaction. After about a week of daily H2 feeding of the reactors the CH4 evolution began to cease and the cumulative CH4 production curve levelled off. By this time the CO2 completely disappeared from the headspace of the reactors (Figure 2). A combination of these observations was indicative of methanogenesis limitation as a consequence of CO2/HCO3 depletion by hydrogenotrophic methanogenesis. The situation was remedied by the injection of 6.5 v/v% CO2 together with the daily H2 dosage (Figure 2) on days 8–14 and 22 as indicated by the arrows.
This effectively restored CH4 production, although the excess CO2 supply resulted in a transient accumulation of CO2 in the headspace. Henceforth, a 4:1 volumetric mixture of H2 and CO2 was injected daily into the head-space of the reactors. Steady CH4 production, without detectable H2 or CO2, was maintained throughout the rest of the 71-day long experiment, demonstrating sustainable bioconversion of H2/CO2 to CH4. The alterations in the pH of the reactor content reflected and corroborated the postulated sequence of events. Following week 2, a significant pH elevation was noted in the reactors receiving 18 v/v% of H2, which quickly reached an alarming level above pH = 9 (Figure 3) on weeks 2 and 3. The injection of CO2 slowly returned the pH level to normal, corroborating the essential role of CO2/HCO3 in maintaining and regulating the buffering capacity in these systems.
The reactors receiving higher H2 doses (31.5 or 43.5 v/v%) showed a substantially distinct behavior. In these reactors CH4 evolution did not commence upon H2 addition and CO2 was not detectable in the headspace even after the first day. Nevertheless, the injected H2 was consumed completely by the microbial community. Pursuing possible bioconversion product(s) other than CH4 revealed that the microbes utilized the H2 and CO2 in the reactors for syntrophic acetate production via homoacetogenesis [42]. Accumulation of considerable amounts of acetate (Figure 4) indicated the predominance of this pathway in these reactors. In line with this mechanism was the substantial pH drop on week 2 (Figure 3). Overdosed (9.9 and 13.9 v/v%) injection of CO2 (Figure 2) successfully balanced the pH back to near normal level for methanogenesis in these reactors. Accordingly, steady CH4 production started (days 8–10) and daily stoichiometric gas delivery of H2 and CO2, drifted the system away from volatile fatty acid (VFA) biosynthesis to hydrogenotrophic methanogenesis (Figure 1, Figure 2 and Figure 3). All reactors were eventually stabilized in the biomethane production mode and maintained their stable operation for the rest of the experimental period. Acetate and other VFAs were barely detectable in these reactors (Figure 4).

3.2. Metagenomic Analyses

The microbial community of the thermophilic digestate was diverse, although the majority of the identified genera were present in low relative abundance (<1%) (Figure 5). Feeding the community with only H2/CO2 daily, acted as strong selection pressure on the community by the end of the 71-day long P2M experiment. In spite of the apparent high initial microbial diversity, a limited number of taxa survived the P2M experimental conditions (Table 1) leading to the substantial enrichment of the successful survivors.
Within the kingdom Bacteria the genus Caldicoprobacter turned out to be the most abundant (19.9%) in the starting community, i.e., in the fermentation effluent of the thermophilic AD plant. These hydrolyzing bacteria belong in the order Clostridia and class Firmicutes and degrade various carbohydrates, e.g., arabinose, xylose, ribose, fructose [43], and proteins via their active serine protease [44]. The second most abundant genus in the kingdom Bacteria was Ureibacillus. These bacteria can also carry out a number of heterotrophic decomposition pathways [45,46,47]. Additional predominating members of the thermophilic anaerobic community were the genera Clostridium and Lutispora with relative abundances of 4.5 and 2.3%, respectively. These genera are routinely found in biogas communities [48,49], together with the less abundant genera Desulfotomaculum (1.8%) and Moorella (1.5%) (Table 1).
Members of the genus Methanosarcina were initially the predominant ones among methanogens with relative abundance of 21.7%. Methanosarcina is the only known genus, which is able to carry out all three methanogenic pathways, i.e., acetoclastic, hydrogenotrophic, and methylotrophic CH4 biosynthesis. This versatile capability makes them the most frequently detected methanogens in many biogas producing systems [7,15]. In line with the metabolic versatility, they showed excellent survival competence upon starvation, the relative abundance in the control reactor was 22.8%. Next in abundance among the initial methanogens was the genus Methanothermobacter (8.4%), a typically hydrogenotrophic methanogen [50]. They endured the starvation just as well as the genus Methanosarcina, and eventually became the most predominant methanogens in all reactors fed with H2/CO2, greatly outnumbering the other two methanogenic genera and therefore substantially contributing to the P2M conversion. It is noteworthy, that the relative abundance of the genus Methanothermobacter increased with the daily H2 doses injected into the reactors while both Methanosarcina and Methanobacterium appeared to respond on the contrary, i.e., their relative abundances apparently decreased at elevated H2 addition (Table 1). Since these abundance values are relative ones, they indicate the level of competition for H2 among the methanogens rather than the absolute number or survival vigor of these Archaea.
The overall rearrangement of the microbial community as a result of H2/CO2 feeding may not look spectacular at first glance (Figure 5, outermost rings). This is due to the fact that sequencing of the samples allowed the identification of numerous taxa present in very low abundance, i.e., <0.1% in the microbial communities. The changes in the scarcely present microbes upon various treatments are difficult to assess, therefore these were not considered in the comparative analyses. Important changes were recognized upon a closer look (Table 1) of the 23 most abundant taxa present in the starting microbial community. Although fresh organic substrate was not delivered into the reactors, some of the heterotrophic Bacteria managed to survive and flourish in spite of the lack of added organic substrates for their heterotrophic growth.
A marked reorganization of the microbial community took place, when the microbes were subjected to starvation, i.e., neither external organic substrate nor H2/CO2 was available to support their life. Comparison of the “start”, i.e., thermophilic AD effluent, microbial community with the “control”, i.e., thermophilic AD effluent incubated at 55 °C, with daily replacement of the headspace with N2 gas, clearly indicated a fight for survival within the community (Table 1, columns 2 and 3).
The regulatory effects of H2 and/or H2/CO2, together with the lack of added organic substrates, manifested themselves in the genera Ureibacillus (log2FC= −7.6), Lutispora (log2FC= −3.9), Herbinix (log2FC= 2.4), Clostridium (log2FC= −2.3), Bacillus (log2FC= −1.3), Tepidanaerobacter (log2FC= −2.0) among Bacteria. Ureibacilli have been found frequently in thermophilic aerobic poultry waste treatment sites [51]. Similarly, the genera Lysinobacillus and Paenibacillus are typical components of the poultry manure microbiota [52,53]. These apparently “outlier” bacteria (taxon names are highlighted in yellow in Table 1) could have therefore infiltrated the thermophilic AD community from the AD substrate, which contained poultry meat processing waste (Figure 6).
The declining representation of homoacetogens, e.g., genus Syntrophomonas (log2FC= −2.5) [54], indicated a shift from syntrophic acetate oxidation (SAO) to hydrogenotrophic methanogenesis in the reactors fed with increasing H2/CO2 loading. In contrast, the SAO genus Actinotalea acclimated excellently to the starvation condition and subsequently to the P2M conditions. Similarly, other SAOB genera, such as Syntrophaceticus and Thermoacetogenium [55] emerged substantially from the diverse group of low abundant taxa in the starting community upon starvation and remained stable members of the community, although virtually unaffected by the amount of daily H2 dosage (taxon names are highlighted in green in Table 1). Others (taxon names are highlighted in white in Table 1) remained unaffected by the presence of H2/CO2 in their environment.
Interestingly, the methanogens (taxon names are highlighted in red in Table 1) responded differently to the changing environment. The genus Methanosarcina, a predominant methanogen in the starting community, was not affected by the starvation, but became slightly inhibited by the daily dosage of H2/CO2 (log2FC = −0.8), although it should be noted again that only relative abundance values were compared in this study. Increasing the H2 supply triggered an apparent drop in the number of Methanobacteria, but their average abundance was at the respectable log2FC = 4.9. The hydrogenotrophic methanogen Archaea (HMA), belonging in the genus Methanothermobacter became the absolute predominant taxon, its relative abundance increased from 8.4% in the starting community up to 65.3% in the reactors receiving 43.5 v/v% H2 + 10.9 v/v% CO2 every day (Figure 6).

4. Discussion

Signatories of the Paris agreement [56] pledged to exercise joint efforts and limit the global climate change to below 2 °C, a challenging undertaking for mankind. Among the measures to be implemented, the expanded use of renewable energy carriers to replace the currently predominating fossil ones has high priority. There are a number of technical tasks to solve and obstacles to overcome along this road, but photovoltaics, wind, and hydro power technologies have already gained momentum and increased appreciably the contribution to the conversion of the energy palette. These technologies produce renewable electricity often in a fluctuating and unpredictable fashion, depending on the environmental conditions. The electricity grids experience difficulties in handling this irregular input without major losses. The power-to-gas (P2G) or power-to-methane (P2M) technology offers a solution by converting the excess renewable electricity to H2 or CH4 via P2G or P2M, respectively [57]. H2 is a carbon-free energy carrier for the future, CH4 seems to be an excellent second choice and an easier target due to the existing elaborated transport and storage networks for “natural gas”, which is essentially fossil CH4.
Several approaches have been proposed to realize P2M [15] using biological systems as catalyst of the CO2 reduction to CH4. They all employ hydrogenotrophic methanogenic Archaea (HMA), which carry out the required biochemical reaction in their natural environment to sustain their life [58], within the biogas producing anaerobic microbial communities [59]. HMAs can accomplish CO2 reduction both in microbiologically pure cultures and as parts of a larger microbial community. In a mixed community the provision of only H2 or H2/CO2 acts as selection pressure in the process. Under mesophilic conditions [28,35] the reactors fed solely with H2, consumed the dissolved CO2/HCO3 and CH4 evolution ceased after 26–28 days. Correcting the conditions by daily injection of stoichiometric H2/CO2 in the head-space restored the P2M process, which could be maintained for an extended period of time. The daily doses of H2/CO2 were completely consumed within 16–20 h.
In the present study the same overall workflow was tested under thermophilic (55 °C) conditions. Elevation of the reaction temperature accelerated the performance of the HMAs in the mixed microbial community. The reactors supplied with 31.5 or 43.5% H2 did not evolve CH4 (Figure 1), but converted the H2/CO2 to primarily acetate (Figure 4), which suggested a homoacetogenic reaction pathway for H2 metabolism instead of the expected CH4 evolution. Apparently, the dissolved CO2/HCO3 was used as carbon source in the acetate biosynthesis as indicated by both the VFA profile and the increased pH by the end of day 7. Similar events were observed only after 3–4 weeks of daily H2 injection under mesophilic conditions [28].
Distinct behavior was observed at low daily H2 dosage, i.e., 18% of H2 in the head-space at the time of gas injection. The H2 also wholly disappeared from the head-space within 24 h and CH4 evolution commenced. Accumulation of VFAs and concomitant elevation of pH was not observed in these reactors indicating that the P2M reaction took place already during this first period of the experiment. By the end of week 2 probably most of the dissolved CO2/HCO3 was converted to CH4. Elevation of the pH was the first warning sign of system imbalance, which required action to restore stable CH4 production. Addition of stoichiometric daily H2/CO2 gas mixture resolved the problem.
In summary, the entire experimental timeline could be divided clearly into two phases. During the first period, the system responded quickly but in a distinct manner depending on the supplied H2 level and the dissolved CO2/HCO3. When only low H2 volumes were injected into the reactors, i.e., 18 v/v%, CH4 evolution took place as expected. In contrast, addition of higher dosage of H2 inhibited CH4 formation completely from the start. Supplementation of a stoichiometric mixture of H2/CO2 yielded 87.5–95.5% CH4 content during the second, stabilized P2M generation period in all reactors.
A comparison of the performance using a fed-batch and “H2 flow-through” reactor arrangement reveals the advantages of this P2M approach relative to the widely studied flow-through CSTR (continuous stirred-tank reactor) reactor configuration [29,60,61] (Table 2). The fed-batch reactors upgraded the gas mixture to 95% bioCH4 purity, which is close to the methane content required for direct injection into the natural gas grid. The yield of CH4 production from the injected H2 doubled in comparison to the values reported in [29,62]. The H2 injection rate reached 1300 mL·L−1·d−1 in the reactors receiving the highest daily H2 dose and practically all the injected H2 was consumed by the microbial community for CH4 production. Moreover, the community apparently did not demand additional nutrients and/or minerals to sustain the biological activity of the enriched community as opposed to the systems utilizing a single HMA strain [22]. Taking these advantages together (Table 2), the fed-batch reactor arrangement and the intermittent gas feeding are recommended to become a novel, efficient P2M strategy as opposed to the flow-through P2M reactors. The increased residence time of H2/CO2 in contact with the aqueous bulk, containing the key living and actively functioning microbial catalysts, offers improved reactor performance although the technology is still far from being optimized. The costs of installation and operation of a fed-batch type P2M reactor would be substantially lower than that of a more sophisticated flow-through in situ or ex situ reactors equipped with online GC monitoring, fine-tuned process control, gas recirculation and management systems [29,60,61].
The results corroborated the existence of a delicate balance between homoacetogenesis and methanogenesis, which is closely regulated by the H2 level within the system [20,62,63]. The time resolution of sampling, analytical measurements, and the complexity of the biochemical reactions in the system did not allow calculation of a precise mass balance in this system. Nevertheless, the data are compatible with the assumption that no additional metabolic pathway contributed considerably to the outcome of the P2M reaction by the mixed anaerobic thermophilic microbial communities. Detailed mapping of the events in time within the P2M reactors is needed as part of future research efforts to determine the boundaries and precise operational parameters, kinetics of dissolution of the gases and the development of H2 concentration gradients in the aqueous medium, etc. This is important for planning and management of the large scale P2M facilities based on mixed microbial systems, which should be competitive compared to the microbiologically well-defined P2M technologies using a pure HMA culture, particularly if the savings in operational costs are taken into account [7,15,16].
Two effects causing selection pressure could be distinguished in these experiments. First, there was an alteration in the composition of the community composition as the result of starvation, i.e., incubation of the community under anaerobic condition for an extended period of time. Second and added to the starvation stress, the community responded to the addition of varying amounts of H2/CO2 so that certain genera were enriched, while others tended to diminish.
Among Bacteria, members of the genera Actinotalea (log2FC = 5.1) and Cellulomonas (log2FC = 2.4) were apparently the ones to respond successfully to the selection pressure brought about by starvation. Actinotalea are facultative anaerobes [64,65] and thus carry out versatile metabolic pathways, whereas members of the genus Cellulomonas are superior in polysaccharide decomposition [66]. Since no organic material was supplied to support their heterotrophic growth, they could obtain organic substrate from the deceased members of the bacterial community. It is noteworthy that some genera present in low abundance (≤0.5%) in the inoculum, e.g., Syntrophaceticus, Sphaerobacter, Thermacetogenium, and Mycobacterium also managed to avoid extinction under the starvation conditions [67,68,69,70]. Some of these and the genus Acetomicrobium exhibited similar behavior and are suspected or verified SAOBs [71].
The methanogenic genus, Methanosarcina, apparently did not suffer much from starvation stress (Table 1) and maintained its predominance in the AD community [59,72,73]. The abundance of the genus Methanothermobacter was also largely unaffected by the starvation stress. The hydrogenotrophic methanogen genus Methanobacterium took a surprisingly pronounced advantage under starvation condition, similarly to a recent finding at mesophilic temperature [49]. This taxon increased its relative abundance from a meager 0.3% to 20% under starvation conditions. Future metatranscriptomic studies should reveal the metabolic changes responsible for this outstanding behavior.
The changes in the abundances of the various taxa upon supplying the starving reactors with various daily dosages of H2/CO2 is of particular interest with regard to the development and microbiological management of a stable and efficient microbial P2M community. The differences in abundances between the microbial communities subjected to starvation stress and equally starved and H2/CO2-fed communities are expressed at logarithmic scale (log2 fold change, Figure 6). The aim of this comparison was to separate the alterations in community composition due to H2/CO2 supply and starvation. It should therefore be noted that the lengths of the horizontal columns do not indicate absolute or relative abundances of any given taxon, these columns show only the differences between starving and H2/CO2-fed reactors.
Practically none of the most abundant 20 bacterial genera responded with elevated growth (Figure 6) to the daily H2/CO2 dosage into the headspace of the reactors although the microbes in the fed-batch reactors consumed the injected H2 completely within 16–24 h at all three H2 concentrations. The genus Ureibacillus did not follow the general trend, but its representation was severely decimated from 9.1% to 0.05% upon starvation (Table 1), therefore it became negligible and could not interfere with the life of the community. Moderate apparent inhibition by H2/CO2 was observed in the case of all bacterial genera (Figure 6). This was likely due to the fact that relative abundance values were used in the calculation of log2FC and the predominance of the hydrogenotrophic genus Methanothermobacter, increased substantially in the H2/CO2-fed reactors.
Nevertheless, the presence of SAOBs among the most abundant 20 bacterial strains is noteworthy and the suspected SAOB-methanogen syntrophic contribution to the improvement of the P2M conversion demands further detailed study involving metatranscriptomics.

5. Conclusions

There are two “take home” messages from the studies reported in this paper. First, the fed-batch reactor configuration should be considered as an alternative to the widely used flow-through arrangement. The flow-through reactors are fine-tuned to minimize H2 loss in the effluent gas, therefore very low H2 injection rates are employed, which limits the attainable CH4 production rates. In addition, the infrastructure and delicate process control makes these approaches costly. Although a fed-batch P2M reactor works intermittently, the added benefits, i.e., high H2 loading rate, complete conversion of H2/CO2 to CH4 and low operation costs, can make this approach appealing for future scale-up development.
Second, we demonstrated that the genus Methanothermobacter is enriched as the sole predominant methanogenic taxon under the selection pressure of the P2M conditions. Consequently, a mixed microbial community from a thermophilic AD plant can simply be used as catalyst in the P2M reactors after a few days/weeks of enrichment period and maintenance of microbiologically pure conditions; addition of expensive complex medium and micro nutrients are not necessary. In so doing, the costs of the P2M operation at an industrial scale can be reduced substantially.
In future studies the economic analysis and the larger scale testing of the proposed novel P2M process are required.

Author Contributions

Conceptualization, K.L.K. and Z.B.; methodology, M.S. and R.W.; formal analysis and experimental investigation, M.S., G.M., and R.W.; resources, K.L.K. and Z.B.; data curation, R.W.; writing—original draft preparation, M.S. and K.L.K.; writing—review and editing, K.L.K. and Z.B.; supervision, G.R.; project administration, Z.B.; funding acquisition, K.L.K., G.R., R.W., G.M. All authors have read and agreed to the published version of the manuscript.

Funding

This work was supported by the European Regional Development Fund to projects IN-NOV-397-13/PALY-2020 (PI: G.R), 2020-1.1.2-PIACI KFI (PI: Z.B.), and by the bilateral scientific collaboration agreement 2019-2.1.13-TÉT_IN-2020-00016 (PI: K.L.K.). R.W. (PD132145), Z.B. (FK 123902) and G.M. (FK123899) received support from the National Research, Development and In-novation Office (NKFIH), Hungary. G.M. was also supported by the Lendület-Programme of the Hungarian Academy of Sciences (LP2020-5/2020).

Institutional Review Board Statement

Not applicable.

Informed Consent Statement

Not applicable.

Data Availability Statement

The raw sequence data obtained in this project have been uploaded on the NCBI SRA database under the project name: BioProject ID: PRJNA758802.

Conflicts of Interest

The authors declare no conflict of interest. The funders had no role in the design of the study; in the collection, analyses, or interpretation of data; in the writing of the manuscript, or in the decision to publish the results.

References

  1. REN21. Renewables 2020 Global Status Report. 2020. Available online: https://www.ren21.net/reports/global-status-report/?gclid=CjwKCAjwoP6LBhBlEiwAvCcthM9n4BM6oHikcrY_nWbzC811LiRCEiGVVkKEgzPT2NcaGYXiUiOBkhoCLR4QAvD_BwE (accessed on 1 November 2021).
  2. Fawzy, S.; Osman, A.I.; Doran, J.; Rooney, D.W. Strategies for mitigation of climate change: A review. Environ. Chem. Lett. 2020, 18, 2069–2094. [Google Scholar] [CrossRef]
  3. Østergaard, P.A. Comparing electricity, heat and biogas storages’ impacts on renewable energy integration. Energy 2012, 37, 255–262. [Google Scholar] [CrossRef]
  4. Lund, P.D.; Lindgren, J.; Mikkola, J.; Salpakari, J. Review of energy system flexibility measures to enable high levels of variable renewable electricity. Renew. Sustain. Energy Rev. 2015, 45, 785–807. [Google Scholar] [CrossRef] [Green Version]
  5. Ketter, W.; Collins, J.; Saar-Tsechansky, M.; Marom, O. Information Systems for a Smart Electricity Grid. ACM Trans. Manag. Inf. Syst. 2018, 9, 1–22. [Google Scholar] [CrossRef]
  6. Holladay, J.D.; Hu, J.; King, D.L.; Wang, Y. An overview of hydrogen production technologies. Catal. Today 2009, 139, 244–260. [Google Scholar] [CrossRef]
  7. Thema, M.; Bauer, F.; Sterner, M. Power-to-Gas: Electrolysis and methanation status review. Renew. Sustain. Energy Rev. 2019, 112, 775–787. [Google Scholar] [CrossRef]
  8. Sharma, S.; Ghoshal, S.K. Hydrogen the future transportation fuel: From production to applications. Renew. Sustain. Energy Rev. 2015, 43, 1151–1158. [Google Scholar] [CrossRef]
  9. Herzog, A.; Tatsutani, M. A hydrogen future ? An Economic and Environmental Assessment of Hydrogen Production Pathways. Nat. Resour. Def. Counc. 2005, 23. [Google Scholar]
  10. Viswanathan, B. Hydrogen Storage. Energy Sources 2017, 185–212. [Google Scholar] [CrossRef]
  11. Andrei, H.; Badea, C.A.; Andrei, P.; Spertino, F. Energetic-Environmental-Economic Feasibility and Impact. Energies 2020, 14, 100. [Google Scholar] [CrossRef]
  12. Campana, P.E.; Mainardis, M.; Moretti, A.; Cottes, M. 100% renewable wastewater treatment plants: Techno-economic assessment using a modelling and optimization approach. Energy Convers. Manag. 2021, 239, 114214. [Google Scholar] [CrossRef]
  13. Luo, G.; Johansson, S.; Boe, K.; Xie, L.; Zhou, Q.; Angelidaki, I. Simultaneous hydrogen utilization and in situ biogas upgrading in an anaerobic reactor. Biotechnol. Bioeng. 2012, 109, 1088–1094. [Google Scholar] [CrossRef] [PubMed]
  14. Global Methane Initiative. Global Methane Emissions and Mitigation Opportunities; Global Methane Initiative: Washington, DC, USA, 2010; Volume 2020, pp. 1–4. Available online: https://www.globalmethane.org/documents/gmi-mitigation-factsheet.pdf (accessed on 1 November 2021).
  15. Angelidaki, I.; Treu, L.; Tsapekos, P.; Luo, G.; Campanaro, S.; Wenzel, H.; Kougias, P.G. Biogas upgrading and utilization: Current status and perspectives. Biotechnol. Adv. 2018, 36, 452–466. [Google Scholar] [CrossRef] [Green Version]
  16. Piechota, G. Biogas/Biomethane Quality and Requirements for Combined Heat and Power (CHP) Units/Gas Grids with a Special Focus on Siloxanes-a Short Review. Sustain. Chem. Eng. 2022, 3, 1–10. [Google Scholar]
  17. Piechota, G. Multi-step biogas quality improving by adsorptive packed column system as application to biomethane upgrading. J. Environ. Chem. Eng. 2021, 9, 105944. [Google Scholar] [CrossRef]
  18. Angelidaki, I.; Karakashev, D.; Batstone, D.J.; Plugge, C.M.; Stams, A.J.M. Biomethanation and Its Potential, 1st ed.; Elsevier Inc.: Amsterdam, The Netherlands, 2011. [Google Scholar] [CrossRef]
  19. Götz, M.; Lefebvre, J.; Mörs, F.; Koch, A.M.; Graf, F.; Bajohr, S.; Reimert, R.; Kolb, T. Renewable Power-to-Gas: A technological and economic review. Renew. Energy 2016, 85, 1371–1390. [Google Scholar] [CrossRef] [Green Version]
  20. Rafrafi, Y.; Laguillaumie, L.; Dumas, C. Biological Methanation of H2 and CO2 with Mixed Cultures: Current Advances, Hurdles and Challenges. Waste Biomass Valorization 2020, 12, 5259–5282. [Google Scholar] [CrossRef]
  21. Wahid, R.; Horn, S.J. Impact of operational conditions on methane yield and microbial community composition during biological methanation in in situ and hybrid reactor systems. Biotechnol. Biofuels 2021, 14, 170. [Google Scholar] [CrossRef]
  22. Adnan, A.I.; Ong, M.Y.; Nomanbhay, S.; Chew, K.W. Technologies for Biogas Upgrading to Biomethane: A Review. Bioengineering 2019, 6, 92. [Google Scholar] [CrossRef] [PubMed] [Green Version]
  23. Rusmanis, D.; O’Shea, R.; Wall, D.M.; Murphy, J.D. Biological hydrogen methanation systems–an overview of design and efficiency. Bioengineered 2019, 10, 604–634. [Google Scholar] [CrossRef] [Green Version]
  24. Rittmann, S.; Seifert, A.; Herwig, C. Essential prerequisites for successful bioprocess development of biological CH4 production from CO2 and H2. Crit. Rev. Biotechnol. 2015, 35, 141–151. [Google Scholar] [CrossRef] [PubMed]
  25. Peillex, J.P.; Fardeau, M.L.; Boussand, R.; Navarro, J.M.; Belaich, J.P. Growth of Methanococcus thermolithotrophicus in batch and continuous culture on H2 and CO2: Influence of agitation. Appl. Microbiol. Biotechnol. 1988, 29, 560–564. [Google Scholar] [CrossRef]
  26. de Poorter, L.M.I.; Geerts, W.J.; Keltjens, J.T. Coupling of Methanothermobacter thermautotrophicus methane formation and growth in fed-batch and continuous cultures under different H2 gassing regimens. Appl. Environ. Microbiol. 2007, 73, 740–749. [Google Scholar] [CrossRef] [Green Version]
  27. Strevett, K.A.; Vieth, R.F.; Grasso, D. Chemo-autotrophic biogas purification for methane enrichment: Mechanism and kinetics. Chem. Eng. J. Biochem. Eng. J. 1995, 58, 71–79. [Google Scholar] [CrossRef]
  28. Szuhaj, M.; Ács, N.; Tengölics, R.; Bodor, A.; Rákhely, G.; Kovács, K.L.; Bagi, Z. Conversion of H2and CO2to CH4and acetate in fed-batch biogas reactors by mixed biogas community: A novel route for the power-to-gas concept. Biotechnol. Biofuels 2016, 9, 102. [Google Scholar] [CrossRef] [Green Version]
  29. Bassani, I.; Kougias, P.G.; Treu, L.; Angelidaki, I. Biogas Upgrading via Hydrogenotrophic Methanogenesis in Two-Stage Continuous Stirred Tank Reactors at Mesophilic and Thermophilic Conditions. Environ. Sci. Technol. 2015, 49, 12585–12593. [Google Scholar] [CrossRef]
  30. Bassani, I.; Kougias, P.G.; Treu, L.; Porté, H.; Campanaro, S.; Angelidaki, I. Optimization of hydrogen dispersion in thermophilic up-flow reactors for ex situ biogas upgrading. Bioresour. Technol. 2017, 234, 310–319. [Google Scholar] [CrossRef] [PubMed]
  31. Agneessens, L.M.; Ottosen, L.D.M.; Voigt, N.V.; Nielsen, J.L.; de Jonge, N.; Fischer, C.H.; Kofoed, M.V.W. In-situ biogas upgrading with pulse H2additions: The relevance of methanogen adaption and inorganic carbon level. Bioresour. Technol. 2017, 233, 256–263. [Google Scholar] [CrossRef]
  32. Luo, G.; Angelidaki, I. Integrated biogas upgrading and hydrogen utilization in an anaerobic reactor containing enriched hydrogenotrophic methanogenic culture. Biotechnol. Bioeng. 2012, 109, 2729–2736. [Google Scholar] [CrossRef]
  33. Strübing, D.; Huber, B.; Lebuhn, M.; Drewes, J.E. High performance biological methanation in thermophilic anaerobic trickle bed reactors. Bioresour. Technol. 2017, 245, 1176–1183. [Google Scholar] [CrossRef] [PubMed]
  34. Rachbauer, L.; Beyer, R.; Bochmann, G.; Fuchs, W. Characteristics of adapted hydrogenotrophic community during biomethanation. Sci. Total Environ. 2017, 595, 912–919. [Google Scholar] [CrossRef] [PubMed]
  35. Ács, N.; Szuhaj, M.; Wirth, R.; Bagi, Z.; Maróti, G.; Rákhely, G.; Kovács, K.L. Microbial Community Rearrangements in Power-to-Biomethane Reactors Employing Mesophilic Biogas Digestate. Front. Energy Res. 2019, 7, 132. [Google Scholar] [CrossRef]
  36. Bassani, I.; Kougias, P.G.; Angelidaki, I. In-situ biogas upgrading in thermophilic granular UASB reactor: Key factors affecting the hydrogen mass transfer rate. Bioresour. Technol. 2016, 221, 485–491. [Google Scholar] [CrossRef] [PubMed] [Green Version]
  37. Afgan, E.; Baker, D.; van den Beek, M.; Blankenberg, D.; Bouvier, D.; Čech, M.; Chilton, J.; Clements, D.; Coraor, N.; Eberhard, C.; et al. The Galaxy platform for accessible, reproducible and collaborative biomedical analyses: 2016 update. Nucleic Acids Res. 2016, 44, W3–W10. [Google Scholar] [CrossRef] [Green Version]
  38. Schmieder, R.; Edwards, R. Quality control and preprocessing of metagenomic datasets. Bioinformatics 2011, 27, 863–864. [Google Scholar] [CrossRef] [Green Version]
  39. Menzel, P.; Ng, K.L.; Krogh, A. Fast and sensitive taxonomic classification for metagenomics with Kaiju. Nat. Commun. 2016, 7, 11257. [Google Scholar] [CrossRef] [Green Version]
  40. Mende, D.R.; Letunic, I.; Huerta-Cepas, J.; Li, S.S.; Forslund, K.; Sunagawa, S.; Bork, P. ProGenomes: A resource for consistent functional and taxonomic annotations of prokaryotic genomes. Nucleic Acids Res. 2017, 45, D529–D534. [Google Scholar] [CrossRef] [Green Version]
  41. Letunic, I.; Bork, P. Interactive Tree of Life (iTOL) v4: Recent updates and new developments. Nucleic Acids Res. 2019, 47, 256–259. [Google Scholar] [CrossRef] [Green Version]
  42. Siriwongrungson, V.; Zeng, R.J.; Angelidaki, I. Homoacetogenesis as the alternative pathway for H2 sink during thermophilic anaerobic degradation of butyrate under suppressed methanogenesis. Water Res. 2007, 41, 4204–4210. [Google Scholar] [CrossRef]
  43. Bouanane-Darenfed, A.; Hania, W.B.; Cayol, J.L.; Ollivier, B.; Fardeau, M.L. Reclassification of acetomicrobium faecale as caldicoprobacter faecalis comb. Nov. Int. J. Syst. Evol. Microbiol. 2015, 65, 3286–3288. [Google Scholar] [CrossRef]
  44. Avdiyuk, K.V. Keratinolytic Enzymes: Producers, Physical and Chemical Properties. Application for Biotechnology. Biotechnol. Acta 2019, 12, 27–45. [Google Scholar] [CrossRef] [Green Version]
  45. Fortina, M.G.; Pukall, R.; Schumann, P.; Mora, D.; Parini, C.; Manachini, P.L.; Stackebrandt, E. Ureibacillus gen. nov., a new genus to accommodate Bacillus thermosphaericus (Andersson et al. 1995), emendation of Ureibacillus thermosphaericus and description of Ureibacillus terrenus sp. nov. Int. J. Syst. Evol. Microbiol. 2001, 51, 447–455. [Google Scholar] [CrossRef]
  46. Weon, H.Y.; Lee, S.Y.; Kim, B.Y.; Noh, H.J.; Schumann, P.; Kim, J.S.; Kwon, S.W. Ureibacillus composti sp. nov. and Ureibacillus thermophilus sp. nov., isolated from livestock-manure composts. Int. J. Syst. Evol. Microbiol. 2007, 57, 2908–2911. [Google Scholar] [CrossRef]
  47. Maus, I.; Koeck, D.E.; Cibis, K.G.; Hahnke, S.; Kim, Y.S.; Langer, T.; Kreubel, J.; Erhard, M.; Bremges, A.; Off, S.; et al. Unraveling the microbiome of a thermophilic biogas plant by metagenome and metatranscriptome analysis complemented by characterization of bacterial and archaeal isolates. Biotechnol. Biofuels 2016, 9, 1–28. [Google Scholar] [CrossRef] [Green Version]
  48. Shiratori, H.; Ohiwa, H.; Ikeno, H.; Ayame, S.; Kataoka, N.; Miya, A.; Beppu, T.; Ueda, K. Lutispora thermophila gen. nov., sp. nov., a thermophilic, spore-forming bacterium isolated from a thermophilic methanogenic bioreactor digesting municipal solid wastes. Int. J. Syst. Evol. Microbiol. 2008, 58, 964–969. [Google Scholar] [CrossRef] [Green Version]
  49. Logroño, W.; Popp, D.; Kleinsteuber, S.; Sträuber, H.; Harms, H.; Nikolausz, M. Microbial resource management for ex situ biomethanation of hydrogen at alkaline ph. Microorganisms 2020, 8, 614. [Google Scholar] [CrossRef] [PubMed] [Green Version]
  50. Wasserfallen, A.; Nölling, J.; Pfister, P.; Reeve, J.; de Macario, E.C. Phylogenetic analysis of 18 thermophilic Methanobacterium isolates supports the proposals to create a new genus, Methanothermobacter gen. nov., and to reclassify several isolates in three species, Methanothermobacter thermautotrophicus comb. nov., Methano. Int. J. Syst. Evol. Microbiol. 2000, 50, 43–53. [Google Scholar] [CrossRef] [PubMed]
  51. Cao, Y.; Wang, L.; Qian, Y.; Xu, Y.; Wu, H.; Zhang, J.; Huang, H.; Chang, Z. Contributions of thermotolerant bacteria to organic matter degradation under a hyperthermophilic pretreatment process during chicken manure composting. BioResources 2019, 14, 6747–6766. [Google Scholar] [CrossRef]
  52. Gorliczay, E.; Boczonádi, I.; Kiss, N.É.; Tóth, F.A.; Pabar, S.A.; Biró, B.; Kovács, L.R.; Tamás, J. Microbiological effectivity evaluation of new poultry farming organic waste recycling. Agric 2021, 11, 683. [Google Scholar] [CrossRef]
  53. Vaz-Moreira, I.; Faria, C.; Nobre, M.F.; Schumann, P.; Nunes, O.C.; Manaia, C.M. Paenibacillus humicus sp. nov., isolated from poultry litter compost. Int. J. Syst. Evol. Microbiol. 2007, 57, 2267–2271. [Google Scholar] [CrossRef] [Green Version]
  54. McInerney, M.J.; Bryant, M.P.; Hespell, R.B.; Costerton, J.W. Syntrophomonas wolfei gen. nov. sp. nov., an anaerobic, syntrophic, fatty acid-oxidizing bacterium. Appl. Environ. Microbiol. 1981, 41, 1029–1039. [Google Scholar] [CrossRef] [Green Version]
  55. Westerholm, M.; Roos, S.; Schnürer, A. Syntrophaceticus schinkiigen. nov., sp. nov., an anaerobic, syntrophic acetate-oxidizing bacterium isolated from a mesophilic anaerobic filter. FEMS Microbiol. Lett. 2010, 309, 100–104. [Google Scholar] [CrossRef] [Green Version]
  56. United Nations. Adoption of the Paris Agreement, Proposal by the President, Draft decision. In Proceedings of the Twenty-First Session of the Conference of the Parties (COP 21), Paris, France, 11 December 2015; Volume 32, p. 21932. Available online: http://unfccc.int/resource/docs/2015/cop21/eng/l09r01.pdf (accessed on 1 November 2021).
  57. Csedő, Z.; Zavarkó, M.; Vaszkun, B.; Koczkás, S. Hydrogen Economy Development Opportunities by Inter-Organizational Digital Knowledge Networks. Sustainability 2021, 13, 9194. [Google Scholar] [CrossRef]
  58. Kakuk, B.; Wirth, R.; Maróti, G.; Szuhaj, M.; Rakhely, G.; Laczi, K.; Kovács, K.L.; Bagi, Z. Early response of methanogenic archaea to H2 as evaluated by metagenomics and metatranscriptomics. Microb. Cell Fact. 2021, 20, 127. [Google Scholar] [CrossRef] [PubMed]
  59. Kleinsteuber, S. Metagenomics of Methanogenic Communities in Anaerobic Digesters. In Biogenesis of Hydrocarbons Handbook of Hydrocarbon and Lipid Microbiology; Springer: Cham, Switzerland, 2019; pp. 337–359. [Google Scholar] [CrossRef]
  60. Corbellini, V.; Kougias, P.G.; Treu, L.; Bassani, I.; Malpei, F.; Angelidaki, I. Hybrid biogas upgrading in a two-stage thermophilic reactor. Energy Convers. Manag. 2018, 168, 1–10. [Google Scholar] [CrossRef]
  61. Mulat, D.G.; Mosbæk, F.; Ward, A.J.; Polag, D.; Greule, M.; Keppler, F.; Nielsen, J.L.; Feilberg, A. Exogenous addition of H2for an in situ biogas upgrading through biological reduction of carbon dioxide into methane. Waste Manag. 2017, 68, 146–156. [Google Scholar] [CrossRef] [PubMed]
  62. Bagi, Z.; Ács, N.; Böjti, T.; Kakuk, B.; Rákhely, G.; Strang, O.; Szuhaj, M.; Wirth, R.; Kovács, K.L. Biomethane: The energy storage, platform chemical and greenhouse gas mitigation target. Anaerobe 2017, 46, 13–22. [Google Scholar] [CrossRef]
  63. Agneessens, L.M.; Ottosen, L.D.M.; Andersen, M.; Olesen, C.B.; Feilberg, A.; Kofoed, M.V.W. Parameters affecting acetate concentrations during in-situ biological hydrogen methanation. Bioresour. Technol. 2018, 258, 33–40. [Google Scholar] [CrossRef]
  64. Waldron, C.R.; Becker-Vallone, C.A.; Eveleigh, D.E. Isolation and characterization of a cellulolytic actinomycete Microbispora bispora. Appl. Microbiol. Biotechnol. 1986, 24, 477–486. [Google Scholar] [CrossRef]
  65. Li, Y.; Chen, F.; Dong, K.; Wang, G. Actinotalea ferrariae sp. nov., isolated from an iron mine, and emended description of the genus Actinotalea. Int. J. Syst. Evol. Microbiol. 2013, 63, 3398–3403. [Google Scholar] [CrossRef] [Green Version]
  66. Stackebrandt, E.; Kandler, O. Taxonomy of the genus Cellulomonas, based on phenotypic characters and deoxyribonucleic acid-deoxyribonucleic acid homology, and proposal of seven neotype strains. Int. J. Syst. Bacteriol. 1979, 29, 273–282. [Google Scholar] [CrossRef] [Green Version]
  67. Kushkevych, I.; Cejnar, J.; Vítězová, M.; Vítěz, T.; Dordević, D.; Bomble, Y. Occurrence of thermophilic microorganisms in different full scale biogas plants. Int. J. Mol. Sci. 2020, 21, 283. [Google Scholar] [CrossRef] [Green Version]
  68. Nouioui, I.; Carro, L.; García-López, M.; Meier-Kolthoff, J.P.; Woyke, T.; Kyrpides, N.C.; Pukall, R.; Klenk, H.P.; Goodfellow, M.; Göker, M. Genome-based taxonomic classification of the phylum actinobacteria. Front. Microbiol. 2018, 9, 1–119. [Google Scholar] [CrossRef] [Green Version]
  69. Hattori, S.; Kamagata, Y.; Hanada, S. A Strictly Anaerobic, Thermophilic, Syntrophic Acetate-Oxidizing Bacterium. Int. J. Syst. Evol. Microbiol. 2000, 50, 1601–1609. [Google Scholar] [CrossRef] [PubMed]
  70. Sattar, A.; Zakaria, Z.; Abu, J.; Aziz, S.A.; Rojas-Ponce, G. Isolation of Mycobacterium avium and other nontuberculous mycobacteria in chickens and captive birds in peninsular Malaysia. BMC Vet. Res. 2021, 17, 13. [Google Scholar] [CrossRef] [PubMed]
  71. Dyksma, S.; Jansen, L.; Gallert, C. Syntrophic acetate oxidation replaces acetoclastic methanogenesis during thermophilic digestion of biowaste. Microbiome 2020, 8, 105. [Google Scholar] [CrossRef] [PubMed]
  72. FitzGerald, J.A.; Allen, E.; Wall, D.M.; Jackson, S.A.; Murphy, J.D.; Dobson, A.D.W. Methanosarcina play an important role in anaerobic co-digestion of the seaweed ulva lactuca: Taxonomy and predicted metabolism of functional microbial communities. PLoS ONE 2015, 10, e0142603. [Google Scholar] [CrossRef] [PubMed] [Green Version]
  73. Silva, T.C.D.; Isha, A.; Chandra, R.; Vijay, V.K.; Subbarao, P.M.V.; Kumar, R.; Chaudhary, V.P.; Singh, H.; Khan, A.A.; Tyagi, V.K.; et al. Enhancing methane production in anaerobic digestion through hydrogen assisted pathways—A state-of-the-art review. Renew. Sustain. Energy Rev. 2021, 151, 111536. [Google Scholar] [CrossRef]
Figure 1. Cumulative biomethane productions in time from 20 mL nominal H2 volume (=18.0 v/v% H2, red curve), 40 mL nominal H2 volume (=31.5 v/v% H2, blue curve) and 60 mL nominal H2 volume (= 43.5 v/v% H2, black curve) and concomitant stoichiometric CO2. The control, i.e., only daily N2 gas replacement of the head-space, is shown in green. The symbol sizes indicate the error of measurement.
Energies 14 07336 g001
Figure 2. The residual CO2 levels measured in the reactors’ head-space. Color codes as in Figure 1: green = control reactors, red = low H2 daily dosage (20 mL H2 nominal volume), blue = medium H2 daily dosage (40 mL H2 nominal volume), black = high daily H2 dosage (60 mL H2 nominal volume). The arrows indicate the time points when excess CO2 was delivered in order to remedy system imbalance.
Energies 14 07336 g002
Figure 3. The alterations in pH values of the aqueous phase of the reactors: green = control reactors, red = 20 mL H2 nominal volume daily dosages, blue = 40 mL H2 nominal volume daily dosages, black = 60 mL H2 nominal volume daily dosages and concomitant stoichiometric CO2.
Energies 14 07336 g003
Figure 4. The volatile fatty acids (VFA) productions of the P2M reactors: green = control reactors, red = 20 mL H2 nominal volume daily dosages, blue = 40 mL H2 nominal volume daily dosages, black = 60 mL H2 nominal volume daily dosages and concomitant stoichiometric CO2.
Energies 14 07336 g004
Figure 5. The microbial diversity map is plotted in the central taxonomic tree and the names of genera corresponding to the branches. The average relative abundances of the taxa in the various reactors are shown in the set of the outer 5 rings: starting community; control (= no H2 feeding) community; 20, 40, and 60 mL H2 nominal volume daily dosages, respectively; color scale in the upper left corner. Set of 4 outermost rings: comparison of the logarithmic fold change (log2FC) values between the start community and the control, 20, 40, and 60 mL H2 nominal volume daily dosages, respectively, and concomitant stoichiometric CO2 (color scale in the lower left corner).
Energies 14 07336 g005
Figure 6. The logarithmic fold change (log2FC) abundance alterations in the most abundant 23 genera at the end of the experiment. The control vs. starting community log2FC values are plotted in green columns, and the log2FC between the control vs. the average of H2/CO2-fed reactors are shown in red columns.
Energies 14 07336 g006
Table 1. The changes in relative abundances of the 23 most abundant microbial taxa upon various treatments. START: composition of the initial thermophilic AD effluent; Control: only daily N2 gas replacement of the head-space; 20 mL H2 reactor: 20 mL nominal H2 volume (=18.0 v/v% H2); 40 mL H2 reactor: 40 mL nominal H2 volume (=31.5 v/v% H2); 60 mL H2 reactor: 60 mL nominal H2 volume (=43.5 v/v% H2) and concomitant stoichiometric CO2. Color codes in the cells of taxon names are as follows: red—Archaea genera; white—the abundance was not affected by H2/CO2 addition; yellow—the abundance of genera decreased at all H2/CO2 concentrations as a result of starvation stress; green—genera responding positively to starvation and to moderate H2/CO2 daily dosage. Red background color in the log2FC cells indicates enrichment, blue background color denotes diminishing tendency for the given taxon. The most striking changes are the boxed in heavy borderlines.
TaxonSTARTControl20 mL H2 Reactor40 mL H2 Reactor60 mL H2 Reactor
Methanosarcina21.6922.8015.2413.709.35
Caldicoprobacter19.897.1212.329.904.20
Ureibacillus9.100.050.190.120.05
Methanothermobacter8.376.6029.4737.5365.26
Clostridium4.521.481.021.010.78
Lutispora2.280.290.170.160.13
Desulfotomaculum1.802.181.411.300.78
Moorella1.531.260.850.730.43
Herbinix1.350.500.270.280.22
Lysinibacillus1.330.100.100.100.10
Limnochorda1.311.090.630.500.23
Acetomicrobium1.283.111.541.320.78
Bacillus1.230.500.350.310.16
Paenibacillus1.160.600.400.390.23
Syntrophomonas1.030.360.220.210.13
Tepidanaerobacter1.010.650.340.250.17
Syntrophaceticus0.571.481.791.550.76
Sphaerobacter0.571.600.670.760.36
Thermacetogenium0.551.111.241.180.51
Mycobacterium0.371.690.800.780.55
Methanobacterium0.2819.9910.999.305.72
Actinotalea0.105.095.325.392.10
Cellulomonas0.102.442.652.661.05
Table 2. Comparisons of process parameters determined in this study to relevant reported performance characteristics. “n.d.” stands for “not determined”. The “A”, “B” and “C” reactor groups indicate the low, medium and high H2 daily dosage conditions as in Figure 1.
Bassani et al. (2015)Corbellini et al. (2018)Mulat et al. (2017)Present Work
ControlH2 AddedControlCSTRUASBControlH2 AddedControl“A” Reactor“B” Reactor“C” Reactor
Biogas composition (%) After stabilizationAfter stabilizationAfter stabilization
CH467.1 ± 0.885.1 ± 3.769.2 ± 186.4 ± 1.091.0 ± 2.065.2 ± 9.889.4 ± 0.438.57 ± 1.9687.48 ± 5.8695.48 ± 5.0194.13 ± 4.90
CO232.9 ± 0.96.6 ± 0.930.7 ± 110.7 ± 3.67.0 ± 1.034.8 ± 9.810.5 ± 0.461.43 ± 8.516.69 ± 2.311.56 ± 1.001.04 ± 0.56
H20.08.3 ± 3.60.03.5 ± 1.52.0 ± 1.00.00.00.02.99 ± 1.611.90 ± 0.903.49 ± 2.50
Gas production
(mL·L−1·d−1)
CH4247 ± 27359 ± 20n.d.n.d.352.53 ± 5322426719.8 ± 0.4131.2 ± 14.4197.3 ± 4.4270.7 ± 7.4
CH4 from H20112.00.0n.d.n.d.0.0127.00.0111.4177.5250.9
CO2121 ± 1528 ± 5n.d.n.d.28.03 ± 4.7119.631.431.0 ± 3.316.1 ± 0.711.1 ± 0.88.5 ± 1.8
H2 injection rate0.0510 ± 320.0550n.d.0.0507 ± 300.0540.3 ± 71.6945 ± 51.31306 ± 45.5
(mL·L−1·d−1)
H2 consumption0.0470 ± 350.0n.d.n.d.0.0507 ± 300.0509.00 ± 1.67854.9 ± 3.481168.41 ± 4.98
(mL·L−1·d−1)
H2 consumption0.092.200.0n.d.n.d.0.0100.000.099.0599.4098.90
(%)
pH7.82 ± 0.168.49 ± 0.04n.d.8.6 ± 0.08.1 ± 07.49 ± 0.177.00-8.008.57 ± 0.198.75 ± 0.118.88 ± 0.098.52 ± 0.11
Organic acids (g·L−1)1.18 ± 0.840.38 ± 0.070.22.70.1n.d.n.d.n.d.n.d.n.d.n.d.
Acetaten.d.n.d.n.d.n.d.n.d.n.d.n.d.0.000.060.040.04
Propionaten.d.n.d.n.d.n.d.n.d.n.d.n.d.0.050.050.030.04
Publisher’s Note: MDPI stays neutral with regard to jurisdictional claims in published maps and institutional affiliations.

