Abstract
This work shows the results obtained from studying the influence of equivalent circuit resistances on three-phase induction motors. The stator resistance, rotor resistance, and iron losses resistance affect the different motor operating variables (output power, current, speed, power factor, starting ratios, and maximum torque). These influences have been quantified, paying particular attention to the losses affected and their impact on efficiency. The study carried out does not apply optimization techniques. It evaluates the different influences of the equivalent circuit’s different resistances on its operation by evaluating applicable constructive modifications concerning available motors. The work has been limited to three-phase induction motors up to 50 kW and low voltage, with the nominal powers of the selected motors being 0.25 kW, 1.5 kW, 7.5 kW, 22 kW, and 45 kW. The tools used to carry out the study are analyzing the equivalent circuit and the simulation of the electromagnetic structure using a finite-element program. The variations proposed in each resistance for all the motors studied is not purely theoretical, as it is based on applying feasible constructive modifications, appropriately analyzed and simulated. These modifications are the variation of the conductor diameter in the stator coils, the change of the section of the rotor cage, and the selection of different ferromagnetic steel types.
1. Introduction
Three-phase induction motors are the most widely used in industrial applications, especially in pumps, fans, compressors, manufacturing, and processing of materials and refrigeration equipment [1]. Different market studies establish that the drives that use alternating current motors are approximately 75% of the total installed motors, where 89% correspond to motors with power up to 1 kW and 10% to powers up to 375 kW. That small and medium power motors are the principal consumers of electrical energy globally [2].
For these reasons, the influence of the efficiency on these motors is of great importance in the efficient use of electrical energy, being one more vector to consider in ecodesign and sustainable development policies associated with electrical energy consumption [3]. The study proposed in this article is limited to motors with powers up to 50 kW and low voltage.
The calculation procedure is based on the use of the equivalent circuit [4,5,6]. The resistors evaluate the different types of losses appear: Joule losses on the stator and the rotor, and the iron losses [7,8]: the stator resistance depending on the diameter of the conductor being used, the rotor resistance depends on the variation of the section of the rotor cage, as well as the iron losses resistance and how it is affected by the type of ferromagnetic steel selected and its specific iron losses. Mechanical losses and additional load losses are not included in this study.
The selected motors are rated 0.25 kW, 1.5 kW, 7.5 kW, 22 kW, and 45 kW. Their construction dimensions are available, and the parameters of its equivalent circuit are known, data that allows the use of finite-element simulation tools [9,10] to assess the modifications proposed and the effects that result in the operation of the motor [11].
Section 2 presents the nominal and constructive data of the different motors selected for the study and the parameters of their equivalent circuit. Section 3 explains the calculation procedure used, the criteria chosen, and the simplified hypothesis adopted. Section 4 shows all the results obtained by applying the calculation procedure explained to one of the motors, specifically the 7.5 kW motor. Section 5 shows the most relevant results obtained for the set of five motors selected in the study. Section 6 presents an efficiency improvement strategy for each motor based on the preliminary study accomplished. Finally, Section 7 presents the main conclusions derived from the work carried out.
The Appendix A includes the determination of the equivalent circuit by laboratory tests and application of the standard 60034-2-1, comparing the results obtained with the calculation procedure elaborated in Section 3 for the 1.5 kW motor. The comparison results are satisfactory and allow a positive approach to the parameter variation study carried out in Section 4 and Section 5.
2. Induction Motor Data
The nominal parameters of the motors selected for the study are shown in Table 1. All the motors are three-phase and have a nominal frequency of 50 Hz. The essential construction dimensions are shown in Table 2 [12], where:

Table 1.
Nominal values of the induction motors.
Table 2.
Main dimensions of the induction motors.
- Ds = outer diameter of stator
- DR = outer diameter of rotor
- g = air gap
- L = axial length
- NS = number of stator slots
- NC = number of conductors per slot
- dc = diameter of conductors
- AS = area of stator slots
- NR = number of rotor slots
- S or D = single cage (S) or double cage (D)
- AR = area of rotor slots
3. Calculation Procedure
The equivalent circuit per phase has been used for the operational analysis of the selected induction motors. The equivalent circuit for single cage motors is shown in Figure 1a, and the equivalent circuit for double cage motors is shown in Figure 1b [13].
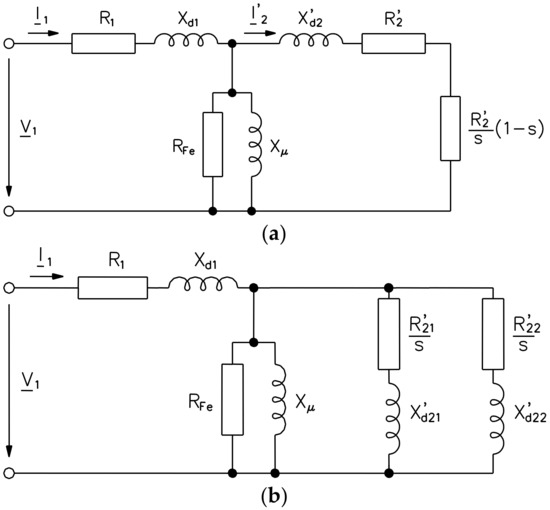
Figure 1.
Equivalent circuits for induction motors. (a) Single cage, (b) Double cage.
Table 3 shows the equivalent circuit parameters of the induction motors used, where:
Table 3.
Equivalent circuit parameters of the induction motors.
- R1 = stator resistance
- Xd1 = stator reactance
- R′2 = rotor resistance referred to stator
- X′d2 = rotor reactance referred to stator
- R′21 = rotor resistance of external cage referred to stator
- X′d21 = rotor reactance of external cage referred to stator
- R′22 = rotor resistance of internal cage referred to stator
- X′d22 = rotor reactance of internal cage referred to stator
- Xμ = magnetizing reactance
- RFe = iron loss resistance
- s = slip
- Pfreg = Mechanical losses at nominal speed
3.1. Variations of the Stator Resistance
To evaluate the stator resistance variation effects on the operation of the motor, the conductor diameter used was taken as the basis. In calculating characteristic curves, we assume a temperature increase of 55 °C; that is, the resistances at a temperature of 75 °C have been corrected.
The three applied modifications consider:
- -
- We are increasing the conductor diameter to the immediately following ones according to standard values.
- -
- Calculating the variation of the stator resistance from (1), considering as a simplified hypothesis that the increase in the diameter of the conductor implies a practically negligible increase in the length of the conductor used:where:
- R1 = stator resistance
- sc1 = area of conductor
- R1m = stator resistance after modifications
- sc1m = area of conductor after modifications
- -
- We are recalculating the slot use coefficient. In cases where this coefficient exceeds the value of 0.5, the slot surface has been increased not to exceed this value.
- -
- Correcting the iron losses and, consequently, the iron loss resistance when it is necessary to increase the slot according to Equations (2) and (3) [14]. From the finite-element simulation of the modified magnetic circuit, it is observed that the inductions in the yoke and the stator teeth slightly increased. The iron losses in the rotor are not considered, since the working frequency is very low compared to that of the stator.where:
- PFe = iron losses
- mce = weight of stator yoke
- Bce = density flux (maximum value) of stator yoke
- md = weight of stator teeth
- Bd = density flux (maximum value) of stator teeth
- P′Fe = iron losses after modifications
- m′ce = weight of stator yoke after modifications
- B′ce = density flux (maximum value) of stator yoke after modifications
- m′d = weight of stator teeth after modifications
- B′d = density flux (maximum value) of stator teeth after modifications
- f = frequency
- RFe = iron loss resistance
- R′Fe = iron losses resistance after modifications
- -
- It was correcting the magnetizing reactance in cases where the slot is increased. From the finite-element simulation of the modified magnetic circuit, it is observed that the magnetizing inductance varies very little. Even so, its variation in the equivalent circuit is applied according to Equation (4).where:
- Xμ = magnetizing reactance
- Lμ = magnetizing inductance
- Xμ′ = magnetizing reactance after modifications
- Lμ′ = magnetizing inductance after modifications
- -
- Due to its low incidence, the possible variations in the stator leakage reactance that these modifications may cause have not been considered.
3.2. Variations of the Rotor Resistance
The section of the rotor slot used was taken as a basis to evaluate the effects of the rotor resistance variation on the motor’s operation. In calculating characteristic curves, we assume a temperature increase of 55 °C; that is, the resistances at a temperature of 75 °C have been corrected.
The three applied modifications consider:
- -
- It was increasing the section of the rotor slot, according to the topology of each motor, by three different values without causing zones that represent a barrier to the magnetic flux circulation or punctually high inductions in the rotor.
- -
- We are calculating the variation of rotor resistance from (5), both for single cage motors and double cage motors. The increase in the rotor slot section, both external and internal, has been studied separately in double cage motors.where:
- R′2 = rotor resistance referred to stator
- sr2 = area of rotor slot
- R′2m = rotor resistance referred to stator after modifications
- sr2m = area of rotor slot after modifications
- -
- In all the variations proposed, the magnetic circuit is slightly modified. In this case, the masses of the yoke and the stator teeth remain unchanged. Although the increments of inductions in the stator are very tiny, simulations are performed with finite elements, and the same calculation procedure indicated in Equations (2) and (3) is applied.
- -
- Due to its low incidence, the possible variations in the stator leakage reactance that these modifications may cause have not been considered.
3.3. Variations of the Type of Steel
The ferromagnetic material used has been taken as a basis to evaluate the effects of iron loss resistance variation on the motor’s operation. The three applied modifications consider:
- -
- We are using other types of ferromagnetic steel with different values of specific iron losses.
- -
- It was correcting the iron losses and, consequently, the iron loss resistance, according to Equations (6) and (3). The induction values in the yoke and stator teeth are determined from the simulation with finite elements of the motor with the different types of ferromagnetic steel and its corresponding magnetization curve.where:
- EL′ = specific iron losses of ferromagnetic steel used
- EL = specific iron losses of ferromagnetic steel after modifications
- -
- It was correcting the magnetizing reactance for the different types of ferromagnetic steel from the simulations using finite elements. Its variation in the equivalent circuit is applied according to Equation (4).
- -
- Due to its low incidence, the possible variations in the stator leakage reactance that these modifications may cause have not been considered.
4. Calculation Procedure Example: 7.5 kW Motor
This chapter shows the calculations and results obtained in one of the motors selected for the study. They are presented for the 7.5 kW motor, which is the intermediate power of the five selected motors. The structure of the rotor in this motor is the double cage. Therefore, two variations of the rotor resistance have been made, corresponding to the external cage and the internal cage.
4.1. Finite Elements Method Simulations
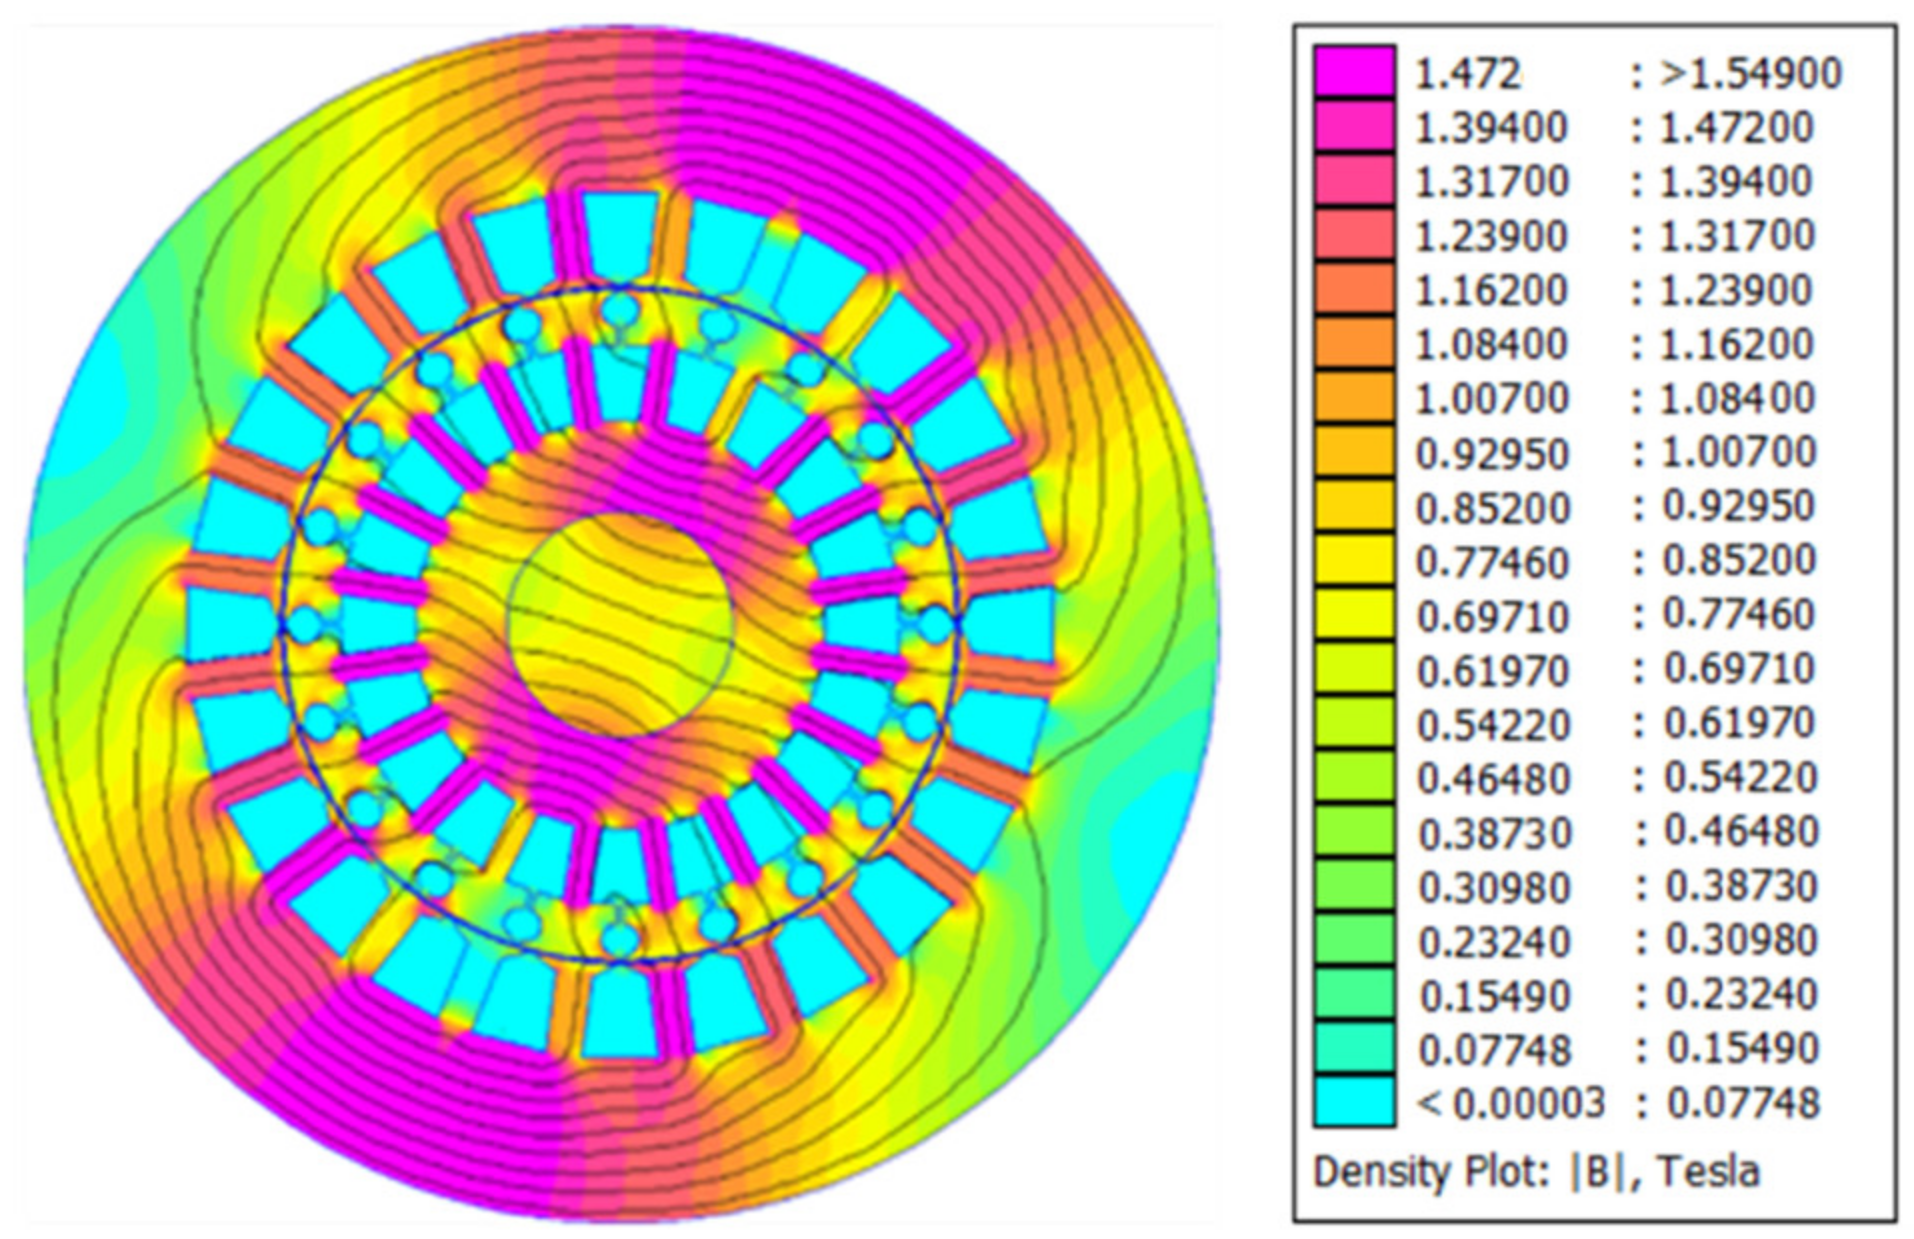
According to the constructional dimensions and the materials used indicated in Table 2, the motor simulation has been carried out using the finite elements method from the FEMM program [15]. Figure 2 shows the simulation result for the magnetizing reactance current at the nominal voltage. For this motor, the magnetizing current in RMS value is 4.6 A. The inductions in the teeth, the stator yoke, and the magnetizing inductance are obtained from the simulations with finite elements of the different structures and the corresponding modifications. These values are required to apply Equations (2), (4) and (6) [16].

Figure 2.
Finite elements method simulation: results in the 7.5 kW motor.
4.2. Variations on the Equivalent Circuit Parameters
From the calculation method explained in Section 3, the different construction variations applied and simulated in the 7.5 kW motor and their effects on the parameters of the equivalent circuit [17] they indicated in Table 4.
Table 4.
Construction variations studied in the 7.5 kW motor.
4.2.1. Effects of Variations in Stator Resistance on the Characteristic Curves
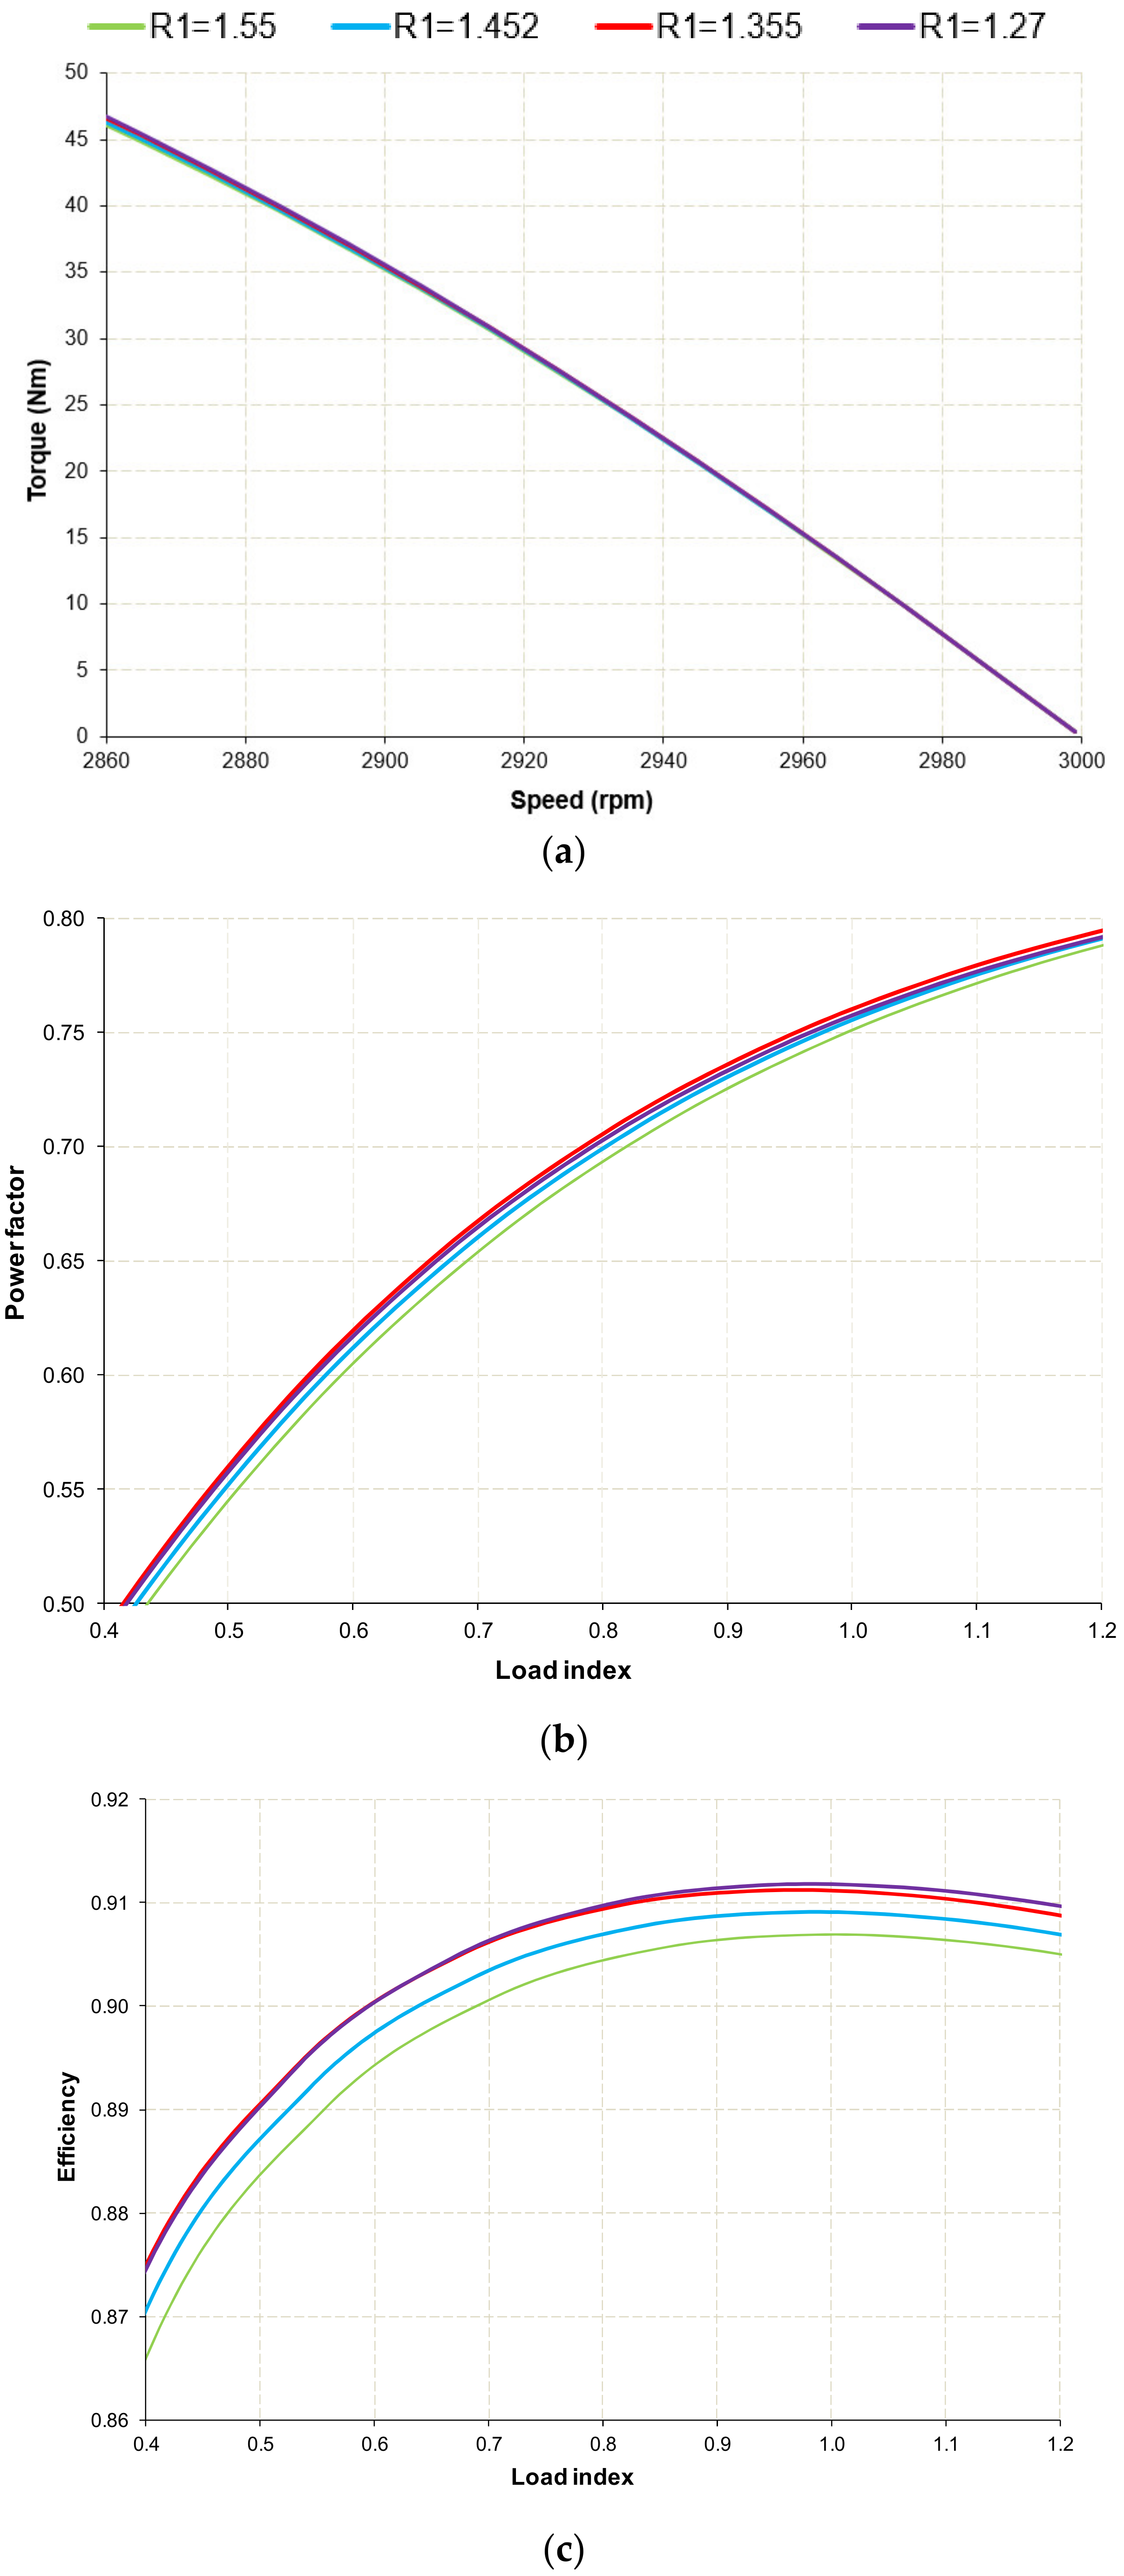
Figure 3 shows the results obtained in the characteristic curves with the modifications proposed in Table 4, based on the resolution of the equivalent circuit and applying the power balance in the motor. Mechanical losses and additional load losses have not been considered in this calculation procedure. The ratio of the output power developed by the motor concerning the nominal output power has been used as the load index. It is observed that the most remarkable effect in these curves is in the efficiency improvement.
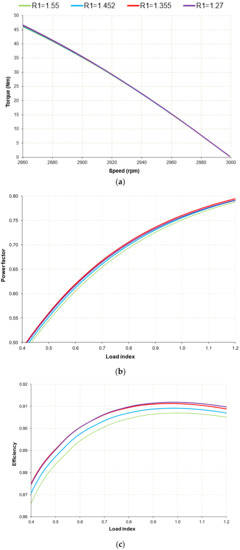
Figure 3.
Characteristic curves in the 7.5 kW motor (variations of R1 in Ω). (a) Torque-speed (stability zone); (b) Power factor-load index; (c) Efficiency-load index.
The analysis at characteristic operating points is of particular interest, such as the nominal, the maximum torque, and the start point. Two criteria have been established to quantify the effect on these points:
- -
- Keeping the same total losses constant so that the motor heating conditions are the same. With this criterion, the nominal power capacity of the motor is increased by reducing the stator resistance (Table 5), where:
Table 5. Nominal, start, and maximum torque results on the 7.5 kW motor (equal heating criteria, variations of R1).
- Ts/Tn = starting torque/nominal torque
- Is/In = starting current/nominal current
- Tmax/Tn = maximum torque/nominal torque
- -
- Keeping the nominal output power constant, so the total losses and heating decrease. With this criterion, the value of the power assigned to the motor does not change (Table 6).
Table 6. Nominal, start, and maximum torque results on the 7.5 kW motor (equal output power criteria, variations of R1).
It is noteworthy to indicate that the proposed criteria change the quantitative perception of some results. The efficiency increases similarly in both criteria, but the power factor and the starting and maximum torque ratios change depending on the requirements adopted.
4.2.2. Effects of Variations in Rotor Resistance on the Characteristic Curves
The motor selected as an example has a double cage rotor, so two situations have been raised: varying the external cage’s resistance and varying the internal cage’s resistance separately.
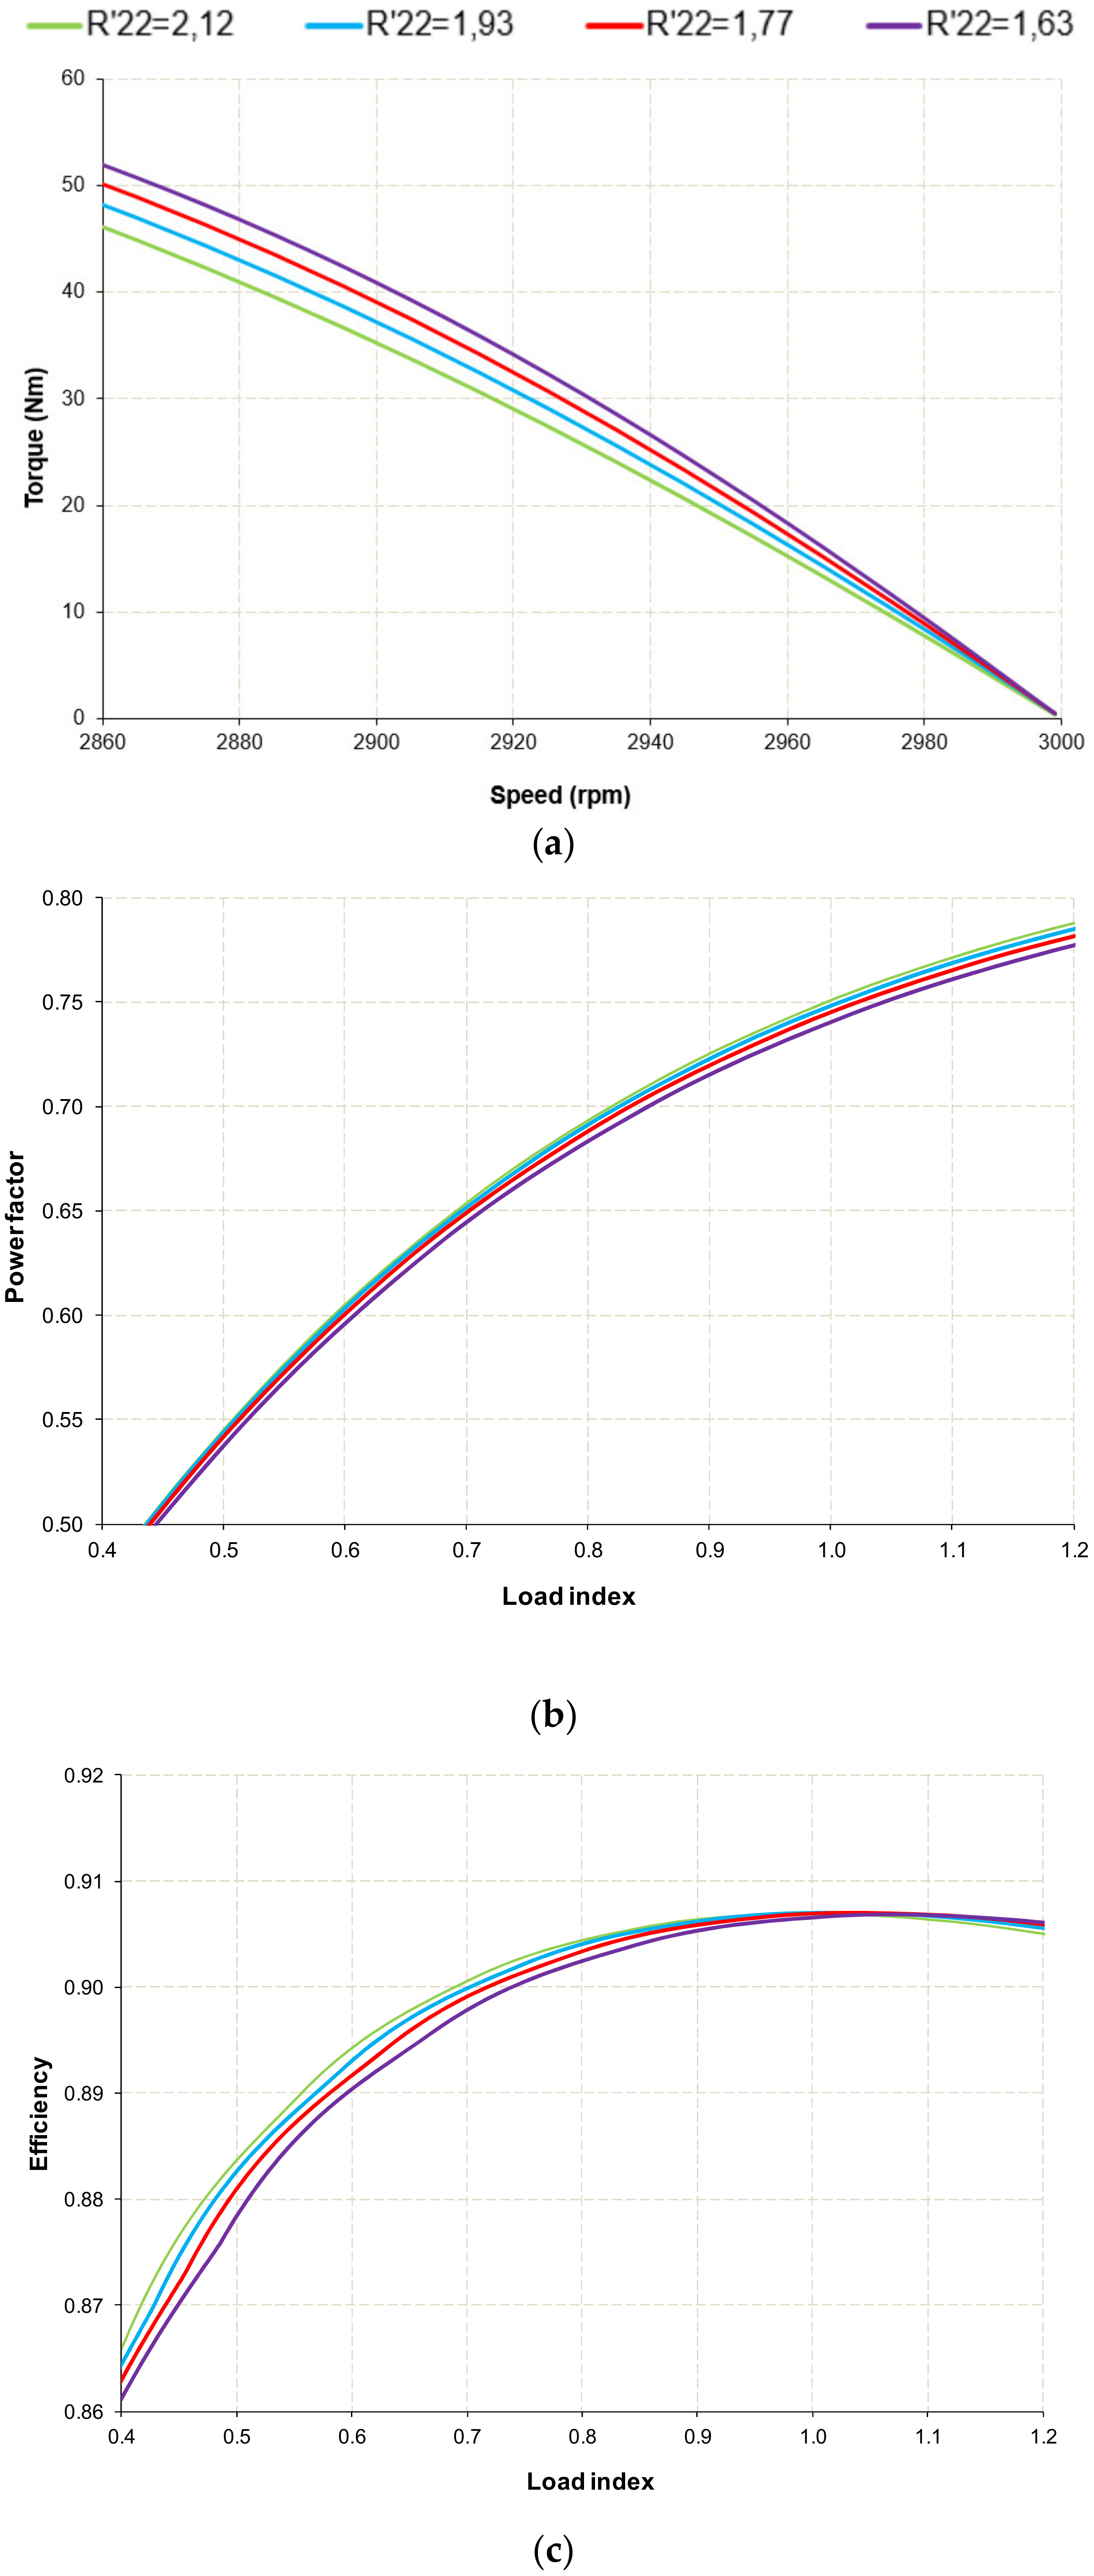
Due to the more significant influence of the internal cage on the motor operating parameters, mainly because the section of the internal cage is greater than the section of the external cage, only the results obtained for variations of the internal cage are shown in Figure 4 and Table 7 and Table 8. The same procedure as in Section 4.2.1 has been followed.
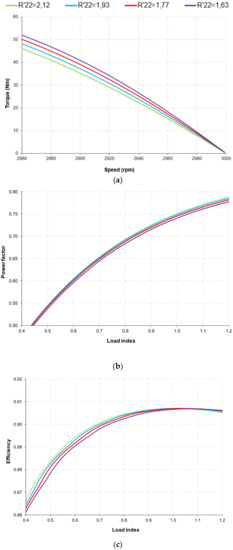
Figure 4.
Characteristic curves in the 7.5 kW motor (variations of R′22 in Ω). (a) Torque-speed (stability zone), (b) Power factor-load index, (c) Efficiency-load index.
Table 7.
Nominal, start, and maximum torque results on the 7.5 kW motor (equal heating criteria, variations of R′22).
Table 8.
Nominal, start, and maximum torque results on the 7.5 kW motor (equal output power criteria, variations of R′22).
It is noteworthy in this case, with both criteria, that the efficiency is practically unchanged, even worse for lower loads index by increasing the section of the rotor cage. On the other hand, other parameters are affected, such as the speed estimated as nominal, which increases with decreasing resistance. Start ratios, both current, and torque, decrease with reduced resistance. In this case, the trend is the same for the two defined criteria.
4.2.3. Effects of Variations in the Type of Steel on the Characteristic Curves
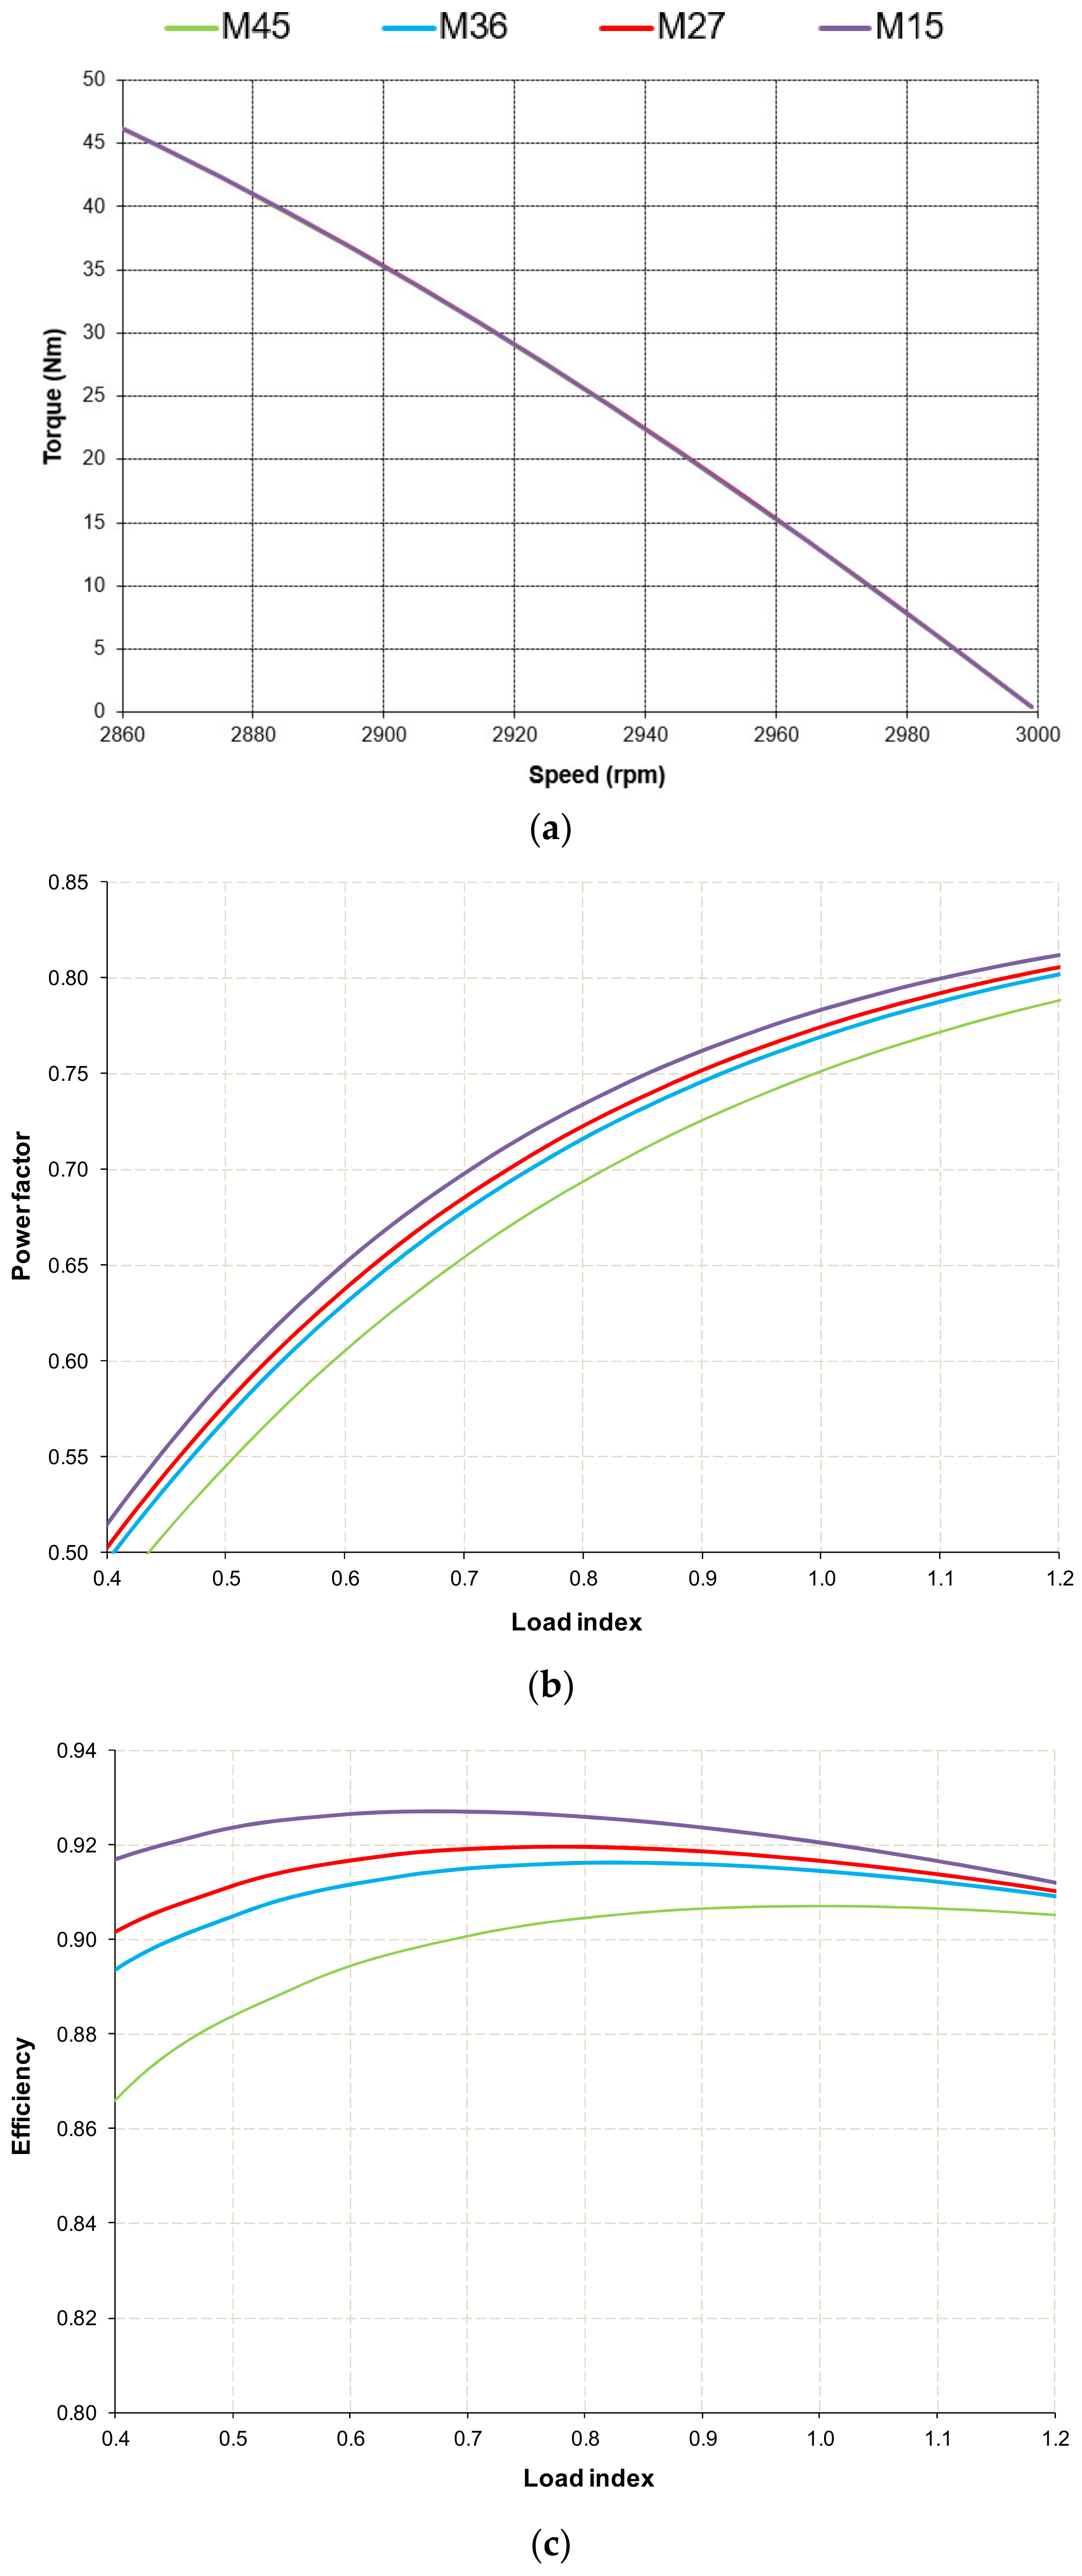
Figure 5 and Table 9 and Table 10 show the results obtained using different types of ferromagnetic steel, with various specific losses and their corresponding magnetization curve in the finite elements simulations. The same procedure as in Section 4.2.1 has been followed.
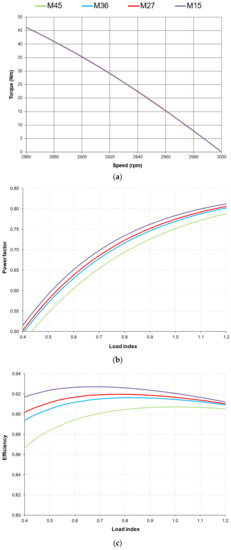
Figure 5.
Characteristic curves in the 7.5 kW motor (variations of type of steel). (a) Torque-speed (stability zone), (b) Power factor-load index, (c) Efficiency-load index.
Table 9.
Nominal, start, and maximum torque results on the 7.5 kW motor (equal heating criteria, variations of type of steel).
Table 10.
Nominal, start, and maximum torque results on the 7.5 kW motor (equal output power criteria, variations of type of steel).
The efficiency increases significantly in both criteria, especially for lower loads index. The power factor increases to a lesser extent than the efficiency for the equal heating criterion, while remaining practically constant with the equal nominal power criterion. The start and maximum torque ratios change of trend according to the criteria adopted.
5. Results in All the Motors Studied
To show the results obtained in all the motors analyzed, we have chosen to concentrate them relatively and thus compare the results of all the motors studied for each parameter. The relative value has been calculated from Equation (7):
To simplify the number of results and graphs to be shown, of all the calculations made, those that follow a similar trend for all the motors studied and in all the proposed construction modifications have been selected to be presented here. We understand that these cases allow possible action strategies to be established in the design or redesign of induction motors in the range of powers covered by the study.
5.1. Equal Heating Criteria
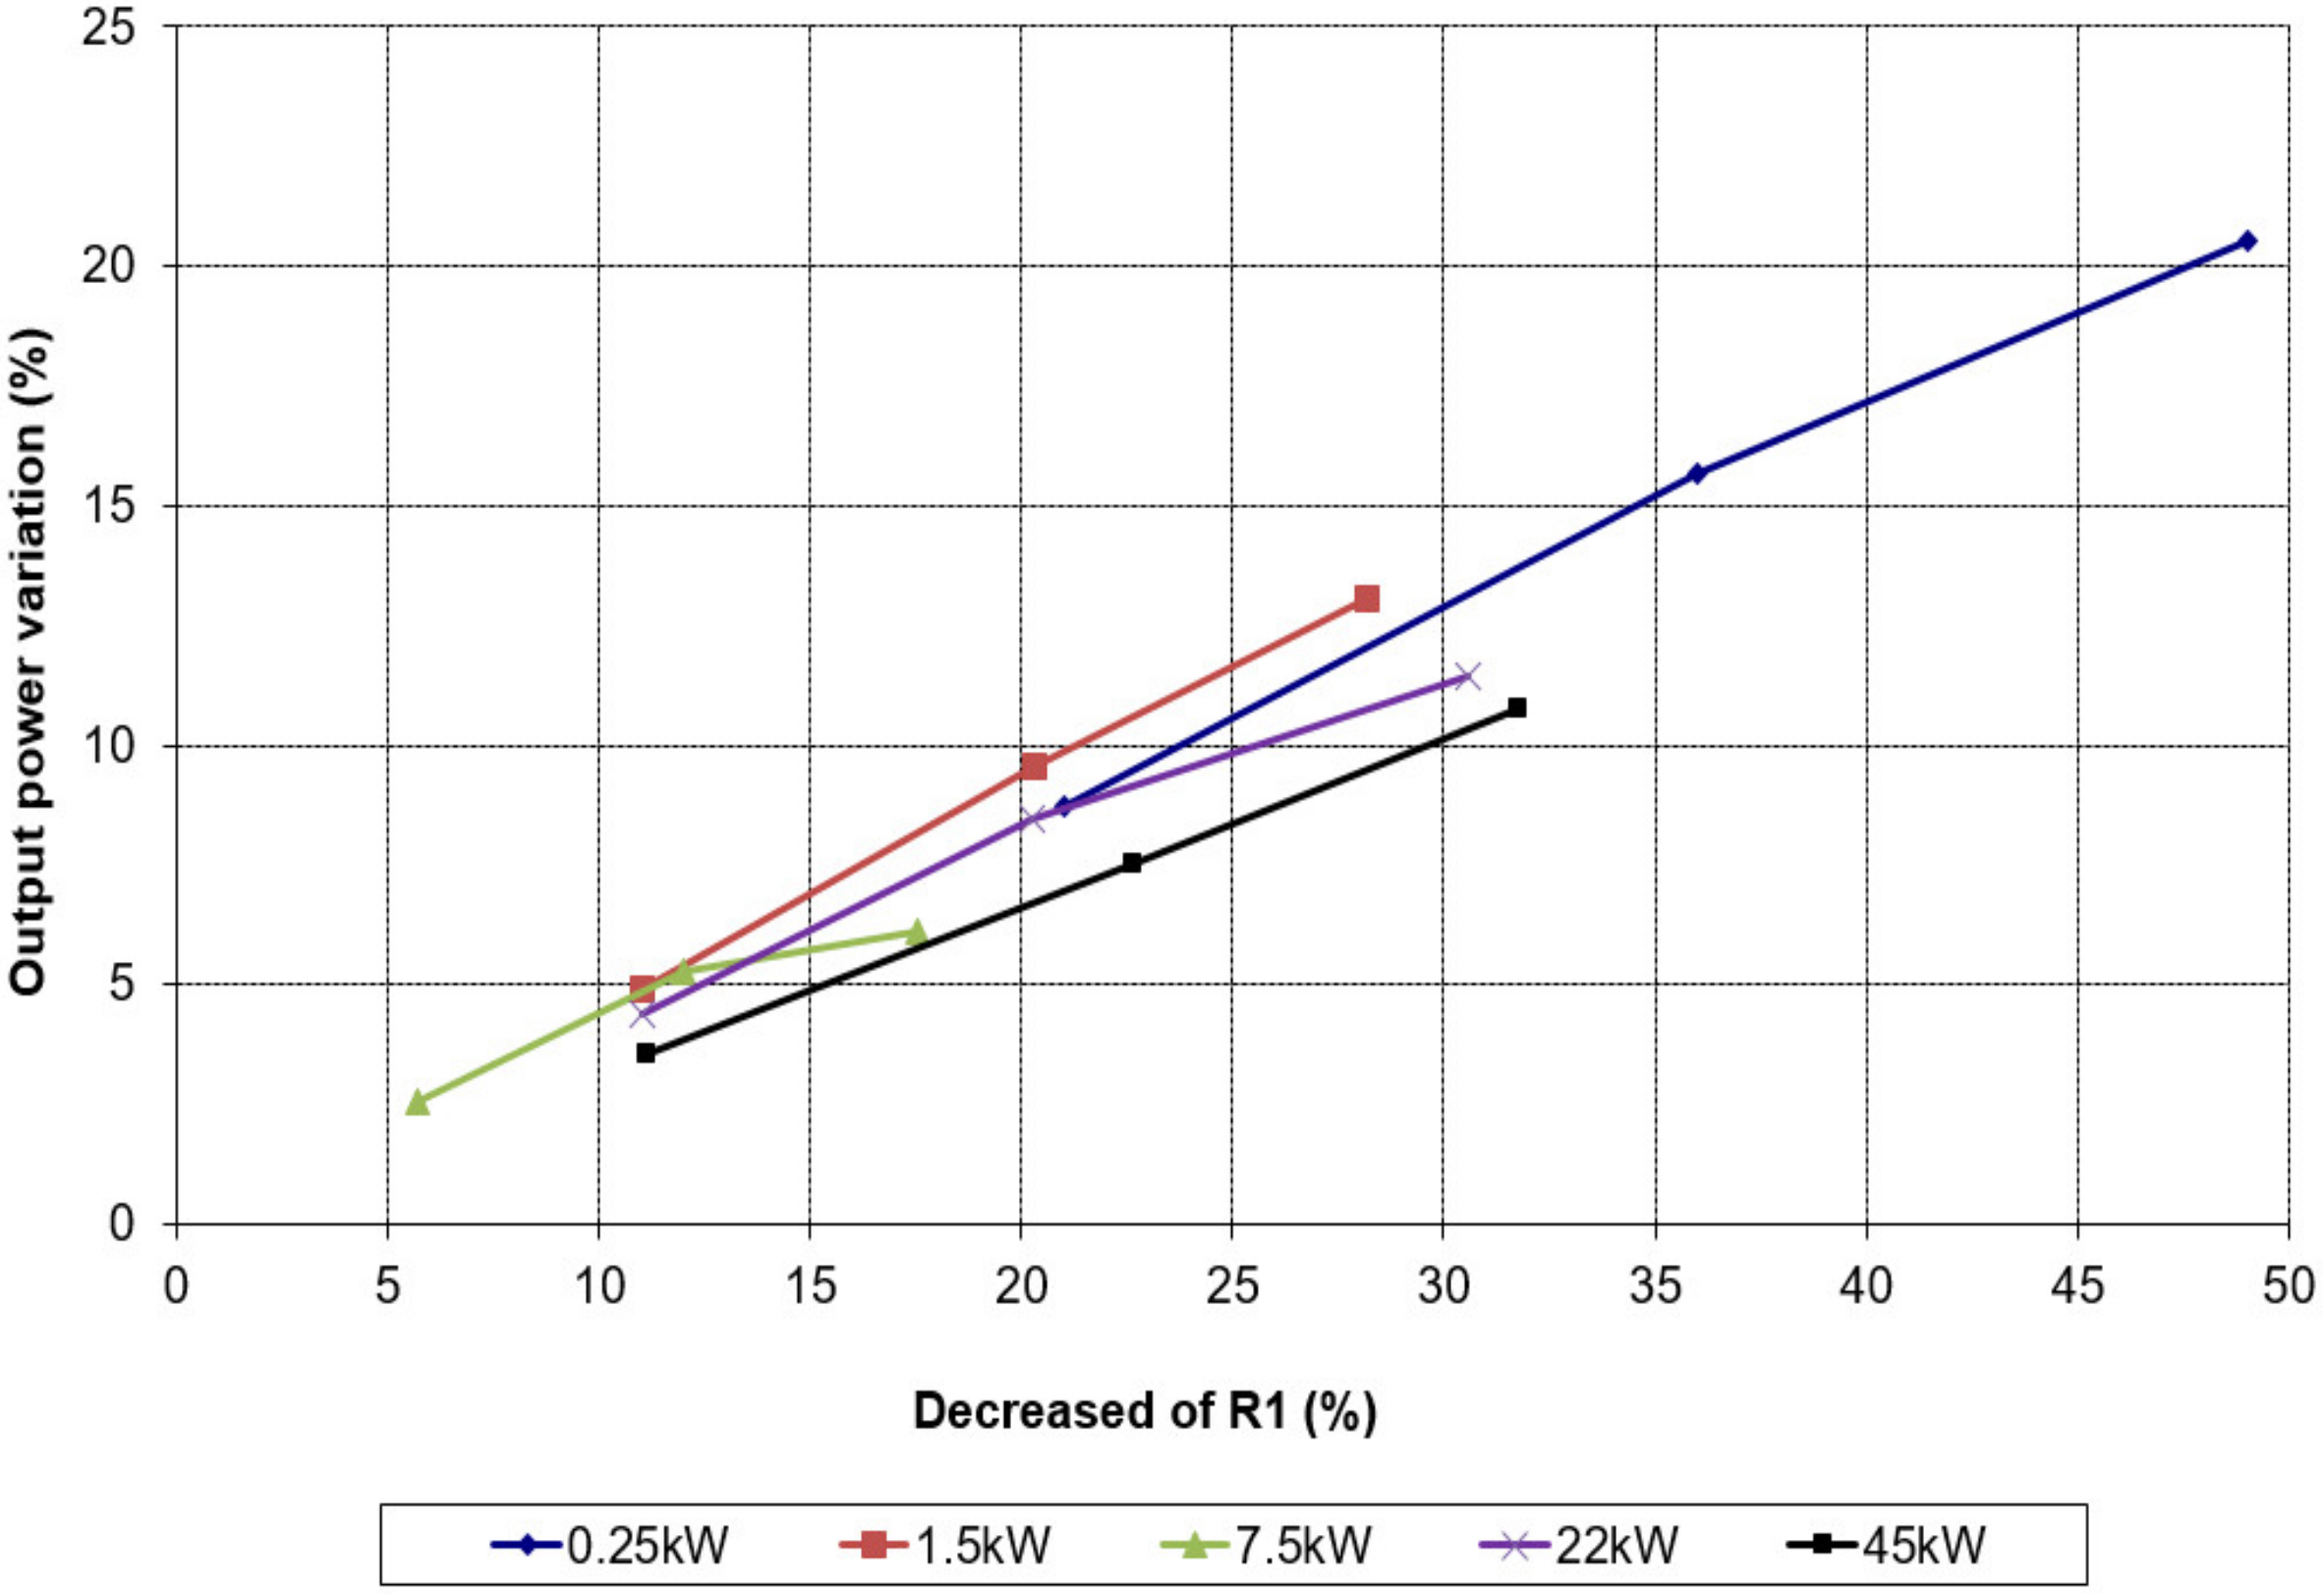
The most relevant results are shown below from establishing the criterion of the equal losses, therefore, the equal heating conditions. For variations in stator resistance, the most notable results are obtained in effects on nominal output power (Figure 6) and effects on nominal efficiency (Figure 7). In both cases, an increase is observed for all the motors analyzed. Less significantly and not in all motors, it is appreciated that the nominal output power is obtained for a slightly lower speed. The starting torque/nominal torque and maximum torque/nominal torque ratios decrease slightly (these ratios do not decrease in the case of the 0.25 kW motor).
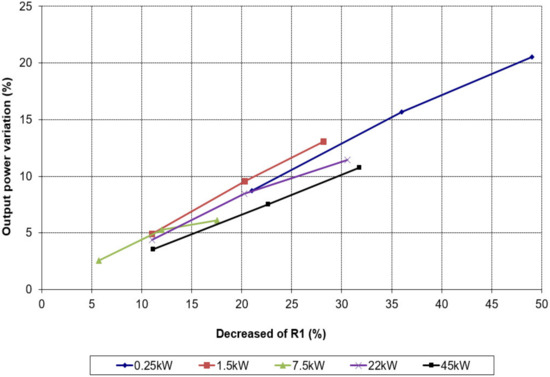
Figure 6.
Output power variation versus decreased of R1 in all the motors.
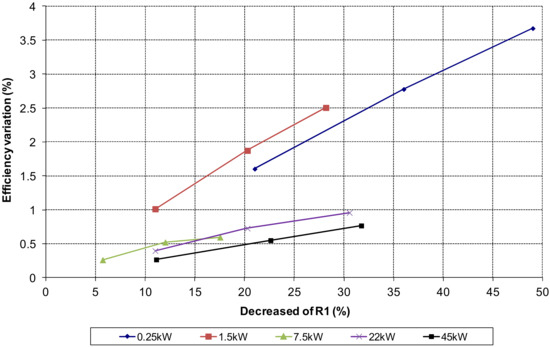
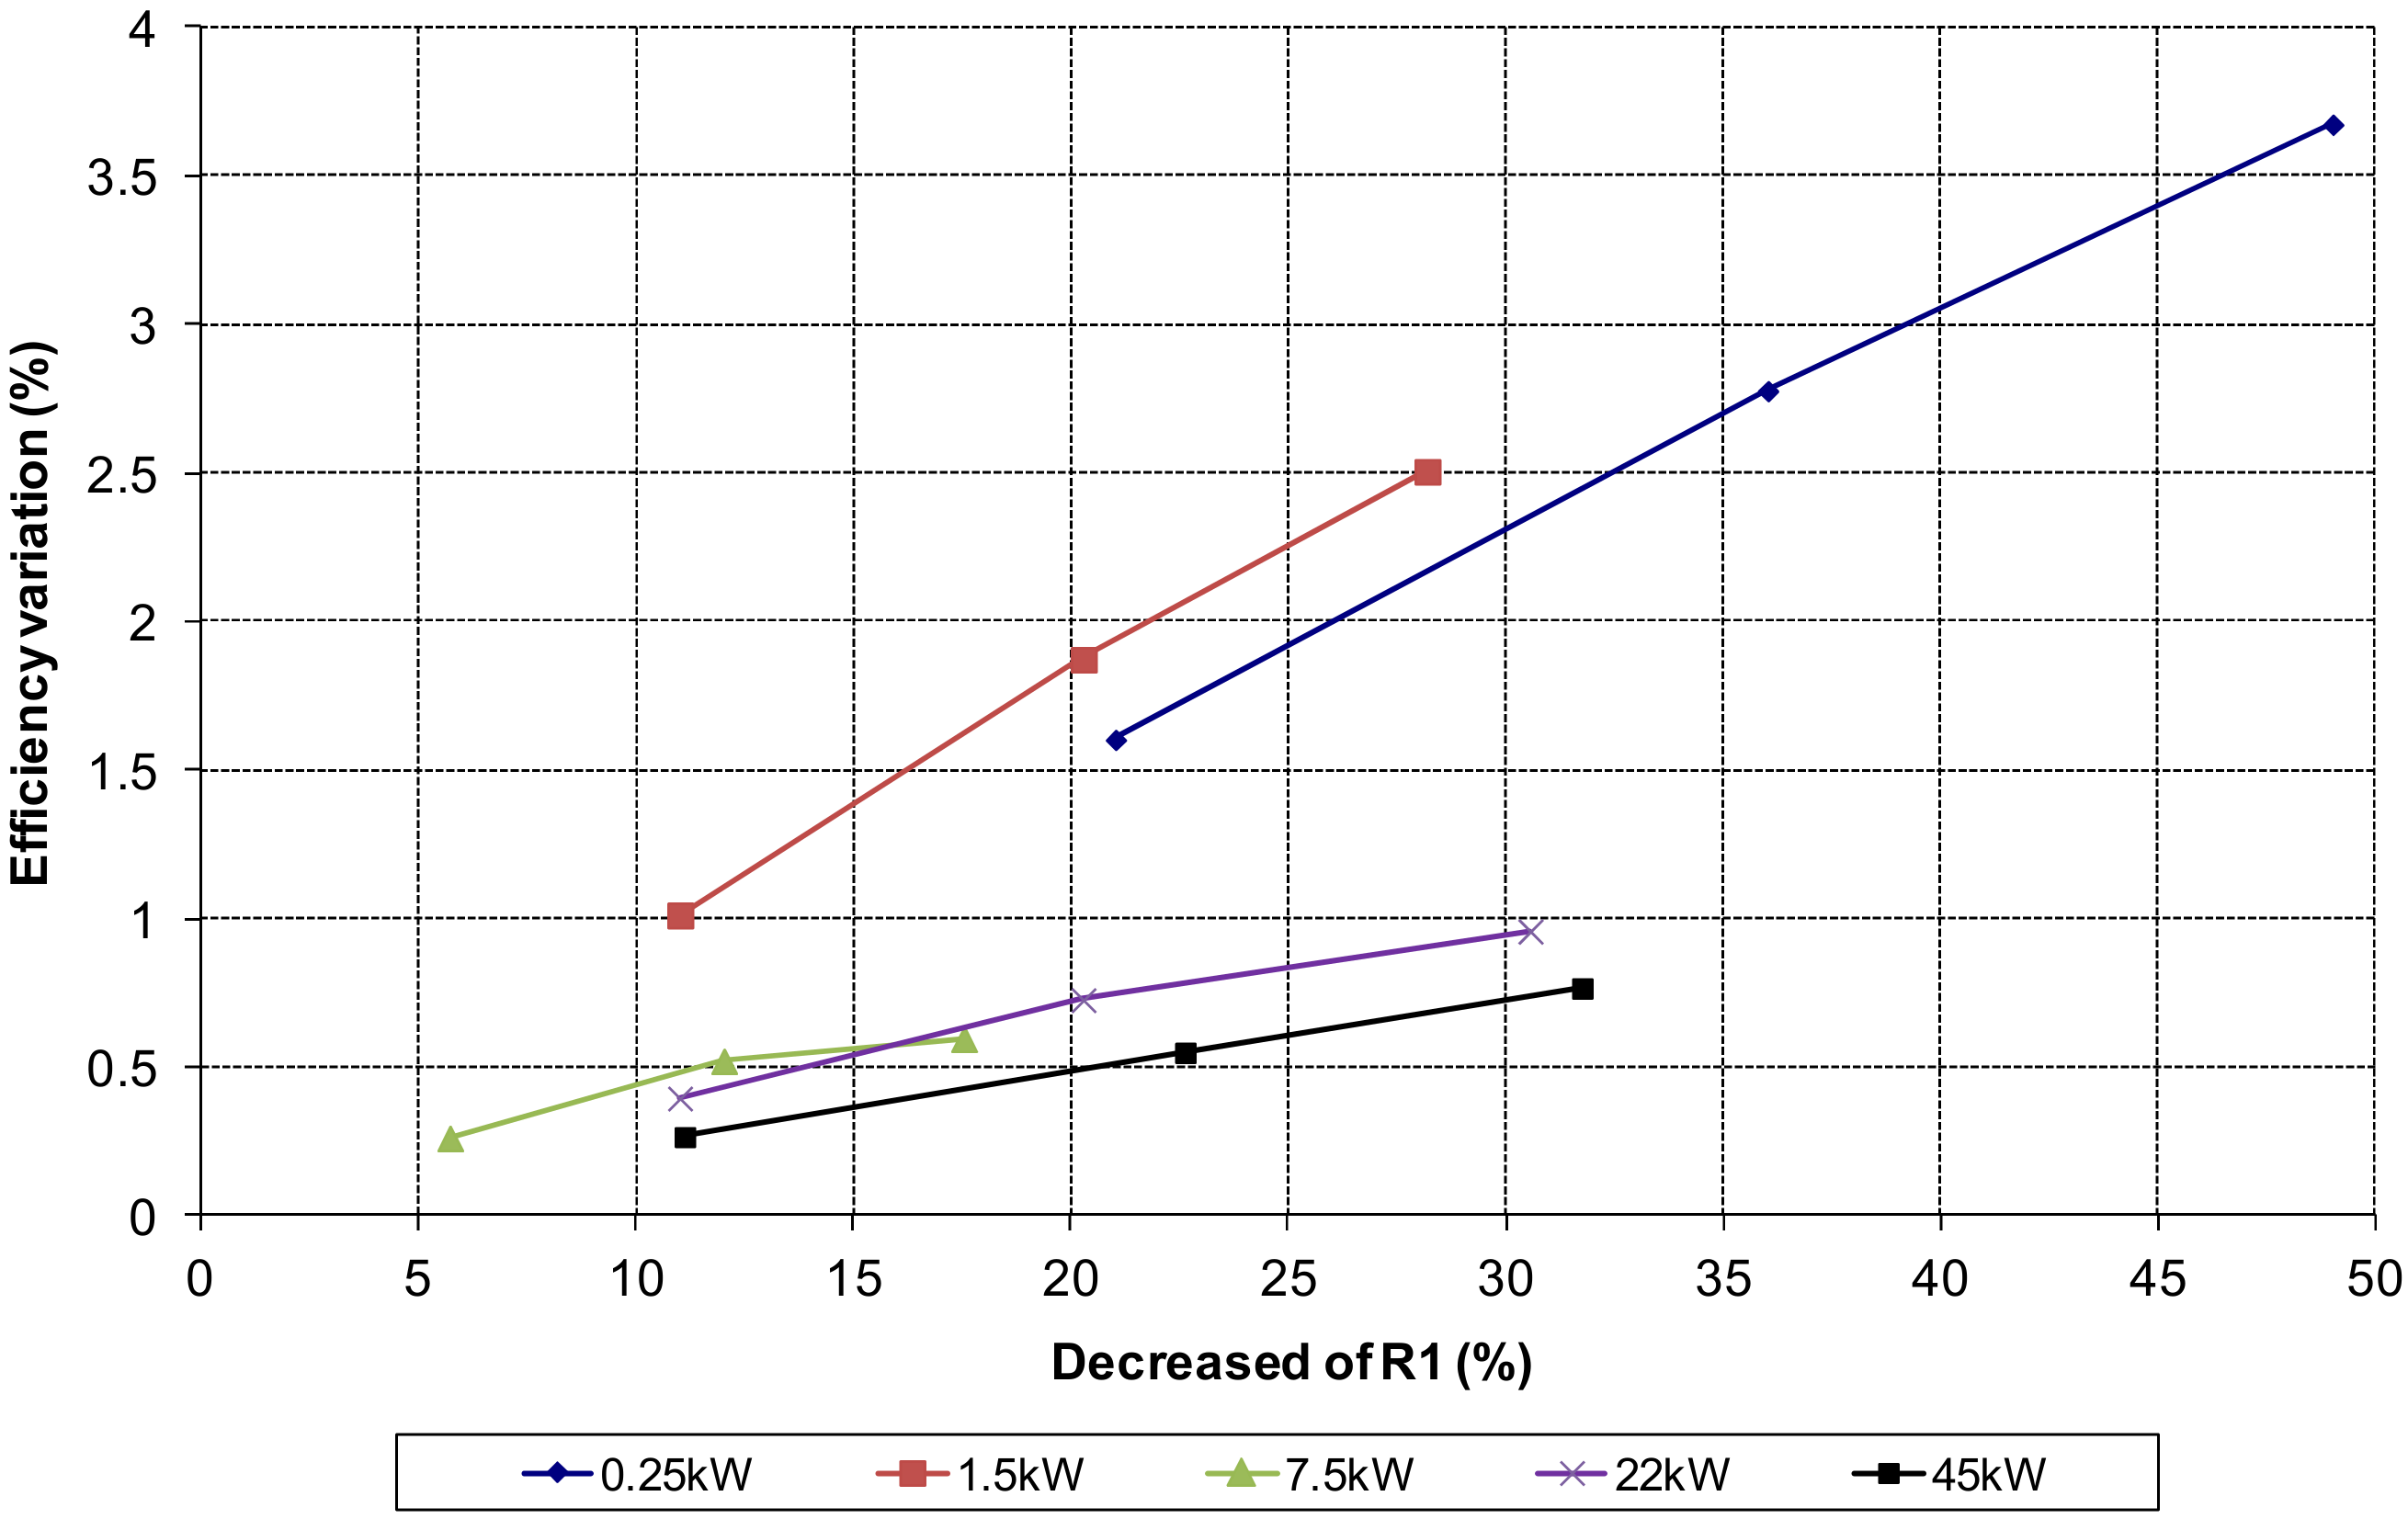
Figure 7.
Efficiency variation versus decreased of R1 in all the motors (equal heating criteria).
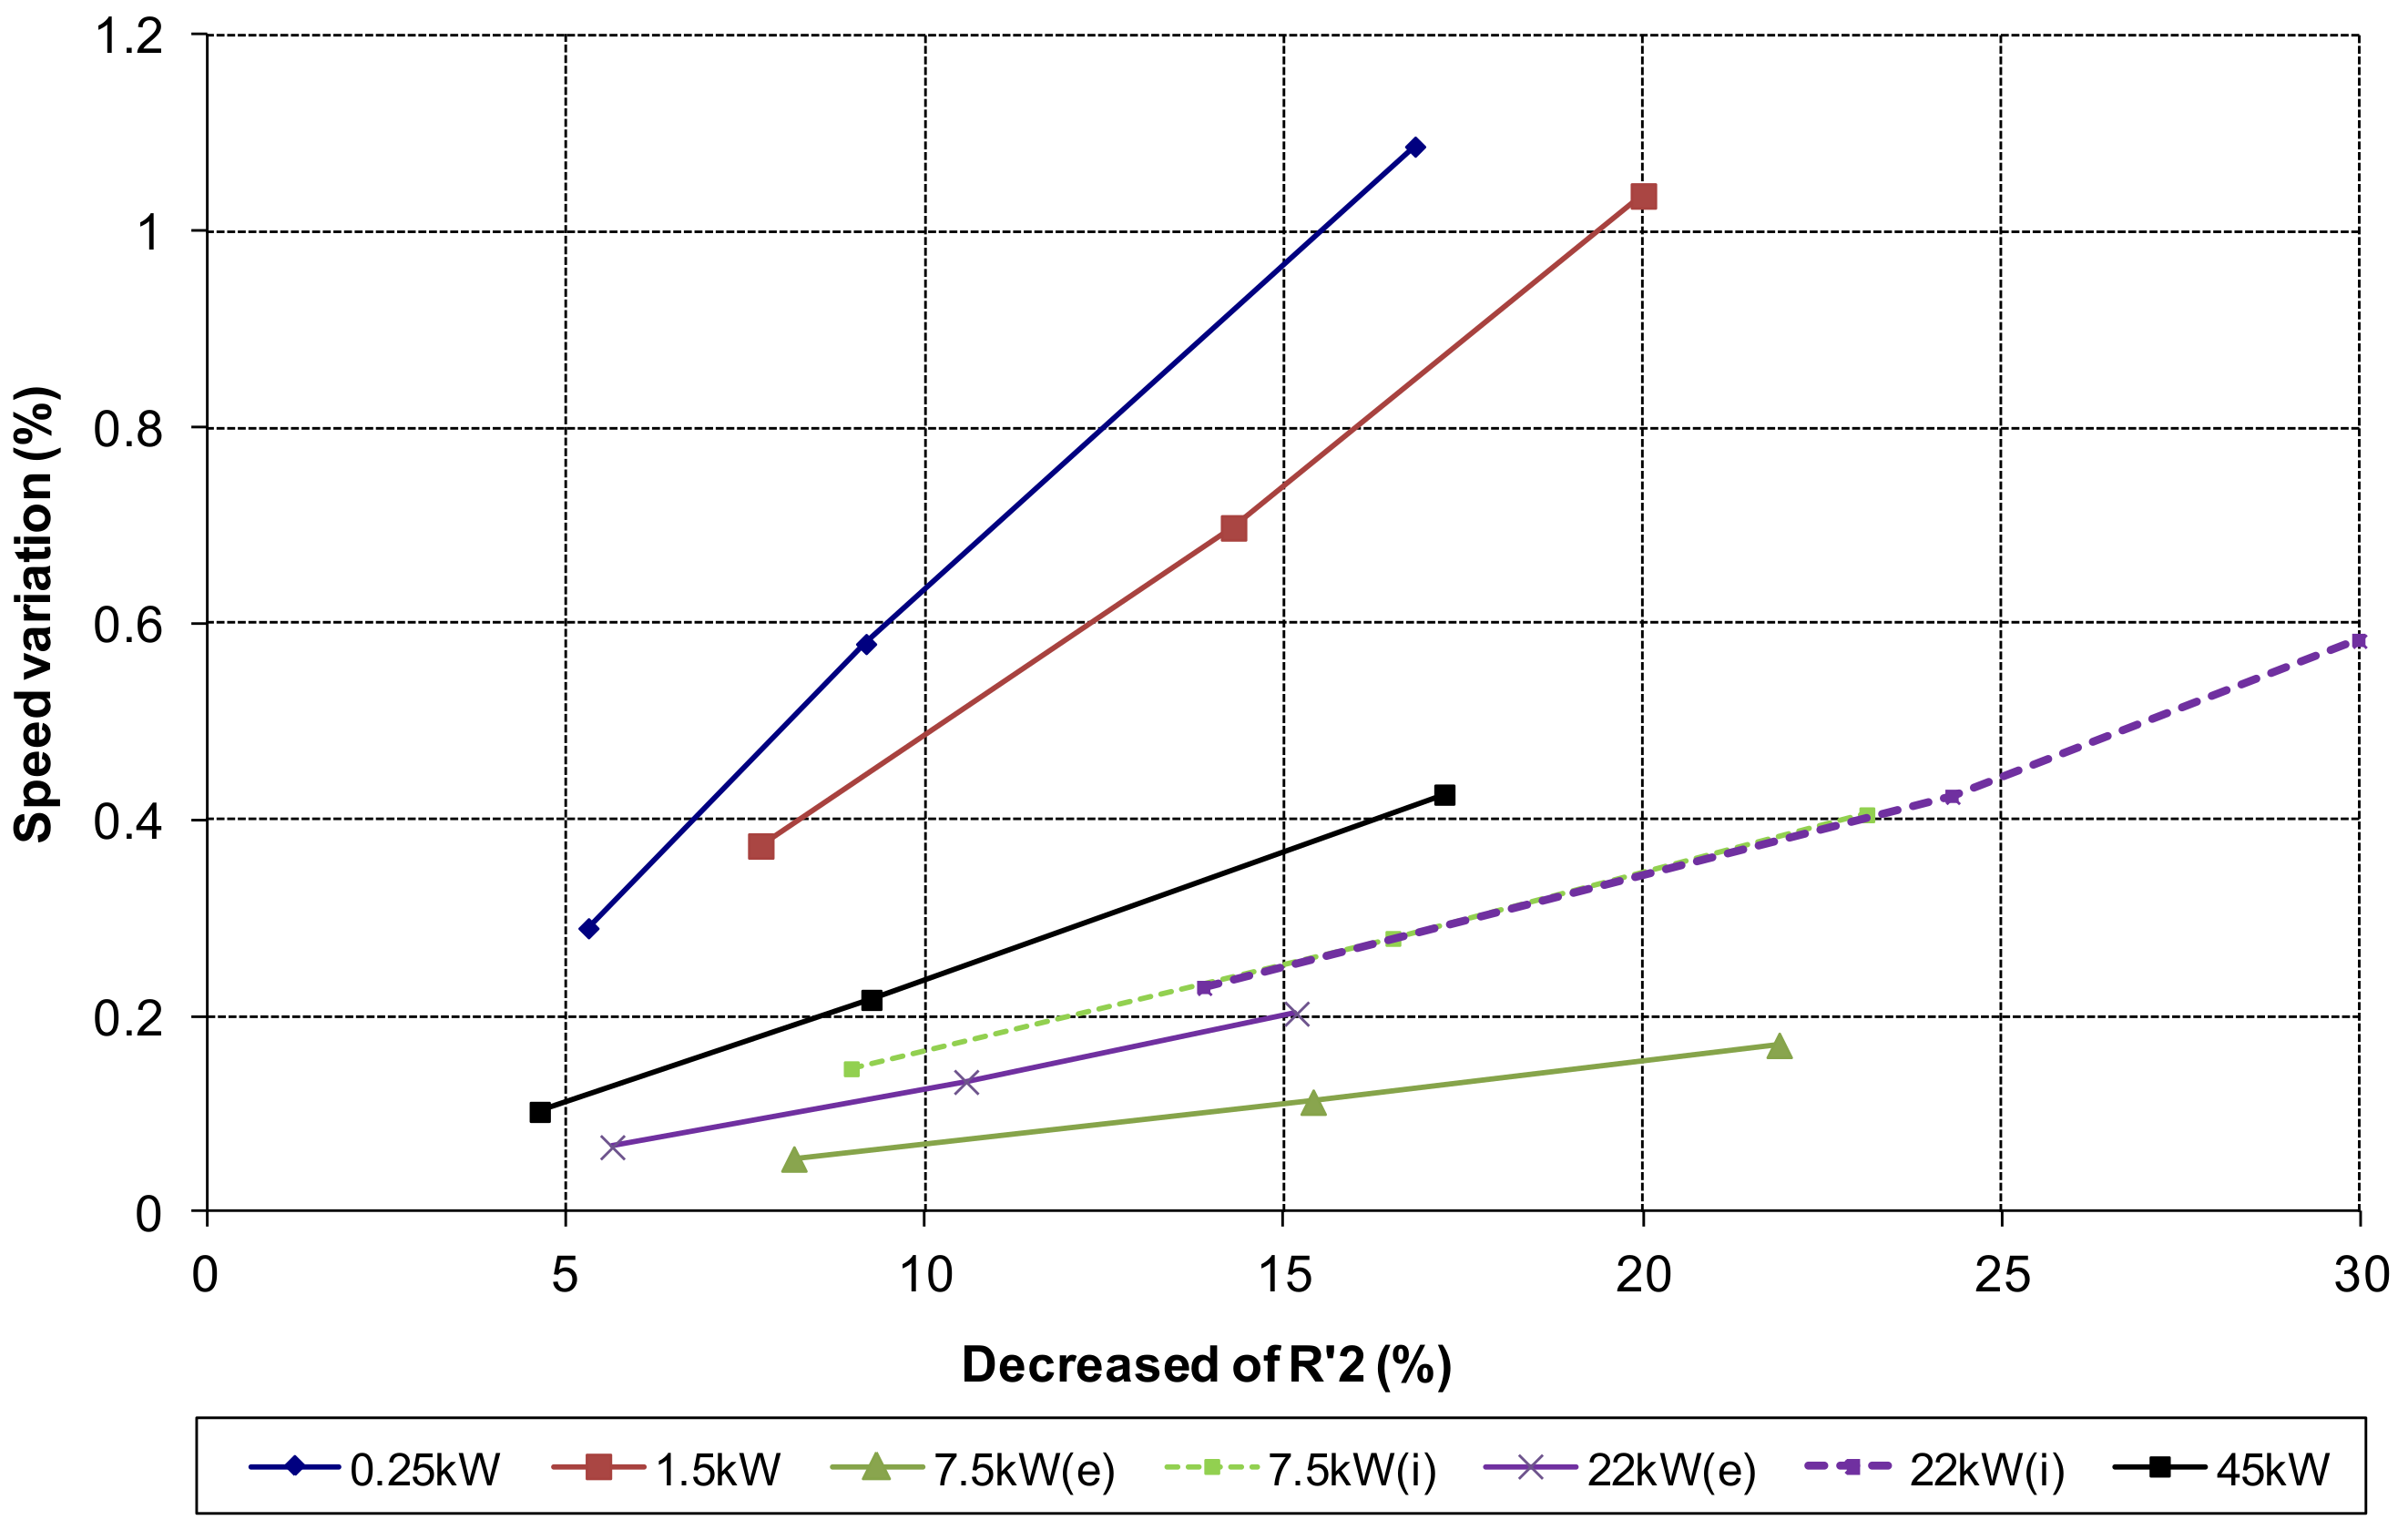
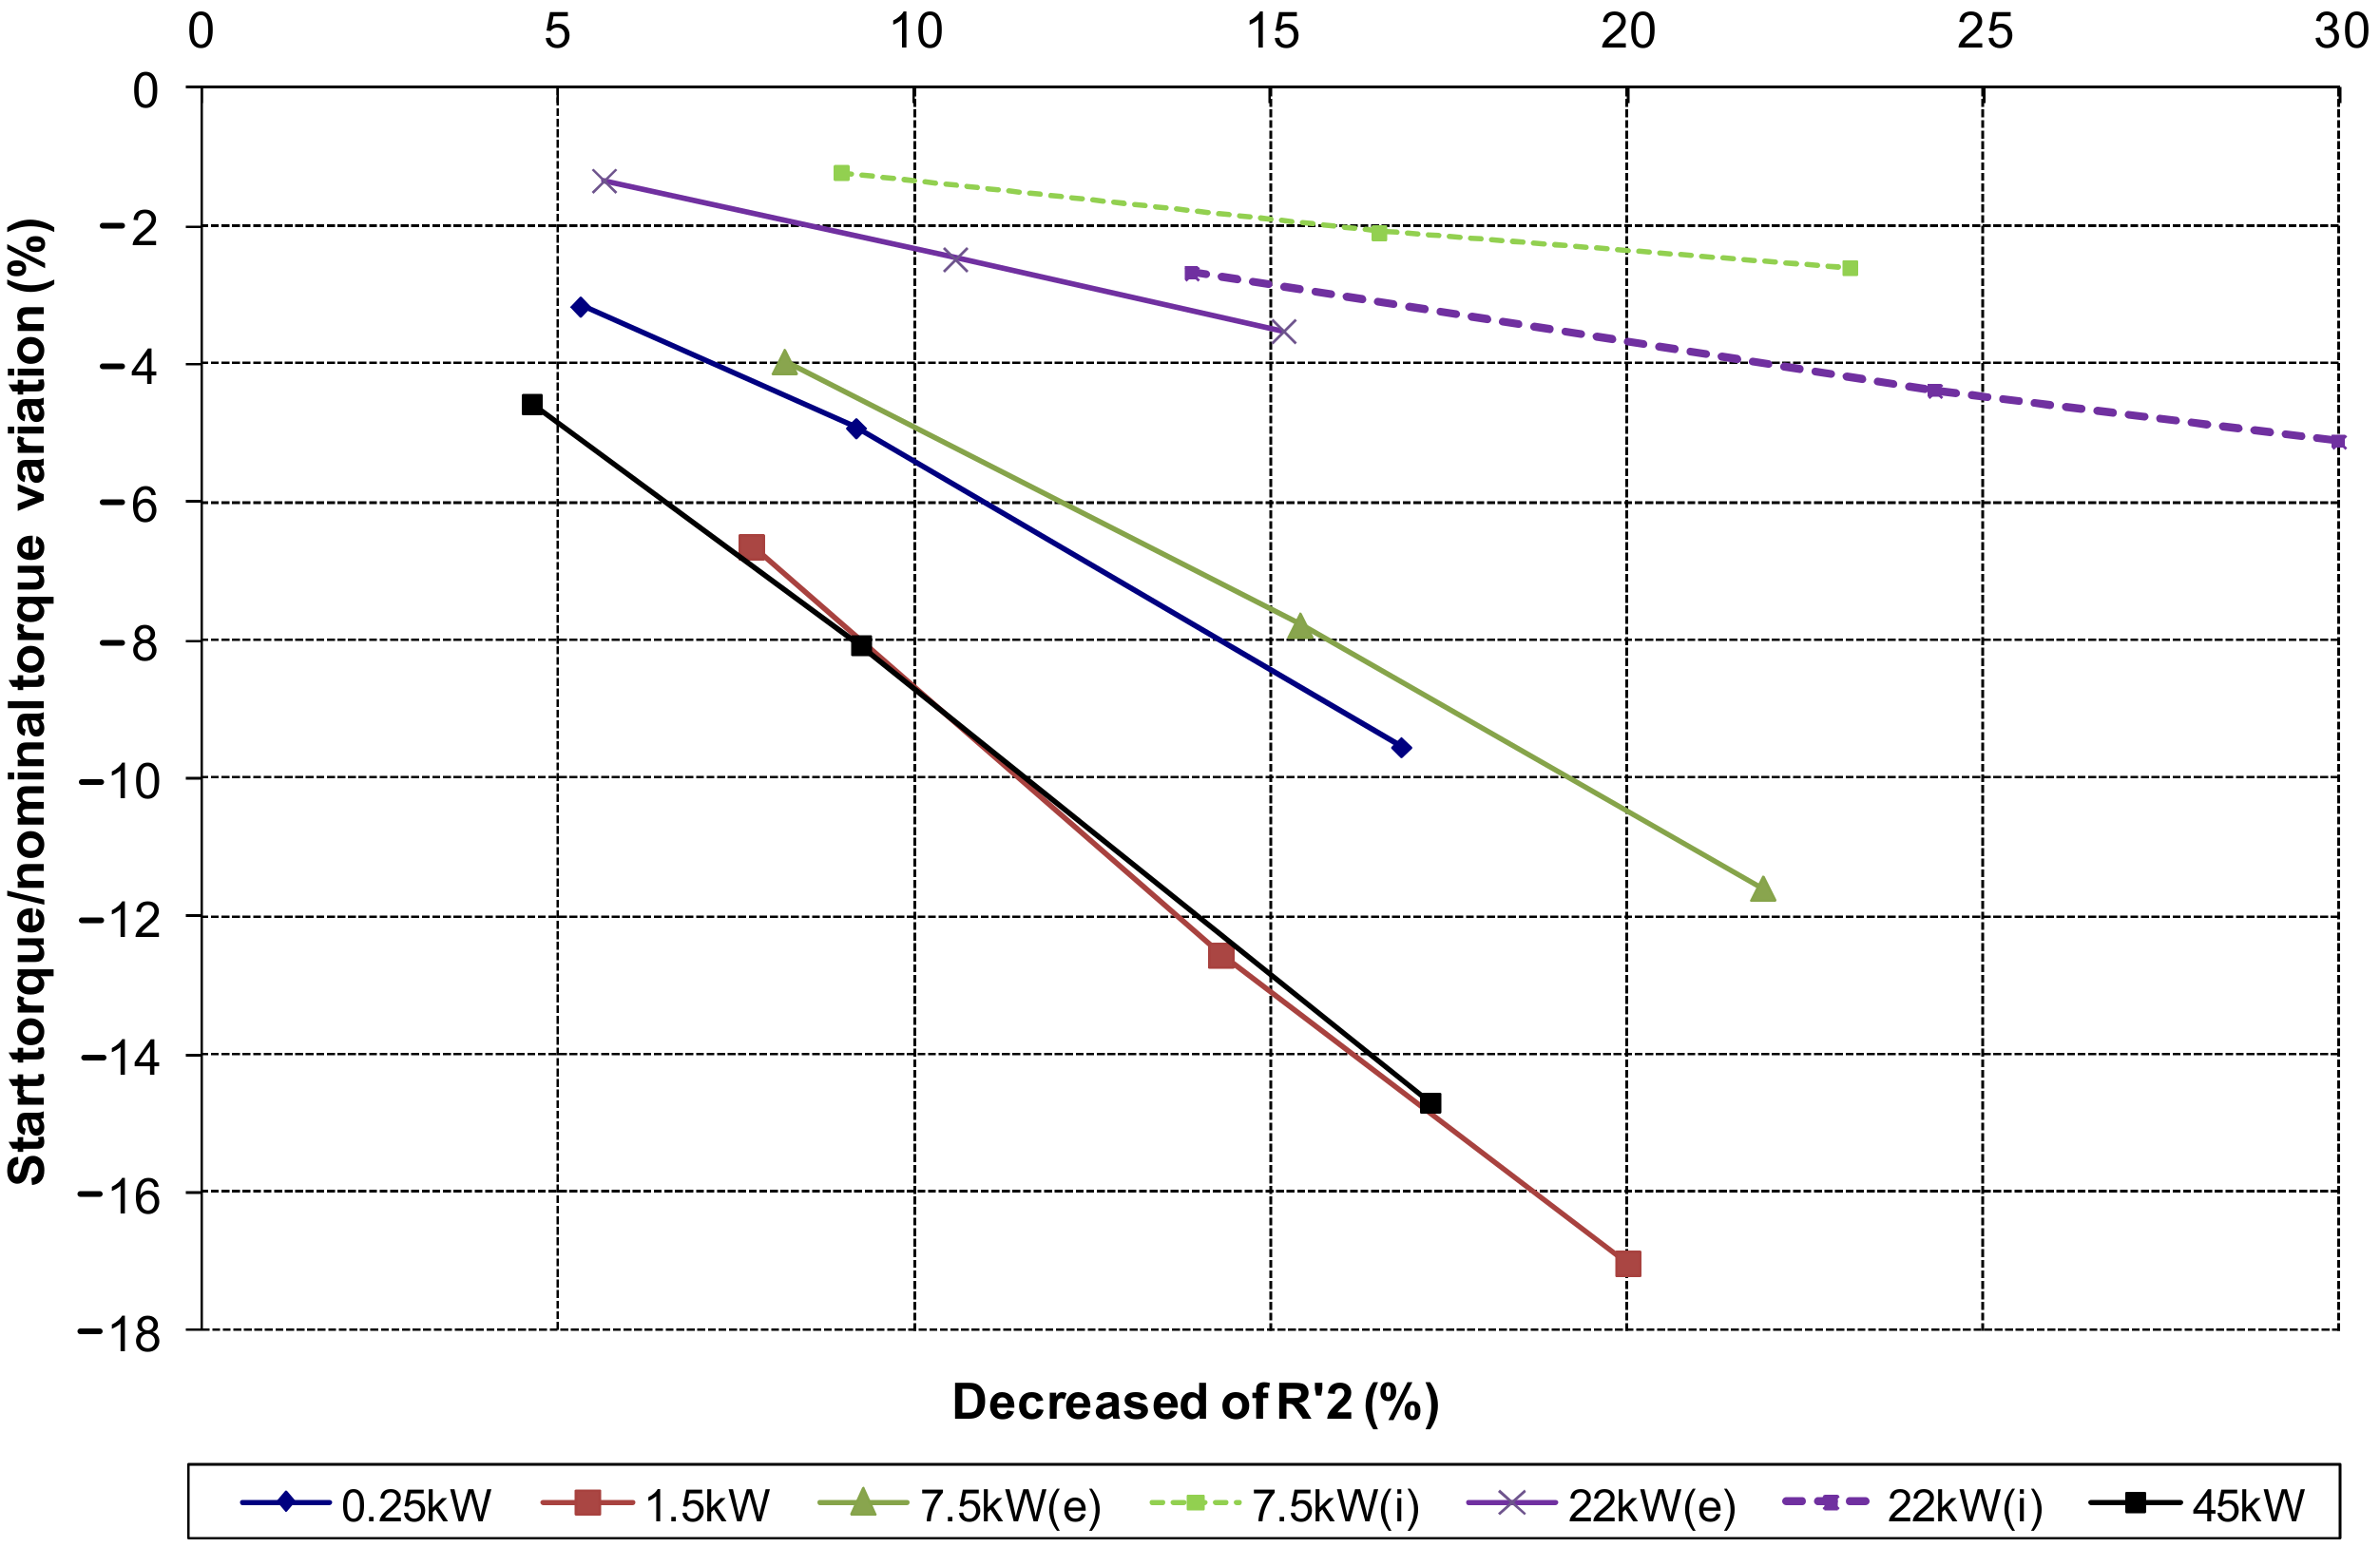
For variations in rotor resistance, the most relevant effects are seen in the increase in nominal speed (Figure 8) and the decrease in the start torque/nominal torque ratio (Figure 9), more significantly when decreasing the resistance of the external cage in double cage motors. Performance tends to increase in all motors, but quantitatively, in a small way.
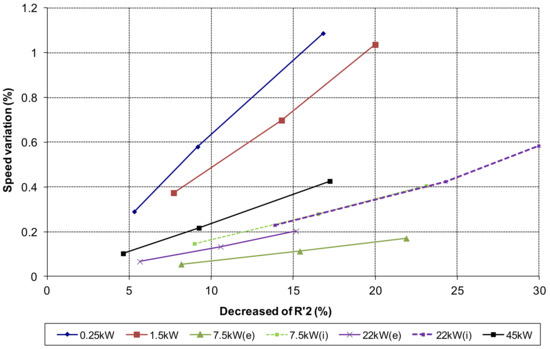
Figure 8.
Speed variation versus decreased of R′2 in all the motors (in the double cage motors, subscript e for external cage variation and subscript i for internal cage variation is used) (equal heating criteria).
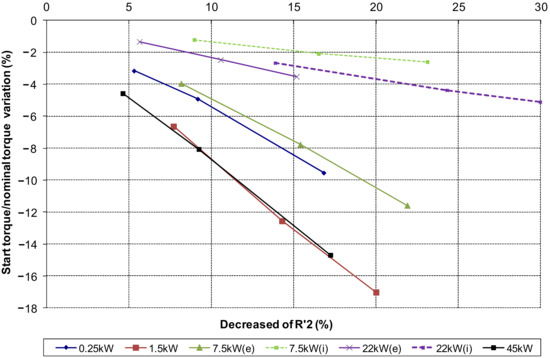
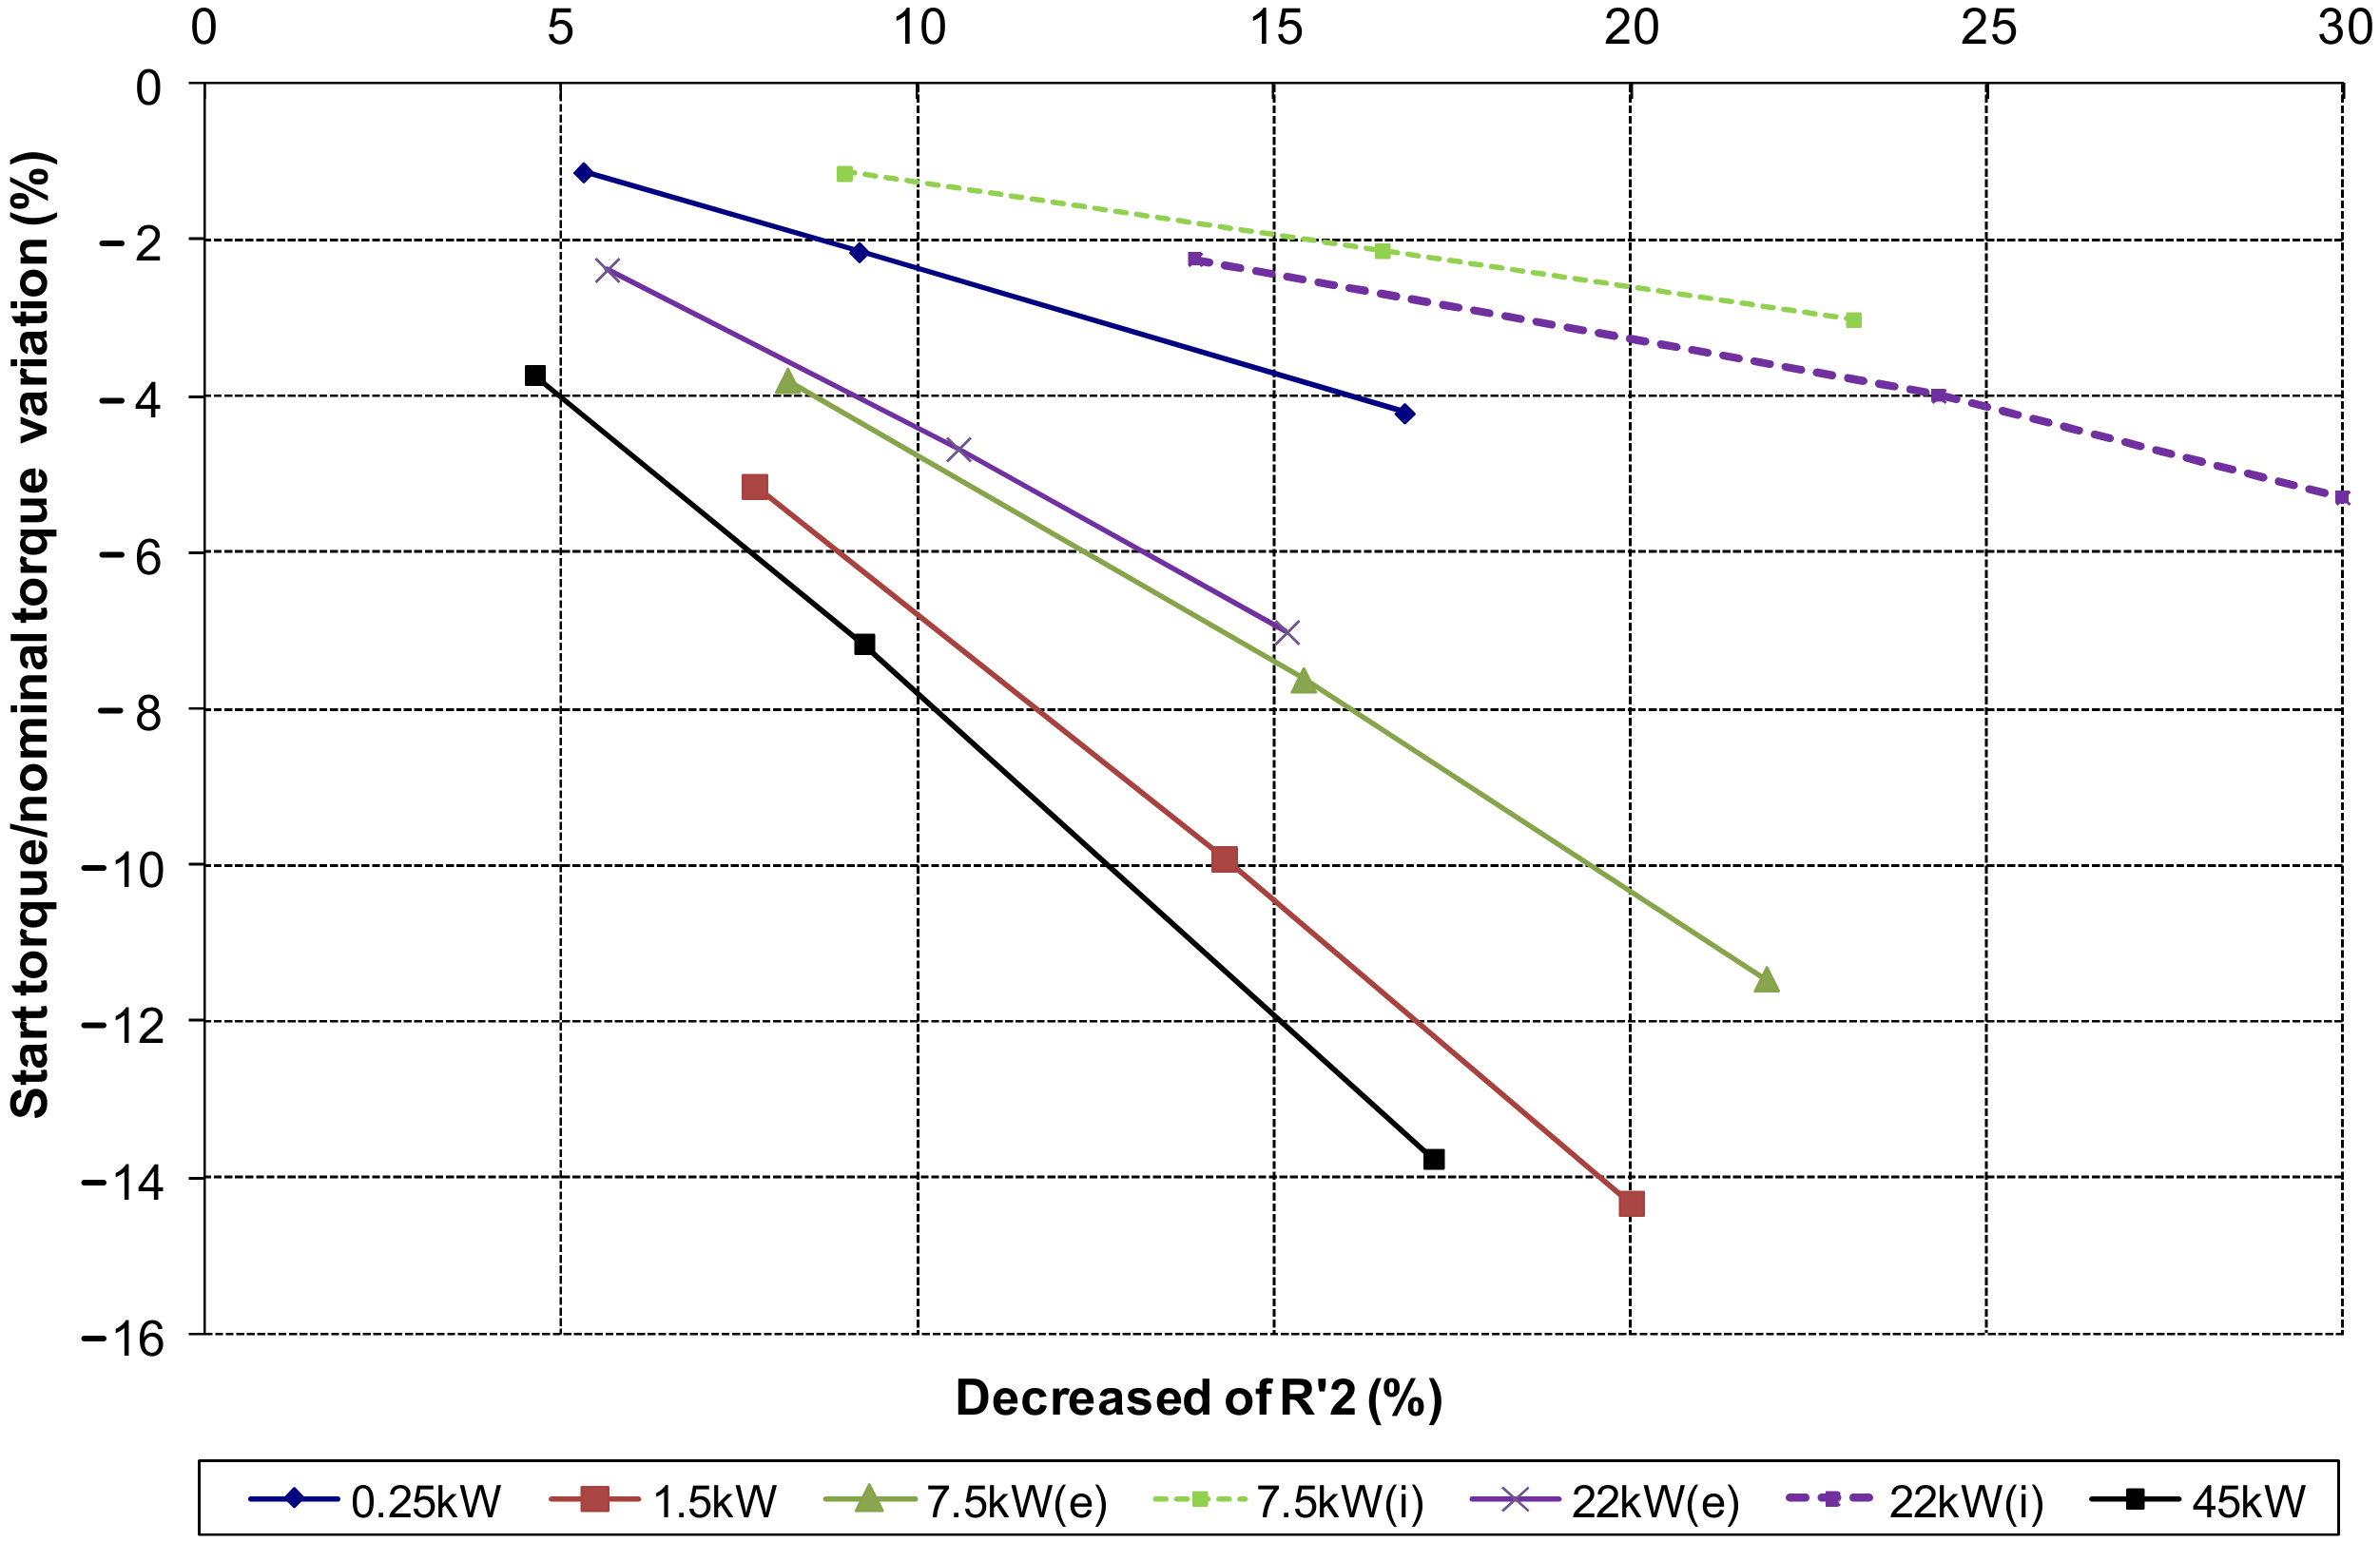
Figure 9.
Start torque/nominal torque variation versus decreased of R′2 in all the motors (in the double cage motors, subscript e for external cage variation and subscript i for internal cage variation is used).
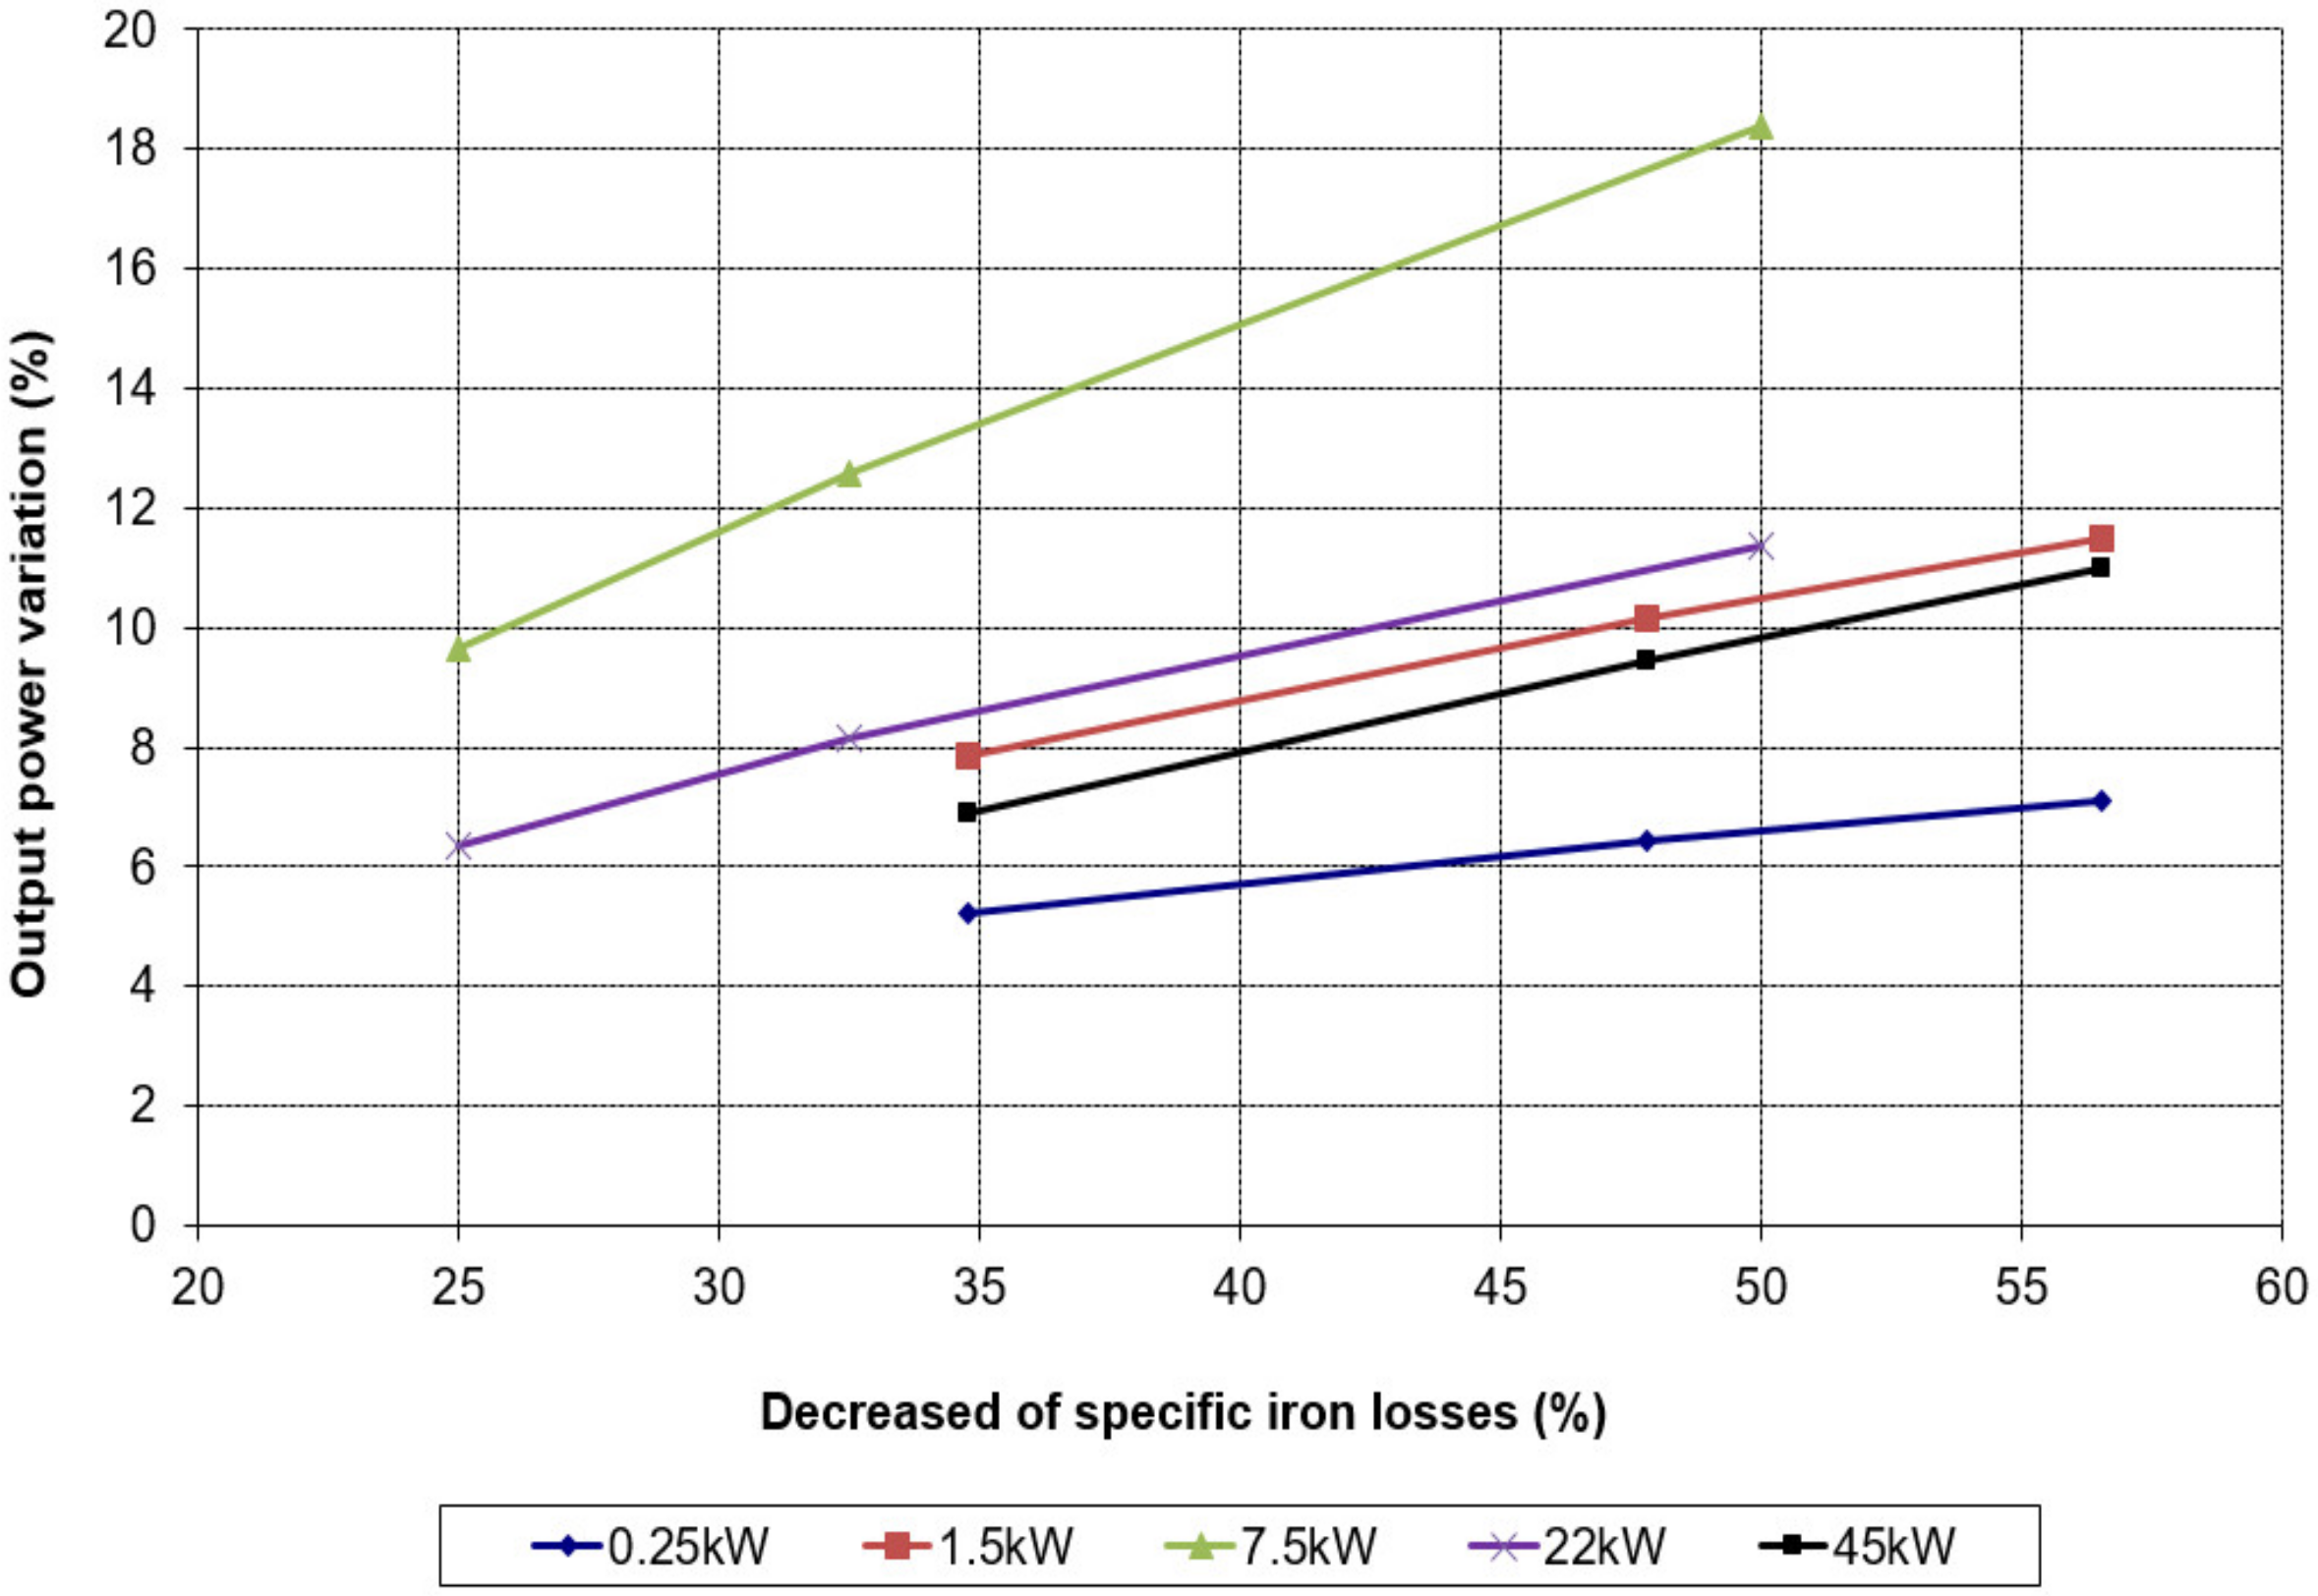
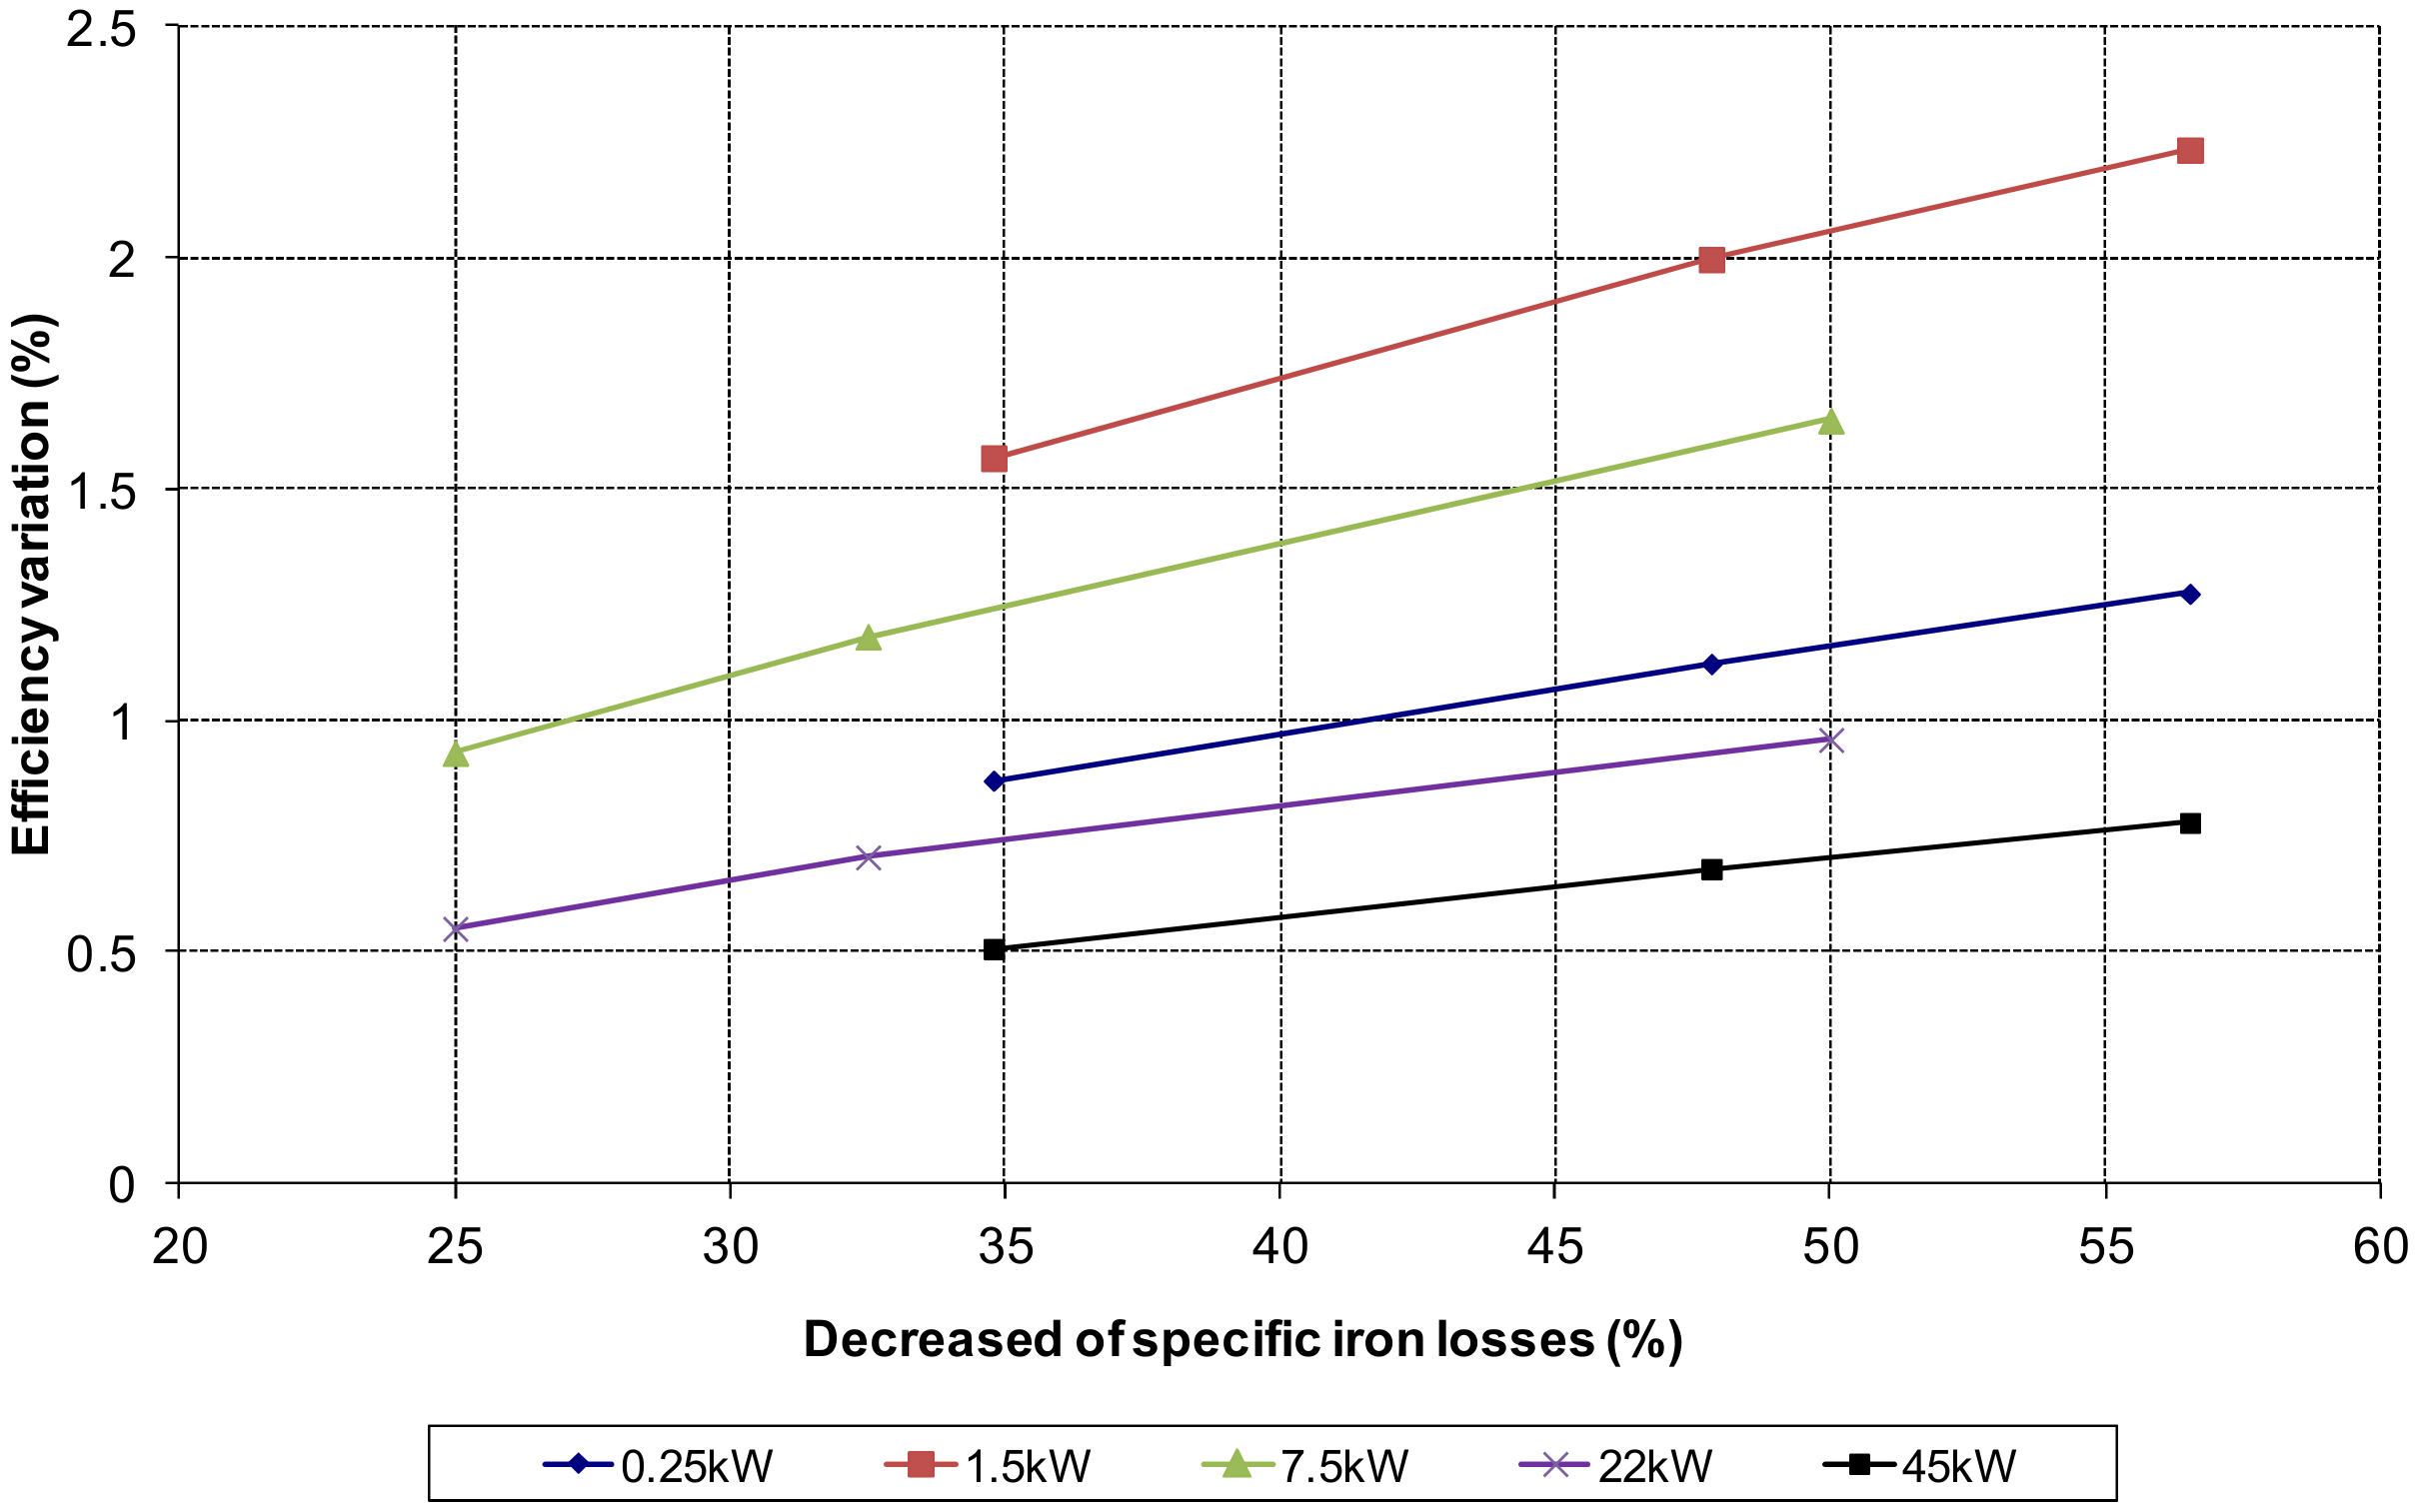
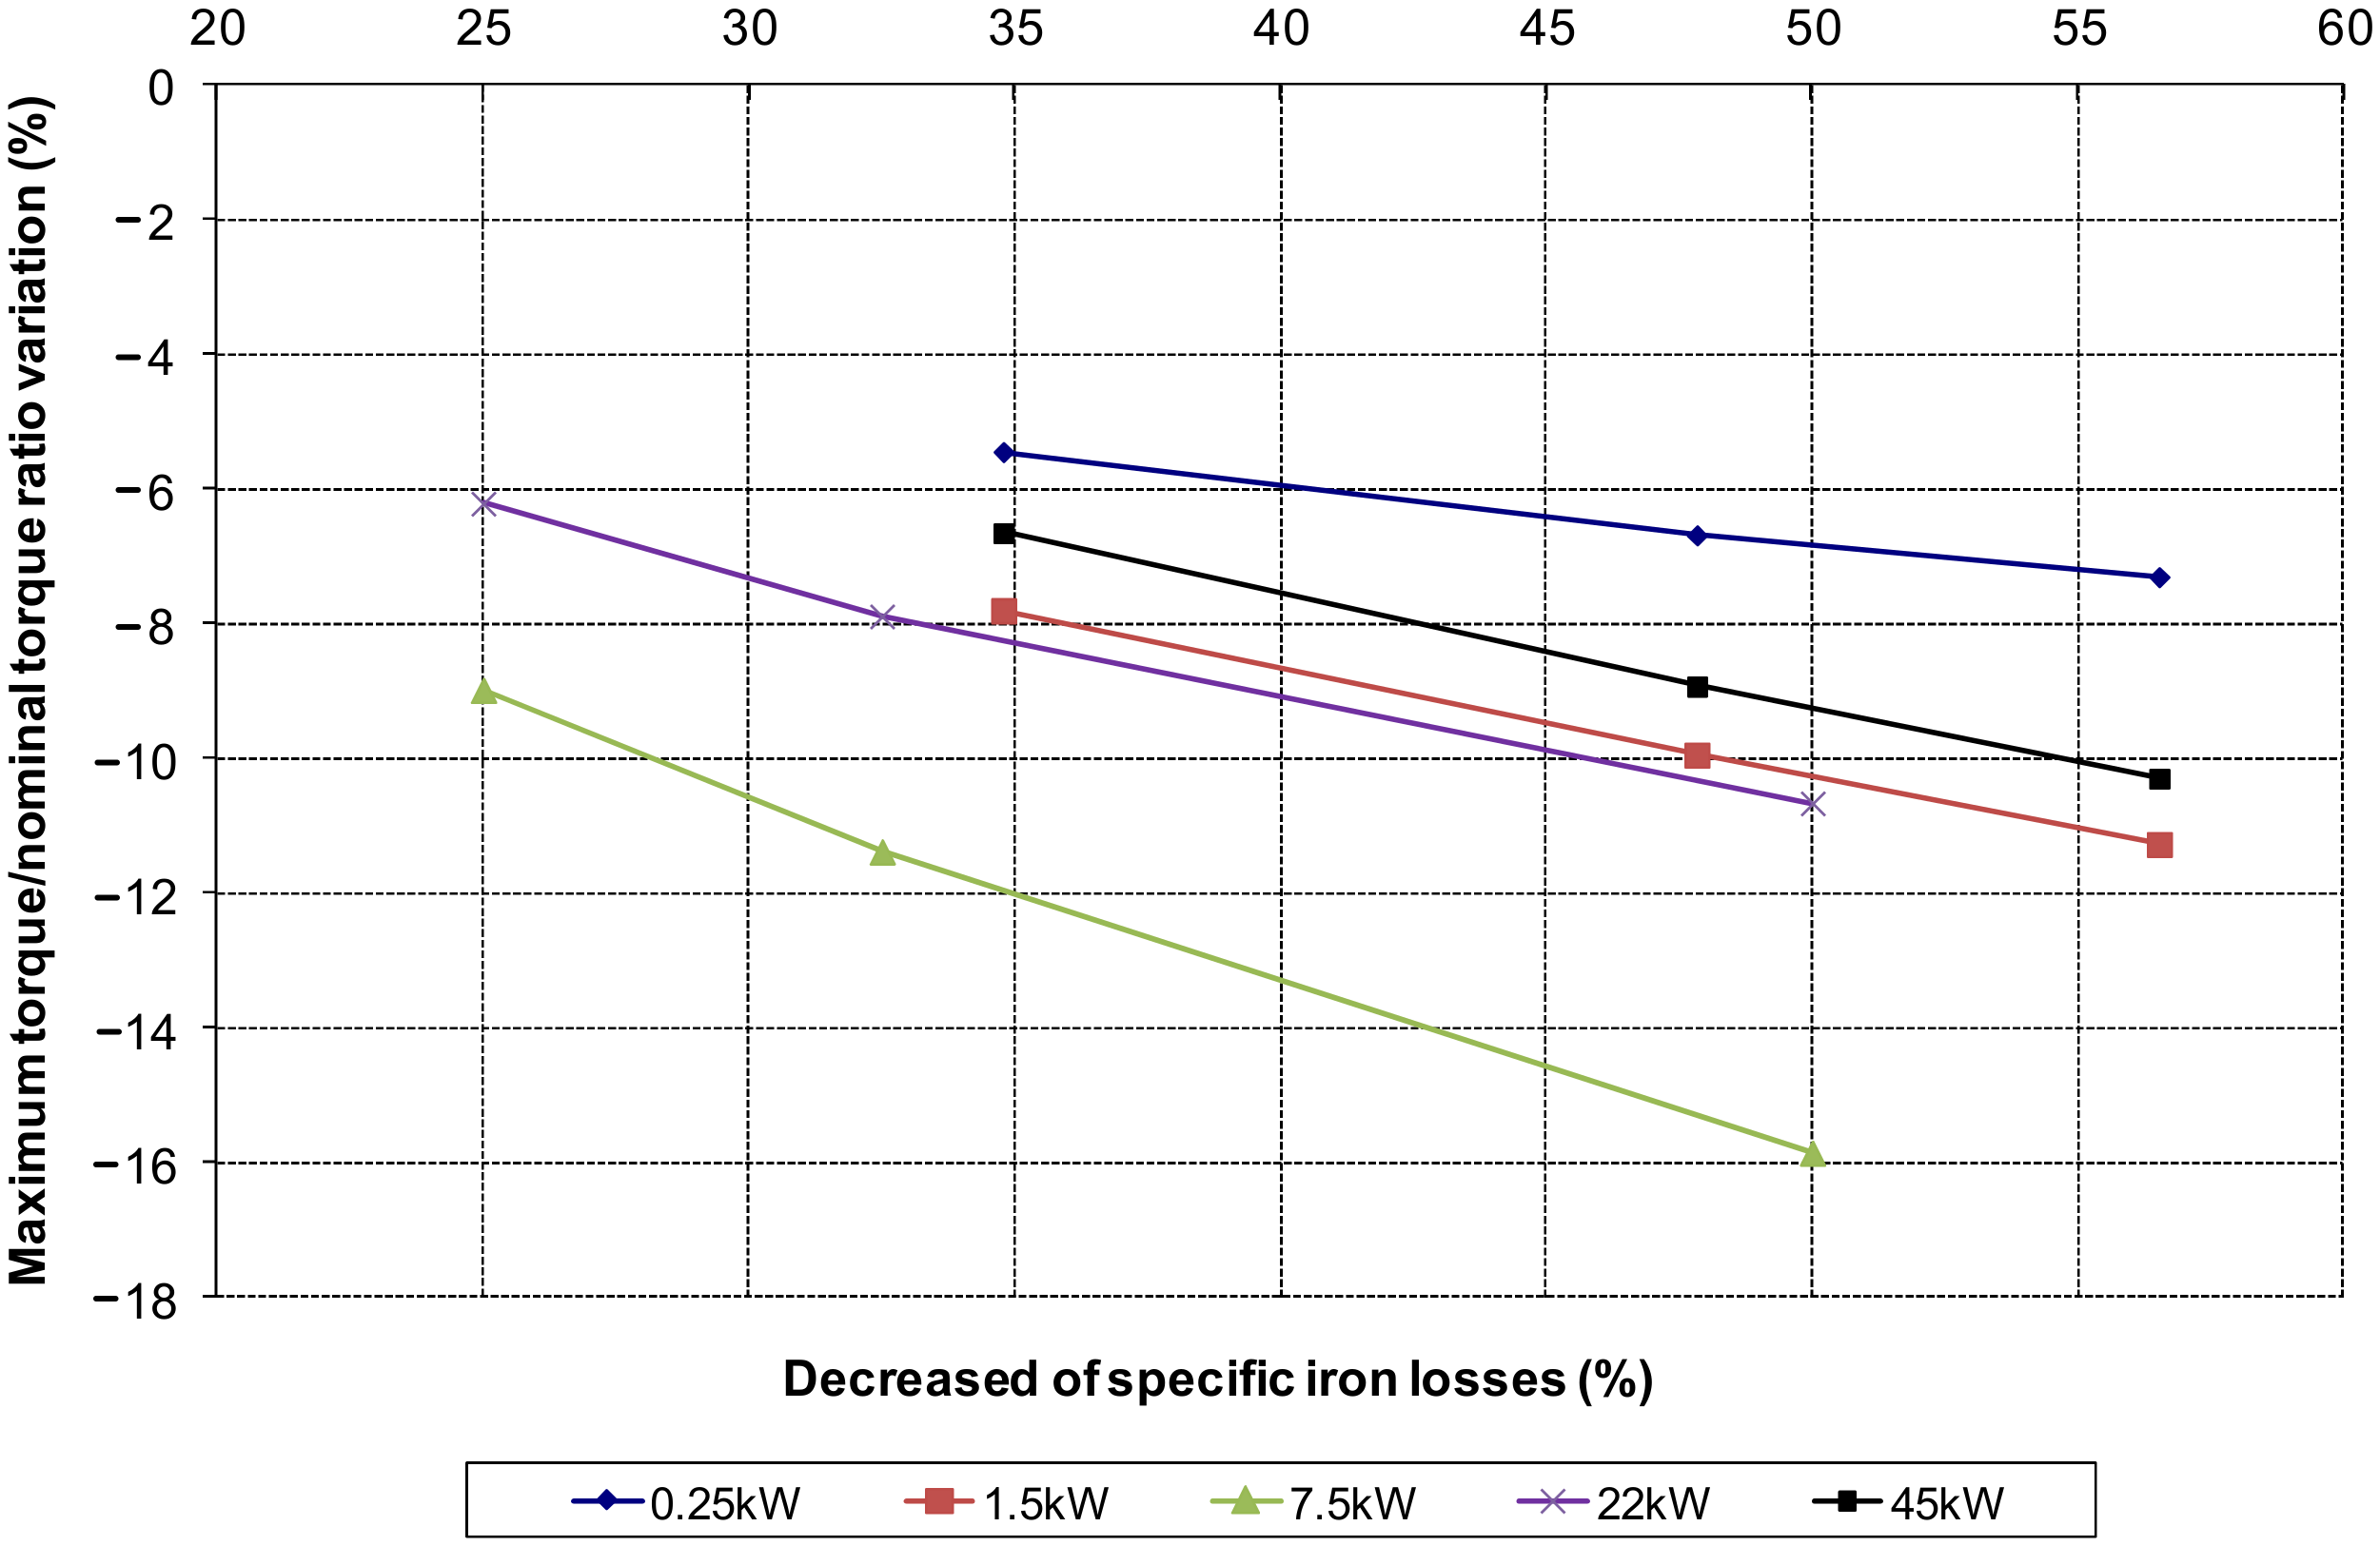
For variations of the specific iron losses in the ferromagnetic steel used, the most relevant results are obtained in effects on the nominal output power (Figure 10), as well as on the nominal efficiency (Figure 11), and on the start torque/nominal torque and maximum torque/nominal torque ratios (Figure 12). In the first two cases, the increase is noticeable, while the decrease is also significant in the indicated ratios.
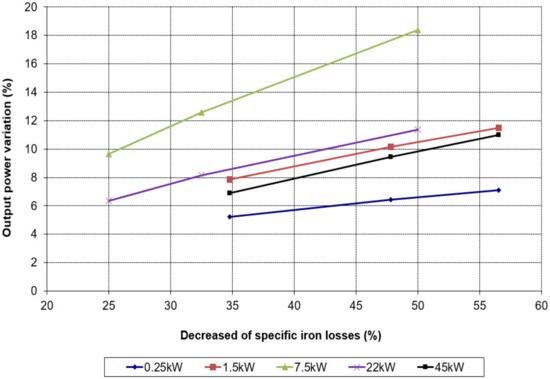
Figure 10.
Output power variation versus decreased of specific iron losses in all the motors.
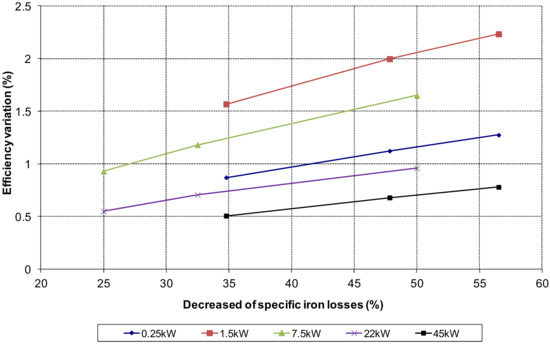
Figure 11.
Efficiency variation versus decreased of specific iron losses in all the motors (equal heating criteria).
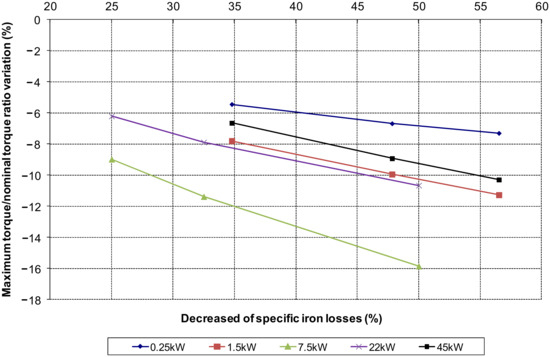
Figure 12.
Maximum torque/nominal torque variation versus decreased of specific iron losses in all the motors.
5.2. Equal Output Power Criteria
The most relevant results are shown below with the criterion of the equal nominal output power established by the motor manufacturer. By maintaining this power, consequently, all the variations adopted affect a decrease in motor losses, which means that the results in some analyzed performances are different with respect to the equal heating criteria.
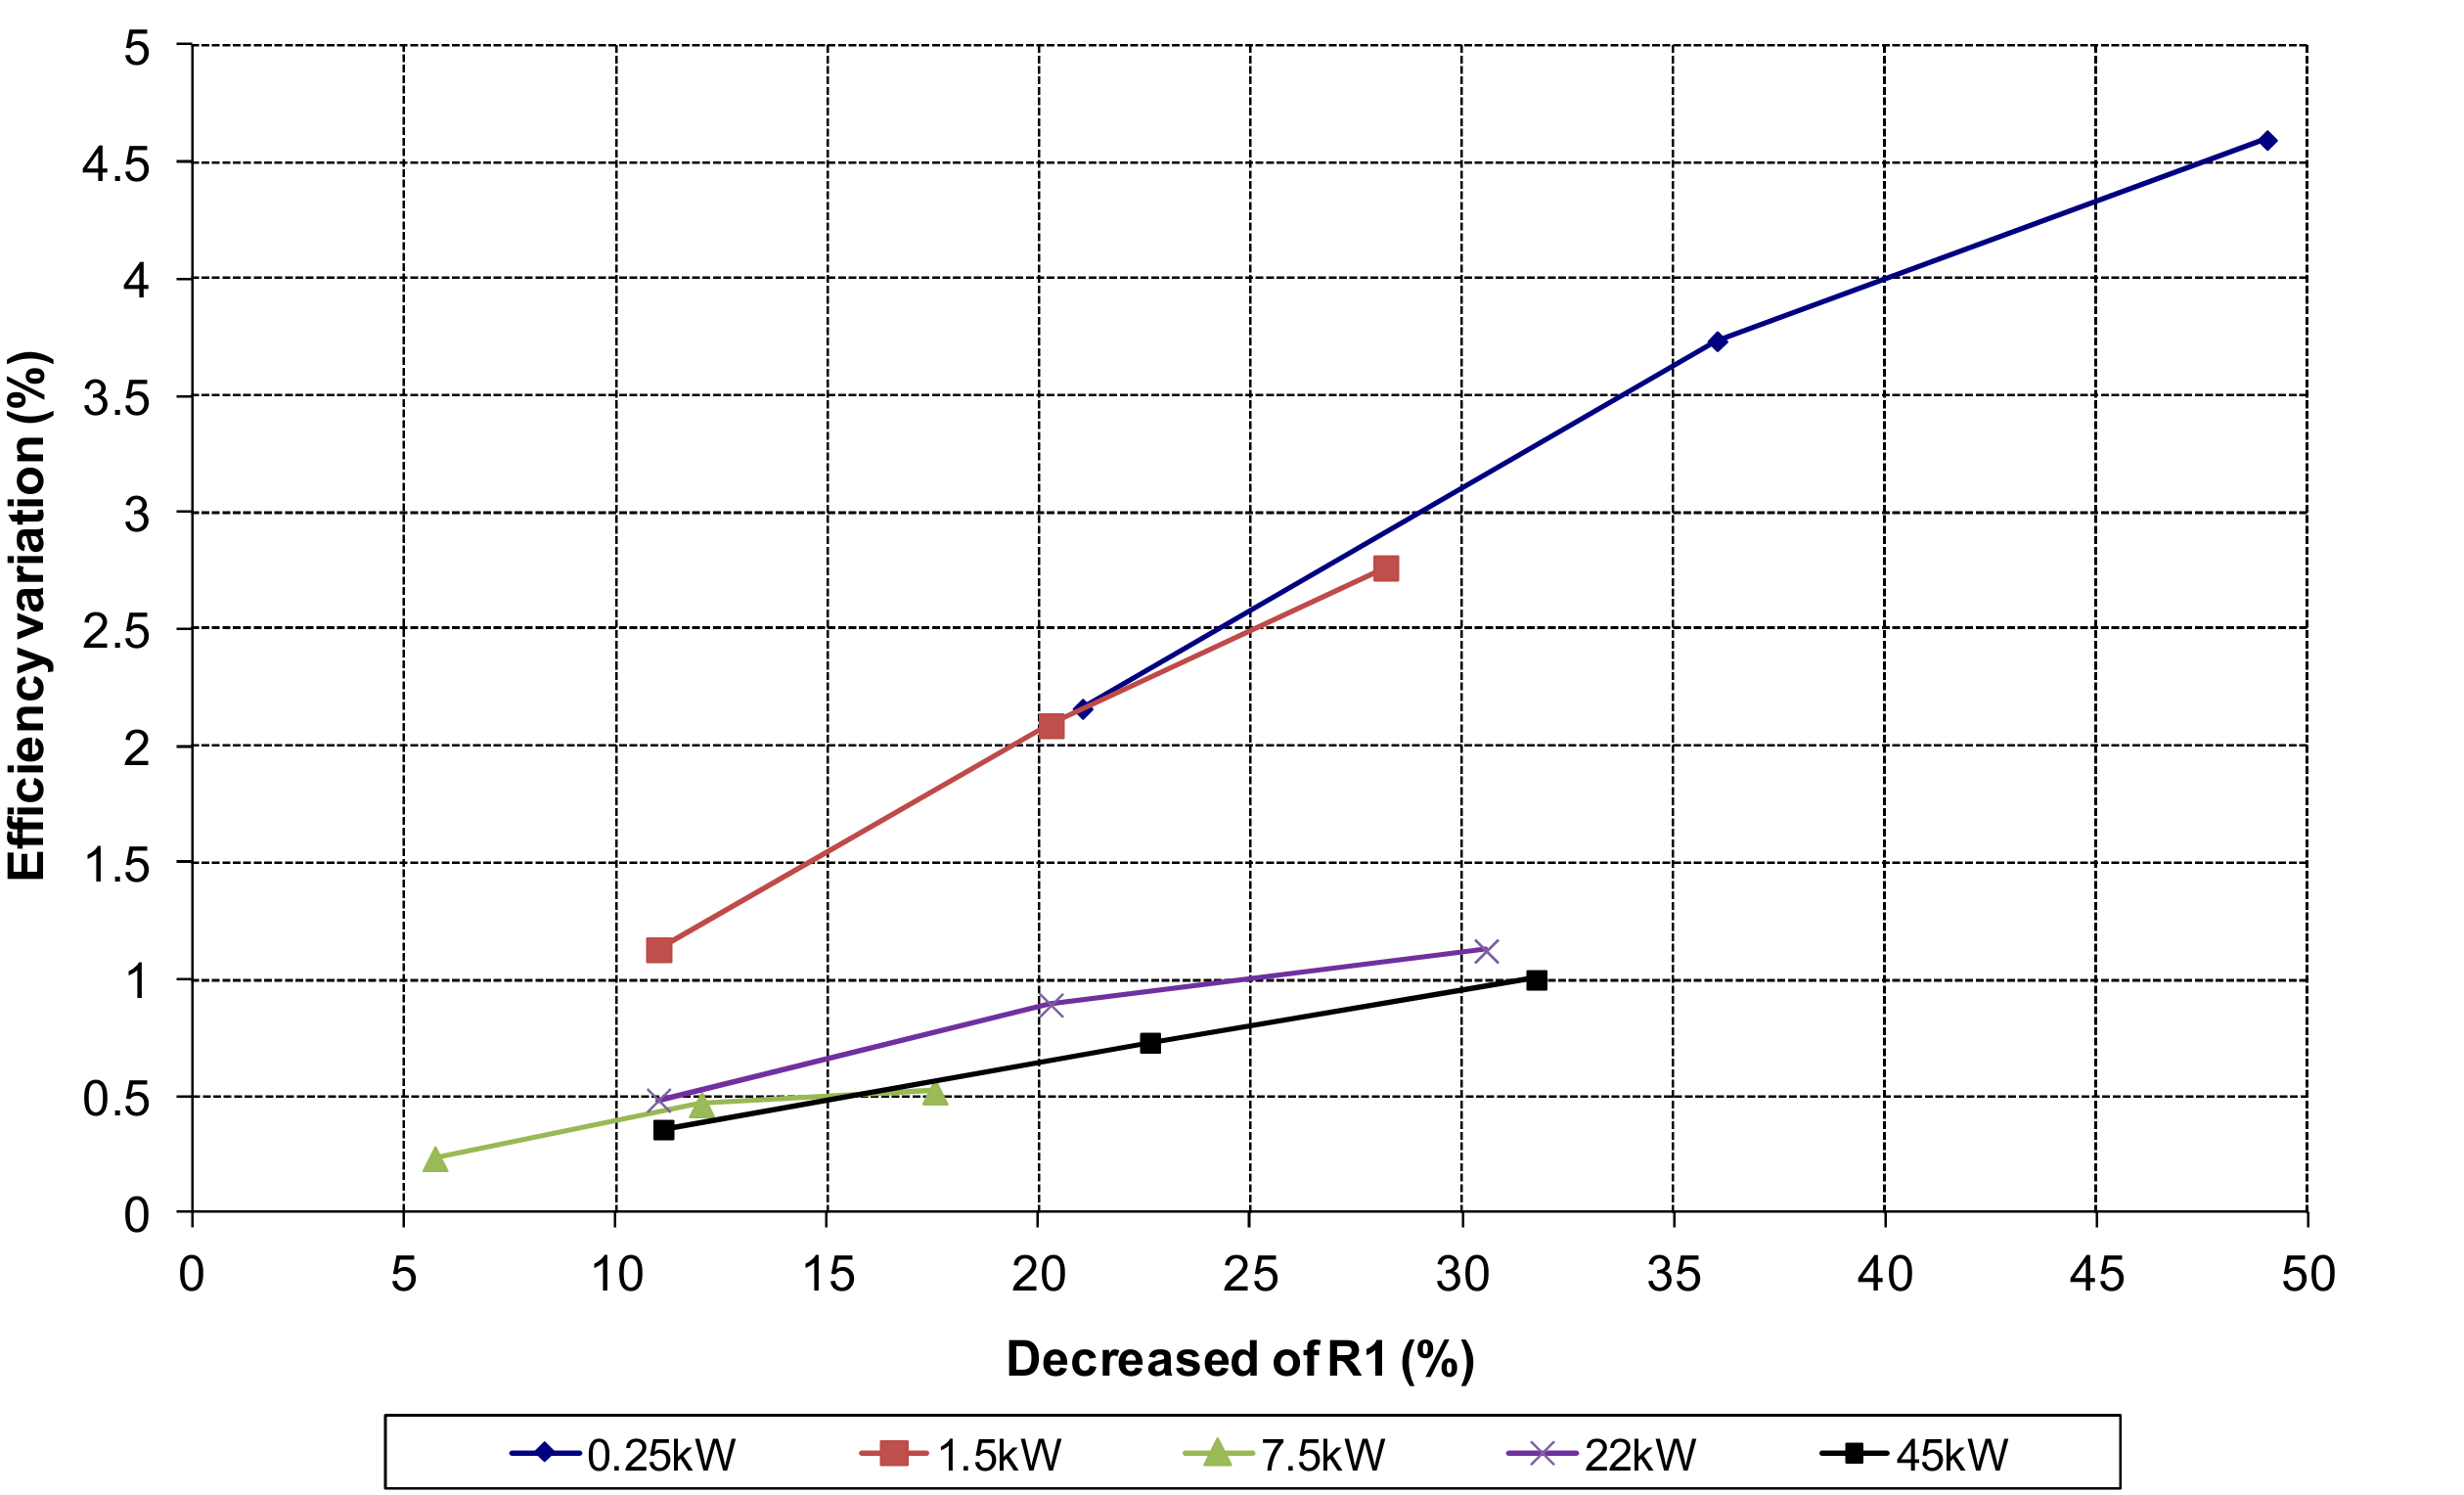
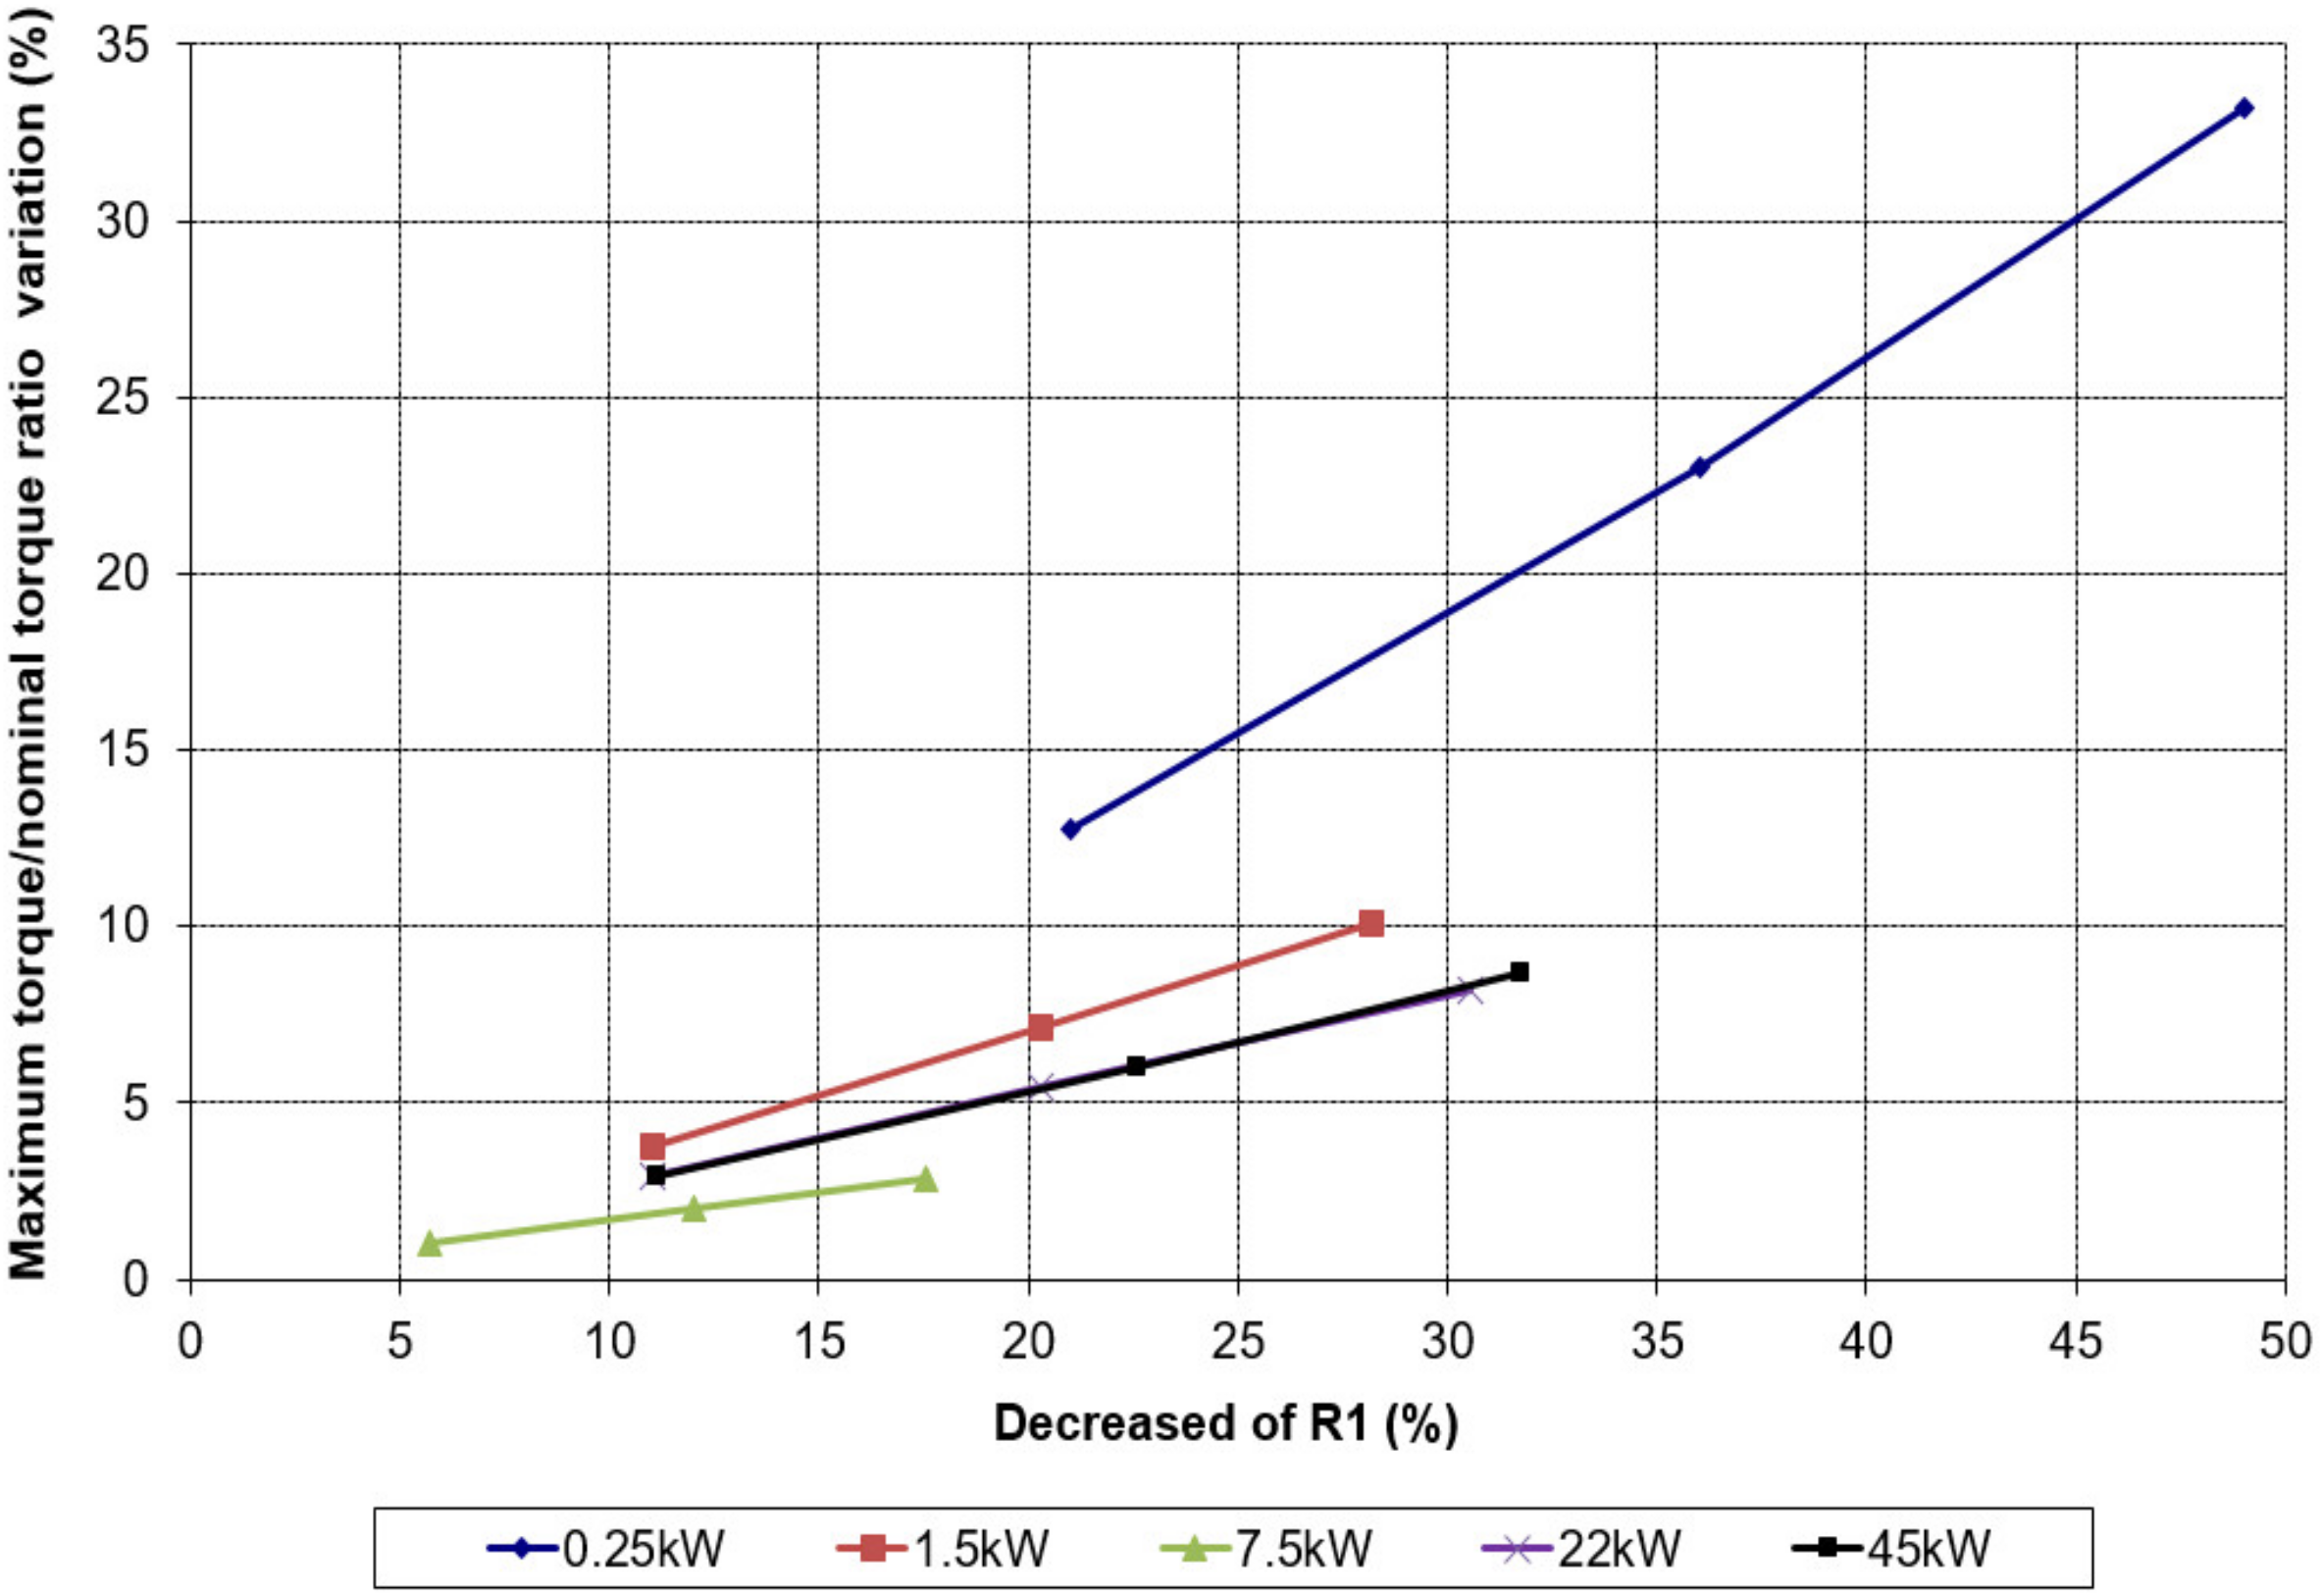
For variations in stator resistance, the most notable results are obtained in an increase in nominal efficiency (Figure 13) and the start torque/nominal torque and maximum torque/nominal torque ratios (Figure 14). The nominal speed also increases, and the power factor decreases in all cases, but quantitatively in a much less pronounced way.

Figure 13.
Efficiency variation versus decreased of R1 in all the motors (equal output power criteria).
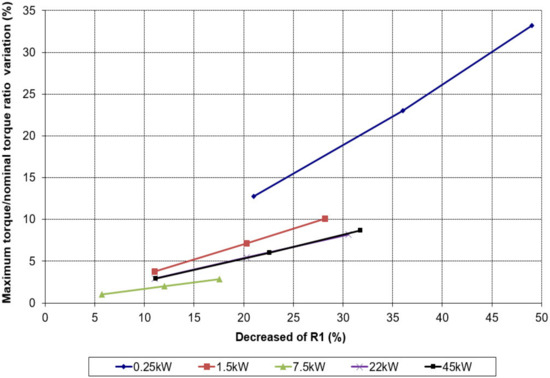
Figure 14.
Maximum torque/nominal torque variation versus decreased of R1 in all the motors.
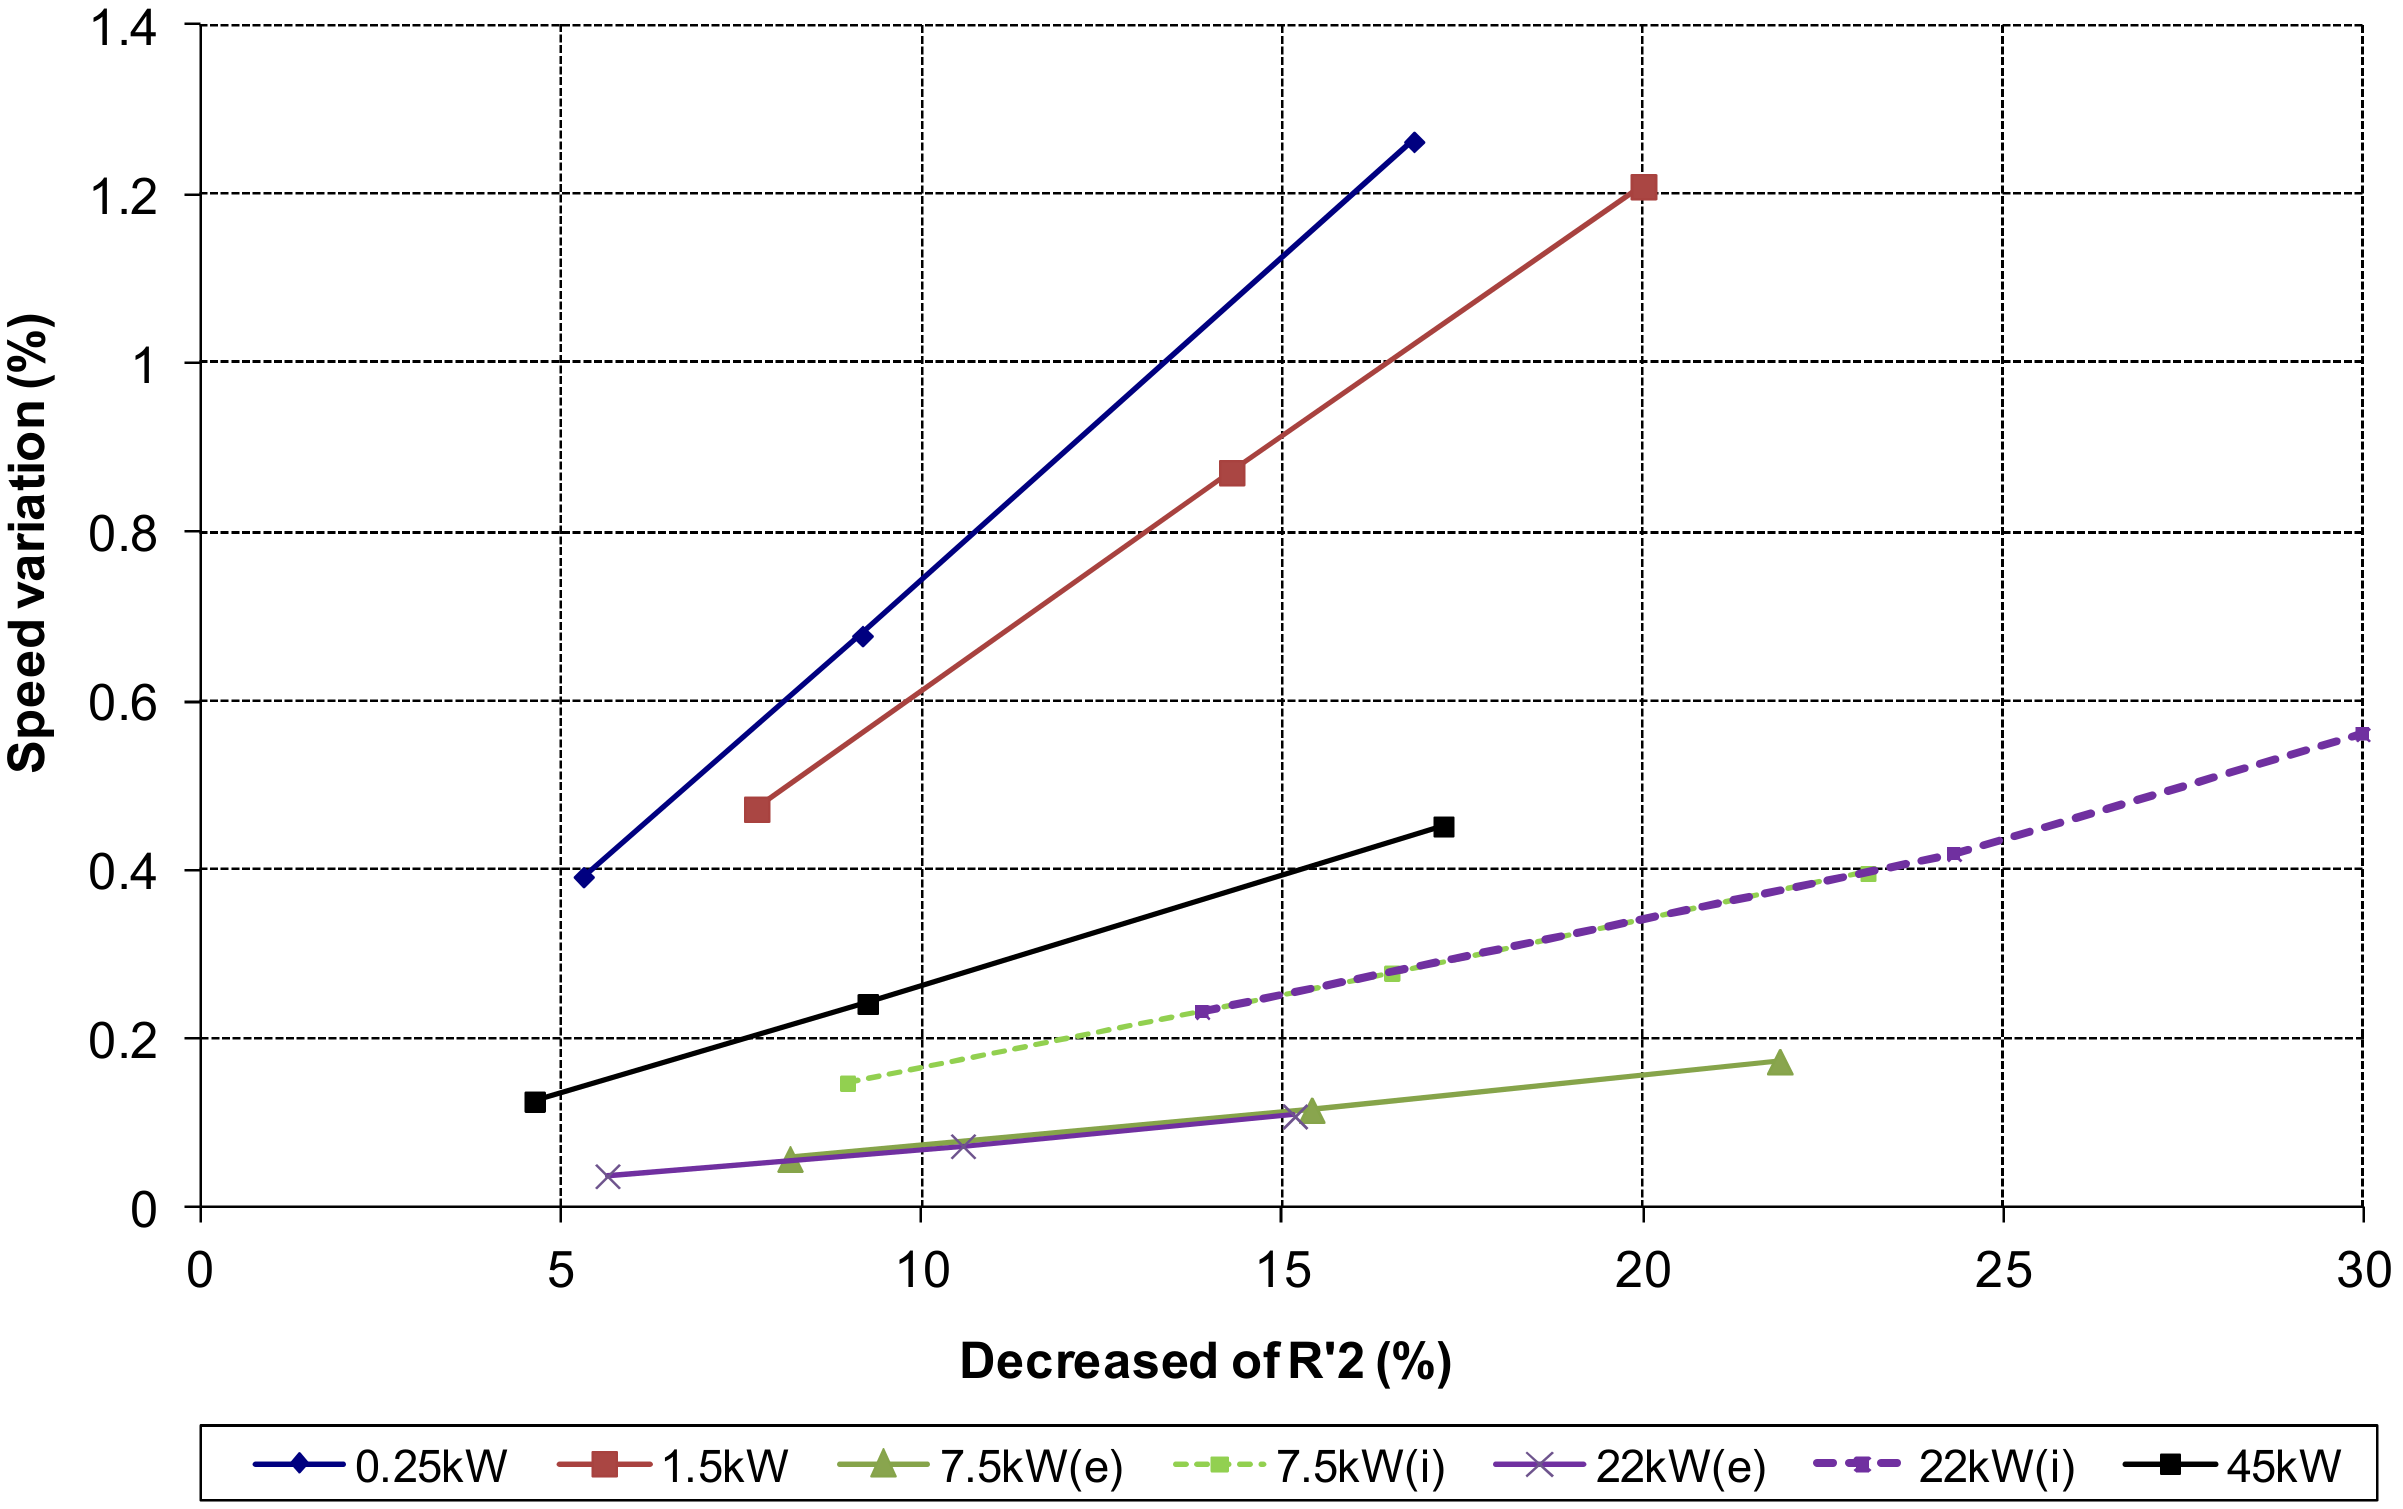
For variations in rotor resistance, the most relevant effects are seen in the increase in nominal speed (Figure 15) and the decrease in the start torque/nominal torque ratio (Figure 16), more significantly when decreasing the resistance of the external cage in double cage motors. In this case, the results are very similar to those obtained with the equal losses criterion. The performance undergoes minimal variations in different trends for each motor, and the power factor, whose tendency is mostly to decrease.
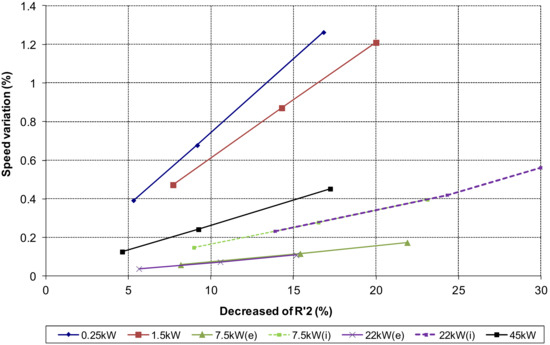
Figure 15.
Speed variation versus decreased of R′2 in all the motors (in the double cage motors, subscript e for external cage variation and subscript i for internal cage variation is used) (equal output power criteria).
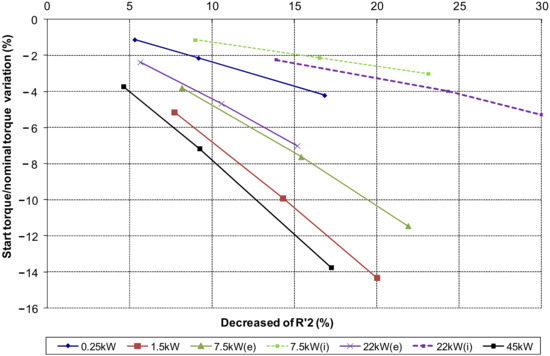
Figure 16.
Start torque/nominal torque versus decreased of R′2 in all the motors (in the double cage motors, subscript e for external cage variation and subscript i for internal cage variation is used).
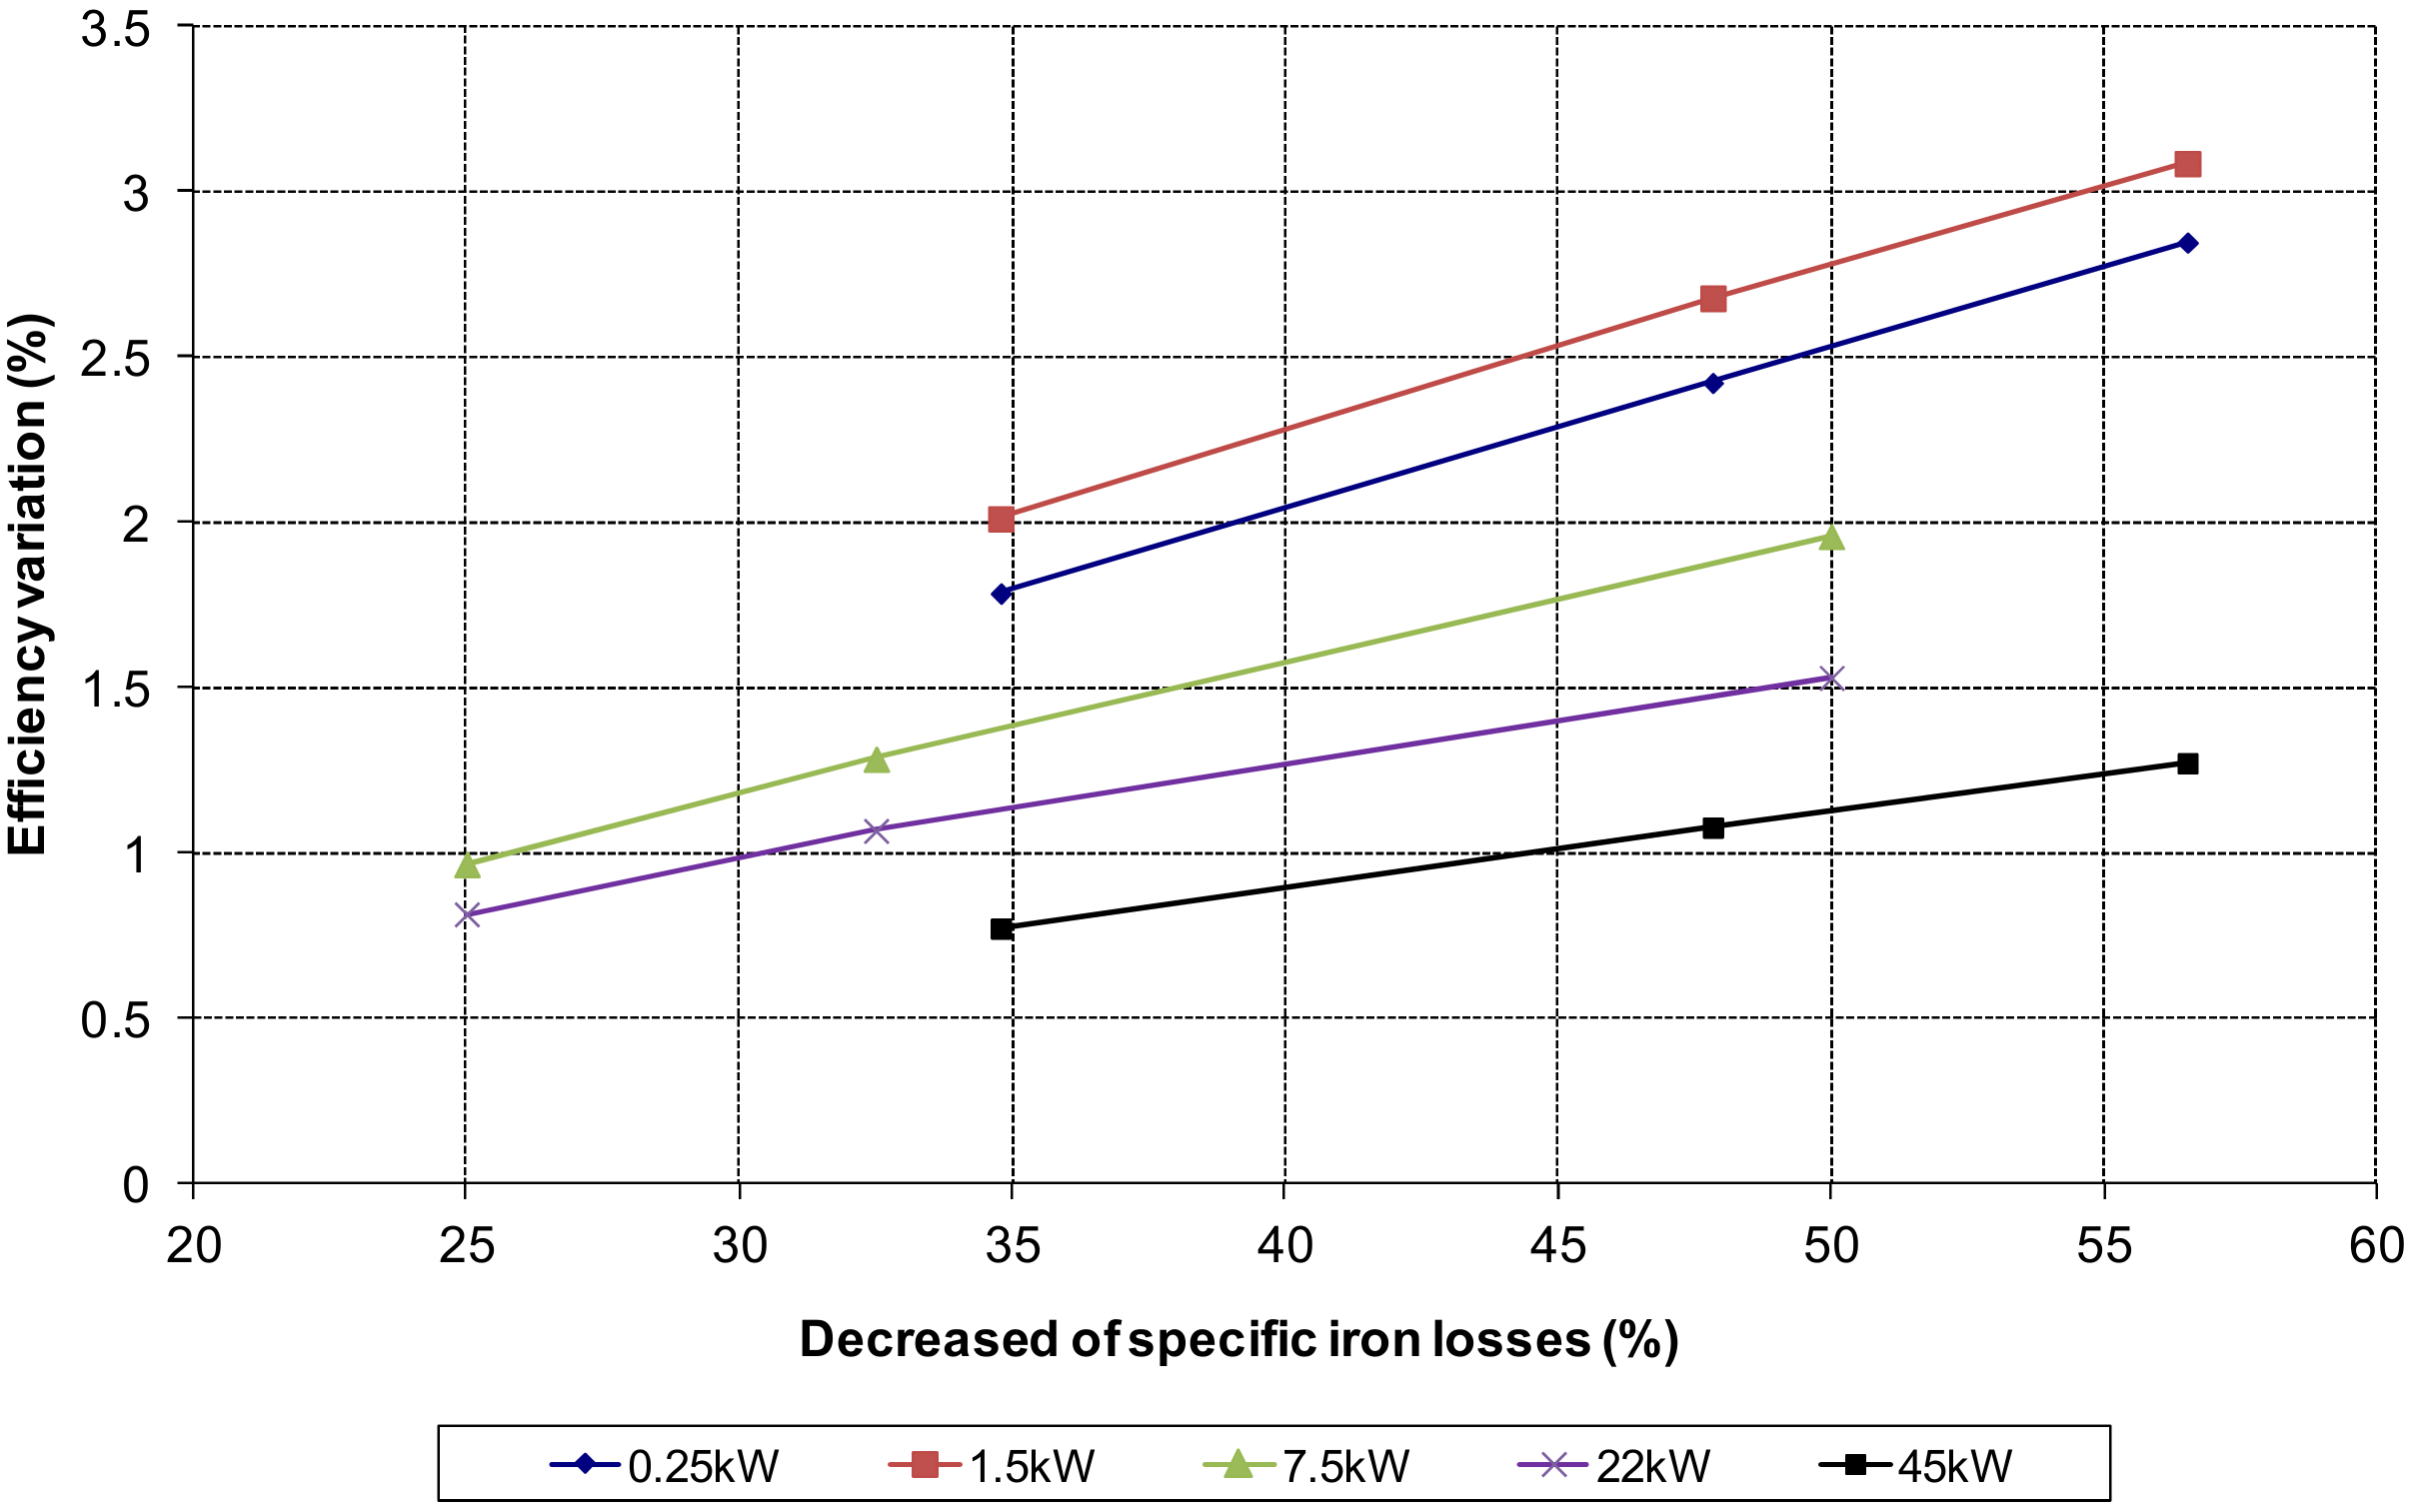
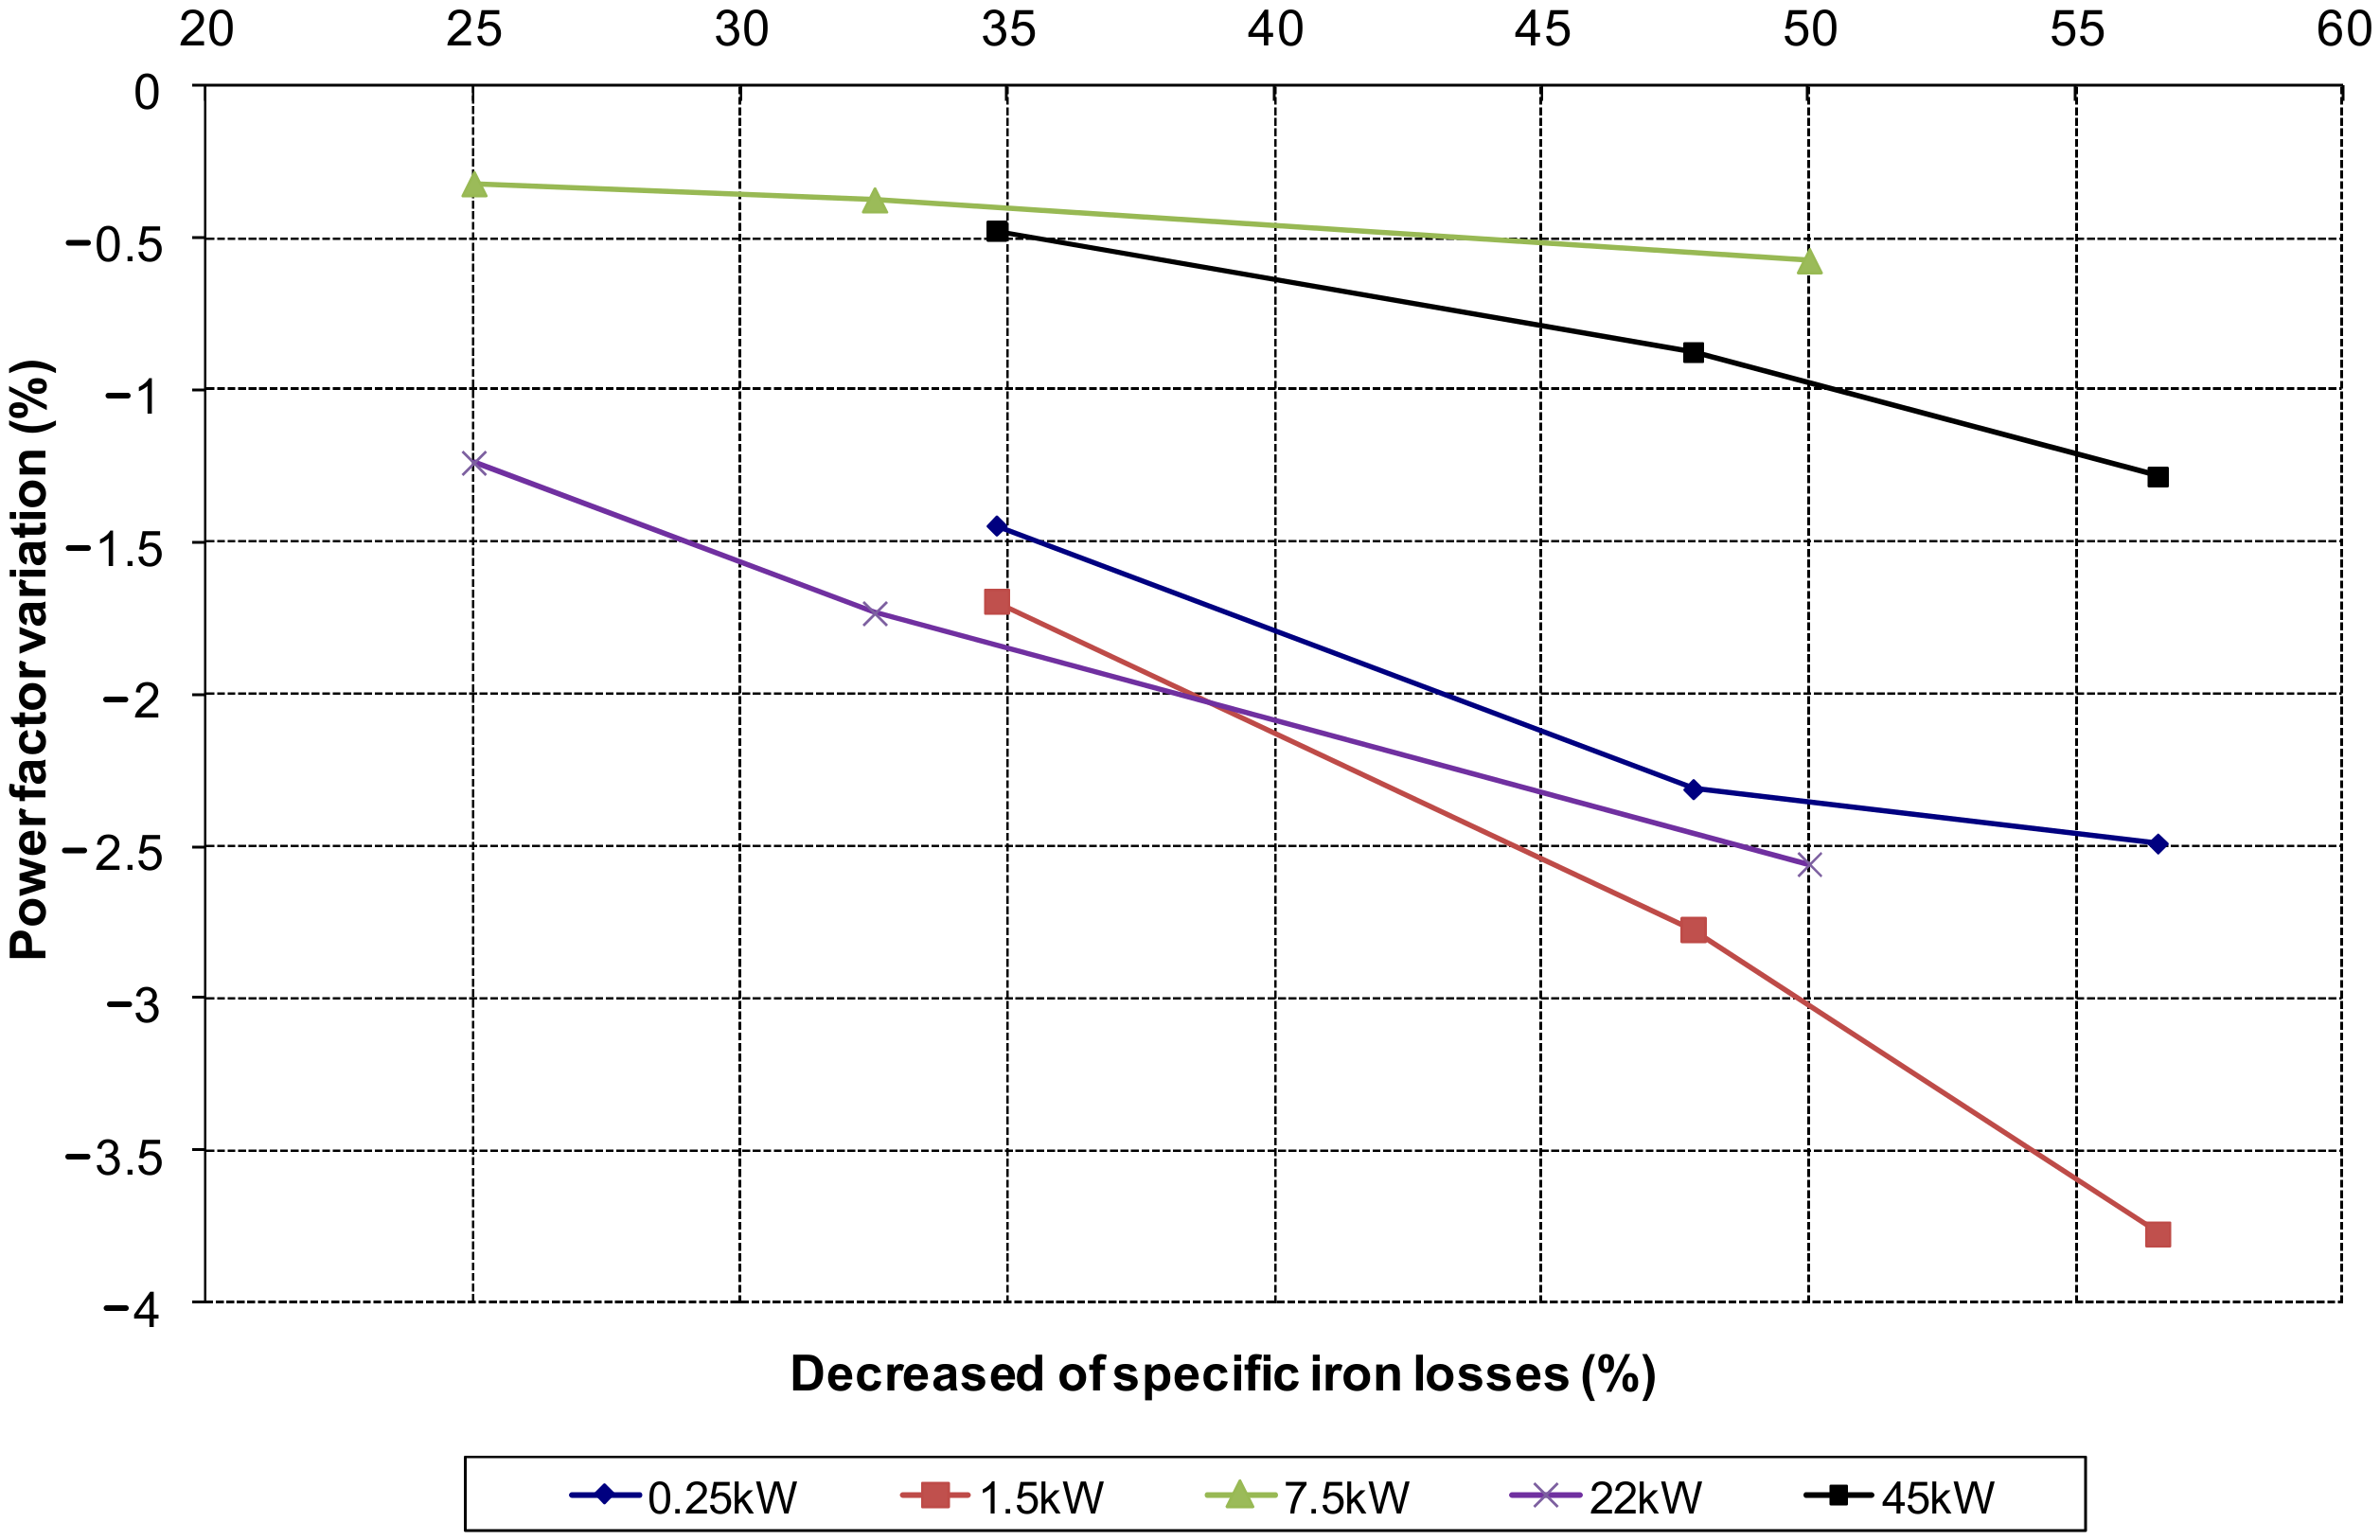
For variations of the specific iron losses in the ferromagnetic steel used, the most appreciable results are an increase in the efficiency (Figure 17) and a decrease in the power factor (Figure 18). In the other parameters, the evolution does not follow a clear trend for all motors.
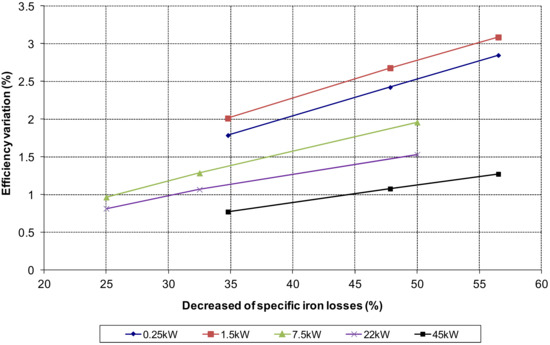
Figure 17.
Efficiency variation versus decreased of specific iron losses in all the motors (equal output power criteria).
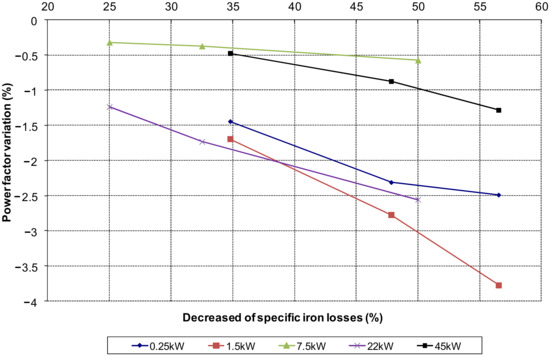
Figure 18.
Power factor variation versus decreased of specific iron losses in all the motors.
6. Application Example: Efficiency Improvement Strategy
As an example of applying the data obtained in the proposed study, this section establishes the efficiency improvement strategy [18], combining constructive variations quantified in the study carried out for each motor [19]. The analysis of all the numerical results and the graphs obtained allows establishing a specific strategy for each motor, highlighting, from the trends observed in Section 5, that the decisions for the efficiency improvement strategy are very similar in the different motors studied.
Table 11 summarizes which decisions are deemed most convenient for each motor, as well as the results obtained. The criterion of the same output power has been taken as a reference to unify the results better. In addition to the improvement obtained from the efficiency at full load, it is quantitatively highlighted how the efficiency at ¾ and ½ of the full load is affected [20].
Table 11.
Efficiency improvement strategy.
The convenience of adopting any of the constructive variants will be influenced by the logistical aspects of material availability and, especially, the economic factors. In this sense, we believe that the interest of the study lies in having, in a quantitative way, the margin of improvement associated with each change. Therefore, it is a powerful tool to aid decision-making.
For example, it is evident a priori that the motor efficiency will improve using a better ferromagnetic steel quality. However, how much does efficiency improve? That is where the work presented gives answers. Of course, the next question would be, how much money does this change cost? That is more complex to respond to since it depends on the fluctuations of the materials in the market and on the opportunities that each company will have to acquire these materials in such a changing market. Even so, we will use the following economic data of the materials used in work. Knowing should take these data with great caution by what was previously commented: 5.5 EUR/kg for the copper of the stator conductors, 1.8 EUR/kg for the aluminum of the rotor cage conductors and 2.3 EUR/kg increase for using a higher ferromagnetic steel quality with lower specific iron losses [21].
For the final decision, the operating conditions of the motor in a given application and the economic costs (hours of annual operation, estimated load index, duty cycle, cost of energy, and cost of materials) will have a lot of influence. Additionally, and given as a reference, an operating scenario has been established that allows obtaining numerical results in this regard. An annual operation of 4500 h (2000 h at full load, 1500 h at 3/4 full load, and 1000 h at 1/2 full load) and an energy cost of 0.08 EUR/kWh (industrial rate) have been pre-set. The economic parameters calculated are the energy-saving in kWh, which allows obtaining the annual economic saving from the cost of energy. The necessary investment in the materials (additional copper in the stator, extra aluminum in the rotor, and use of ferromagnetic steel of higher quality) to finally determine the payback of the investment made in years. This payback result is solely calculated from the additional direct cost of the new materials used without taking into account the possible logistics and industrial benefit costs associated with the adoption of the considered construction variations. The results obtained for each motor are presented in Table 12.
Table 12.
Economic evaluation (4500 h/year).
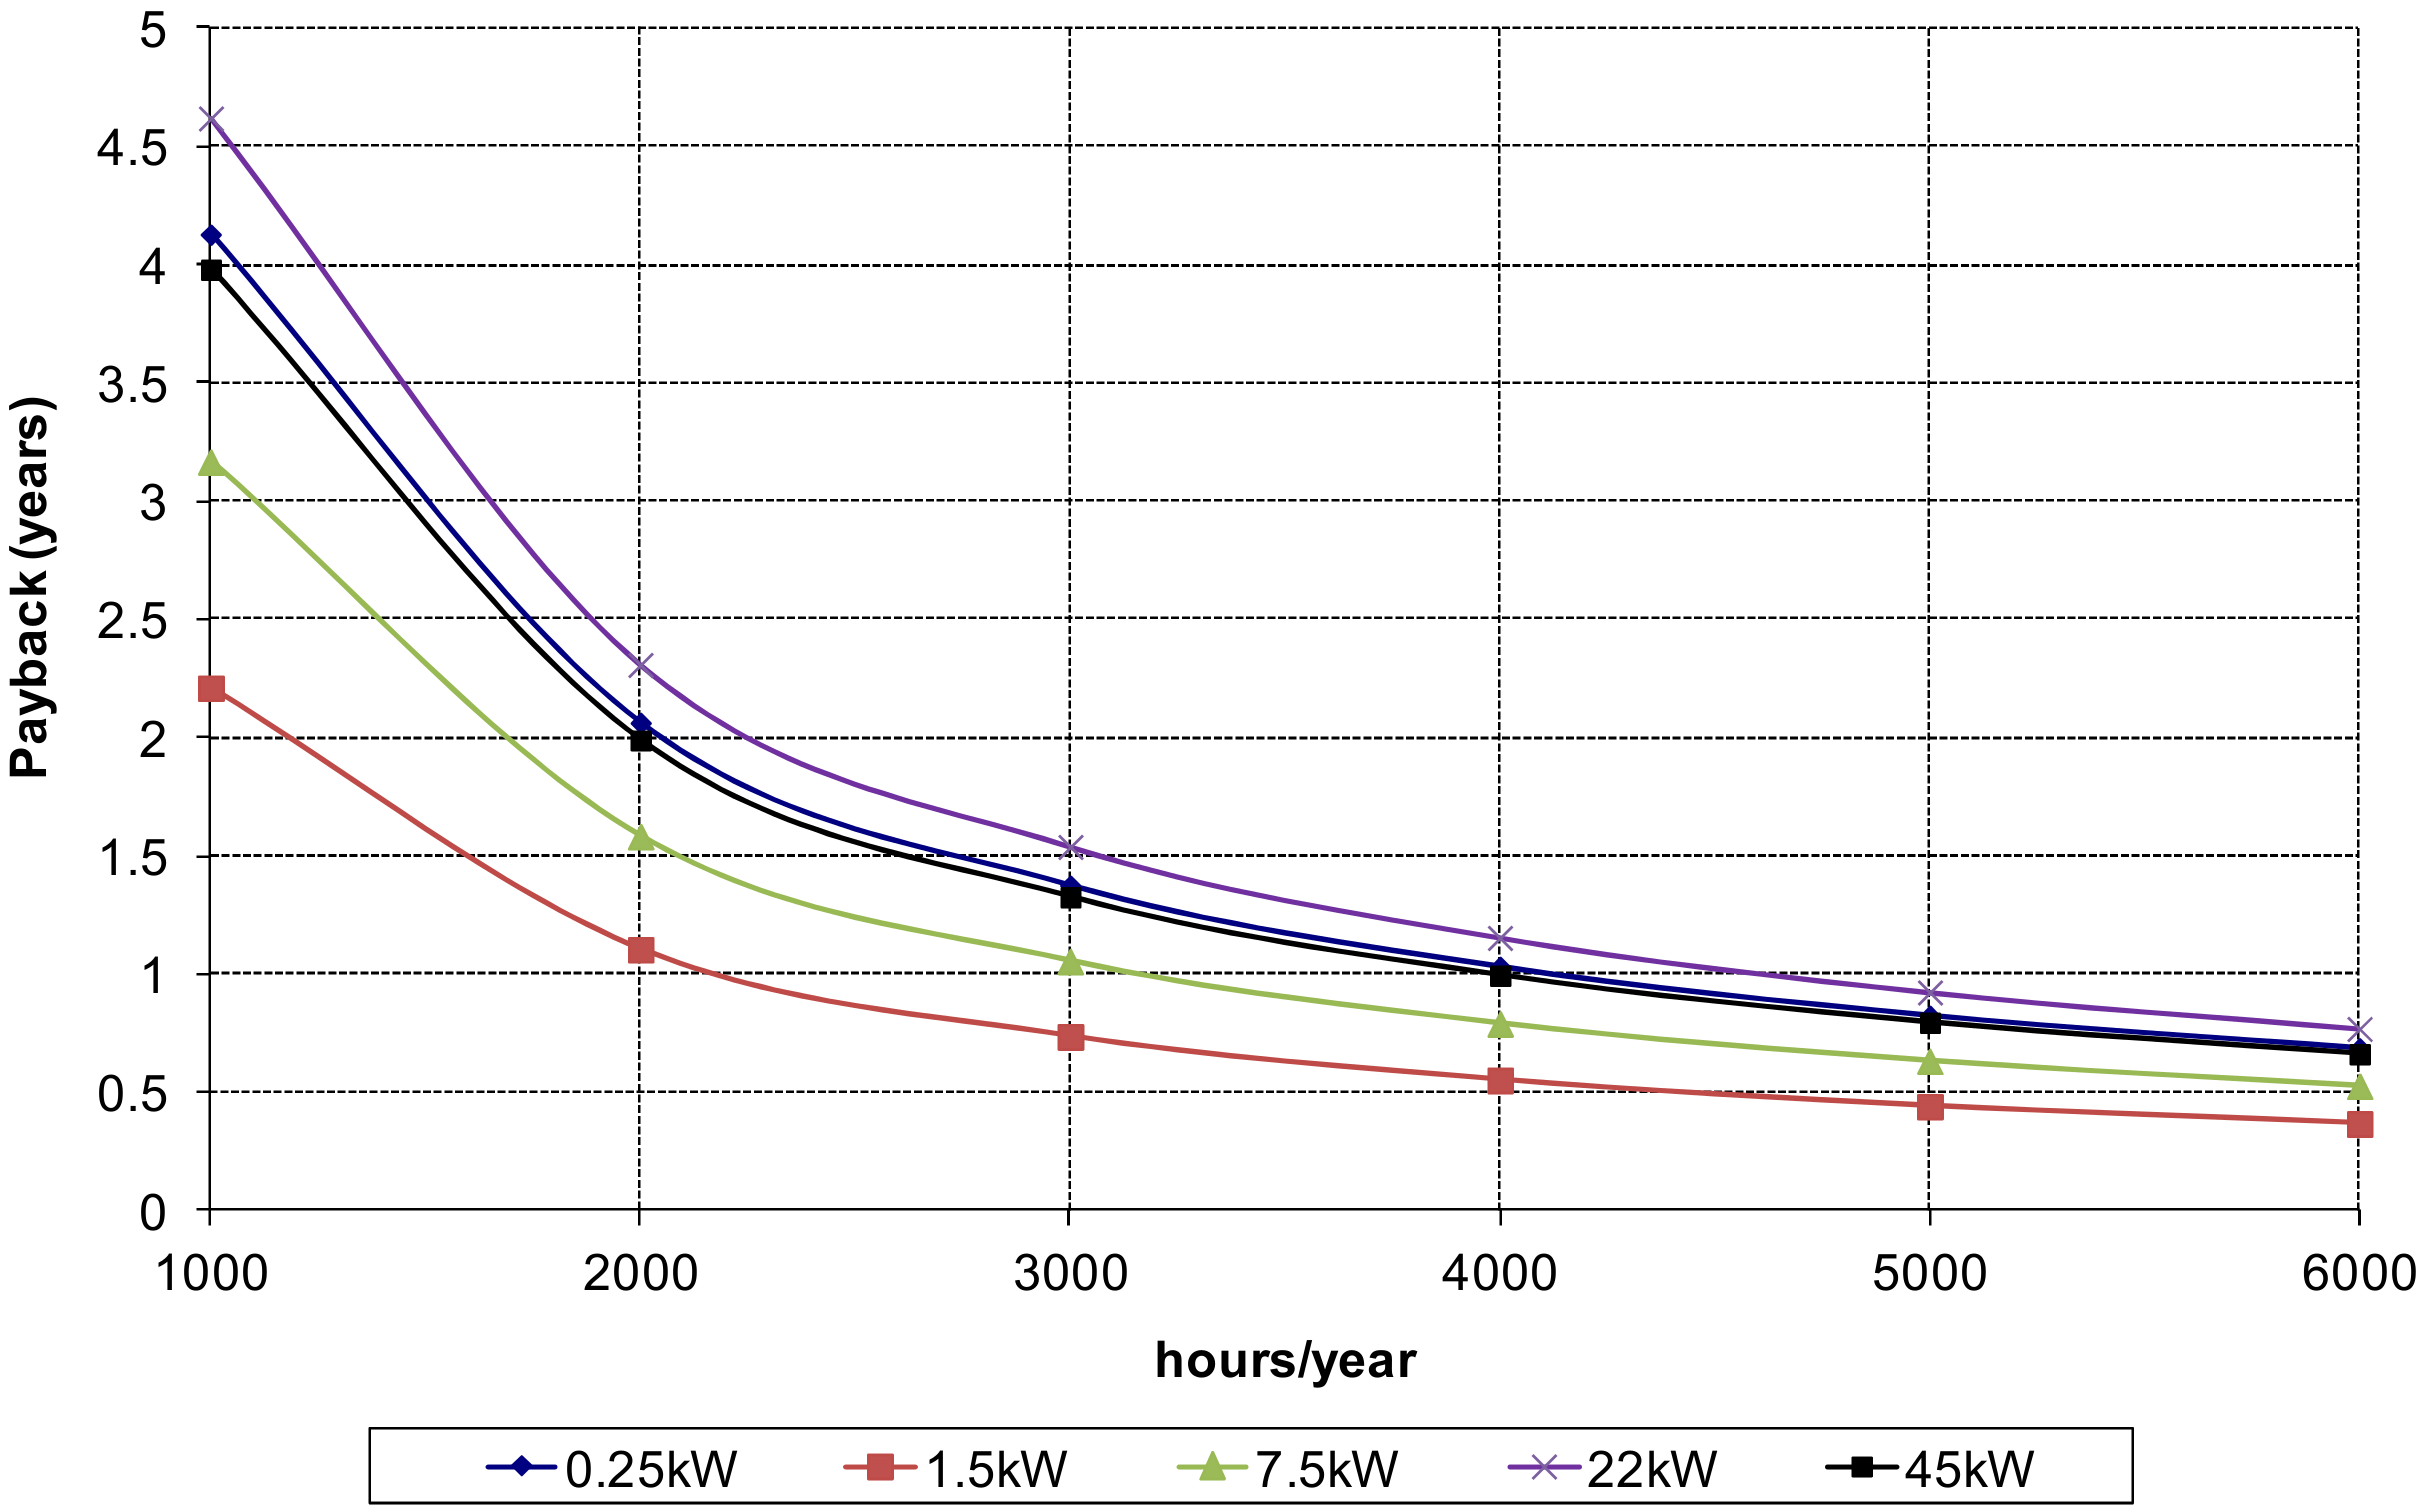
As this economic assessment is very sensitive to the number of hours of annual motor operation, Figure 19 shows the evolution of the payback according to the number of hours/year, considering a duty cycle of 45% of hours at full load, 35% of hours at 3/4 of full load and 20% of hours at 1/2 of full load [22]. Although these results have not been evaluated in this study, they would allow an analysis of the environmental impact derived from the measures adopted, with reference to the materials used and the associated energy savings, through the study of the life cycle of modified motors compared to initial motors [23,24].
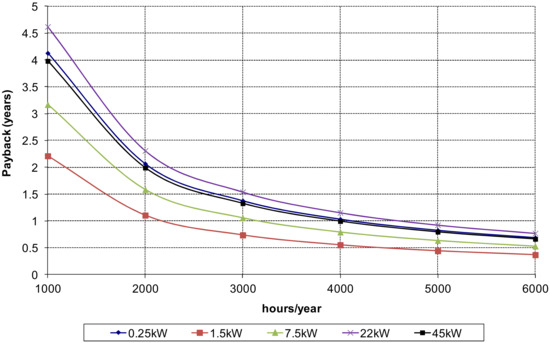
Figure 19.
Payback versus of the hours/year in all the motors.
7. Conclusions
The tools of the equivalent circuit solved using spreadsheets and the simulation programs solved using the finite elements method make it possible to address the consequences of potential changes in the design of induction motors extensively. The obtained numerical results allow, clearly and objectively, to establish possible improvement strategies for the motor operation. The extension of the study also allows how the rest of the operating variables are affected when the improvement strategy is applied for a given parameter.
The wide use of three-phase induction motors in industrial applications makes them the leading players in electrical energy consumption worldwide. Any strategy to improve the efficiency of these motors means significant energy savings in the consumption of electrical energy, with direct consequences affecting the environment.
Although the improvement strategies and standardized efficiency classes applied to these motors have been covered in numerous studies for many years, the quantitative analysis shows applicable constructive variants to low-voltage motors for up to 50 kW. The optimization techniques are not carried out in the study.
The economic study carried out allows us to identify that in all the motors in the power range analyzed, it is possible to recover the investment in materials to improve efficiency in a short time, if the number of hours of motor operation is relatively high. Thus, manufacturers can present their improved motors, even at a higher cost, with a competitive advantage that can relatively easily recover the additional economic investment.
The results obtained in the equivalent circuit parameters using the calculation procedure elaborated in Section 3 have been contrasted with experimental results from laboratory tests according to the standard IEC 60034-2-1. The differences obtained are less than 5%, supporting the study carried out in Section 4 and Section 5 from the variation of the equivalent circuit parameters.
Author Contributions
Conceptualization, M.T.; Methodology, M.T.; Simulation, M.T. and B.B.; Writing—original draft preparation, M.T. and B.B.; Writing—review and editing, M.T. and B.B. All authors have read and agreed to the published version of the manuscript.
Funding
This research received no external funding.
Institutional Review Board Statement
Not applicable.
Informed Consent Statement
Not applicable.
Conflicts of Interest
The authors declare no conflict of interest.
Appendix A. Laboratory Tests Procedure Example: 1.5 kW Motor
This appendix shows, as an example, the laboratory tests performed to obtain the equivalent circuit parameters in the 1.5 kW motor, one of the motors selected for the study. The experimental results obtained (following the IEC 60034-2-1 standard [25]) are compared from the calculation procedure developed in Section 3, based on the main dimensions and the simulation with the finite elements method. A comparison is shown in Table A2.
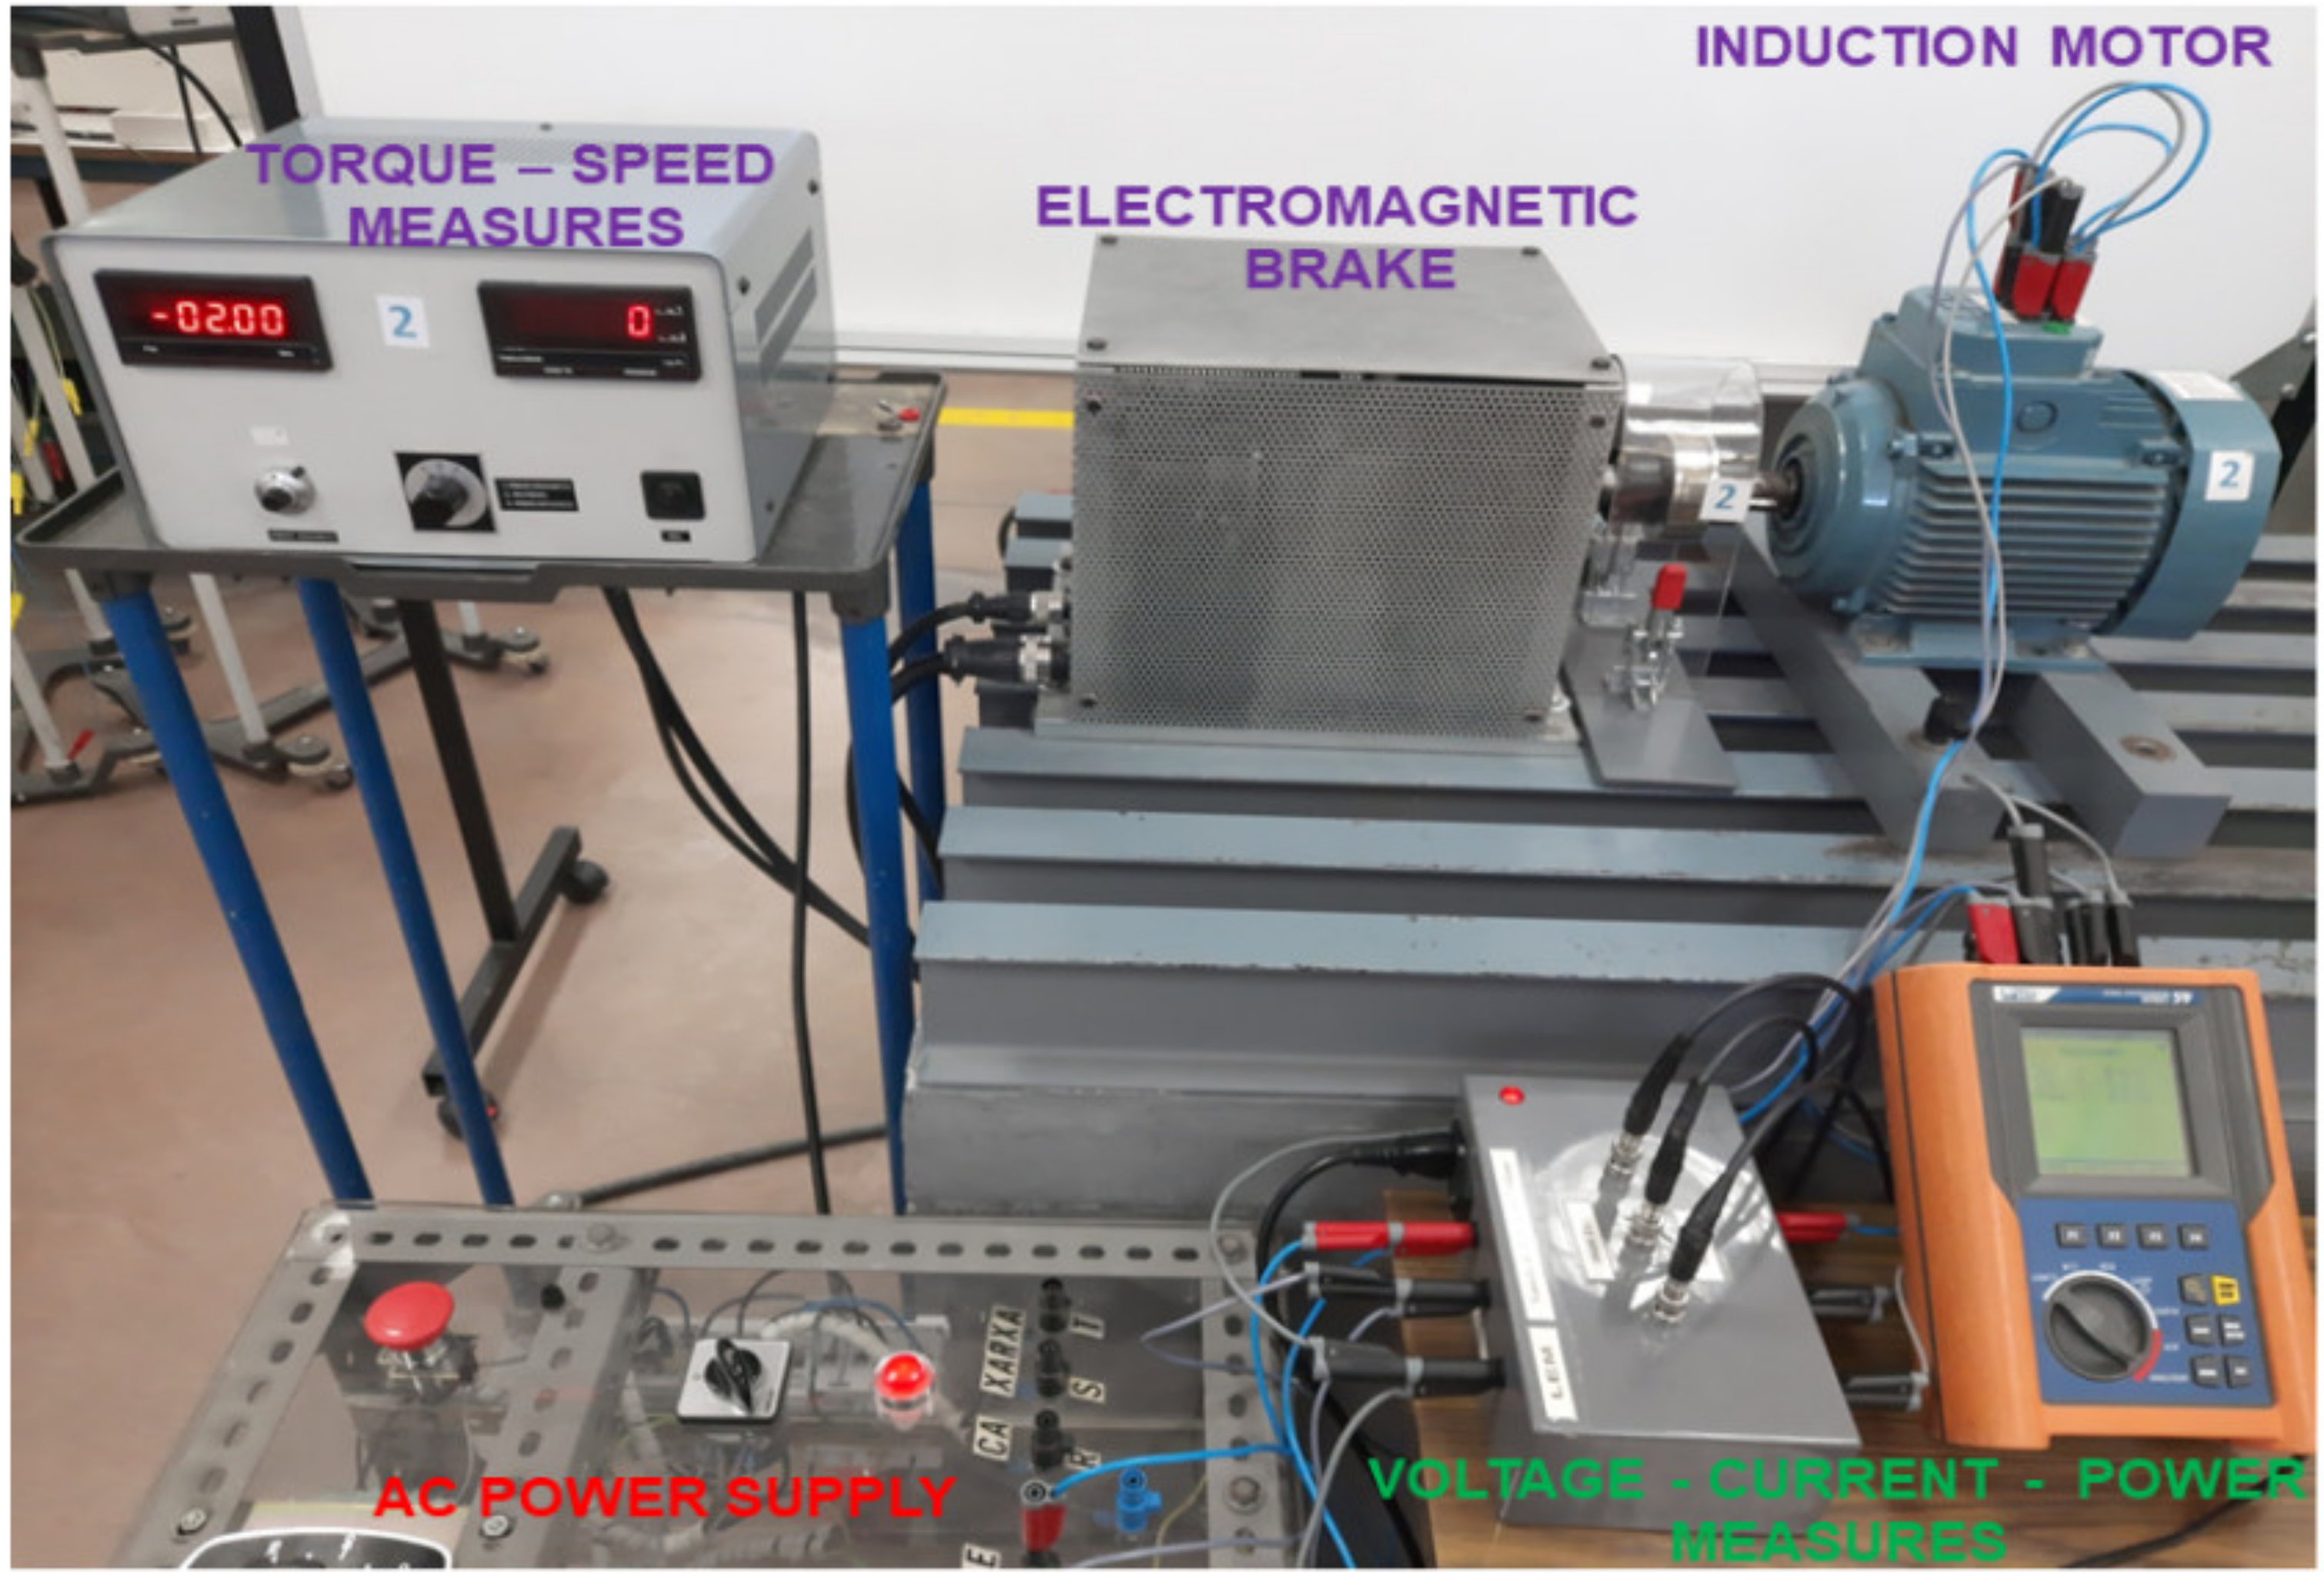
Figure A1 shows a photograph of the test bench used. Stator resistance is measured using a Thomson bridge. The Skin-effect has not been considered. Table A1 includes the results of the following tests:
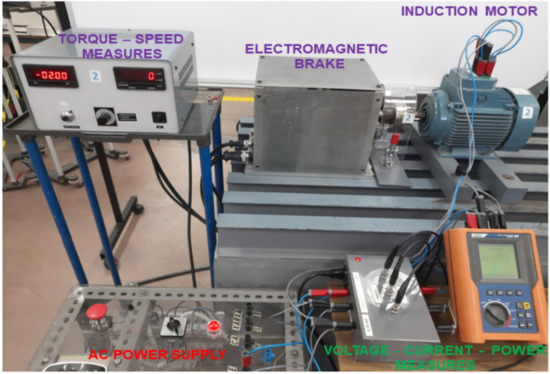
Figure A1.
Test bench performed in the laboratory.
- -
- No-load test at different voltages.
- -
- Locked rotor test at nominal current.
Table A1.
Laboratory tests result on the 1.5 kW motor.
Table A1.
Laboratory tests result on the 1.5 kW motor.
| Voltage (V) | Current (A) | Active Power (W) | Reactive Power (var) | Speed (rpm) | |
|---|---|---|---|---|---|
| No-load test | 100 | 1.4 | 55 | 264 | 1481 |
| 120 | 1.6 | 68 | 386 | 1483 | |
| 140 | 1.9 | 82 | 536 | 1486 | |
| 160 | 2.2 | 98 | 702 | 1488 | |
| 180 | 2.5 | 120 | 893 | 1489 | |
| 200 | 3 | 151 | 1139 | 1490 | |
| 230 | 3.6 | 198 | 1524 | 1492 | |
| Locked rotor test | 48.5 | 6 | 326 | 457 | 0 |
Table A2.
Equivalent circuit parameters: comparison results on the 1.5 kW motor.
Table A2.
Equivalent circuit parameters: comparison results on the 1.5 kW motor.
| Laboratory Tests | Calculation Procedure | Difference (%) | |
|---|---|---|---|
| R1 (Ω) | 4.69 | 4.58 | −2.35 |
| Xd1 (Ω) | 5.08 | 5.25 | 3.33 |
| R′2 (Ω) | 4.34 | 4.22 | −2.86 |
| X′d2 (Ω) | 7.58 | 7.82 | 3.12 |
| Xμ (Ω) | 99.27 | 95.87 | −3.42 |
| RFe (Ω) | 1290.3 | 1234.6 | −4.32 |
| Pfreg (W) | 23.2 | 23.7 | 2.16 |
Notes: All the reactances at the frequency of 50 Hz. Stator and rotor resistances at 20 °C.
References
- De Almeida, A.; Falkner, H.; Fong, J.; Jugdoyal, K. EuP Lot 30: Electric Motors and Drives; University of Coimbra: Coimbra, Portugal, 2014. [Google Scholar]
- IEC 60034-30-1 Standard on Efficiency Classes for Low Voltage AC Motors. 2014. Available online: https://webstore.iec.ch/publication/136 (accessed on 20 September 2021).
- Ecodesign Electric Motors. Commission Regulation (EU) No 4/2014 of 6 January 2014 Amending Regulation (EC) No 640/2009 Implementing Directive 2005/32/EC of the European Parliament and of the Council with Regard to Ecodesign Requirements for Electric Motors. 2014. Available online: https://eur-lex.europa.eu/legal-content/EN/TXT/?uri=celex%3A32014R0004 (accessed on 20 September 2021).
- Rajput, S.; Bender, E.; Averbukh, M. Simplified Algorithm for Assessment Equivalent Circuit Parameters of Induction Motors. IET Electr. Power Appl. 2020, 14, 426–432. [Google Scholar] [CrossRef]
- Vasconcelos, G.F.; Rabelo, J.M.; Rodrigues, F.C.; Rabelo, L.M.; Behlacen, A. A High Precision Method for Induction Machine Parameters Estimation from Manufacturer Data. IEEE Trans. Energy Convers. 2021, 36, 1226–1233. [Google Scholar] [CrossRef]
- Nikolaev, A.A.; Revyako, D.A. Improvement of Calculating Methods for the Equivalent Circuit Parameters of Induction Machine of Various Powers Using Additional Experimental Data. In Proceedings of the IEEE 2021 International Conference on Industrial Engineering, Applications and Manufacturing (ICIEAM), Sochi, Russia, 17–21 May 2021. [Google Scholar] [CrossRef]
- Sreejeth, M.; Singh, M. Sensitivity Analysis of Induction Motor Performance Variables. In Proceedings of the 2016 IEEE 1st International Conference on Power Electronics, Intelligent Control and Energy Systems (ICPEICES), Delhi, India, 4–6 July 2016. [Google Scholar] [CrossRef]
- Tezcan, M.M.; Yetgin, A.G.; Canakoglu, A.I.; Cevher, B.; Turan, M.; Ayaz, M. Investigation of the Effects of the Equivalent Circuit Parameters on Induction Motor Torque Using Three Different Equivalent Circuit Models. In Machine Modelling and Simulations; EDP Science: Les Ulis, France, 2017. [Google Scholar] [CrossRef] [Green Version]
- Lin, C. Altered Grey Wolf Optimization and Taguchi Method with FEA for Six-Phase Copper Squirrel Cage Rotor Induction Motor Design. Energies 2020, 13, 2282. [Google Scholar] [CrossRef]
- Chen, H.; Koti, H.N.; Demerdash, N.A.O.; Rahman, K.M.; Sun, Y. Fast Steady-State Analysis in Time-Stepping Finite-Element Simulation of Induction Motors Based on Virtual Blocked Rotor Techniques. IEEE Trans. Ind. Appl. 2020, 56, 3731–3743. [Google Scholar] [CrossRef]
- Balasubramanian, A.; Martin, F.; Billah, M.; Osemwinyen, O.; Behlacen, A. Application of Surrogate Optimization Routine with Clustering Technique for Optimal Design of an Induction Motor. Energies 2021, 14, 5042. [Google Scholar] [CrossRef]
- Tong, W.A. Mechanical Design of Electric Motors; CRC Press: Boca Raton, FL, USA, 2014. [Google Scholar]
- Torrent, M. Estimation of Equivalent Circuits for Induction Motors in Steady State Including Mechanical and Stray Load Losses. Eur. Trans. Electr. Power 2012, 22, 989–1015. [Google Scholar] [CrossRef]
- Yin, W.J.; Wen, T. Estimation of Equivalent Circuits for Induction Motors in Steady State Including Mechanical and Stray Load Losses. Perform. Anal. Refin. Induc. Mach. Models Consid. Iron Loss 2019, 85, 31–36. [Google Scholar] [CrossRef] [Green Version]
- David, M. Finite Element Method Magnetics: User’s manual. 2015. Available online: https://www.femm.info/Archives/doc/manual42.pdf (accessed on 20 September 2021).
- Carbonieri, M.; Bianchi, N.; Alberti, L. Direct Analysis of Induction Motor Using Finite Element. In Proceedings of the 2018 IEEE Energy Conversion Congress and Exposition (ECCE 2018), Portland, OR, USA, 23–27 September 2018. [Google Scholar] [CrossRef]
- Bortoni, E.C.; Bernardes, J.V., Jr.; Da Silva, P.V.V.; Faria, V.A.D.; Vieira, P.A.V. Evaluation of Manufacturers to Obtain High-Efficient Induction Motors. Sustain. Energy Technol. Assess. 2019, 31, 221–227. [Google Scholar] [CrossRef]
- Pyrhönen, J.; Haataja, J.; Luostarinen, K.; Härkönen, H. High Efficient Induction Motors; weSRCH Green Tech: Santa Clara, CA, USA, April 2014. [Google Scholar]
- Cavagnino, A.; Vaschetto, S.; Ferraris, L.; Gmyrek, Z.; Agamloh, E.; Bramerdorfer, G. Towards an IE4 Efficiency Class for Induction Motors. In Proceedings of the 2018 IEEE Energy Conversion Congress and Exposition (ECCE 2018), Portland, OR, USA, 23–27 September 2018. [Google Scholar] [CrossRef]
- Rachev, S.; Dimitrov, L.; Ivanov, I.; Karakoulidis, K. Study the Effects of No Nominal Conditions on the Performance of High Efficiency Induction Motor. In Proceedings of the 2017 IEEE International Conference on Energy and Environment (CIEM 2017), Bucharest, Romania, 19–20 October 2017. [Google Scholar] [CrossRef]
- Rassolkin, A.; Kallaste, A.; Orlova, S.; Gevorkov, L.; Vaimann, T.; Belahcen, A. Re-Use and Recycling of Different Electrical Machines. Latv. J. Phys. Tech. Sci. 2018, 55, 13–23. [Google Scholar] [CrossRef] [Green Version]
- Saidur, R. A review on electrical motors energy use and energy savings. Renew. Sustain. Energy Rev. 2010, 14, 877–898. [Google Scholar] [CrossRef]
- Torrent, M.; Martínez, E.; Andrada, P. Life Cycle Analysis on the Design of Induction Motors. Int. J. Life Cycle Assess. 2011, 16, 1–8. [Google Scholar] [CrossRef] [Green Version]
- Cassoret, B.; Manata, J.P.; Mallard, V.; Roger, D. Comparative Life Cycle Assessment of Induction Machines Made with Copper-Cage or Aluminium-Cage Rotors. IET Electr. Power Appl. 2019, 13, 712–719. [Google Scholar] [CrossRef]
- IEC 60034-2-1 Standard on Rotating Electrical Machines—Part 2-1: Standard Methods for Determining Losses and Efficiency from Tests (Excluding Machines for Traction Vehicles). 2014. Available online: https://webstore.iec.ch/publication/121 (accessed on 20 September 2021).

Publisher’s Note: MDPI stays neutral with regard to jurisdictional claims in published maps and institutional affiliations. |
© 2021 by the authors. Licensee MDPI, Basel, Switzerland. This article is an open access article distributed under the terms and conditions of the Creative Commons Attribution (CC BY) license (https://creativecommons.org/licenses/by/4.0/).