Abstract
Real-time monitoring of energetic-environmental parameters in wastewater treatment plants enables big-data analysis for a true representation of the operating condition of a system, being still frequently mismanaged through policies based on the analysis of static data (energy billing, periodic chemical–physical analysis of wastewater). Here we discuss the results of monitoring activities based on both offline (“static”) data on the main process variables, and on-line (“dynamic”) data collected through a monitoring system for energetic-environmental parameters (dissolved oxygen, wastewater pH and temperature, TSS intake and output). Static-data analysis relied on a description model that employed statistical normalization techniques (KPIs, operational indicators). Dynamic data were statistically processed to explore possible correlations between energetic-environmental parameters, establishing comparisons with static data. Overall, the system efficiently fulfilled its functions, although it was undersized compared to the organic and hydraulic load it received. From the dynamic-data analysis, no correlation emerged between energy usage of the facility and dissolved oxygen content of the wastewater, whereas the TSS removal efficiency determined through static measurements was found to be underestimated. Finally, using probes allowed to characterize the pattern of pH and temperature values of the wastewater, which represent valuable physiological data for innovative and sustainable resource recovery technologies involving microorganisms.
Keywords:
dynamic monitoring; load factors; KPI; pH; sensors; temperature; total suspended solids; urban wastewater 1. Introduction
Ensuring satisfactory energetic-environmental performance in wastewater treatment plants (also referred to as WWTP) is a challenge of great interest and relevance for the world of research, because of the many implications not only for sanitary purposes, but also related to the concept of sustainability [1].
The academic and experimental experience gained in recent years through direct contact with companies involved in the integrated water service has revealed many weaknesses in the management of these industrial realities [2], which are so valuable for the protection of our habitats and our health. For example, local authorities usually do not impose continuous controls of process variables [3]; as a result, a common practice is to perform random checks 2–3 times a month to determine and monitor the average chemical composition of the wastewater entering and leaving the plants, assuming that these values are sufficiently representative of the operating status of a system [4]. When the industrial facilities are on a very small scale, an additional common difficulty is the lack of complete and homogeneous database of historical values of the main process variables monitored by the managing agencies (volumetric flow rates of treated wastewater, pollutant load entering the plant and removed by wastewater treatment, total amount of sludge generated by the process, and so forth) [5]. From the point of view of energy consumption, the wastewater sector alone is responsible for 1% of total energy consumption worldwide, considering all production activities and, in general, all industrial processes at varying scales [6]. The only energy carrier in these systems remains almost entirely electricity, still largely produced from non-renewable sources [7]. Alongside this, the vast majority of purification systems currently in operation (e.g., in Italy, but not limited to) continue to rely on the conventional activated sludge treatment layout, which is still one of the simplest and most reliable systems from a constructional point of view [8], although it involves a waste of valuable resources of commercial interest, including macro- and micronutrients [9,10]. In the National Recovery and Resilience Plan launched by the Italian Government as part of the broader Next Generation EU program (available at the URL: https://www.governo.it/sites/governo.it/files/PNRR.pdf; accessed on 29 September 2021) 600 M€ are to be allocated to transform, where possible, sewage treatment plants into “green factories”, allowing the recovery of energy and sludge, and the reuse of purified wastewater for irrigation and industrial purposes [11]. For the recovery of resources from the wastewater sector, several strategies and technologies are being studied in recent years, an example of which is the use of microalgae to trap these elements in a biomass matrix, commercially expendable for the extraction of many valuable by-products or energy [12]. The use of these practices, however, is still at a testing stage in most of the realities that have chosen to adopt these solutions for the increase of their performance indices [13]. Therefore, since it is not always possible to adopt this type of sustainable solutions, in order to improve the energy-environmental performance of these systems, it is still essential to optimize the use of energy within the facilities, through system auditing and the accurate monitoring of process variables [14]. The first tool is the one that allows to gather all the qualitative and quantitative information on the observed system in order to firstly frame its operating conditions and overall performance, based on data collected offline (static data) [15]. The second tool, on the other hand, is necessary to learn in a satisfactory way the operating status of a system; in fact, it is well-known that only the use of real-time monitoring and management systems mediated by proper sensing devices can enable a big data analysis statistically representative of the system, as well as the development of predictive models that can support the managing bodies in the decision-making processes related to the proper management of the plants [16].
Remaining in the context of monitoring systems to be used in the wastewater industry, a further challenge is posed by the sensors to be included within a plant, their reliability, the effectiveness of measurements, and the information that can be obtained from such data measured in real time [17]. The present work focuses on a medium-scale sewage treatment plant operating in the geographical area of Cilento (Campania region, Southern Italy), where a pilot system for dynamic monitoring of energy consumption and other variables of the process has been implemented. In this work not only the energetic-environmental performances deriving from offline data (static data) are evaluated, but also the results of the real-time monitoring using suitable sensors are proposed. In showing the results it will be not only compared the online data with those obtained in static mode (e.g., through billing and reports on the physico-chemical composition of wastewater) but will also be highlighted the critical aspects linked to the use of sensors in such systems, their strength points, possible hints for improvement. As a further element of novelty, the real-time monitoring system implemented in this facility also allows to better understand how important parameters, such as pH and temperature of the wastewater, fluctuate over the entire monitoring period and with a significantly finer temporal resolution. Since these parameters play a key physiological role in the deployment of processes for the recovery of macronutrients by organisms such as microalgae (as previously mentioned), the choice to monitoring them was motivated by the prospect of implementing future performance optimization strategies based on biorefinery concepts. Having access to a complete dataset of real-time information and being able to analyze them is therefore an imperative requirement for the identification of those priority interventions that can actually lead to an improvement in energy and environmental performance of the system.
2. Materials and Methods
This research falls within the activities related to a project entitled “Energy management for an intelligent water network”, which is part of a partnership between the Department of Environmental, Biological and Pharmaceutical Sciences and Technologies of the University of Campania “L. Vanvitelli” and the company ASIS SpA. This project aimed to acquire new knowledge and skills useful to expand and improve the current energy consumption management system of ASIS company.
The company is responsible for four main plants: three wastewater treatment plants and a large freshwater lifting station. Here, focus is on the wastewater treatment plant serving the city of Agropoli (province of Salerno), as it is the only facility that is geographically located within the Cilento, Vallo di Diano and Alburni National Park. This plant, which was designed for a maximum capacity of 45,000 PE (Population Equivalent), consists of a classic CAS (Conventional Activated Sludge) process layout with two treatment lines, “Sewage” and “Sludge” Line [8]. The Sewage Line consists of: (i) initial pre-treatment and primary treatment to remove grease and most of the suspended solids; (ii) secondary biological treatment to reduce the organic load by means of activated sludge oxidation tanks; (iii) tertiary treatment to further allow the sewage sludge to settle; (iv) final treatment to stabilize and disinfect the treated effluent using sodium hypochlorite; (v) discharge of the treated and disinfected effluent into the receiving water body. The Sludge Line consists of: (i) mohno pump to transport the sludge; (ii) a polyelectrolyte to condition the sludge; (iii) a mechanical thickener; and (iv) a centrifuge to remove the water content.
Quantitative information from the plant, regarding the trend of the main process variables, was obtained through both offline data collection (static monitoring) and real-time parameter measurement (dynamic monitoring).
2.1. Analysis of Offline Data (Static Monitoring)
The offline data were defined as “static”, because they were obtained by gaining access to energy bills, chemical–physical analysis reports on wastewater samples, and to the archives of the company [18]. With reference to a timeline of 5 years, from January 2016 to December 2020, data were collected as average or total values at a monthly frequency and concern the main control variables of the purification process, in particular: total energy consumption of the facility; average pollutant load entering and leaving the plant, expressed in terms of COD, BOD and TSS; total wastewater flowrate per month. Equivalent emissions expressed in terms of tons of oil and CO2, associated with the electricity consumption of the facility, were inferred using the following conversion factors: 0.187 tons of oil equivalent (toe) for each megawatt-hour of electric consumption (MWhel), according to D.Lgs 102/2014 as amended [19] 2014), and 0,411 tons of CO2 equivalent for each MWhel, according to Fighir, et al. [20].
According to the Description Model already effectively applied in di Cicco, et al. [21] for the evaluation of the energetic and environmental performance of a WWTP with a CAS process layout, all the data acquired were then used to calculate the operational indicators and KPIs described here below and summarized in Table 1.

Table 1.
Overview of the indicators used for assessing energy-related and environmental performances of the WWTP, according to the model described in [18].
The Population Equivalent served by the plant (PEserved), as it is known, allows to evaluate the number of inhabitants that actually contribute to the wastewater entering the plant, allowing to make comparisons with the maximum design capacity. This parameter can be determined (i) with respect to the biodegradable organic load contained in the wastewater, corresponding to 60 g of BOD per day for each inhabitant [22], or (ii) with respect to the volumes treated by the plant, in which case reference will be made to the per-capita production of wastewater, obtained from the daily freshwater supply of each people served (320 L PE−1 day−1) and the return coefficient to the sewer (80%) (first mentioned in di Cicco, et al. [23]). This distinction was necessary because the calculation of the is conventionally based only on the amount of BOD in the effluent, while it does not consider the volume of effluent and—therefore—how concentrated the contaminants actually are. This aspect, as also highlighted in di Cicco, et al. [21], is very important, because conditions of strong dilution of the wastewater negatively impact on the mechanisms that microorganisms perform for the removal of pollutants during secondary and tertiary treatment.
The organic (LForganic) and hydraulic (LFhydraulic) Load Factors respectively quantify, as percentages, the level of pollutant load to be treated [15] or the level of wastewater flowrate [21] compared to the maximum value for which the plant was designed (PEdesign). Dilution Factor (DF), on the other hand, through a ratio between the daily wastewater flow rate and the organic PEserved, represents a further useful operational indicator to assess the dilution of the wastewater in terms of daily volume of sewage for each organic PEserved [24].
Concerning the COD/BOD ratio, it can be used to assess whether or not the effluent is readily biodegradable and, for this reason, it is also referred to as “biodegradability index” [8,25]. Typically, municipal wastewater has an average COD/BOD of approximately 2: the closer the index is to 1, the faster the wastewater will undergo biological degradation; the higher (>3) the ratio, the more it implies that the wastewater is rich in substances that are difficult to remove by biological treatment, not biodegradable or even toxic to the metabolism of the microorganisms that fulfill the biological degradation reactions in the oxidation tanks [26]. In order to better investigate the composition of the wastewater in terms of BOD, COD and TSS, and to establish comparisons with data from the relevant literature, a ternary plot was created; indeed, this graphical representation tool allows an immediate visualization of the similarity or variability of 3 composition parameters with respect to a fixed value (in this case, their sum, set equal to 1).
Lastly, the Key Performance Indexes (KPIs) are among the most widely used statistical normalization techniques to describe plant performance in terms of energy consumption [24]. They are specific consumptions obtained from the ratio between the energy consumption of the facility and the values of selected process control variables. The KPIs currently most used from a descriptive point of view due to their effectiveness, and for which more benchmarking data are available in the literature, are those that compare energy consumption with wastewater flowrate (KPI1; kWh m−3), population equivalent served from an organic point of view (KPI2; kWh PEorganic,served−1 year−1), and the amount of COD removed by purification treatments (KPI3; kWh kgCODremoved) [1].
All the indicators thus calculated, coupled with the static data originally collected, were statistically processed not only in terms of their progress over time, but also to study existing correlations among them, and to allow comparisons with similar cases from the literature as benchmarks.
2.2. Analysis of Real-Time Data (Dynamic Monitoring)
Next to the analysis of static data, within the context of monitoring activities defined as “dynamic”, data from the system were obtained in real-time mode, thanks to the use of suitable sensors. As mentioned in the introduction, the use of sensors is of major importance, because it allows to study the functionality of the system with a time resolution that conventional controls performed by the plant technicians are not able to guarantee [3]. With a tighter data grid, it is possible to outline in a more accurate way the trend of process control variables and provide company stakeholders with a more effective tool for supporting decision-making processes [16]. The analysis of dynamic monitoring data reported in di Cicco, et al. [21] highlighted the interpretive limitations of investigating possible correlations between variables that were not measured simultaneously and with the same temporal frequency. For this reason, in the present study, an attempt was made to further implement the monitoring system, adding to the measurement of energy consumption also the measurement of parameters related to the chemical–physical characteristics of the wastewater flowing through the Sewage Line.
Figure 1 shows a diagram of the sewage line with an overview of the parameters measured in real time and the location of the probes. All the measurements taken by the devices were transmitted to a datalogger (Hach, mod. SC1000) and sent through Wi-Fi connection to a web interface (david.energreenup.it) specifically designed for storage, statistical analysis and graphical representation of the data collected.
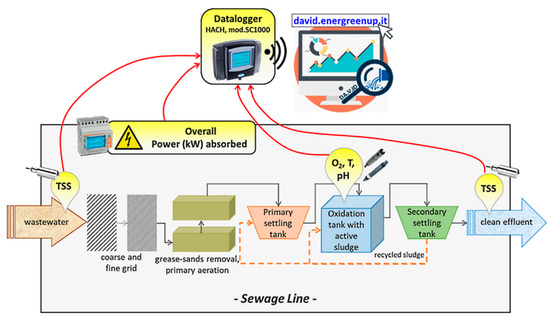
Figure 1.
Overview of the system for real-time monitoring of energetic and environmental parameters.
The measurements of absorbed power and related energy consumption (measured by means of an energy multimeter Lovato, mod. 380…415VAC), refer to the energy demand of the entire facility (Figure 1).
Concerning the other parameters (all measured through the use of specific HACH probes), given that in a CAS-type wastewater treatment plant more than 50% of consumption is attributable to the aeration of sewage [27], it was decided to measure the content of dissolved oxygen in the wastewater inside the oxidation tank (Figure 1), in order to investigate the presence of possible correlations with the total energy consumption. Moreover, the variations in temperature and pH of the wastewater in the oxidation tank were measured. Finally, TSS of the wastewater entering and leaving the WWTP was also measured, with the aim of assessing the real purification efficiency of the plant and comparing it with the removal efficiency reported by static data.
Statistical Analysis of Real-Time Data
In the aggregate of all monitored parameters, the system recorded data from June 2020 to July 2021. Based on the characteristics of the probes, parameters were recorded at the following time steps: energy consumption and absorbed power every 6 h; dissolved oxygen in the wastewater every 30 min; temperature and pH every 15 min; TSS every 10 min. The measures recorded by the probes were downloaded as “comma separated values” files. Subsequently, data were imported and statistically processed using Microsoft Excel and JMP Pro software 16.0.0 (SAS Institute, https://www.jmp.com/en_us/home.html (accessed on 29 September 2021)).
A data pattern screening was performed on all files to identify the presence of missing values, duplicate values, and the presence of time periods when monitoring was interrupted due to maintenance activities. After that, the distribution of values for each parameter was evaluated to determine the frequency of data ranges and the average values.
As mentioned in the previous paragraph, with the data coming from the energy multimeter, the time trend of the power absorbed by the entire facility was analyzed, whereas the monthly average values of energy consumption were calculated for comparison with the static data coming from energy bills.
In order to study the correlation between dissolved oxygen in the oxidation tank and the power absorbed by the plant, since the two parameters were recorded with a different time frequency, the O2 values with temporal matching with the absorbed power measurements were filtered from the database, verifying that the linear relationship between the two timelines returned an r2 equal to 1. Subsequently, O2 and P were analyzed both through bivariate estimation, and through Pearson’s correlation index.
For suspended solids, the removal efficiency expressed as a percentage was calculated according to the formula {[1 − (TSSout/TSSin)] × 100}. Since, at any given time, the suspended solids leaving the plant (TSSout) do not correspond to the suspended solids entering the plant (TSSin), and since information on the retention time of the wastewater in the sewage line was not available, the removal efficiency formula was applied to the average monthly values of TSSin and TSSout, while the error of the ratio was obtained by error propagation method.
3. Results and Discussion
3.1. Static Monitoring
The comparative analysis of all the data coming from the system resulted in the characterization of the average behavior of the control variables over a 5-year period. Table 2 summarizes all the results obtained from the study not only of the static data originally collected in offline mode, but also of the indicators defined within the descriptive model and listed in Table 1.
Table 2.
Overview of the results obtained for the WWTP system control variables and the description model indicators listed in Table 1. In this table, all values are reported as averages over either the individual monitoring year or the entire period (overall), with the exception of annual plant energy consumption, which is expressed as total consumption. Error on average values is reported as standard deviation (SD).
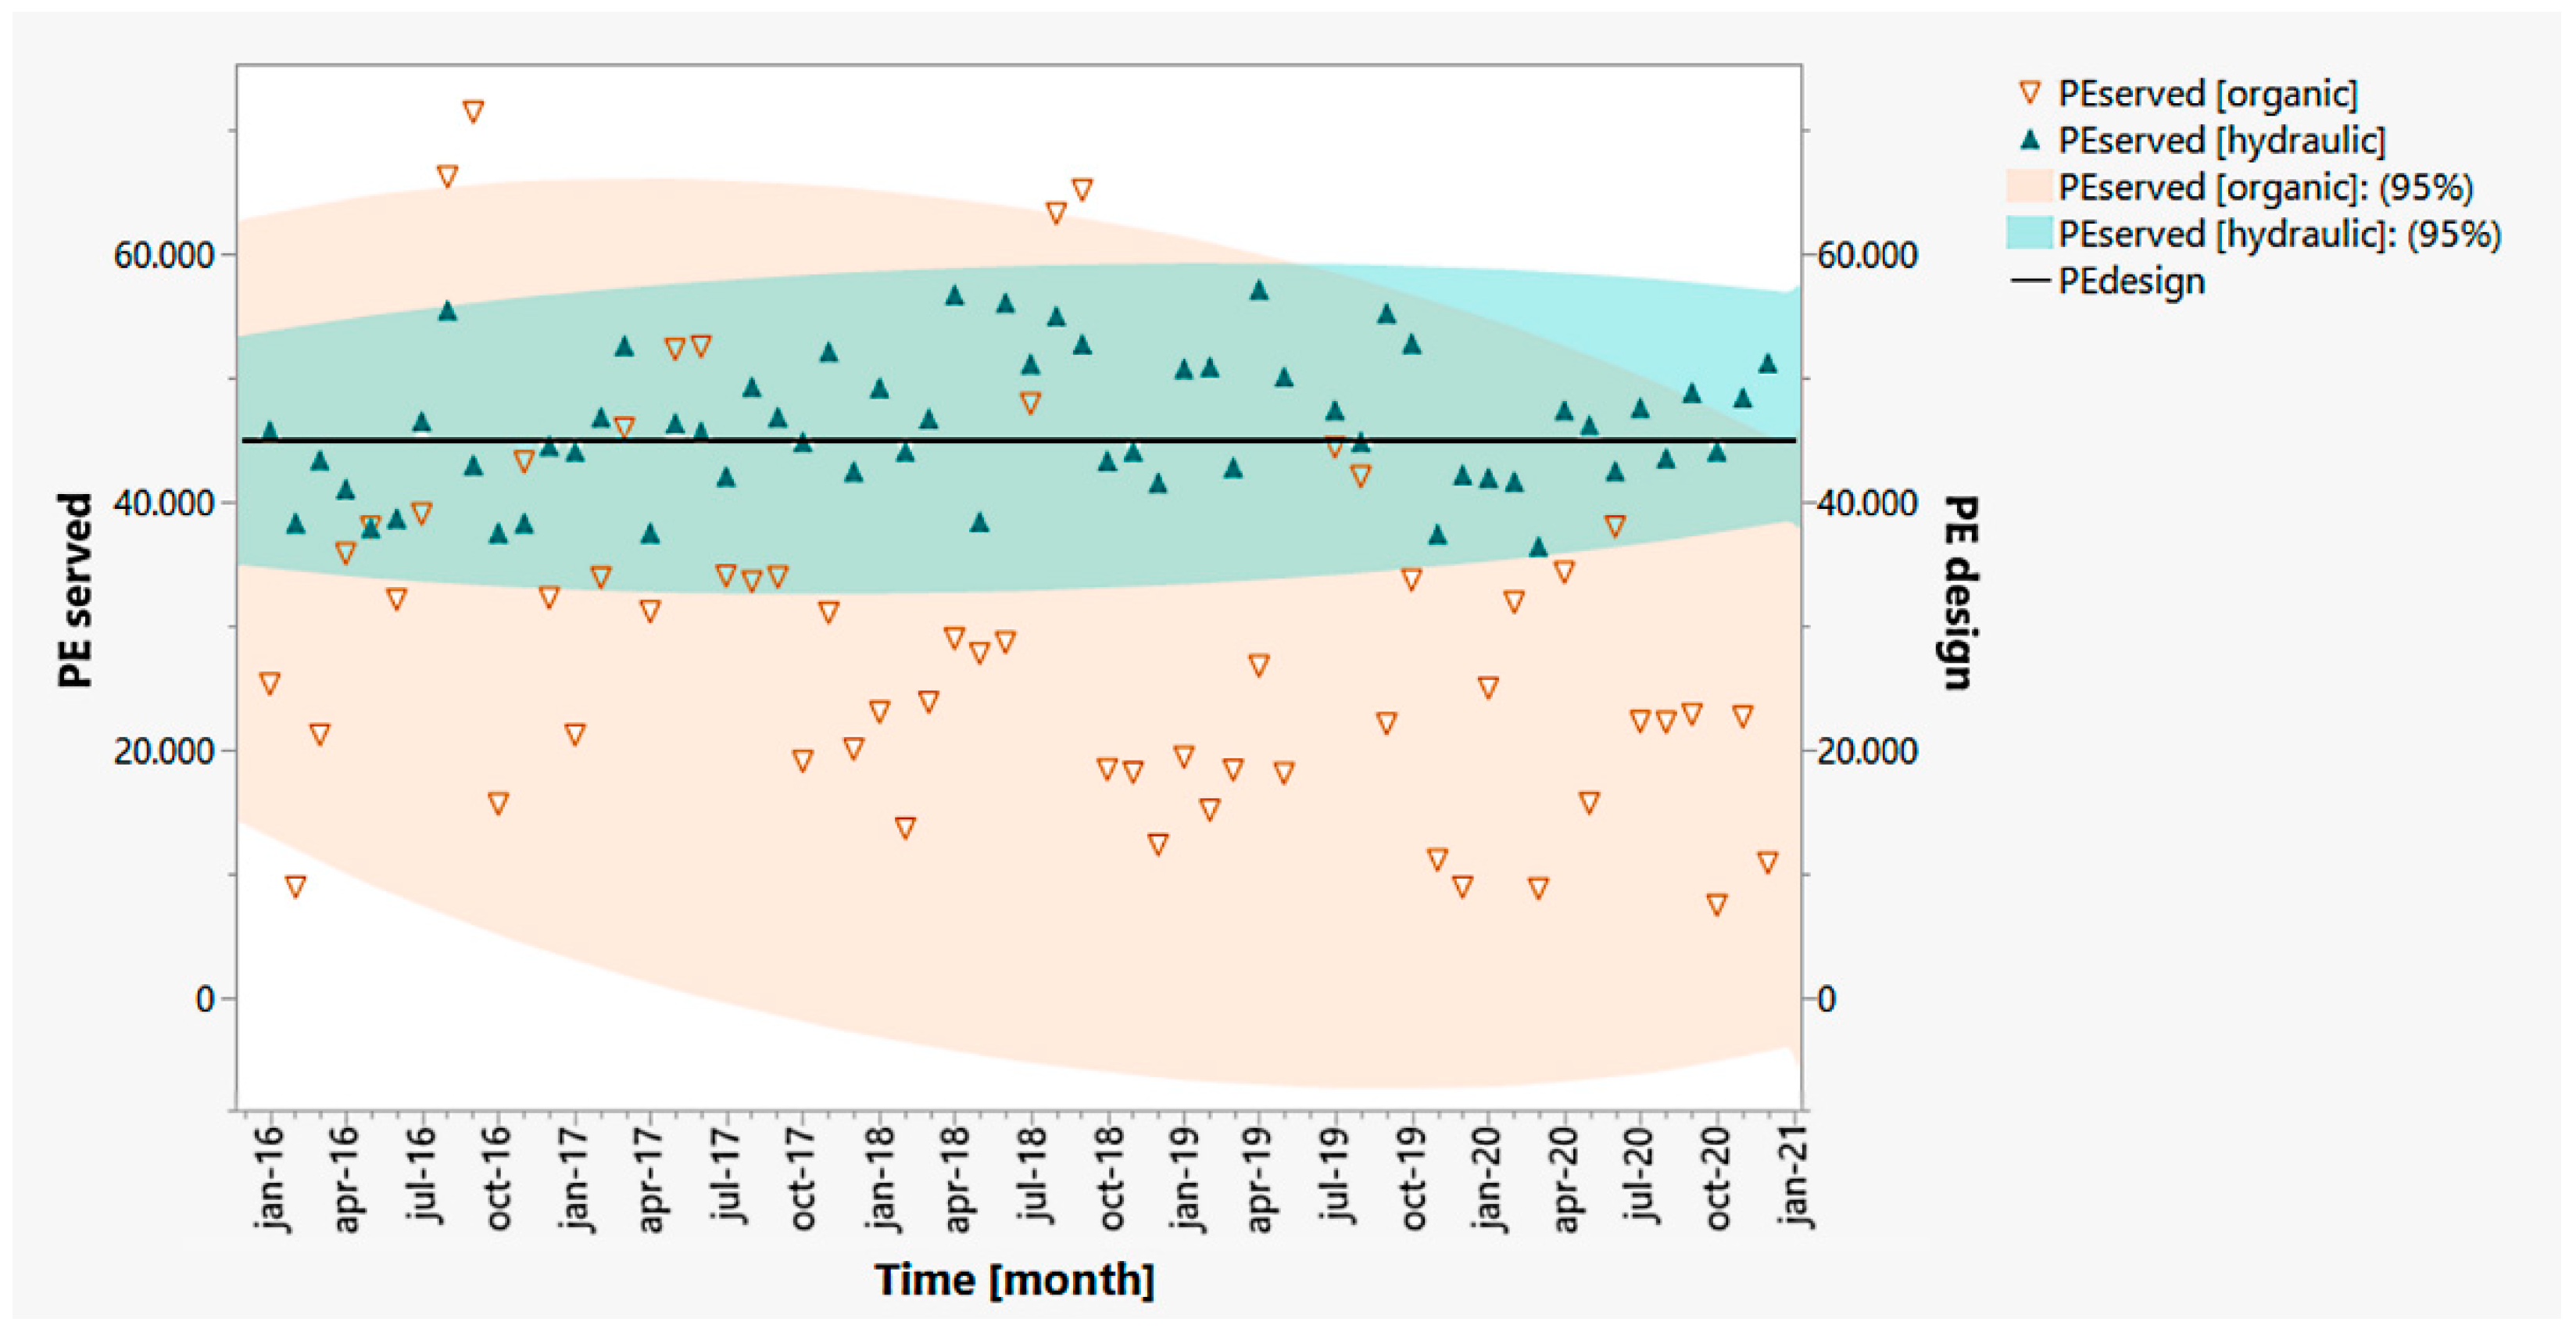
Starting from the energy consumption, the system shows an average annual consumption of about 900 MWh, with a monthly average request of 75 MWh of electricity, as the only energy carrier of the entire facility. Concerning the stress faced by the plant, observing the results obtained for the organic and hydraulic load factors, it was possible to notice that the plant received a highly fluctuating organic contaminants load during the year (high standard deviation), while more regular were the volumetric flowrates received by the system, for which the WWTP almost always works in conditions close to or equal to the maximum sustainable capacity. The result appeared more evident when observing in Figure 2 the comparison between organic and hydraulic PEserved with respect to the maximum design capacity (PEdesign). The ellipses surrounding the monthly average values of the two parameters represent the 95% confidence range (normal bivariate density ellipse). As shown, the pollutant load associated with the incoming wastewater in terms of BOD5 () is remarkably variable, with the values exceeding the design capacity threshold especially during the summer season. Since the city from which the plant receives the wastewater (Agropoli) is located along the coastline and represents a destination with a strong tourist influx, it can be assumed that the exceeding of the values is related to the strong increase of the local population affected by seasons [28]. It is interesting to notice that, during the summer months of 2020, this behavior did not show the same intensity; this can probably be related to a reduction of the local tourist influx, as a consequence of the restrictions introduced to cope with the COVID-19 pandemic crisis [29]. In Figure 2, however, the hydraulic load received by the system is less variable, but still close to or greater than the maximum design capacity.

Figure 2.
Comparison of the population equivalent effectively served by the plant (organic and hydraulic PEserved) versus maximum design capacity (PEdesign, black line).
A significantly high hydraulic load can often indicate a high level of dilution of the effluent with respect to the associated organic matter. To investigate the quality of the sewage in terms of COD, BOD5 and TSS content, the ternary graph shown in Figure 3 displays the average values obtained in the 5 years of monitoring using the formula BOD5 + COD + TSS = 1. As can be seen, the composition of the effluent is rather homogeneous over time; furthermore, looking at Figure 3b, no seasonal fluctuations could be noticed. Cross-checking this graph with the average values obtained from the COD/BOD5 ratio, it could be observed that the effluent was always in the range of “medium biodegradable” sewage [26], relying on a composition richer in terms of BOD5 and more depleted in terms of TSS, in contrast to what was reported in di Cicco, et al. [21] for the case study of a large plant serving the city of Salerno, which was instead affected by a severe problem of parasitic inflows diluting the wastewater, with negative consequences on the energy performances of the system. The two districts of Salerno and Agropoli are distant about 50 km from each other, and both extend along the coastline and in the same geomorphological context. Hence, it should be excluded the climatic factor (also in terms of rainfall) as a determinant of the different sewage composition in the two districts [30]. The reasons for a higher content of organic matter in the wastewater of the city of Agropoli should more probably be sought in the fact that it is smaller than the larger city of Salerno, therefore having a lower impact of industrial activities, and being more densely surrounded by agricultural and livestock productive activities, affecting the sewer system with a greater discharge of organic substances from plant and animal sources.
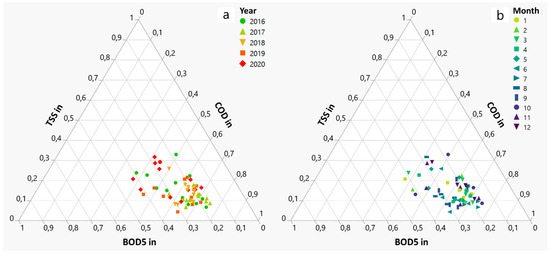
Figure 3.
Ternary plot of effluent composition in terms of BOD5, COD and TSS, relative to the year (a) or month (b) of monitoring. Data follow the normalization formula BOD5 + COD + TSS = 1.
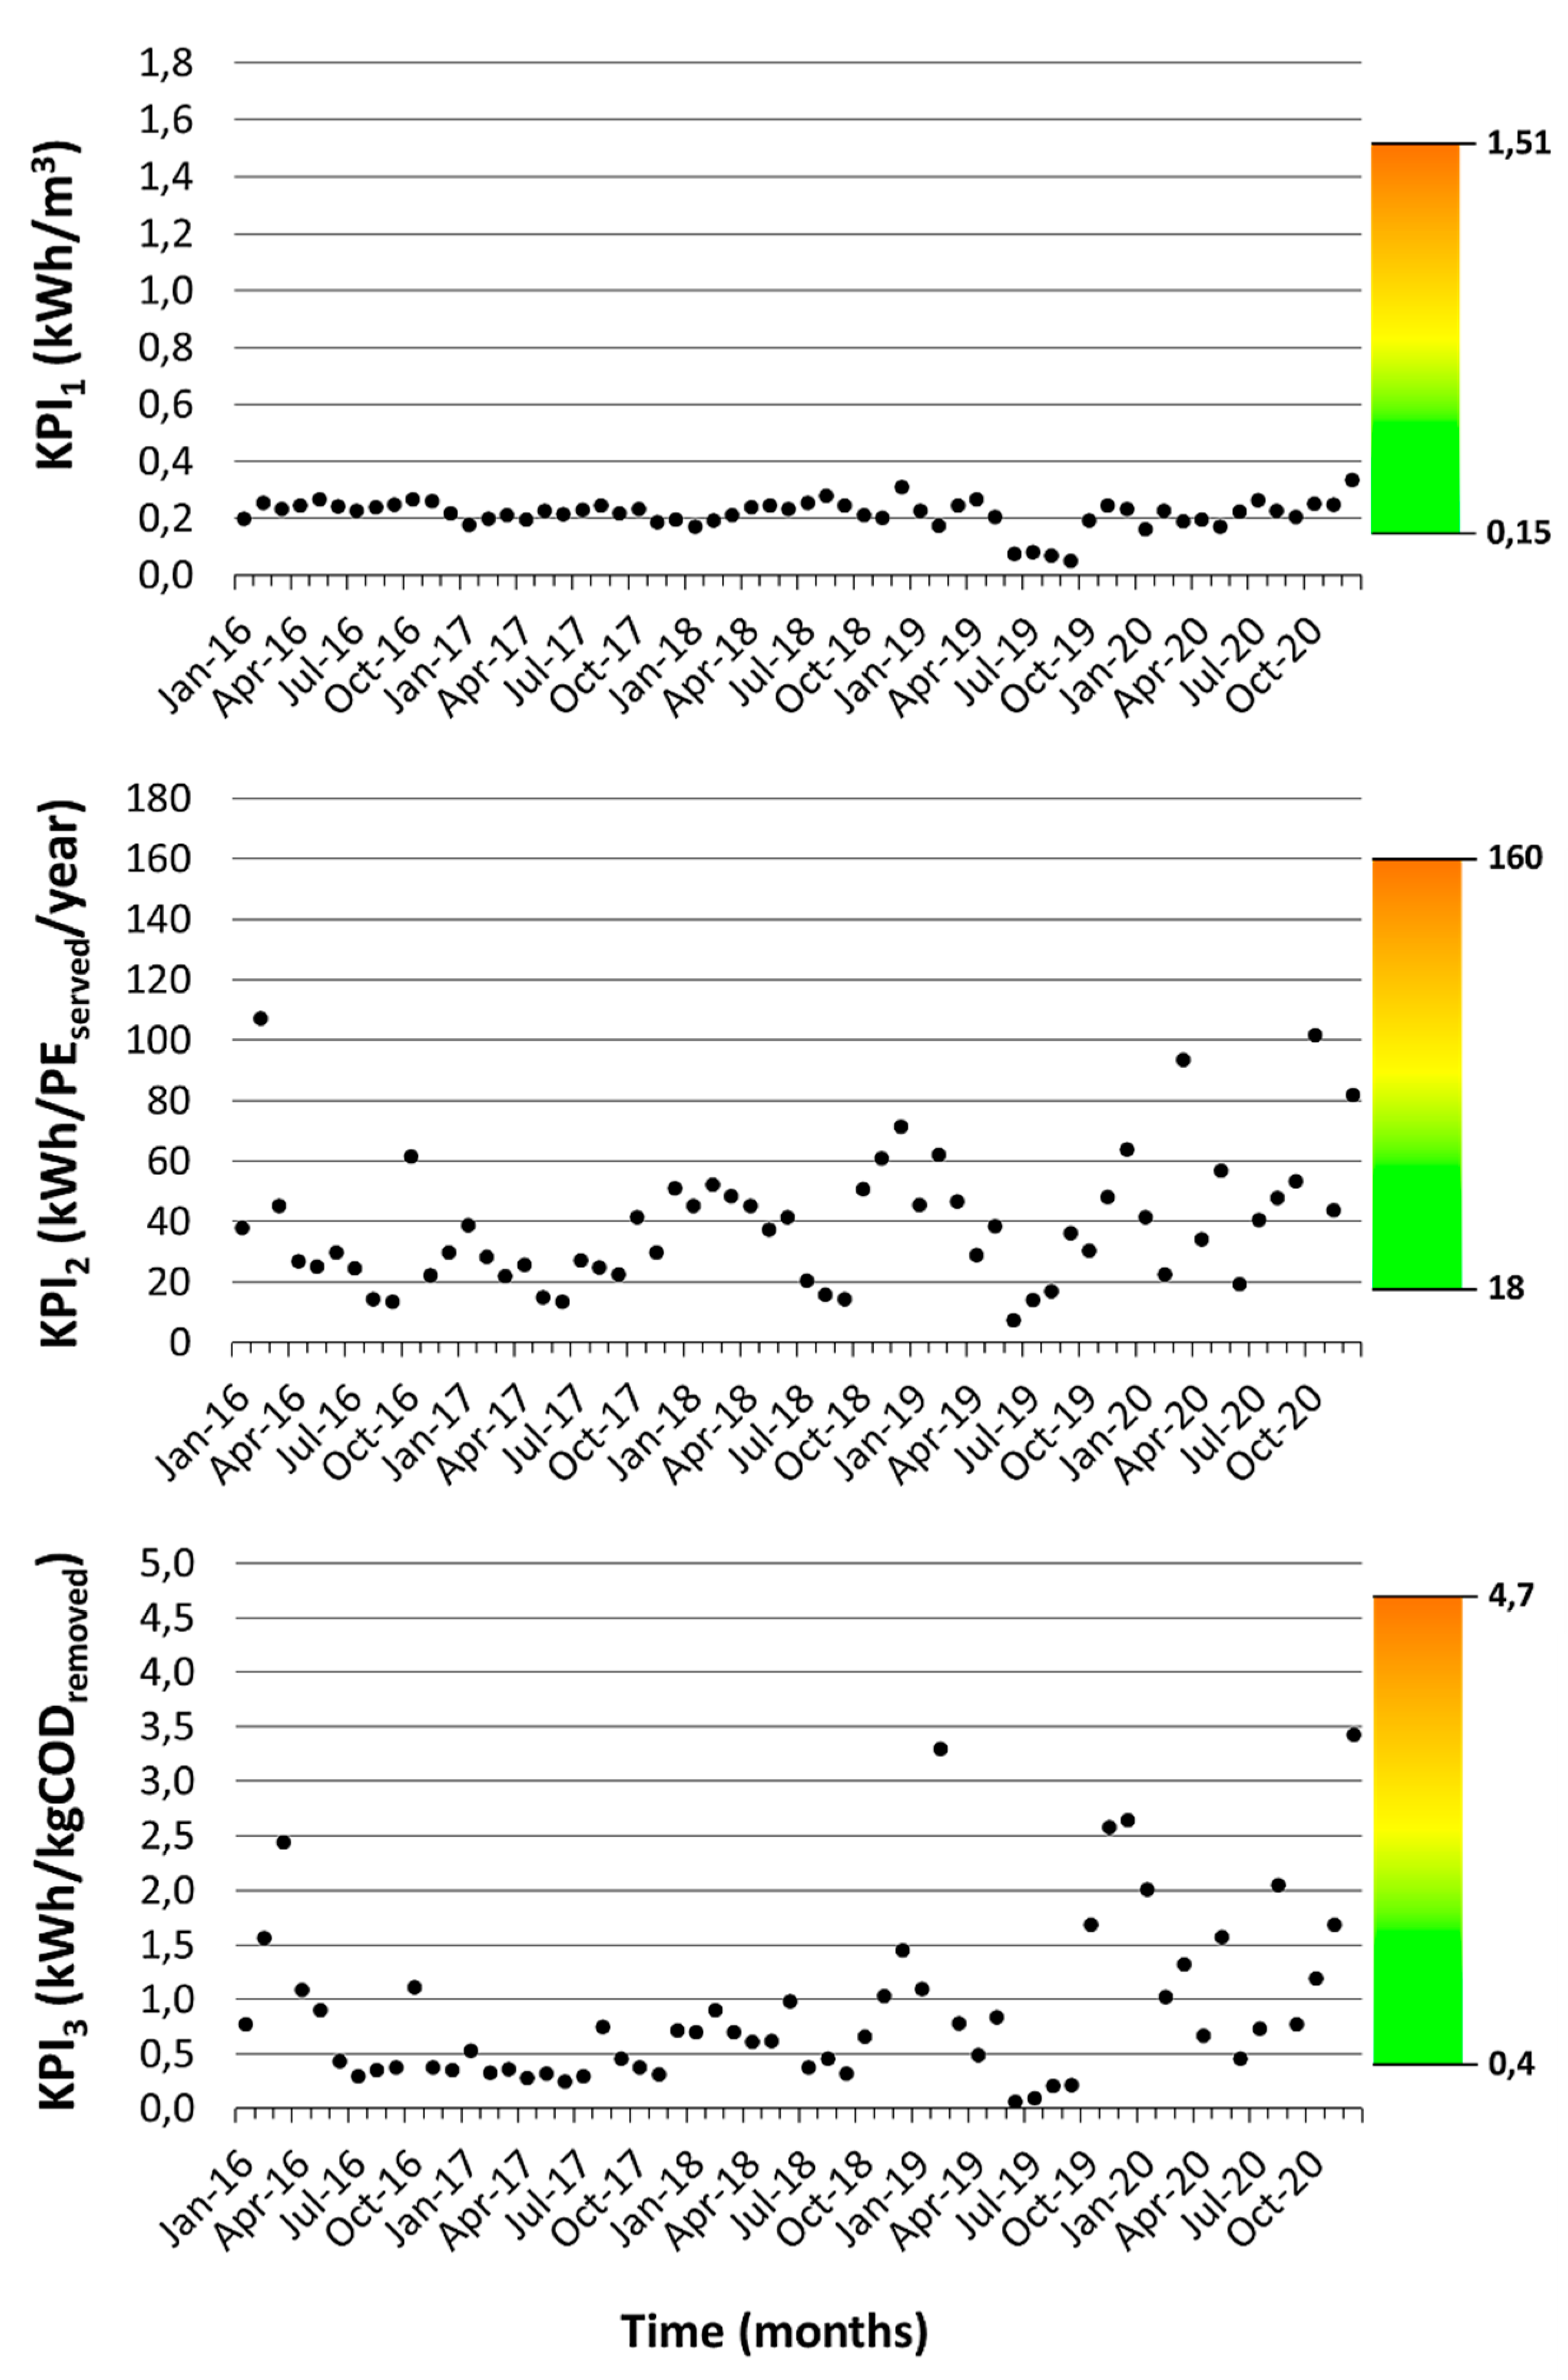
Relevant literature showed that the more concentrated the wastewater is in terms of organic load, the more efficient its specific energy consumption will be [24,27,31]. In relation to this aspect, in Figure 4 the temporal trends of the KPIs through the 5 years of monitoring were depicted, emphasizing their ranking with respect to the range reported in the existing literature for treatment plants of the same size (10.000 < PE < 99.999) [27]. Campanelli, Foladori and Vaccari [27] reported representative values for these three key performance indexes as a result of a statistical survey conducted on 241 treatment plants, 60 of which belonging to the same size category as the WWTP object of this study. For such plants, the following ranges of values are given: (i) KPI1 between 0,15 and 1,51, with a mean of 0,47 (standard deviation 0,27); (ii) KPI2 between 18 and 160, with a mean of 63 (standard deviation 29); (iii) KPI3 between 0,4 and 4,7, with a mean of 1,7 (standard deviation 0,9). As observed, the specific consumptions were always high-performing when compared to the benchmark range, being mostly scattered towards the lower cut-off indicated (best performance). Unlike KPI1, which was very homogeneous, KPI2 and KPI3 exhibited a greater variability over time; this trend should not be surprising because the calculation of the two parameters considered the trend of the pollutant load associated with the wastewater and which appeared affected, as has been previously discussed, by a tourism seasonality effect.

Figure 4.
Time trend of the three KPIs defined in the description model (Table 1), compared to the range of values reported in the literature for WWTP of the same size and plant layout, according to Campanelli, Foladori and Vaccari [27].
Finally, with regard to the effectiveness of purification treatments, Table 2 highlights the average annual values obtained for the 3 parameters BOD5, COD, TSS, with their standard deviation. For the first two parameters, removal efficiencies are very high and largely comply with the effluent threshold values imposed by current legislation, for which minimum removal is expected to be 80% and 75%, respectively for BOD5 and COD. Concerning the suspended solids, the system very often appeared ineffective. In particular, the values of removal efficiency evaluated using static data provide an overall TSS removal performance of 69% (standard deviation 12%), while it should be equal or higher than 90%. In order to investigate the real accuracy of the offline TSS measurements, as it will be discussed in the next section, it was decided to rely on the use of sensors for real-time monitoring of this parameter and for a simultaneous comparison with the officially reported static data.
3.2. Dynamic Monitoring
Thousands of data were obtained during the 13 months of real-time monitoring, starting with the energy consumption of the entire facility.
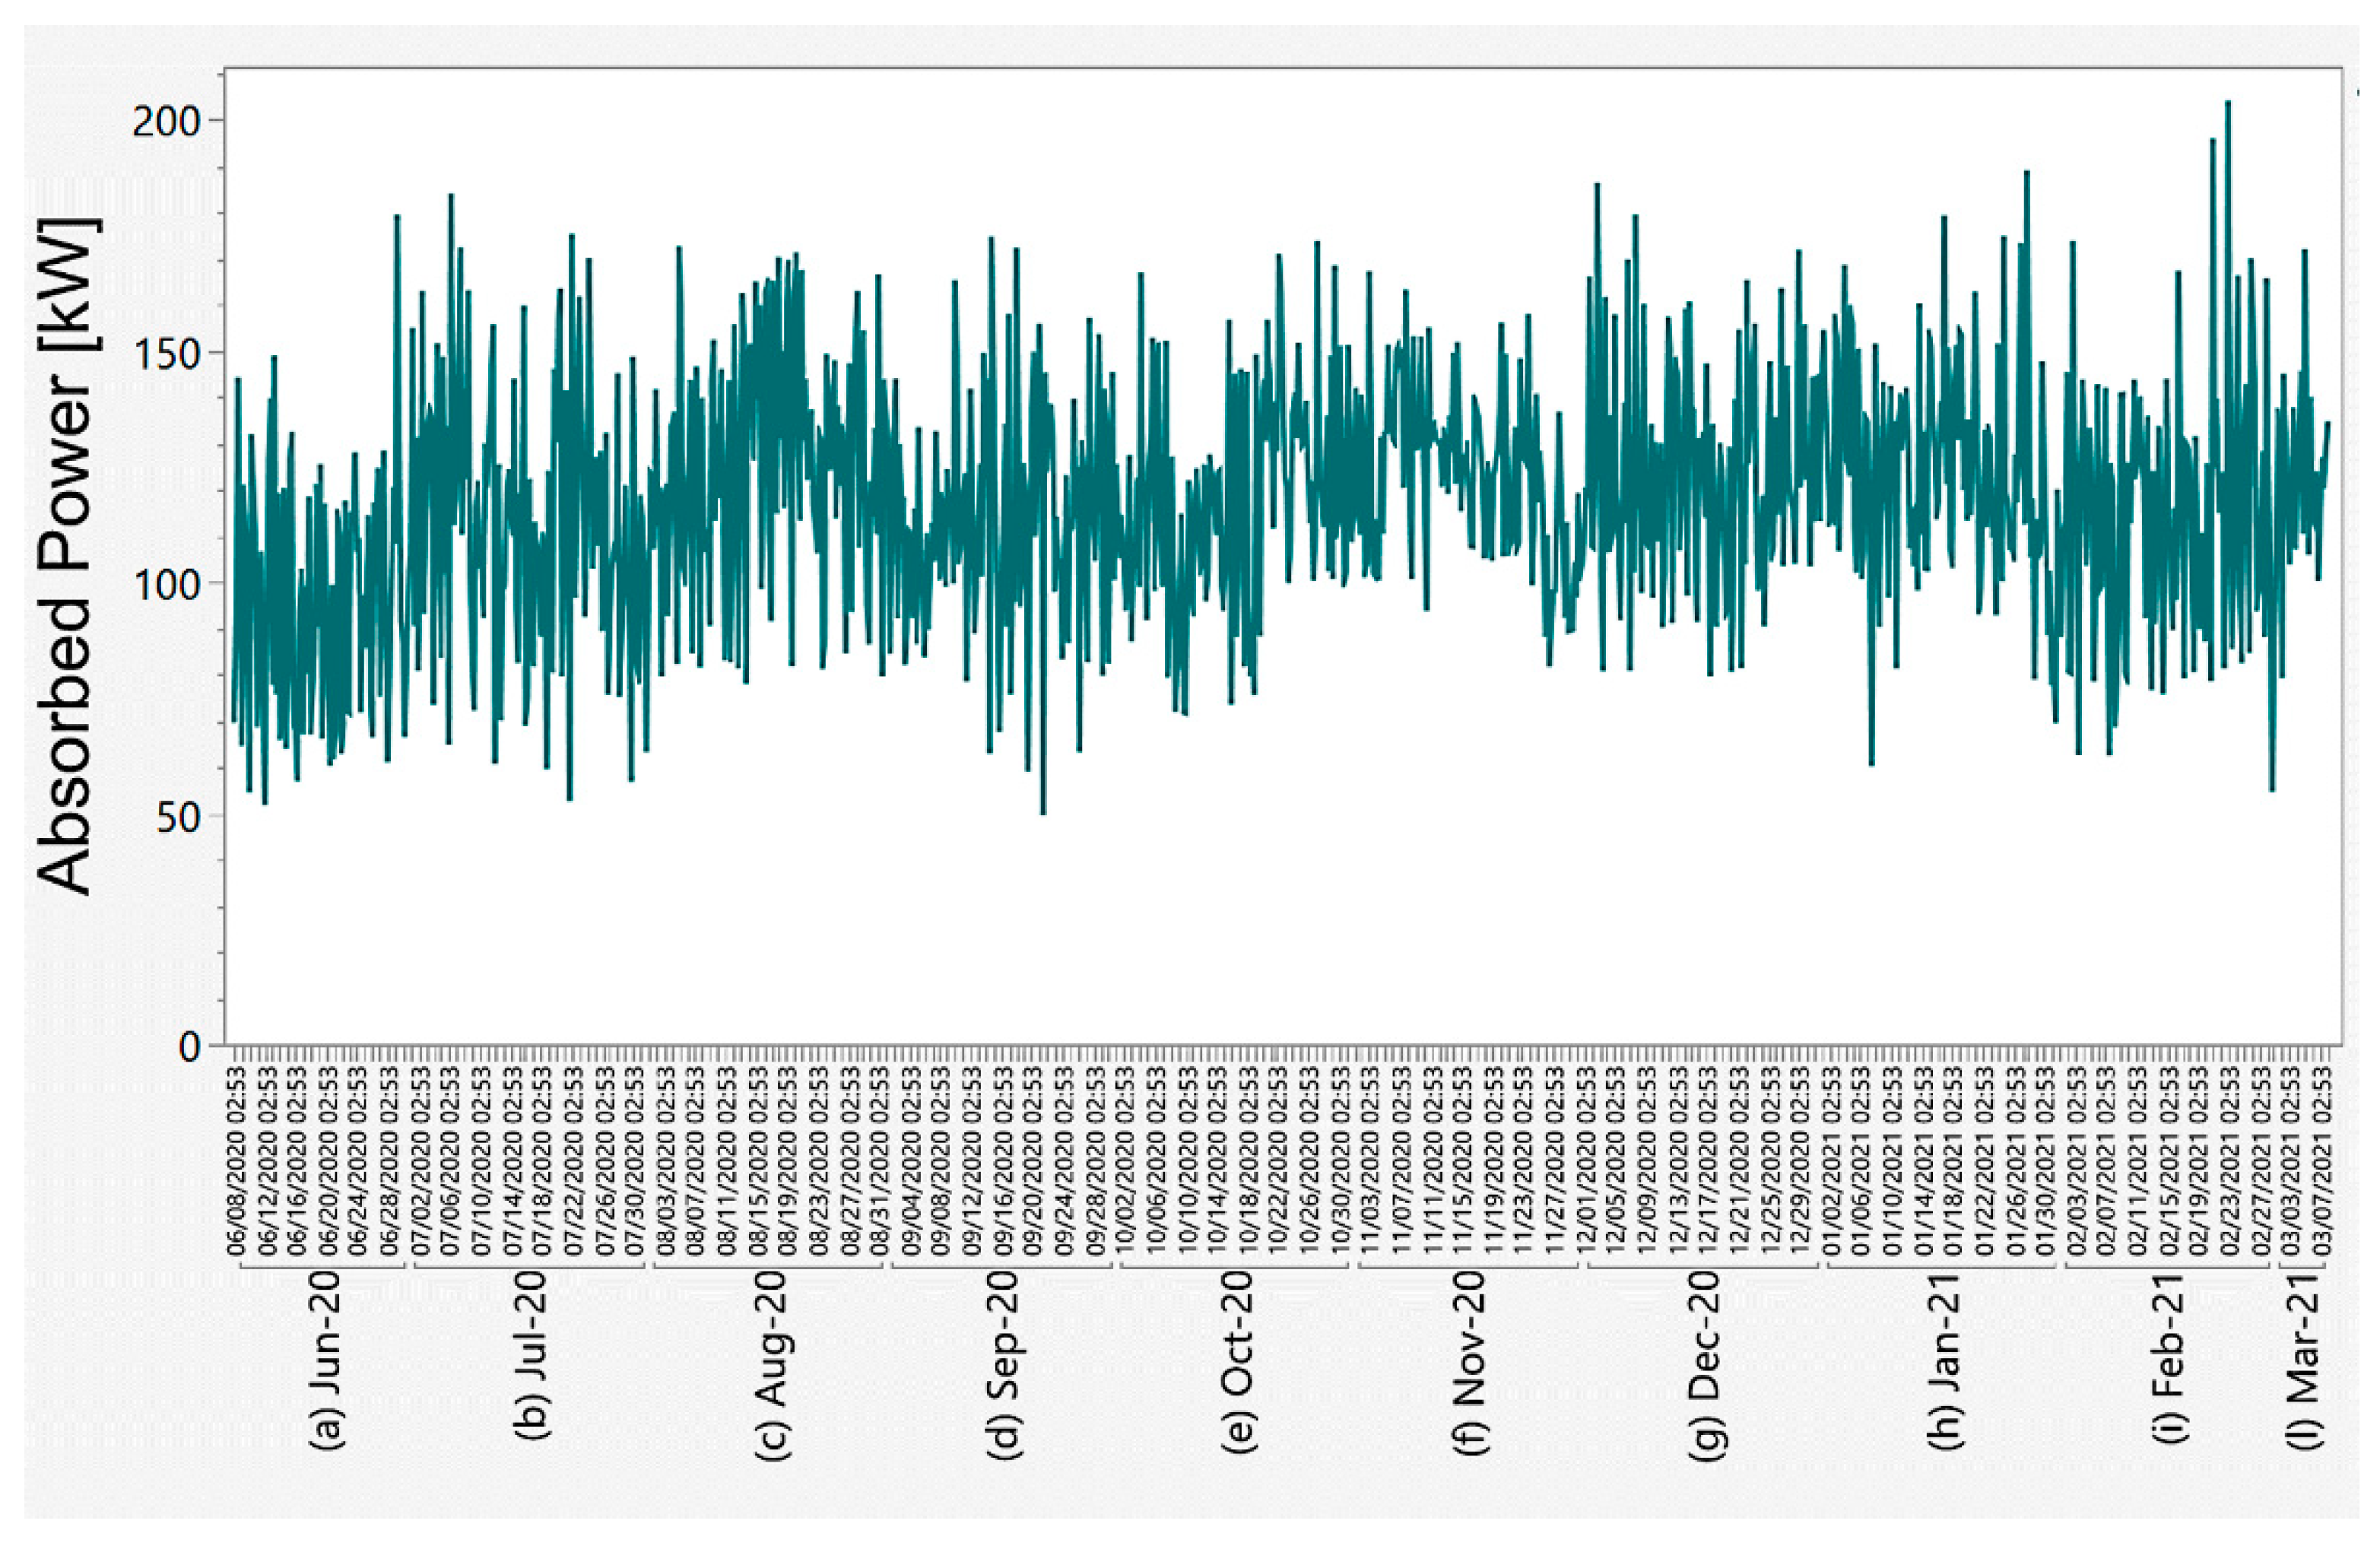
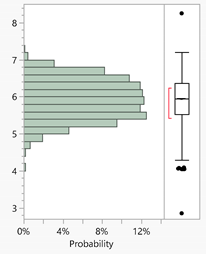
Figure 5 shows the time trend of the absorbed power recorded at the facility general electrical panel over a period of about 10 months. As can be seen, power was absorbed by the entire infrastructure without relevant fluctuations, with an average value over the entire period of 117 kW (standard deviation 25 kW). Along with the energetic inputs, it was also monitored the content of dissolved oxygen in the wastewater of the oxidation tank, with an average value of 5,9 mg/L (standard deviation 0,5) (Table 3). The study of a potential interdependence between the oxygen dissolved in the sewage and the power absorbed by the facility (to drive the electromechanical units used to aerate the sewage) revealed that there is no link between the two variables (Figure 6). Indeed, the bivariate estimation of the two parameters returned an r2 equal to 0,03 (correlation index: −0,28 for a confidence interval < 95%; −0,05 for a confidence interval > 95%); moreover, Pearson correlation index between O2 and Power was −0,09, for which two variables are significantly not correlated.
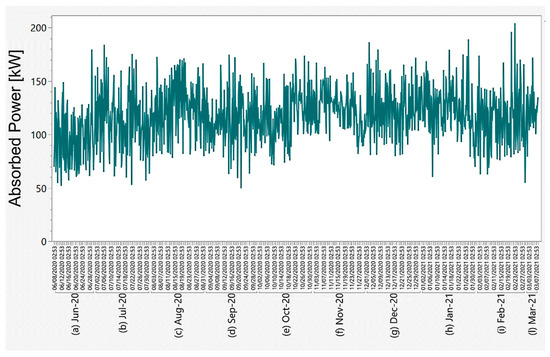
Figure 5.
Time trend of the power absorbed by the WWTP over a period of about 10 months.
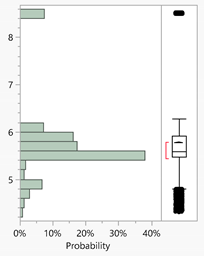
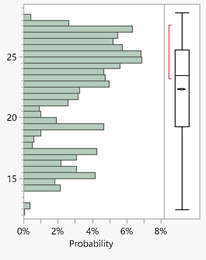
Table 3.
Distribution of real-time values of dissolved O2, pH, and T in the oxidation tank, with the corresponding box plot and a summary of the main statistical quantities evaluated on the data sets.
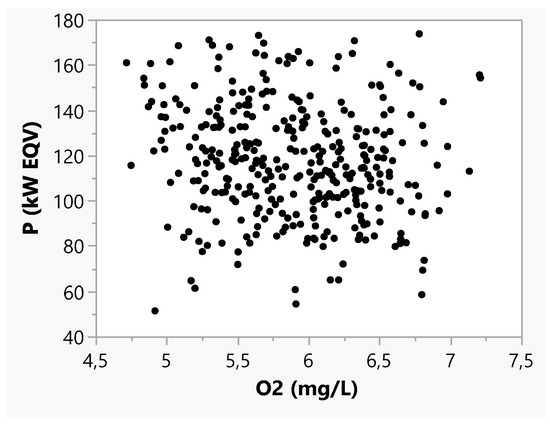
Figure 6.
Bivariate estimation of the power absorbed by the system versus the O2 content of the wastewater.
Concurrently with the wastewater O2 content, in the oxidation tank it was also possible to place sensors for monitoring the temperature and pH of the sewage. Monitoring of these two parameters, although it does not directly affect the management of energy use in the system at this stage, is still very important for future prospects of recovery of matter and energy from the system. In recent years, in fact, the issue of implementing innovative and sustainable technologies for recovering nutrients and resources from waste streams has become increasingly relevant [32]. One of these streams is wastewater, which is responsible for the loss of more than 55% of the total phosphorus from the European Union system boundaries [33], phosphorus being primarily imported from foreign countries and for which there is much interest in implementing recovery practices [34]. One of the approaches most explored and appreciated in recent years for the significant benefits it brings is to use urban wastewater as a growth medium for algal biomass, which traps within its cellular structure most of the macro and micronutrients naturally abundant in wastewater, including, for example, phosphorus [35]. For the implementation of such sustainable cultivation systems, especially if they are continuously-fed systems for maximizing biomass production, understanding how key parameters such as pH and temperature change during the seasons becomes crucial, in order to select the organism that best suits such habitat and that needs minimum interventions to artificially modify the growth conditions (by chemically modifying the pH of the wastewater or heating/cooling the wastewater before feeding it into photobioreactors). In the specific case study of the Agropoli WWTP, as can be seen from the data shown in Table 3, the urban wastewater is characterized by an average temperature of about 22 °C and an average sub-acid pH (5,7). A wastewater with these values, used in an enclosed environment (e.g., greenhouse) and with a further non-invasive acidification (up to pH 4) could potentially be suitable for the use with extremophilic thermoacidophilic microalgae, which are currently among those of greatest interest on the market for their great adaptive capacity, tolerance to heavy metals and toxic substances in the environment, high productivity of bio-compounds with high market value (phycobiliproteins, pigments, glycogen and other reserve carbohydrates, secondary metabolites with antioxidant and antibacterial activity) [14,36,37,38].
The monitoring system implemented in this WWTP allowed to go a step further than just monitoring energy consumption, providing an example of how data obtained in real time can be used to learn about and more accurately manage a specific industrial system, in this case a wastewater treatment plant. One of the parameters being monitored in real time that was most effective in highlighting the ineffectiveness of random controls of the chemical and physical composition of the wastewater is the TSS at the inlet and outlet of the plant (Figure 1). Figure 7 shows the time-trend of this parameter during the three summer months of the year 2020, on which the studies focused because it represented the timeframe during which the pollutant load associated with the sewage is expected to be higher than the rest of the year due to a touristic season effect. During this time period, the probes recorded average TSS removal efficiencies approximately equal to or greater than the limit imposed by legislation (Table 4). Therefore, comparing the average values obtained for this parameter based on both static and dynamic measurements during the 3-month timeframe (Table 4), it was demonstrated that not only does the plant operate in full compliance with the thresholds imposed by legislation, but the random sampling of wastewater to analyze its composition must be more accurately reprogrammed in order to have a truly representative picture of the plant’s operating conditions.
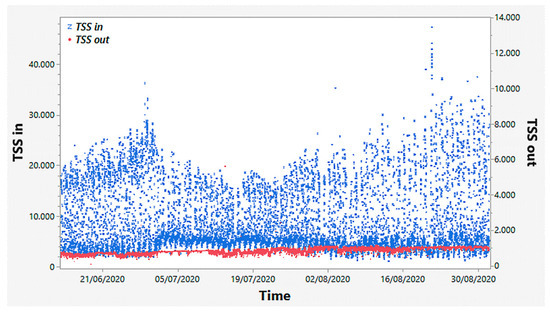
Figure 7.
Time trend of the total suspended solids entering and leaving the WWTP over a period of 3 months.
Table 4.
Comparison of monthly removal efficiencies from static data versus average values from dynamic monitoring, over a period of 3 months.
4. Conclusions
Aim of this document was to present the results of on-line and offline monitoring activities on a WWTP with conventional activated sludge layout. Using a descriptive model specifically conceived for such systems, it was possible to define the energetic-environmental performances of the system, also comparing them with data reported in the recent literature on similar case studies. Using the operational indicators conceived for the evaluation of organic and hydraulic load entering the system, the plant has shown a tendency to be undersized compared to the amount of pollutants and—especially—volumetric flowrates it receives, very often exceeding the maximum design capacity (45.000 PE). The variation in organic load was found to be influenced more by tourist seasonal influxes, as evidenced by a comparative analysis between (i) the time-trend of hydraulic load and (ii) the temporal characterization of the pollutant load with ternary plots. Nevertheless, from a descriptive point of view, the use of ternary plots helped to define the composition of the effluent, which showed a general organic footprint and was weakly exposed to dilution by inflow and infiltration. The use of sensors to monitor both environmental and energy parameters allowed to reveal with a high temporal resolution a missing correlation (Pearson correlation index equal to −0,09) between the electrical power absorbed by the WWTP and oxygen dissolved in the wastewater, which is regulated by aeration machineries that account for more than 50% of the total energy demand. Real-time monitoring of total suspended solids, on the other hand, showed that the plant is effective in removing contaminants (average real-time TSSremoval efficiency > 90% vs. average offline TSSremoval efficiency ≈ 70%), indeed disproving the offline records obtained through routine sampling of the effluent to determine its chemical and physical composition, thus suggesting a more effective planning of monitoring operations on behalf of the technical staff. Characterizing the pattern of parameters such as temperature and pH of wastewater through continuous monitoring, finally, is extremely important, because it provides essential information aimed at the implementation of sustainable technologies for the bio-recovery of material and energy resources, towards the valorization of waste streams. The overall results suggest the need for a more extensive digital monitoring within industrial systems, providing information on the system at a deeper and deeper level. Moreover, as they are comparable with similar systems, these results provide a useful support to the international scientific discussion on the topic of optimizing the energy management of wastewater treatment plants, for implementing more effective management strategies through the knowledge of different experiences.
Author Contributions
Conceptualization, M.R.d.C. and C.L.; methodology, M.R.d.C., A.M. and C.L.; software, A.M., A.S. and C.V.; validation, M.R.d.C., A.M., A.S., C.V. and C.L.; formal analysis, M.R.d.C., A.M., A.S., C.V. and M.I.; investigation, A.M., A.S. and C.V.; resources, L.B. and G.G.; data curation, M.R.d.C. and A.M.; writing—original draft preparation, M.R.d.C. and A.M.; writing—review and editing, M.R.d.C. and C.L.; visualization, M.R.d.C. and A.M.; supervision, C.L.; project administration, G.G. and C.L.; funding acquisition, C.L. All authors have read and agreed to the published version of the manuscript.
Funding
This research received no external funding.
Data Availability Statement
Restrictions apply to the availability of these data. Data was obtained from ASIS Reti e Impianti SpA and are available on request from the corresponding author with the permission of ASIS Reti e Impianti SpA.
Acknowledgments
We would like to thank the company ASIS Reti e Impianti SpA for providing resources, financing part of the monitoring activities and allowing access to the wastewater treatment plant where the sensors were installed.
Conflicts of Interest
The authors declare no conflict of interest. The funders had no role in the design of the study; in the collection, analyses, or interpretation of data; in the writing of the manuscript, or in the decision to publish the results.
References
- Cardoso, B.J.; Rodrigues, E.; Gaspar, A.R.; Gomes, Á. Energy performance factors in wastewater treatment plants: A review. J. Clean. Prod. 2021, 129107. [Google Scholar] [CrossRef]
- Longo, S.; Chitnis, M.; Mauricio-Iglesias, M.; Hospido, A. Transient and Persistent Energy Efficiency in the Wastewater Sector based on Economic Foundations. Energy J. 2020, 41. [Google Scholar] [CrossRef]
- Gehring, T.; Deineko, E.; Hobus, I.; Kolisch, G.; Lübken, M.; Wichern, M. Effect of sewage sampling frequency on determination of design parameters for municipal wastewater treatment plants. Water Sci. Technol. 2020, 84, 284–292. [Google Scholar] [CrossRef]
- Daelman, M.R.J.; De Baets, B.; van Loosdrecht, M.C.M.; Volcke, E.I.P. Influence of sampling strategies on the estimated nitrous oxide emission from wastewater treatment plants. Water Res. 2013, 47, 3120–3130. [Google Scholar] [CrossRef]
- Li, Z.; Zou, Z.; Wang, L. Analysis and Forecasting of the Energy Consumption in Wastewater Treatment Plant. Math. Probl. Eng. 2019, 2019, 1–8. [Google Scholar] [CrossRef] [Green Version]
- IEA. World Energy Outlook; Organisation for Economic Co-Operation and Development/International Energy Agency: Paris, France, 2016. [Google Scholar]
- Utilitalia. Linea Guida per l’Esecuzione della Diagnosi Energetica ai Sensi Dell’articolo 8 del d.lgs 102/2014—Servizio Idrico Integrato. Transl. “Guideline for the Execution of the Energy Diagnosis according to Article 8 of the Legislative Decree No. 102/2014—Integrated Water Service”; Utilitalia—Imprese Acqua Ambiente Energia: Rome, Italy, 2018. [Google Scholar]
- Metcalf&Eddy. Wastewater Engineering, Treatment and Reuse, 4th ed.; McGraw Hill: New York, NY, USA, 2014. [Google Scholar]
- Kehrein, P.; van Loosdrecht, M.; Osseweijer, P.; Garfí, M.; Dewulf, J.; Posada, J. A critical review of resource recovery from municipal wastewater treatment plants—Market supply potentials, technologies and bottlenecks. Environ. Sci. Water Res. Technol. 2020, 6, 877–910. [Google Scholar] [CrossRef] [Green Version]
- Capodaglio, A.G.; Olsson, G. Energy issues in sustainable urban wastewater management: Use, demand reduction and recovery in the urban water cycle. Sustainability 2020, 12, 266. [Google Scholar] [CrossRef] [Green Version]
- PNRR. Piano Nazionale di Ripresa e Resilienza (IT). Transl: National Recovery and Resilience Plan (Italy). In Next Generation EU Program; Ministero dell’Economia e delle Finanze: Rome, Italy, 2021. Available online: https://www.governo.it/sites/governo.it/files/PNRR.pdf (accessed on 29 September 2021).
- Bhatia, S.K.; Mehariya, S.; Bhatia, R.K.; Kumar, M.; Pugazhendhi, A.; Awasthi, M.K.; Atabani, A.E.; Kumar, G.; Kim, W.; Seo, S.-O.; et al. Wastewater based microalgal biorefinery for bioenergy production: Progress and challenges. Sci. Total Environ. 2021, 751, 141599. [Google Scholar] [CrossRef] [PubMed]
- Goswami, R.K.; Mehariya, S.; Verma, P.; Lavecchia, R.; Zuorro, A. Microalgae-based biorefineries for sustainable resource recovery from wastewater. J. Water Process. Eng. 2020, 101747. [Google Scholar] [CrossRef]
- di Cicco, M.R.; Palmieri, M.; Altieri, S.; Ciniglia, C.; Lubritto, C. Cultivation of the Acidophilic Microalgae Galdieria phlegrea with Wastewater: Process Yields. Int. J. Environ. Res. Public Health 2021, 18, 2291. [Google Scholar] [CrossRef]
- Foladori, P.; Vaccari, M.; Vitali, F. Energy audit in small wastewater treatment plants: Methodology, energy consumption indicators, and lessons learned. Water Sci. Technol. 2015, 72, 1007–1015. [Google Scholar] [CrossRef] [Green Version]
- Vetromile, C.; Spagnuolo, A.; Petraglia, A.; Masiello, A.; di Cicco, M.R.; Lubritto, C. Pre- and post-operam comparison of the energy consumption of a radio base station under energy efficiency actions. Energy Build. 2021, 236, 110772. [Google Scholar] [CrossRef]
- Mamandipoor, B.; Majd, M.; Sheikhalishahi, S.; Modena, C.; Osmani, V. Monitoring and detecting faults in wastewater treatment plants using deep learning. Environ. Monit. Assess. 2020, 192, 148. [Google Scholar] [CrossRef]
- di Cicco, M.R.; Spagnuolo, A.; Masiello, A.; Vetromile, C.; Nappa, M.; Corbo, G.; Lubritto, C. Assessing energy performance and critical issues of a large wastewater treatment plant through full-scale data benchmarking. Water Sci. Technol. 2019, 80, 1421–1429. [Google Scholar] [CrossRef]
- D.Lgs 102/2014 as Amended. Legislative Decree no. 102 of 4 July 2014. “Implementation of Directive 2012/27/EU on Energy Efficiency, Amending Directives 2009/125/EC and 2010/30/EU and Repealing Directives 2004/8/EC and 2006/32/EC. (14G00113)”; Official Journal; Istituto Poligrafico e Zecca dello Stato: Rome, Italy, 4 July 2014.
- Fighir, D.; Teodosiu, C.; Fiore, S. Environmental and Energy Assessment of Municipal Wastewater Treatment Plants in Italy and Romania: A Comparative Study. Water 2019, 11, 1611. [Google Scholar] [CrossRef] [Green Version]
- di Cicco, M.R.; Spagnuolo, A.; Masiello, A.; Vetromile, C.; Nappa, M.; Lubritto, C. Energetic and environmental analysis of a wastewater treatment plant through static and dynamic monitoring activities. Int. J. Environ. Sci. Technol. 2020, 17, 4299–4312. [Google Scholar] [CrossRef]
- D.Lgs 152/2006 as Amended. Legislative Decree 152 of 3 April 2006. “Environmental Regulations”; Official Journal; Istituto Poligrafico e Zecca dello Stato: Rome, Italy, 3 April 2006.
- di Cicco, M.R.; Spagnuolo, A.; Masiello, A.; Vetromile, C.; Nappa, M.; Corbo, G.; Lubritto, C. Energy Monitoring of a Wastewater Treatment Plant in Salerno, Campania Region (Southern Italy). In Frontiers in Water-Energy-Nexus—Nature-Based Solutions, Advanced Technologies and Best Practices for Environmental Sustainability; Springer: Cham, Switzerland, 2019. [Google Scholar]
- Longo, S.; d’Antoni, B.M.; Bongards, M.; Chaparro, A.; Cronrath, A.; Fatone, F.; Lema, J.M.; Mauricio-Iglesias, M.; Soares, A.; Hospido, A. Monitoring and diagnosis of energy consumption in wastewater treatment plants. A state of the art and proposals for improvement. Appl. Energy 2016, 179, 1251–1268. [Google Scholar] [CrossRef] [Green Version]
- Abdallaa, K.Z.; Hammamb, G. Correlation between Biochemical Oxygen Demand and Chemical Oxygen Demand for Various Wastewater Treatment Plants in Egypt to Obtain the Biodegradability Indices. Int. J. Sci. Basic Appl. Res. 2014, 13, 42–48. [Google Scholar]
- Papadopoulos, A.; Parissopoulos, G.; Papadopoulos, F.; Karteris, A. Variations of COD/BOD5 ratio at different units of a wastewater stabilization pond pilot treatment facility. In Proceedings of the 7th International Conference on Environmental Science and Technology Ermoupolis, Syros Island, Greece, 3–6 September 2001; pp. 16–19. [Google Scholar]
- Campanelli, M.; Foladori, P.; Vaccari, M. Electricity Consumption and Energy Efficiency in Wastewater Treatment; Maggioli Editore: Rimini, Italy, 2013. [Google Scholar]
- Dias, D.F.C.; Marques, R.; Martins, C.; Martins, A.; Oehmen, A. The impact of a seasonal change in loading rate on the nitrous oxide emissions at the WWTP of a tourist region. Sci. Total Environ. 2022, 804, 149987. [Google Scholar] [CrossRef]
- Bakar, N.A.; Rosbi, S. Effect of Coronavirus disease (COVID-19) to tourism industry. Int. J. Adv. Eng. Res. Sci. 2020, 7, 189–193. [Google Scholar] [CrossRef] [Green Version]
- Cahoon, L.B.; Hanke, M.H. Rainfall effects on inflow and infiltration in wastewater treatment systems in a coastal plain region. Water Sci. Technol. 2017, 75, 1909–1921. [Google Scholar] [CrossRef]
- Vaccari, M.; Foladori, P.; Nembrini, S.; Vitali, F. Benchmarking of energy consumption in municipal wastewater treatment plants—A survey of over 200 plants in Italy. Water Sci. Technol. 2018, 77, 2242–2252. [Google Scholar] [CrossRef] [PubMed]
- Kaloudas, D.; Pavlova, N.; Penchovsky, R. Phycoremediation of wastewater by microalgae: A review. Environ. Chem. Lett. 2021, 2905–2920. [Google Scholar] [CrossRef]
- van Dijk, K.C.; Lesschen, J.P.; Oenema, O. Phosphorus flows and balances of the European Union Member States. Sci. Total Environ. 2016, 542, 1078–1093. [Google Scholar] [CrossRef] [PubMed]
- Egle, L.; Rechberger, H.; Krampe, J.; Zessner, M. Phosphorus recovery from municipal wastewater: An integrated comparative technological, environmental and economic assessment of P recovery technologies. Sci. Total Environ. 2016, 571, 522–542. [Google Scholar] [CrossRef] [Green Version]
- Panda, S.; Mishra, S.; Akcil, A.; Kucuker, M.A. Microalgal potential for nutrient-energy-wastewater nexus: Innovations, current trends and future directions. Energy Environ. 2020, 32, 604–634. [Google Scholar] [CrossRef]
- Čížková, M.; Vítová, M.; Zachleder, V. The Red Microalga Galdieria as a Promising Organism for Applications in Biotechnology. In Microalgae—From Physiology to Application; IntechOpen: London, UK, 2019; Available online: https://www.intechopen.com/chapters/69487 (accessed on 29 September 2021).
- Bottone, C.; Camerlingo, R.; Miceli, R.; Salbitani, G.; Sessa, G.; Pirozzi, G.; Carfagna, S. Antioxidant and anti-proliferative properties of extracts from heterotrophic cultures of Galdieria sulphuraria. Nat. Prod. Res. 2019, 33, 1659–1663. [Google Scholar] [CrossRef] [PubMed]
- López, G.; Yate, C.; Ramos, F.A.; Cala, M.P.; Restrepo, S.; Baena, S. Production of Polyunsaturated Fatty Acids and Lipids from Autotrophic, Mixotrophic and Heterotrophic cultivation of Galdieria sp. strain USBA-GBX-832. Sci. Rep. 2019, 9, 10791. [Google Scholar] [CrossRef] [PubMed]


Publisher’s Note: MDPI stays neutral with regard to jurisdictional claims in published maps and institutional affiliations. |
© 2021 by the authors. Licensee MDPI, Basel, Switzerland. This article is an open access article distributed under the terms and conditions of the Creative Commons Attribution (CC BY) license (https://creativecommons.org/licenses/by/4.0/).