Article

Roof Color-Based Warm Roof Evaluation in Cold Regions Using a UAV Mounted Thermal Infrared Imaging Camera

1
Department of Spatial Information, Kyungpook National University, Daegu 41566, Korea
2
Korea Land and Geospatial Informatix Corporation, Andong 36691, Korea
3
Department of Convergence and Fusion System Engineering, Kyungpook National University, Sangju 37224, Korea
*
Author to whom correspondence should be addressed.
Energies 2021, 14(20), 6488; https://doi.org/10.3390/en14206488
Submission received: 9 September 2021 / Revised: 6 October 2021 / Accepted: 7 October 2021 / Published: 10 October 2021
(This article belongs to the Special Issue Building, District, and Community Energy Systems Optimization)

Abstract

:
Existing studies on reducing urban heat island phenomenon and building temperature have been actively conducted; however, studies on investigating the warm roof phenomenon to in-crease the temperature of buildings are insufficient. A cool roof is required in a high-temperature region, while a warm roof is needed in a low-temperature or cold region. Therefore, a warm roof evaluation was conducted in this study using the roof color (black, blue, green, gray, and white), which is relatively easier to install and maintain compared to conventional insulation materials and double walls. A remote sensing method via an unmanned aerial vehicle (UAV)-mounted thermal infrared (TIR) camera was employed. For warm roof evaluation, the accuracy of the TIR camera was verified by comparing it with a laser thermometer, and the correlation between the surface temperature and the room temperature was also confirmed using Pearson correlation. The results showed significant surface temperature differences ranging from 8 °C to 28 °C between the black-colored roof and the other colored roofs and indoor temperature differences from 1 °C to 7 °C. Through this study, it was possible to know the most effective color for a warm roof according to the color differences. This study gave us an idea of which color would work best for a warm roof, as well as the temperature differences from other colors. We believe that the results of this study will be helpful in heating load research, providing an objective basis for determining whether a warm roof is applied.

1. Introduction

Reducing energy consumption is important in energy systems, experts point out [1]. The largest energy consumption in a country is observed in three sectors: buildings, industry, and transport [2,3]. At the 25th United Nations Framework Convention on Climate Change, the Conference of the Parties announced that the global construction sector accounts for about 40% of total carbon emissions and 36% of the energy use [4]. A key factor in future building development is to build buildings that consume less energy, are comfortable, and have low carbon emissions [5]. With the global economic development, the urbanization rate is gradually increasing, and the urban temperature continues to rise due to the global warming effect and abnormal country temperature due to the increase in the urbanization rate. Due to these abnormal temperatures in cities, interest in the urban heat island phenomenon is increasing. The main causes of the urban heat island phenomenon are the heating and cooling of buildings, operation of factories, driving of automobiles, and artificial structures of asphalt and concrete [6,7]. This phenomenon causes a rise in the temperature of the building and is accompanied by housing problems such as heating and cooling loads. For this reason, in hot summer and cold winter regions, people’s demands for indoor heating environments are increasing [8]. Various studies have been conducted to reduce the temperatures of structures [9,10,11]. In particular, evaluating cool roofs, which is the most convenient method of lowering the temperature of a building and the easiest to install and maintain, has been actively investigated [12,13]. An unmanned aerial vehicle (UAV) was recently employed to evaluate the existing cool and green roofs [14,15].
As mentioned above, studies on urban heat islands and the lowering of building temperatures have been actively evaluated, but no significant reports were found on the evaluation of warm roofs that increase the temperature of buildings. In regions with a severe urban heat island effect, the temperature difference in the winter is greater than in the summer, because the use of heating in the winter increases rapidly, resulting in a higher temperature in the city center. For this reason, it is necessary to study to increase the temperature of the building through a warm roof using the roof color in order to absorb more solar energy, which is natural energy [16]. The energy performance of a building is complex, because it is affected by a variety of factors, such as external temperature, insolation, exterior cladding, windows, and activities inside the building. Of these, heat loss inside the building is caused by the walls (35%), the roof (25%), the number of floors (15%), and the drafts of (15%) windows [17]. Among the five reasons for heat loss, the walls, number of floors, drafts, and windows are already determined factors when building a building, so it is not easy to change them later. In the case of the roof, it may be difficult to change later, but heat loss can be prevented more easily than other elements through color application. In the case of the roof, a warm roof evaluation is considered to be important, because it is the second-highest among the five heat loss reasons. Additionally, a cool roof is needed in tropical or high-temperature regions, while a warm roof is required in cold or low-temperature regions. As a method of raising the temperature of a building, many studies have been conducted on the development of insulation materials, reinforcement of insulation materials, and double walls [18,19,20,21].
The aforementioned methods pose structural difficulties in certain installation scenarios and other disadvantages, such as high installation and maintenance costs. However, a warm roof with black or dark paint can use the color difference to effectively absorb heat from the natural energy of the sun, increasing the heat accumulation of the roof. Therefore, this technique can be easily applied to existing buildings where other methods fail or are difficult to install. In addition, it is an excellent alternative in terms of cost, because it is easier to install even after the initial design, construction, and completion of a building.
The thermal physics mechanism for the roof is as follows [22]:
  • The sun’s radiation hits the roof surface.
  • Solar Reflectance: the fraction of solar emergance that is reflected by the roof (some heat is absorbed by the roof and transferred to the building below).
  • Thermal Emittance: the relative ability of the roof surface to radiate absorbed heat.
In previous studies, rather than a study on evaluating a warm roof in the winter, the cool roof effect in the summer was conducted [23,24]. Another disadvantage of the existing studies is that they evaluated the model building rather than the actual building, thereby eliminating the impact of the real physical environment on the building. In addition, cold- or low-temperature regions were not considered. In the previous study, it was difficult to obtain the overall temperature of the roof surface in the case of a nonreduced model building, because satellite images, handle-type thermal infrared (TIR) images, and laser thermometers were used to evaluate the cool winter roof. In addition, the use of oblique images may result in distortion [25,26].
Since the previous studies were limited to the summer effect of the cool roof, in this study, a warm roof was evaluated by considering a cold temperature region. In the existing cool roof summer evaluation, the building surface temperature was directly measured using a model building, TIR camera, or a handheld laser thermometer. Since the scale model building may differ from the real environment, in this study, it was applied to the real building, not the scale model building. The actual building has the same indoor area, and the roof surface is divided equally with the indoor area, and color is applied. In addition, previous studies recorded the temperature directly with a handheld TIR camera or remote-based oblique TIR image from a tall building to a low building. However, in this study, TIR images were acquired perpendicularly (90°) from a height of 50 m to the roof surface by remote sensing using a TIR camera mounted on a UAV.

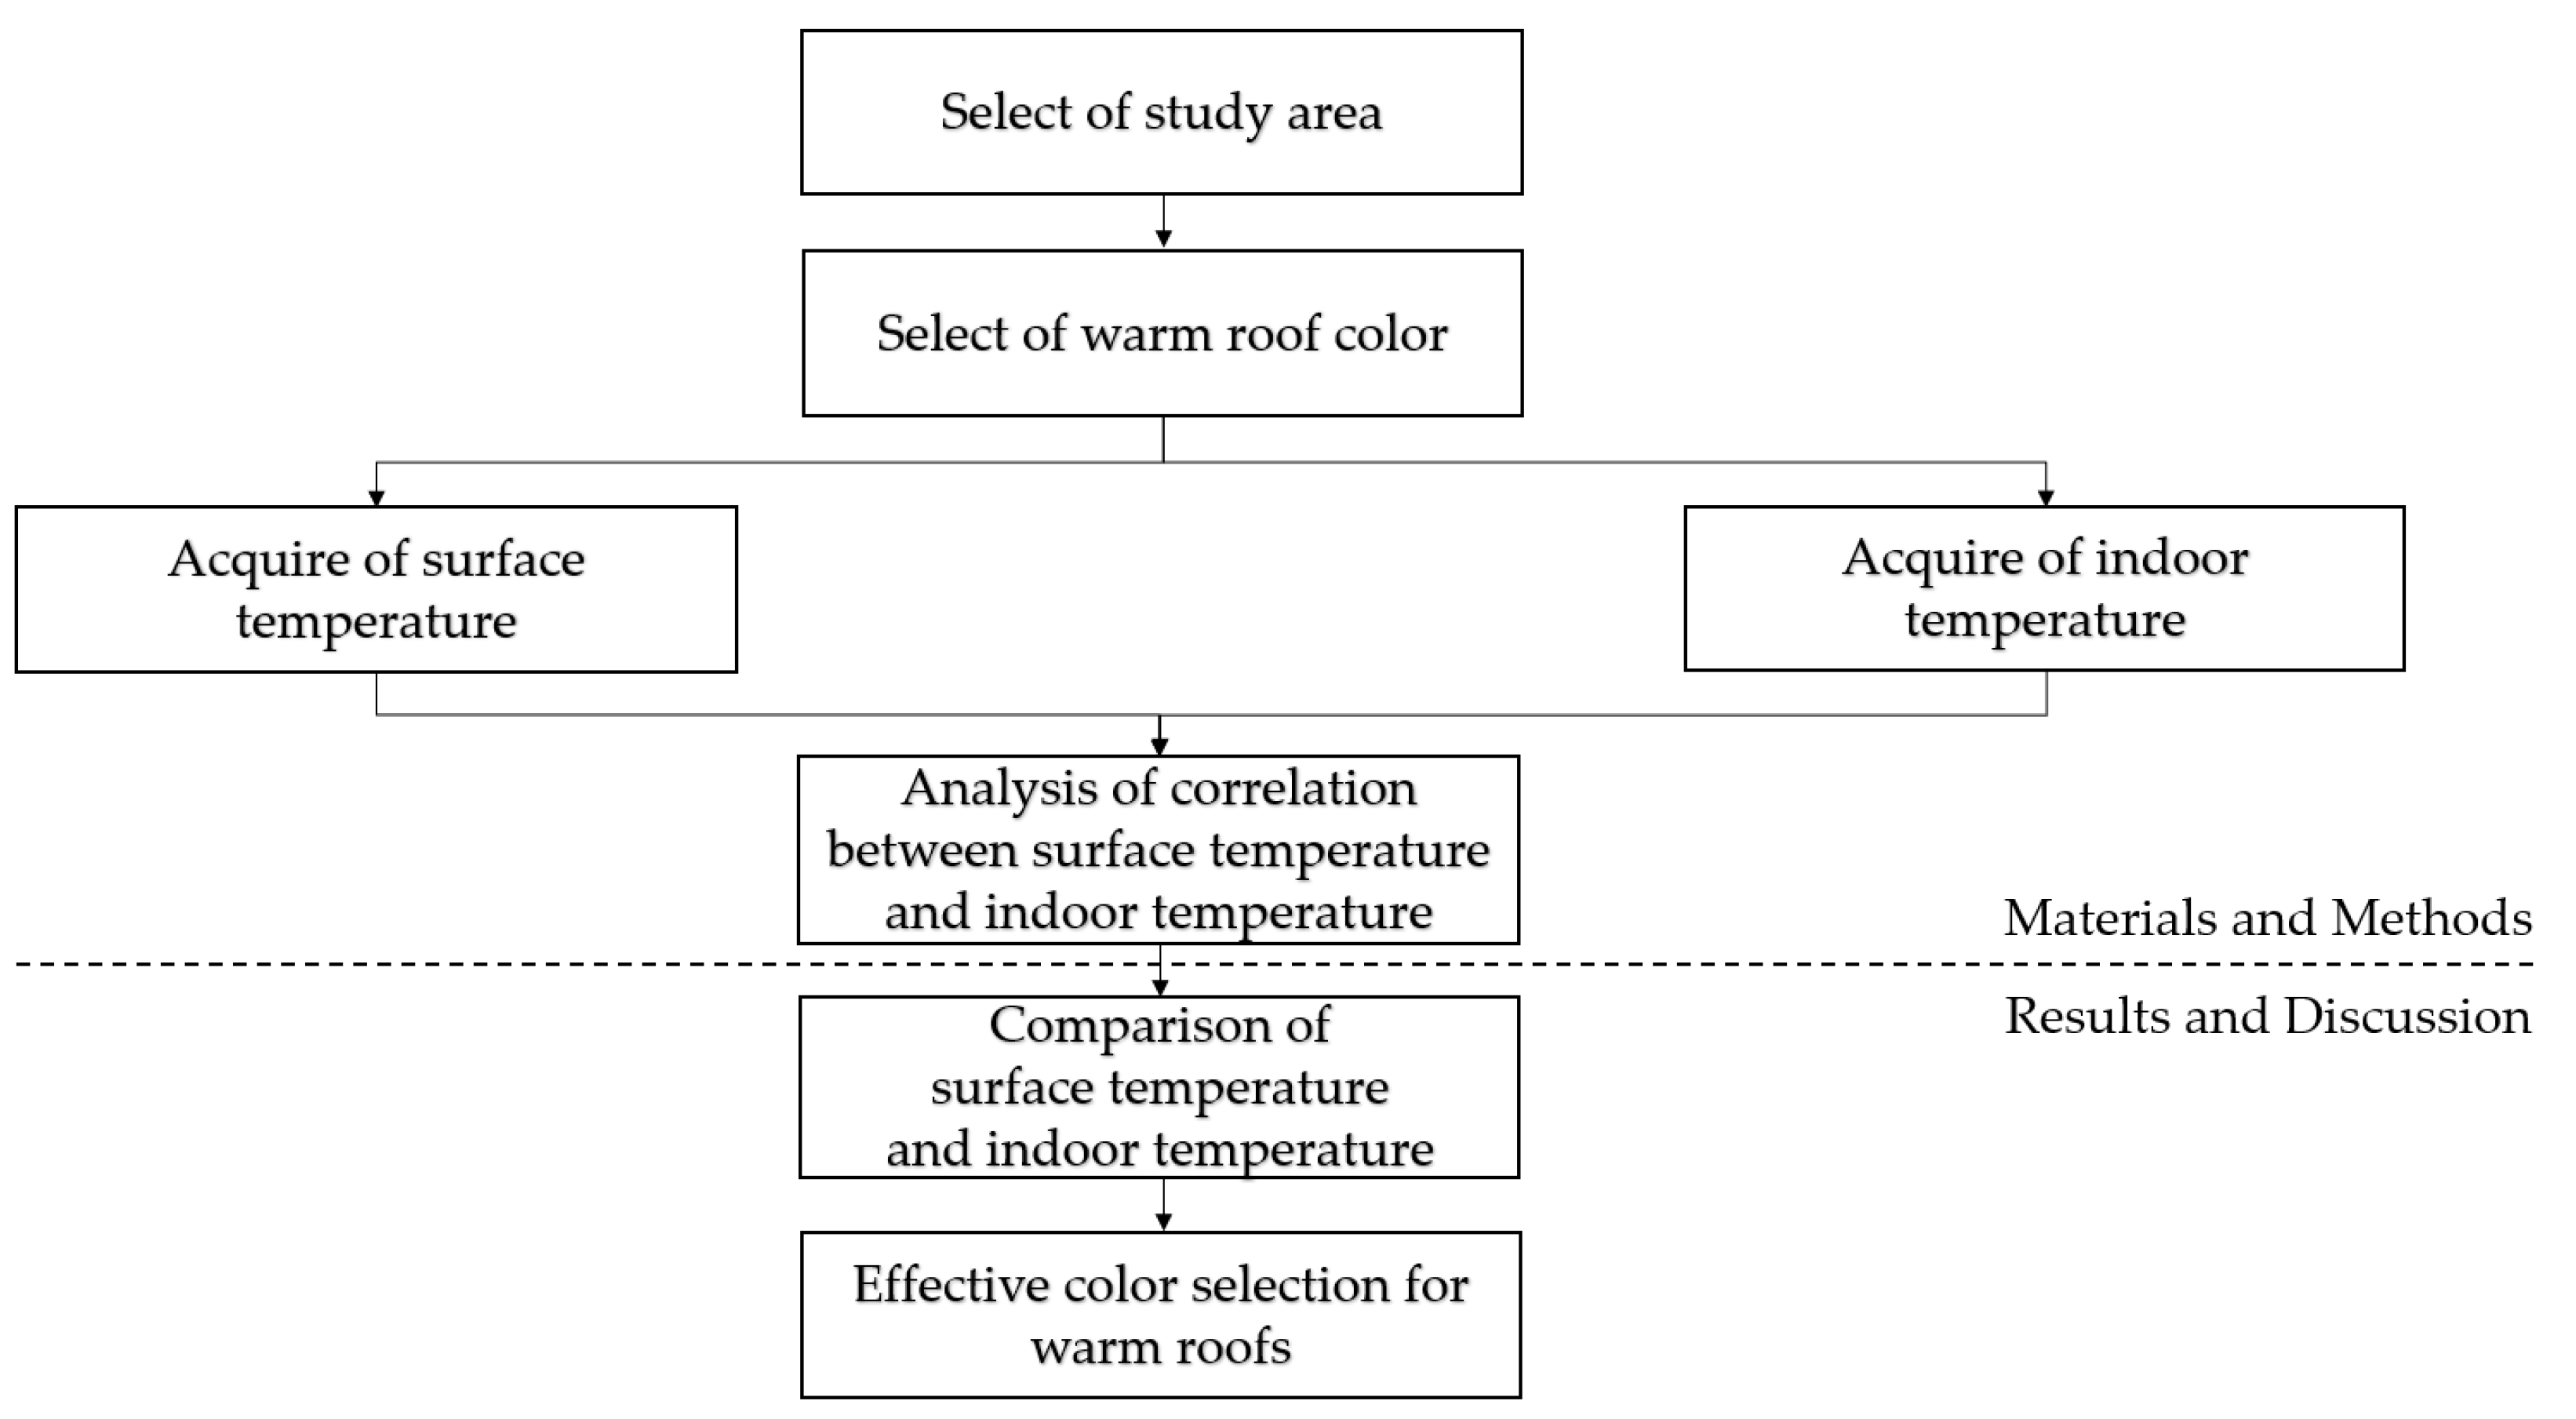
2. Materials and Methods

In Section 2, Materials and Methods, as shown in Figure 1, the selection of the research site, the selection of the warm roof color, the acquisition of surface temperature and indoor temperature data, and the analysis of the correlation between the surface temperature and the indoor temperature are performed.

2.1. Study Method and Equipment

In this study, the cool roof performance was evaluated according to the color through a remote sensing system using Inspire 1, a rotorcraft UAV manufactured by DJI (Shenzhen, Guangdong, China), and Zenmuse XT630, a TIR camera for drones from Flir (Wilsonville, Oregon, U.S, Table 1). The XT630 is an image-based system where the difference in infrared radiation emitted by an object is displayed as a temperature value [27]. The Zenmuse XT630 can be mounted with various lens models: 6.8 mm, 7.5 mm, 9 mm, 13 mm, and 19 mm. A 13-mm lens model was used in this study, with a 45° × 37° and field of view (FOV) of 1.308 mrad. In conjunction with the TIR camera, an uncooled VOx microbolometer sensor was used, which provided a resolution of 640 × 512 pixels. The sensor offered a 17-μm pixel pitch size, with a spectral band ranging from 7.5 to 13.5 μm. The scene range of a TIR camera consists of a range of −25 °C to 135 °C (High Gain) or −40 °C to 550 °C (Low Gain) [28]. Additionally, in the UAV, the angle may change due to vibrations, but in the Zenmuse XT630, the range of the vibration angle had a precision of ±0.03 °C, and the temperature accuracy also had a high accuracy of ±5% [29]. The Zenmuse XT630 showed a precise temperature; however, since it is necessary to evaluate the accuracy of the recorded temperature, the surface temperature was also obtained through a laser thermometer for 4 out of 16 weeks (Table 1).
The following colors were investigated for evaluating the cool roof performance: white, the most effective in the cool roof study; gray, similar to cement color; green, the existing roof color; blue, often used in factories; and black, which absorbs the most sunlight. A total of five colors were applied (Figure 2). The surface and indoor temperatures were measured using a UAV equipped with a TIR camera and a digital thermometer installed in each room (Table 1), respectively. For the digital thermometer, Xiaomi’s ultraprecision thermometer was used.

2.2. Study Area

The east building of the Kyungpook National University Sangju Campus, building 9, located in Sangju-si, Gyeongsangbuk-do (Figure 2), was designated as the study site. The building on the left of building 9 was designated, because the indoor area on the 4th floor was equally divided, as shown in Figure 3, so experiments could be conducted under the same conditions. Additionally, in the case of the study site building, there were few permanent personnel, and there were few factors affecting the surface temperature, because there were no other equipment on the rooftop except for the outdoor unit of the air conditioner and heater. The outdoor unit of the air conditioner and heater was far away from the rooftop surface to which the color was applied, so it did not affect the surface temperature. Building 9 was at the highest position among the 10 buildings on the Kyungpook National University Sangju Campus (only the laboratory and lecture building) and was the closest to the sun among the buildings, because there was a difference of about 20 m compared to the lowest building (based on the height of the surface land on which the building is built, not the height of the building). The exterior walls of the building were all covered with brown bricks, and the middle part of the building was made of all-glass windows, but the study site did not affect the temperature, because it was the building on the left with the all-glass windows. In the case of black color, it was applied, because it was considered to be effective for warm roofs, because it absorbs a lot of light. In the case of white, it was applied, because it was evaluated as the most effective color for cool roofs in many previous studies. Blue and green are mainly waterproof paints used in Korea, and gray was selected, because it was the color before applying colors such as waterproof paint at the initial stage of the building.

2.3. Data Acquisition

The surface temperature of each color of building 9 was acquired using Inspire 1, a UAV, Zenmuse XT630, a TIR camera dedicated to Flir’s UAV, and the DJI GO application that can take images and check the temperature. The data acquisition process is shown in Figure 4.
The image acquisition date (based on Korean standards) was measured for a total of 16 weeks from the third week after 7 November 2018 (the onset of winter, one of the 24 seasonal divisions) to the fifth week of February, before 6 March 2019, when winter ends (the day on which insects appear from their hideouts in the earth). During the measurements, photos were taken 2 to 3 days a week on a sunny day with little wind and clouds, considering the altitude interval of the sun from 10 o’clock to 16 hundred hours at 2-h intervals. The reason why the photo was taken using a UAV in the atmospheric state of a clear sky was to minimize the difference in solar heat intensity due to cloud cover. Wind and clouds are one of the factors that affect the temperature, but factors such as wind and clouds were excluded, because the effect on the indoor temperature was evaluated by measuring the surface temperature value according to the roof color. The data were acquired at a vertical angle (90°) from a height of about 50 m so that the surface temperature of each color could be seen at a glance (Figure 5). In the case of Inspire 1, hovering of the aircraft was very accurate when the GPS was connected. Even if the GPS connection was disconnected, the hovering accuracy was accurate vertically: 0.5 m and horizontally: 2.5 m through vision positioning, so it is possible to shoot stably at a vertical (90°) camera angle. The indoor temperature was acquired at the same time as the surface temperature.
TIR images acquired by UAVs were in 8-bit JPEG format and represented DN values, not temperatures. The TIR images consisted of a JPEG image with radiation data and metadata. EXIF contained the information needed to calculate the temperature with the addition of certain metadata values [30]. The temperature value can be checked only with the Flir tools and software provided by Flir in the single infrared image acquired. However, in this study, the surface temperature was obtained by converting the DN value into a temperature value through Matlab 2021a without using the commercial version of the software. First, to convert the DN value to a temperature value, a process for converting the 8-bit JPEG format into a 16-bit TIFF image was required. The conversion was carried out using exiftool software. The 8-bit JPEG image was converted into a 16-bit TIFF image using the rawthermalimage—b command and the metadata stored in the jpeg image obtained after executing exiftool in the cmd window [29].
H 2 O = H u m × E X P ( 1.5587 + 0.06939 × A i r T 0.00027816 × A i r T + 0.00000068455 × A i r T )
R a w r e f l = P l a n c k R 1 P l a n c k R 2 × ( E X P ( P l a n c k B A i r T   +   273.15 ) P l a n c k F ) P l a n c k O
3193 K = X × EXP   ( Dist × ( A l p h a   1 + B e t a   1 ) × H 2 O ) ) + ( 1 X ) × E X P ( Dist ) × ( ( A l p h a   2 + B e t a   2 ) × H 2 O )
R a w A t m o s r e f l = P l a n c k R 1 P l a n c k R 2 × ( E X P ( P l a n c k B A i r T   +   273.15 ) P l a n c k F ) P l a n c k O
R a w o b j e c t = D N ( ( 1 3193 K ) R a w A t m o s r e f l ) ( 1 E ) × R a w r e f l E 3193 K
T o b j e c t = P l a n c k B L N ( P l a n c k R 1 P l a n c k R 2   ×   ( R a w o b j e c t   +   P l a n c k O ) + P l a n c k F ) 273.15
Next was to convert the DN value into a temperature value using the converted TIFF file. This was accomplished using Equations (1)–(6), with different parameters depending on the TIR camera and the environment at the time of shooting [31]. The parameter information for the TIR camera requires PlanckR1, PlanckR2, PlanckB, PlanckF, PlanckO, Alpha1, Alpha2, Beta1, Beta2, and X [32]. These parameters are unique values stored for each sensor to calculate the attenuation by the atmosphere (Table 2). This information is stored as metadata in the TIR image at the time of the shooting. To acquire the metadata, ExifToolGUI software used to extract EXIF information was employed. Entering TIR images into the ExifToolGUI software allows viewing the overall parameter information for TIR images [33,34].
Where Dist is the distance to the target, RAT is the reflected apparent temperature (depending on the sky conditions and humidity), Hum is the humidity, AirT is the air temperature, and E is the emissivity. According to the shooting environment, the parameters Dist, RAT, Hum, AirT, and E for the shooting environment can be set by the user. The shooting environment refers to the external factors at the time of shooting using UAV and TIR cameras (height between UAV and target, external temperature, humidity, etc.). The emissivity of the surface is generally set to 0.95 or more in the absence of snow and water; hence, this value was adopted in this study [35,36]. In addition, to ascertain the accuracy of the TIR camera, the surface temperature was acquired with a laser thermometer for four weeks when recording the surface temperature (Table 3), with the emissivity of the laser thermometer set to 0.95. Table 3 shows the difference between the surface temperature of the TIR image and the laser thermometer to confirm the temperature accuracy of the TIR image. The same temperature accuracies (±5%) were obtained for the Zenmuse XT630 and the laser thermometer. Table 4 and Table 5 summarize the average weekly values for the TIR images surface temperatures acquired by UAV and the indoor temperatures obtained by a digital thermometer.
The Pearson correlation index was obtained to confirm the correlation between the surface temperature and the indoor temperature for each color at each time zone (Table 6).
The Pearson’s correlation was between −1 and +1. The closer the value to −1, the higher the negative correlation. The closer the value to +1, the higher the positive correlation. A value of 0 indicates the absence of a correlation.
In the positive correlation, 0.3 or more and less than 0.7 means a strong correlation, and 0.7 or more means a very strong correlation [37]. The correlation between the surface temperature and the indoor temperature showed a strong correlation by color for all time periods. It can be seen that the correlation of all colors was slightly lowered after 12 o’clock, which is thought to be because the sun’s light transmitted to the roof becomes weaker as the sun’s elevation angle decreases over time.

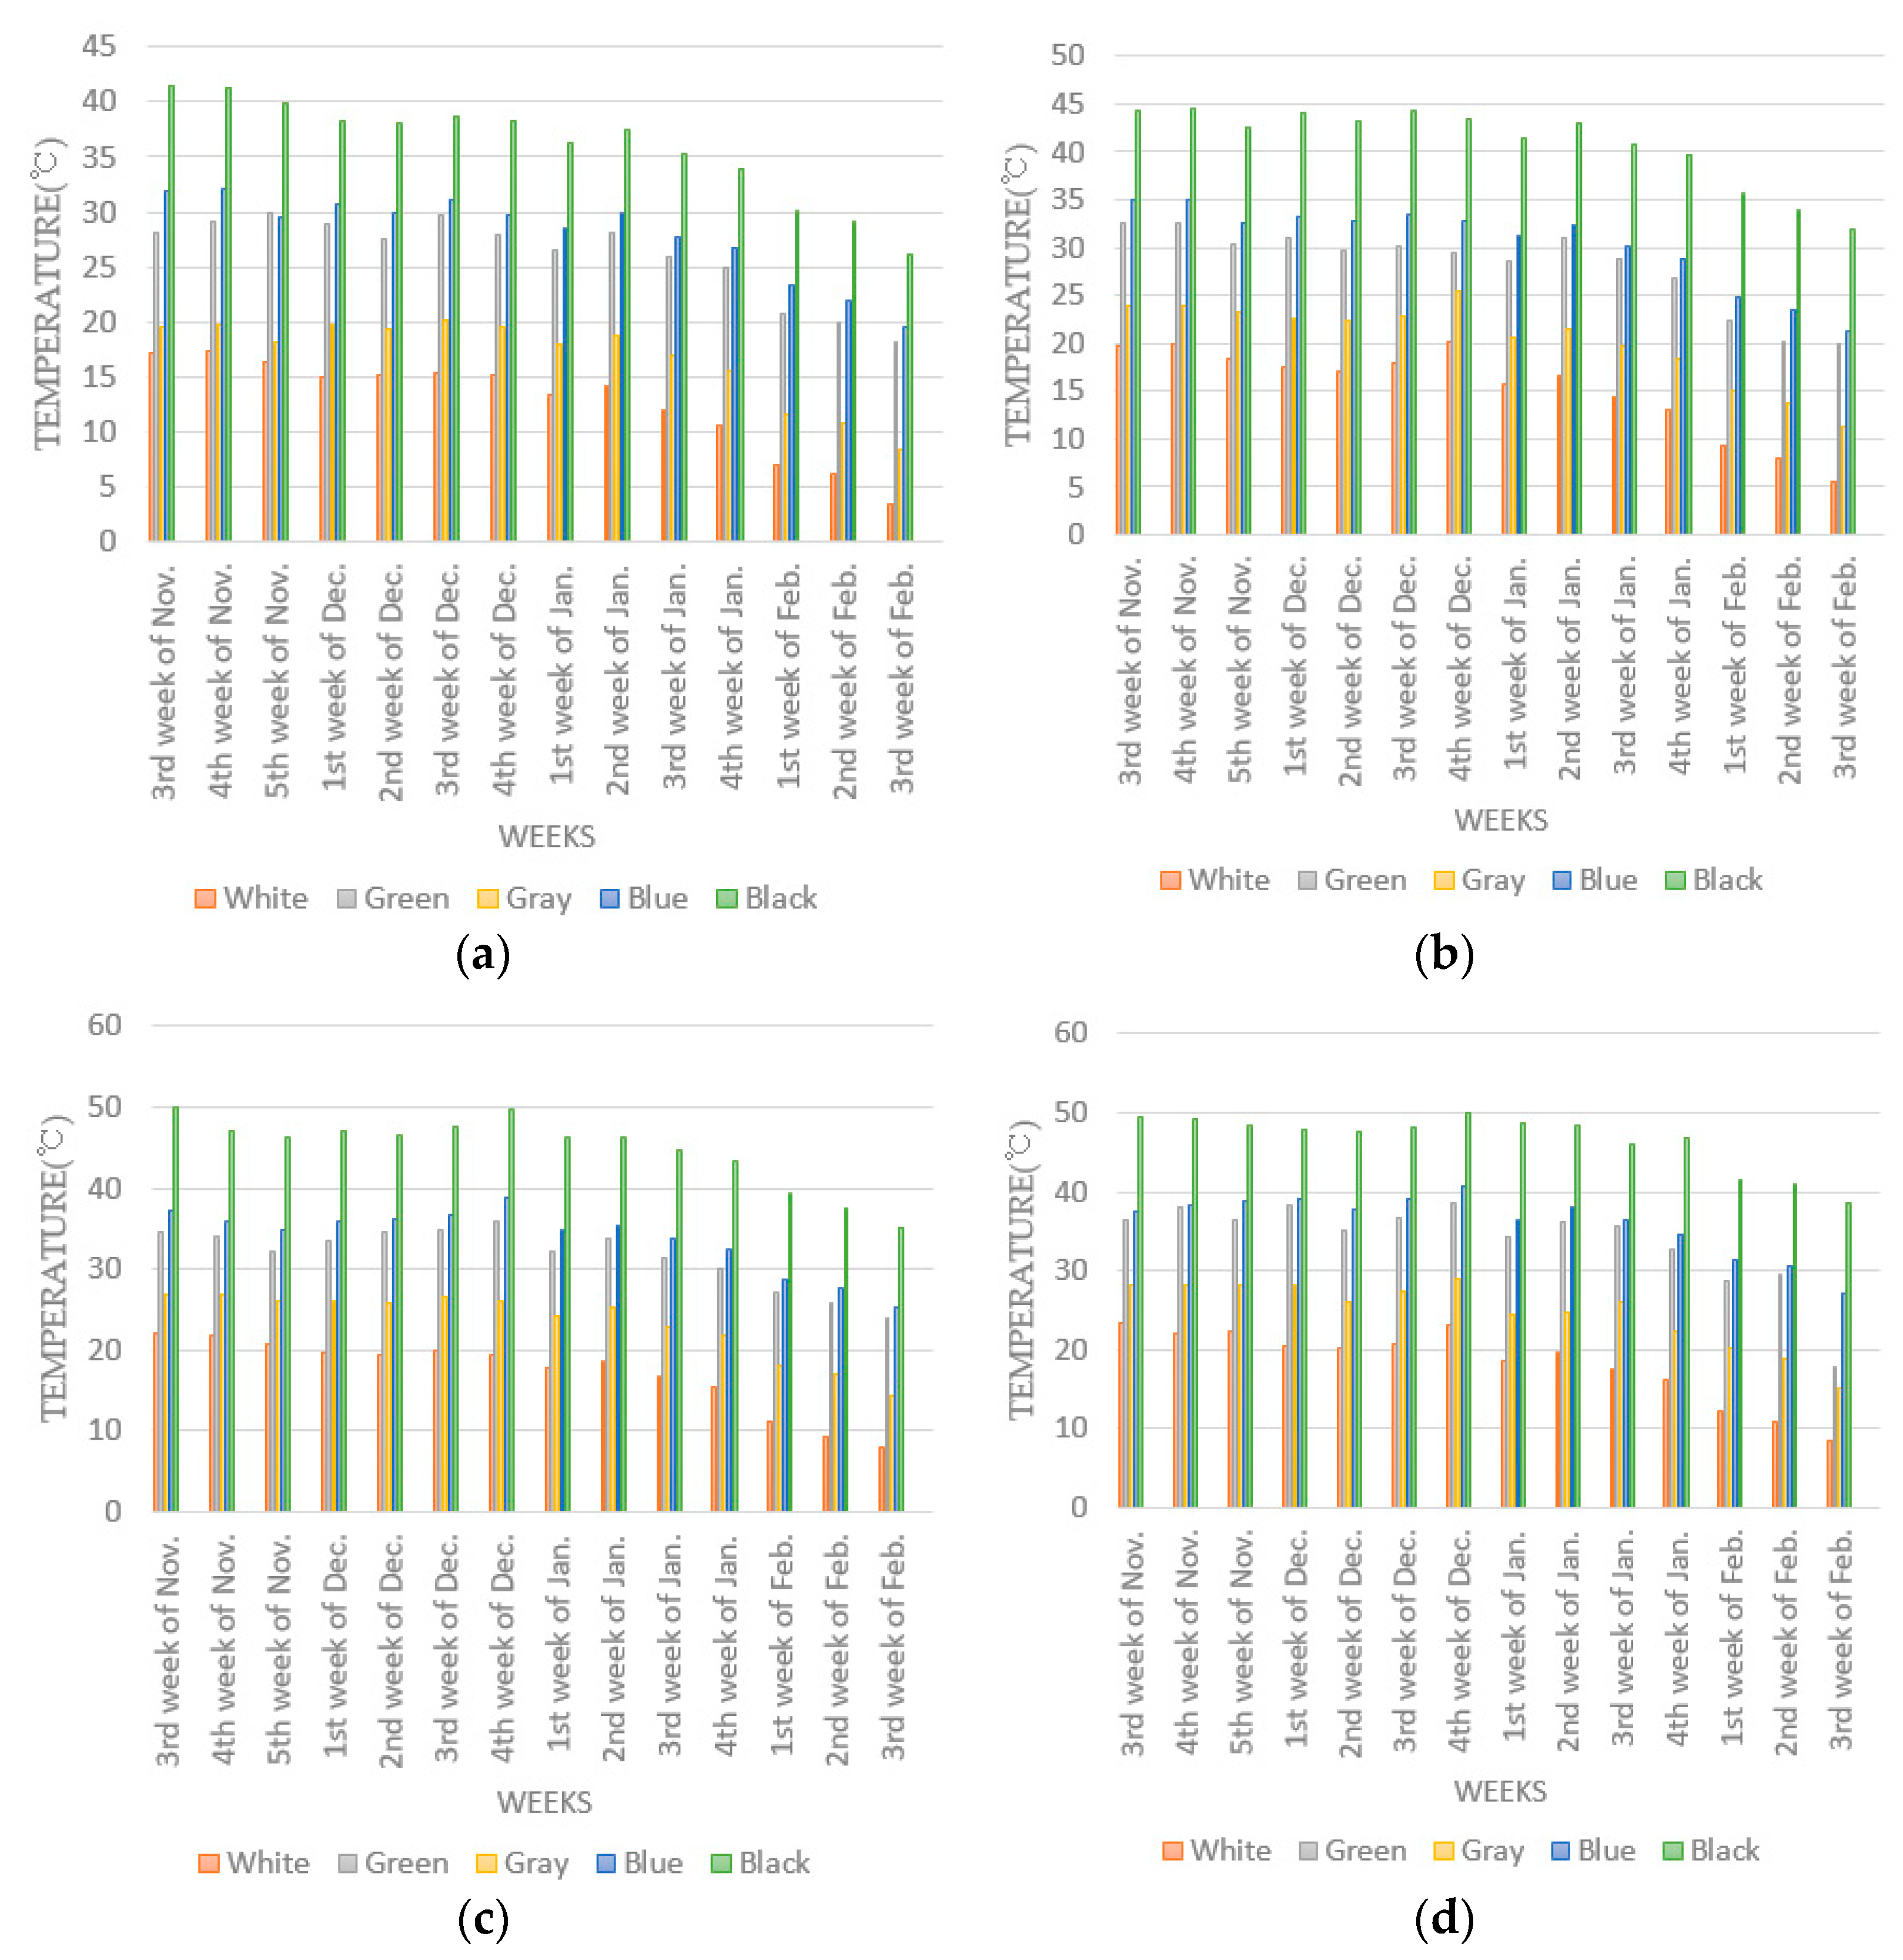
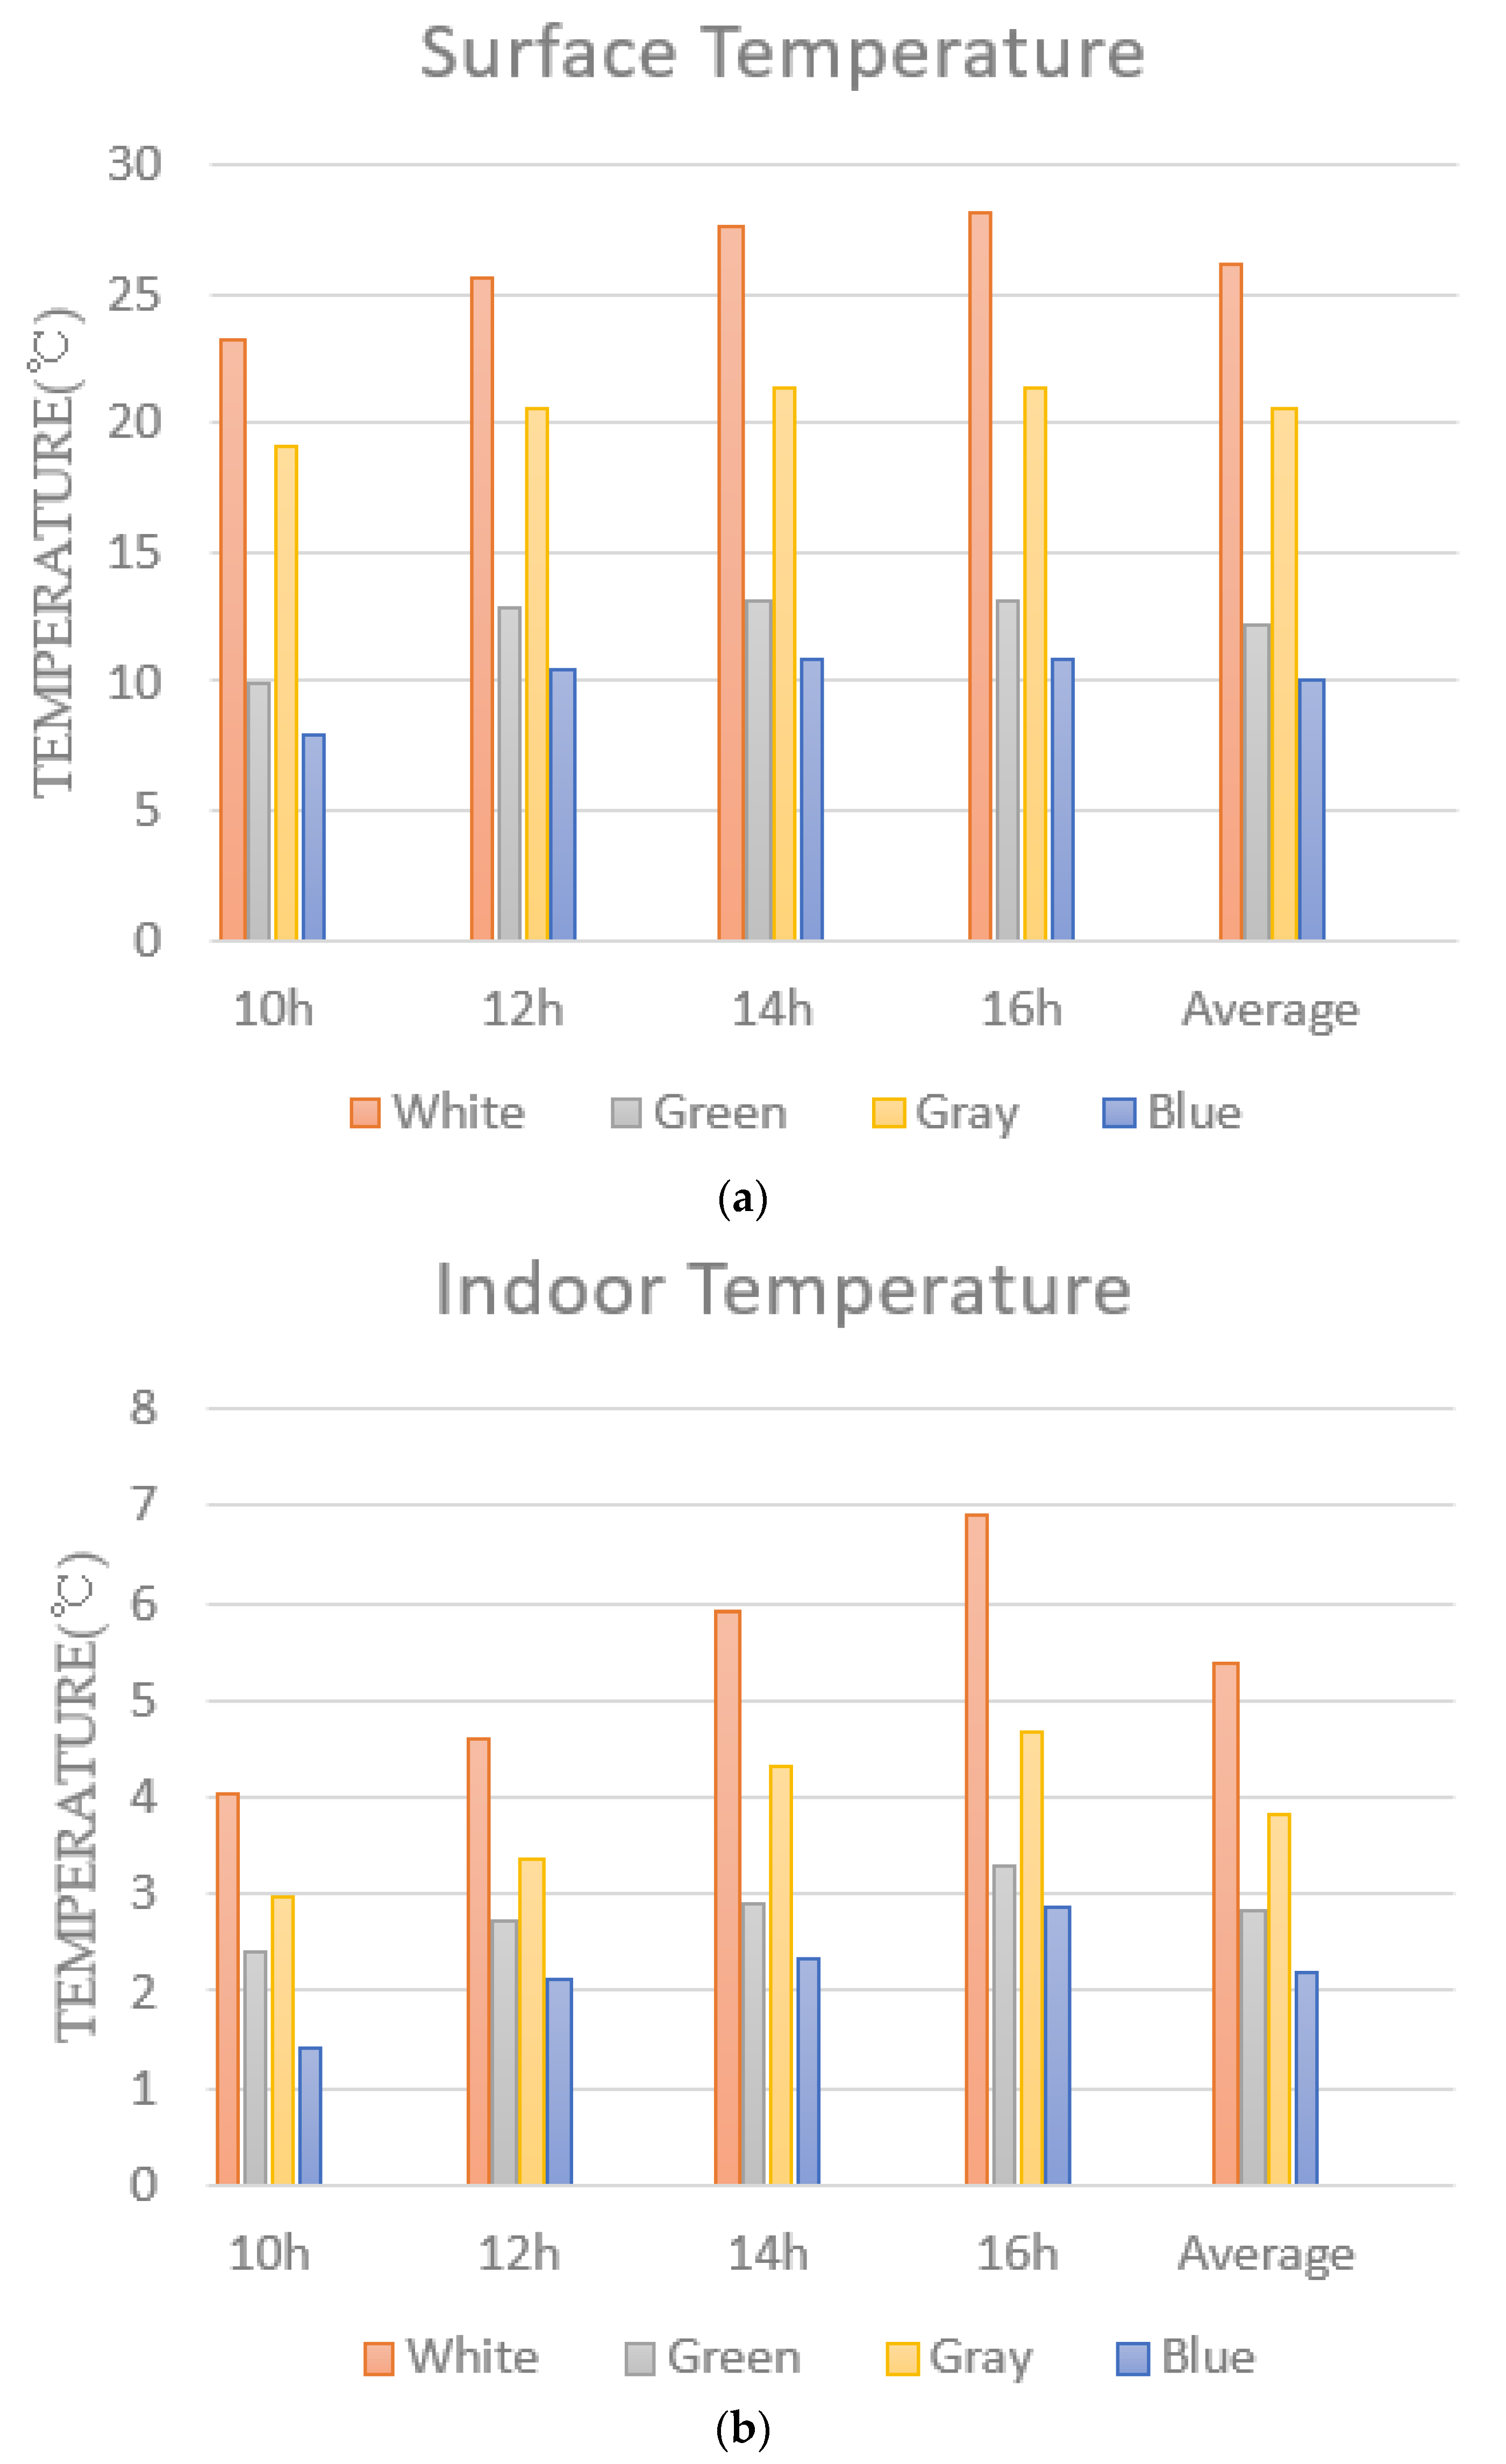
3. Results and Discussion

Section 3, Results and Discussion, compares the differences between the temperature values of the surface temperature and the indoor temperature obtained for each color. Through comparisons, a quantitative analysis was performed on the differences in temperature for each color, and an effective color was selected for a warm roof (Figure 1).
In this study, the overall average surface and indoor temperatures for each color and the overall average surface and indoor temperatures for each color and period were ob-tained in 4 months (16 weeks). Figure 6 and Figure 7 show weekly graphs for the surface temperatures and indoor temperatures. Before comparing the surface temperature and the indoor temperature between the colored roofs, it is necessary to verify whether the average difference between them is significant. Before comparing the surface temperature and the indoor temperature between the colored roofs, it is necessary to verify whether the average difference between them is significant. An analysis of variance (ANOVA) was used for validation. ANOVA is based on the law of overall variance, where the observed variance for a given variable is split into components attributable to different sources of variation. ANOVA in its simplest form provides a statistical test for whether two or more population means are equal, so we generalize the t-test to more than two means. In the ANOVA, if the p-value is less than 0.05, it can be considered that there is a significant difference [38].
Table 7 and Table 8 are tables showing the significant results between the surface temperature of the colored roof and the indoor temperature through ANOVA. When looking at the p-values of the surface temperature and the indoor temperature, values smaller than 0.05 can be confirmed. Through this, it can be seen that there is a statistically significant difference between the surface temperature and the indoor temperature between colored roofs.
The average surface temperatures for each colored roof were: 15.85 °C for white, 29.94 °C for green, 21.35 °C for gray, 32.12 °C for blue, and 42.04 °C for black. The average indoor temperature was 6.71 °C for white, 9.25 °C for green, 8.24 °C for gray, 9.90 °C for blue, and 12.08 °C for black. In all the dates and time zones, the black-colored roof was observed to have the highest temperature, and the white-colored roof was observed to have the lowest temperature. As in previous studies, depending on the roof color and its closeness to white, the lower the temperature, and the closer it is to black, the higher the temperature [14]. Light gray was used to express the color of cement in the early stages of construction and showed a tendency toward low temperatures similar to white. In blue and green-colored roofs, a high temperature was recorded, identical to the black-colored roof. If a good maintenance culture is not observed after construction, the color may change to dark gray or black, approaching the black-colored roof temperature value. Conversely, as the color fades over time, blue and green colors may change to white-like colors. In Figure 8, the differences between the black-colored roof temperatures and the others, which were observed to be effective on the warm roof instead of the existing cool roof, were compared. An ANOVA test was also conducted on the temperature differences, and as a result, the p-values of the surface and indoor temperatures were 1.66 × 10⁻⁸ and 9.25 × 10⁻⁴. It can be seen that there is also a statistically significant difference in the temperature differences between the black-colored roof and other colored roofs. The black-colored roof, which was hypothesized to be the most effective in the warm roof phenomenon, was found to have the highest surface and indoor temperatures. For the surface temperature, the black-colored roof appeared to be 8–28 °C higher than other colors, and for the indoor temperature, it was about 1–7 °C higher. Comparing the surface temperatures, the difference between the white-colored roof, reported to be effective in the existing cool roof phenomenon, and the black-colored roof, observed in this study to be effective in the warm roof phenomenon, was 28.2 °C. The differences between the green and blue-colored roofs, which are often used as the existing roof colors, were 13.1 °C and 10.9 °C. On average, the temperature differences are in the order of white > gray > green > blue (Figure 8a). In the indoor temperature comparison, the highest difference was observed between the white- and black-colored roofs, similar to the surface temperatures. The differences between green and blue, often used as the existing roof colors, were 2.8 °C and 2.2 °C. As for the indoor temperature, on average, the temperature differences were observed in the order of white > gray > green > blue, just like the surface temperatures (Figure 8b).

4. Conclusions

In this study, a warm roof was evaluated by remote sensing using a TIR camera mounted on a UAV. There are various methods for reducing heat loss, but these methods are costly and time-consuming and are difficult to apply to existing buildings and various buildings. It can be one of the more eco-friendly methods by using a warm roof and using color to prevent heat loss and absorb natural sunlight. It is considered to be the cheapest and most efficient method to increase the efficiency of building energy through the warm roof evaluation using UAVs conducted in this study. In general, white is known as a color that reflects a lot of light, and black is a color that absorbs a lot of light. The reason why white was applied in the cool roof evaluation was because we knew that white reflects a lot of light. As a result of the evaluation in the previous study, it was confirmed that the surface temperature was lower than that of other colors, and as the surface temperature decreased, the indoor temperature also decreased.
In previous studies, there has been no study to evaluate the color of warm roof roofs to meet the heating load in the winter and the alleviation of the urban heat island phenomenon in cold areas using the black properties that absorb a lot of light. In this study, since we know that black absorbs a lot of light, we applied a remote sensing technique using a UAV and TIR camera to a real building, not a model building, by applying a color different from black. For the warm roof evaluation, the accuracy of the TIR camera was verified by comparing it with a laser thermometer, and the correlation between the surface temperature and the indoor temperature was also confirmed using Pearson’s correlation. As a result, in comparing a black-colored roof to other colored roofs, surface temperature differences from 8 °C to 28 °C were observed, and for indoor temperatures, differences of about 1–7 °C were obtained. Comparing the average surface and indoor temperatures for each colored roof and period, the relative differences between the black-colored roof and the others were seen in the order of white > gray > green > blue. The white-colored roof, which has been effective in existing cool roofs, showed the lowest surface and indoor temperatures, because it reflects a lot of light. On the other hand, the black-colored roof, which absorbs a lot of light, showed the highest surface and indoor temperatures. In addition, the closer the roof colors are to black, the higher their surface and indoor temperatures, and the closer they are to white, the lower their surface and indoor temperatures. As a result, it was confirmed that the black color absorbs more light than other colors, and thus, the surface temperature is high, and it is confirmed that the indoor temperature increases as the surface temperature increases.
Since heating costs and carbon dioxide can be reduced for every 1 °C increase in the in-door temperature [39], it is recommended to consider black-colored roofs in cold regions. In addition, it is thought that the urban heat island phenomenon can be reduced by lowering the heating load by absorbing solar energy by applying a black roof color to lower the heating load, which is the cause of the urban heat island phenomenon. In the past, it was necessary to measure the surface temperature directly with a laser thermometer, but in our study, it was confirmed that the warm roof evaluation could be easily performed using a UAV and a TIR camera. We believe that the results of this study will be helpful in heating load research.
In this study, the surface temperature and indoor temperature were acquired using a UAV, a TIR camera for a UAV, and an indoor thermometer. A warm roof evaluation was performed by comparing the correlation and temperature values of the acquired surface temperature and indoor temperature. This study gave us an idea of which colors would work best for a warm roof and what the temperature values for each color would be.
Based on the results of this study, in future research, the evaluation of warm roofs will be conducted through multiple regression analyses and temperature comparisons, considering the material, thickness, and shape of the roofs. In addition, it is necessary to quantitatively predict the effect of reducing the heating energy consumption due to the application of a warm roof and to analyze whether an increase in solar radiation flowing into a building affects the heating energy consumption. Through this analysis, it is thought that it will be possible to provide objective evidence for judging whether a warm roof should be applied.

Author Contributions

Conceptualization, W.L. and K.L.; software K.L. and S.J.; formal analysis, J.P.; writing—original draft preparation, K.L.; and writing—review and editing W.L. All authors have read and agreed to the published version of the manuscript.

Funding

This research was supported by the Basic Science Research Program through the National Research Foundation of Korea (NRF) funded by the Ministry of Education (NRF-2020R1I1A3061750), The Basic Science Research Program through the National Research Foundation of Korea (NRF) funded by the Ministry of Education (NRF-2019H1A2A1074119), and the National Research Foundation of Korea (NRF) grant funded by the Korea government (MSIT) (No. NRF-2021R1A5A8033165).

Institutional Review Board Statement

Not applicable.

Informed Consent Statement

Not applicable.

Data Availability Statement

Data sharing not applicable.

Acknowledgments

The authors wish to acknowledge Research Institute of Artificial Intelligent Diagnosis Technology for Multi-scale Organic and Inorganic Structure, Kyungpook National University, Sangju, South Korea for providing the laboratory facilities.

Conflicts of Interest

The authors declare no conflict of interest.

References

  1. Krawczyk, J.M.; Mazur, A.M.; Sasin, T.; Stokłosa, A.W. Infrared Building Inspection with Unmanned Aerial Vehicles. Pr. Inst. Lotnictwa 2015, 3, 32–48. [Google Scholar] [CrossRef]
  2. Bui, D.; Nguyen, T.N.; Ngo, T.D.; Nguyen-Xuan, H. An Artificial Neural Network (ANN) Expert System Enhanced with the Electromagnetism-Based Firefly Algorithm (EFA) for Predicting the Energy Consumption in Buildings. Energy 2020, 190, 116370. [Google Scholar] [CrossRef]
  3. Somu, N.; MR, G.R.; Ramamritham, K. A Deep Learning Framework for Building Energy Consumption Forecast. Renew. Sustain. Energy Rev. 2021, 137, 110591. [Google Scholar] [CrossRef]
  4. Global Status Report for Buildings and Construction. 2019. Available online: https://www.gbpn.org/china/newsroom/2019-global-status-report-buildings-and-construction (accessed on 15 August 2020).
  5. Wang, D.; Meng, J.; Zhang, T. Evaluating the Thermal Performance Index for Future Architectures in China’s Hot Summer and Cool Winter Regions. Sustain. Energy Technol. Assess. 2021, 46, 101241. [Google Scholar]
  6. Mohajerani, A.; Bakaric, J.; Jeffrey-Bailey, T. The Urban Heat Island Effect, its Causes, and Mitigation, with Reference to the Thermal Properties of Asphalt Concrete. J. Environ. Manag. 2017, 197, 522–538. [Google Scholar] [CrossRef]
  7. Shafiee, E.; Faizi, M.; Yazdanfar, S.; Khanmohammadi, M. Assessment of the Effect of Living Wall Systems on the Improvement of the Urban Heat Island Phenomenon. Build. Environ. 2020, 181, 106923. [Google Scholar] [CrossRef]
  8. Jiang, H.; Yao, R.; Han, S.; Du, C.; Yu, W.; Chen, S.; Li, B.; Yu, H.; Li, N.; Peng, J. How do urban residents use energy for winter heating at home? A large-scale survey in the hot summer and cold winter climate zone in the Yangtze River region. Energy Build. 2020, 223, 110131. [Google Scholar] [CrossRef]
  9. Sisco, L.; Monzer, S.; Farajalla, N.; Bashour, I.; Saoud, I.P. Roof top gardens as a means to use recycled waste and A/C condensate and reduce temperature variation in buildings. Build. Environ. 2017, 117, 127–134. [Google Scholar] [CrossRef]
  10. Sholahudin, S.; Han, H. Simplified dynamic neural network model to predict heating load of a building using Taguchi method. Energy 2016, 115, 1672–1678. [Google Scholar] [CrossRef]
  11. Chatterjee, S.; Khan, A.; Dinda, A.; Mithun, S.; Khatun, R.; Akbari, H.; Kusaka, H.; Mitra, C.; Bhatti, S.S.; Van Doan, Q.V.; et al. Simulating micro-scale thermal interactions in different building environments for mitigating urban heat islands. Sci. Total Environ. 2019, 663, 610–631. [Google Scholar] [CrossRef]
  12. He, Y.; Yu, H.; Ozaki, A.; Dong, N. Thermal and energy performance of green roof and cool roof: A comparison study in Shanghai area. J. Clean. Prod. 2020, 267, 122205. [Google Scholar] [CrossRef]
  13. Shittu, E.; Stojceska, V.; Gratton, P.; Kolokotroni, M. Environmental impact of cool roof paint: Case-study of house retrofit in two hot islands. Energy Build. 2020, 217, 110007. [Google Scholar] [CrossRef]
  14. Lee, K.R.; Seong, J.H.; Han, Y.K.; Lee, W.H. Comparison of rooftop surface temperature and indoor temperature for the evaluation of cool roof performance according to the rooftop colors in summer: Using thermal infrared camera mounted on UAV. J. Korean Soc. Surv. Geod. Photogramm. Cartogr. 2019, 37, 9–18. [Google Scholar]
  15. Lee, K.; Seong, J.; Han, Y.; Lee, W.H. Evaluation of applicability of various color space techniques of UAV images for evaluating cool roof performance. Energies 2020, 13, 4213. [Google Scholar] [CrossRef]
  16. Varentsov, M.; Konstantinov, P.; Baklanov, A.; Esau, I.; Miles, V.; Davy, R. Anthropogenic and Natural Drivers of a Strong Winter Urban Heat Island in a Typical Arctic City. Atmos. Chem. Phys. 2018, 18, 17573–17587. [Google Scholar] [CrossRef] [Green Version]
  17. Vihola, J.; Sorri, J.; Heljo, J.; Kero, P. Heat Loss Rate of the Finnish Building Stock. Procedia Econ. Financ. 2015, 21, 601–608. [Google Scholar] [CrossRef] [Green Version]
  18. Gorshkov, A.; Vatin, N.; Nemova, D.; Shabaldin, A.; Melnikova, L.; Kirill, P. Using life-cycle analysis to assess energy savings delivered by building insulation. Procedia Eng. 2015, 117, 1080–1089. [Google Scholar] [CrossRef] [Green Version]
  19. Al-Homoud, M.S. Performance characteristics and practical applications of common building thermal insulation materials. Build. Environ. 2005, 40, 353–366. [Google Scholar] [CrossRef]
  20. Modi, P.; Bushehri, R.; Georgantopoulou, C.; Mavromatidis, L. Design and development of a mini scale hot box for thermal efficiency evaluation of an insulation building block prototype used in Bahrain. Adv. Build. Energy Res. 2017, 11, 130–151. [Google Scholar] [CrossRef]
  21. Beemkumar, N.; Yuvarajan, D.; Arulprakasajothi, M.; Elangovan, K.; Arunkumar, T. Control of room temperature fluctuations in the building by incorporating PCM in the roof. J. Therm. Anal. Calorim. 2021, 143, 3039–3046. [Google Scholar] [CrossRef]
  22. Asadi, S.; Hassan, M.M.; Beheshti, A. Performance evaluation of an attic radiant barrier system using three-dimensional transient finite element method. J. Build. Phys. 2013, 36, 247–264. [Google Scholar] [CrossRef]
  23. Ryu, T.H.; Um, J. Comparative evaluation of surface temperature among rooftop colors of flat roof building models: Towards performance evaluation of cool roof. KIEAE J. 2013, 13, 83–91. [Google Scholar]
  24. Rosati, A.; Fedel, M.; Rossi, S. NIR reflective pigments for cool roof applications: A comprehensive review. J. Clean. Prod. 2021, 313, 127826. [Google Scholar] [CrossRef]
  25. Hoegner, L.; Stilla, U. Mobile thermal mapping for matching of infrared images with 3D building models and 3D point clouds. Quant. Infrared Thermogr. J. 2018, 15, 1–19. [Google Scholar] [CrossRef]
  26. James, M.R.; Robson, S. Mitigating systematic error in topographic models derived from UAV and ground-based image networks. Earth Surf. Process. Landf. 2014, 39, 1413–1420. [Google Scholar] [CrossRef] [Green Version]
  27. Zefri, Y.; ElKettani, A.; Sebari, I.; Lamallam, S.A. Thermal infrared and visual inspection of photovoltaic installations by UAV photogrammetry—Application case: Morocco. Drones 2018, 2, 41. [Google Scholar] [CrossRef] [Green Version]
  28. Alfaro-Mejía, E.; Loaiza-Correa, H.; Franco-Mejía, E.; Restrepo-Girón, A.D.; Nope-Rodríguez, S.E. Dataset for recognition of snail trails and hot spot failures in monocrystalline Si solar panels. Data Brief 2019, 26, 104441. [Google Scholar] [CrossRef]
  29. Park, J.H.; Lee, K.R.; Lee, W.H.; Han, Y.K. Generation of land surface temperature orthophoto and temperature accuracy analysis by land covers based on thermal infrared sensor mounted on unmanned aerial vehicle. J. Korean Soc. Surv. Geod. Photogramm. Cartogr. 2018, 36, 263–270. [Google Scholar]
  30. Misopolinos, L.; Zalidis, C.H.; Liakopoulos, V.; Stavridou, D.; Katsigiannis, P.; Alexandridis, T.K.; Zalidis, G. Development of a UAV system for VNIR-TIR acquisitions in precision agriculture. In Proceedings of the Third International Conference on Remote Sensing and Geoinformation of the Environment (RSCy2015), Paphos, Cyprus, 19 June 2015; Volume 9535, p. 95351H. [Google Scholar]
  31. Di Felice, F.; Mazzini, A.; Di Stefano, G.; Romeo, G. Drone high resolution infrared imaging of the Lusi mud eruption. Mar. Pet. Geol. 2018, 90, 38–51. [Google Scholar] [CrossRef]
  32. Aubrecht, D.M.; Helliker, B.R.; Goulden, M.L.; Roberts, D.A.; Still, C.J.; Richardson, A.D. Continuous, long-term, high-frequency thermal imaging of vegetation: Uncertainties and recommended best practices. Agric. For. Meteorol. 2016, 228, 315–326. [Google Scholar] [CrossRef] [Green Version]
  33. Fernández, A.; Usamentiaga, R.; de Arquer, P.; Fernández, M.Á.; Fernández, D.; Carús, J.L.; Fernández, M. Robust detection, classification and localization of defects in large photovoltaic plants based on unmanned aerial vehicles and infrared thermography. Appl. Sci. 2020, 10, 5948. [Google Scholar] [CrossRef]
  34. Kao, D.; Chen, M.; Wu, W.; Lin, J.; Chen, C.; Tsai, F. Drone forensic investigation: DJI spark drone as a case study. Procedia Comput. Sci. 2019, 159, 1890–1899. [Google Scholar] [CrossRef]
  35. Karbou, F.; Prigent, C. Calculation of microwave land surface emissivity from satellite observations: Validity of the specular approximation over snow-free surfaces? IEEE Geosci. Remote Sens. Lett. 2005, 2, 311–314. [Google Scholar] [CrossRef]
  36. Prigent, C.; Rossow, W.B.; Matthews, E. Microwave land surface emissivities estimated from SSM/I observations. J. Geophys. Res. Atmos. 1997, 102, 21867–21890. [Google Scholar] [CrossRef]
  37. Jung, J.; Park, S.; Lee, Y.; Gim, J. The Development of Infrared Thermal Imaging Safety Diagnosis System using Pearson’s Correlation Coefficient. J. Korean Sol. Energy Soc. 2019, 39, 55–65. [Google Scholar] [CrossRef]
  38. St, L.; Wold, S. Analysis of variance (ANOVA). Chemom. Intellig. Lab. Syst. 1989, 6, 259–272. [Google Scholar]
  39. Radhi, H. Evaluating the potential impact of global warming on the UAE residential buildings–A contribution to reduce the CO2 emissions. Build. Environ. 2009, 44, 2451–2462. [Google Scholar] [CrossRef]
Figure 1. Research flow chart.
Energies 14 06488 g001
Figure 2. Study area. The red border represents the color for the warm roof performance evaluation. The five colors are presented as capital letters: A: black, B: blue, C: gray, D: green, and E: white.
Energies 14 06488 g002
Figure 3. Floor plan of the study site (Photos courtesy of the KNU Facility Space Comprehensive Management System, which is available at http://ufis.knu.ac.kr (accessed on 10 July 2021)).
Energies 14 06488 g003
Figure 4. Surface temperature and indoor temperature data acquisition process.
Energies 14 06488 g004
Figure 5. Some of the acquired TIR images: (a) 10 h, (b) 12 h, (c) 14 h, and (d) 16 h.
Energies 14 06488 g005
Figure 6. Weekly rooftop surface average temperatures acquired by a UAV-mounted TIR camera at different times (The vertical axis is the temperature (°C), and the horizontal axis is the weeks.): (a) 10 h, (b) 12 h, (c) 14 h, and (d) 16 h.
Energies 14 06488 g006
Figure 7. Weekly indoor average temperature acquired by a UAV-mounted TIR camera at different times (The vertical axis is the temperature (°C), and the horizontal axis is the weeks.): (a) 10 h, (b) 12 h, (c) 14 h, and (d) 16 h.
Energies 14 06488 g007
Figure 8. Overall average surface and indoor temperatures by colors (°C): (a) surface temperature and (b) indoor temperature.
Energies 14 06488 g008
Table 1. UAV, TIR camera, laser thermometer, and digital thermometer specifications.
UAVTIR CameraLaser ThermometerDigital Thermometer
Inspire 1Zenmuse XT630DT-8868HXiaomi
Weight2935 gResolution640 × 512Temperature range−50 °C~1650 °C
(−58 °F–3002 °F)
Temperature
display unit
0.1 °C
Flight altitudeMax: 4500 mPixel size17 μmTemperature accuracy±1.0% of readingTemperature
accuracy
±0.3 °C
Flight timeMax: 18 minFOV45° × 37°
SpeedMax: 22 m/sFocal length13 mm
Maximum wind
resistance
10 m/sScene range−25 °C~+135 °C
(High gain)
−40 °C~+550 °C
(Low gain)
Table 2. Each parameter included in Equations (1)–(6).
ParameterValue
TIR SensorPlanckR117,096.453
PlanckR20.046642166
PlanckB1428
PlanckF1
PlanckO−342
Alpha 10.006569
Alpha 20.012620
Beta 1−0.002276
Beta 2−0.006670
X1.9
EnvironmentDist50 m
RAT22 °C
Hum50%
AirT22 °C
E0.95
Table 3. Comparison between measured temperatures using a laser thermometer and a UAV-mounted TIR sensor (°C).
WhiteGreenGrayBlueBlack
TIR camera19.4626.5824.3535.0544.37
Laser thermometer19.3526.8124.1834.9544.56
Temperature difference0.11−0.230.170.10−0.19
Table 4. Weekly rooftop surface average temperatures at different times (°C).
TimeColor3rd Week of Nov.4th Week of Nov.5th Week of Nov.1st Week of Dec.2nd Week of Dec.3rd Week of Dec.4th Week of Dec.1st Week of Jan.2nd Week of Jan.3rd Week of Jan.4th Week of Jan.1st Week of Feb.2nd Week of Feb.3rd Week of Feb.
10 hWhite17.1017.4016.3515.0515.1515.3515.2513.3514.1511.9510.657.006.153.40
Green28.2029.1529.8528.8527.5529.6527.8526.4528.1525.8524.9520.7519.8518.15
Gray19.5019.7518.1519.7519.4020.1519.5018.0018.6516.8515.5011.6010.758.35
Blue31.9032.1029.5530.7529.9531.1529.7028.5529.8527.7026.7523.2521.9519.55
Black41.4541.3039.8038.2538.1038.6538.2036.3037.4535.2533.9530.1029.1026.20
12 hWhite19.8019.8518.3517.5017.1517.9020.1515.7516.6014.4013.109.308.055.60
Green32.6532.5530.4030.9529.7530.1529.4528.5530.9528.8526.8022.4520.2519.85
Gray23.9523.9523.3022.5522.4522.8525.4520.6521.5519.7518.4015.0013.8011.30
Blue35.1035.1032.6033.1532.7033.4532.8031.3032.2530.0528.7024.7523.4021.30
Black44.2044.5542.5544.1043.3044.4043.4041.5042.9040.7039.5535.6033.8532.00
14 hWhite22.0021.9020.6519.7019.3020.0019.4017.9018.5016.7015.4011.109.207.85
Green34.5533.9532.1533.4534.6534.7535.9532.1533.8531.2530.1527.0525.8523.90
Gray26.8526.9525.9526.1525.9026.4526.0024.1025.1522.9521.8517.9517.1014.40
Blue37.1536.0034.7036.0036.2536.7538.9034.8535.4533.8532.5028.7527.7525.30
Black50.0547.0546.2047.1546.6547.5549.6546.2546.3544.5543.2039.4037.5035.15
16 hWhite23.3022.1522.4520.4520.1020.8523.1018.7019.6517.4516.1512.3010.808.60
Green36.5537.9536.4538.1535.1536.8038.4534.2536.1035.7032.6528.7529.4017.80
Gray28.3028.2528.0528.2026.0527.4529.0524.4024.8525.9522.2520.1019.0015.25
Blue37.5038.1538.7539.0037.8038.9540.8036.4038.1036.5034.6031.2530.4527.10
Black49.5549.0548.2547.8547.6548.0549.8548.5548.2546.0546.8541.4540.8538.45
Table 5. Weekly indoor average temperatures acquired by a thermometer at different times (°C).
TimeColor3rd Week of Nov.4th Week of Nov.5th Week of Nov.1st Week of Dec.2nd Week of Dec.3rd Week of Dec.4th Week of Dec.1st Week of Jan.2nd Week of Jan.3rd Week of Jan.4th Week of Jan.1st Week of Feb.2nd Week of Feb.3rd Week of Feb.
10 hWhite16.1514.409.708.407.107.707.406.304.805.204.902.802.452.05
Green17.4018.2513.5510.608.509.608.208.406.357.306.004.351.951.75
Gray17.1516.4511.909.608.408.508.057.406.256.405.854.352.151.95
Blue18.0018.0013.5511.3010.2510.4510.009.108.208.057.506.002.852.65
Black19.4019.1515.3012.8011.2511.6511.1510.609.409.758.957.704.853.90
12 hWhite15.8014.109.458.457.257.307.356.255.105.104.853.152.352.20
Green17.3518.2513.5510.808.759.708.258.606.607.506.155.152.352.10
Gray17.4516.8012.009.908.509.157.857.706.156.655.754.102.252.10
Blue17.9518.1512.9011.1010.5010.109.808.808.107.707.605.452.852.65
Black19.8019.9017.2513.3012.3512.3011.7511.009.959.909.558.054.254.05
14 hWhite15.9013.608.908.206.755.706.605.904.353.304.402.252.702.35
Green18.0518.4513.8511.309.259.1510.158.907.258.556.805.502.902.70
Gray17.3516.6012.009.807.857.308.107.405.854.805.703.704.202.20
Blue18.1518.5513.5011.6511.0510.2510.109.258.358.158.106.204.802.85
Black20.7520.5518.5515.2514.2514.5514.1010.659.557.808.506.956.155.85
16 hWhite15.7013.759.107.756.305.206.455.354.103.154.052.151.751.95
Green18.4518.6014.4511.659.659.4510.259.257.408.807.205.604.152.85
Gray18.8517.1012.4510.158.357.557.907.406.154.955.953.804.452.95
Blue18.3018.2513.6011.8011.5010.1510.559.408.658.358.406.555.003.20
Black20.9520.8518.9516.4514.6514.8014.3011.3510.6510.658.907.607.156.35
Table 6. Correlation index between the surface temperature and room temperature through the Pearson’s correlation coefficients.
Time WhiteGreenGrayBlueBlack
100.820.780.730.820.90
120.800.830.780.870.82
140.760.700.730.730.78
160.750.690.690.700.76
Table 7. ANOVA test for the comparison of surface temperature differences between colored roofs.
GroupsCountSumAverageVariance
White56887.4515.8524.31
Green1676.6529.9427.43
Gray1195.7521.3525.40
Blue1798.9032.1225.02
Black2354.1042.0333.34
Source of VariationSum of squaresDegrees of freedomMean of squaresF-valuep-valueF-critical value
Between groups22,923.7545730.94211.461.31 × 10−822.40
Within groups7452.9727527.10---
Total30,376.72279----
Table 8. ANOVA test for the comparison of indoor temperature differences between colored roofs.
GroupsCountSumAverageVariance
White56375.706.7116.19
Green517.859.2522.21
Gray461.608.2420.23
Blue554.209.9019.34
Black676.3012.0823.16
Source of VariationSum of squaresDegrees of freedomMean of squaresF-valuep-valueF-critical value
Between groups889.214222.3010.992.77 × 10−82.40
Within groups5561.6727520.22---
Total6450.88279----
Publisher’s Note: MDPI stays neutral with regard to jurisdictional claims in published maps and institutional affiliations.

