Abstract
The work aims at investigating the techno-economic performance of a biodiesel micro combined heat and power (CHP) system for residential applications. The CHP unit is based on a direct-injection compression ignition engine providing 6.7 kWel and 11.3 kWth. A 0D model is developed and validated to characterise the behaviour of the biodiesel-fired engine at full and partial load in terms of efficiency, fuel consumption, and emissions. Furthermore, non-dimensional polynomial correlations are proposed to foresee the performance of biodiesel-fuelled engines for micro-CHP applications at partial loads. Afterwards, the CHP system is adopted to satisfy the electric and thermal demand of domestic users in Southern Italy. To this purpose, a parametric analysis is performed considering a different number of apartments and operating strategies (electric-driven and thermal-driven). A bi-variable optimisation based on the primary energy saving (PES) index and payback period (PBT) permits selecting the thermal-driven strategy and five apartments as the most suitable solution. The optimal PBT and PES are equal to 5.3 years and 22.4%, respectively. The corresponding annual thermal self-consumption reaches 81.3% of the domestic request, and the thermal surplus is lower than 8%. Finally, a sensitivity analysis is adopted to define the influence of the costs of energy vectors and a cogeneration unit on the economic feasibility of the biodiesel CHP system. The analysis highlights that the investigated apparatus represents an attractive option to satisfy the energy requests in micro-scale applications, providing valuable energy and economic advantages compared to traditional energy production.
1. Introduction
Micro combined heat and power (μCHP) generation is widely considered a key technical solution to promote sustainable energy production and overcome environmental concerns [1,2]. Unlike conventional separate production systems, μCHP units guarantee lower costs and fuel consumptions, as well as higher on-site generation share [3,4,5]. In this framework, internal combustion engines (ICEs) represent a reliable, well-established, and economically viable technology [6,7,8]. ICEs are the most common power source for transport and are significantly diffused for electric generation and CHP applications up to 1.0 MW [9,10,11].
However, fossil fuel depletion and more and more severe emission regulations have encouraged the industry and the research community to study alternative fuels [12,13,14]. In this context, biodiesel represents an attractive, renewable, and environmentally friendly sustainable fuel [15,16]. Furthermore, the flexibility of using fuel blends (biofuel and conventional fuel) in compression ignition engines avoids significant modifications in the engine components and operating conditions [17,18,19].
Several works are available in the literature on the use of biodiesel in compression ignition (CI) engines for applications in the automotive field and small power generation [5,20,21,22]. Figure 1 highlights that the number of scientific publications has been growing at a high rate for the last 10 years. Conversely, very few papers have been published on CHP applications and further investigations are necessary to promote biofuel exploitation.
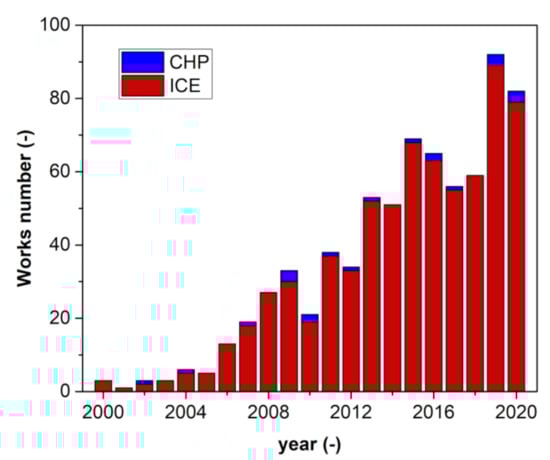
Figure 1.
Number of papers on biodiesel-fired internal combustion engines from 2000 to 2020. Automotive and small power applications (red bar), combined heat and power (CHP) generation (blue bar). Authors elaboration on Scopus data [23]. Document search criterion refers to “Article title, Abstract, Keywords” menu and adopts “Biodiesel” AND “internal combustion engines” keywords for ICE applications. “Biodiesel” AND “CHP” AND NOT “biodiesel production” AND NOT “hydrogen” AND NOT “gasification” are used for CHP applications.
Furthermore, most works focused on the analysis and comparison of the performance and pollutant emissions of ICEs fuelled with conventional diesel, biodiesel, and blends. As an example, McCarty et al. [24] found a decrease in the performance of the CI engine when the biodiesel share increased. In particular, a 5% torque reduction and a 7% increase in fuel consumption were observed for biodiesel, mainly due to its lower heating value. Furthermore, the authors claimed that biodiesel lowered carbon monoxide (CO) emissions due to higher oxygen content, whereas hydrocarbon (HC) emissions increased with the biodiesel share. The nitrogen oxide (NOx) emissions depended on the oxygen percentage in the biofuel and could be either lower or higher compared to standard diesel fuel. Lahane et al. [25] compared a wide range of biodiesel/diesel blends, from 5% biodiesel content to full biodiesel operation, and showed that engine power did not change significantly when the biodiesel content was lower than 20%. On the other hand, Özener et al. [26] found that fuel consumption increased in the range 2–9%, whereas a torque reduction of 1–4% was observed when ICE operated at full biodiesel operation. Furthermore, Ndayishimiye et al. [27], as well as Rosa et al. [28], confirmed an increase in fuel consumption with the biodiesel share. Similar results were found by Lahane et al. [25]. The engine running on biodiesel fuel provided a decrease in CO and HC emissions and an increase in NOx [25,26]. A combustion analysis revealed that the injection time reduced with the biodiesel content increase. In addition, Ozturk [29] demonstrated that the adoption of biodiesel decreased the injection and ignition delays, as well as the maximum heat release rate, whereas the injection and combustion durations increased with the biofuel content.
As already noticed, few studies on biodiesel engines in CHP configurations are available in the literature [23,30]. The majority of the works were experimental and focused on the performance and emissions of CHP engines fuelled by blends of biodiesel and conventional diesel fuel [31]. Results show that the overall efficiency of the system and the NOX emissions increased with the biodiesel content. Some authors experimentally investigated the effects of additives on the performance of micro-CHP internal combustion engines driven with biodiesel/diesel blends. In particular, Caligiuri et al. [32] highlighted that the addition of a small amount of bioethanol (3% on a volume basis) provided a significant thermal efficiency increase (up to 13%) compared to the neat fully diesel or biodiesel operation. A further positive effect of bioethanol integration is a reduction in CO and NOx emissions at high and low engine loads. Moreover, Magno et al. [33] experimentally studied the effect of the addition of rapeseed methyl ester (RME) on a biodiesel (20%) and conventional diesel (80%) blend. The addition of RME reduced the CO and HC emissions, whereas a NOx emissions decrease was registered in some operating conditions.
As far as modelling is concerned, a bunch of papers on biodiesel compression ignition engines is available in the literature. Different methods [34,35] and levels of complexity can be used [36,37], adopting 0D [38], 1D [39], and computational fluid dynamics (CFD) models [40]. CFD codes provide detailed information on the phenomena occurring in internal combustion engines but require high computational capacities to characterise real ICEs [41,42]. Conversely, zero dimensional models, based on the first law of thermodynamics, use semi-empirical equations to describe the thermodynamic processes occurring in the cycle. The relative simplicity of implementation, the low computational cost, the ability to easily perform parametric analysis, and the good accuracy, make the 0D approach very attractive.
Nevertheless, few works are available on the 0D numerical modelling of ICEs fuelled with biodiesel for electric generation or in CHP configuration [43,44]. To fill this gap in the scientific literature, a zero-dimensional model of a micro combined heat and power system based on a biodiesel-fuelled internal combustion engine was developed. The performances in terms of electric and thermal efficiency, specific fuel consumption, and NOx emissions was evaluated at full and partial loads. The thermal power was recovered for cogeneration purposes from the exhaust gas flow and the cooling circuit. A semi-empirical model to predict the NOx emissions as a function of the heat release rate and adiabatic flame temperature [45] was used, and the CO2 and GHG emissions were evaluated considering the emission factors [46,47]. The engine 0D model was validated with experimental data from the scientific literature.
Another novelty of the work was the introduction of non-dimensional polynomial correlations useful for foreseeing the performance (fuel consumption, thermal, and electric efficiency) of biodiesel-driven engines at partial load for micro-CHP applications. Afterwards, attention was focused on a case study to investigate the energy characteristics and the economic viability of the CHP system to satisfy the energy demand of residential users. To this purpose, a multi-variable optimisation was carried out to define the number of apartments, which guaranteed a suitable trade-off between economic and energy performance of the selected CHP unit. The energy balance and the main emissions were evaluated, and a sensitivity analysis of the main economic parameters was carried out.
2. Materials and Methods
2.1. System Description
A zero-dimensional numerical model was developed to characterise the energy performance of a biodiesel-fired combined heat and power (CHP) system for micro-scale domestic applications. Particularly, the CHP apparatus provided electric and thermal energy to satisfy the energy demand of domestic users. The simplified scheme of the overall system is shown in Figure 2 as well as the main energy fluxes: electric and thermal production, final users’ energy self-consumption, thermal integration from a conventional auxiliary boiler, thermal dumping, electric excess to be injected into the grid, and electric integration. The energy balances are expressed as follows:
where Pr and represent the electric and thermal power request, respectively; Pel and are the CHP electric and thermal power, respectively; Ps is the electric power surplus; Pp corresponds to the electric power from the grid; is the thermal power surplus; and represents the auxiliary boiler thermal integration.
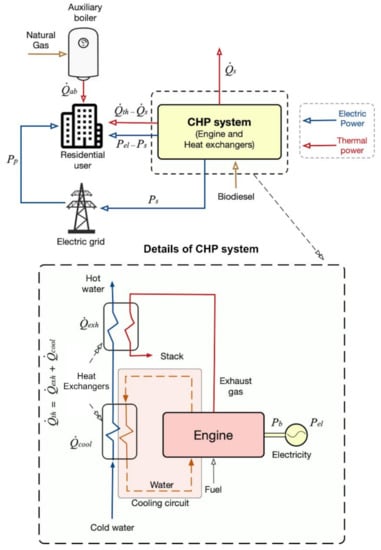
Figure 2.
Micro-CHP system layout and energy fluxes.
The figure also shows the details of the CHP arrangement and main components: the prime mover and two heat exchangers to recovery waste engine energy from the coolant circuit and the exhaust gases.
2.2. Prime Mover
The CHP apparatus is based on a single-cylinder four-stroke direct injection (DI) compression ignition engine, whose main characteristics are summarised in Table 1. The rated brake power is equal to 11.0 kW at 2000 rpm and reduces to 7.6 at 1500 rpm. An alternator converts the mechanical energy into electricity while two heat exchangers in series exploit the thermal energy of the cooling fluid and exhaust gas. At partial load operations, the coolant mass flow rate varies to maintain the temperature difference from the entrance to the outlet of the CHP system equal to 10 °C. Several experimental tests on the current biodiesel-fired internal combustion engine were carried out by Qi et al. [48]. Specifically, the biodiesel fuel was obtained from the trans-esterification of soybean crude oil with methanol (CH3OH) catalysed by potassium hydroxide (KOH). Qi et al. analysed the engine performances in terms of brake thermal efficiency (BTE), brake specific fuel consumption (BSFC), and exhaust gas emissions for different loads at 1500 rpm engine speed, and these results were adopted to validate the numerical model proposed in the present work. More information on the experimental investigations is available in the literature [48].

Table 1.
Main engine characteristics.
2.3. Mathematical Model of the CHP System
The proposed zero-dimensional single-zone model was developed to evaluate the performance of the biodiesel-fired CHP unit. The numerical model is based on the following assumptions, in line with the literature [43,44,49]: The chemical properties and temperature of the air-fuel mixture within the cylinder are homogeneous, the fuel injected into the combustion chamber is instantaneously mixed with the cylinder charge, and the behaviour of the gas mixture is ideal.
2.3.1. General Equations
The first law of thermodynamics for the investigated system can be expressed as:
where is the chemical heat release rate (gross heat release rate) from the combustion process, is the heat-transfer rate to the cylinder walls, dU/dt is the internal energy variation of the cylinder content, and Pin is the indicated power.
For perfect gas, Equation (1) can be expressed as follows [50]:
where p is the cylinder pressure, V is the instantaneous cylinder volume, and γ is the specific heat ratio that is evaluated as a function of the temperature adopting a polynomial method developed by Krieger and Borman [51].
2.3.2. Ignition Delay
The ignition delay (ID) is defined as the difference between the start of combustion (SOC) and the start of the dynamic injection timing. The ID is an important parameter for the combustion process in diesel and biodiesel engines because it defines the ignition point and the SOC. In this work the ignition delay is based on the empirical correlation developed by Hardenberg and Hase [52]:
where Sp is the mean piston speed, N is the engine speed; R is the universal gas constant; TTDC and pTDC are the temperature and cylinder pressure (in bar) at TDC (top dead centre) [50], respectively; and Ea is the activation energy, which can be expressed as a function of the fuel cetane number (CN):
For biodiesel, the ignition delay slightly decreases compared to the diesel fuel due to a higher cetane number [29,48,53].
2.3.3. Combustion and Heat Transfer Rate Model
The combustion heat release rate is modelled as a function of the mass flow rate and lower heating value Hi of the fuel burned into the cylinder:
The burned fuel is modelled by adopting a triple Wiebe function:
The law is a combination of three Wiebe functions and it is able to characterise the different (premixed, diffusion, and late) phases of the combustion process. The parameter βi is the fuel fraction burned for each phase, the coefficient αi accounts for the corresponding combustion efficiency, σi is the shape parameter that establishes the combustion speed, and tst,i and Δti represent the start and duration of the combustion for the generic ith phase of the process, respectively. These parameters are defined as a function of the engine load according to the literature [54].
The mass flow rate of fuel injected into the cylinder is:
where Nh is the number of injector orifices, Ae is the effective area of orifice, CD represents the discharge coefficient [55], and ρf and pf are the density and the injection pressure of the fuel, respectively.
The heat transfer rate to the cylinder walls is predicted according to the Annand correlation [56]:
where Aw is the area of the cylinder, Tw is the wall temperature, and h is the convective heat transfer coefficient, which is defined as follows:
where the parameters a and b are constant and are evaluated after a calibration process, k is the thermal conductivity of the gas, and Re is the Reynolds number.
2.3.4. CHP Performance
The energy balance of the internal combustion engine is as follows:
where Pb is the brake power, is the heat transer rate to the cooling fluid, is the exhaust heat rate, and is the miscellaneous losses (i.e., mechanical friction and organic losses, and convective and radiated thermal power from the engine to the environment).
The brake power Pb is evaluated as the difference between the indicated power Pin and frictional power Pfr, which is considered constant for a given engine speed [50]:
The thermal power to the coolant is estimated as follows:
where the heat transfer rate to the walls is predicted through Equation (8), the second term represents the friction power fraction transferred to the cooling fluid [57], fmep corresponds to the friction mean effective pressure, voil is the kinematic viscosity of lubricant oil at the generic temperature T, and voil,90 is the reference kinematic viscosity at 90 °C.
The thermal power of the exhaust gas is:
where the miscellaneous losses are considered independent of the engine load according to the literature [58].
The electric power Pel is evaluated as the product of the brake power Pb and the alternator electro-mechanical efficiency ηem, whereas the thermal power takes into account the heat transfer rate recovered from the cooling fluid () and the exhaust gas (), and the corresponding heat exchanger thermal efficiencies (ηhe,cool and ηhe,exh, respectively):
The energy performances of the CHP system are expressed in terms of electric efficiency (ηel), thermal efficiency (ηth), and specific fuel consumption (Sfc):
Furthermore, the primary energy saving (PES) index and the energy utilisation factor (EUF) are adopted as cogeneration parameters [59]:
where ηel,ref and ηth,ref are the reference efficiencies for separate electric and thermal production, respectively [60].
Table 2 summarises the main assumptions adopted for the investigation. The electro-mechanical efficiency (ηem) of the alternator was set to 90%, and the heat exchangers’ effectiveness was equal to 95% [61,62]. The reference electric (ηel,ref) and thermal (ηth,ref) efficiencies for the biodiesel-fired cogeneration unit were fixed to 44.2% and 85.0%, respectively, according to the harmonised reference values for separate energy production of the European Commission Delegated Regulation 2015/2402 [60]. The biodiesel lower heating value (Hi) corresponded to 38.8 MJ/kg and the density (ρf) was 870 kg/m3 [48]. The fuel injector presented four orifices (Nh) and the injection pressure (pf) was equal to 180 bar [48].
Table 2.
Operating conditions and main assumptions.
2.3.5. Emissions Model
The numerical model was integrated to evaluate the environmental impact of the CHP unit. To this purpose, the Zeldovich thermal-NOx mechanism [63] was considered. The model points out the strong influence of the temperature of combustion products on the thermal NOx. High oxygen concentrations and high temperatures of combustion products involve a significant thermal nitrogen oxide formation rate [50]. Several researchers developed semi-empirical correlations based on the adiabatic flame temperature [64,65,66]. This work adopted a modified semi-empirical correlation [45], which takes into account the adiabatic flame temperature and the effect of heat release rate function according to the following equation:
where mNOx is the NOx mass per cycle produced during combustion, Tad represents the adiabatic flame temperature, and the parameters k1, k2, and k3 are fitted with literature data [48]. The coefficient ϕ takes into account the reduction process of thermal NOx due to the re-entrainment in the reduction zone of the NOx produced during the combustion. More details are provided in the literature [45,48,67].
Furthermore, the environmental impact of the investigated CHP system was analysed in terms of carbon dioxide (CO2) and greenhouse gas (GHG) emissions due to the biodiesel combustion according to the following equation:
where x represents the generic pollutant, fx is the corresponding emission factor, and mf is the annual fuel consumption that depends on the CHP operating conditions and is evaluated as:
The subscript h refers to hourly value, is the corresponding CHP electric power, and Δth is the time interval.
In particular, the emission factor was equal to 79.6 g/MJ for CO2, whereas the GHG factor corresponded to 80.5 g of equivalent CO2 per MJ [46,47].
2.3.6. Economic Analysis
An economic analysis was carried out to evaluate the feasibility of the micro-CHP system for domestic applications. When the micro-CHP unit was unable to satisfy the users’ electric demand, the grid provided the electric energy, and the electric surplus was sold to the grid if the CHP production was higher than the domestic request. Furthermore, a back-up boiler was integrated to meet the users’ thermal demand when the micro-CHP system was not able to satisfy the request. Figure 2 presents the simplified scheme of the investigated system and the corresponding energy flows.
The main assumptions for the economic investigation are shown in Table 3. The specific cost of the cogeneration unit was set to 1260 €/kW [68,69], and the biodiesel cost was equal to 70 c€/L [70]. The specific rates of the thermal and electric energy were 0.10 and 0.20 €/kWh, respectively, whereas the revenues from the electricity injected into the grid were equal to 0.10 €/kWh [61]. It is wortfh noting that renewable small and micro scale units and high-efficiency cogeneration systems have a surplus electricity priority dispatch according to national and European directives [71,72,73]. The investment period and the interest rate were fixed to 20 years [74,75] and 3% [76,77], respectively.
Table 3.
Main assumptions for the economic analysis.
Finally, a parametric investigation was performed to evaluate the influence of a possible variation in the specific costs of energy vectors and the micro-CHP unit [78,79,80] on the economic feasibility of the investigated renewable system.
3. Results and Discussion
3.1. Model Validation
The work aimed at analysing the performance of a biodiesel-fired combined heat and power (CHP) unit for residential micro-scale applications. To this purpose, a zero-dimensional single-zone numerical model was developed and the possible application to the domestic sector was investigated.
The model was validated in terms of brake thermal efficiency (BTE), brake specific fuel consumption (BSFC), cylinder pressure, heat release rate (HRR), and NOx emissions, adopting experimental data from the literature [48].
Figure 3 highlights the comparison between experimental and numerical BTE and BSFC as a function of the brake mean effective pressure (bmep).
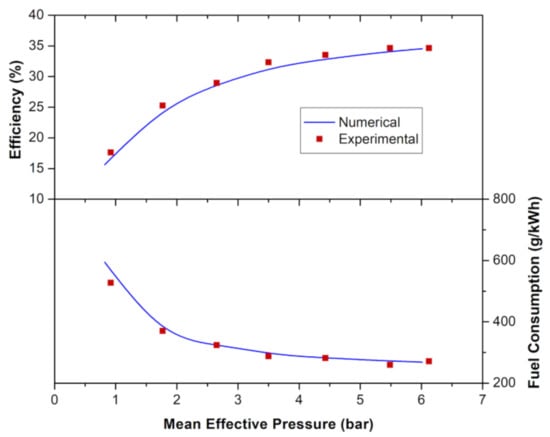
Figure 3.
Comparison between numerical and experimental results in terms of brake thermal efficiency and specific fuel consumption.
As expected, BTE increased with the engine load, whereas BSFC progressively reduced. In particular, the numerical BTE and the BSFC at low engine load (bmep = 0.8 bar) were 15.6% and 594.5 g/kWh, respectively, whereas the corresponding experimental values were 16.8% and 553.6 g/kWh, respectively; at full engine load (bmep = 6 bar) the model shows that the brake thermal efficiency reached 34.5% and the specific fuel consumption reduced to 268.5 g/kWh, whereas the experimental measurements corresponded to 34.7% and 267.4 g/kWh, respectively. A global good agreement between experimental and numerical results was registered with 3% mean absolute percentage errors.
Furthermore, the validation was extended considering the heat release and the cylinder pressure. As an example, Figure 4 shows the comparison between experimental and numerical results at 5.3 bar bmep (88% of full load). The numerical results are in good agreement with the experimental measurements. The start of combustion (SOC), which occurs when the HRR becomes positive, predicted by the numerical model (6° CA BTDC) was close to the experimental value (7° CA BTDC). This result confirms the proper characterisation of the ignition delay (ID) after adopting Equation (5). A slight difference between numerical and experimental results can be observed in the first (premixed) and the second (diffusion) phase of the combustion process. In particular, an experimental slight peak was noticed during the diffusion phase, whereas a smoother curve for the numerical results was found. This was due to a different estimation in the biodiesel fraction burned during the premixed and diffusion phase. However, the differences were always lower than 4.4%. The cylinder pressure confirmed this trend (Figure 4b) and the numerical peak was slightly underestimated. It is worth noting that this comparison was limited from the top dead centre (TDC) to 10° CA after top dead centre (ATDC) due to the lack of experimental pressure data [48] outside this range.
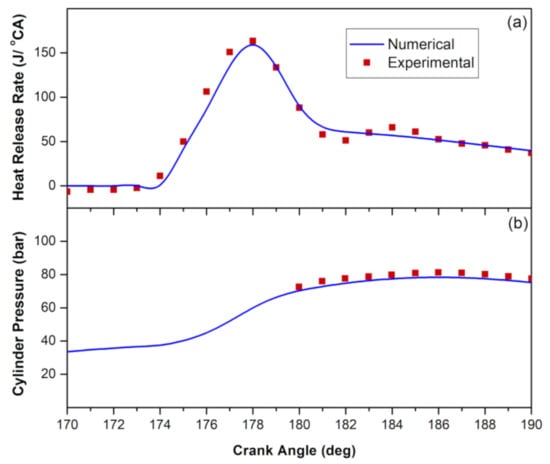
Figure 4.
Comparison between numerical and experimental results: (a) heat rate release; (b) cylinder pressure.
Furthermore, Figure 5 shows the comparison between numerical and experimental NOx emissions at different engine loads and highlights that the proposed model well characterised the behaviour of the biodiesel-fired engine also in terms of environmental impact (nitrogen oxide production), with differences always lower than 3.9%. NOx emissions increased as the engine load rose due to the upsurge in the adiabatic flame temperature, oxygen content, and residence time in the combustion zone, according to the literature [18,81]. In particular, the nitrogen oxides moved from about 400 ppm at minimum (bmep = 0.8 bar) to about 1900 ppm at full load (bmep = 6 bar).
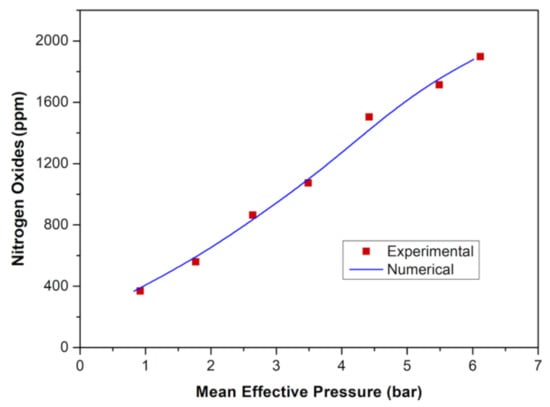
Figure 5.
Comparison between numerical and experimental results in terms of NOx emissions.
3.2. CHP Performance Characterisation
The proposed numerical model was adopted to characterise the energy performance of the biodiesel-fired micro-CHP unit. At full load, the electric and thermal power were equal to 6.7 kWel and 11.3 kWth, respectively, whereas the total losses were about 3.6 kW. Figure 6 highlights the corresponding numerical energy balance as percentages of the fuel input.
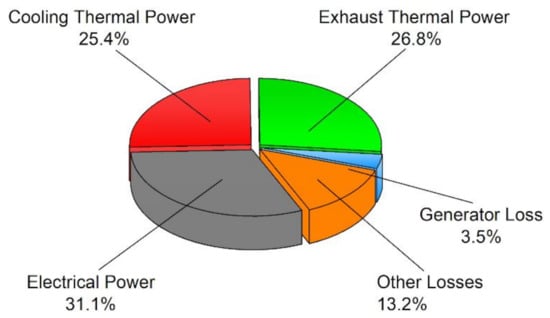
Figure 6.
Energy balance of the biodiesel-fired micro-CHP system.
The energy utilisation factor was 83.3% and 16.7% of the biodiesel primary energy could not be used for cogeneration purposes, in line with the literature [82,83]. The electric and thermal efficiencies corresponded to 31.1% and 52.2%, respectively. In particular, the useful thermal effect was obtained from the energy exploitation of the cooling fluid and exhaust gas (25.4% and 26.8% of the fuel input, respectively).
Furthermore, the behaviour of the biodiesel micro-cogeneration unit was characterised as a function of the electric load factor. To this purpose, efficiencies and fuel consumptions referred to the corresponding values at full load, as follows:
where the electric load factor (Lf) is the ratio of the electric power to nominal electric power:
The normalised electric efficiency reduced with the decrease in the electric load (Figure 7a) and maintained values higher than 82% for Lf ≥ 0.5. At Lf = 0.2 the normalised parameter was equal to 56.4% and reduced to 43.1% at Lf = 0.13. Conversely, the thermal performance rose at partial loads, and the normalised coolant and exhaust thermal efficiencies at minimum reached 151.2% (Figure 7b) and 111.9% (Figure 7c), respectively.
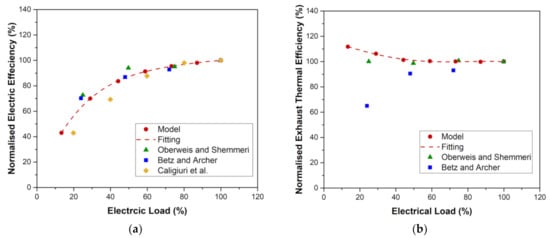
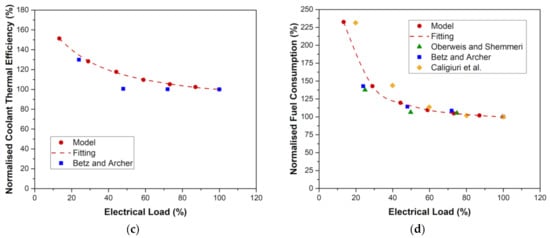
Figure 7.
CHP performances in terms of normalised parameters and comparison with experimental data: (a) electric efficiency; (b) exhaust thermal efficiency; (c) cooling circuit thermal efficiency; (d) fuel consumption. Authors elaboration on experimental literature data [31,32,84].
The analysis demonstrated that the electric load significantly influenced the CHP fuel economy (Figure 7d). Specifically, at low engine load, the fuel consumption was more than doubled compared to the full load operation.
Figure 7 highlights also that the CHP normalised parameters could be properly approximated by adopting the following polynomial correlations (red curves in the figure):
with R2 higher than 99%.
The comparison with experimental results from the literature [31,32,84] revealed a good match for most of the data. It is worth noting that the thermo-physical and chemical properties of biodiesel were hardly homogeneous for different applications, depending on raw sources, processes, and technologies adopted for the production of the biofuel. Even with these limitations, the proposed non-dimensional equations represented a useful tool for the prediction of the performance of biodiesel-fired micro-CHP energy systems at partial load.
3.3. Case Study: A Domestic Application
The energy performance and the economic viability of the CHP system fuelled by biodiesel were analysed in a test case. The energy requests of typical residential users located in Southern Italy were considered. Figure 8 shows the daily profiles of electric (a) and thermal demand (b) of a single apartment during a typical day in winter, summer, and intermediate seasons in Messina (Southern Italy). The annual electric and thermal demands are 2.70 MWhel and 9.18 MWhth [62,85]. The daily electric demand moves from 5.6 kWhel (winter) to 12.7 kWhel (summer), whereas the daily thermal load presents the maximum value (44.8 kWhth) in winter and the minimum request (7.5 kWhth) in summer. The thermal and electric data refer to the averaged energy demand registered for 500 and 110 flats, respectively [86]. In particular, the electric load includes domestic lighting systems and appliances, as well as air conditioners, whereas the thermal request refers to space heating and hot water requests. Compared to simple single-apartment data, the averaged values provide more general results. As an example, Mongibello et al. [85] investigated the energy performances of cogeneration energy systems considering multi-apartment users resulting from single-flat averaged data.
Figure 8.
Daily profiles of the energy demand of a single apartment during a typical day in winter, summer, and intermediate seasons in Southern Italy: (a) electric; (b) thermal; Authors elaboration on literature data [86].
The CHP energy production was evaluated on an hourly basis, also considering partial load operations, and the minimum load was assumed to be 20% of the rated power.
The goal of the analysis was to find the best fit between the biodiesel-fired CHP engine and the final users from an energetic and economic point of view. Two operating strategies (i.e., thermal and electric-driven operations) were compared, and the optimal number of apartments that could be fed by the investigated CHP system was determined by adopting a multi-objective optimisation. To this purpose, the two objectives were the payback period (PBT) and the primary energy saving (PES) index, and the ideal configuration presented the minimum PBT and the maximum PES.
The first set of results concerns the analysis of the two parameters as a function of the number of apartments (Figure 9 and Figure 10).
Figure 9.
PES index as a function of the number of apartment under the thermal- and electric driven strategies.
Figure 10.
Influence of the number of apartments on the system’s economic feasibility: (a) net present values; (b) payback periods. Thermal-driven strategy.
Figure 9 reveals that the primary energy saving index increased with the number of dwellings for both the investigated strategies, and the thermal-driven control guaranteed the highest values for all the examined cases.
The maximum difference between the two operating modes (5.6 percentage points) was registered for four apartments. Under the thermal driven strategy, the PES index revealed a significant rise in the range from one to four apartments; from this point, the increasing rate decreased progressively, reaching a plateau (close to 24%).
The economic analysis highlights that the sole thermal-driven strategy and a number of dwellings ranging between three and six guaranteed cost-effective operations with a payback period of less than 10 years. For a larger number of apartments, the energy requests increased, and higher thermal and electric integrations were necessary, with a negative impact on the system’s economic balances. Furthermore, the revenues from the electricity injected into the grid reduced, and consequently the NPV was less than zero at 20 years. The electric-driven strategy was also economically unfavourable for all the investigated conditions, with a payback time higher than the considered investment period (20 years).
For this reason, Figure 10 shows the net present value (NPV) and payback period (PBT), as a function of the number of users for the sole thermal-driven operation. Four apartments offered a minimum PBT and corresponding NPV of EUR 22,083 at 20 years. The hatched area in Figure 10b defines payback times higher than the investment period, and it corresponds to unfavourable economic operations.
The “minimum distance” method was adopted as an optimisation criterion to find a suitable trade-off between economic and energy performances, according to the literature [87,88,89]. The first step was finding the ideal point defined by the maximum saving index (PESmax = 22.9%) and the minimum payback period (PBTmin = 4.5 years). The selection of the CHP system configuration was obtained by minimising the dimensionless distance of the investigated configurations to the ideal point as follows:
where the subscript i refers to the generic ith analysed configuration.
Figure 11 shows the two parameters for the configurations that assured a positive cash flow and reveals that a Pareto frontier existed. In particular, the multi-objective optimisation criterion suggested adopting the thermal-driven operating mode with five apartments.
Figure 11.
PBT as a function of the PES index for different apartments.
In order to verify the energy performance of the selected configuration, the yearly electric and thermal energy flows were analysed and the results were compared with all the other investigated systems (i.e., adopting different operating strategies and number of apartments), independently of the corresponding economic viability. To this purpose, the yearly energy balances were defined as a function of the number of apartments and were expressed in terms of thermal and electric self-consumption, integration, and surplus (Figure 12). High energy self-consumption and low surplus were crucial to lowering the dependence of the CHP system from the electric grid and saving fossil fuel in the auxiliary boiler, fostering the transition towards diffuse energy systems based on renewable sources, and promoting the development of independent smart communities [61,90].
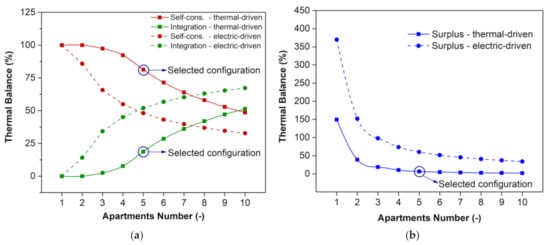
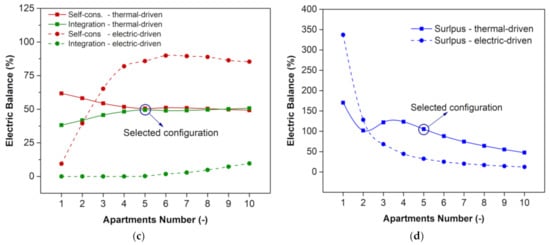
Figure 12.
Comparison between thermal- and electric-driven strategies: (a) thermal self-consumption and integration; (b) thermal surplus; (c) electric self-consumption and integration; (d) electric surplus.
For all the investigated cases, the lower the number of apartments, the higher the self-consumption. It is worth noting that under thermal-driven operation the micro-CHP unit was switched off if the heat demand was absent, and the thermal self-consumption was higher than the electric-driven strategy, leading to a lower integration from the auxiliary boiler (Figure 12a). The maximum difference between the two strategies was close to 37 percentage points and was registered for four apartments. Conversely, the thermal surplus was considerably high under electric-driven operation and a significant thermal dissipation was present (Figure 12b). Figure 12c,d compare the corresponding electric balances. As expected, the self-consumption was always higher for the electric-driven mode, leading to a decrease in electric integration and surplus. However, the configuration, operating according to a thermal-driven strategy, experienced a low decreasing rate of electric self-consumption. In particular, the optimised system was located in the plateau region with self-consumed electricity higher than 50%.
To sum up, on the basis of the current analysis, the thermal load following operation appears to be the proper strategy with respect to electric operating mode because it maximises the thermal self-consumption and minimises the thermal surplus, confirming the PES trend. Furthermore, the selected number of apartments (five) guarantees a proper trade-off between thermal dumping, electric surplus, and self-consumption.
To investigate in more detail the behaviour of the optimised micro-CHP unit, an energy and emission analysis was carried out on an hourly basis.
The electrical and thermal balances in winter, summer, and intermediate season days are shown in Figure 13. The figure also shows the daily energy consumptions for the selected days. As already noted, the maximum electric consumption was registered in summer (63.3 kWhel per day), whereas the maximum thermal demand was in winter (223.8 kWhth per day).
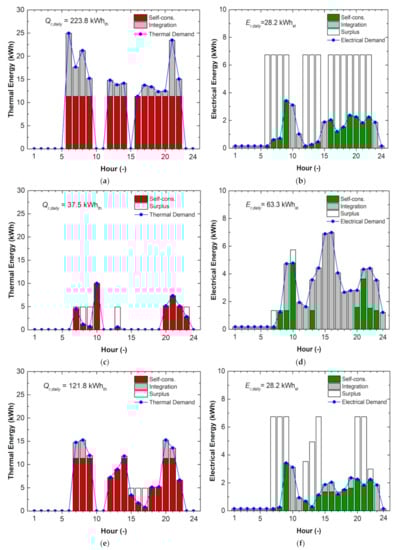
Figure 13.
Hourly energy balance of the micro-CHP system for thermal-driven strategy: (a) thermal exchange in winter; (b) electric exchange in winter; (c) thermal exchange in summer; (d) electric exchange in summer; (e) thermal exchange in intermediate seasons; (f) electric exchange in intermediate seasons.
During a typical day in winter, the micro-CHP system worked at nominal operating conditions for 14 h per day (Figure 13a) owing to the high thermal energy demand, satisfying about 71% of the daily thermal request. Even though the micro-CHP unit worked at full load, a thermal integration from the back-up boiler was necessary due to the thermal demand that reached the maximum values.
A significant injection of the electric energy to the grid was guaranteed by the system due to the low electric request (Figure 13b). Since the CHP system was switched off when the thermal demand was zero, the integration from the grid was necessary. On a typical summer day, the electric load presented the highest values (close to 2.0 MWhel/month) due to the significant cooling requests, whereas the thermal demand was low owing to the sole hot water request. In these conditions, the micro-CHP system worked at partial load (about 40% of the nominal thermal power) for 7 h per day (Figure 13c) and was turned off when the hot water demand was zero, minimising the thermal excess and avoiding the thermal support of the backup boiler. On the contrary, a significant integration from the grid, equal to 73% of the daily electric load, was necessary (Figure 13d). During the intermediate season, the micro-CHP system was capable of guaranteeing 88% of the thermal request, 68% of electric self-consumption, and an electric surplus equal to 67% of the production (Figure 13e,f).
The monthly electric and thermal energy balances of the selected micro-CHP system are shown in Figure 14. Figure 14a highlights that the micro-CHP unit completely satisfied the thermal demand in July and August, with a slight integration necessary from April to November (lower than 12.2%). On the other hand, the auxiliary boiler was crucial in winter to meet the peak thermal demand and the integration ranged between 21% and 29%. The thermal dumping was not present in January and February, whereas it reached the maximum values in July and August (39% of the thermal production).
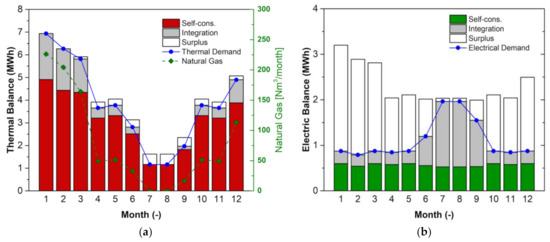
Figure 14.
Monthly energy balances for the micro-CHP system with thermal-driven strategy and five apartments: (a) thermal balance; (b) electric balance.
The electric balance highlights that the micro-CHP unit never satisfied the electric energy demand (Figure 14b), covering 50.5% of the yearly electric requests. The maximum electric integration was in July and August due to the high cooling demand. Even though the electrical production was larger than the corresponding requests from December to February, the grid integration was still present. In fact, the thermal and electric loads were not concurrent during all the hours of the day. The optimised system satisfied at least 68.4% of the electric demand from October to May whereas the electric surplus was higher than 67.4%. On the other hand, a significant integration (73.2%) was noticed in July and August owing to the cooling load, with a small fraction of the electric production (11.6%) injected into the grid.
Furthermore, the monthly CO2 and NOx emissions and the biodiesel consumptions were evaluated (Figure 15). The parameters reflected the thermal self-consumption trend, with minimum values in the hot months and maximum in the cold season. In particular, the biodiesel consumption reached 0.87 t in January and reduced to values lower than 0.30 in July and August. The corresponding CO2 and NOx emissions moved from about 2.6 to 1.2 t/month and from 41.8 to 11.8 kg/month, respectively.
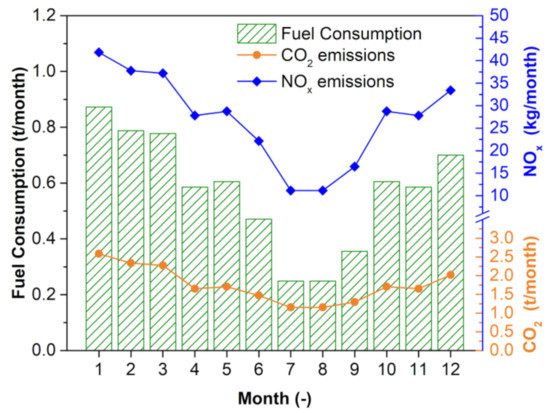
Figure 15.
Fuel consumption, CO2, and NOx emissions on a monthly basis for the micro-CHP system. Five apartments and thermal-driven strategy.
Table 4 shows the annual balance and the main global performances. A very low thermal dumping was found. The yearly natural gas consumption (mng) was 958.6 m3, and it is evaluated as:
where Qab is the auxiliary boiler integration, ηab corresponds to the efficiency of the boiler (90%), and Hi,ng is the lower heating value of natural gas (35.9 MJ/Nm3).
Table 4.
Yearly energy performance for the selected configuration.
In this way, the proposed biodiesel CHP system guaranteed a primary energy saving index and an energy utilisation factor equal to 22.4% and 83.1%, respectively. The annual thermal self-consumption was around 81%, whereas the thermal surplus was about 7% of the heat production. The yearly electrical integration was 49.5% of the corresponding electrical energy demand, whereas the percentage of the electrical surplus amounted to 67.6%.
The proposed biodiesel CHP system presented a payback period equal to 5.3 years and a net present value of about EUR 17,600 at 20 years. On an annual basis, the fuel consumption was 6.8 t, whereas CO2, NOx, and GHG emissions were 21.0 t, 0.3 t, and 21.4 tCO2,eq, respectively, and future investigations will be carried out on different fuel blends to reduce the environmental impact of the investigated CHP system and improve its energy and economic performance.
3.4. Sensitivity Analysis
The previous analysis demonstrated that the biodiesel CHP unit represented an interesting option to satisfy the energy requests of micro-scale users. For this reason, a sensitivity investigation was performed to evaluate the influence of the possible variation in costs of energy vectors and cogeneration units on the economic feasibility of the system. In particular, the specific cost of the CHP apparatus varied from 1000 €/kWel to 2000 €/kWel, the biodiesel price ranged between 50 c€/L and 80 c€/L, and the changes in the specific rates of electric and thermal energy were within 17–23 c€/kWhel and 7–13 c€/kWhth, respectively. In particular, electric cost refers to the expense of the electricity withdrawn from the grid, and thermal cost accounts for the rate of natural gas used in the auxiliary boiler.
Figure 16 shows the results in terms of PBT maps. As expected, the payback period increased with the rise in the specific cost of both biodiesel and micro-CHP units (Figure 16a). A wide area of profitability was observed, with PBT values of less than seven years. The payback time reduced to less than three years when the biodiesel and CHP specific costs were lower than 55 c€/L and 1200 €/kWel, respectively. Conversely, for a biofuel rate equal to 80 c€/L and a CHP cost higher than 1400 €/kWel, the yearly expenses increased, and the PBT surpassed 10 years.
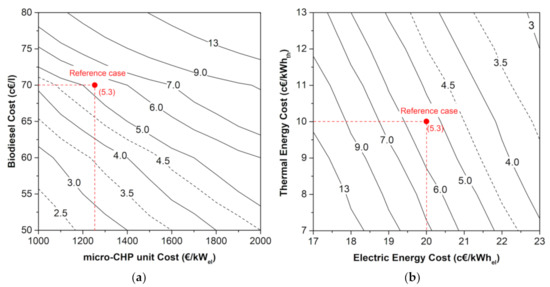
Figure 16.
Payback period maps: (a) influence of the specific cost of CHP and biodiesel; (b) effect of the cost of electric and thermal energy.
Similarly, Figure 16b highlights the PBT as a function of the specific cost of electric and thermal energy. The high self-consumption guaranteed an improvement in the economic performance of the investigated system when the prices of electric and thermal energy rose. A PBT of less than three years can be observed for the maximum energy rates (23 c€/kWhel and 13 c€/kWhth), whereas the payback exceeded 13 years for electric and thermal costs lower than 18 c€/kWhel and 8 c€/kWhth, respectively.
The analysis reveals that the investigated biodiesel CHP system represents a promising technical solution for micro-scale CHP applications in the residential sector with interesting economic and energy performance able to promote the exploitation of renewable sources and the self-sustainability of small users. In fact, the relatively low payback period of the optimised technical solution was achieved without considering incentives for renewable sources. Further improvements are expected for the next years due to the possible development in the biodiesel production process and related exploitation technologies. In addition, the fully renewable nature of the CHP unit and the low environmental impact will help in fostering the transition towards distributed energy systems and independent smart grid communities.
4. Conclusions
The paper aimed to analyse the energy performance and the economic viability of a fully renewable micro-CHP unit for domestic applications. The system is based on a biodiesel-fuelled internal combustion engine that provides 6.7 kWel electric power and 11.3 kWth thermal power. A 0D single-zone thermodynamic model was proposed and validated to estimate the behaviour and the environmental impact of the system at full and partial loads. The validation was carried out through experimental data available in the literature and a good fit was found for all the investigated parameters (brake thermal efficiency, brake specific fuel consumption, cylinder pressure, heat release rate, and NOx emissions).
Polynomial normalised correlations as a function of the electric load were defined to characterise the main biodiesel-fuelled CHP performance parameters. The comparison with literature data showed good agreement and permitted the evaluation of the system behaviour of micro-scale biodiesel CHP engines.
Afterwards, a case study was investigated. Particularly, the numerical model was used to estimate the energy performance of the micro-CHP unit in satisfying the energy and thermal request of typical residential users located in Southern Italy. An auxiliary boiler was considered to produce thermal energy when the CHP was unable to meet the peaks of request. In order to find the best fit between the CHP biodiesel-fired engine and the final users from an energetic and economic point of view, a parametric analysis was carried out for different number of apartments. Furthermore, two operation strategies were compared: thermal- and electric-driven modes. An optimisation procedure was developed to find the most suitable number of apartments and operating controls, considering the primary energy saving index and the payback period as objective parameters. The criterion suggested adopting the thermal-driven strategy and five apartments. Conversely, the electric-driven strategy turned out to be economically unfavourable with a payback time higher than the considered investment period (20 years). The payback period of the selected configuration was close to five years and the primary energy saving index was higher than 22%. The optimised system revealed a significant energy self-consumption: 81.3% of the thermal request and 50.5% of the electric demand on a yearly basis, reaching at least 68.6% of the electric load in the period from October to May. Furthermore, low electric surplus and thermal dumping was obtained. It is worth noting that high self-consumption and low excess production are crucial to reducing the dependence of the energy system on the electric grid and, at the same time, to saving fossil fuel. The yearly CO2, NOx, and GHG emissions were equal to 21.0 t, 0.3 t, and 21.4 tCO2,eq, respectively, and future works will be performed on fuel blends based on renewable and traditional fuels to reduce the environmental impact of the investigated CHP system.
Moreover, in order to take into account the increasing development of biodiesel CHP technology, a sensitivity analysis was carried out to investigate the influence of the expected decrease in the biodiesel-driven CHP cost and the effect of the energy vector costs. The results showed that specific cost values higher than 80 c€/L for the biofuel and 2000 €/kWel for the CHP unit led to economically unfavourable investments. However, a wide area of profitability was found, with a payback period of less than seven years, whereas a biodiesel-specific cost of less than 55 c€/L and micro-CHP units with a specific cost lower than 1200 €/kWel reduced the payback period to values of less than three years.
To conclude, the payback time close to five years and the high energy performance of the selected configuration showed that the biodiesel-driven CHP system represents for the investigated users a technical solution capable of promoting the exploitation of renewable sources and self-sustainability, helping to foster the transition towards diffuse energy systems based on renewable sources. The operation of the CHP engine with different blends of biofuel and conventional diesel fuel and the integration of the technology in polygeneration and multi-source energy systems will be the focus of future investigations.
Author Contributions
Conceptualisation, A.A. and P.M.; methodology, A.A., D.P., and P.M.; software, D.P.; validation, A.A., D.P., and P.M.; formal analysis, A.A. and P.M.; investigation, A.A., D.P., P.M., and T.C.; resources, A.A., D.P., P.M., and T.C.; data curation, A.A., D.P., and P.M.; writing—original draft preparation, A.A., D.P., and P.M.; writing—review and editing, A.A., D.P., and P.M.; visualisation, A.A., D.P., and P.M.; supervision, A.A. and P.M.; funding acquisition, A.A. and P.M. All authors have read and agreed to the published version of the manuscript.
Funding
This research received no external funding.
Institutional Review Board Statement
Not applicable.
Informed Consent Statement
Not applicable.
Data Availability Statement
The data presented in this study are available on request from the corresponding author.
Conflicts of Interest
The authors declare no conflict of interests.
Nomenclature
| A | Area (m2) |
| a | Coefficient (-) |
| B | Bore (m) |
| b | Coefficient (-) |
| bmep | Brake mean effective pressure (bar) |
| Cd | Injector discharge coefficient (-) |
| d | Diameter (mm) |
| E | Electric energy (kWh) |
| Ea | Activation energy (J/mol) |
| fmep | Friction mean effective pressure (bar) |
| Hi | Lower heating value (J/kg) |
| h | Heat transfer coefficient (W/m2 K) |
| k | Thermal conductivity (W/m K) |
| Normalised load factor (%) | |
| m | Mass (kg) |
| Mass flow rate (kg/s) | |
| N | Engine speed (rpm) |
| Nap | Apartments number (-) |
| Nh | Number of injector orifices (-) |
| P | Power (W) |
| p | Pressure (Pa or bar) |
| Q | Thermal energy (kWh) |
| Thermal power (W) | |
| R | Universal gas constant (J/mol K) |
| Re | Reynolds number (-) |
| Sfc | Specific fuel consumption (g/kWh) |
| Normalised fuel consumption (%) | |
| Sp | Mean piston speed (m/s) |
| T | Temperature (K) |
| t | Time (s) |
| U | Internal energy (J) |
| V | Volume (m3) |
| Vd | Displacement (cm3) |
| Greek Characters | |
| α | Wiebe coefficient (-) |
| β | Fuel burned fraction (-) |
| Δ | Difference (-) |
| ϕ | NOx re-entrainment coefficient (-) |
| γ | Specific heat ratio (-) |
| η | Efficiency (-) |
| Normalised efficiency (%) | |
| ρ | Density (kg/m3) |
| σ | Wiebe shape factor (-) |
| τ | Ignition delay (s) |
| υ | Kinematic viscosity (m2/s) |
| Subscripts and Superscripts | |
| ab | Auxiliary boiler |
| ad | Adiabatic |
| b | Brake |
| cool | Cooling system |
| e | Effective |
| el | Electric |
| em | Electro-mechanical |
| exh | Exhaust |
| f | Fuel |
| fr | Friction |
| full | Electric full load |
| h | Generic hour |
| he | Heat exchanger |
| i | Generic configuration |
| in | Indicated |
| inj | Injected |
| max | Maximum |
| min | Minimum |
| misc | Miscellaneous |
| ng | Natural gas |
| oil | Oil |
| p | Purchased |
| r | Request |
| ref | Reference |
| s | Surplus |
| st | Start |
| th | Thermal |
| w | Wall |
| Acronyms | |
| ATDC | After top dead centre |
| CA | Crank angle |
| BSFC | Brake specific fuel consumption |
| BTDC | Before top dead centre |
| BTE | Brake thermal efficiency |
| CHP | Combined heat and power |
| CO | Carbon monoxide |
| CO2 | Carbon dioxide |
| CN | Cetane number |
| EOC | End of combustion |
| EUF | Energy utilisation factor |
| GHG | Greenhouse gas |
| HC | Hydrocarbon |
| HRR | Heat release rate |
| ICE | Internal combustion engine |
| ID | Ignition delay |
| NOx | Nitrogen oxides |
| NPV | Net present value |
| PBT | Payback time |
| PES | Primary energy saving |
| SOC | Start of combustion |
| TDC | Top dead centre |
References
- Kryzia, D.; Kuta, M.; Matuszewska, D.; Olczak, P. Analysis of the Potential for Gas Micro-Cogeneration Development in Poland Using the Monte Carlo Method. Energies 2020, 13, 3140. [Google Scholar] [CrossRef]
- Rosato, A.; Ciervo, A.; Ciampi, G.; Scorpio, M.; Sibilio, S. Integration of Micro-Cogeneration Units and Electric Storages into a Micro-Scale Residential Solar District Heating System Operating with a Seasonal Thermal Storage. Energies 2020, 13, 5456. [Google Scholar] [CrossRef]
- Amber, K.; Day, T.; Ratyal, N.; Kiani, A.; Ahmad, R. Techno, Economic and Environmental Assessment of a Combined Heat and Power (CHP) System—A Case Study for a University Campus. Energies 2018, 11, 1133. [Google Scholar] [CrossRef]
- Chen, X.; Si, Y.; Liu, C.; Chen, L.; Xue, X.; Guo, Y.; Mei, S. The Value and Optimal Sizes of Energy Storage Units in Solar-Assist Cogeneration Energy Hubs. Appl. Sci. 2020, 10, 4994. [Google Scholar] [CrossRef]
- Li, D.; Xu, X.; Yu, D.; Dong, M.; Liu, H. Rule Based Coordinated Control of Domestic Combined Micro-CHP and Energy Storage System for Optimal Daily Cost. Appl. Sci. 2017, 8, 8. [Google Scholar] [CrossRef]
- Amelio, M.; Morrone, P. Residential cogeneration and trigeneration. In Current Trends and Future Developments on (Bio-) Membranes; Elsevier: Amsterdam, The Netherlands, 2020; pp. 141–175. ISBN 978-0-12-817807-2. [Google Scholar]
- Algieri, A.; Andiloro, S.; Tamburino, V.; Zema, D.A. The Potential of Agricultural Residues for Energy Production in Calabria (Southern Italy). Renew. Sustain. Energy Rev. 2019, 104, 1–14. [Google Scholar] [CrossRef]
- Martinez, S.; Michaux, G.; Salagnac, P.; Bouvier, J.-L. Micro-Combined Heat and Power Systems (Micro-CHP) Based on Renewable Energy Sources. Energy Convers. Manag. 2017, 154, 262–285. [Google Scholar] [CrossRef]
- Kalantzis, N.; Pezouvanis, A.; Ebrahimi, K.M. Internal Combustion Engine Model for Combined Heat and Power (CHP) Systems Design. Energies 2017, 10, 1948. [Google Scholar] [CrossRef]
- Cheekatamarla, P.; Abu-Heiba, A. A Comprehensive Review and Qualitative Analysis of Micro-Combined Heat and Power Modeling Approaches. Energies 2020, 13, 3581. [Google Scholar] [CrossRef]
- Mikalsen, R. Internal combustion and reciprocating engine systems for small and micro combined heat and power (CHP) applications. In Small and Micro Combined Heat and Power (CHP) Systems; Elsevier: Amsterdam, The Netherlands, 2011; pp. 125–146. ISBN 978-1-84569-795-2. [Google Scholar]
- Rodríguez-Fernández, J.; Hernández, J.J.; Calle-Asensio, A.; Ramos, Á; Barba, J. Selection of Blends of Diesel Fuel and Advanced Biofuels Based on Their Physical and Thermochemical Properties. Energies 2019, 12, 2034. [Google Scholar] [CrossRef]
- Algieri, B. The Influence of Biofuels, Economic and Financial Factors on Daily Returns of Commodity Futures Prices. Energy Policy 2014, 69, 227–247. [Google Scholar] [CrossRef]
- Agarwal, A.K. Biofuels (Alcohols and Biodiesel) Applications as Fuels for Internal Combustion Engines. Prog. Energy Combust. Sci. 2007, 33, 233–271. [Google Scholar] [CrossRef]
- Capuano, D.; Costa, M.; Di Fraia, S.; Massarotti, N.; Vanoli, L. Direct Use of Waste Vegetable Oil in Internal Combustion Engines. Renew. Sustain. Energy Rev. 2017, 69, 759–770. [Google Scholar] [CrossRef]
- Basha, S.A.; Gopal, K.R.; Jebaraj, S. A Review on Biodiesel Production, Combustion, Emissions and Performance. Renew. Sustain. Energy Rev. 2009, 13, 1628–1634. [Google Scholar] [CrossRef]
- Raman, L.A.; Deepanraj, B.; Rajakumar, S.; Sivasubramanian, V. Experimental Investigation on Performance, Combustion and Emission Analysis of a Direct Injection Diesel Engine Fuelled with Rapeseed Oil Biodiesel. Fuel 2019, 246, 69–74. [Google Scholar] [CrossRef]
- Saravanan, S.; Nagarajan, G.; Lakshmi Narayana Rao, G.; Sampath, S. Combustion Characteristics of a Stationary Diesel Engine Fuelled with a Blend of Crude Rice Bran Oil Methyl Ester and Diesel. Energy 2010, 35, 94–100. [Google Scholar] [CrossRef]
- Raheman, H.; Ghadge, S.V. Performance of Diesel Engine with Biodiesel at Varying Compression Ratio and Ignition Timing. Fuel 2008, 87, 2659–2666. [Google Scholar] [CrossRef]
- Ge, J.C.; Choi, N.J. Soot Particle Size Distribution, Regulated and Unregulated Emissions of a Diesel Engine Fueled with Palm Oil Biodiesel Blends. Energies 2020, 13, 5736. [Google Scholar] [CrossRef]
- Karami, R.; Rasul, M.G.; Khan, M.M.K. CFD Simulation and a Pragmatic Analysis of Performance and Emissions of Tomato Seed Biodiesel Blends in a 4-Cylinder Diesel Engine. Energies 2020, 13, 3688. [Google Scholar] [CrossRef]
- Paredes Rojas, J.C.; Torres San Miguel, C.R.; Vázquez Medina, R.; Leal Naranjo, J.A.; Ortiz Hernàndez, F.E.; Costa Castelló, R. Pollutant Emissions and Combustion Efficiency Assessment of Engines Using Biodiesel. Appl. Sci. 2020, 10, 8646. [Google Scholar] [CrossRef]
- Scopus Document Search. Available online: https://www.scopus.com (accessed on 16 October 2020).
- McCarthy, P.; Rasul, M.G.; Moazzem, S. Analysis and Comparison of Performance and Emissions of an Internal Combustion Engine Fuelled with Petroleum Diesel and Different Bio-Diesels. Fuel 2011, 90, 2147–2157. [Google Scholar] [CrossRef]
- Lahane, S.; Subramanian, K.A. Effect of Different Percentages of Biodiesel–Diesel Blends on Injection, Spray, Combustion, Performance, and Emission Characteristics of a Diesel Engine. Fuel 2015, 139, 537–545. [Google Scholar] [CrossRef]
- Özener, O.; Yüksek, L.; Ergenç, A.T.; Özkan, M. Effects of Soybean Biodiesel on a DI Diesel Engine Performance, Emission and Combustion Characteristics. Fuel 2014, 115, 875–883. [Google Scholar] [CrossRef]
- Ndayishimiye, P.; Tazerout, M. Use of Palm Oil-Based Biofuel in the Internal Combustion Engines: Performance and Emissions Characteristics. Energy 2011, 36, 1790–1796. [Google Scholar] [CrossRef]
- Rosa, H.A.; Wazilewski, W.T.; Secco, D.; Chaves, L.I.; Veloso, G.; de Souza, S.N.M.; da Silva, M.J.; Santos, R.F. Biodiesel Produced from Crambe Oil in Brazil—A Study of Performance and Emissions in a Diesel Cycle Engine Generator. Renew. Sustain. Energy Rev. 2014, 38, 651–655. [Google Scholar] [CrossRef]
- Öztürk, E. Performance, Emissions, Combustion and Injection Characteristics of a Diesel Engine Fuelled with Canola Oil–Hazelnut Soapstock Biodiesel Mixture. Fuel Process. Technol. 2015, 129, 183–191. [Google Scholar] [CrossRef]
- Khatri, K.K.; Sharma, D.; Soni, S.L.; Tanwar, D. Experimental Investigation of CI Engine Operated Micro-Trigeneration System. Appl. Therm. Eng. 2010, 30, 1505–1509. [Google Scholar] [CrossRef]
- Oberweis, S.; Al-Shemmeri, T.T. Effect of Biodiesel Blending on Emissions and Efficiency in a Stationary Diesel Engine. REPQJ 2010, 1, 304–310. [Google Scholar] [CrossRef]
- Caligiuri, C.; Renzi, M.; Bietresato, M.; Baratieri, M. Experimental Investigation on the Effects of Bioethanol Addition in Diesel-Biodiesel Blends on Emissions and Performances of a Micro-Cogeneration System. Energy Convers. Manag. 2019, 185, 55–65. [Google Scholar] [CrossRef]
- Magno, A.; Mancaruso, E.; Vaglieco, B.M. Effects of a Biodiesel Blend on Energy Distribution and Exhaust Emissions of a Small CI Engine. Energy Convers. Manag. 2015, 96, 72–80. [Google Scholar] [CrossRef]
- Rajak, U.; Nashine, P.; Singh, T.S.; Verma, T.N. Numerical Investigation of Performance, Combustion and Emission Characteristics of Various Biofuels. Energy Convers. Manag. 2018, 156, 235–252. [Google Scholar] [CrossRef]
- Prabhakaran, P.; Saravanan, C.G.; Vallinayagam, R.; Vikneswaran, M.; Muthukumaran, N.; Ashok, K. Investigation of Swirl Induced Piston on the Engine Characteristics of a Biodiesel Fueled Diesel Engine. Fuel 2020, 279, 118503. [Google Scholar] [CrossRef]
- Hassan, N.M.S.; Rasul, M.G.; Harch, C.A. Modelling and Experimental Investigation of Engine Performance and Emissions Fuelled with Biodiesel Produced from Australian Beauty Leaf Tree. Fuel 2015, 150, 625–635. [Google Scholar] [CrossRef]
- Karami, R.; Rasul, M.G.; Khan, M.M.K.; Mahdi Salahi, M.; Anwar, M. Experimental and Computational Analysis of Combustion Characteristics of a Diesel Engine Fueled with Diesel-Tomato Seed Oil Biodiesel Blends. Fuel 2021, 285, 119243. [Google Scholar] [CrossRef]
- Cho, S.; Park, J.; Song, C.; Oh, S.; Lee, S.; Kim, M.; Min, K. Prediction Modeling and Analysis of Knocking Combustion Using an Improved 0D RGF Model and Supervised Deep Learning. Energies 2019, 12, 844. [Google Scholar] [CrossRef]
- Torres-Jimenez, E.; Dorado, R.; Kegl, B.; Kegl, M. One-Dimensional Modeling and Simulation of Injection Processes of Bioethanol-Biodiesel and Bioethanol-Diesel Fuel Blends. Fuel 2018, 227, 334–344. [Google Scholar] [CrossRef]
- Algieri, A.; Bova, S.; De Bartolo, C.; Nigro, A. Numerical and Experimental Analysis of the Intake Flow in a High Performance Four-Stroke Motorcycle Engine: Influence of the Two-Equation Turbulence Models. J. Eng. Gas. Turbines Power 2007, 129, 1095–1105. [Google Scholar] [CrossRef]
- Gombosuren, N.; Yoshifumi, O.; Hiroyuki, A. A Charge Possibility of an Unfueled Prechamber and Its Fluctuating Phenomenon for the Spark Ignited Engine. Energies 2020, 13, 303. [Google Scholar] [CrossRef]
- Nigro, A.; Algieri, A.; De Bartolo, C.; Bova, S. Fluid Dynamic Investigation of Innovative Intake Strategies for Multivalve Internal Combustion Engines. Int. J. Mech. Sci. 2017, 123, 297–310. [Google Scholar] [CrossRef]
- Ngayihi Abbe, C.V.; Nzengwa, R.; Danwe, R.; Ayissi, Z.M.; Obonou, M. A Study on the 0D Phenomenological Model for Diesel Engine Simulation: Application to Combustion of Neem Methyl Esther Biodiesel. Energy Convers. Manag. 2015, 89, 568–576. [Google Scholar] [CrossRef]
- Gogoi, T.K.; Baruah, D.C. A Cycle Simulation Model for Predicting the Performance of a Diesel Engine Fuelled by Diesel and Biodiesel Blends. Energy 2010, 35, 1317–1323. [Google Scholar] [CrossRef]
- Guardiola, C.; López, J.J.; Martín, J.; García-Sarmiento, D. Semiempirical In-Cylinder Pressure Based Model for NOX Prediction Oriented to Control Applications. Appl. Therm. Eng. 2011, S1359431111003164. [Google Scholar] [CrossRef]
- Ispra. National Inventory Report 2020 - Italian Greenhouse Gas Inventory 1990–2018. Available online: http://www.sinanet.isprambiente.it/it/sia-ispra (accessed on 16 October 2020).
- Ispra. Fattori Di Emissione Atmosferica Di Gas a Effetto Serra Nel Settore Elettrico Nazionale e Nei Principali Paesi Europei. Edizione 2020. Available online: https://www.isprambiente.gov.it/it/pubblicazioni/rapporti/fattori-di-emissione-atmosferica-di-gas-a-effetto-serra-nel-settore-elettrico-nazionale-e-nei-principali-paesi-europei.-edizione-2020 (accessed on 16 October 2020).
- Qi, D.H.; Chen, H.; Geng, L.M.; Bian, Y.Z. Experimental Studies on the Combustion Characteristics and Performance of a Direct Injection Engine Fueled with Biodiesel/Diesel Blends. Energy Convers. Manag. 2010, 51, 2985–2992. [Google Scholar] [CrossRef]
- Liu, J.; Dumitrescu, C.E. Single and Double Wiebe Function Combustion Model for a Heavy-Duty Diesel Engine Retrofitted to Natural-Gas Spark-Ignition. Appl. Energy 2019, 248, 95–103. [Google Scholar] [CrossRef]
- Heywood, J.B. Internal Combustion Engine Fundamentals, 2nd ed.; McGraw-Hill Education: New York, NY, USA, 2018; ISBN 978-1-260-11610-6. [Google Scholar]
- Klein, M. A Specific Heat Ratio Model and Compression Ratio Estimation; Division of Vehicular Systems, Department of Electrical Engineering, Linköping University: Linköping, Sweden, 2004. [Google Scholar]
- Hardenberg, H.O.; Hase, F.W. An Empirical Formula for Computing the Pressure Rise Delay of a Fuel from Its Cetane Number and from the Relevant Parameters of Direct-Injection Diesel Engines. SAE Trans. 1979, 88, 1823–1834. Available online: www.jstor.org/stable/44658184 (accessed on 10 October 2020).
- Gumus, M. A Comprehensive Experimental Investigation of Combustion and Heat Release Characteristics of a Biodiesel (Hazelnut Kernel Oil Methyl Ester) Fueled Direct Injection Compression Ignition Engine. Fuel 2010, 89, 2802–2814. [Google Scholar] [CrossRef]
- Awad, S.; Varuvel, E.G.; Loubar, K.; Tazerout, M. Single Zone Combustion Modeling of Biodiesel from Wastes in Diesel Engine. Fuel 2013, 106, 558–568. [Google Scholar] [CrossRef]
- Rakopoulos, C.D.; Rakopoulos, D.C.; Giakoumis, E.G.; Kyritsis, D.C. Validation and Sensitivity Analysis of a Two Zone Diesel Engine Model for Combustion and Emissions Prediction. Energy Convers. Manag. 2004, 45, 1471–1495. [Google Scholar] [CrossRef]
- Annand, W.J.D. Heat Transfer in the Cylinders of Reciprocating Internal Combustion Engines. Proc. Inst. Mech. Eng. 1963, 177, 973–996. [Google Scholar] [CrossRef]
- Kaplan, J. Modeling the Spark-Ignition Engine Warm-Up Process to Predict Component Temperatures; Department of Mechanical Engineering, Massachusetts Institute of Technology: Cambridge, MA, USA, 1990. [Google Scholar]
- Wu, J.Y.; Wang, J.L.; Li, S.; Wang, R.Z. Experimental and Simulative Investigation of a Micro-CCHP (Micro Combined Cooling, Heating and Power) System with Thermal Management Controller. Energy 2014, 68, 444–453. [Google Scholar] [CrossRef]
- Algieri, A.; Morrone, P. Energetic Analysis of Biomass-Fired ORC Systems for Micro-Scale Combined Heat and Power (CHP) Generation. A Possible Application to the Italian Residential Sector. Appl. Therm. Eng. 2014, 71, 751–759. [Google Scholar] [CrossRef]
- European Commission Commission Delegated Regulation (EU) 2015/2402 of 12 October 2015 Reviewing Harmonised Efficiency Reference Values for Separate Production of Electricity and Heat in Application of Directive 2012/27/EU of the European Parliament and of the Council and Repealing Commission Implementing Decision 2011/877/EU. Available online: https://eur-lex.europa.eu/eli/reg_del/2015/2402/oj (accessed on 15 November 2020).
- Algieri, A.; Morrone, P.; Bova, S. Techno-Economic Analysis of Biofuel, Solar and Wind Multi-Source Small-Scale CHP Systems. Energies 2020, 13, 3002. [Google Scholar] [CrossRef]
- Morrone, P.; Algieri, A.; Castiglione, T. Hybridisation of Biomass and Concentrated Solar Power Systems in Transcritical Organic Rankine Cycles: A Micro Combined Heat and Power Application. Energy Convers. Manag. 2019, 180, 757–768. [Google Scholar] [CrossRef]
- The Oxidation of Nitrogen in Combustion and Explosions. In Selected Works of Yakov Borisovich Zeldovich; Barenblatt, G.I., Sunyaev, R.A., Eds.; Princeton University Press: Princeton, NJ, USA, 1992; Volume 1, pp. 364–403. ISBN 978-1-4008-6297-9. [Google Scholar]
- Tauzia, X.; Maiboom, A.; Karaky, H. Semi-Physical Models to Assess the Influence of CI Engine Calibration Parameters on NOx and Soot Emissions. Appl. Energy 2017, 208, 1505–1518. [Google Scholar] [CrossRef]
- Saravanan, S.; Nagarajan, G.; Anand, S.; Sampath, S. Correlation for Thermal NOx Formation in Compression Ignition (CI) Engine Fuelled with Diesel and Biodiesel. Energy 2012, 42, 401–410. [Google Scholar] [CrossRef]
- Karaky, H.; Mauviot, G.; Tauzia, X.; Maiboom, A. Development and Validation of a New Zero-Dimensional Semi-Physical NOx Emission Model for a D.I. Diesel Engine Using Simulated Combustion Process. SAE Int. J. Engines 2015, 8, 1924–1937. [Google Scholar] [CrossRef]
- Vellaisamy, R.; Clark, N.; Thompson, G.J.; Atkinson, R.J.; Tissera, C.A.; Swartz, M.M. Assessment of NOx Destruction in Diesel Engines by Injecting NO in the Intake Manifold. Proceedings of SAE 2005 World Congress & Exhibition, Detroit, MI, USA, 11–14 April 2005. SAE Technical Paper 2005-01-0370. [Google Scholar] [CrossRef]
- Riley, D.M.; Tian, J.; Güngör-Demirci, G.; Phelan, P.; Villalobos, J.R.; Milcarek, R.J. Techno-Economic Assessment of CHP Systems in Wastewater Treatment Plants. Environments 2020, 7, 74. [Google Scholar] [CrossRef]
- Hodge, B.K. Alternative Energy Systems and Applications, 2nd ed.; John Wiley & Sons: Hoboken, NJ, USA, 2017; ISBN 978-1-119-10921-1. [Google Scholar]
- Neste Market Data. Available online: https://www.neste.com/investors/market-data (accessed on 1 October 2020).
- European Parliament and Council Directive 2012/27/EU of the European Parliament and of the Council of 25 October 2012 on Energy Efficiency, Amending Directives 2009/125/EC and 2010/30/EU and Repealing Directives 2004/8/EC and 2006/32/EC Text with EEA Relevance. Available online: https://eur-lex.europa.eu/legal-content/EN/TXT/PDF/?uri=CELEX:32012L0027&from=EN (accessed on 15 November 2020).
- European Parliament and Council Directive (EU) 2019/944 of the European Parliament and of the Council of 5 June 2019 on Common Rules for the Internal Market for Electricity and Amending Directive 2012/27/EU. Available online: https://eur-lex.europa.eu/legal-content/EN/TXT/PDF/?uri=CELEX:32019L0944&from=EN (accessed on 15 November 2020).
- GSE Dispacciamento Rinnovabili. Available online: https://www.gse.it/servizi-per-te/mercati-energetici/dispacciamento-rinnovabili (accessed on 15 November 2020).
- Simpson, M.C.; Chatzopoulou, M.A.; Oyewunmi, O.A.; Le Brun, N.; Sapin, P.; Markides, C.N. Technoeconomic Analysis of Internal Combustion Engine—Organic Rankine Cycle Systems for Combined Heat and Power in Energy-Intensive Buildings. Appl. Energy 2019, 253, 113462. [Google Scholar] [CrossRef]
- Elsner, W.; Wysocki, M.; Niegodajew, P.; Borecki, R. Experimental and Economic Study of Small-Scale CHP Installation Equipped with Downdraft Gasifier and Internal Combustion Engine. Appl. Energy 2017, 202, 213–227. [Google Scholar] [CrossRef]
- Sorknæs, P.; Østergaard, P.A.; Thellufsen, J.Z.; Lund, H.; Nielsen, S.; Djørup, S.; Sperling, K. The Benefits of 4th Generation District Heating in a 100% Renewable Energy System. Energy 2020, 213, 119030. [Google Scholar] [CrossRef]
- Gustafsson, M.S.; Myhren, J.A.; Dotzauer, E.; Gustafsson, M. Life Cycle Cost of Building Energy Renovation Measures, Considering Future Energy Production Scenarios. Energies 2019, 12, 2719. [Google Scholar] [CrossRef]
- Anca-Couce, A.; Hochenauer, C.; Scharler, R. Bioenergy Technologies, Uses, Market and Future Trends with Austria as a Case Study. Renew. Sustain. Energy Rev. 2021, 135, 110237. [Google Scholar] [CrossRef]
- Lyócsa, Š.; Todorova, N.; Výrost, T. Predicting Risk in Energy Markets: Low-Frequency Data Still Matter. Appl. Energy 2021, 282, 116146. [Google Scholar] [CrossRef]
- Algieri, B.; Leccadito, A. Ask CARL: Forecasting Tail Probabilities for Energy Commodities. Energy Econ. 2019, 84, 104497. [Google Scholar] [CrossRef]
- Saravanan, S.; Nagarajan, G.; Narayana Rao, G.L. Feasibility Analysis of Crude Rice Bran Oil Methyl Ester Blend as a Stationary and Automotive Diesel Engine Fuel. Energy Sustain. Dev. 2009, 13, 52–55. [Google Scholar] [CrossRef]
- Cogengreen EcoGEN CHP Units. Available online: www.cogengreen.com (accessed on 10 November 2020).
- Senertec Dachs. Smart Cogeneration. Available online: www.senertec.com (accessed on 10 November 2020).
- Betz, F.; Archer, D. Biodiesel fueled engine generator with heat recovery: Comparing biodiesel to diesel performance. In Proceedings of the ASME 2009 3rd International Conference on Energy Sustainability, San Francisco, CA, USA, 19–23 July 2009; ASMEDC: San Francisco, CA, USA, 2009; Volume 2, pp. 103–108. [Google Scholar]
- Mongibello, L.; Bianco, N.; Caliano, M.; Graditi, G. Influence of Heat Dumping on the Operation of Residential Micro-CHP Systems. Appl. Energy 2015, 160, 206–220. [Google Scholar] [CrossRef]
- Sasso, M.; Roselli, C.; Sibilio, S.; Possidente, R.; Beausoleil-Morrison, I.; Dorer, V. Performance Assessment of Residential Cogeneration Systems in Southern Italy: A Report of Subtask C of FC+COGEN-SIM The Simulation of Building-Integrated Fuel Cell and Other Cogeneration Systems: Annex 42 of the International Energy Agency Energy Conservation in Buildings and Community Systems Programme; Her Majesty the Queen in Right of Canada: Ottawa, ON, Canada, 2008; ISBN 978-0-662-48049-5. [Google Scholar]
- Dinçer, İ.; Rosen, M.; Ahmadi, P. Optimization of Energy Systems; John Wiley & Sons: Chichester, West Sussex, UK, 2018; ISBN 978-1-118-89450-7. [Google Scholar]
- Algieri, A.; Zema, D.A.; Nicotra, A.; Zimbone, S.M. Potential Energy Exploitation in Collective Irrigation Systems Using Pumps as Turbines: A Case Study in Calabria (Southern Italy). J. Clean. Prod. 2020, 257, 120538. [Google Scholar] [CrossRef]
- Morrone, P.; Algieri, A. Integrated Geothermal Energy Systems for Small-Scale Combined Heat and Power Production: Energy and Economic Investigation. Appl. Sci. 2020, 10, 6639. [Google Scholar] [CrossRef]
- Rezaeiha, A.; Montazeri, H.; Blocken, B. A Framework for Preliminary Large-Scale Urban Wind Energy Potential Assessment: Roof-Mounted Wind Turbines. Energy Convers. Manag. 2020, 214, 112770. [Google Scholar] [CrossRef]
Publisher’s Note: MDPI stays neutral with regard to jurisdictional claims in published maps and institutional affiliations. |
© 2021 by the authors. Licensee MDPI, Basel, Switzerland. This article is an open access article distributed under the terms and conditions of the Creative Commons Attribution (CC BY) license (http://creativecommons.org/licenses/by/4.0/).