Article

A Numerical Analysis of an Innovative Flow Ripple Reduction Method for External Gear Pumps

1
Department of Industrial Engineering, University of Naples Federico II, Via Claudio, 21, 80125 Naples, Italy
2
Department of Engineering, University of Sannio, Piazza Guerrazzi, 82100 Benevento, Italy
*
Author to whom correspondence should be addressed.
Energies 2021, 14(2), 471; https://doi.org/10.3390/en14020471
Submission received: 20 December 2020 / Revised: 1 January 2021 / Accepted: 2 January 2021 / Published: 17 January 2021
(This article belongs to the Special Issue Gear Pumps and Motors)

Abstract

:
In this paper, an innovative solution to minimize noise emission, acting on the flow ripple, in a prototype External Gear Pump (EGP) is presented. Firstly, a new tool capable to completely simulate this pump’s typologies, called EgeMATor, is presented; the hydraulic model, adopted for the simulation, is based on a lumped parameter method using a control volume approach. Starting from the pump drawing, thanks to different subroutines developed in different environments interconnected, it is possible to analyze an EGP. Results have been compared with the outputs of a three-dimensional CFD numerical model built up using a commercial code, already used with success by the authors. In the second section, an innovative solution to reduce the flow ripple is implemented. This technology is called Alternative Capacitive Volumes (ACV) and works by controlling and uniformizing the reverse flow, performing a consistent reduction of flow non-uniformity amplitude. In particular, a high reduction of the flow non-uniformity is notable in the frequency domain on the second fundamental frequency. The technology is easy to accommodate in a pump housing, especially for high-pressure components, and it helps with reducing the fluid-borne noise.

1. Introduction

Nowadays, the scientific community considers it intolerable that millions of people suffer from unacceptable noise level emissions. Every country is doing its best to conform to the more stringent regulations and policies regarding environmental noise emissions. Fluid power technology aims to keep noise limitation as low as possible for industrial and mobile applications. External gear pumps (EGPs) are widely used in fluid power since these pumps have many advantages, like compactness and low costs, relatively high efficiency and remarkable reliability, structural simplicity, and a wide range of operating conditions. Even if the working principle of the EGPs is straightforward, there are many studies available in the literature focused on their performance improvement. An EGP consists of a driving gear, connected to the pump’s shaft and a driven gear (Figure 1) [1,2]. The displacement chambers, generated by the gears meshing, are connected to the ports through two wear-plates.
In recent years, as the world advances more and more towards complete electrification, noise emissions from all fluid power components are becoming crucial. The request of low-noise EGPs has pushed research towards developing innovative design solutions capable of minimizing the kinematic flow ripple. Among them, many solutions improve the standard involute gear design concept using numerical and experimental techniques.
To center this target, numerical models can be an efficient way to analyze the operation of EGPs and predict their performance. Several authors studied the ideal flow behavior of the machines using theoretical models (Ivantysyn et al. [1] and Manring et al. [3]), while others adopted numerical modeling both with lumped parameter and Computational Fluid Dynamic (CFD) approaches. Vacca et al. [4,5,6,7,8] developed a numerical tool to understand EGPs also with asymmetric tooth profiles. In Reference [5], they optimized an EGP using an NSGA-II algorithm to reduce the flow ripple and, as a consequence, the emitted fluid-borne noise. The same authors in a recent study [7] implemented a thermal model on the already developed lumped parameter tool, improving the prediction of the pump operation. Borghi et al. [9,10], studying the EGPs, developed lumped parameter numerical models to predict both the volumetric and hydro-mechanical efficiencies and all their main losses. Mancò et al. [11] studied an EGP using a lumped parameter approach that has been compared with experimental data with high accuracy. Zhou et al. [12] developed a lumped parameter approach to consider the dynamic nature of the gas cavitation process in external gear machines (EGMs). Lumped parameter-based models have many advantages; one of them is that they can also be integrated with mechanical models for the evaluation of gear micromotion, like models done by Zardin et al. [13], Falfari et al. [14], Mucchi et al. [15] and by Vacca et al. [4].
Other studies analyzed EGPs using two-dimensional (2D) modeling approaches with deforming mesh and volume re-meshing in the literature. However, even if the 2D modeling approaches give interesting results, they cannot predict the internal flow behavior like three-dimensional (3D) models [16]. It depends on the fact that the flow is complex during the operation of those machines because of the rotational speed (range of 500–3000 rpm) and the high pressure. Besides, three-dimensional CFD methods are widely used for studying EGPs [17]. Corvaglia et al. [18] showed a new application of a 3D CDF algorithm to predict the unsteady flow rate in hydraulic pipes placed after the pump’s delivery port. The authors compared experimental data and numerical results with excellent agreement. Castilla et al. [19] presented a numerical technique applied on an EGP to predict vortexes’ general shape, generated in the meshing zone, and their distribution. In Reference [20], the same authors introduced a decompression slot in the plates located in correspondence to the meshing zone, using the same tool previously described in Reference [19] for the analysis. Other researchers modified the design of the plates by adding grooves, with the aim of noise reduction. However, even if those grooves can reduce the pump’s fluid-borne noise, they can also significantly affect the volumetric efficiency of the EGP if not well-designed because they connect volumes at different pressures [9]. Grooves’ effects inside the plates have been widely numerically studied by Borghi et al. [21], looking at the reverse flow in the transition area between high- and low-pressure volumes.
In this paper, a Hydreco prototype pump manufactured by Duplomatic MS for industrial applications (theoretical displacement of 53 cm3/rev), with a pressure rated up to 350 bar and a speed range of 450–3500 rev/min, has been studied to minimize noise emission, acting on the flow ripple. The pump has 16 teeth per gear, and the pump rotation is clockwise (right pump). Firstly, the pump has been numerically studied using a tool completely developed by the authors called EgeMATor (External Gear Machine Multi Tool Simulator). The tool used for the hydraulic simulation is a lumped parameter model that, for its nature, is always quicker and suitable for optimization studies, while the 3D CFD numerical model permits, on one side, to support the 0D model and, from the other side, to go deeper in the pump behavior, for example, to study cavitation phenomena. Since the pump is in its prototyping phase, the EgeMATor tool’s results have been validated with a 3D CFD model developed with the commercial code Simerics MP+® (Simerics Inc., Bellevue, WA, USA), showing high accuracy. An innovative technology, later called Alternative Capacitive Volumes (ACV), has been presented. The ACV consists of two volumes used to connect the delivery volume with the displacement chambers cyclically through two opportune orifices: it uniformizes the reverse flow with a high reduction of the flow non-uniformity that is notable, in the frequency domain, in particular on the second fundamental frequency. An optimization process done in EgeMATor has been run to find the best design of the ACV with a reduction of the flow ripple by 61% and a consequent reduction of the fluid-borne noise.

2. The Tool: EgeMATor

2.1. Overview

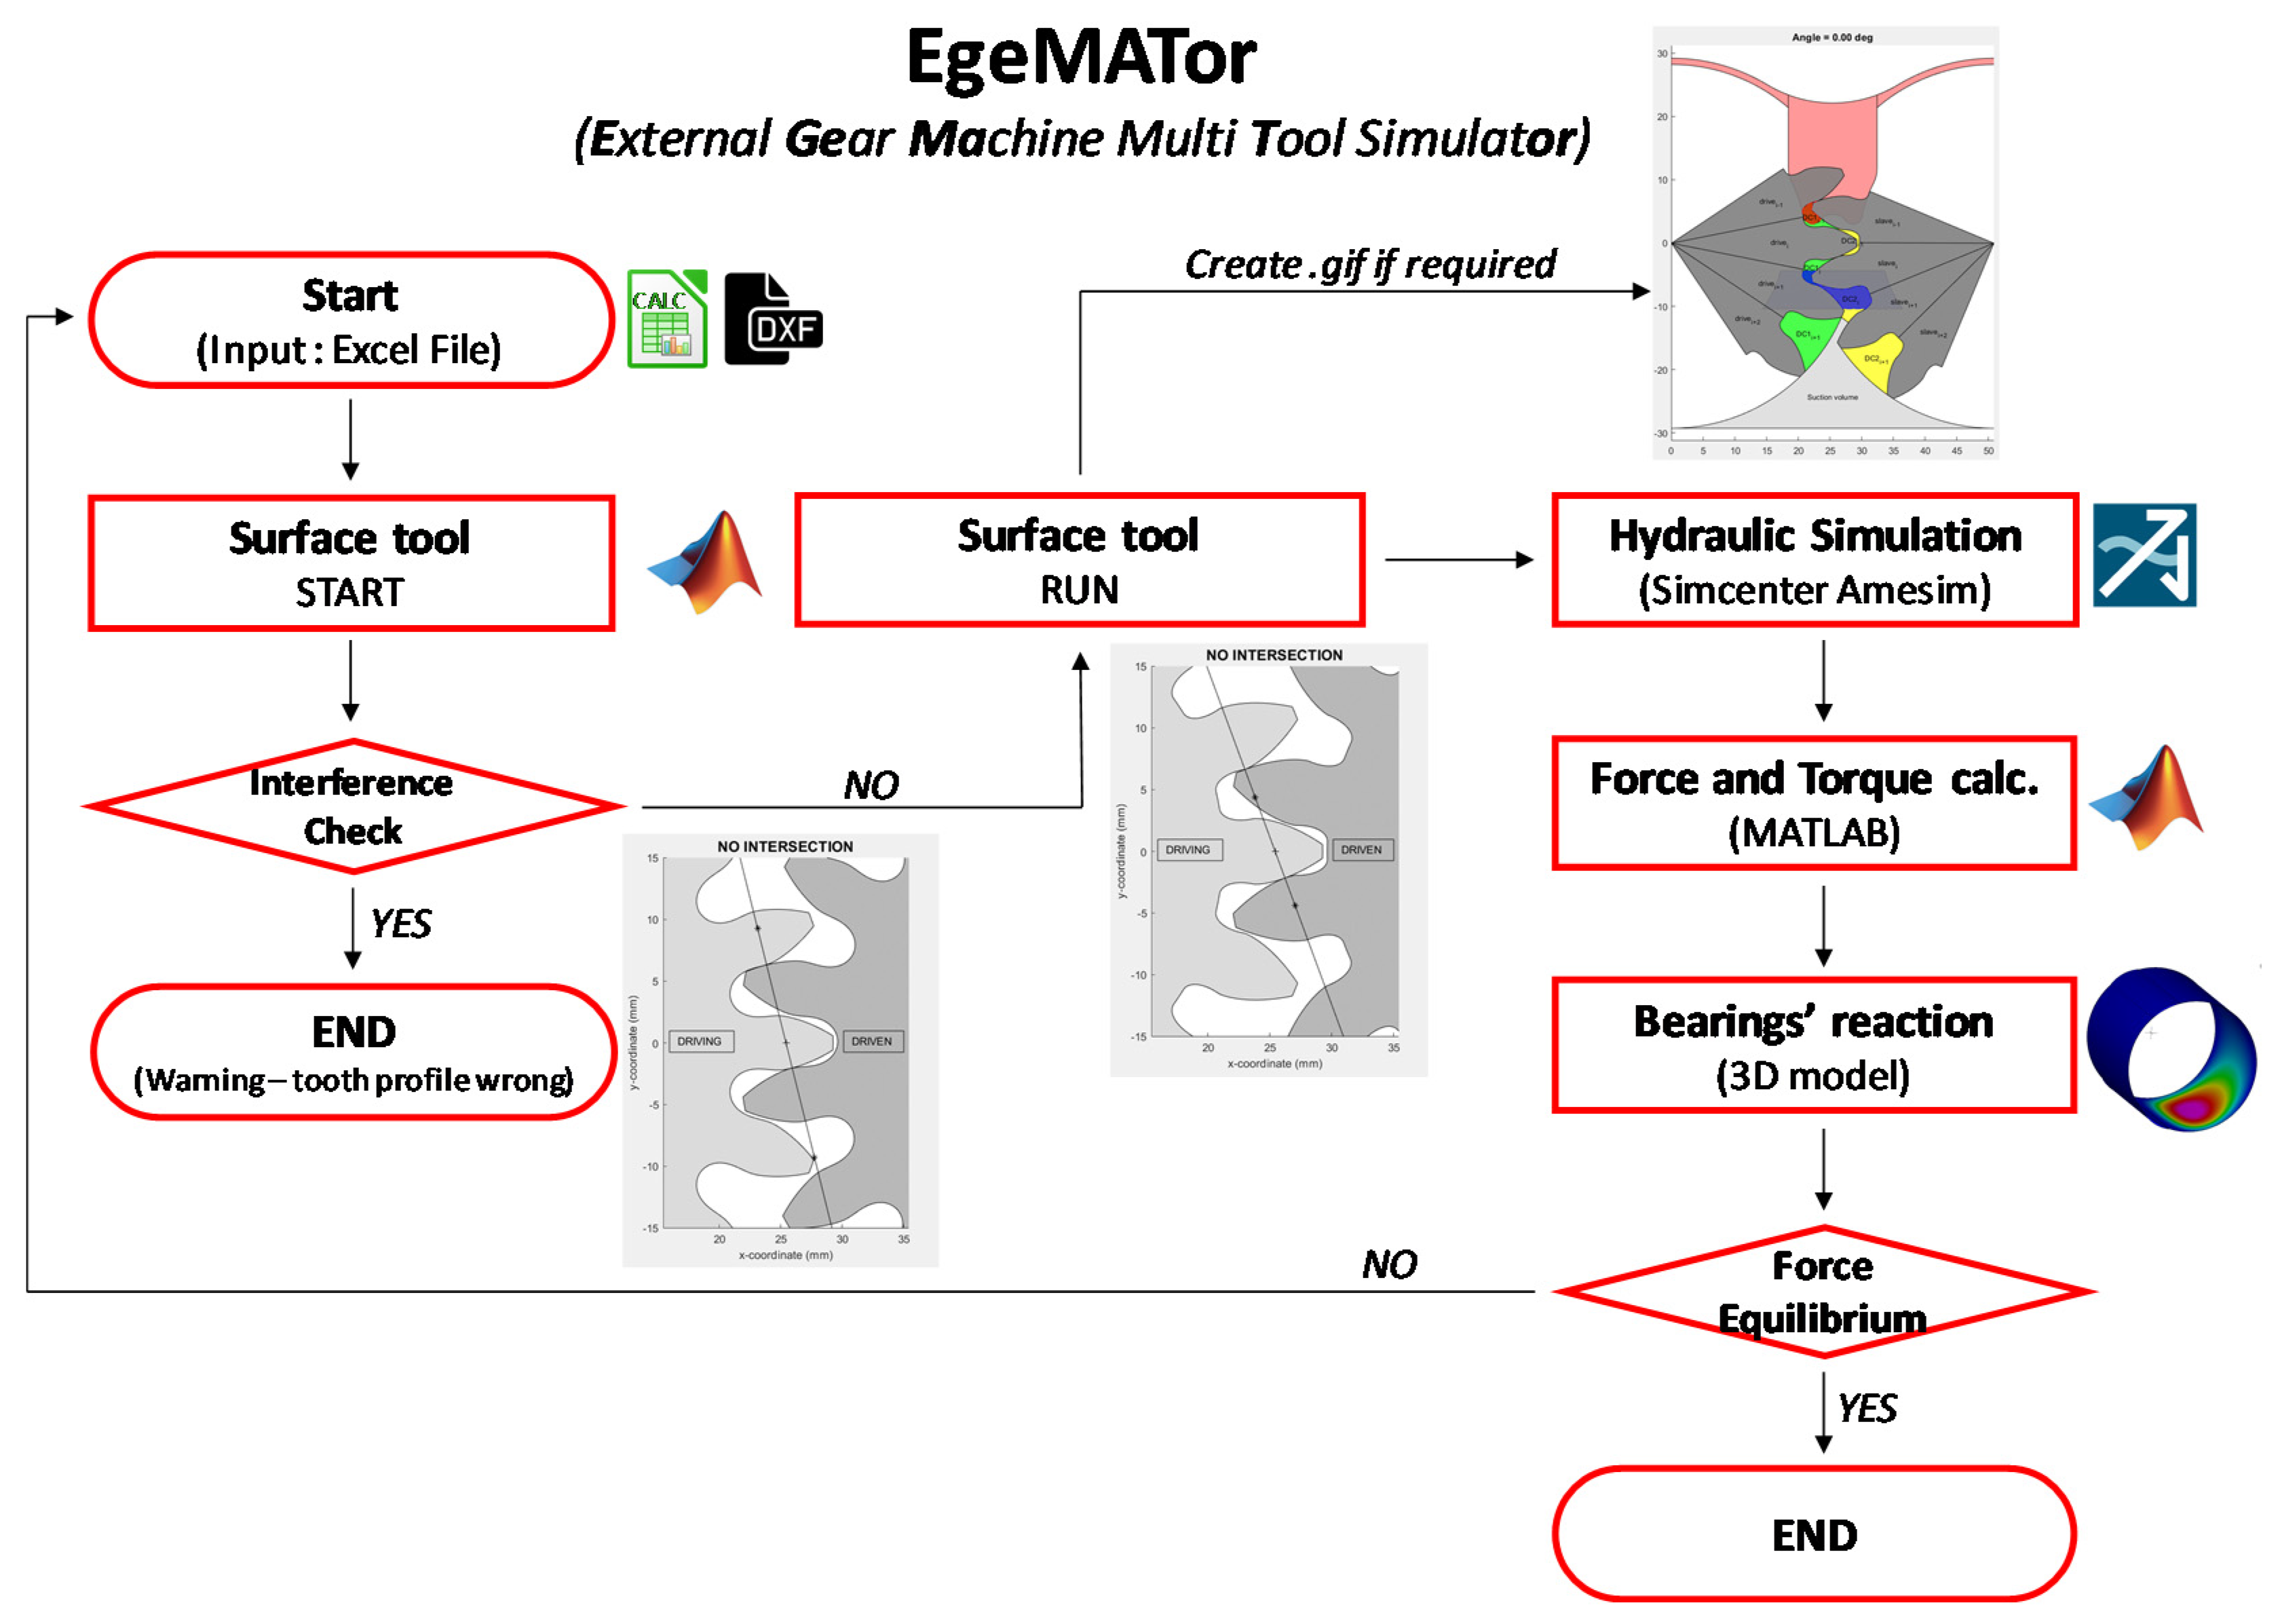
EgeMATor (External Gear Machine Multi Tool Simulator) is a tool completely developed by the authors for numerical simulations of external gear machines. In particular, the tool is composed of different subroutines developed in different environments, interconnected to each other, as visible from its workflow in Figure 2, to study the EGMs in depth.
The hydraulic simulation main subroutine, visible in the previous figure, runs a numerical simulation of the pump, in Simcenter Amesim® (Siemens AG, Munich, Germany), using a lumped parameter method based on the control volume approach. This step is preceded by a code, written in MATLAB® (MathWorks Inc., Natick, MA, USA), called Surface Tool, that provides all the information needed by the hydraulic simulation subroutine, regarding displacement volumes as the gears rotate and their connection with the contiguous elements. Then, after the hydraulic simulation, it is possible to activate a subroutine that calculates gears’ forces and torques. Next, another subroutine runs the bearings reaction calculation; then, results are compared and, if a different gear positioning is necessary, the Surface Tool starts the process again. Further information will be provided in the next section.

2.2. The Surface Tool

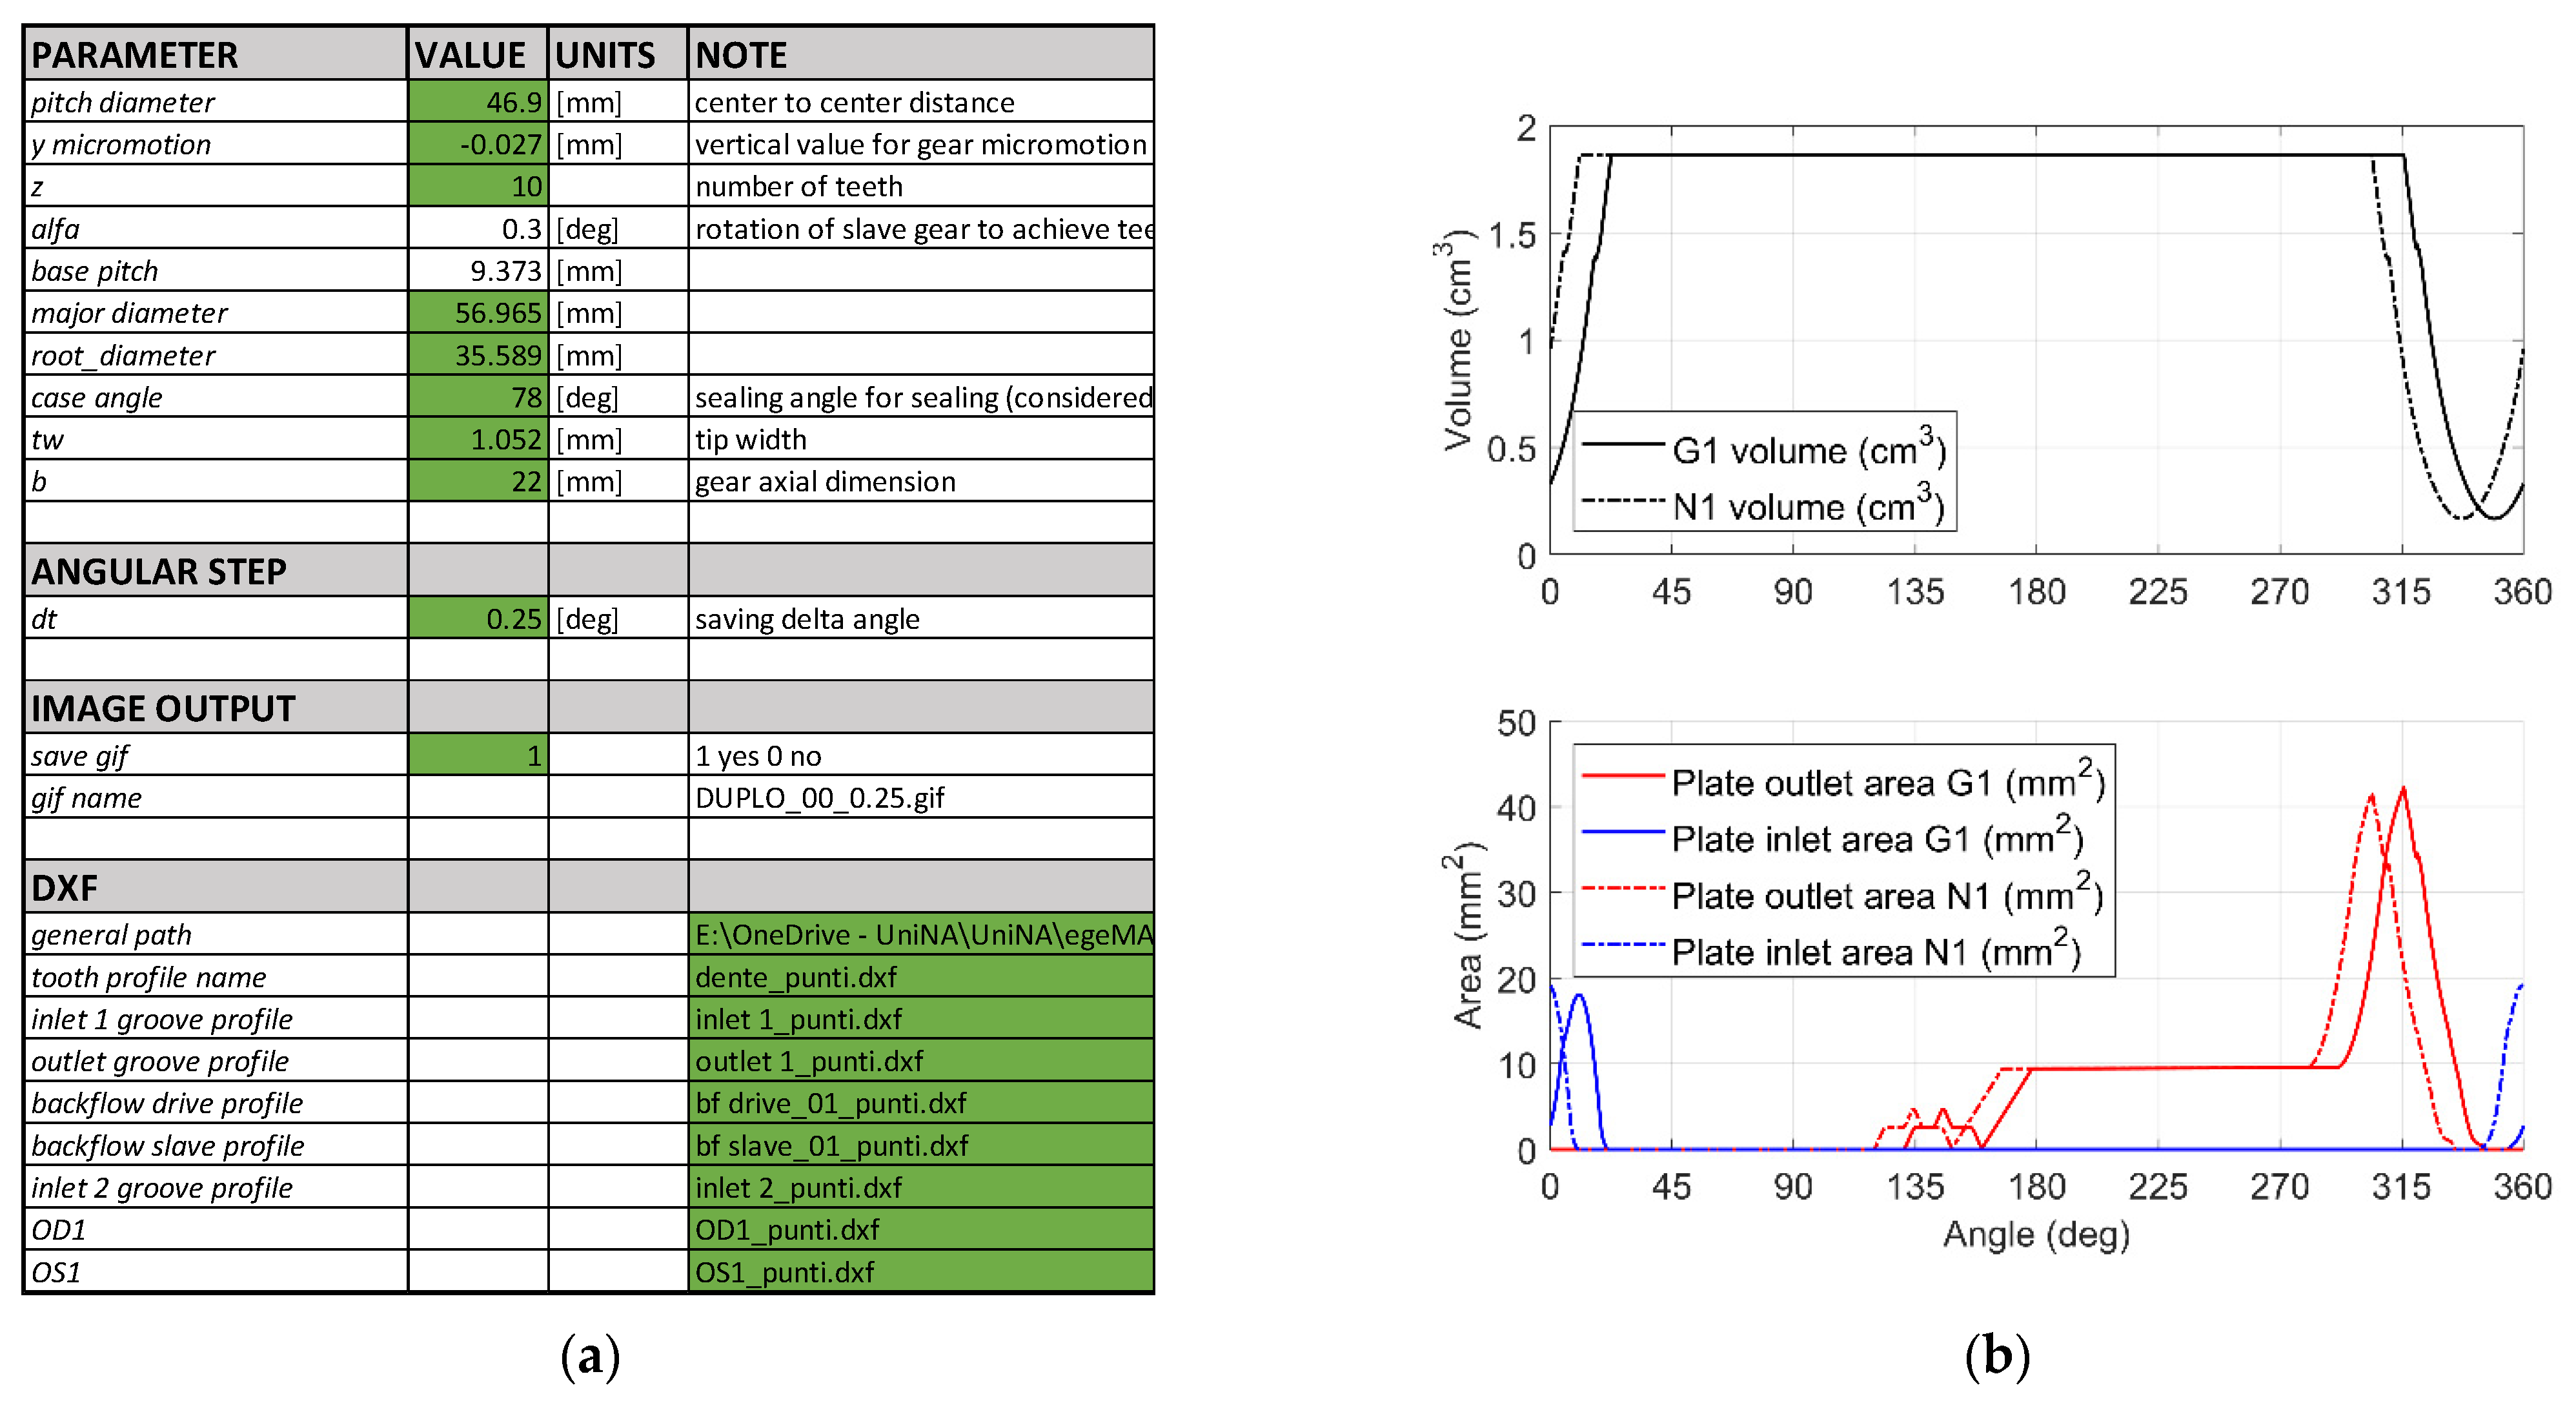
The Surface Tool, the hearth of EgeMATor, needs an excel file for its calculation, with all the pump parameters and drawings of the components to start. An example of this excel file has been shown in Figure 3a, where the pump parameters are defined (such as a number of teeth, gears’ center to center distance, axial dimension, gear micromotion, etc.), and also the folder path containing DXF files (Drawing Exchange Format) of tooth profile and wear-plates’ relief groove geometries is linked. The DXF files, used as input, can be saved directly from a Computer-Aided Design CAD model (only exporting a sketch) or from experimental measurement like a non-contact 3D laser scan arm. The code, written in MATLAB®, locates the right cell of the excel file and uses the relative value during the script running. Firstly, the Surface Tool runs control on the gear engagement with these inputs, checking any interference in the meshing zone. In case of interference, the tool provides a warning; otherwise, it continues its subroutine, generating all the required data files needed by the lumped parameter model. The Surface Tool saves around 100 data files, where every calculated dimension, such as the volumes of the displacement chambers, Gi (driving gear), and Ni (driven gear), are tabled as functions of the angular position (Figure 3b).
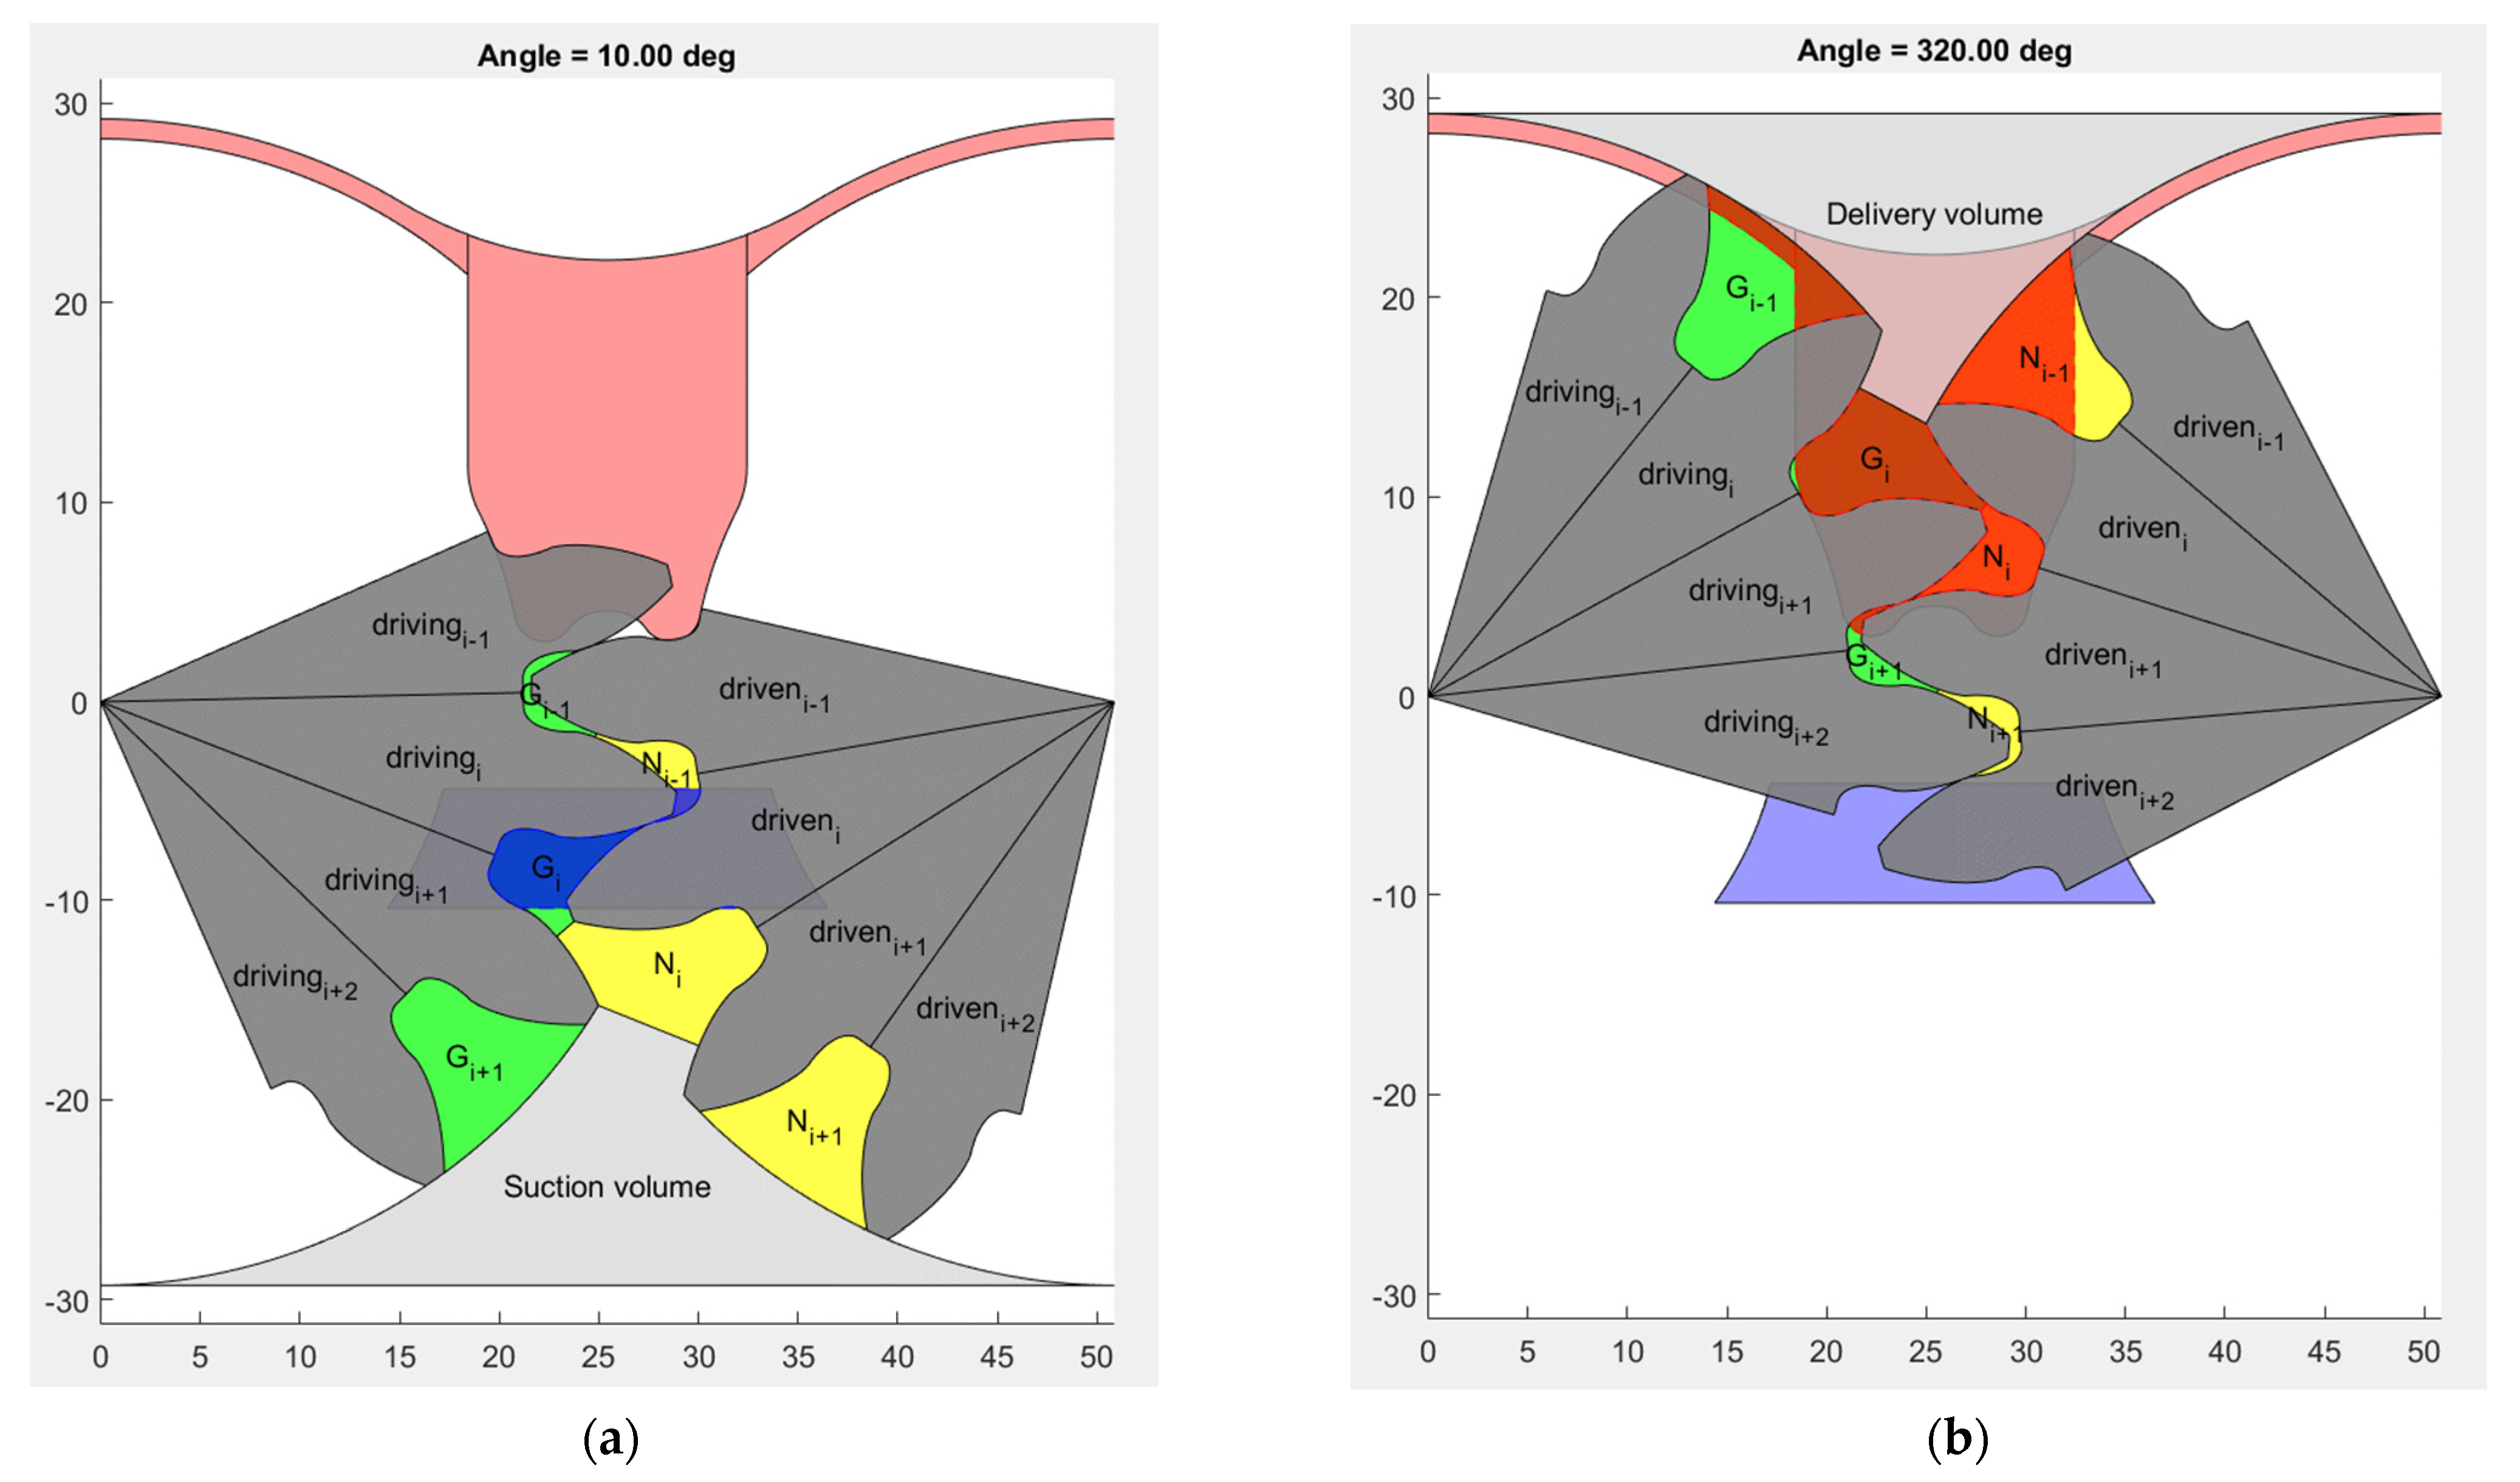
To provide support for the user, helping to visualize the morphology of the displacement chambers and their connections with the wear-plates, the Surface Tool is also capable of optionally generating a GIF (Graphics Interchange Format) animation of gear meshing. The GIF animation frames have been presented in Figure 4 for two different angular positions, where the i-th displacement chambers are visible. In the figure, the Gi and Ni volumes with their previous and following chambers are notable. The wear-plate relief grooves and suction/delivery volume have been added as well.
The tool also provides an estimation of the pump displacement, VE, in accordance with the following formulation: for the analyzed pump, the estimation of the displacement is 52.72 cm3/rev:
V E = z T [ max ( V G i + V N i ) min ( V G i + V N i ) ]
where z T is the number of teeth, VG,i is the volume of the displacement chamber Gi, and VN,i is the volume of the displacement chamber Ni.
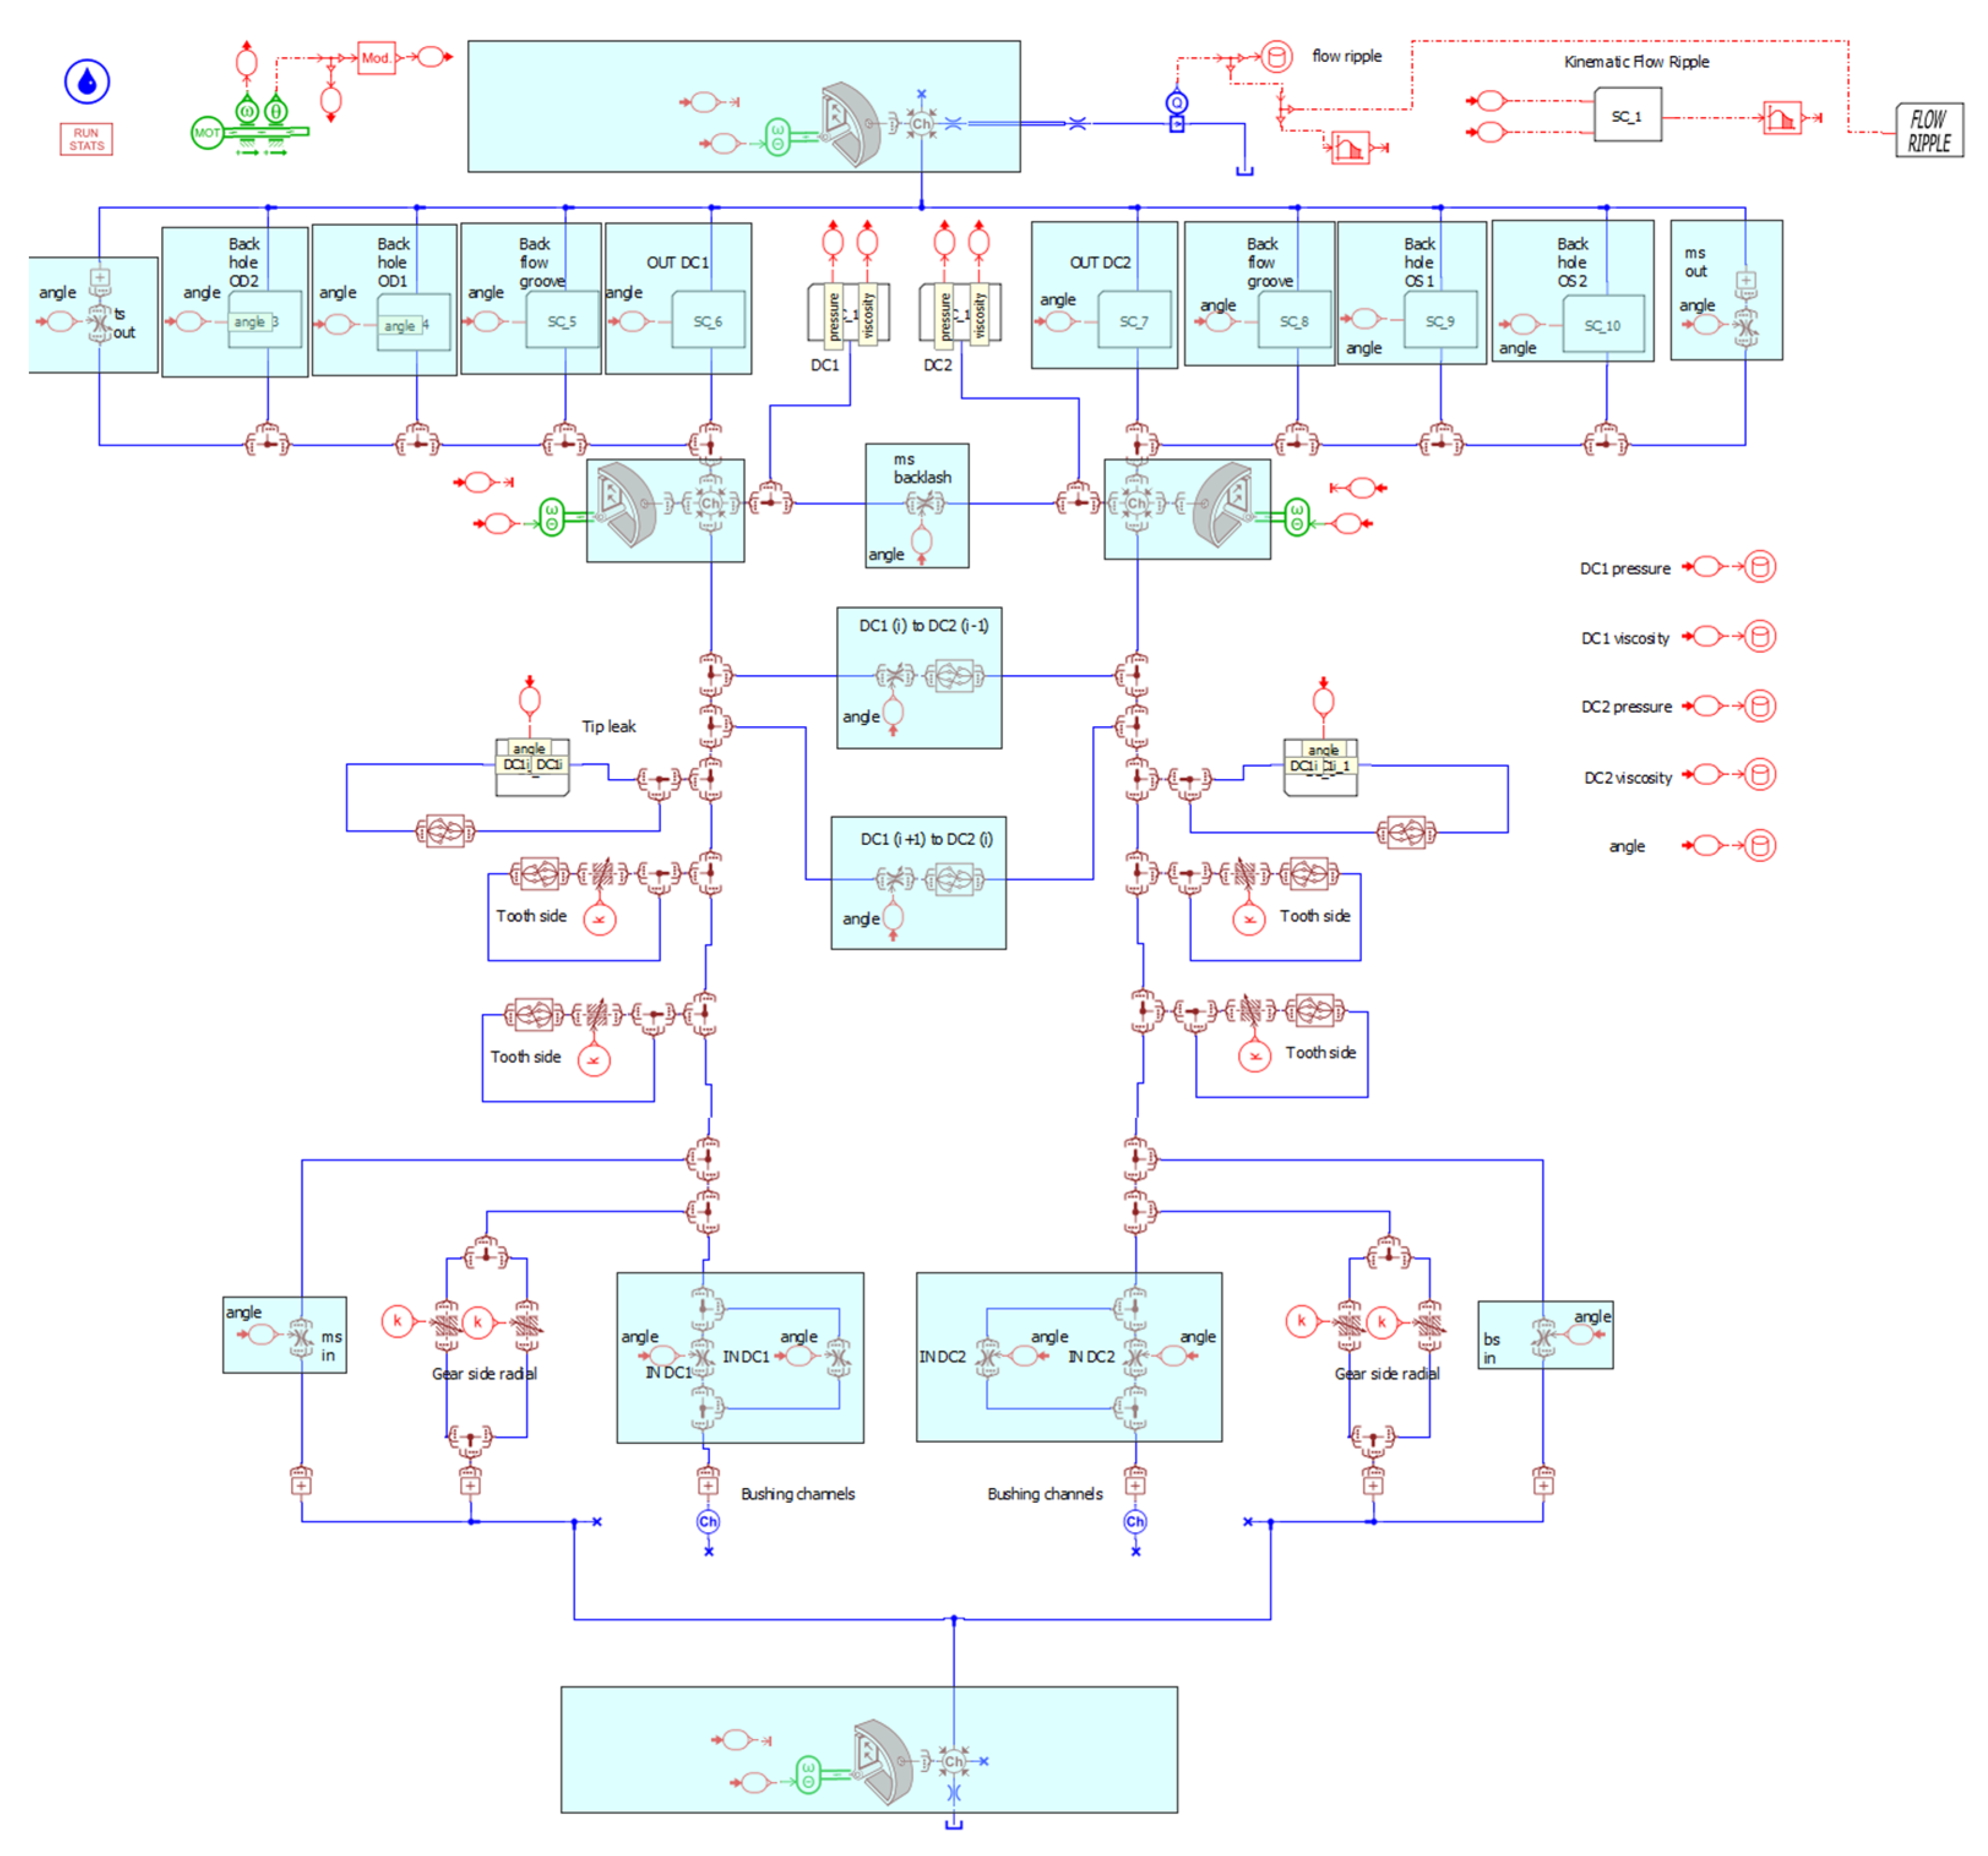
Taking a step back to the EgeMATor workflow in Figure 2, the tool is now ready to simulate the hydraulic behavior with a model created in the Simcenter Amesim® environment. The modeling is based on a control volume approach, well-known in the literature, and already used by the authors with success [22]. Figure 5 presents an overview of the lumped parameter model to understand better its working approach and how volumes are connected.

2.3. The Hydraulic Model

With reference to Figure 4 and Figure 5, it is important to underline how the control volume approach works. For the control volume approach, every Gi and Ni volume has homogeneous properties, and they are modeled as capacitive elements, whose pressure is calculated as follows:
d p d t = β k V ( Q d V d t ) ρ a t m ρ
where volumetric fluxes, Q, are evaluated for every connection presented in Figure 5. The equation to evaluate the flux depends on the physics of the connection. In particular, tooth tip and side fluxes have been modeled considering both Couette and Poiseuille flow contribution; more precisely, slices of teeth have been considered for the side leakage approximation.
The Surface Tool requires a significant parameter to complete its subroutine: it is the “saving delta angle” Δφ, which is crucial for a robust hydraulic simulation. As said earlier, the tool creates a batch of data files, where a collection of (φ,y) couples is stored. Each couple represents a dimension (y) as a function of the rotational angle (φ). For this reason, it is important to define the table as “saving delta angle” (Δφ = φi + 1 − φi). With a bigger Δφ, the Surface Tool subroutine will be faster, but some information could be lost, while lower Δφ will provide more information than necessary, consuming CPU resources with consequently more computational time. An analysis of the numerical flow ripple has been performed to find the hydraulic simulation independence from the parameter Δφ. Results, presented in Figure 6a, show a single flow ripple of the analyzed pump, simulated with the hydraulic model in Simcenter Amesim® (an overview is shown in Figure 7) at 1500 rev/min with an imposed outlet pressure of 230 bar. It is clearly visible that the instantaneous flow at pump delivery becomes independent for Δφ ≤ 0.50 degrees. In Figure 6b, the CPU time required by an Intel(R) Core (TM) i7-7700HQ CPU 2.80 GHz, to complete the subroutines is presented as well. The same independence has been observed on the Gi and Ni pressurizations. A fair tradeoff for the Δφ in the Surface Tool is 0.50 deg, but since both subroutines (Surface Tool and hydraulic simulation) require around 10 min to complete, a value of 0.25 deg has been set for the presented study.
EgeMATor has other features; in particular, it is also capable of running other subroutines to calculate, for example, forces and torques on the gears, but since the nature of the paper is more focused on the hydraulic side of the machine—the flow ripple—the description of those subroutines is not presented in this publication. Only some results have been presented in the final section.

3. Three-Dimensional CFD Numerical Model

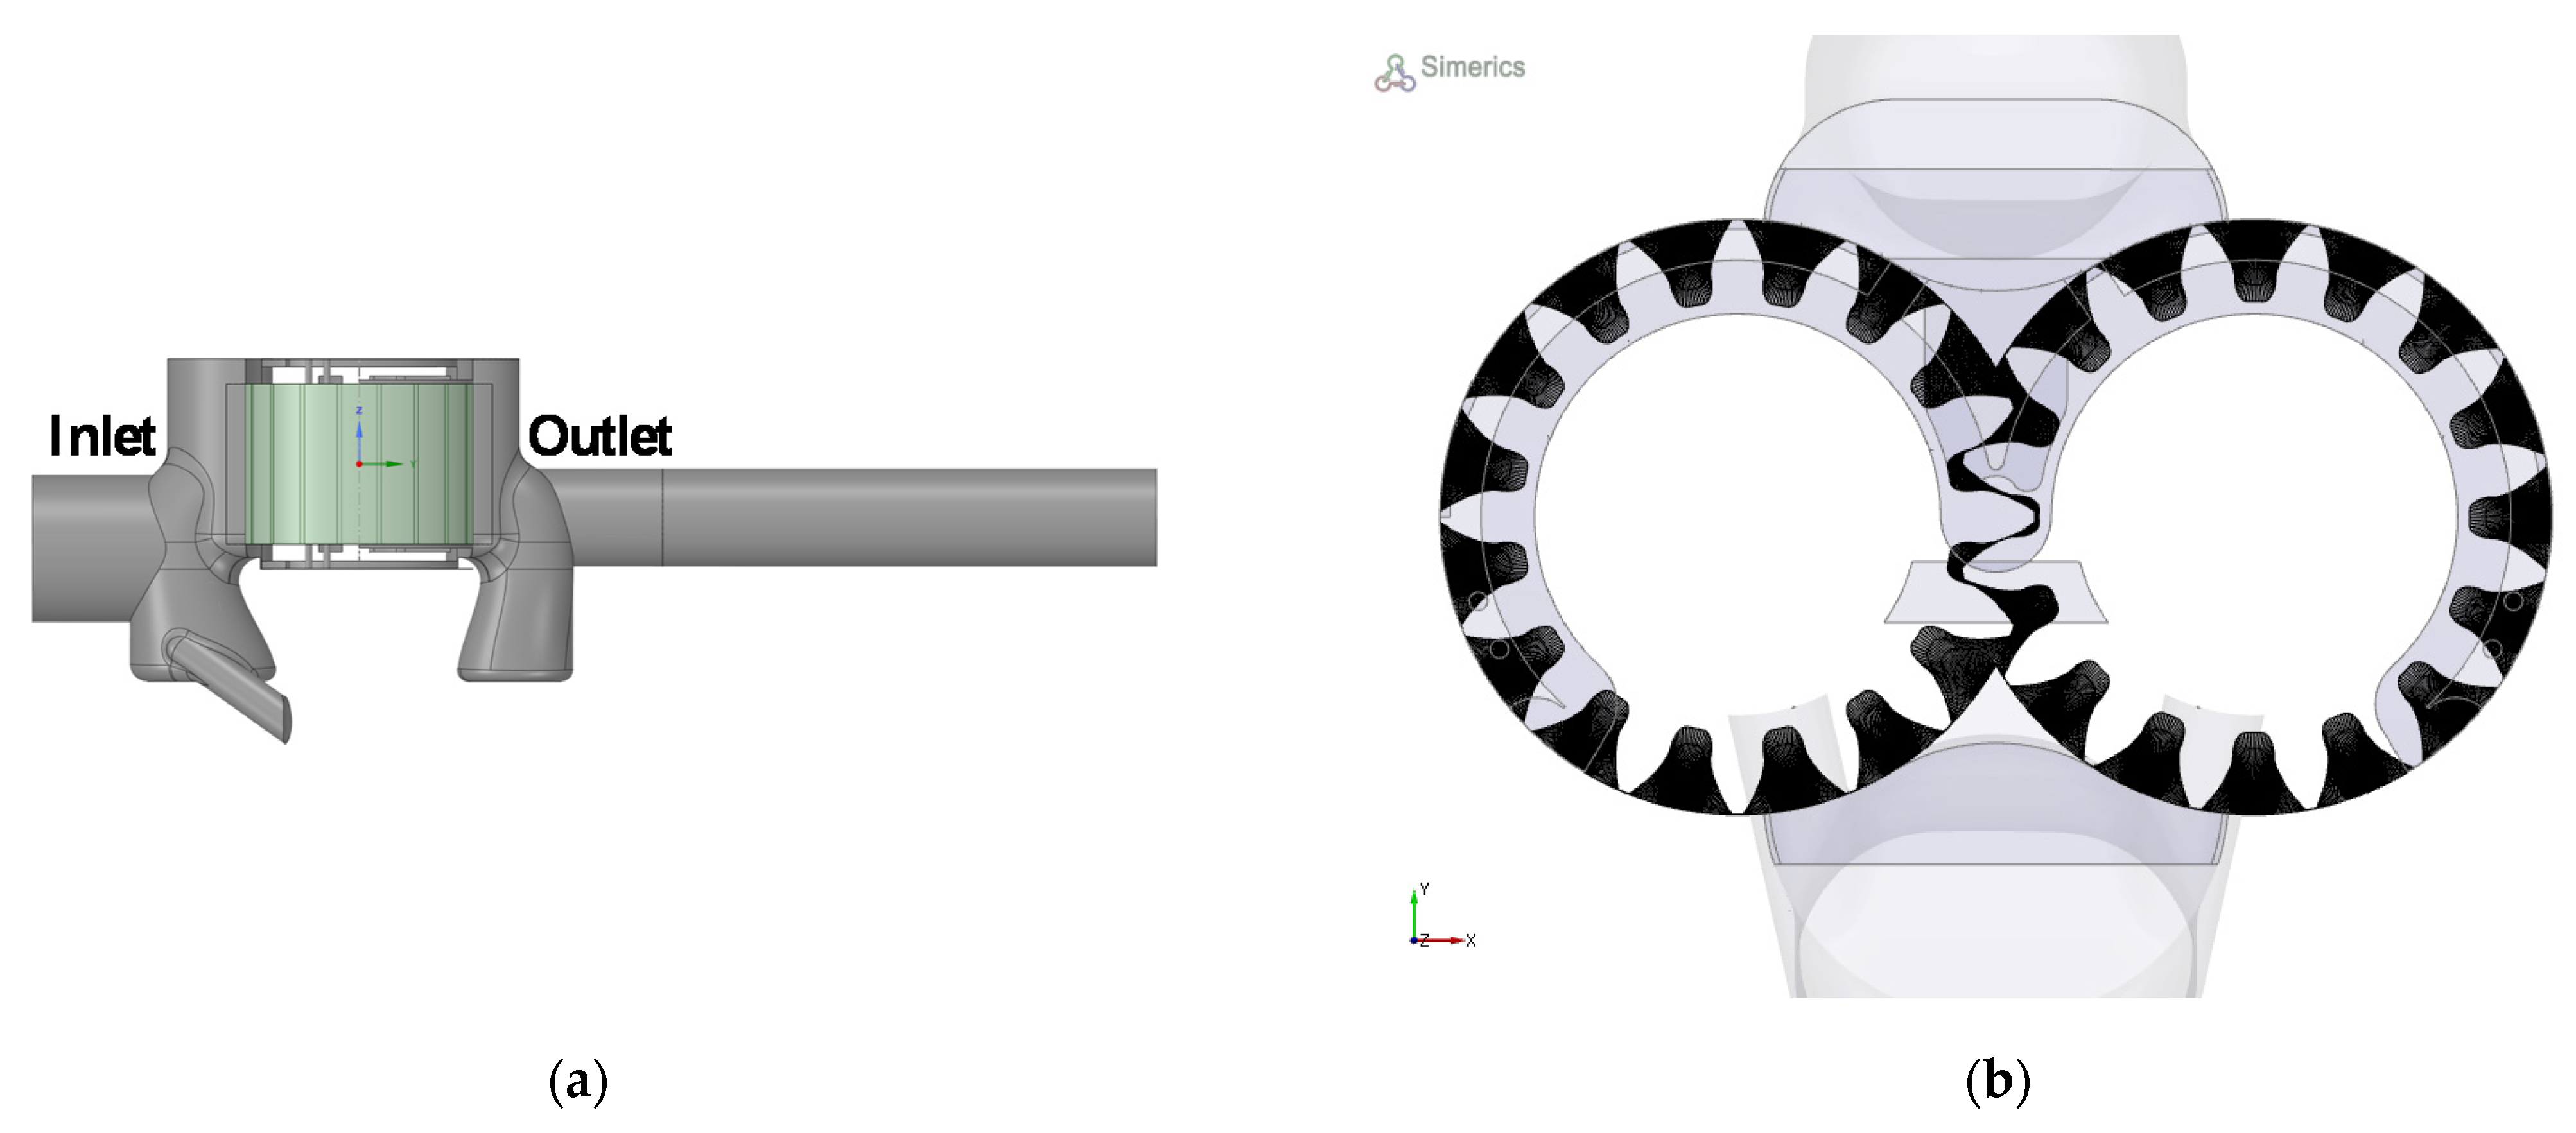
A transient three-dimensional CFD model of the external gear pump has been built up only to validate results obtained with EgeMATor in the absence of experimental data. The model has been developed with the commercial software Simerics MP+, which fits perfectly for this kind of analysis and has already been used by the authors successfully [22,23,24,25]. It discretizes the conservation of mass (3) and momentum (4) equations using a finite volume method. The CFD code uses a template mesher for EGPs, which creates a structural mesh for the two gears. The software works directly with the fluid volumes extracted from a CAD 3D model (shown in Figure 8a); those volumes, after meshing, are interfaced during the numerical modeling in Simeric MP+. In Figure 8b, a section of the gears’ meshing volume is presented.
t Ω ( t ) ρ d Ω + σ ρ V n d σ = 0
t Ω ( t ) ρ V d Ω + σ p ( V n ) V d σ = σ ( τ ¯ n ) d σ σ p n d σ
A cavitation model has been implemented to account for cavitation phenomena. Simerics MP+ includes a cavitation model based on the full cavitation model developed by Singhal et al. [26], where the working fluid in cavitating flows is always assumed to be a mixture of liquid, vapor, and some non-condensable gases (NCG). The modeling of the NCG effects has been done with the Equilibrium Dissolved Gas Model (EDGM) available in the software. In the EDGM, the mass fraction of the total non-condensable gas remains constant, but a part of it is dissolved into the liquid to satisfy the local equilibrium condition instantly. Mathematically, in addition to the same vapor mass fraction equation and vapor mass transfer models, the EDGM model solves an additional transport equation for the mass fraction of the dissolved gas, which is assumed to always be in an equilibrium state. The modeling equations for the liquid-vapor phase change are as follows [27]:
( ρ f v ) t + ( ρ V f v ) = [ ( D v + μ t σ v ) f v ] + R e R c
where Dv is the diffusivity of the vapor mass fraction, and σv is the turbulent Schmidt number. The vapor generation term, Re, and the condensation rate, Rc, are modeled as:
R e = { C e ρ l ρ v 2 3 ( p v p ) ρ l ( 1 f v f g , f ) p < p v 0 p p v
R c = { 0 p < p v C c ρ l ρ v 2 3 ( p p v ) ρ l f v p p v
The free NCG mass fraction, fg,d, has not been considered constant, but its evaluation has been achieved by adding the transport equation of the dissolved gas:
( ρ f g , d ) t + ( ρ V f g , d ) = ( ( D g , d + μ t σ g , d ) f g , d ) + ρ τ ( p p d , e q u i l , r e f f d , e q u i l , r e f f g , d ) + S g , d
where Sg,d is the user-defined law of gas dissolution or release, and fd,equil,ref is the equilibrium mass fraction of the dissolved gas at the reference pressure pd,equil,ref, both parameters have user-specified values. In this equilibrium model, the time scale, τ, approaches zero so that the mass transfer is near-instant. The free gas has the mass fraction fg,d, instead of fg. The mass fraction of the free gas is obtained from the condition:
f g = f g , f + f g , d = f g , s p e c i f i e d
where fg,specified is a user-specified value.
In the absence of experimental data, a mesh sensitivity analysis has been done by increasing or decreasing the cells’ number of the displacement chambers and wear-plates to achieve a stable solution of the monitored model’s outputs. The model requires a computational time of around 1 day for each pump revolution on an Intel (R) Xeon (R) CPU E5-2640v2 @ 2.00 GHz (two processors) and consists of 554,000 3D cells. Heat transfer is not included in the modeling, and temperature affects only fluid viscosity and density. To solve the turbulent flow, Simerics MP+® adopts a RANS approach, with the standard “K-Epsilon” turbulence model, which has been proven to be capable of predicting the correct time-averaged flow field, in particular for wall-bounded flows [22,23].
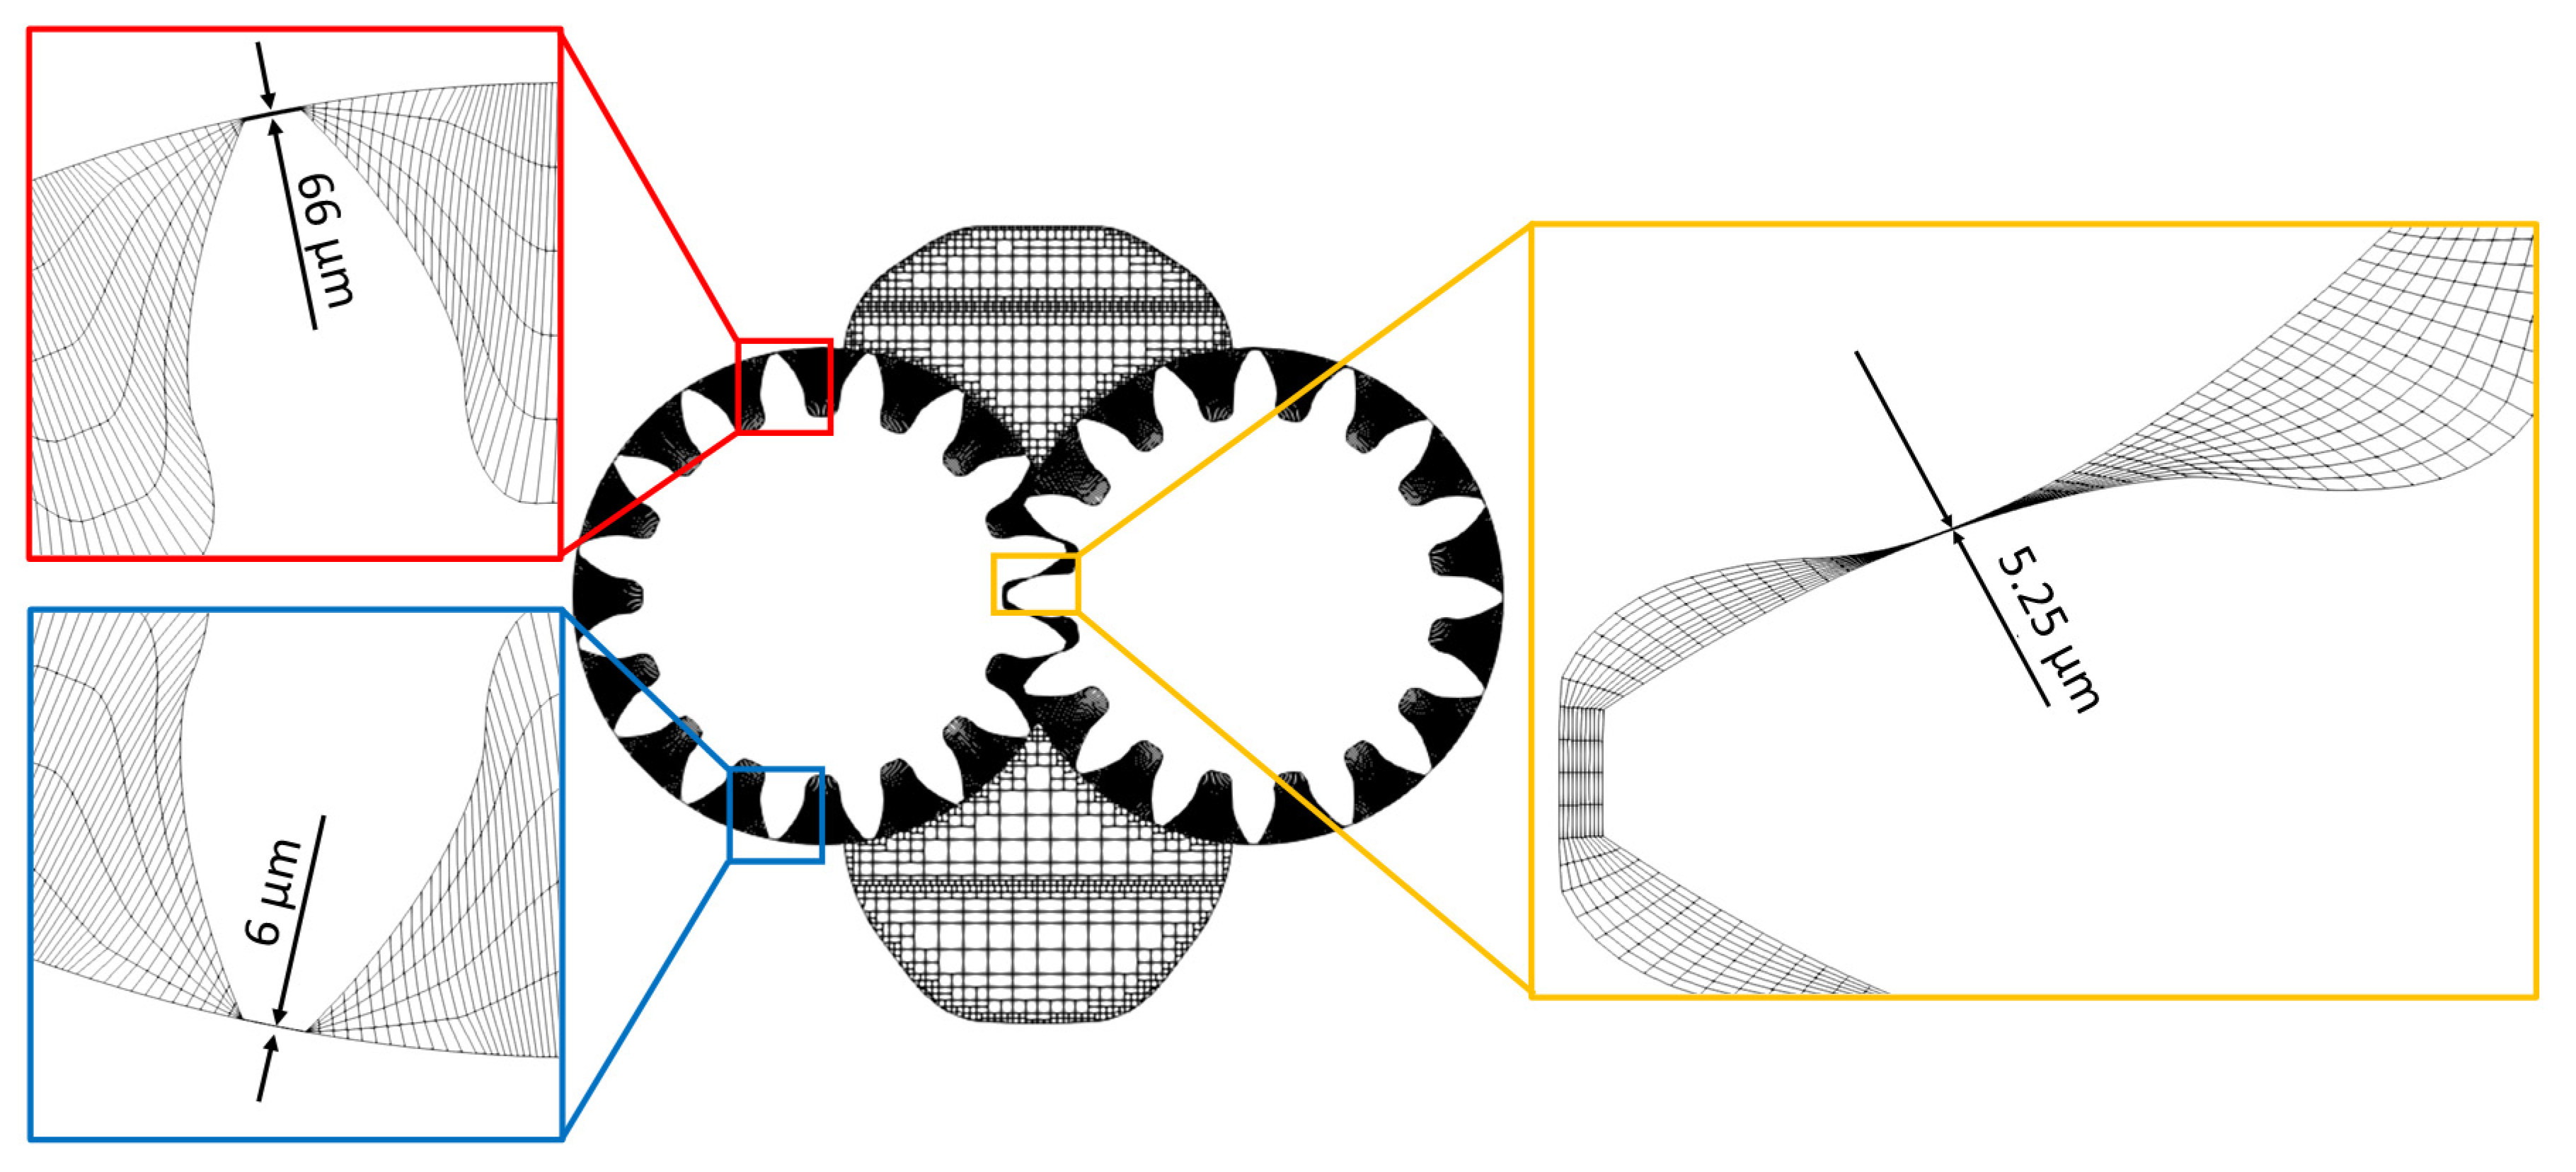
For the three-dimensional CAD model, the theoretical radial clearance between the tooth tip and the internal housing is 36 μm. However, to reproduce the gear micromotion due to the pressure toward the inlet side, both gears have been offset by 30 μm to create a micro-gap of fluid to respect a non-zero volume cell required by Simerics MP+®. This micromotion creates an eccentricity with respect to the housing, increasing the gap over the tip at the pump’s high-pressure side. Another small clearance is needed between the driving and driven gears’ teeth to reproduce the contact. In particular, a relative rotation of 0.21° has been set to get a 5 μm gap, as shown in Figure 9.
The numerical 3D CFD model has been run at the same boundary conditions and fluid properties simulated with EgeMATor:
  • The pressure at inlet port: 0 bar
  • The pressure at outlet port variable in the range 230–350 bar
  • The fluid is hydraulic oil, ISO VG46
  • Variable dynamic viscosity
  • Variable liquid bulk modulus (linearly dependent with pressure)
  • Oil Temperature: 313 K

4. Results Comparison

In this section, a comparison between the presented methods is shown. Authors in a previous paper [23] have already verified the accuracy of the 3D CFD approach used in this paper to validate the results achieved with EgeMATor. Outlet flow ripple and displacement chambers’ (Gi and Ni) pressures have been compared. Next, graphs will show results from three different models, where each item has a particular significance:
  • EgeMATor standard (later called EgeMATor STD) are the results from the lumped parameter model in standard condition, where sealing conditions (gears’ teeth contact, gears—housing micromotion) are strictly respected.
  • EgeMATor (3D CFD) are the results from the lumped parameter model with imposed clearances to match the 3D CFD simulating conditions (no perfect sealing).
  • 3D CFD are data referring to the three-dimensional CFD numerical model with minimum clearance to respect a CFD simulation context.
All the following results have been referred to a rotational speed of 1500 rev/min and 350 bar of the outlet pressure (maximum pressure).

4.1. Outlet Flow Ripple

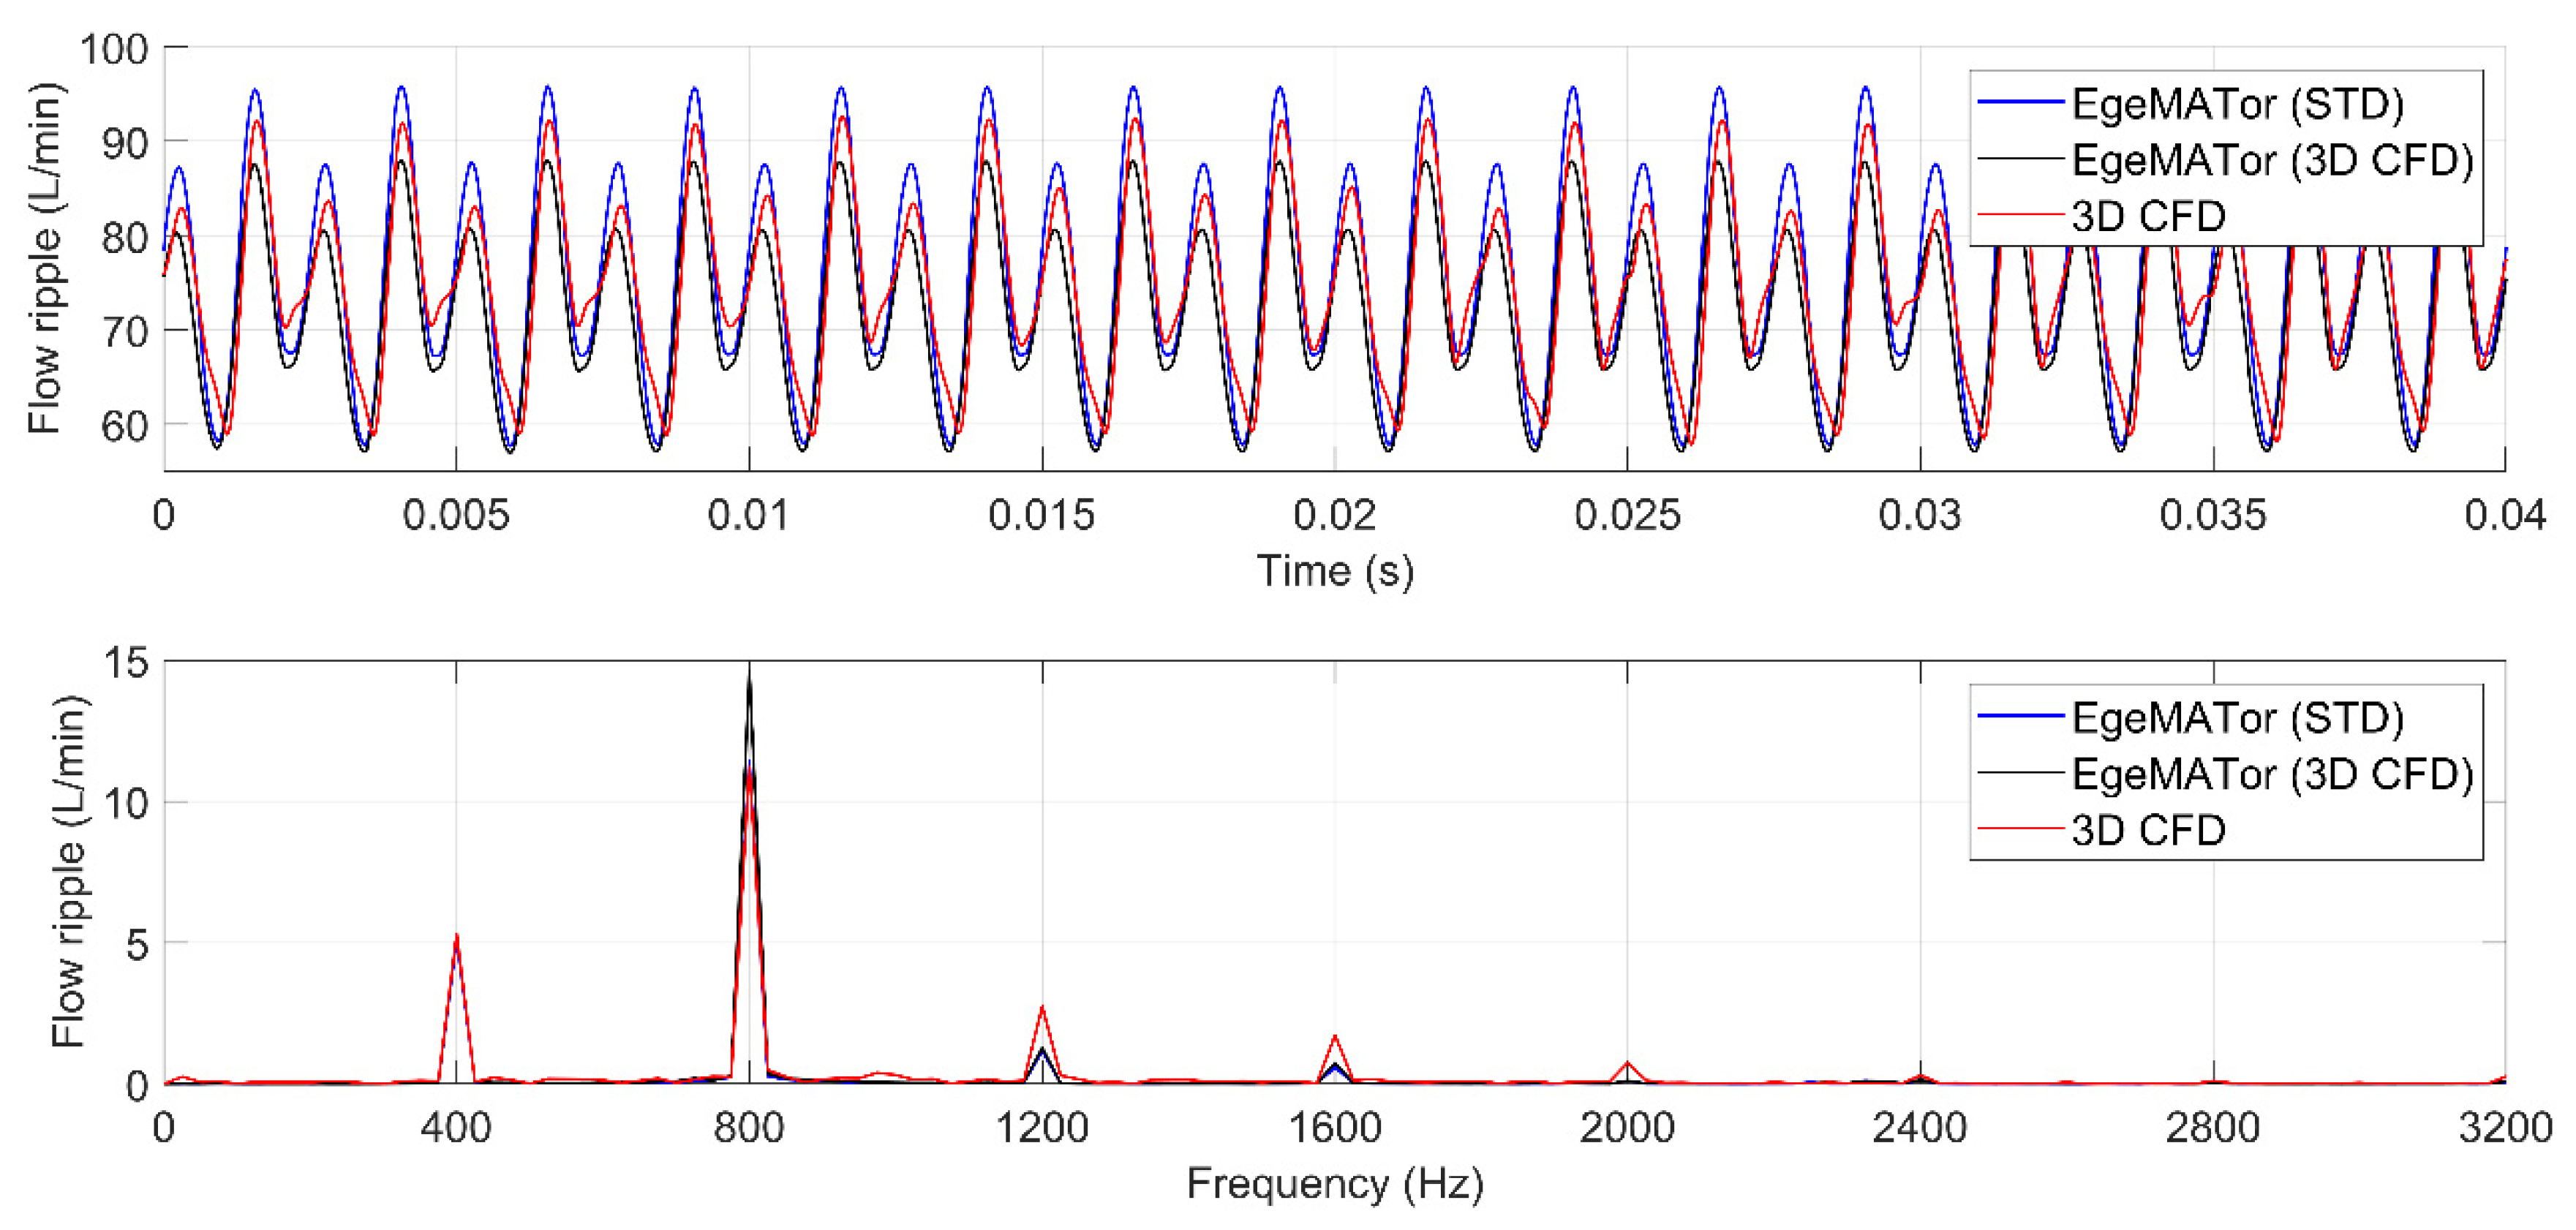
In Figure 10, the outlet flow ripple has been presented in both time and frequency domains. Notably, there is a similar prediction for both approaches. As expected, the EgeMATor (STD) model, identified with the blue line in Figure 10, provides an average outlet flow higher than the EgeMATor (3D CFD) model (black line) for its better sealing conditions. As predicted, the 3D CFD model (red line) provides an average outlet flow closer to the lumped parameter model with imposed clearances (EgeMATor 3D CFD).

4.2. Gi and Ni Pressure Distributions

The effects of the clearances imposed in the EgeMATor (3D CFD) model are better visible in Figure 11, where the pressure distributions of the displacement chambers G1 and N1 have been presented. Indeed, for the two models, EgeMATor (3D CFD) and 3D CFD, both chambers’ pressurization phase have a similar prediction, while the EgeMATor (STD) shows different pressurization starting angle. This delay is related to the reduced tip clearance in this model during the pressurization phase transition.
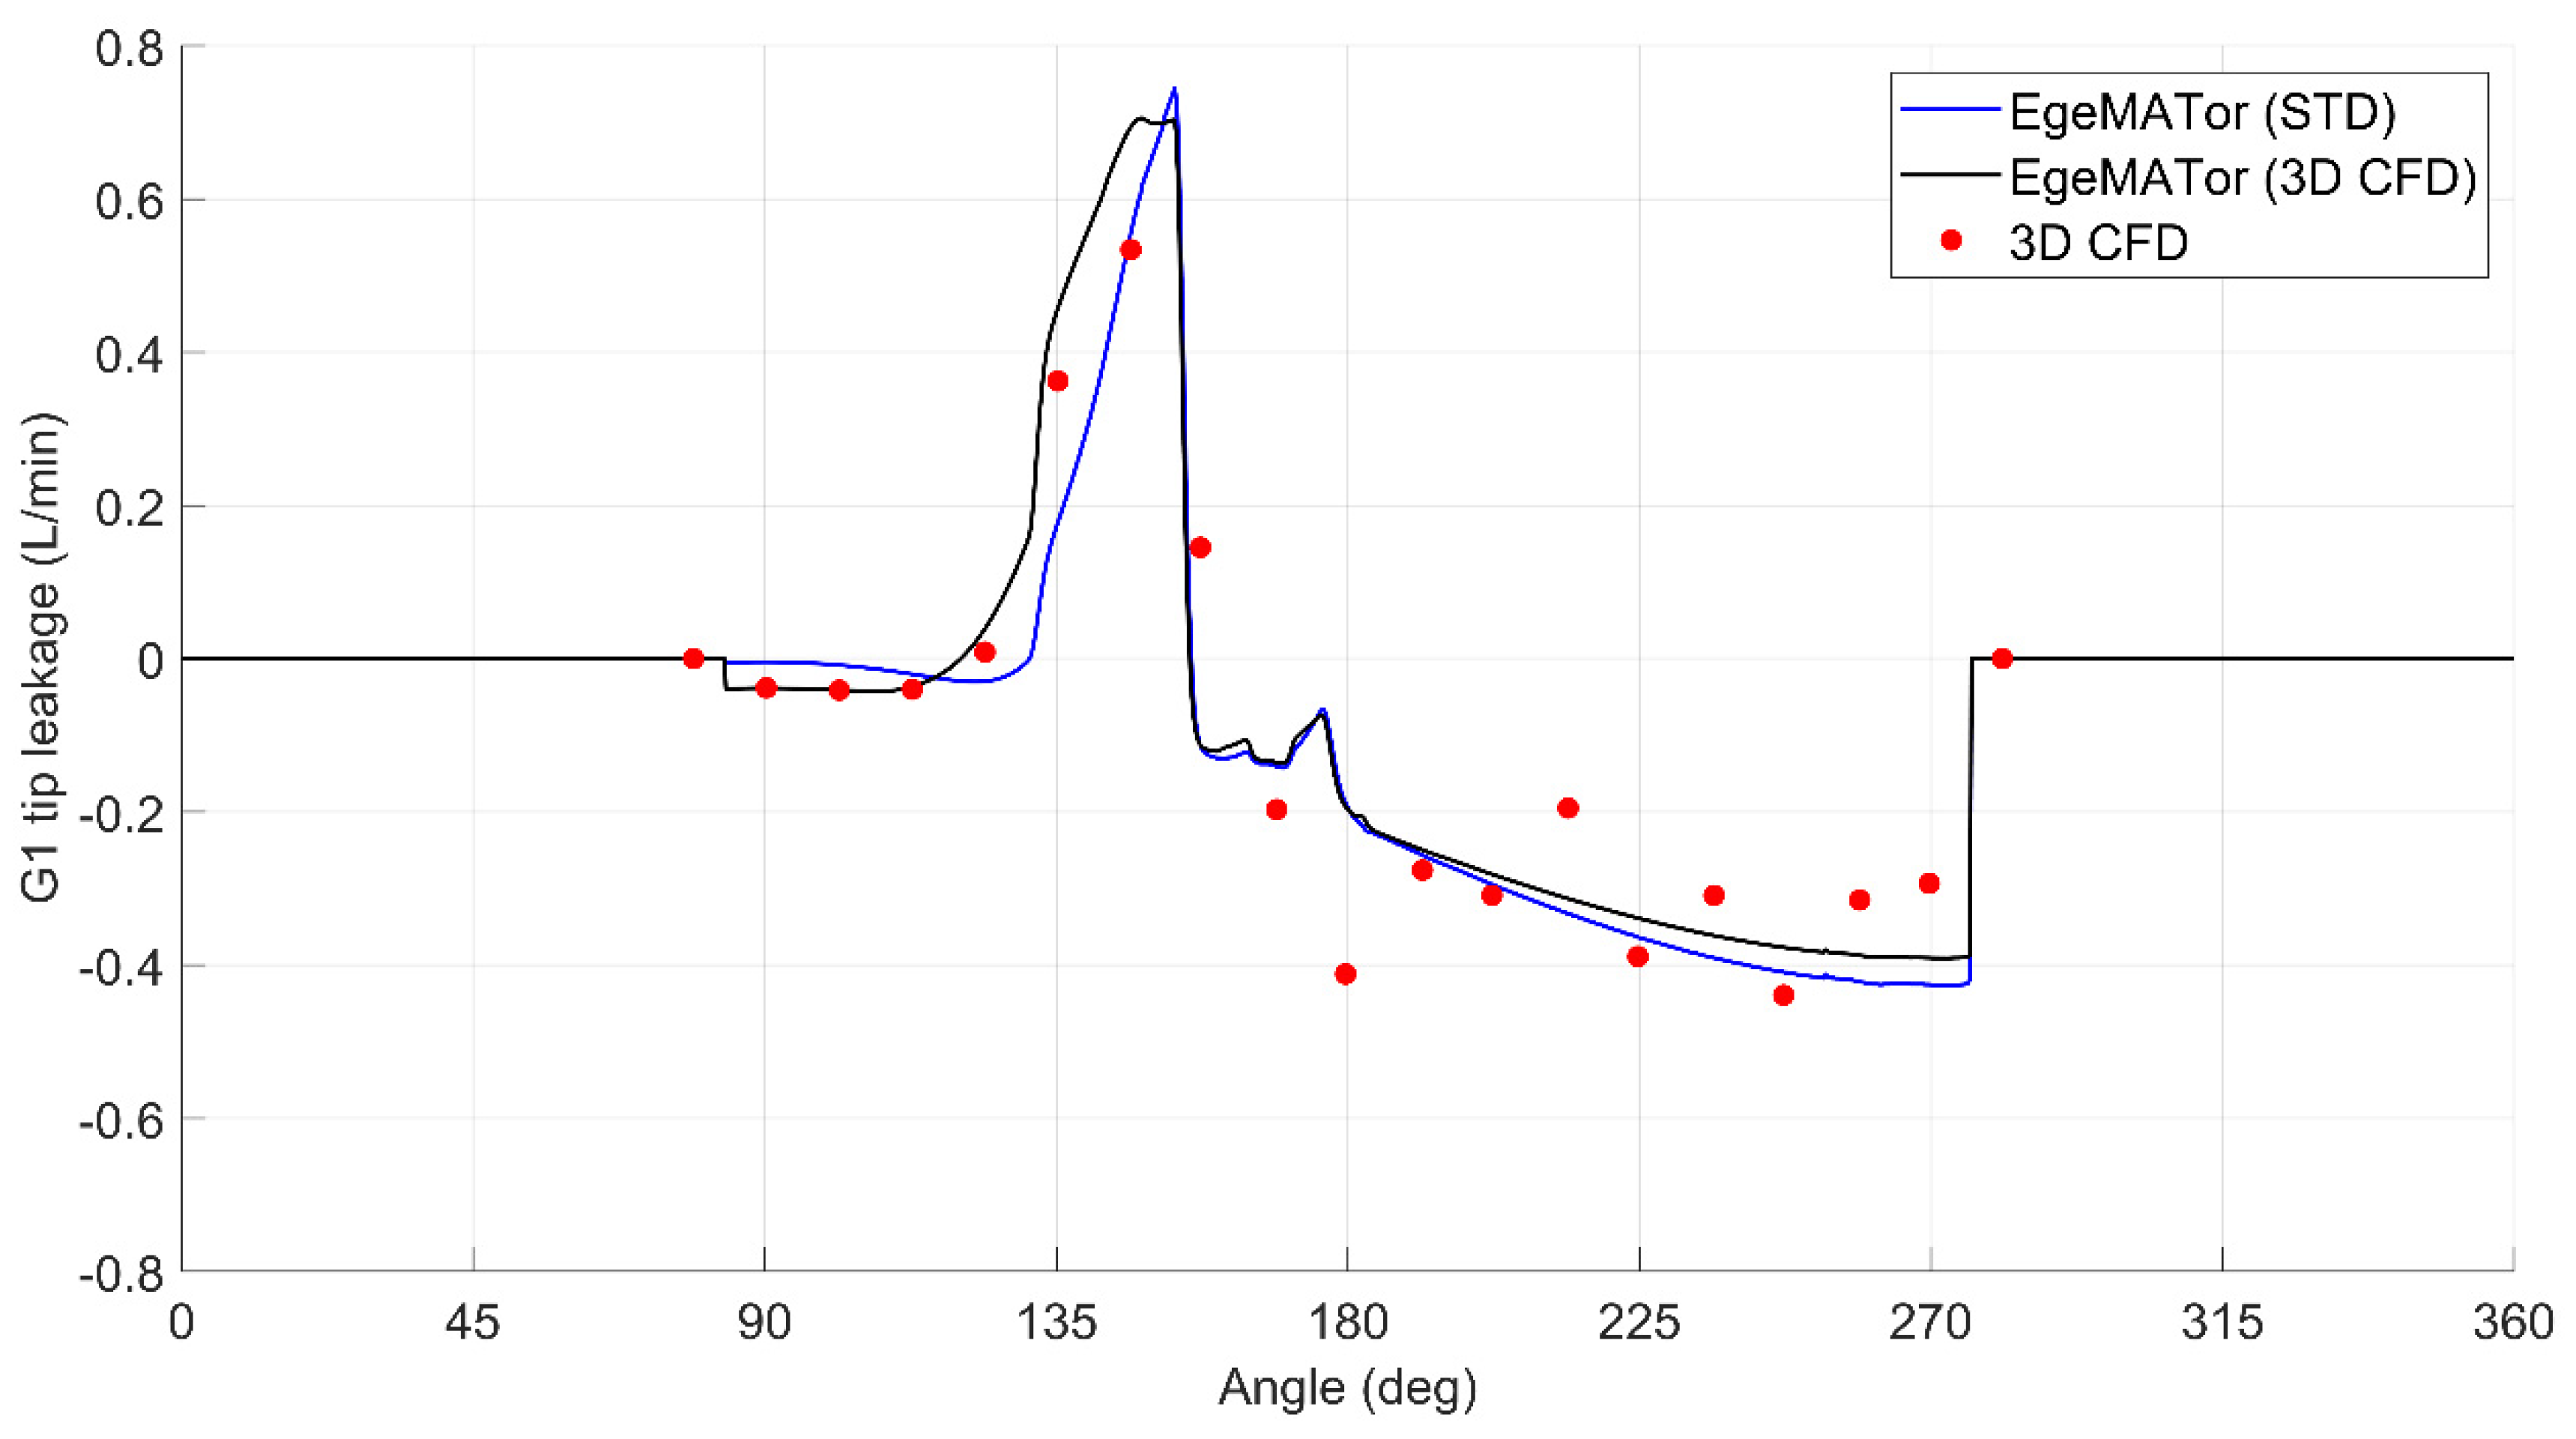
Even in these plots, the comparison shows a good agreement among the numerical simulations, confirming the adopted methodology’s robustness. Considering the leakage flux across the driving tooth number 2 (nomenclature visible in Figure 4), from Figure 12, the effects of the different radial clearance (gears—pump housing) between the two lumped parameter models are visible, as well as how the 3D CFD results are more similar to the EgeMATor (3D CFD) model, especially during the pressurization phase (around 85–130 deg of the figure). Negative values represent a flux exiting the control volume G2.
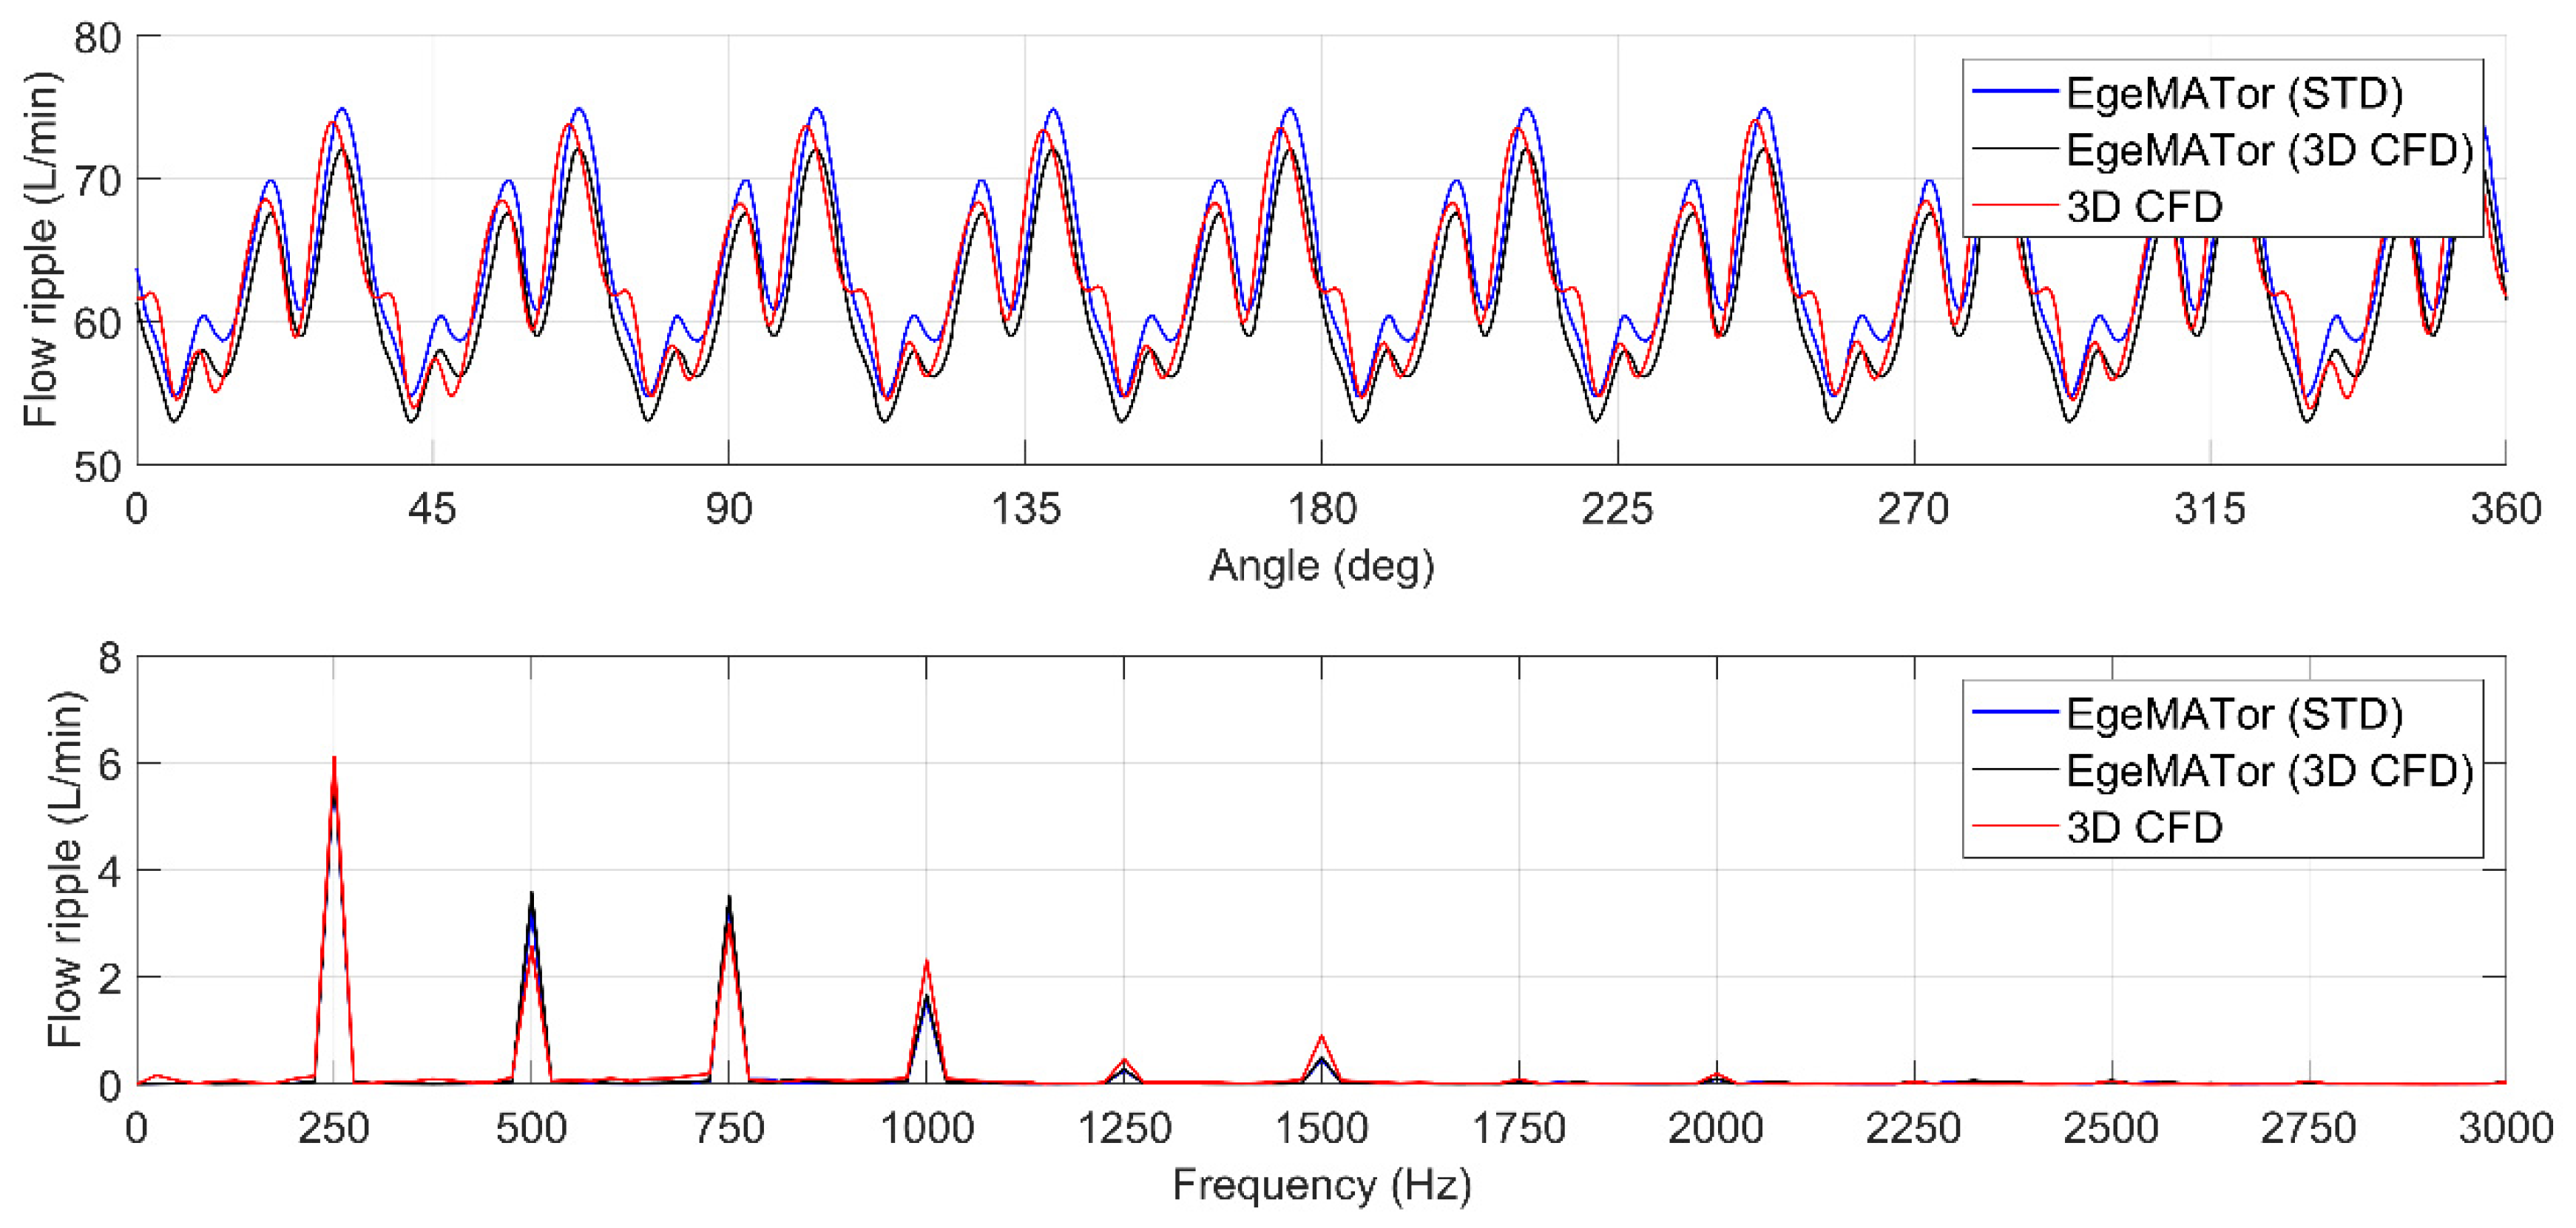
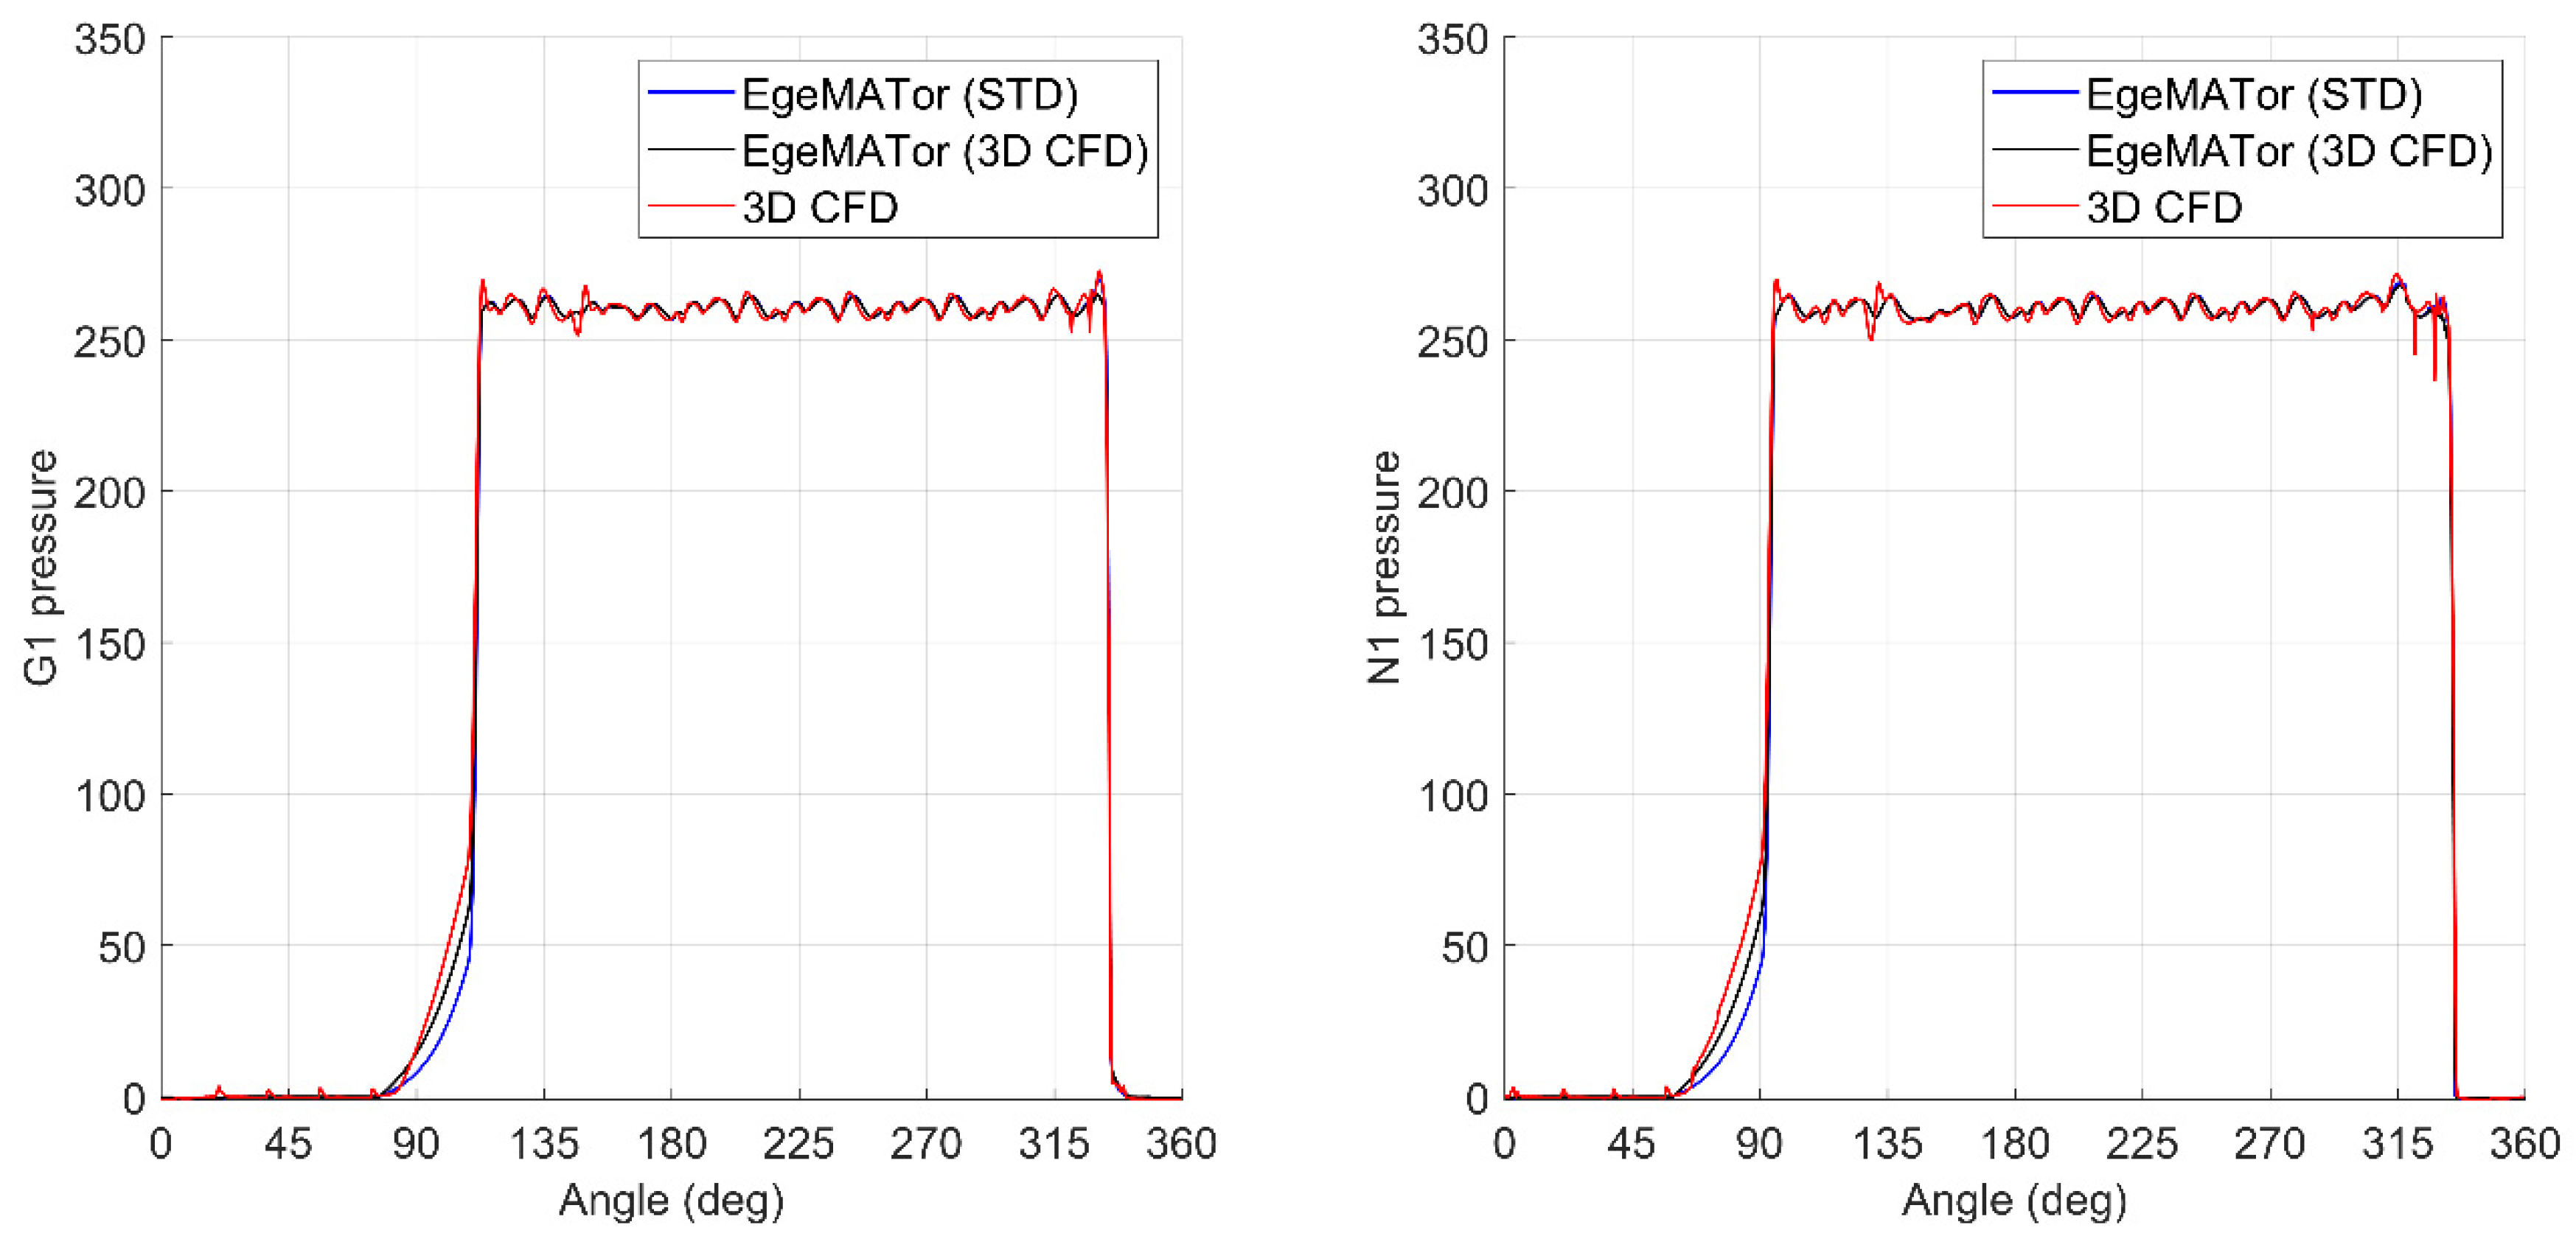
To better prove the presented tool’s effectiveness and robustness, the authors decided to add another study on a different pump with a lower number of teeth (ten per each gear) in Appendix A since this is the first time that EgeMATor is presented. The next paragraph is focused on the optimization of the pump performance, looking, in particular, at the reduction of the flow ripple. For this purpose, an innovative solution called ACV is introduced in EgeMATor, providing interesting results.

5. Alternative Capacitive Volumes (ACV)

5.1. The ACV Idea

The main idea behind introducing the Alternative Capacitive Volumes (ACV) is to act on the reverse flow from the delivery volume to the displacement chambers during the pressurization (Figure 13). Usually, the displacement chamber’s pressurization happens through a reverse flow coming directly from the outlet volume, creating a drop clearly visible on the flow ripple. With the introduction of the ACV, a volume of oil trapped between two small orifices (around 4 cm3 for the presented case) is used for the chamber pressurization; thus, the reverse flow is controlled and uniformized. The first orifice is a threaded orifice inserted to connect the ACV with the delivery volume (Figure 13), while the second one is directly machined in the wear-plate connecting the displacement volume to the ACV, as highlighted in Figure 14b. Every visible external access will be opportunely sealed, as well as the wear-plate back.
A standard 1 mm threaded orifice has been selected for the ACV connection with the delivery port to make the system industrially reliable. A volume of the ACV that could easily fit in the pump housing through additional machining has been designed. Then, numerical simulations have been run to prove the idea.
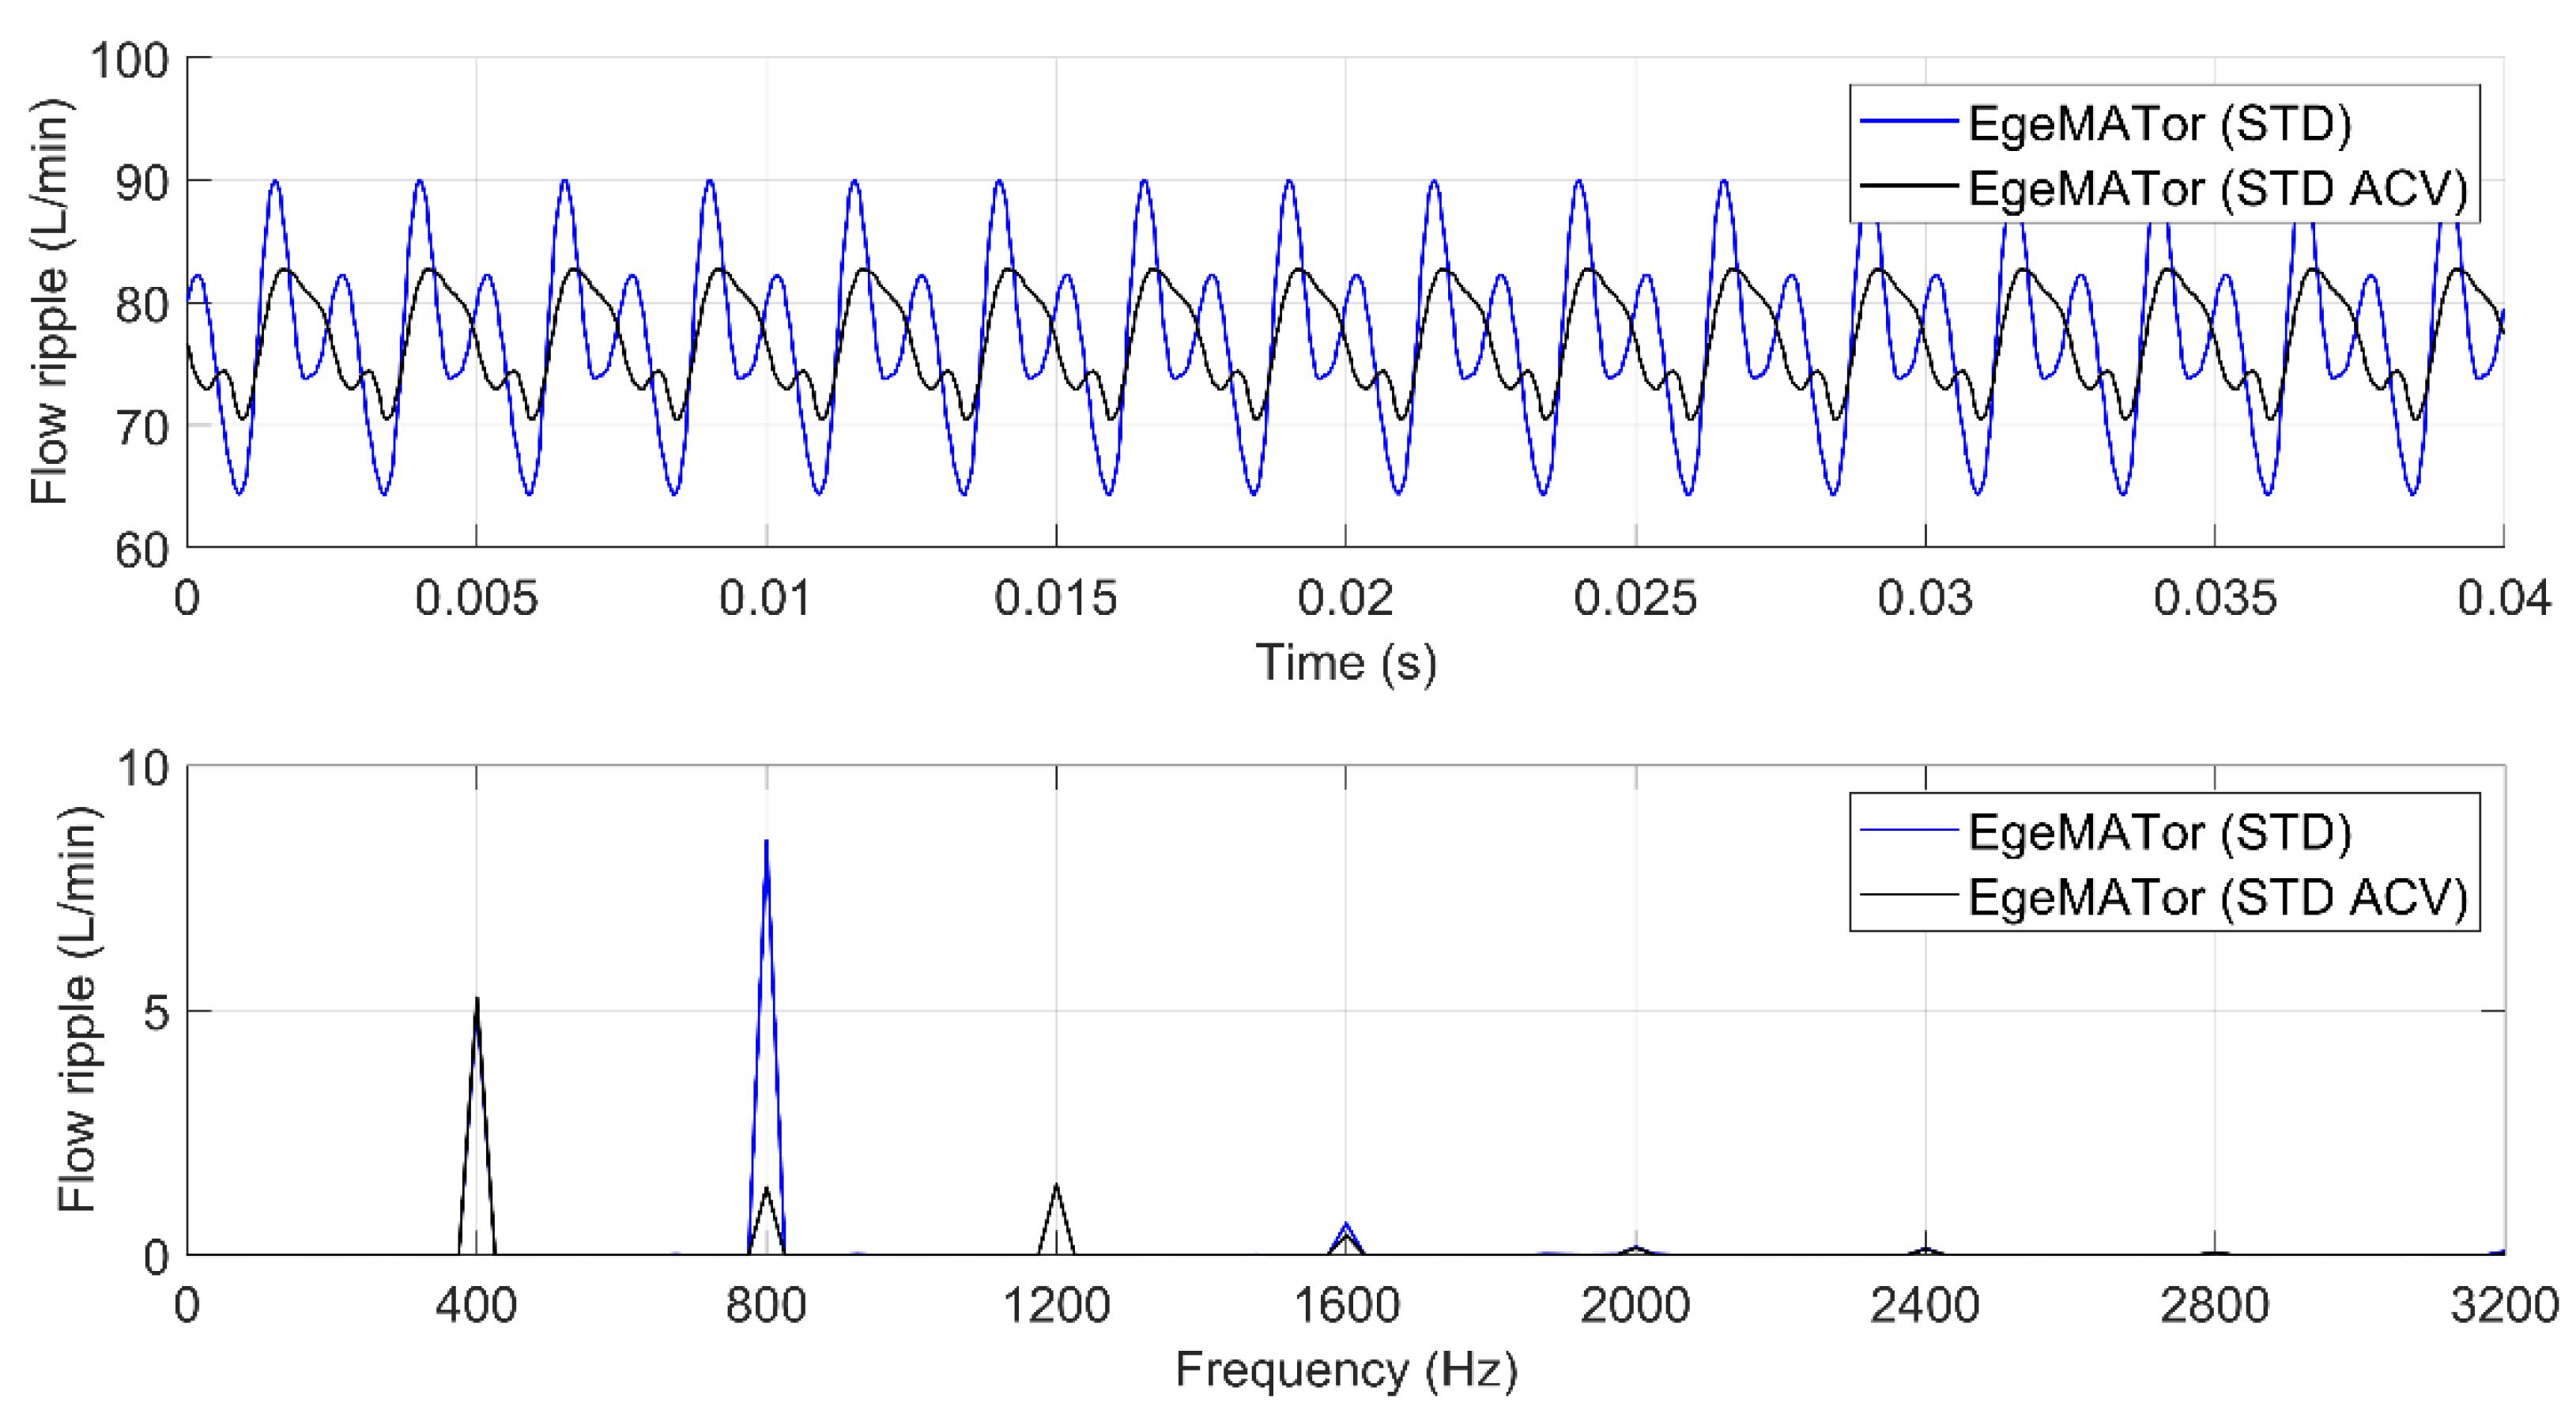
The first set of simulations has been run to compare results from the 3D CFD (ACV) model with EgeMATor (3D CFD ACV), validating the lumped parameter approach the introduction of ACV. The simulation constraints are 1500 rev/min (average working speed) and 230 bar (average working pressure). This analysis has been presented in Figure 15, where the EgeMATor (3D CFD), identified with a blue line, shows a higher numerical flow non-uniformity amplitude than the pump model with the ACV (black line). The same results are visible for the 3D CFD model, which is very similar in the flow ripple prediction. Looking at the frequency domain in the same figure, a reduction of the flow ripple on the second fundamental frequency (800 Hz) is clearly visible due to the reduction of the reverse flow for each displacement chamber (at 1500 rev/min the shaft frequency is 25 Hz, a value that if it is multiplied by the number of 32 displacement chambers gives 800 Hz). After this validation, the second set of simulations has been run only in EgeMATor environment, with a perfect sealing, not reliable in the 3D CFD model. The mentioned analysis has been presented in Figure 16, where the flow ripple amplitude reduction is still effective.
As is shown, the second fundamental frequency of the flow ripple, visible in the frequency domain, is highly reduced. No relevant differences have been observed on the other frequencies.

5.2. The ACV’s β Angle Optimization

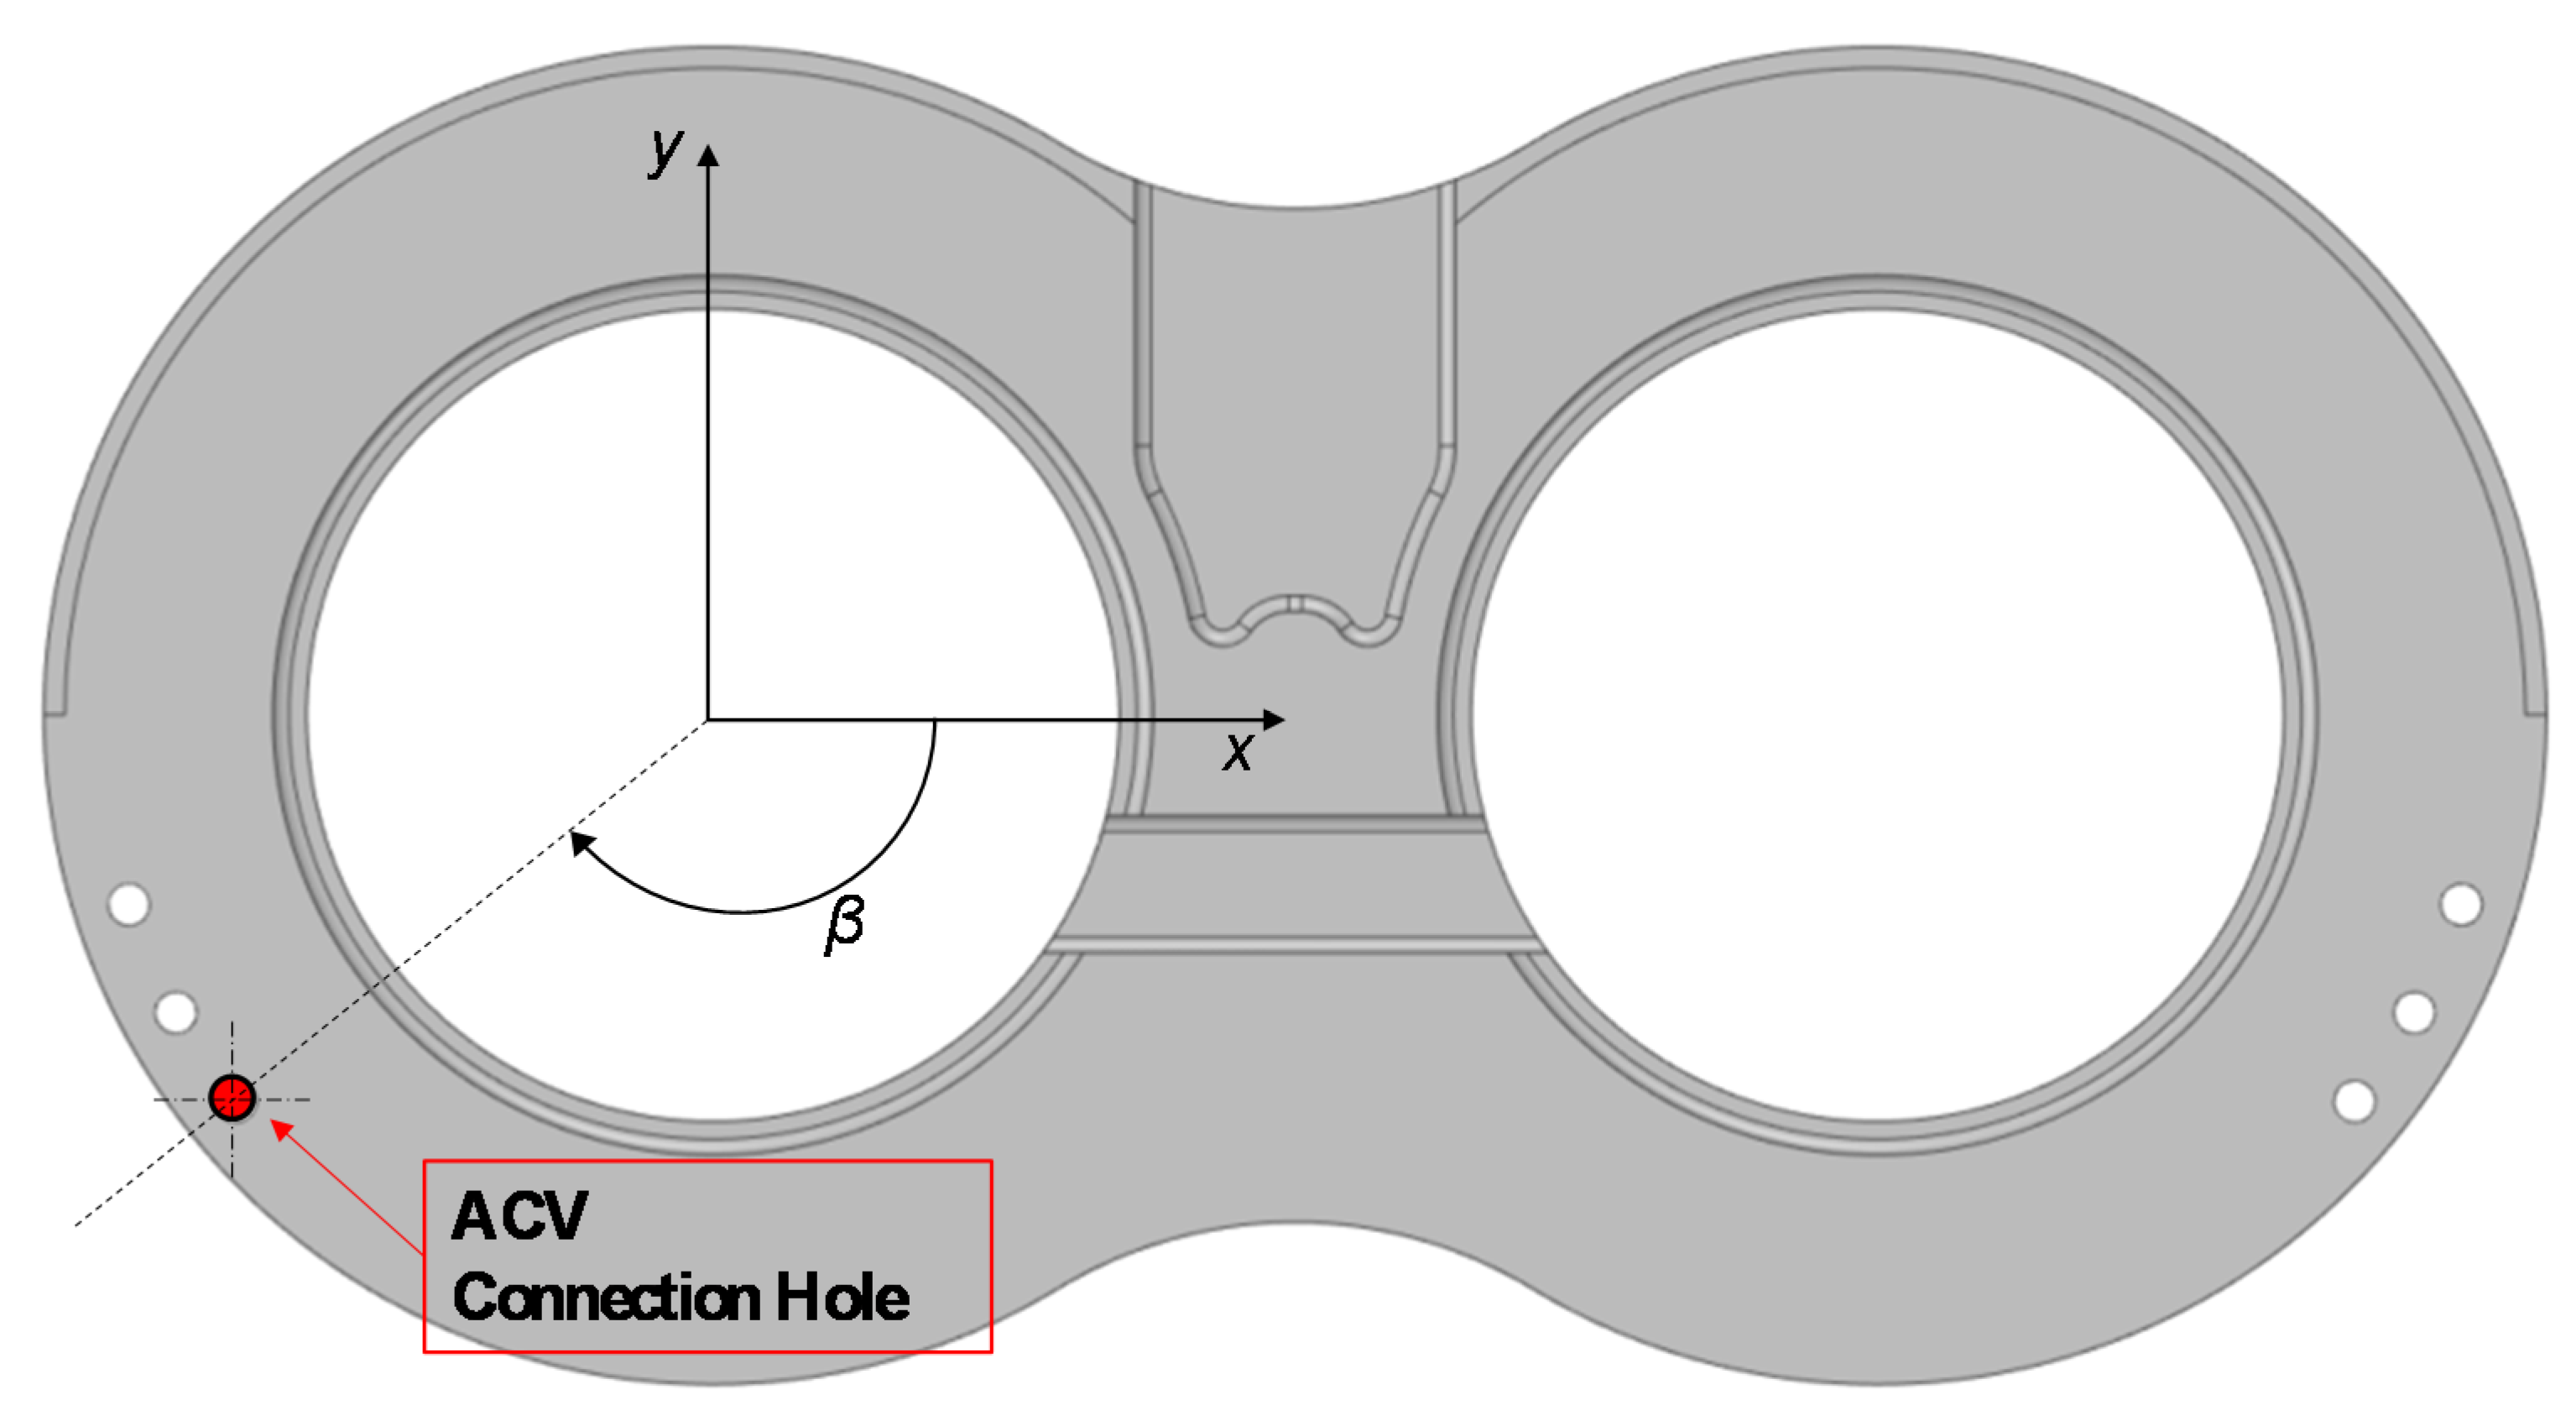
Since the dumper functionality of the ACV has been proven, an optimization process has been run to get the benefit of a best design. The optimization process has been performed directly in EgeMATor, since Simcenter Amesim® permits this kind of study. In other works, the authors approached the optimization also in a CFD environment [23], but because the tool robustness has been proven, the process has been performed directly in Simcenter Amesim® for its speed of calculation. It has been decided to run an optimization to reduce the flow ripple by merely modulating the β angle visible in Figure 17 since the Surface Tool does not allow parametrization of the plate’s geometries. In this way, the Non-Uniformity Grade (NUG) [1] can be minimized, reducing the fluid-borne noise. The optimization process aimed at the fluid-borne noise reduction has been done using a Non-Linear Programming by Quadratic Lagrangian (NLPQL) method, which particularly fits this kind of study, where a single objective function has to be minimized.
The optimization process’s input is the parameter Δβ, which shifts the angular position of the hole that connects the displacement chamber to the ACV. The effects of gears’ micromotions have been neglected since they lie in the drawings’ tolerance range. The definition of the objective function is given in the following equation:
Objective   Function :   min ( NUG )
This objective function has a simple interpretation: it tends to minimize the “Non-Uniformity Grade”. Parameters set for the optimization study are the following:
  • Optimization technique: NLPQL
  • Relative gradient step: 0.0001
  • Desired final accuracy: 0.001
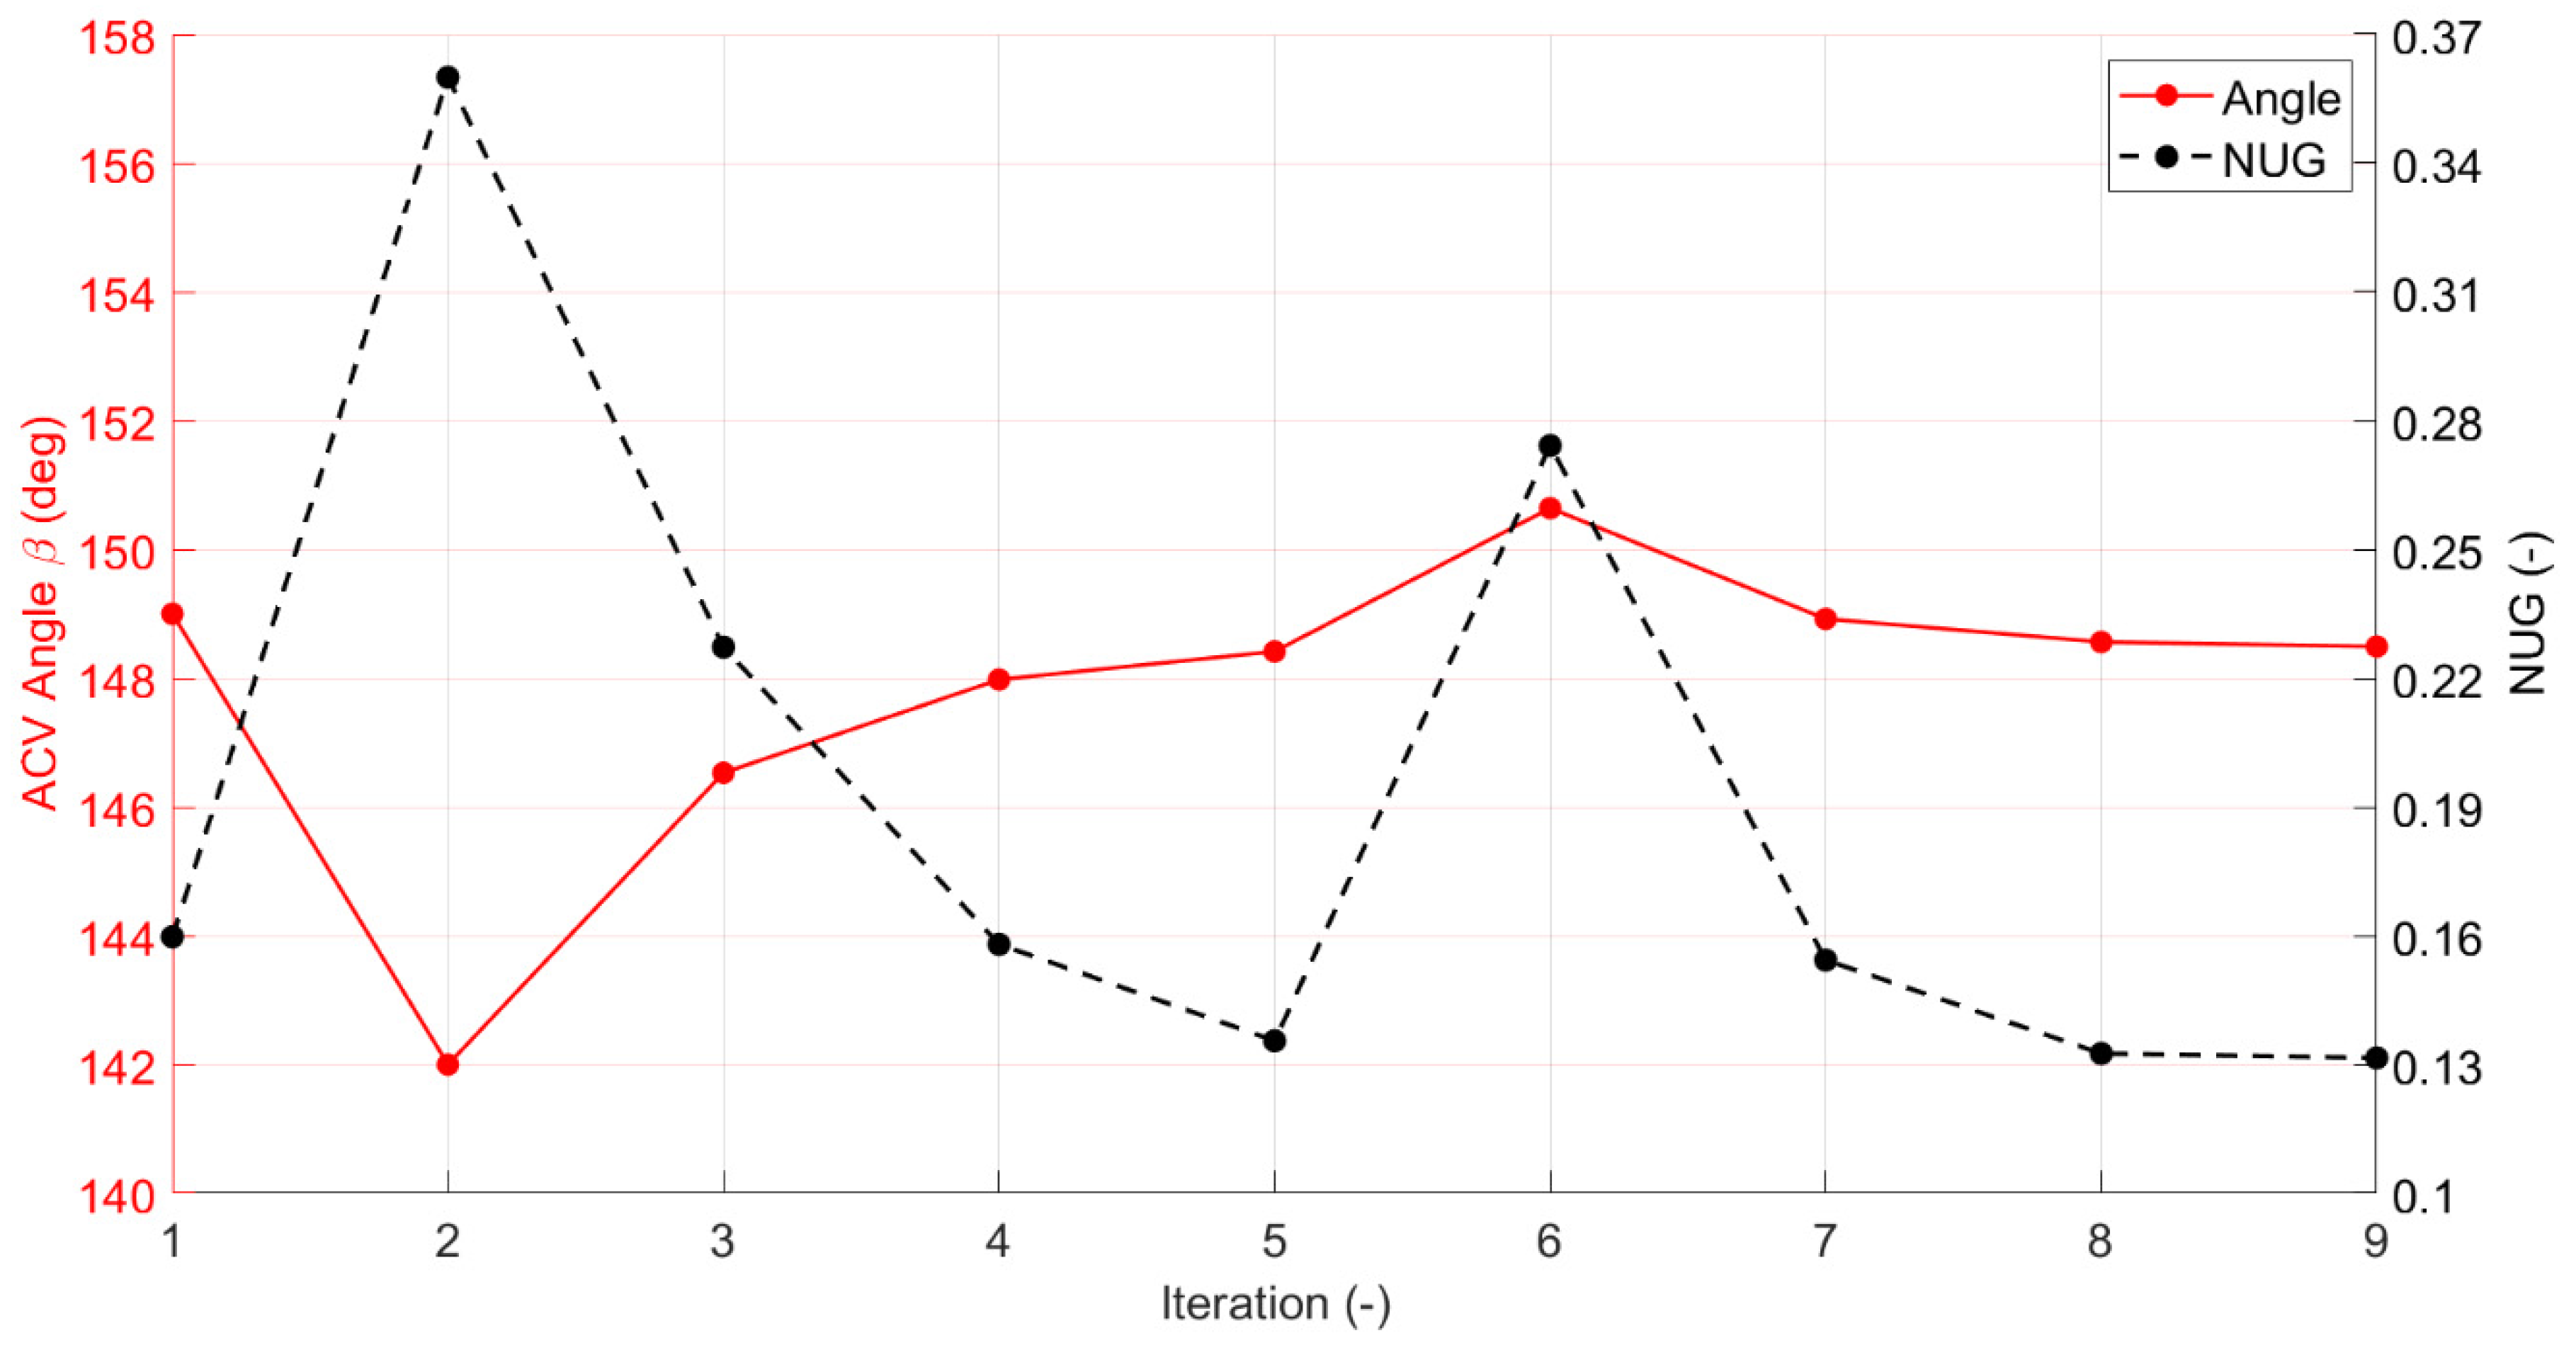
The optimization process took nine iterations to complete the algorithm, as shown in Figure 18. It can be noted from Figure 18 that the NUG has been further reduced from the initial value of 0.160, to 0.131, which corresponds to a further percentage reduction of 18.1%. The corresponding Δβ variation from the initial value is −0.51 deg. The working condition constraints are 1500 rev/min (average working speed) and 230 bar (average working pressure).

5.3. Final Results

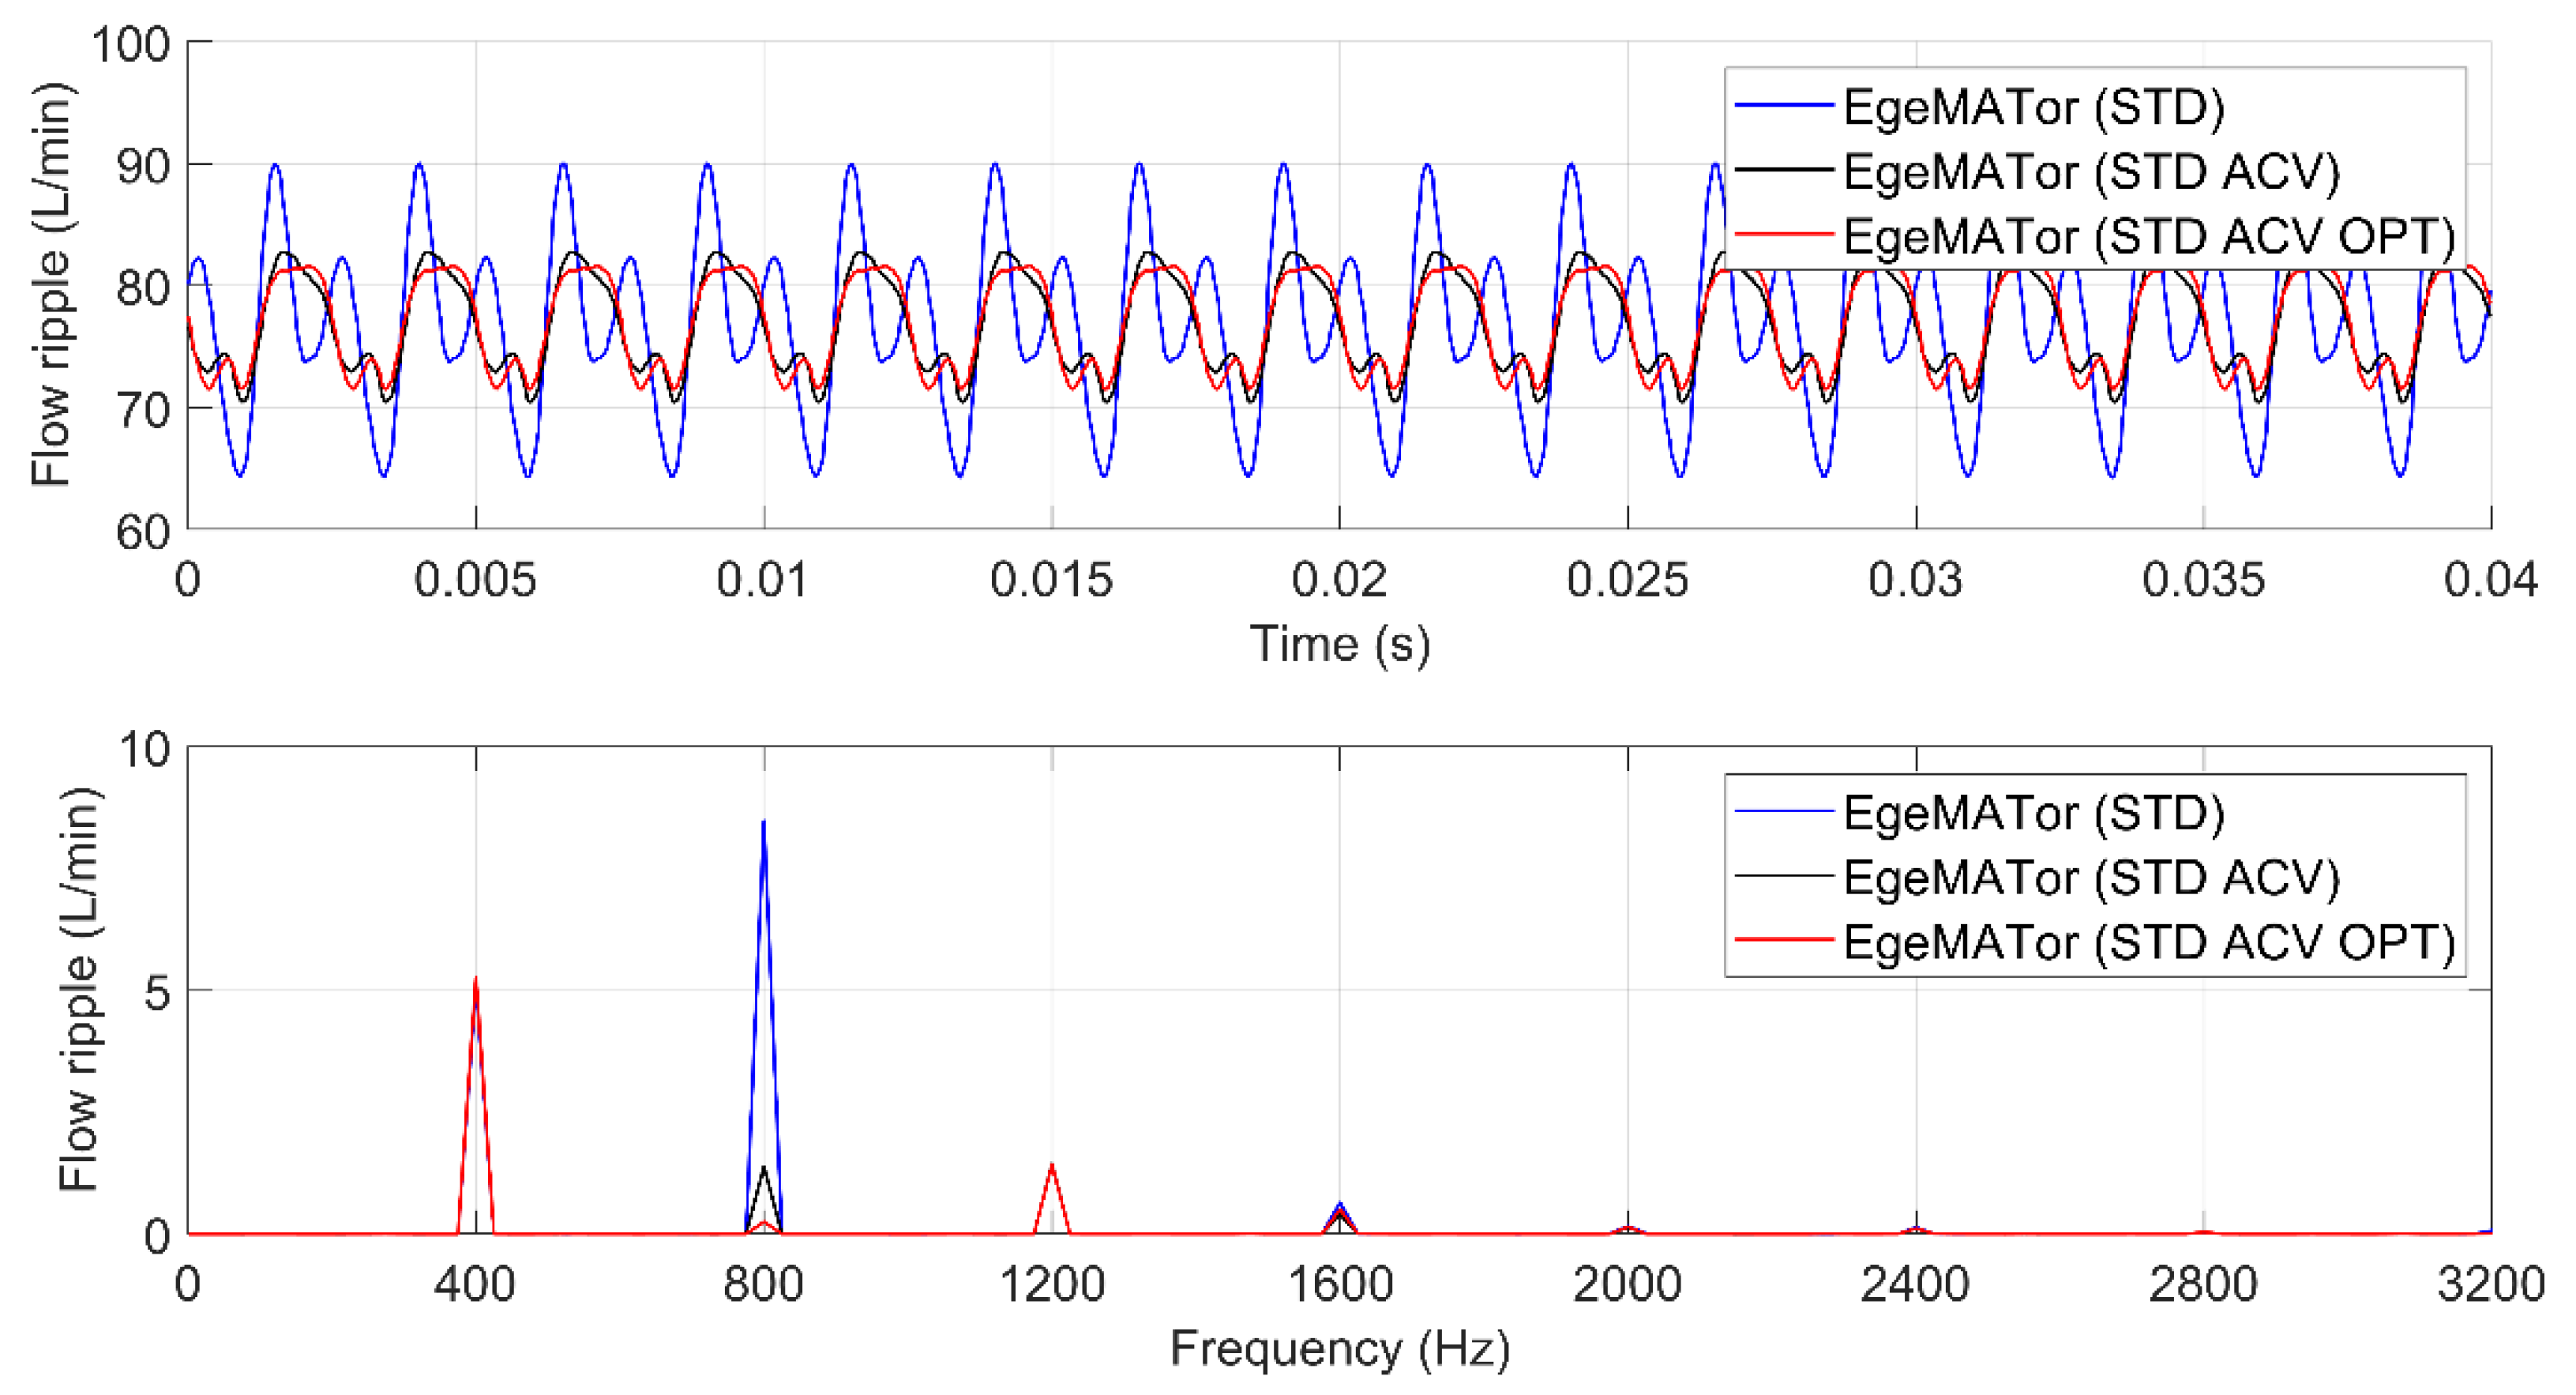
Using EgeMATor, further analysis is presented in Figure 19, where the numerical flow ripple comparison has been reported, for both time and frequency domains, among the initial standard pump (blue line), the pump with the ACV (black line), and the pump with the ACV angle optimized (red line). A further reduction in the flow ripple amplitude using the optimized angle is clearly visible from the figure’s top plot. The same results are evident in the frequency domain, again on the second fundamental frequency (800 Hz).
Table 1 presents a summary of the NUG reduction achieved with the optimization process.
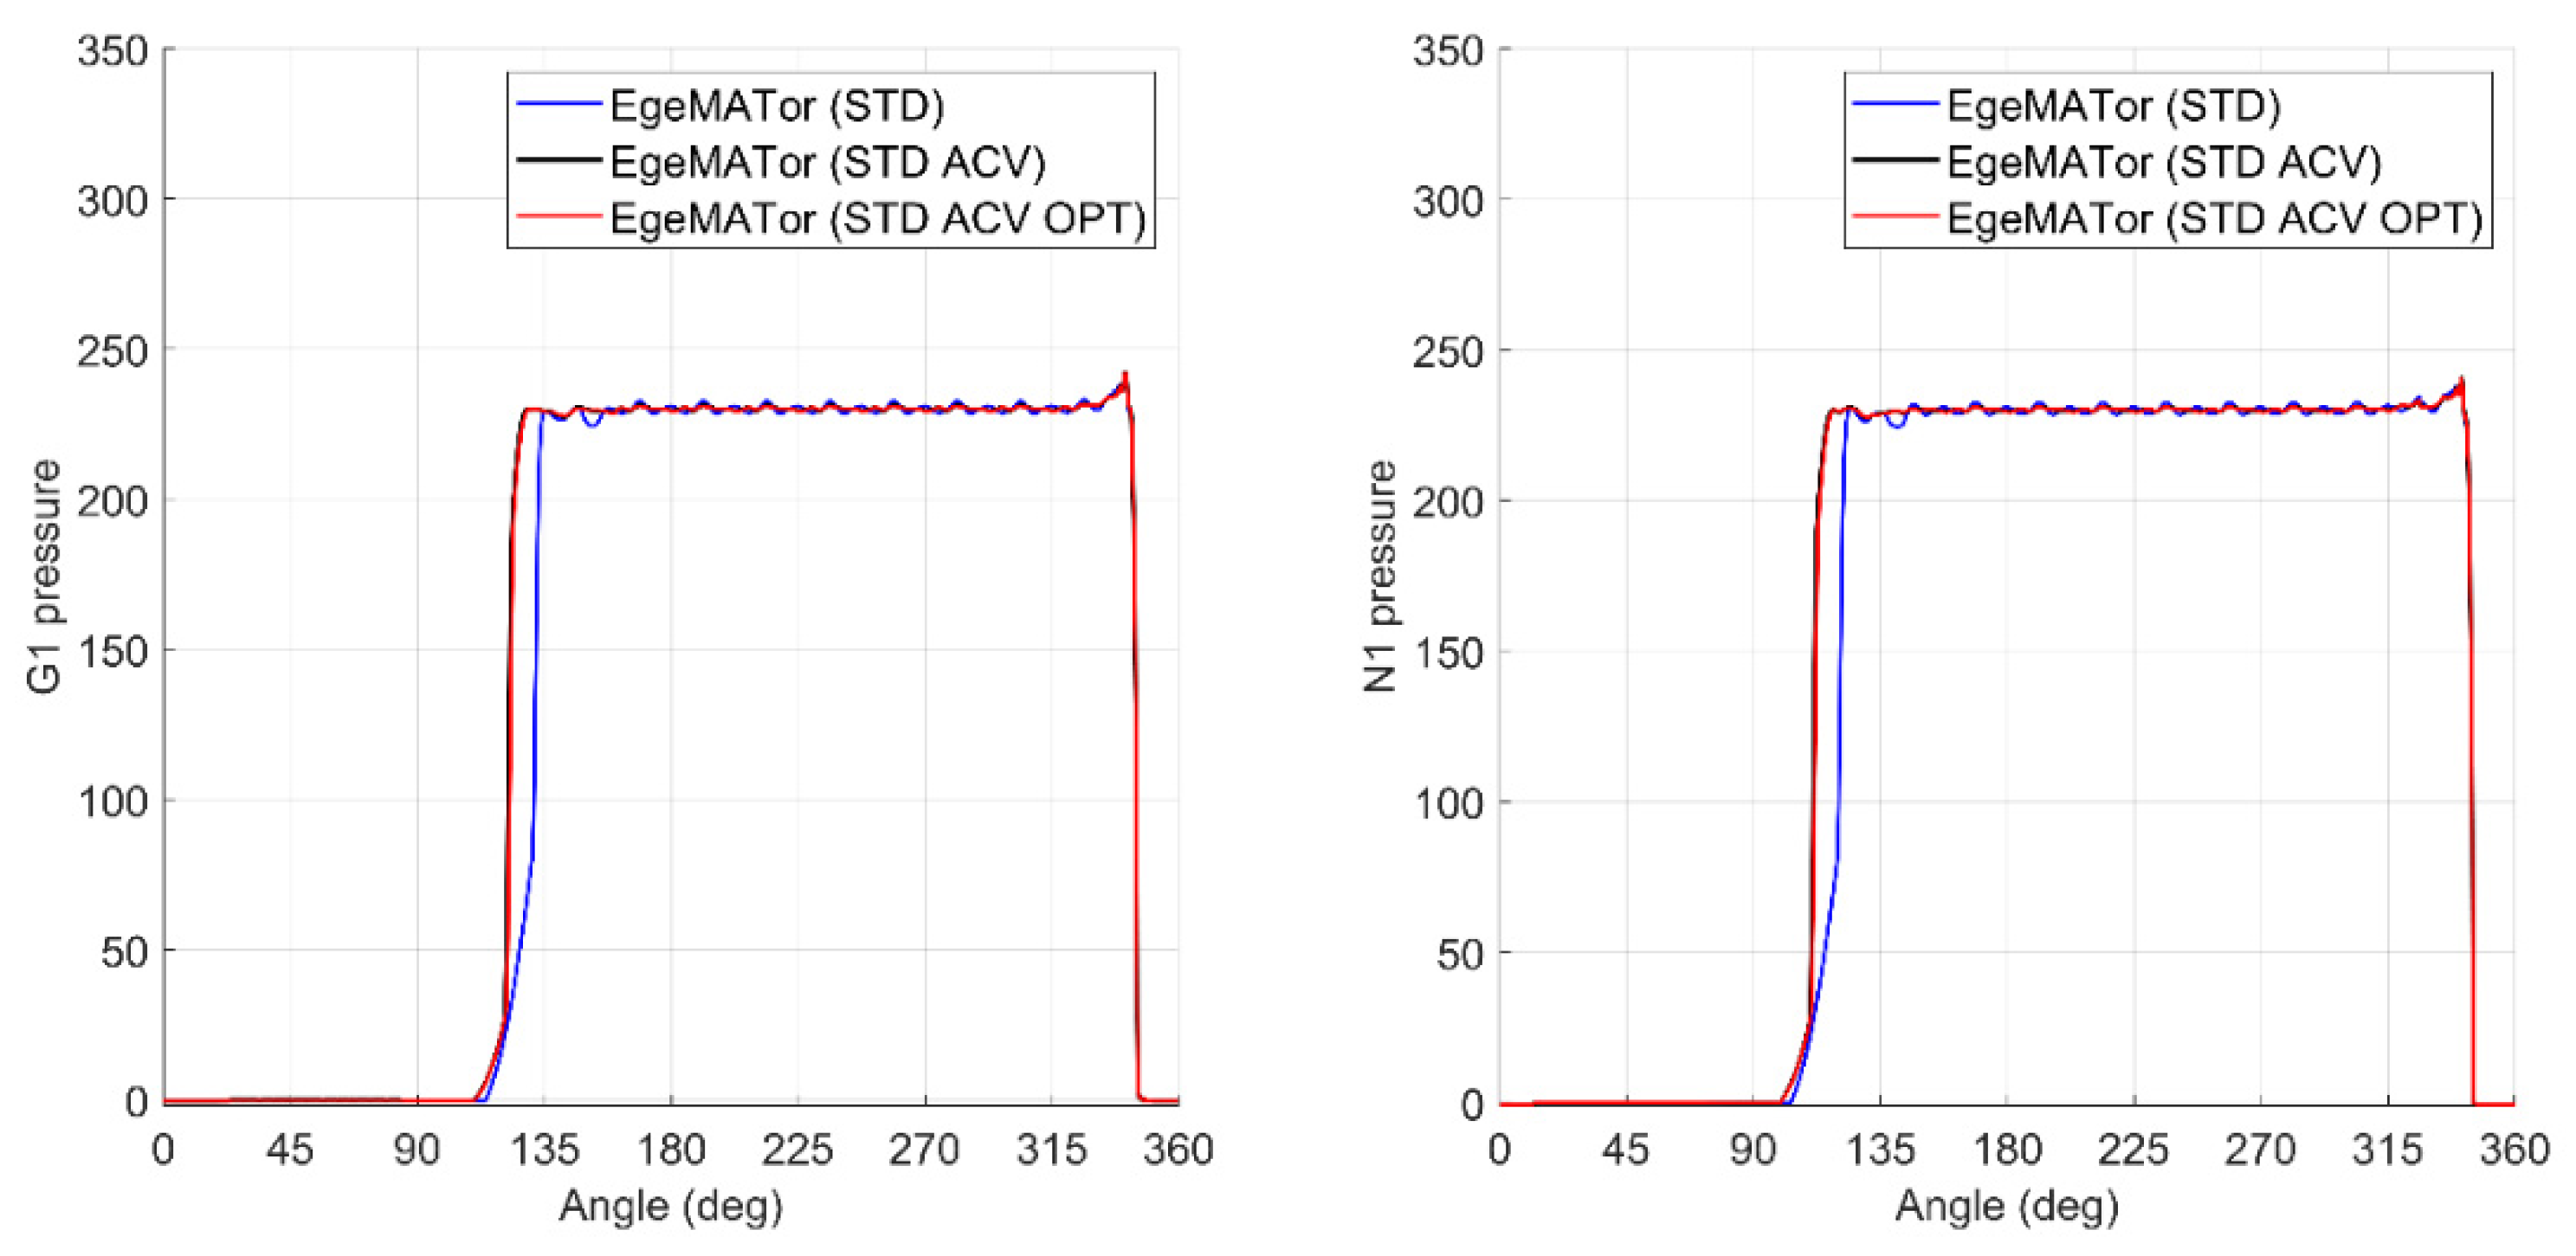
As for the Gi and Ni pressure distributions visible in Figure 20, the effects of the ACV introduction are also evident. The pressurization, due to the tip leakage, becomes shorter in terms of angular extension.
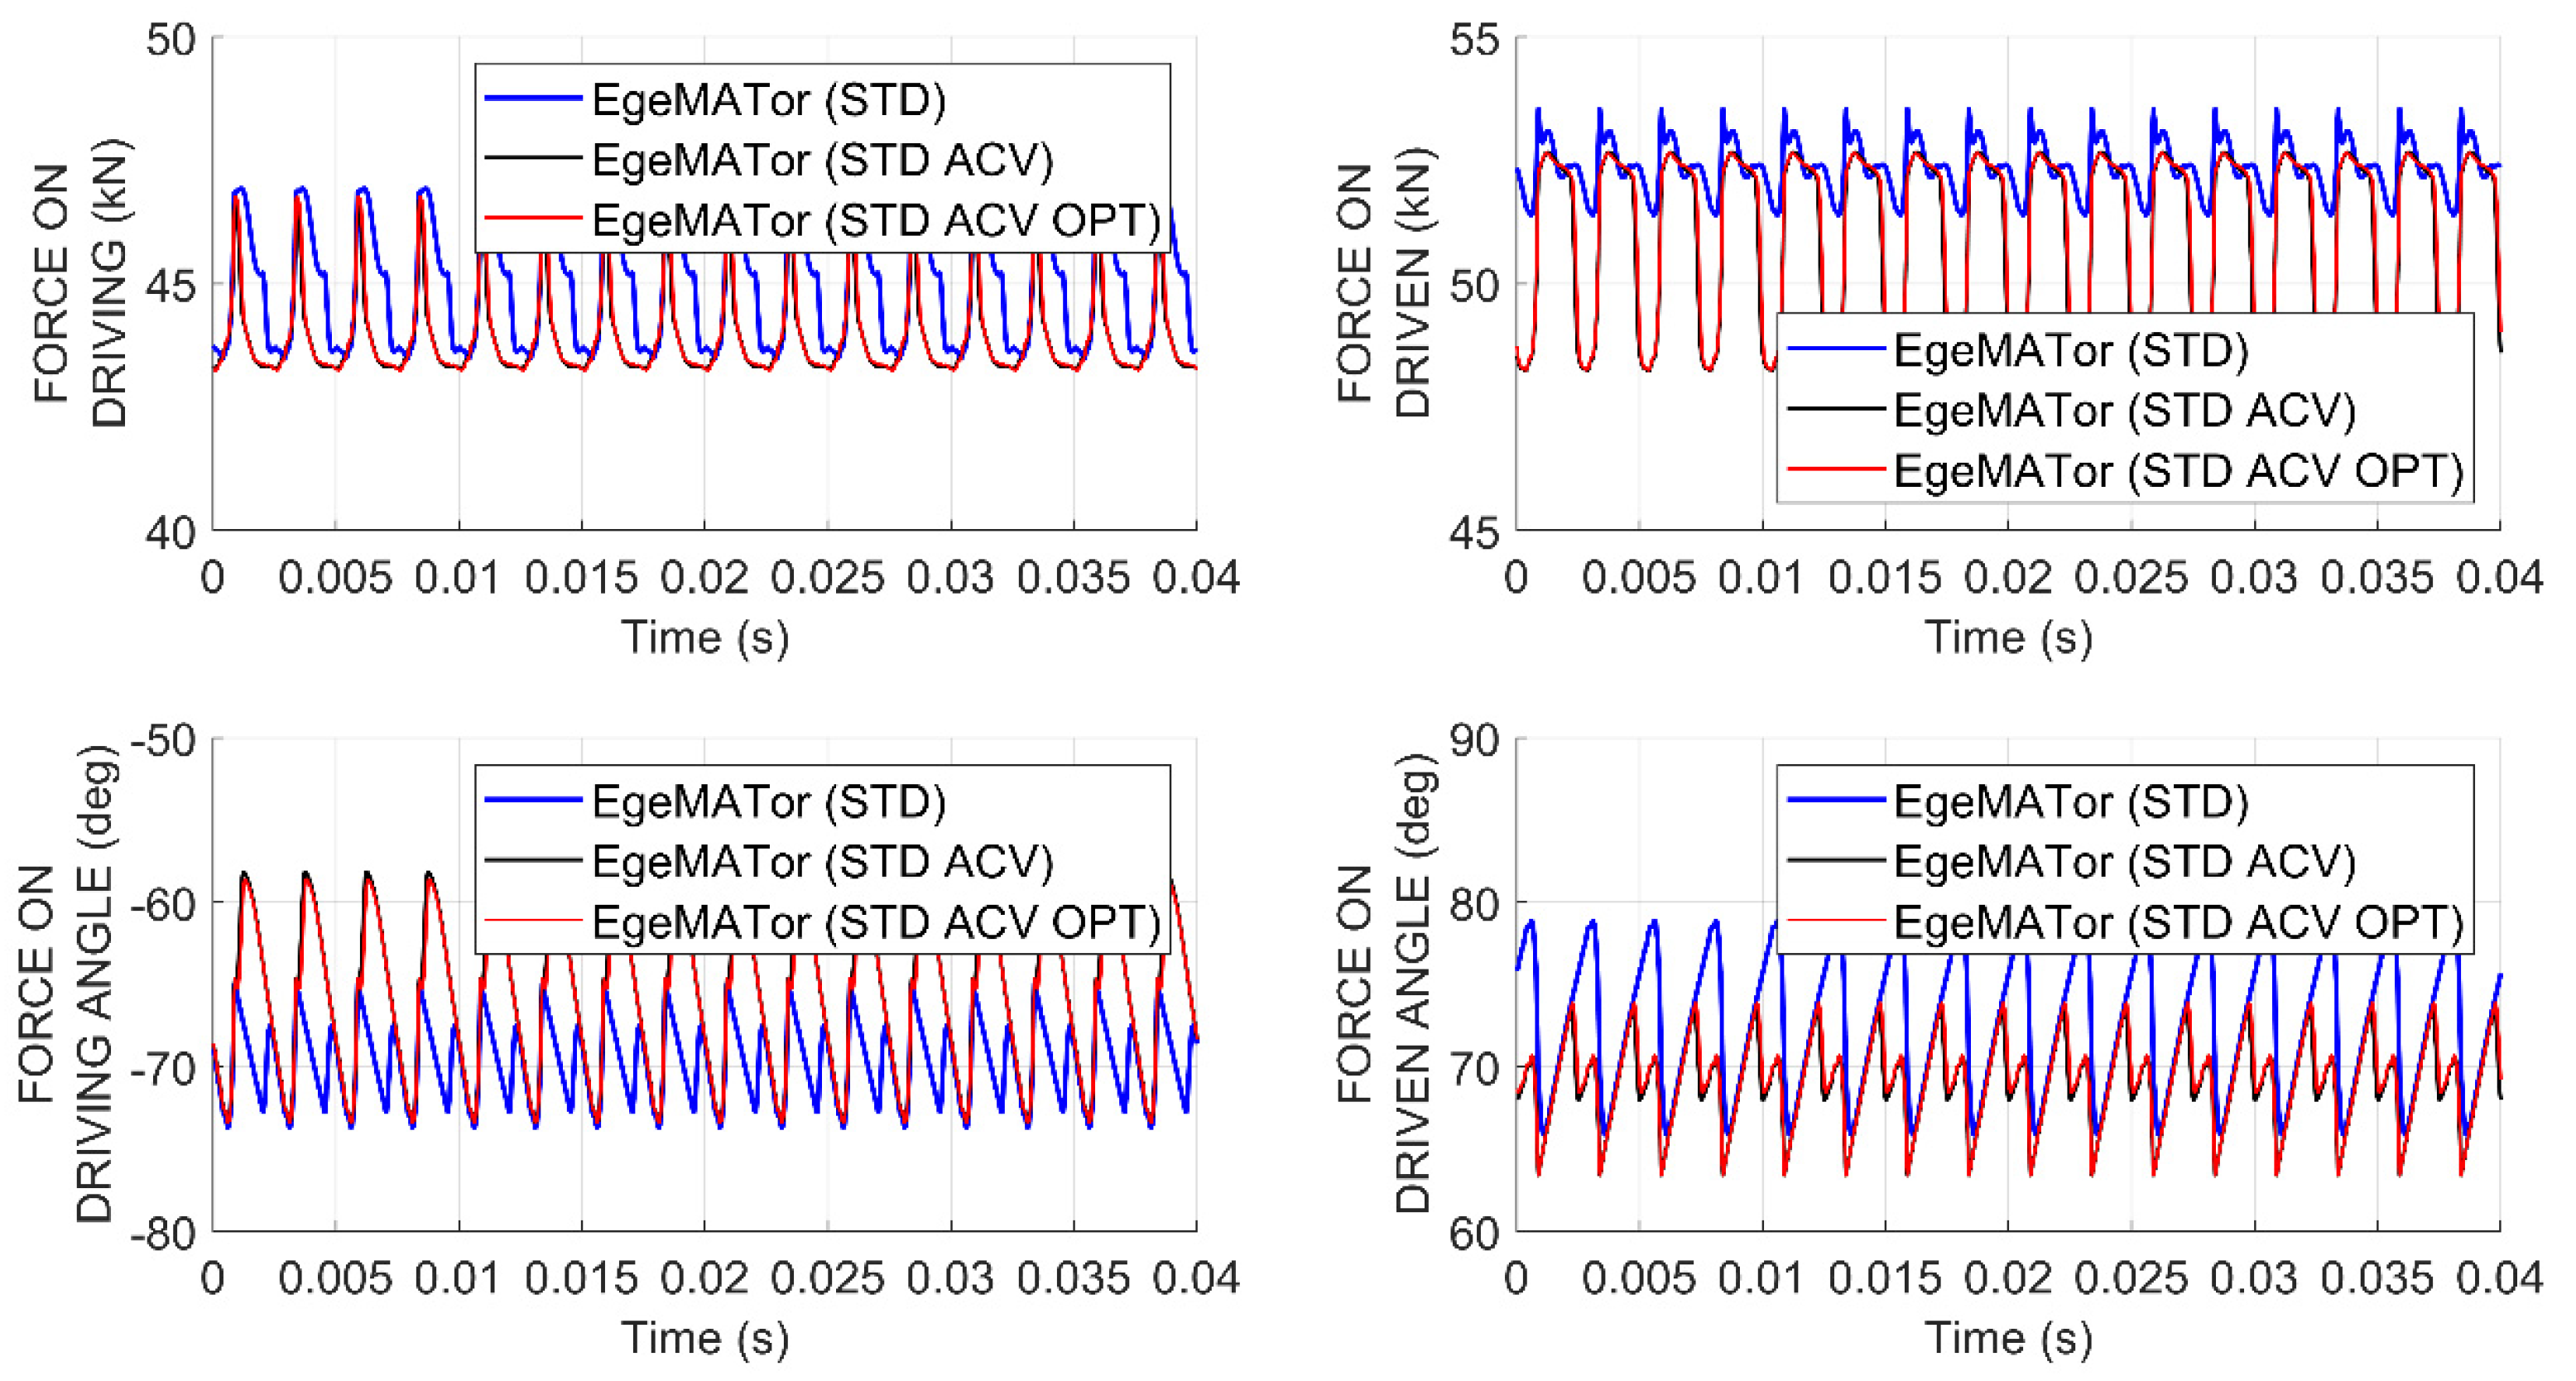
Since EgeMATor can also evaluate force and torque on the gears through a subroutine developed in MATLAB®, the following figures have been presented to compare the three different pumps, showing the effects of the ACV introduction on the forces and torques ripples.
As can be seen from Figure 21 and Figure 22, only a slight variation on forces acting on the gears has been observed. Non-relevant variations have been appreciated on the torque acting on the shaft.
This analysis confirms that the ACV system can reduce the pump’s fluid-borne noise without increasing the structural borne-noise, which is mainly influenced by oscillating forces and torques.
Another six working conditions have been analyzed to understand the ACV’s effects at different speeds and pressures. A summary of this analysis has been reported in Table 2, where it is evident that, at the same speed used as a boundary condition for the optimization process, the flow ripple reduction (in terms of NUG) is still very interesting, also varying the pump outlet pressure (studies number 1 and 2). In other cases, particularly for studies numbers 3 and 4, the improvements are less relevant but still consistent at a lower speed. At higher speed (studies numbers 5 and 6), the benefits disappeared, and indeed, the NUG got slightly worse.
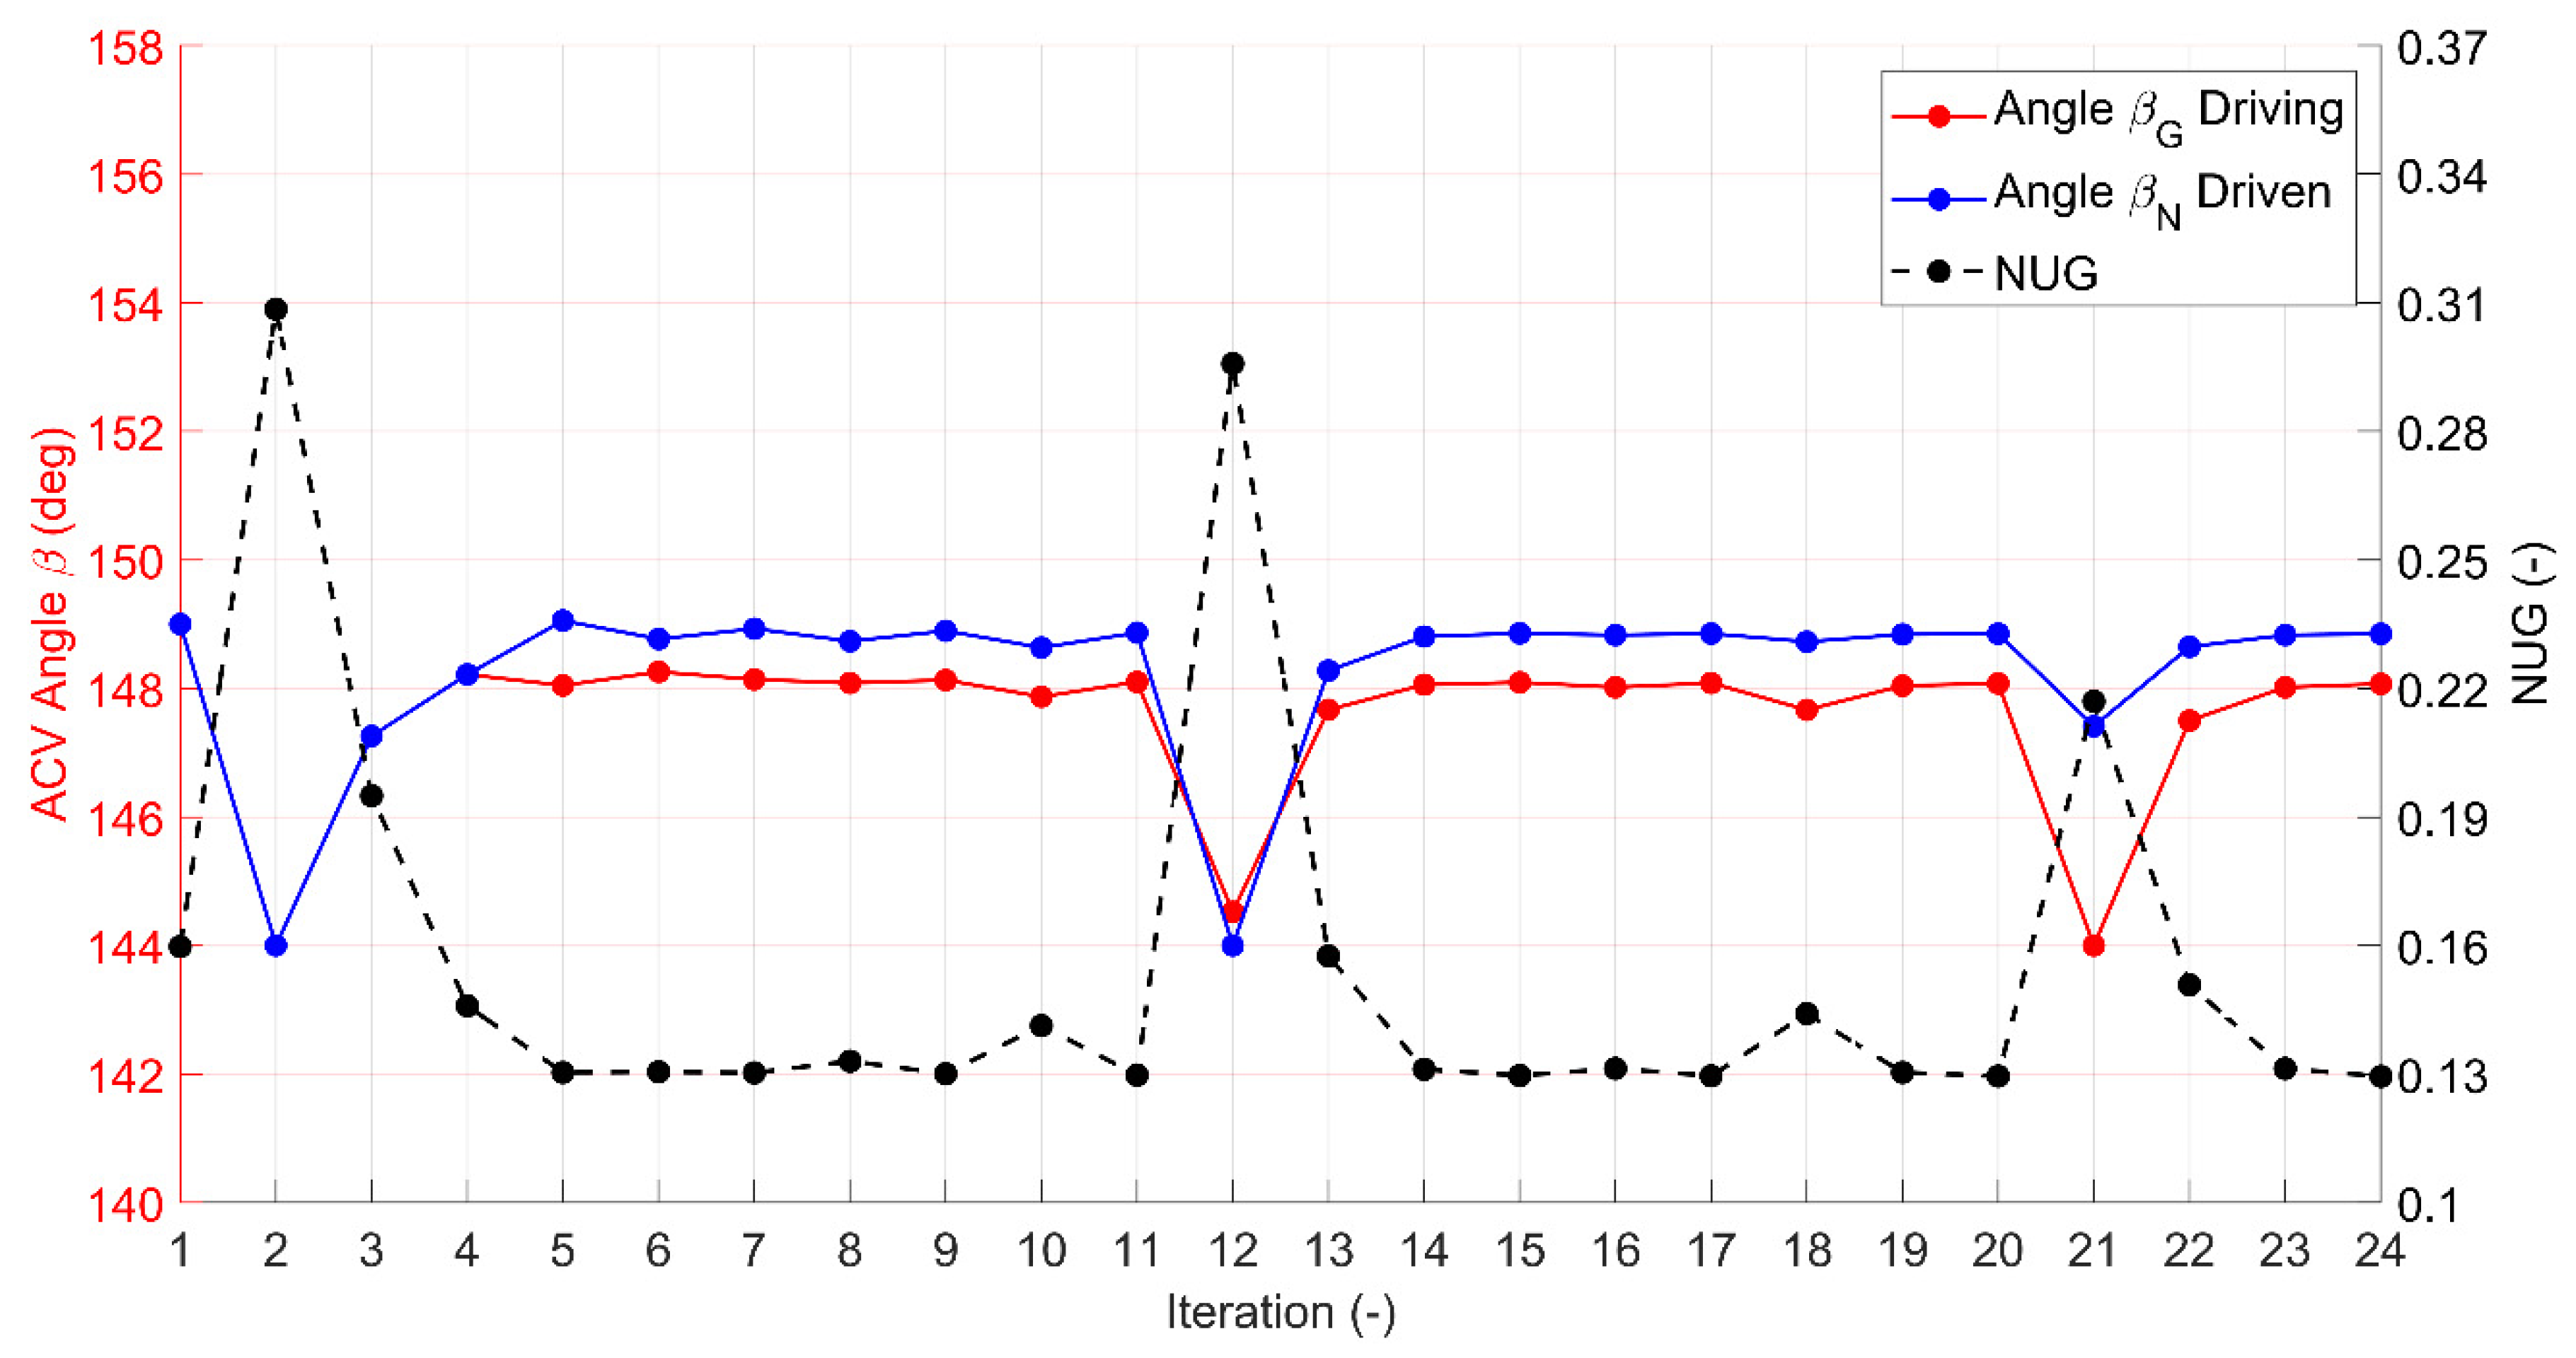
Finally, an additional optimization process has been run. In this case, the input parameter Δβ, which shifts the connection hole to the ACV, has been differentiated for the driving and the driven gears. The optimization process trend for this analysis has been shown in Figure 23, where it can be noted that after twenty-four iterations, even if the NUG has been further reduced, the improvement achieved differentiating the two angles is irrelevant. Indeed, the optimized NUG is now equal to 0.129, which means a further reduction of 1.5%, a value not relevant if it is considered that the wear-plate will lose its symmetry (that simplifies the meshing and the assembly processes).

6. Conclusions

In this paper, two different approaches to simulate the fluid-dynamic of an EGP have been presented. The first methodology is based on the control volume approach, and it has been simulated through a tool (EgeMATor) developed by the Fluid Power Research Group of the Universities of Naples Federico II and Sannio. The second methodology uses a three-dimensional CFD commercial software that includes a specific template mesher for EGPs. Since no experimental data were available during the analysis, because the pump was still in a prototyping phase, results from both methodologies have been compared; in particular, the three-dimensional CFD simulation has also been used to validate the EgeMATor results deeply. Due to the nature itself of the CFD simulation, where contact between pump elements cannot be realized since a minimum fluid gap is always required (to avoid zero volume cells), two models have been realized with EgeMATor: the first one (called STD) replicates a perfect sealing during the simulation, while the second model, instead, uses the minimum gaps as imposed in the three-dimensional CFD model. Obtained results have permitted validation of the EgeMATor approach, so the tool has been used to run further analyses. Two volumes have been accommodated in the pump housing, and they have been used to cyclically connect the delivery volume and the displacement chambers through two opportune orifices. The new system, called ACV, has been used to control the reverse flow coming from the pump outlet, that pressurizes the displacement chamber. In this way, the reverse flow has been controlled and uniformized. The wear-plate geometries have been optimized with an NLPQL algorithm, showing a reduction of the flow ripple (NUG) by 61%, substantially reducing the fluid-borne noise. Analysis of forces and torques that could create structural vibrations has been done as well. The results, obtained with EgeMATor, showed no significant variation on gears’ forces and torques. Further optimization will be done on orifices’ dimensions and ACV volumes, but the actual best design will be manufactured and tested before that.

Author Contributions

Conceptualization, A.S., E.F. and G.M.; methodology, G.M. and E.F.; software, G.M.; validation with the 3D CFD code, G.M. and E.F.; formal analysis, G.M.; investigation, G.M. and E.F.; writing—original draft preparation, G.M. and E.F.; writing—review and editing, G.M., E.F. and A.S.; visualization, G.M. and E.F.; supervision, A.S. and E.F.; funding acquisition, A.S. and E.F. All authors have read and agreed to the published version of the manuscript.

Funding

This research has been developed as part of a PhD Program supported by the MIUR (Ministero dell’Istruzione dell’Università e della Ricerca) of the Italian Government, it involves two Universities (the University of Naples “Federico II” and the University of Minnesota) and the international company Duplomatic MS.

Institutional Review Board Statement

Not applicable.

Informed Consent Statement

Not applicable.

Data Availability Statement

Not applicable.

Acknowledgments

The authors would like to thank Bsim s.r.l. and OMIQ s.r.l., for providing software. They appreciate the support from Roberto Maddalon and Michele Pavanetto of Duplomatic MS SpA.

Conflicts of Interest

The authors declare no conflict of interest.

Nomenclature

Acronyms
NameDescriptions
ACVAlternative Capacitive Volumes
CADComputer-Aided Design
CFDComputational Fluid Dynamic
CPUCentral Processing Unit
DXFDrawing Exchange Format
EDGMEquilibrium Dissolved Gas Model
EgeMATorExternal Gear Machine Multi Tool Simulator
EGMsExternal Gear Machines
EGPExternal Gear Pump
GIFGraphical Interchange Format
ISOInternational Organization for Standardization
NCGNon-Condensable Gas
NLPQLNon-Linear Programming by Quadratic Lagrangian
NSGA-IINon-dominated Sorting Genetic Algorithm II
NUGNon-Uniformity Grade
RANSReynolds Average Navier-Stokes
Symbols
NameDescriptions
CeCavitation evaporation coefficient
DvDiffusivity of the vapor mass fraction (m2/s)
Dg,dDiffusivity of the dissolved NCG (m2/s)
fd,equil,refEquilibrium mass fraction of the dissolved gas at the reference pressure
fgMass fraction of free NCG
fg,dFree NCG mass fraction
fg,fMass fraction of dissolved NCG
fg,specifiedUser-specified value
fvMass fraction of the vapor
n Surface normal of the surface σ
pPressure (Pa)
pd,equil,refReference pressure for the dissolved gas equilibrium mass fraction (Pa)
pvPhase-change threshold pressure (Pa)
QFlowrate (L/min)
ReVapor generation rate
RcVapor condensation rate
Sg,dSource of dissolved NCG (kg/m3)
VVolume (m3)
V Fluid velocity vector (m/s)
VEEstimated pump displacement (m3/rev)
VG,ii-th volume of the driving gear (m3)
VN,ii-th volume of the driven gear (cm3)
tTime (s)
zTNumber of teeth
Greek Symbols
βAngle on the ACV
βkFluid bulk modulus
μtTurbulent viscosity (Pa·s)
ρDensity of mixture (kg/m3)
ρatmFluid density at atmospheric pressure (kg/m3)
ρgDensity of gas (kg/m3)
ρlDensity of liquid (kg/m3)
σSurface of the control volume (m2)
σg,dDissolved Gas Schmidt number
σvVapor Schmidt number
ΩControl volume (m3)
τTime scale (s)
τ Stress tensor
φAngle (deg)
ΔφSaving delta angle (deg)

Appendix A

In this appendix, a study on a different pump is presented to show the effectiveness of the EgeMATor tool. This pump has a lower number of teeth per gear, 10 instead of 16. It can be seen from Figure A1 and Figure A2, showing flow ripple and displacement chambers’ pressure distributions, that there is a good agreement between the 3D CFD approach and the EgeMATor model. In this case, experimental results (P-Q curve) were available, and the models were validated on the average outlet flow.
Figure A1. Flow ripple comparison at 1500 rpm and 260 bar for a 10-teeth EGP in time and frequency domains.
Energies 14 00471 g0a1
Figure A2. Gi and Ni pressure distributions for a 10-teeth EGP.
Energies 14 00471 g0a2

References

  1. Ivantysyn, J.; Ivantysynova, M. Hydrostatic Pumps and Motors: Principles, Design, Performance, Modelling, Analysis, Control, and Testing; Akademia Books International: New Delhi, India, 2001; ISBN 8185522162. [Google Scholar]
  2. Rundo, M. Models for Flow Rate Simulation in Gear Pumps: A Review. Energies 2017, 10, 1261. [Google Scholar] [CrossRef] [Green Version]
  3. Manring, N.D.; Kasaragadda, S.B. The theoretical flow ripple of an external gear pump. J. Dyn. Syst. Meas. Control 2003, 125, 396. [Google Scholar] [CrossRef]
  4. Vacca, A.; Guidetti, M. Modelling and experimental validation of external spur gear machines for fluid power applications. Simul. Model. Pract. Theory 2011, 19, 2007–2031. [Google Scholar] [CrossRef]
  5. Zhao, X.; Vacca, A. Formulation and optimization of involute spur gear in external gear pump. Mech. Mach. Theory 2017, 117, 114–132. [Google Scholar] [CrossRef]
  6. Rituraj, F.; Vacca, A.; Morselli, M.A. Modeling of manufacturing errors in external gear machines and experimental validation. Mech. Mach. Theory 2019, 140, 457–478. [Google Scholar] [CrossRef]
  7. Riturai, R.; Vacca, A.; Morselli, M.A. Thermal Modelling of External Gear Machines and Experimental Validation. Energies 2020, 13, 2920. [Google Scholar] [CrossRef]
  8. Zhao, X.; Vacca, A.; Sujan, D. Numerical modeling of a helical external gear pump with continuous-contact gear profile: A comparison between a lumped-parameter and a 3D CFD approach of simulation. In Proceedings of the BATH/ASME 2018 Symposium on Fluid Power and Motion Control, Bath, UK, 12–14 September 2018. [Google Scholar]
  9. Borghi, M.; Zardin, B.; Specchia, E. External gear pump volumetric efficiency: Numerical and experimental analysis. In Proceedings of the SAE 2014 World Congress and Exhibition, Detroit, MI, USA, 8–10 April 2009. [Google Scholar]
  10. Zardin, B.; Natali, E.; Borghi, M. Evaluation of the Hydro—Mechanical Efficiency of External Gear Pumps. Energies 2019, 12, 2468. [Google Scholar] [CrossRef] [Green Version]
  11. Mancò, S.; Nervegna, N. Simulation of an external gear pump and experimental verification. In Proceedings of the JHPS International Symposium on Fluid Power, Tokyo, Japan, 13–16 March 1989. [Google Scholar]
  12. Zhou, J.; Vacca, A.; Casoli, P. A novel approach for predicting the operation of external gear pumps under cavitating conditions. Simul. Model. Pract. Theory 2014, 45, 35–49. [Google Scholar] [CrossRef]
  13. Zardin, B.; Borghi, M. Modeling and simulation of external gear pumps and motors. In Proceedings of the 5th FPNI—PhD Symposium on Fluid Power, Krakow, Poland, 1–5 January 2008. [Google Scholar]
  14. Falfari, S.; Pelloni, P. Setup of a 1D model for simulating dynamic behaviour of external gear pumps. In Proceedings of the SAE 2007 Commercial Vehicle Engineering Congress & Exhibition, Rosemont, IL, USA, 30 October–2 November 2007. [Google Scholar]
  15. Mucchi, E.; Dalpiaz, G.; Fernandez Del Rincon, A. Elastodynamic analysis of a gear pump. Part I: Pressure distribution and gear eccentricity. Mech. Syst. Signal Process. 2010, 24, 2160–2179. [Google Scholar]
  16. Strasser, W. CFD investigation of gear pump mixing using deforming/agglomerating mesh. J. Fluids Eng. 2007, 129, 476–484. [Google Scholar] [CrossRef]
  17. Qi, F.; Dhar, S.; Nichani, V.H.; Srinivasan, C.; Wang, D.M.; Yang, L.; Bing, Z.; Yang, J.J. A CFD study of an electronic hydraulic power steering helical external gear pump: Model development, validation and application. SAE Int. J. Passeng. Cars Mech. Syst. 2016, 9, 346–352. [Google Scholar] [CrossRef]
  18. Corvaglia, A.; Ferrari, A.; Rundo, M.; Vento, O. Three-dimensional model of an external gear pump with an experimental evaluation of the flow ripple. Proc. Inst. Mech. Eng. Part C J. Mech. Eng. Sci 2020, 1–9. [Google Scholar] [CrossRef]
  19. Castilla, R.; Gamez-Montero, P.; Ert€urk, N.; Vernet, A.; Coussirat, M.; Codina, E. Numerical Simulation of Turbulent Flow in the Suction Chamber of a Gearpump Using Deforming Mesh and Mesh Replacement. Int. J. Mech. Sci. 2010, 52, 1334–1342. [Google Scholar] [CrossRef]
  20. Castilla, R.; Gamez-Montero, P.J.; Del Campo, D.; Raush, G.; Garcia-Vilchez, M.; Codina, E. Three-dimensional numerical simulation of an external gear pump with decompression slot and meshing contact point. J. Fluids Eng. 2015, 137, 041105. [Google Scholar] [CrossRef]
  21. Borghi, M.; Milani, M.; Paltrinieri, F.; Zardin, B. Pressure transients in external gear pumps and motors meshing volumes. In Proceedings of the SAE Commercial Vehicle Engineering Congress, Chicago, IL, USA, 1–3 November 2005. [Google Scholar]
  22. Frosina, E.; Marinaro, G.; Senatore, A. Experimental and numerical analysis of an axial piston pump: A comparison between lumped parameter and 3D CFD approaches. In Proceedings of the ASME-JSME-KSME 2019 8th Joint Fluids Engineering Conference, AJKFluids, San Francisco, CA, USA, 28 July–1 August 2019. [Google Scholar]
  23. Olivetti, M.; Monterosso, F.G.; Marinaro, G.; Frosina, E.; Mazzei, P. Valve Geometry and Flow Optimization through an Automated DOE Approach. Fluids 2020, 5, 17. [Google Scholar] [CrossRef] [Green Version]
  24. Frosina, E.; Senatore, A.; Rigosi, M. Study of a high-pressure external gear pump with a computational fluid dynamic modeling approach. Energies 2017, 10, 1113. [Google Scholar] [CrossRef] [Green Version]
  25. Frosina, E.; Marinaro, G.; Senatore, A.; Pavanetto, M. Effects of PCFV and Pre-Compression Groove on the Flow Ripple Reduction in Axial Piston Pumps. In Proceedings of the 2018 Global Fluid Power Society PhD Symposium, GFPS 2018, Samara, Russia, 18–20 July 2018. [Google Scholar]
  26. Singhal, A.K.; Athavale, M.M.; Li, H.Y.; Jiang, Y. Mathematical basis and validation of the full cavitation model. J. Fluids Eng. 2002, 124, 617–624. [Google Scholar] [CrossRef]
  27. Simerics Inc. Simerics MP+’s User Manual—V 5.0.11; Simerics: Bellevue, WA, USA, 2020. [Google Scholar]
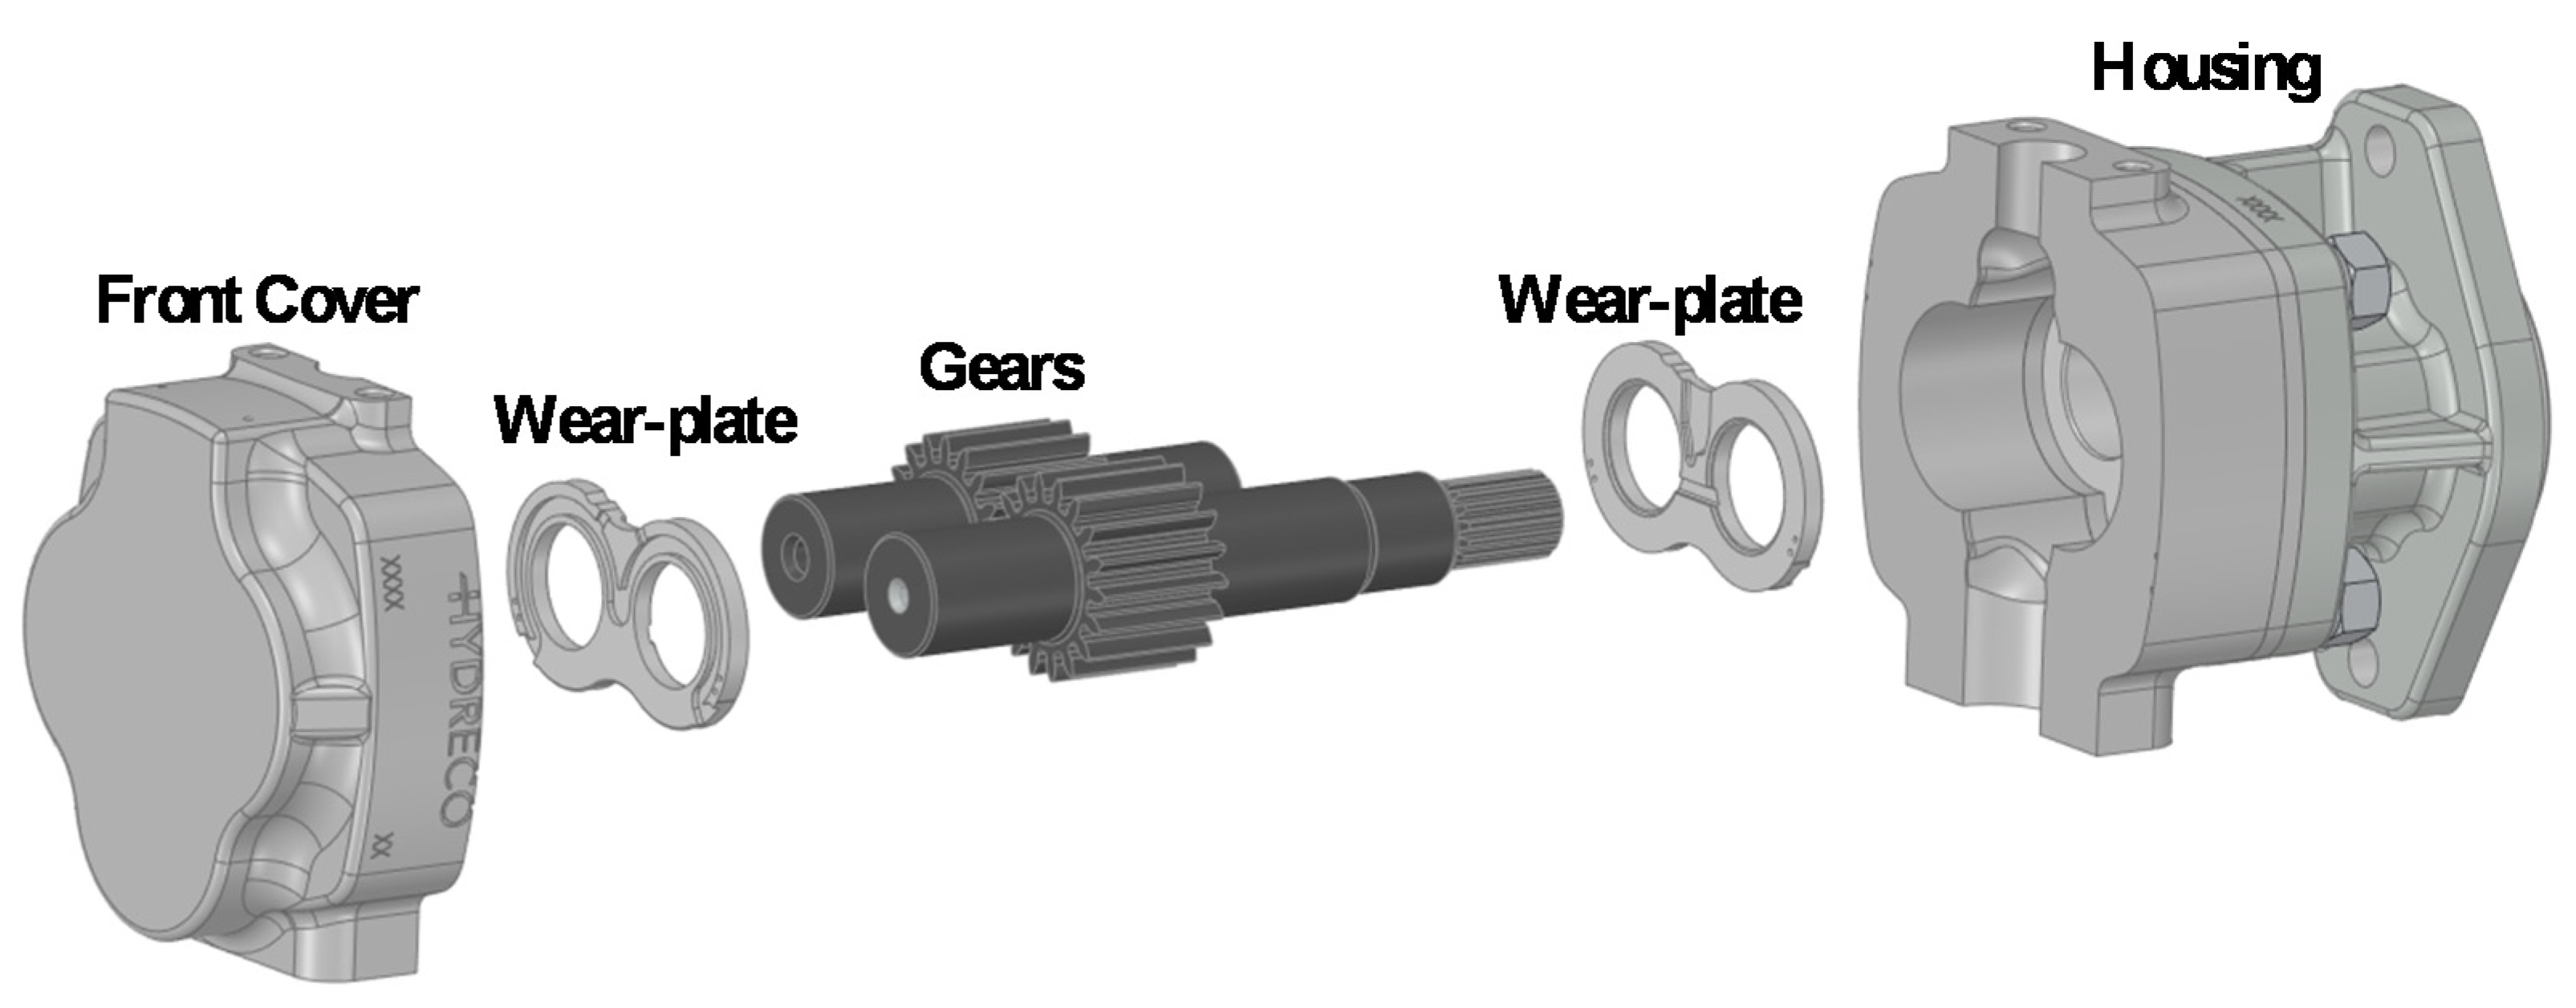
Figure 1. Reference external gear pump.
Energies 14 00471 g001
Figure 2. The EgeMATor’s (External Gear Machine Multi Tool Simulator) workflow.
Energies 14 00471 g002
Figure 3. The Surface Tool: (a) Excel sheet input sample for the Surface Tool input; (b) Sample of output data.
Energies 14 00471 g003
Figure 4. Extracted frames from the GIF animation at: (a) 10 deg of rotation; (b) 320 deg of rotation.
Energies 14 00471 g004
Figure 5. Overview of the lumped parameter model.
Energies 14 00471 g005
Figure 6. Variation of “saving delta angle” (Δφ): (a) Effects of the “saving delta angle” (Δφ) variation on the numerical flow ripple; (b) Effects of the “saving delta angle” (Δφ) on the computational time of the Surface Tool and the Hydraulic Simulation.
Energies 14 00471 g006
Figure 7. Hydraulic simulation model overview.
Energies 14 00471 g007
Figure 8. Three-dimensional CFD numerical model: (a) Extracted fluid volume; (b) the mesh in the meshing volume.
Energies 14 00471 g008
Figure 9. Section of the domain mesh—Teeth gap in the zoomed view.
Energies 14 00471 g009
Figure 10. Outlet flow ripple at 1500 rev/min and 350 bar in time and frequency domains.
Energies 14 00471 g010
Figure 11. Gi and Ni pressure distributions.
Energies 14 00471 g011
Figure 12. Tip leakage across driving tooth n°2 G2 at 1500 rev/min and 350 bar.
Energies 14 00471 g012
Figure 13. Pump housing views with highlighted ACV surfaces: (a) Front view; (b) Prospective view.
Energies 14 00471 g013
Figure 14. Wear-plate design: (a) Standard configuration; (b) Configuration with orifice connection to the ACV.
Energies 14 00471 g014
Figure 15. Outlet flow ripple at 1500 rev/min and 230 bar in time and frequency domains.
Energies 14 00471 g015
Figure 16. Standard vs. ACV (no gap), outlet flow ripple at 1500 rev/min and 230 bar in time and frequency domains.
Energies 14 00471 g016
Figure 17. Definition of the Angle β.
Energies 14 00471 g017
Figure 18. Optimization process trend.
Energies 14 00471 g018
Figure 19. Flow ripple comparison at 1500 rpm and 230 bar in time and frequency domains.
Energies 14 00471 g019
Figure 20. Gi and Ni pressure distributions.
Energies 14 00471 g020
Figure 21. Numerical forces and their directions acting on driving and driven gears.
Energies 14 00471 g021
Figure 22. Contact force and numerical torques acting on driving and driven gears.
Energies 14 00471 g022
Figure 23. Second optimization process trend.
Energies 14 00471 g023
Table 1. Results summary at 1500 rev/min and 230 bar.
EgeMATor ModelNUGReduction from STD Model
Standard (STD)0.334/
with ACV (STD ACV)0.160−52.1%
with ACV optimized (STD ACV OPT)0.131−60.8%
Table 2. Analysis of different working conditions.
Study NumberPump Speed
(rev/min)
Outlet Pressure
(bar)
NUG STD
(/-)
NUG STD ACV OPT
(/)
Variation
(%)
115003500.4030.170−57.82%
215001200.2690.159−40.89%
38003500.4820.392−18.67%
48001200.3080.234−24.03%
530003500.3400.363+6.76%
630001200.3170.345+8.83%
Publisher’s Note: MDPI stays neutral with regard to jurisdictional claims in published maps and institutional affiliations.