1. Introduction
In the field of fluid power, external gear pumps represent the most used type of fixed displacement machine. The main advantages are the robustness, the simple design, as well as the low cost. On the contrary, drawbacks are high ripple and noise. In spite of the simplicity of the component, the development of a simulation tool for predicting the performance involves several complex aspects.
Starting from the late eighties, a significant number of papers has been written on modelling, simulation and testing of external gear pumps [
1]. A first classification of the models available in literature can be based on the level of spatial discretization of the fluid domain. The simplest type consists in considering all chambers physically connected to the outlet volume as a single variable control volume with homogeneous fluid properties. In a similar way the inlet volume is defined. Moreover, additional volumes are used for the chambers not connected neither to the inlet nor to the delivery side [
2,
3]. With this type of model, coupled to a model of the hydraulic circuit connected to the pump, it is possible to reproduce the delivery pressure oscillations.
For an in-depth analysis of the phenomena inside the pump, a control volume must be associated to each volume between two consecutive teeth of the gears, so that it is possible to better reproduce the evolution of the pressure above all in the meshing region. These models were developed in the first decade of this century by different research groups [
4,
5,
6,
7,
8,
9,
10] and they are continuously improved. Recently, the methodology has been extended also to helical gear pumps [
11].
The further step is the CFD simulation, developed for the first time in the middle nineties [
12]. At the beginning the models were limited in studying the flow field in a two-dimensional domain. Models were built mainly with ANSYS Fluent
® [
13,
14,
15,
16], but also with OpenFoam
® [
17]. Progressively the analysis was extended in 3D portions of the pump [
18]. Nowadays, thanks to the improved computational capabilities of modern workstations, it is possible to simulate in reasonable times the entire pump in 3D. The literature reports some example of models in OpenFoam [
19], ANSYS CFX
® [
20,
21], and SimericsMP+
® [
22,
23,
24,
25].
However, despite the better discretization of the computational volume, the CFD models have an intrinsic limitation, since it is not possible to implement the micro-movements of the components due to the clearances under the action of the pressure and contact forces. This is an important aspect in the simulation of the gear machines, since it has an impact in the evaluation of the leakages and of the friction.
Different authors have developed lumped parameter models that take into account the axial movement and the tilt of the thrust plates, based on the equilibrium generated by the pressure distribution calculated in a two-dimensional domain [
26,
27,
28]. Further improvements are the elasto-dynamic lubrication [
29], the fluid–structure interaction [
30] and the mixed lubrication [
31]. Instead, the tooth tip leakage is influenced by the radial movement of the gears and examples of calculation of the current axis positions based on the radial force on the shaft can be found in the references [
32,
33]. Although usually the type of regime in such gaps is assumed to be purely laminar, more complex formulations based on CFD can be implemented for considering also turbulent regime [
34]. Finally, the lumped parameter models can be enriched with additional features such as specific cavitation models [
35,
36,
37] or for the evaluation of the mechanical-hydraulic efficiency [
38].
Considering all different analyzed aspects and the papers available in literature, in synthesis, the advantages of the CFD models, anyway variable from code to code, are listed hereinafter.
Evaluation of the flow through complex geometries without the need to make hypotheses on the type of regime, to make approximations on the flow areas and to supply the discharge coefficients, typically unknown.
More flexibility in simulating any kind of geometry in term of gears’ profiles and millings on the port plates.
Starting from scratch, the reduced time for passing from the CAD (computer-aided design) model to the simulation-ready fluid-dynamics model.
On the contrary, the drawbacks are not negligible and can be identified as follows.
High computational time, that makes the model not suitable for optimization analyses involving a high number of configurations, and anyway limited to very specific research activities.
The axis of rotation of the gears remain fixed and the axial clearance between gears and thrust plates is constant during the simulation. Moreover, since the dynamic misalignment of the gears with respect to their ideal position is neglected, some sources of vibration and noise cannot be correctly reproduced.
The lower flexibility in customizing the model with non-standard features not already included in the software package, such as different models of fluid or mesh topologies.
It is evident that, for the lumped parameter models, pros and cons are interchanged.
With reference to this context, and being aware of the listed drawbacks, the present paper focuses on the capability of a CFD model developed in SimericsMP+ of predicting two specific quantities: the tooth space pressure history and the suction pressure for the incipient incomplete filling. It is demonstrated that, for these types of analyses, the CFD approach gives good results. Thus, the aim of the paper is to find the best tradeoff and the best model setting for performing the abovementioned simulations with a high degree of confidence without the need of tuning on experimental data.
2. Description of the Pump
In
Figure 1a, a view of the pump Casappa Magnum HDP 30.51 is shown. The two gears with 10 teeth are integral with the shaft and housed in the pump casing. The shafts are supported by journal bearings mounted in the frontal and rear cover. Two thrust plates are inserted between the rotors and the covers, one of them is visible in
Figure 1b. Aim of the plates is the axial compensation of the gaps. In fact, on a proper rear surface of the plates, the delivery pressure is transferred, generating a clamping force on the gears. A second aim of the thrust plates is the management of the connection of the trapped volume in the gear meshing region with the inlet and outlet volume by means of proper millings. Two configurations of the plates were tested and simulated. The standard type A, shown in
Figure 1, was provided of peripheral channels and grooves used to transfer the delivery pressure back in a number of tooth spaces, in order to make the resultant radial force on the gear less sensitive to the operating conditions. With this plate, only one tooth volume in a time remains isolated for 36 degrees corresponding to an angular pitch. The type B was identical to type A but without the peripheral channels and groves, so that the tooth spaces remain isolated up to the direct connection with the delivery volume. In this case, five consecutive tooth space volumes remain always isolated. The main parameters of the pump are synthetized in
Table 1.
3. Test Rig
The pump was tested on a specific test bench installed at the Fluid Power Research Laboratory of the Politecnico di Torino. The test rig allows obtaining both steady-state and transient characteristics of fluid power pumps and motors.
In
Figure 2, the hydraulic scheme relative to the steady-state tests of pumps is shown. The unit under test is mounted in a closed circuit and can be driven in both directions of rotation. In the configuration shown in
Figure 2, the upper branch of the closed loop is the high-pressure side, therefore the delivery port of the pump, thanks to the non-return valves, is connected to the proportional pressure relief valve RV2 that simulates the load. The relief valve RV3 behaves as safety valve. A triple auxiliary external gear pump PU driven at 1500 rpm by a 7.5 kW electric motor (M2) takes the fluid from a 100 L reservoir with ISO VG46 hydraulic oil, whose viscosity was measured as function of the temperature with a Brookfield AMETEK DV1 viscosimeter. The stage 1 (20 cm
3/rev) is used for the circulation of the oil in the plate-type water-oil heat exchanger HE2 for controlling the temperature of the reservoir. The stage 2 (20 cm
3/rev) compensates the leakages of the closed loop and behaves as boost pump. The stage 3 (4 cm
3/rev) generates the pilot signal used in the slip-in cartridge valve that, along with a proportional stage, forms a pressure relief valve RV1 with a minimum pressure setting of about 3 bar. Considering the pressure drops between the valve RV1 and the pump under test, the pressure at the suction port can be set in a range with a minimum value even lower than the atmospheric pressure. The control signal of the proportional valves RV1 and RV2 can be imposed at a constant value or generated by a PID controller using as feedback the reading of a pressure transducer.
The water-oil heat exchanger HE1 cools the oil circulating in the low-pressure side of the loop and the flow rate of water is controlled by a proportional valve EV1 based on the feedback signal of the temperature transducer either at the inlet (T1) or at the outlet (T2) port of the pump. The reservoir temperature is controlled in a similar manner by means of the electrovalve EV2 and the transducer T3.
Two bi-directional turbine flowmeters Flow Technology FT-16 measure the inlet and outlet volumetric flow rate. For the present study, the raw frequency signal supplied by the turbine at the delivery port was acquired and the value of flow rate was calculated in post-processing by interpolating the calibration curves (supplied at 95 cSt and 10 cSt) at the current kinematic viscosity.
An ABB driver is used for controlling the speed in a closed loop of the main electric motor (M1) using as feedback signal the output of an integrated 1024 pulse/rev encoder. A torque meter is also present, even if not used for the present study.
In addition to the standard measuring equipment (transducers P1 and P2 with range 0–400 bar), for this test high dynamics pressure transducers were also mounted directly on the pump (
Table 2). More specifically, two pressure transducers GS were mounted on the pump casing for sensing the pressure in the inlet and in the outlet volumes. The transducers are temperature compensated in the range 0–60 °C.
Moreover, since the pump was already used by Mancò and Nervegna [
39] for a pioneering study at the Politecnico di Torino for measuring the time variation of a tooth space pressure, the unit is a customized version. In particular, the driver gear is equipped with a surface mount miniature pressure transducer fitted in a recessed slot machined at the bottom of a tooth space. The signal for the acquisition is taken via slip rings connected to a small shaft integral to the gear on the opposite side with respect to the main shaft. The driven gear is also provided with an 8 mm shaft, to which an ELCIS I05 S728 encoder with 1800 pulse/rev has been connected in the same way as reported in the reference [
39].
In
Figure 3 a photo of the pump mounted on the test rig is shown. Since the pressure ripple is influenced by the layout of the circuit, in order to simplify the layout, a steel straight pipe with a fixed orifice with diameter 4 mm at one end was inserted between the pump and the delivery hose. In this way, only for the tests where the pressure ripple was acquired, the load was generated by the fixed orifice and the setting of the relief valve RV2 was kept at the minimum level, so that the pressure downstream from the orifice was of the order of 15 bar. In
Figure 4, the detail of the cover side of the pump with the slip rings is shown on the left, while on the right the driver gear with the transducer is visible.
The excitation voltage (10 Vdc) to all transducers was supplied by an Entran MSC-A1 conditioning module with a frequency band of 0–50 kHz at −1 dB. The same unit was used for amplifying the output signals, which were acquired with a sampling frequency of 50 kHz, through a National Instruments data acquisition card NI 6250 16 bit with multi-channel sampling rate of 1 MS/s. The gain of the entire measuring chain in terms of bar/V for the GS transducers was checked through a deadweight tester.
The encoder was used for phasing the experimental measurements with the simulation data. The latter were obtained starting from the chamber in the reference position shown in
Figure 5 that also illustrates the procedure for determining the angle between the marker of the encoder and a known position of the gears. By removing the adapter of the delivery pressure transducer, it was possible to see by eye the chamber pressure transducer. A 2.5 mm hexagonal wrench was inserted in the opposite tooth space of the driven gear and the shaft was gently rotated by hand forward as long as the rod of the wrench was not horizontal; the horizontality was determined by a bubble level. Starting from such a position, the wrench was removed, and the shaft was rotated by hand firmly in the reverse direction. During this phase, two signals were acquired simultaneously from the encoder with the acquisition card: the square wave with 1800 pulse/rev and the marker signal. The angular shift was determining by counting the number of acquired pulses up to the marker. Different repetitions have demonstrated that the error in evaluating such an angle was 0.2 deg. Finally, by means of the CAD drawing, the additional angular shift between the position of the gears shown on the right and the reference position was calculated.
4. CFD Model
The dynamic model of the pump was built in SimericsMP + v5.0.15. The gears’ profiles were generated by extrusion of the 2D drawing obtained analytically as function of the geometrical parameters. The assemblies of the pump and of the delivery pipe were used for extracting the surfaces of the fluid domain. A view of the total fluid model is shown in
Figure 6. For ease of representation, the lateral gaps are hidden.
As already discussed in the introduction, the hypothesis of perfectly centered gears with respect to the bushings is not realistic. In the real component the position is a consequence of the equilibrium between the load capacity of the bushing and the external force generated by the pressure distribution and by the contact force on the gear. The equilibrium is function of the operating conditions, such as the delivery pressure, the angular speed, and the oil temperature. The position of the gears’ centers has an effect not only on the tooth tip leakage, but also on the pressure in a chamber when it is ideally isolated from both the inlet and the outlet volumes. Since in the CFD model it is not possible to modify the position of the centers during the simulation, a reasonable translation of the gears towards the inlet side was applied in the phase of model construction. As already highlighted, this aspect represents the most important drawback of a CFD model. Considering the data available in literature, a first attempt value of the ratio between the gap height when a tooth respectively leaves and enters the casing can be found in the reference [
40], where an advanced 0D model that considers the micro-motions is presented. Starting from the calculated tip gap height vs. shaft angle, a ratio around 6 can be estimated. In order to have a similar ratio, the total diametrical clearance between the rotors and the housing was distributed 15% on the inlet side and 85% on the delivery side. It is straightforward that this position represents a compromise, however, as demonstrated by the model validation reported in the
Section 5.1, it was found that such a translation allows a fair matching with the experimental data in all tested conditions.
The same problem about the positioning occurs for the axial clearances, although the gap is largely compensated by the micro-movements (translation and tilt) of the thrust plates. The compensation should reduce the clearances up to a few microns, hence in the model two 5 µm thick layers were initially added on the two sides of the gears. However, it was found that such a small clearance, although it has an effect on the internal leakages, has a negligible influence of the pressure history of the tooth space. Hence, in the presented results, the lateral gaps have been deactivated.
The model does not allow having direct contact between the flanks of the teeth, therefore a small clearance must be set. Although the drawing of the gear profiles was obtained with a high number of points, it was found that the minimum clearance between the flanks of the teeth that allows avoiding inference for any position of the gears was 16 μm. Such a gap was generated by means of an initial rotation of the driver gear of 0.28 deg. This virtual clearance could have an influence on the fluid leakages between delivery and inlet volumes, whose accurate evaluation is out of the aim of the present work.
Two different models were built for simulating the plates type A and B. The rotating mesh was created by means of a template specific for external gear pumps. In each gear the resulting mesh is a structured hexahedral type. The grid is composed of a fixed number of cells in the radial direction. In the innermost layer of cells, the nodes are anchored to the gear surface, while the cells of the outermost layer slide with respect to the opposite gear and to the casing. In this way, when a tooth of a gear enters the opposite tooth space, the cells are compressed radially. In correspondence of the tooth tip clearance the cells are simply squeezed. A total number of 10 cells in the radial direction and 720 cells in the circumferential direction was set for each tooth.
In the fixed volumes, the mesh is unstructured Cartesian type with cubic elements with different cell density depending on the size of the volume. The total number of cells coming from a mesh sensitivity analysis made in a previous study [
41] and also repeated for this specific model is about 1.5 million. In
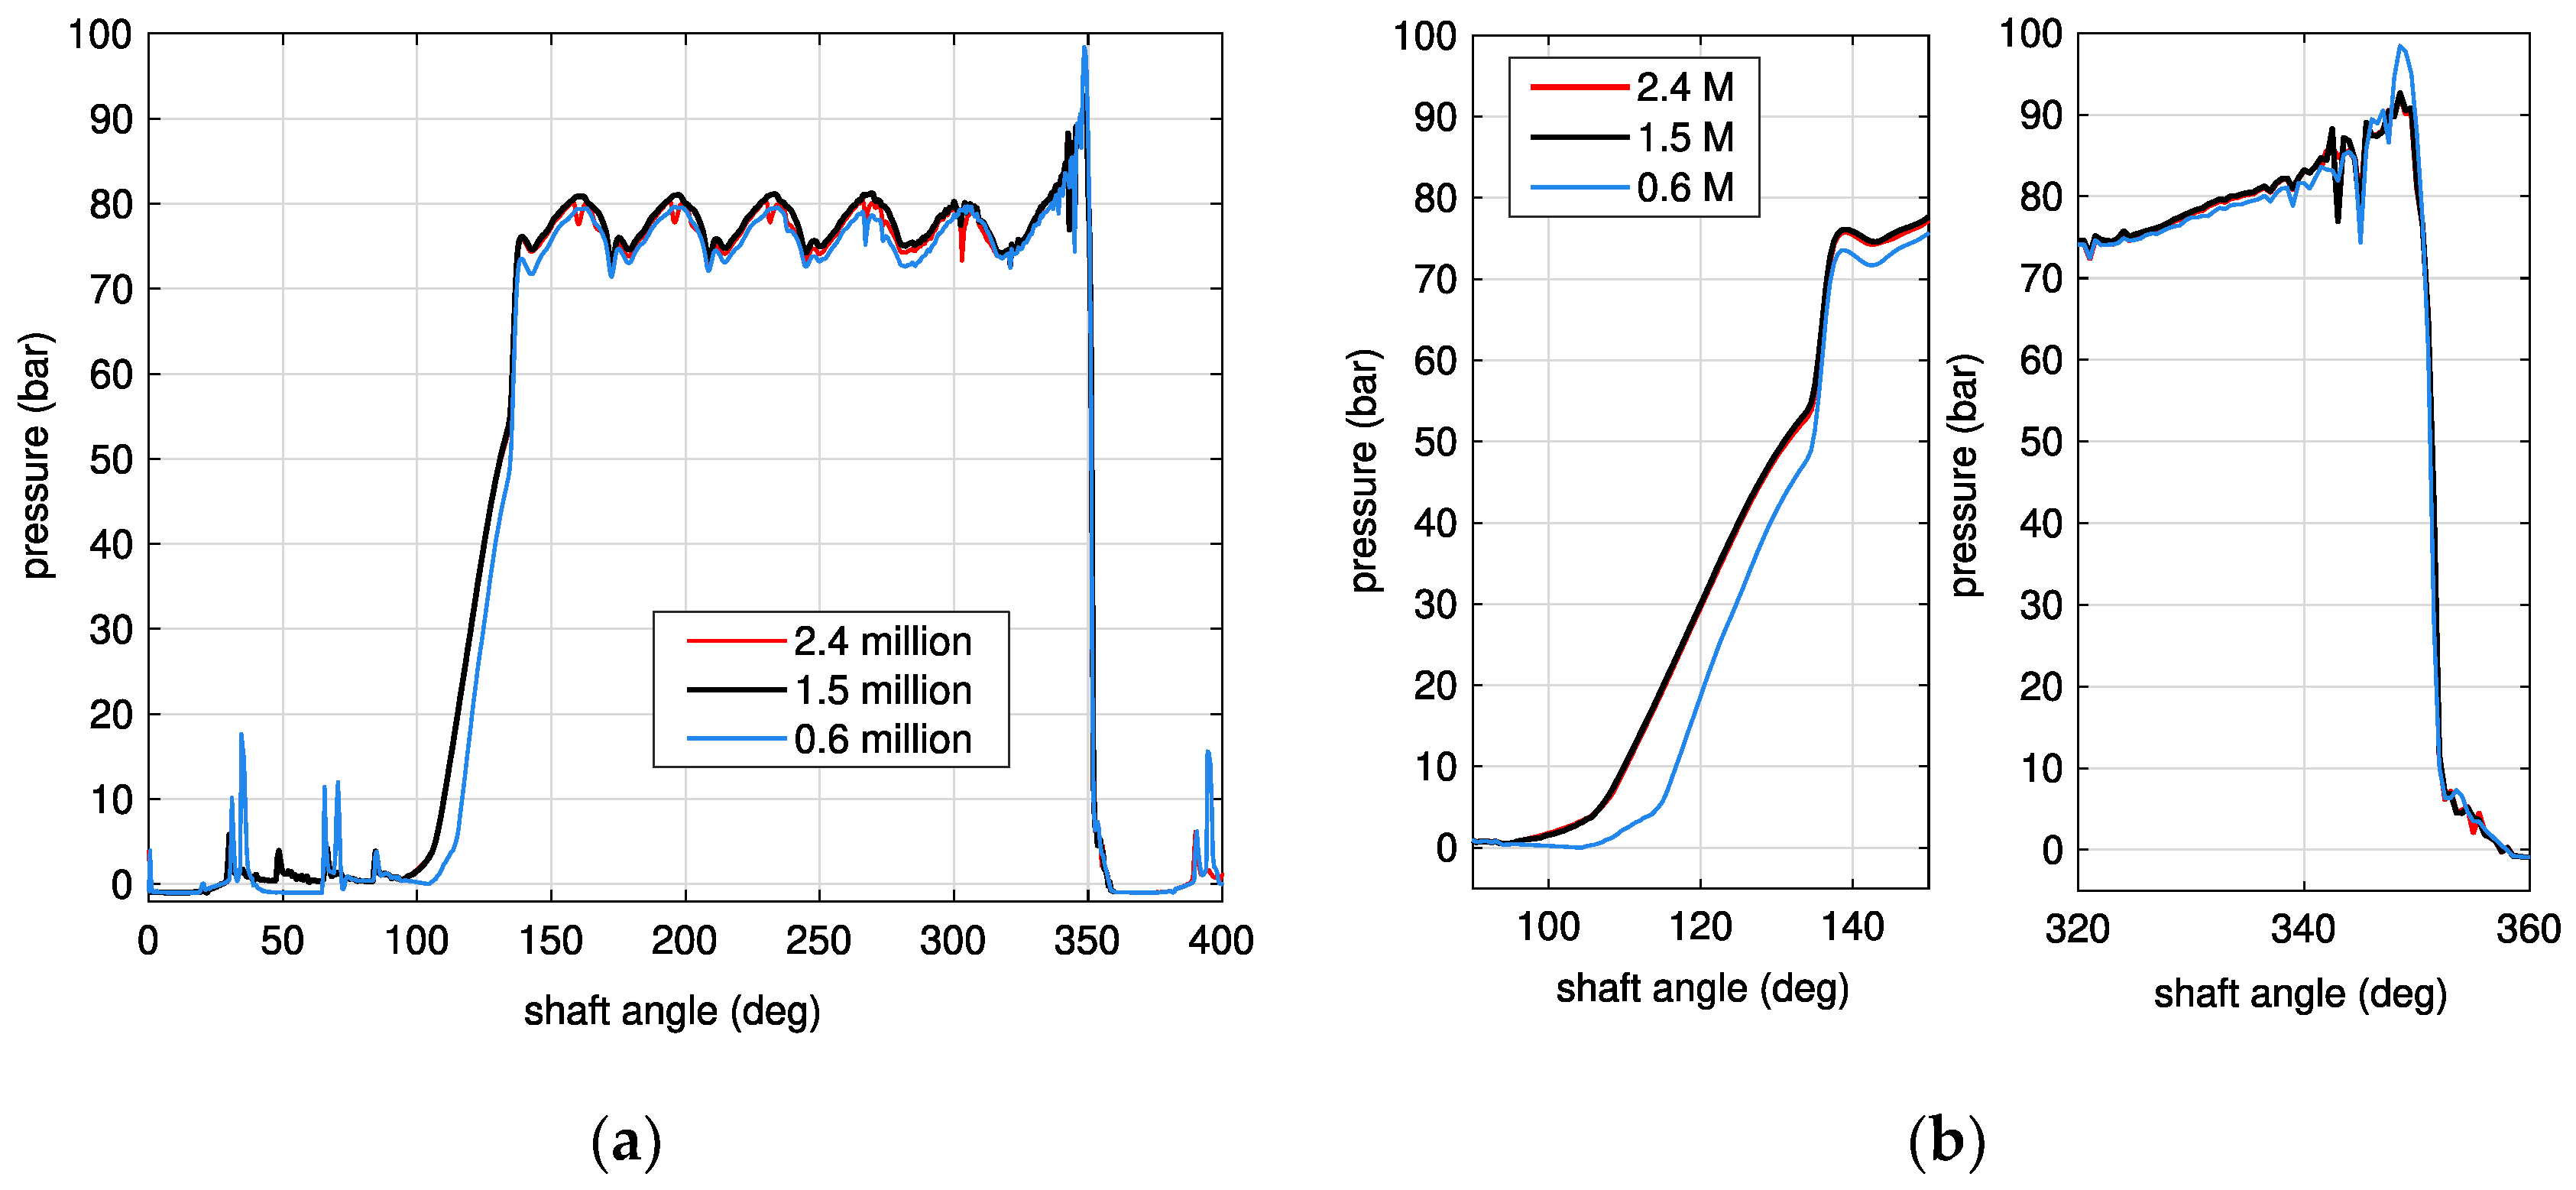
Figure 7a, the simulated tooth space pressure at 1250 rpm with 1.5 million cells is contrasted with the results obtained with 600,000 cells and with 2.4 million. The main influence of the number of cells is in the transition between the low and high pressure and vice versa, as visible in the details in
Figure 7b. More specifically, with 600,000 cells the increase of the pressure is delayed, and the pressure peak is slightly higher. It must be remarked that the computational time with 2.4 million cells is about double with respect to 1.5 million, but with negligible variations in terms of pressure waveform.
The model used for cavitation and aeration phenomena is the Equilibrium Dissolved Gas [
42] that does not consider the dynamics of release and dissolution of the air. In this model the mixture density is calculated as function of the mass fraction of vapor and gas (air). The fraction of dissolved/undissolved gas is determined by the Henry’s law. A total amount of gas volume equal to 2% was set, since such a value gave good results in a similar study on a gerotor pump tested in closed circuit [
43]. The same value of 2% was also used by the authors of the paper [
23]. This amount is lower than the maximum fraction of air that can be dissolved by the hydraulic oil in steady-state conditions (about 9% at 20 °C and atmospheric pressure), but it must be considered that the oil is not in steady-state conditions and, above all in the cavitation tests described in the
Section 5.2, the pressure is reduced to very low levels making plausible a strong deaeration of the oil. Moreover, since the time constant for redissolution is some orders of magnitude higher than the time constant for separation, it is reasonable that, when the test is underway, the amount of air stabilizes to a value lower than the maximum.
The turbulence model was deactivated, since it was checked that its influence is negligible on the results. In
Table 3, the other not default fluid properties set in the model are reported.
The pressure values measured in the experimental tests were set, as boundary conditions, at the inlet port of the pump and downstream from the fixed orifice that simulates the load.
The simulations were run with an angular step of 0.5 degrees and the convergence was considered achieved when an exponent of the residual error drop equal to −2 or a maximum number of 150 iterations was reached. This last condition occurred only occasionally, since typically, on average, 50 iterations are enough. The exponent of the residual error drop at the
n-th iteration is defined as follows:
where
res(
n) is the residual at the
n-th iteration and
maxres is the maximum residual in all previous iterations from 1 to
n−1. For the steady-state tests in conditions of incomplete filling, the end of the transient was considered concluded when the variation of the mean volumetric flow rate, calculated with the moving average, was lower than 1% in the last revolution with respect to the previous one.
The CPU time for simulating a complete revolution of the shaft was typically 4–4.5 h on a 24-core Platinum Xeon 8268 processor at 2.9 GHz workstation and about 20 h on an 8-core Xeon E5-2687W-v2 processor at 3.4 GHz workstation.
5. Results and Discussion
5.1. Chamber Pressure History
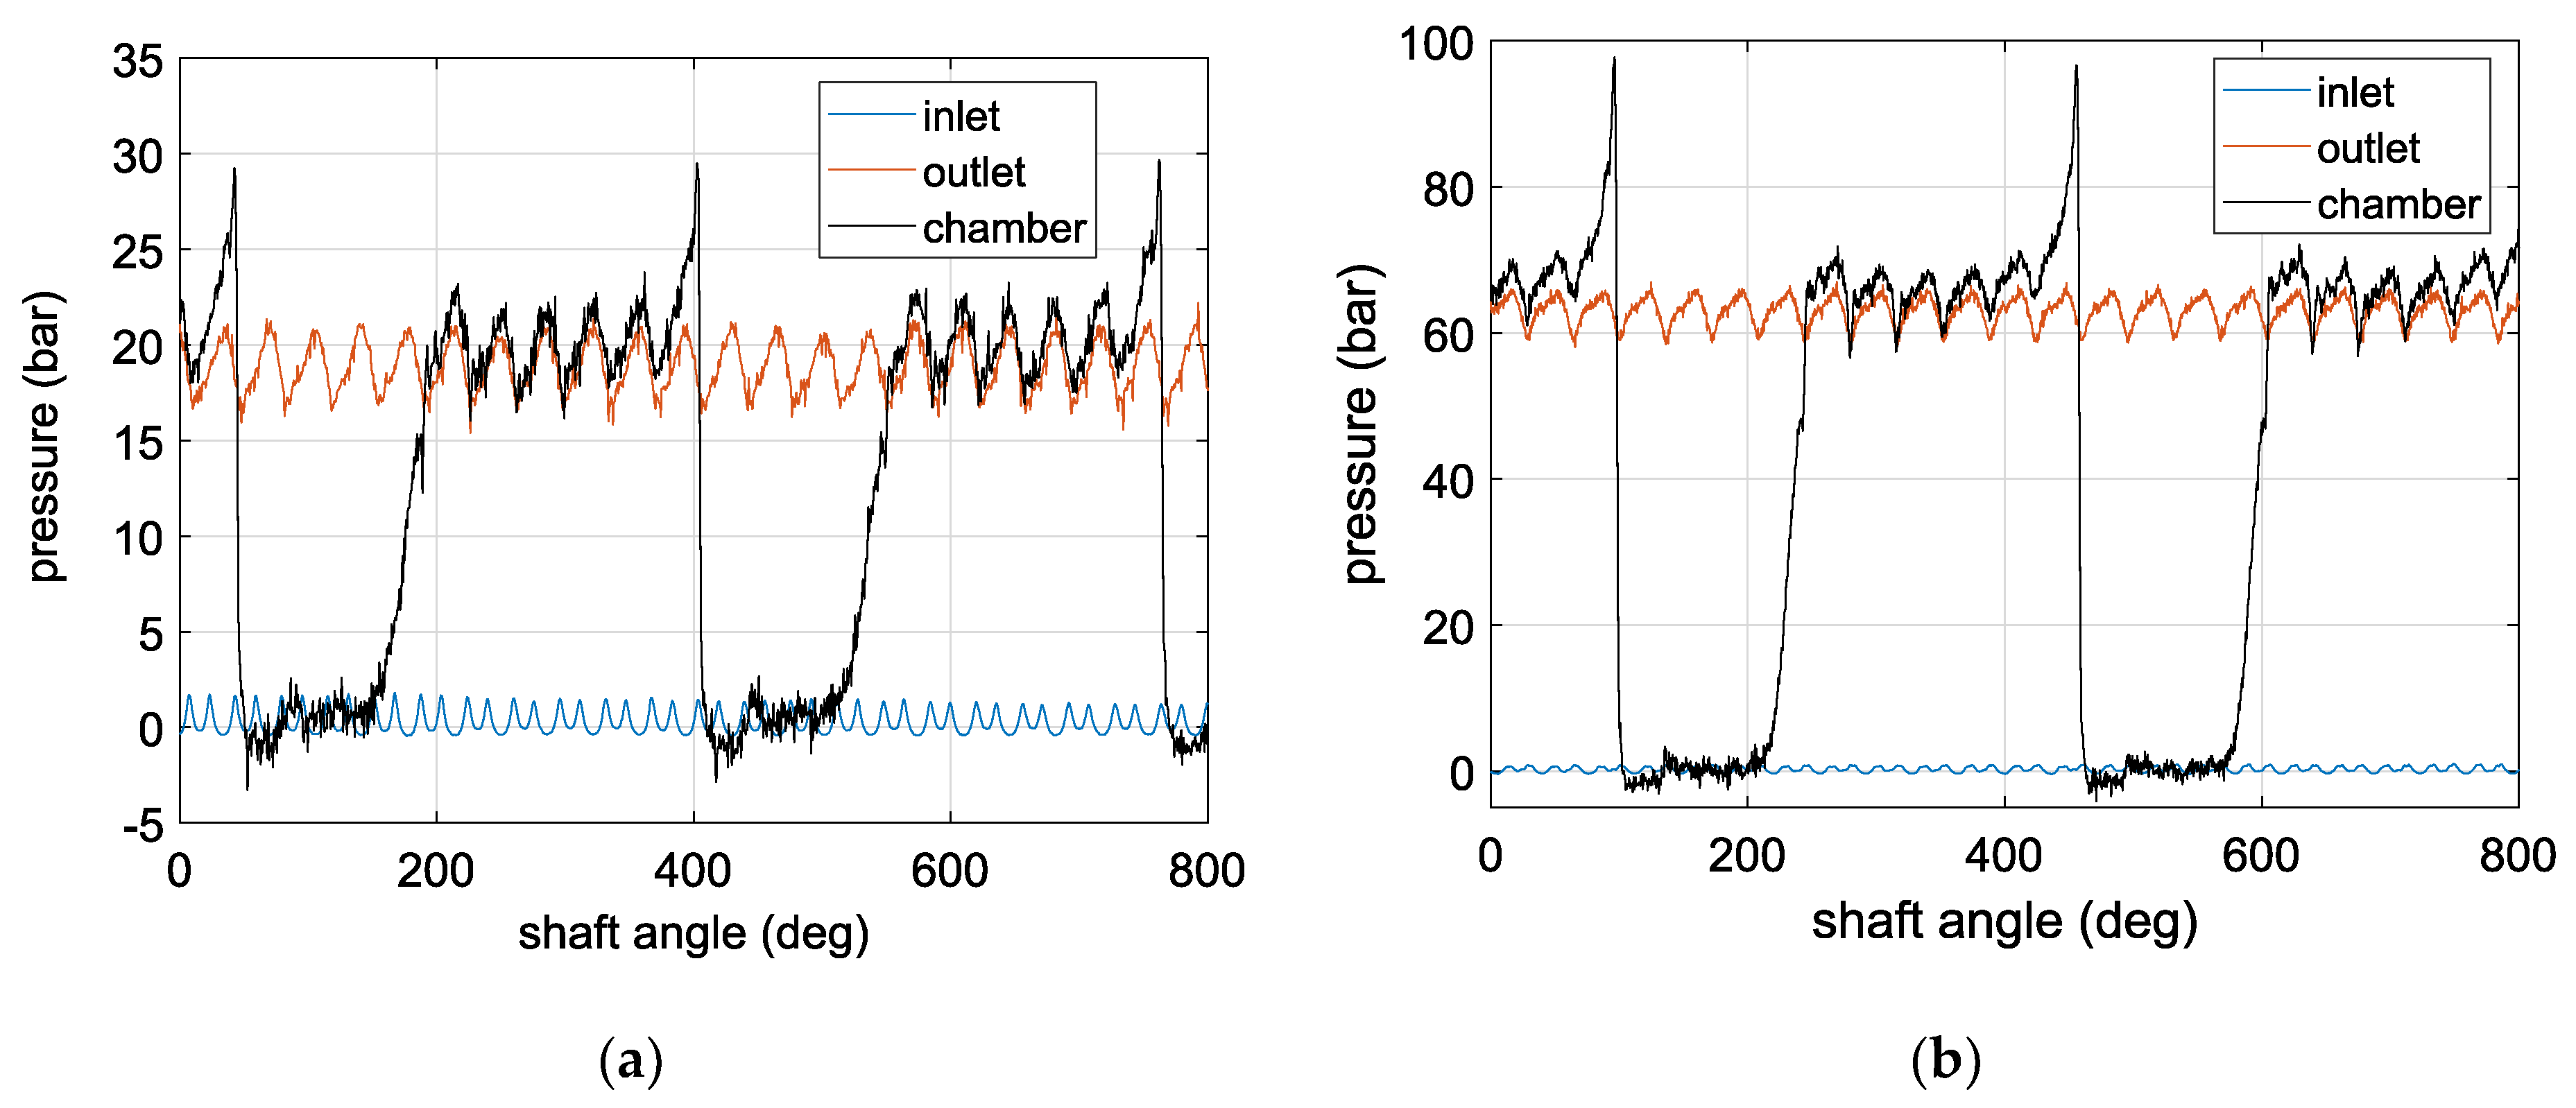
The tests were performed at constant speed with a delivery pressure function of the pressure drop in the load orifice. A command to the RV1 relief valve was supplied in order to set the pressure in the inlet volume of the pump, measured by the GS transducer, between 0 and 1 gauge bar. The temperature was maintained in the range 35–40 °C. Since it is no longer possible to verify on the deadweight tester the integrity of the EPL-318 pressure transducer once glued on the gears, a check was made by superimposing the signals of the three transducers for different angular velocities. In
Figure 8 the comparison is made at 1000 and 2000 rpm as function of the shaft angle. It must be considered that only in this preliminary test the origin of the
x-axis is random and the 4 mm restrictor on the delivery side was not present. The chamber signal exhibits a high frequency noise. However, the reading is coherent with the GS transducers in terms of offset and wave amplitude.
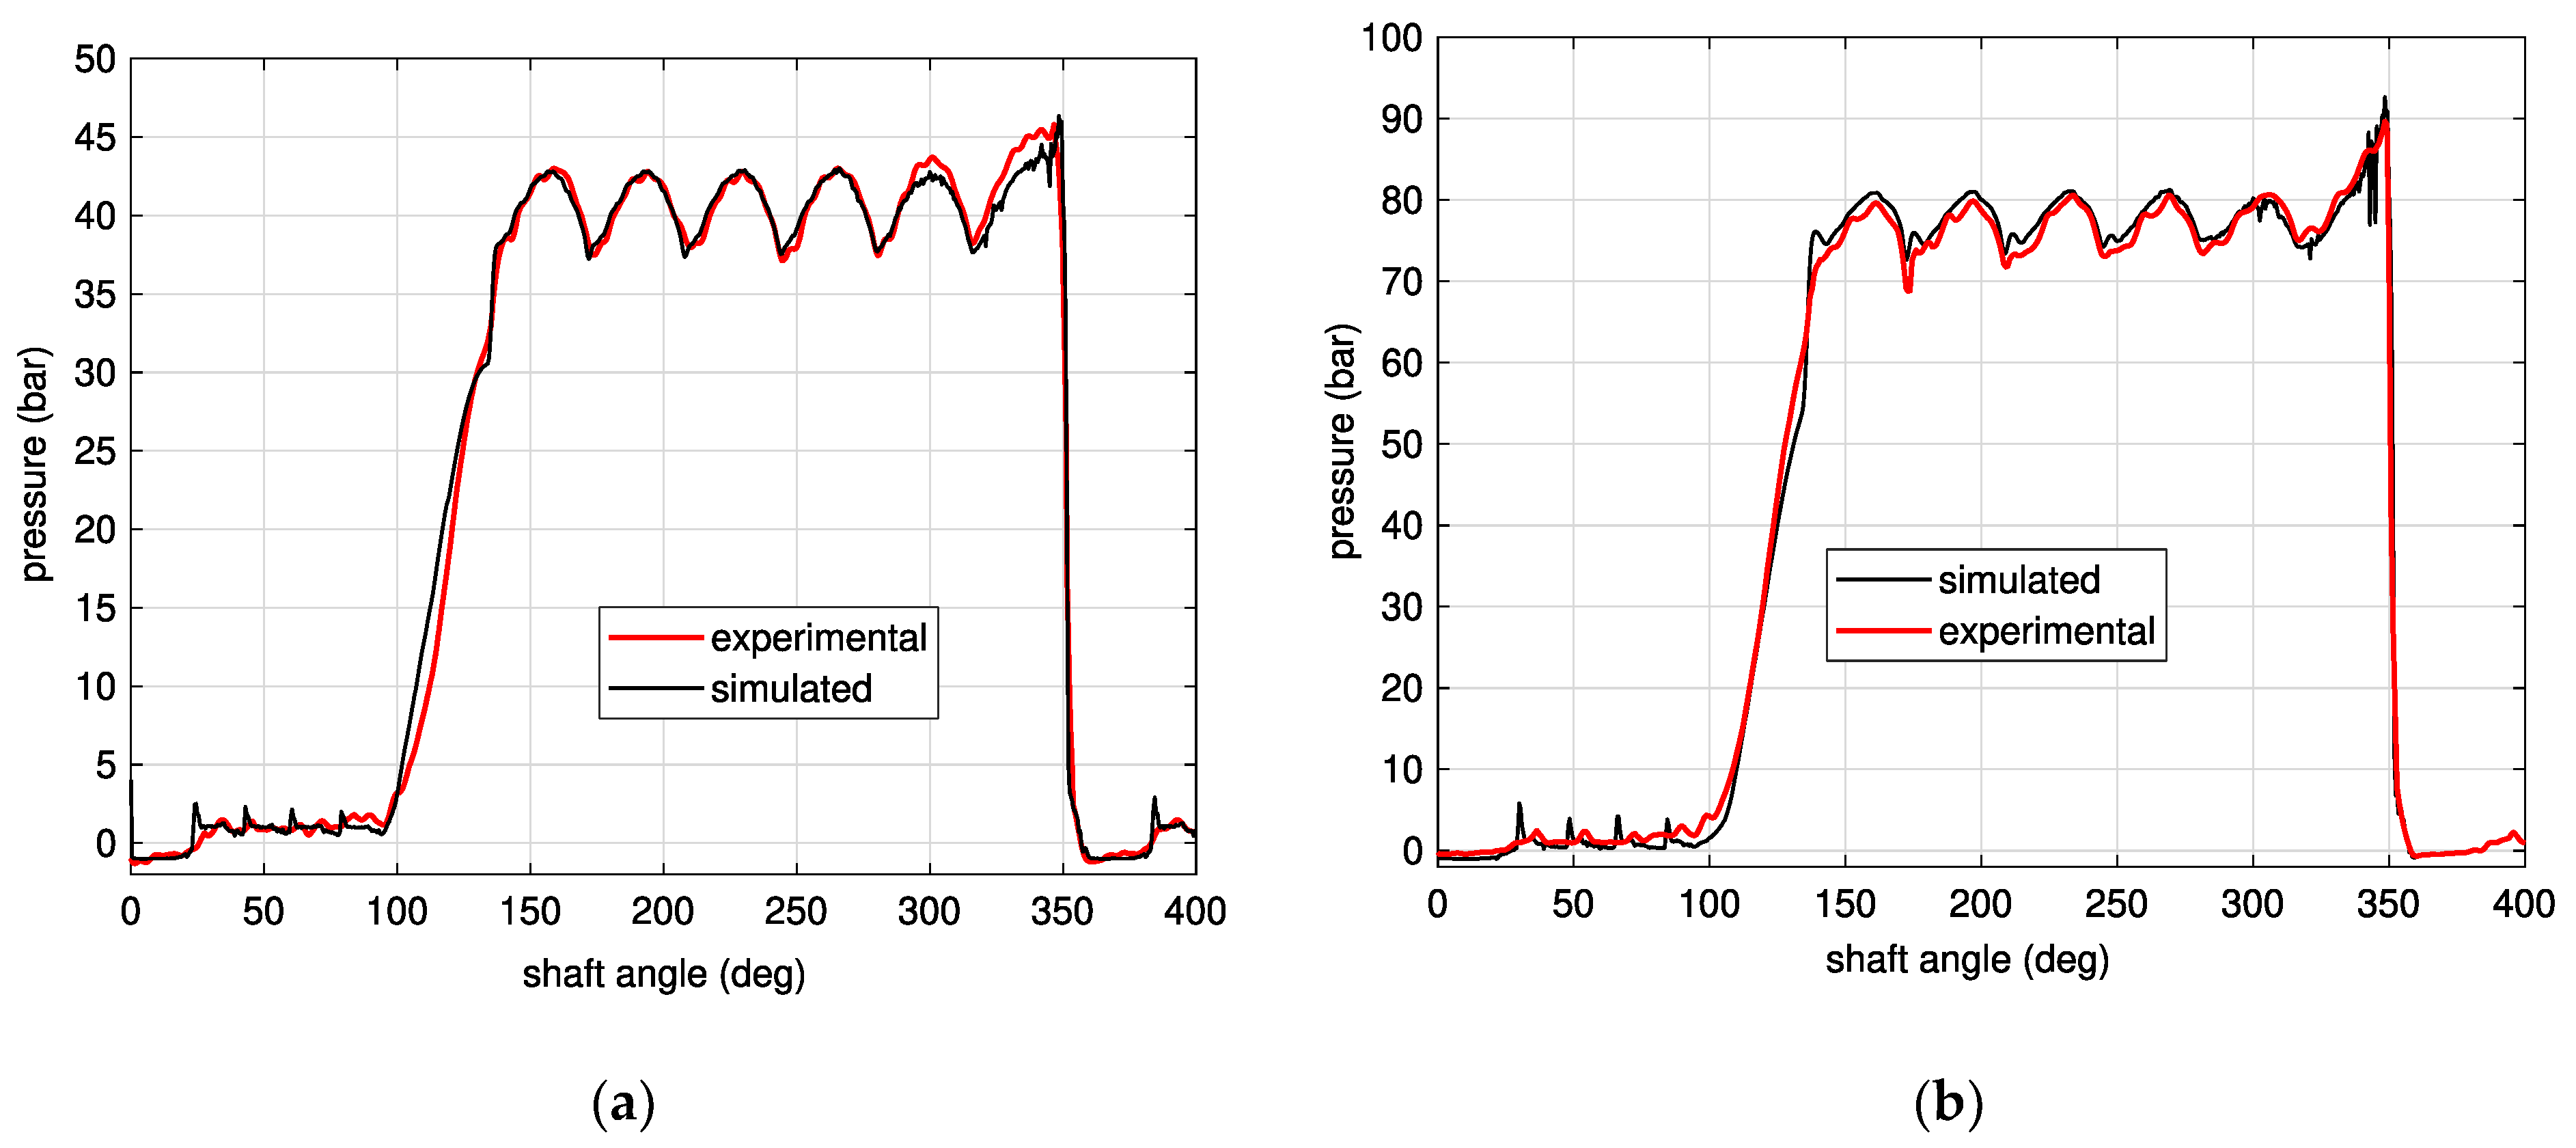
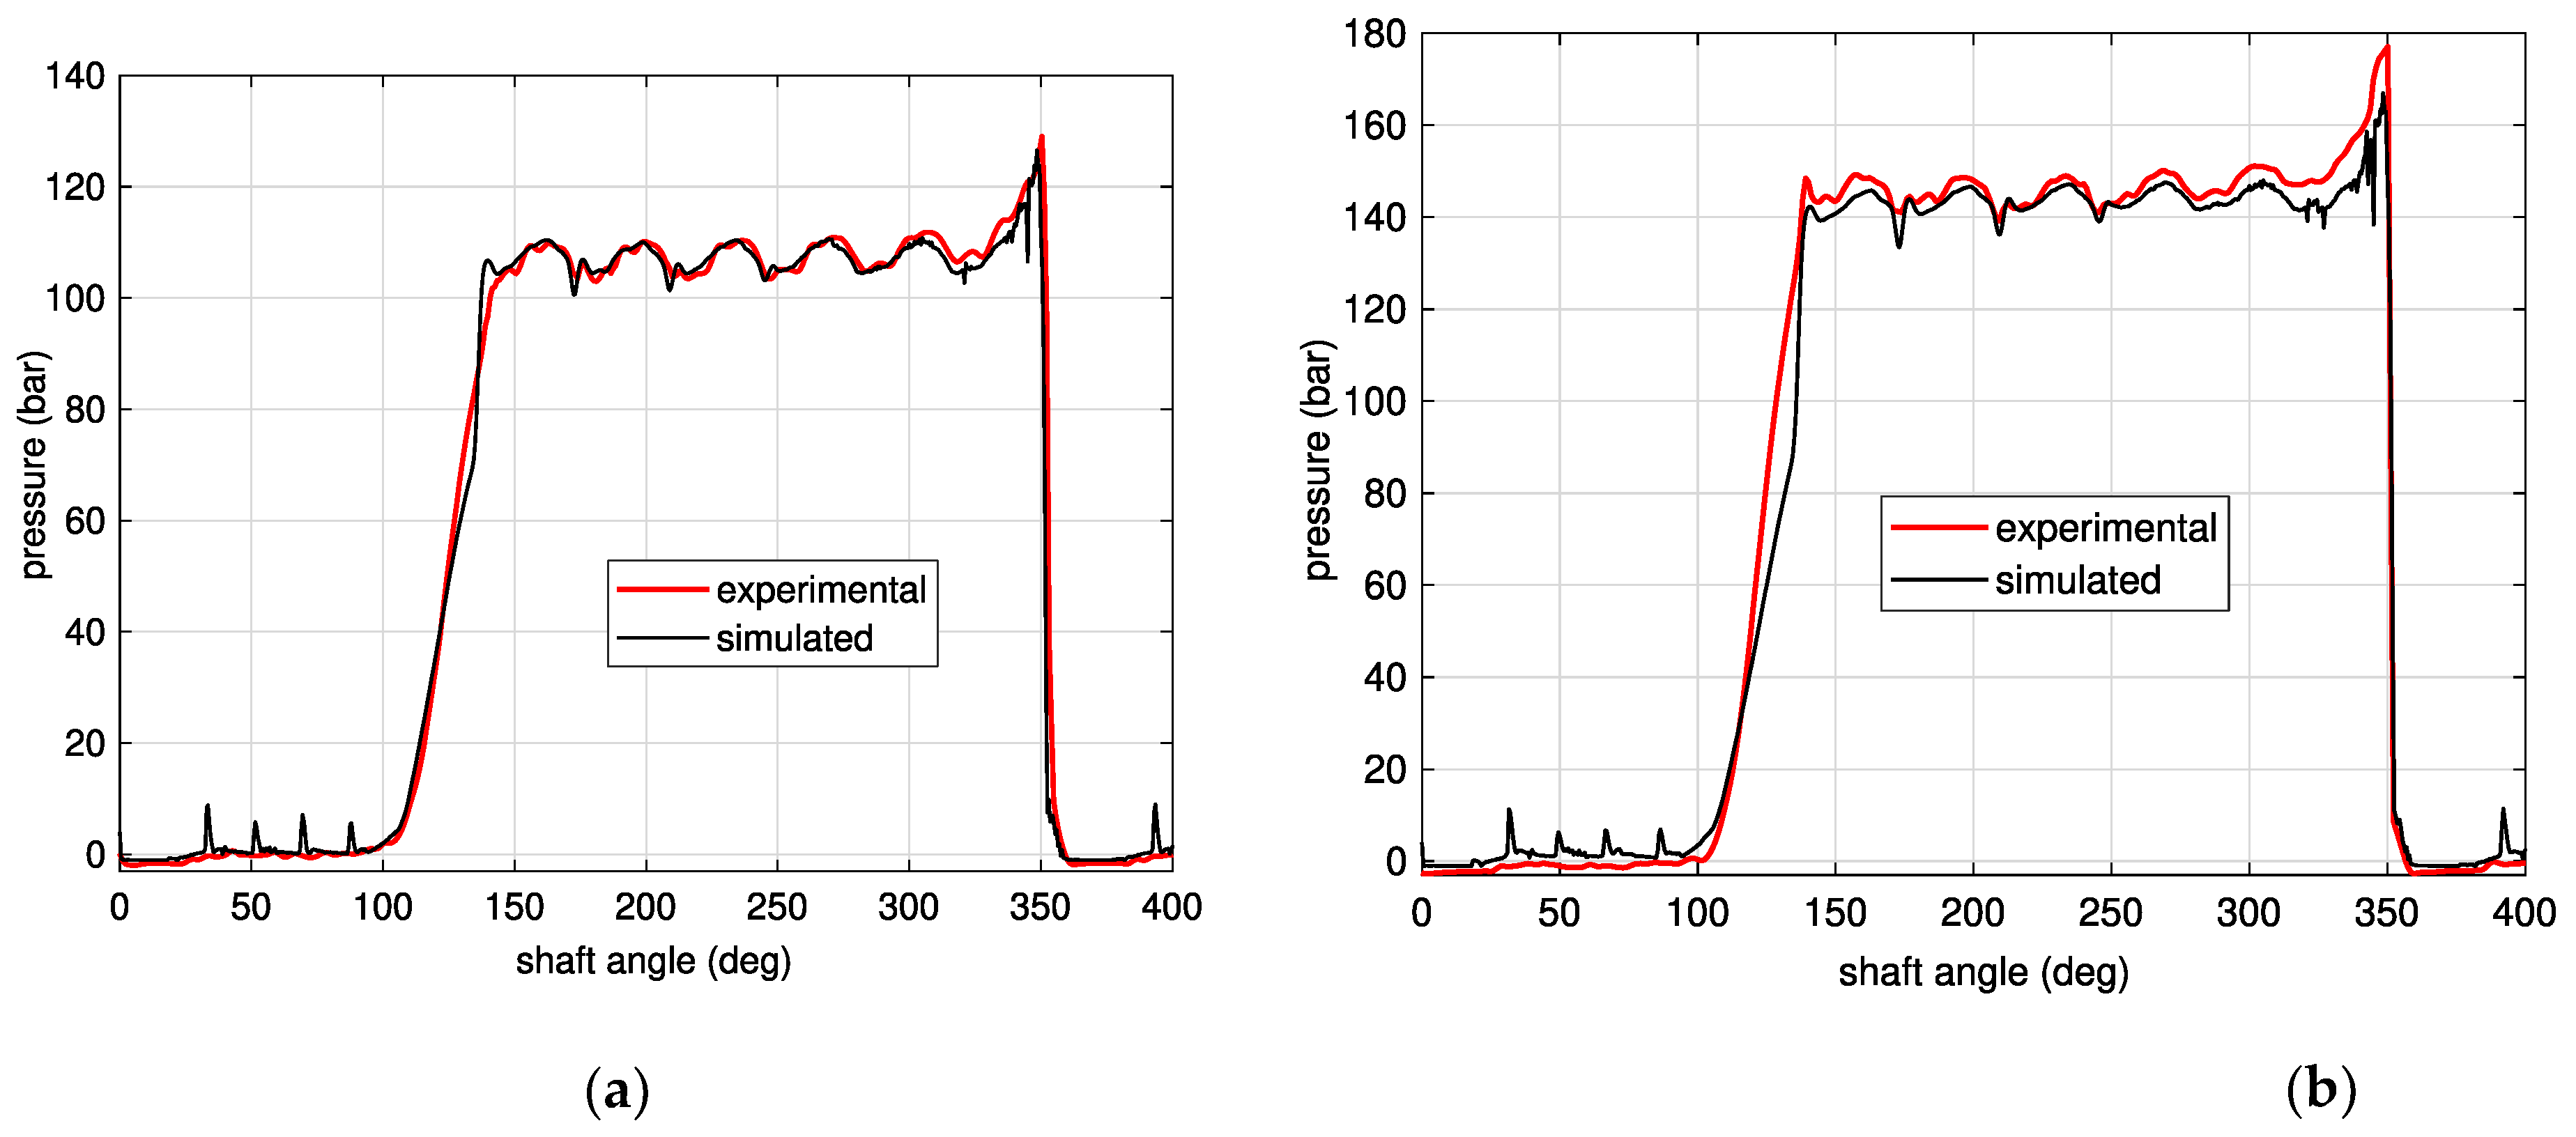
The comparison between the measured and simulated chamber pressure in four different operating conditions for a complete revolution of the shaft with the plates type A is shown in
Figure 9 and
Figure 10. In
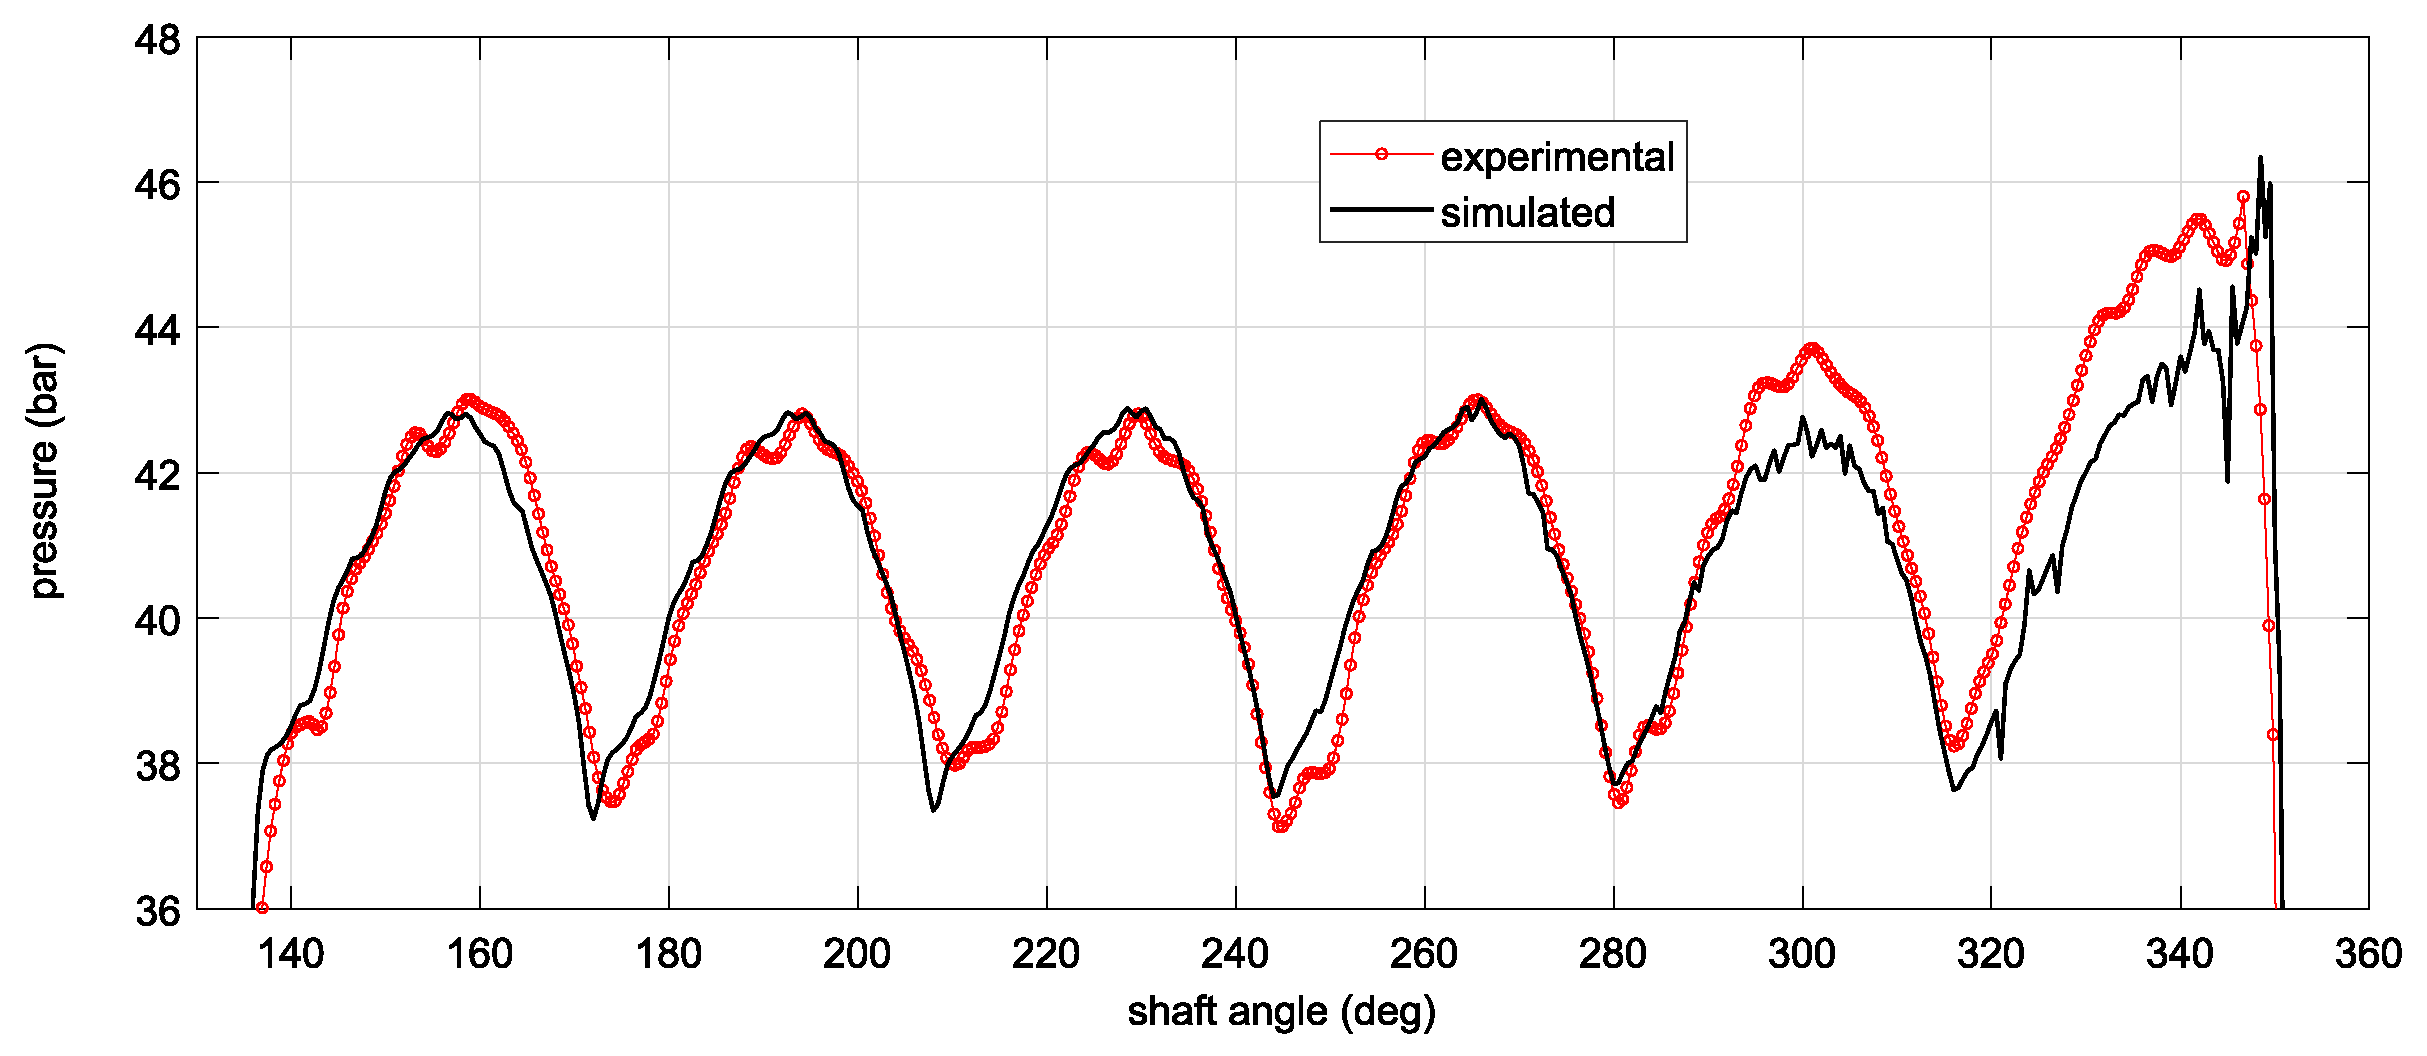
Figure 11 and
Figure 12, the detail in correspondence of the connection of the chamber with the delivery volume is shown, so that it is possible to better appreciate the pressure waveform.
The presented experimental data were post-processed in Matlab® using the “smoothdata” function with robust quadratic regression with smooth factor 0.01. It was checked that such settings are able to smooth the noisy data without changing the waveform. It must be highlighted that the model is not able to catch the pressure peaks when the chamber is connected to the inlet side simply because the suction line, made up by rigid pipes and hoses, was not included in the CFD model.
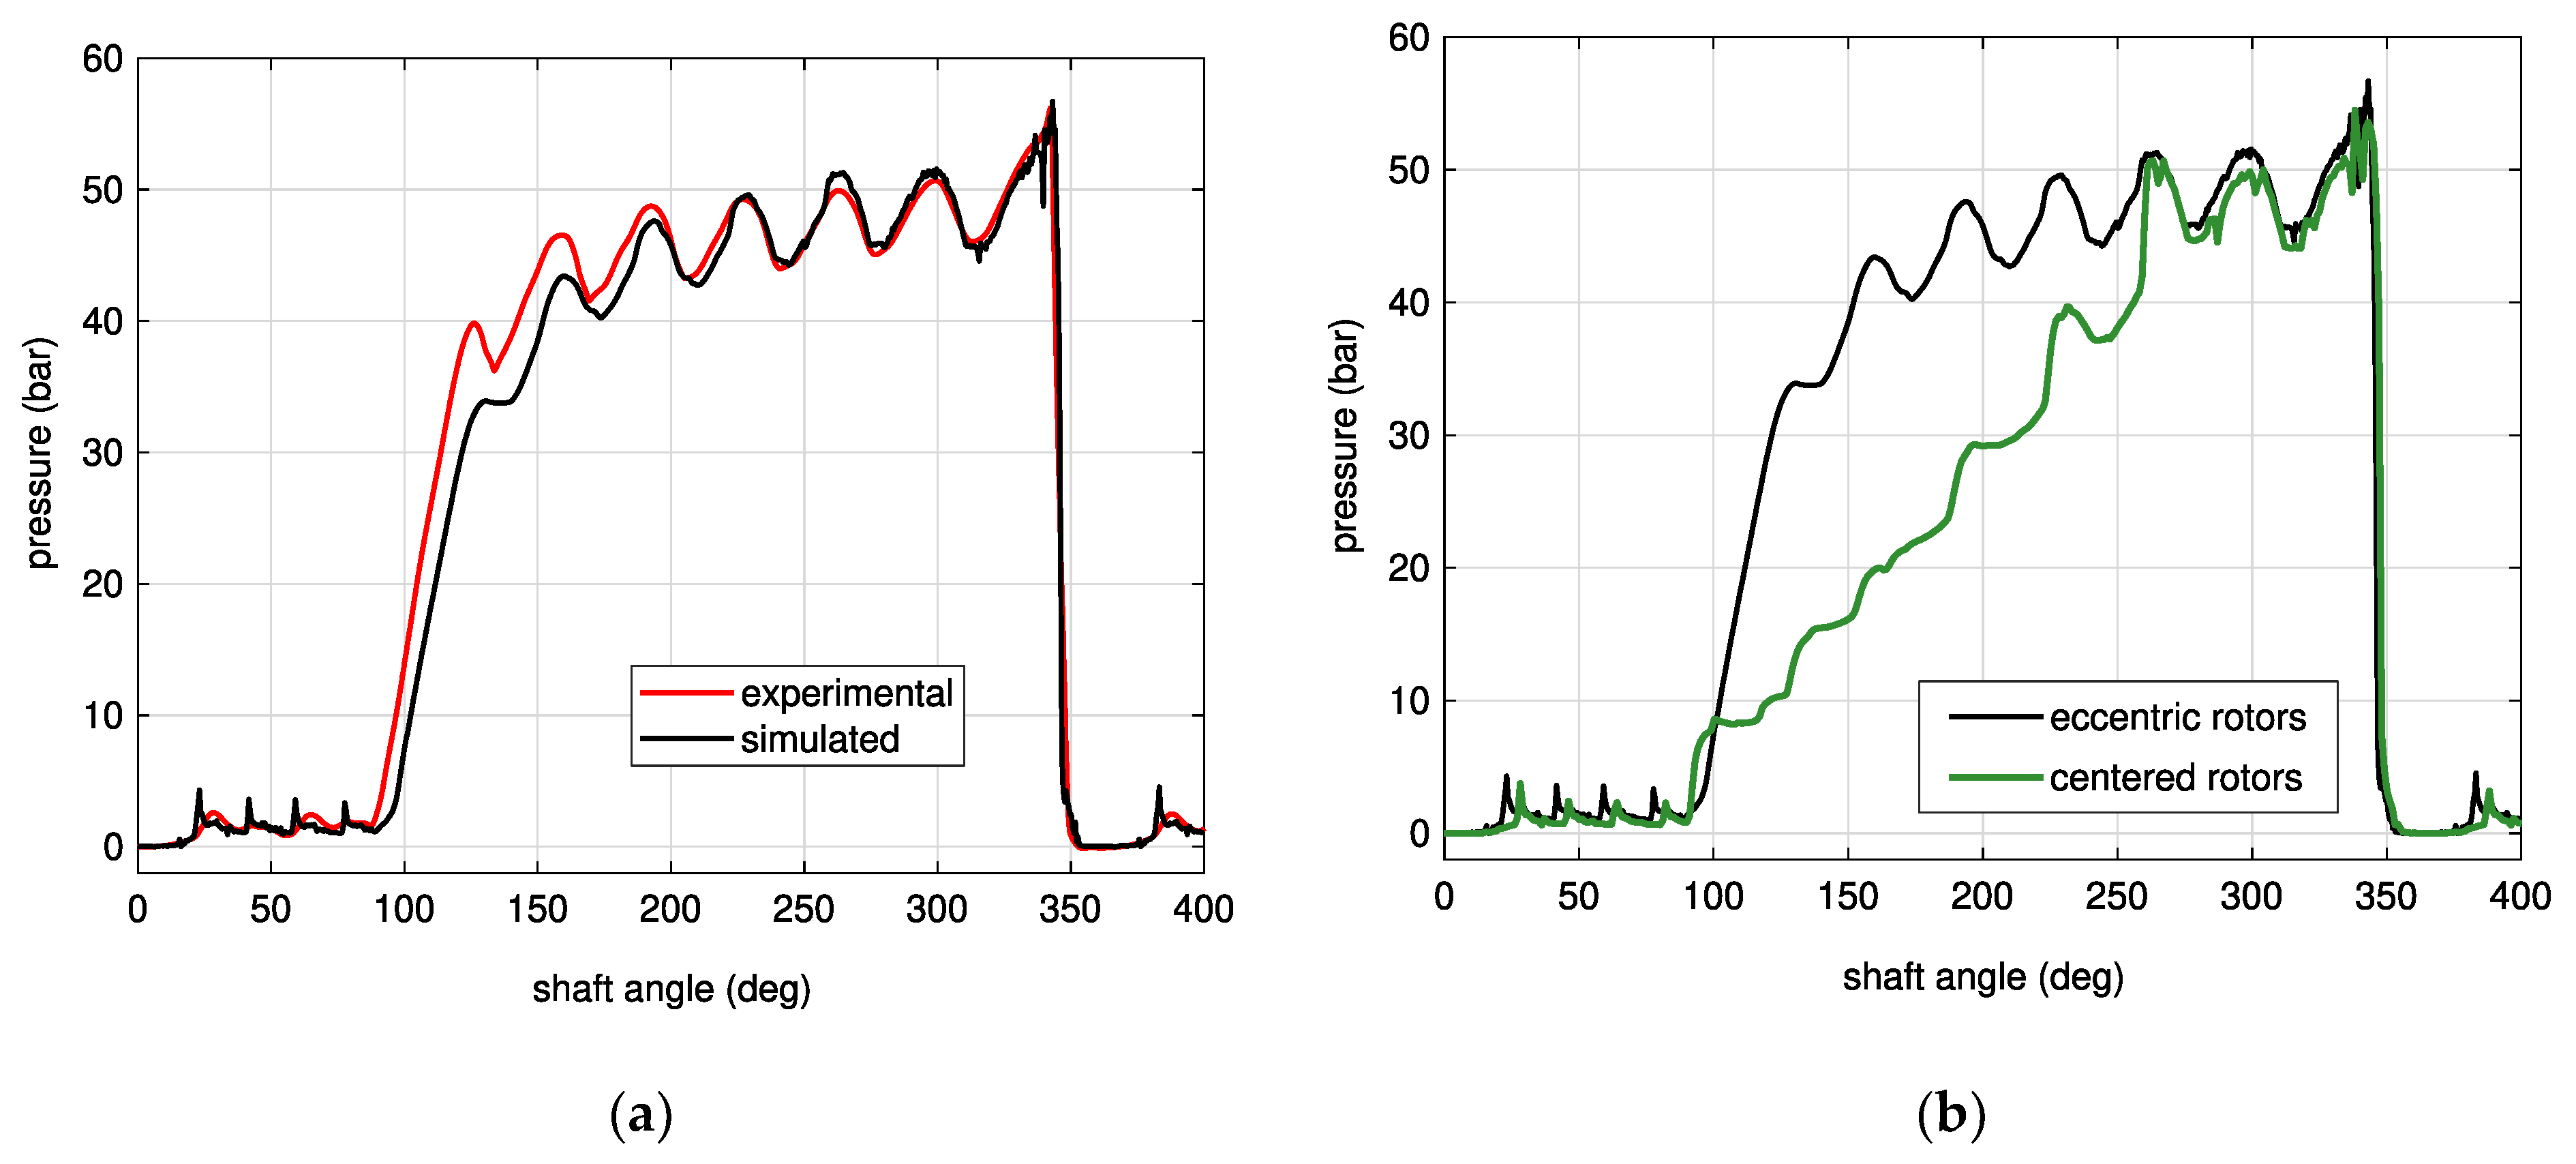
In
Figure 13a the chamber pressure with the plates type B and same position of the gears’ axes used for the plates type A is shown at 1000 rpm. In this study, the thrust plates type B were used for checking the model in a different configuration more similar to a not pressure compensated design. As expected, a more gradual increment of the pressure in the chamber is detected and at least 100 degrees are necessary to reach the same pressure of the delivery volume. This configuration of the thrust plates is more critical to simulate, since for a significantly higher angular span the pressure in the tooth space is only controlled by the leakages, whose geometry is highly influenced by the position of the gears decided a priori by the user.
In
Figure 13b, the influence of the position of the gears’ axes is shown. If the ideal and unrealistic case of perfectly centered shafts is assumed, each isolated tooth space communicates with the adjacent ones through two tooth gaps, leading and trailing, with the same height regardless of the position of the chamber. In this way the pressure difference between delivery and inlet volumes is equally partitioned between the isolated tooth spaces and a step-shaped curve is obtained. Obviously, similar results can be obtained with the plates A, but in this case, since only one tooth space at a time is isolated, during this phase such a space will be pressurized at the mean value between the inlet and the outlet volumes.
It is evident that the approach with centered gears is inadequate for an in-depth analysis of the pump behavior and could nullify the advantages of the use of a CFD model, above all if the assessment of the force on the gears is one of the aims of the research.
5.2. Cavitation Tests
For these steady-state tests the straight delivery pipe and the calibrated orifice were removed, and the high-pressure hose was connected directly to the outlet port of the pump; in this way the load was imposed at 20 bar by the pressure relief valve RV2 controlled in closed loop using the transducer P2. The inlet pressure measured by the GS transducer was modified in a range below the atmospheric pressure and the corresponding delivered flow rate was measured. The inlet pressure was set by supplying in open loop proper voltage signals to the pilot stage of the relief valve RV1. The quantities were acquired by another personal computer equipped with a NI CompactDAQ and 16-bit NI 9215 analogue input modules. A Labview® virtual instrument acquired continuously the input channels at 10 kHz and when the steady-state conditions were reached, the mean values calculated over a 5 s time interval were saved.
In
Figure 14 the delivered flow rate as function of the inlet pressure for three angular speeds is shown. The temperature was maintained at 35 °C ± 2 °C. For each speed, the graph reports the experimental points obtained in 4 different tests. Before and after each test, the zero of the transducer was checked by venting to atmosphere the inlet pipe by removing a screw in a fitting, in order to avoid inaccurate readings due to a possible zero shift caused by a variation of the temperature.
The data shows the fall of the flow rate when lower pressure values are reached, denoting a condition of incomplete filling of the tooth spaces. Since the tests were performed at low delivery pressure, the influence of the leakages is minimized, and the measured reduction of the flow rate is due mainly to the incomplete filling. A dispersion of almost 0.1 bar is visible in the low-pressure range, which can be partially ascribed to the accuracy of the 20 bar GS transducer. On the other hand, due to the high-pressure peaks, up to 20 bar, in the suction volume in some operating conditions due to the closed circuit configuration, the use of a transducer with a lower range was not possible.
Despite the data dispersion, it is evident that the incomplete filling of the pump begins in correspondence of a higher pressure as the speed increases: just below 0.2 absolute bar at 1000 rpm, between 0.2 and 0.25 bar at 1500 rpm and between 0.35 and 0.4 bar at 2000 rpm. Such a phenomenon, already found in a similar study on a gerotor pump [
43], indicates that, at equal pressure in the inlet volume, the fluid needs a higher energy for entering the tooth spaces if the speed increases.
The simulated points were obtained with the same model of the pump core without the straight pipe at the outlet, as on the test rig, and with a segment of duct at the inlet. In fact, in this analysis the focus is on the reduction of the mean value of the flow rate, which depends on the phenomena occurring in the inlet volume, and not on the delivery pressure ripple. A monitoring point was placed in the same location of the inlet transducer. For each operating condition, at least 4 revolutions of the shaft were simulated for reaching the steady-state condition. It is unquestionable that the model is capable to reproduce not only qualitatively, but also quantitatively the experimental data. The only unknown parameter is the fraction of air that can have a slight influence on the pressure level at which the flow rate reduction begins [
43].
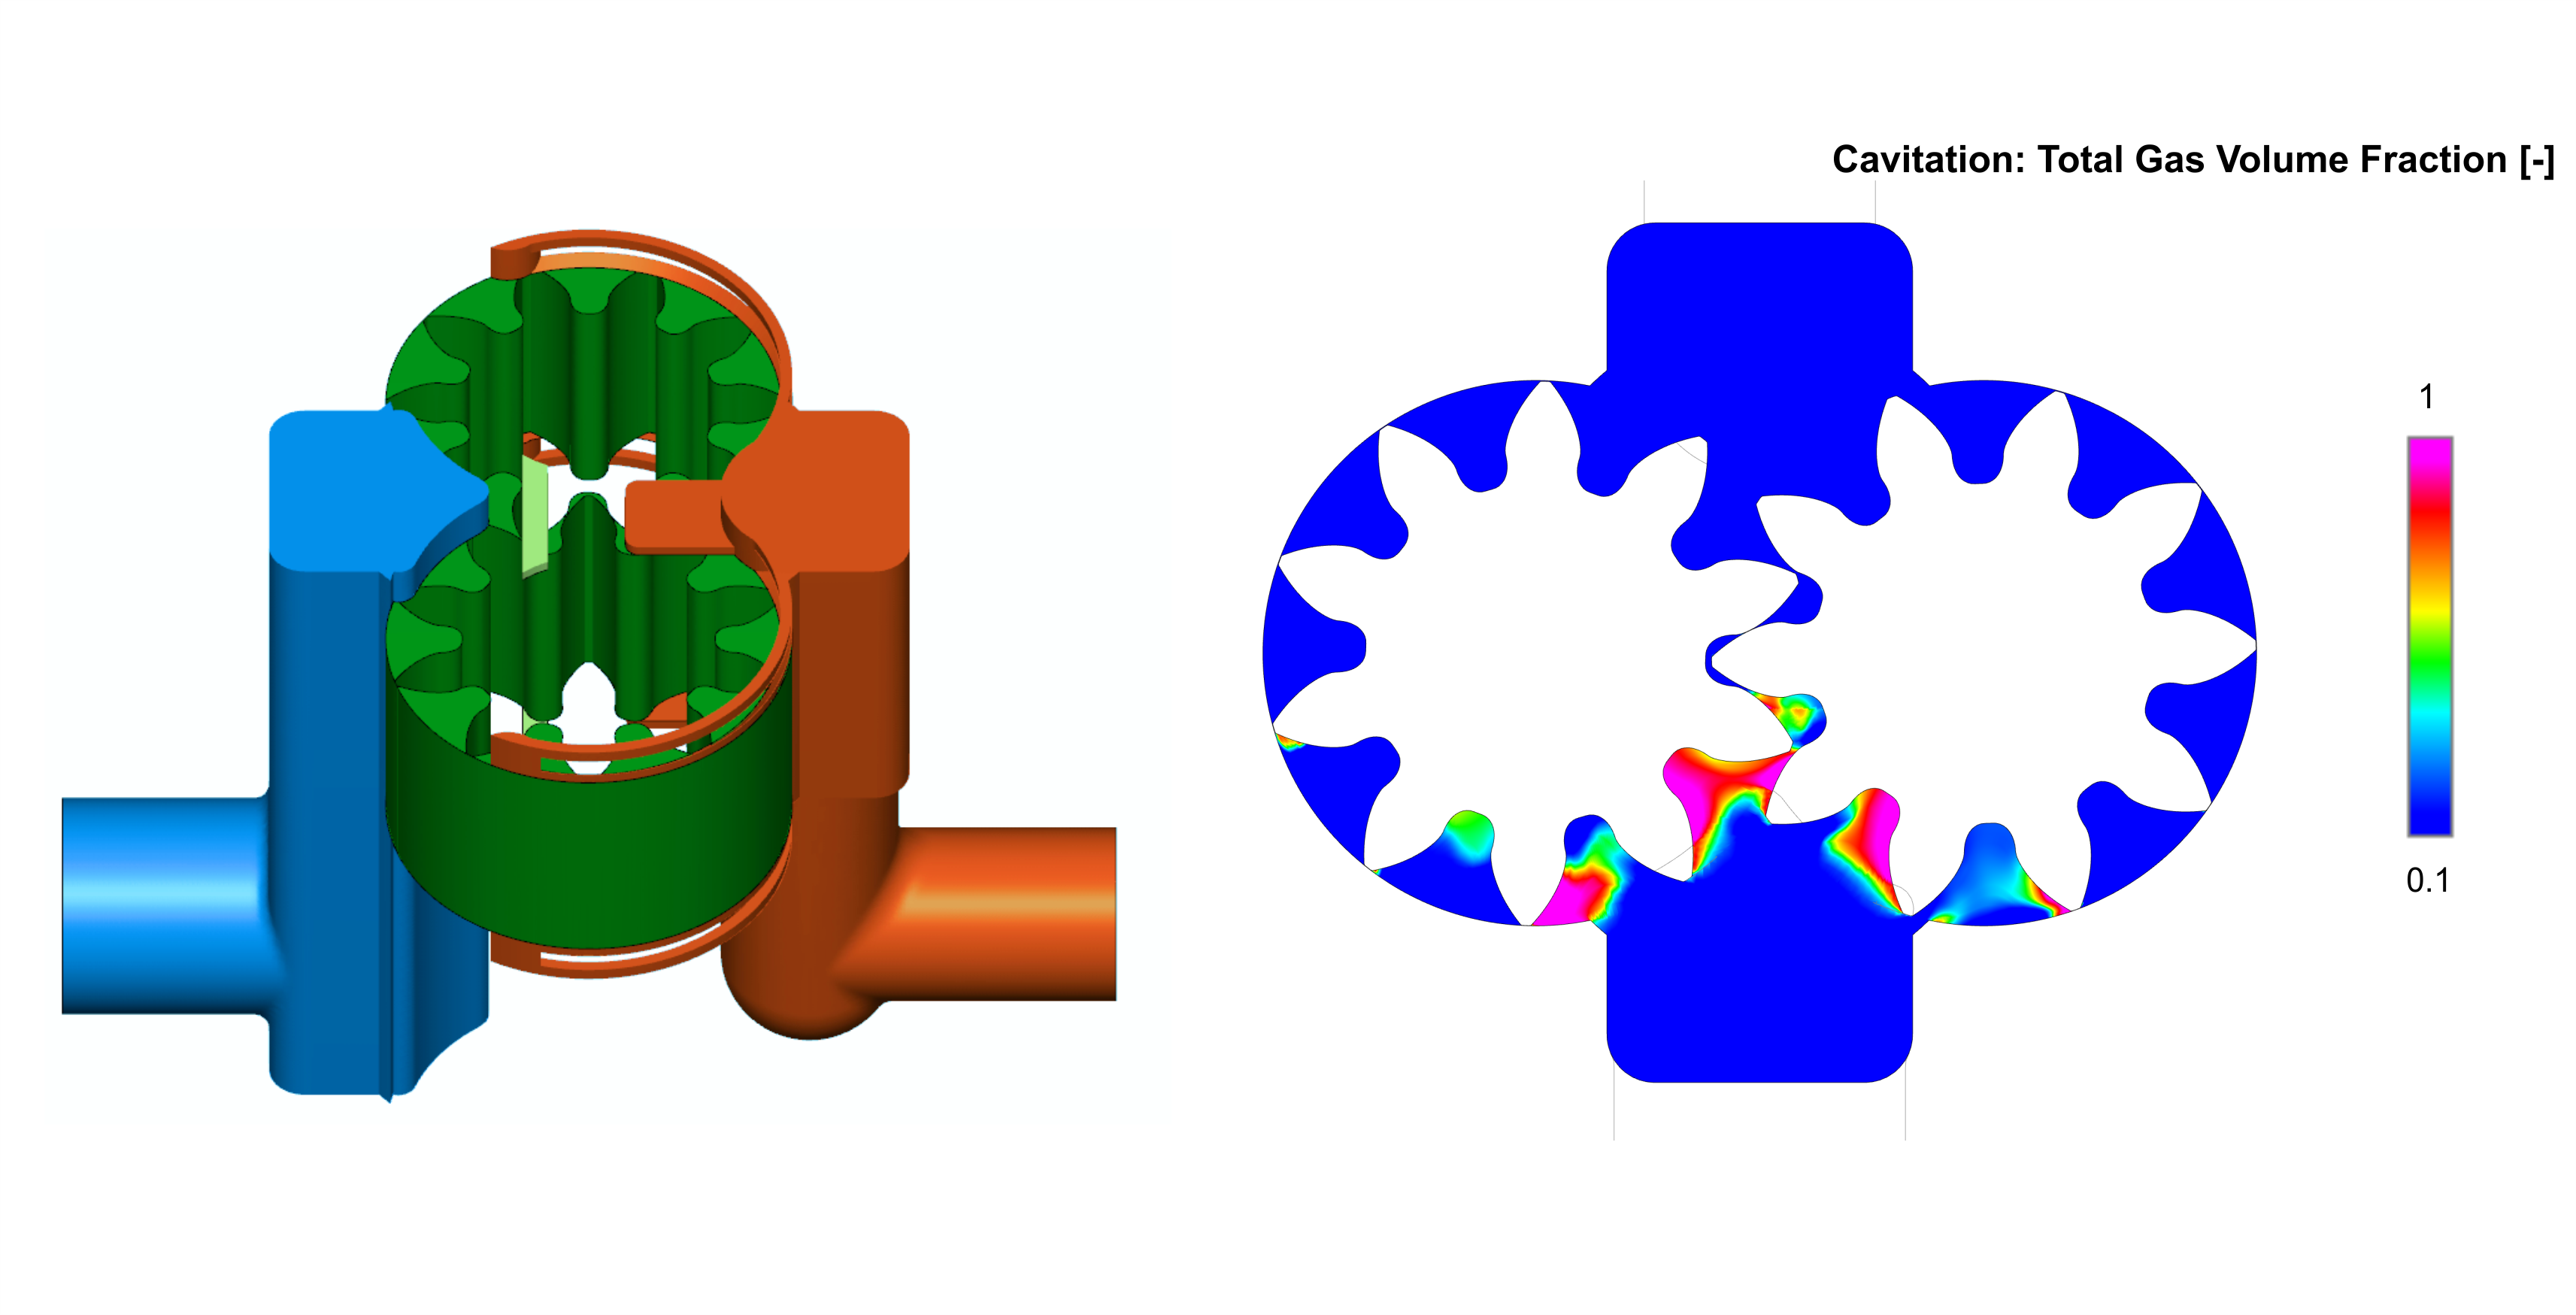
Figure 15 reports the total gas/vapor fraction and the pressure field in the inlet volume relative to the simulated operating point in
Figure 14 at 2000 rpm, inlet pressure 0.13 absolute bar and delivered flow rate 90 L/min. In
Figure 15a the gas volume fraction indicates that the gaseous/vapor phase is present not only massively in the meshing region, but also in the isolated tooth chambers, where due to the centrifugal force the oil fraction is pushed outwards. From the pressure field in
Figure 15b, the pressure drop between the inlet volume (in green) and the tooth spaces (in blue) is evident. Such a drop is a function not only of the geometrical flow areas, but also of the shape, spatial position, and orientation of the tooth space with respect to the inlet volume, as demonstrated in other studies on gerotor and vane pumps [
43,
44]. Moreover, the velocity of the chamber that is leaving the inlet volume has an influence on the angle with which the fluid enters the chamber itself. A pressure recovery is also observed on the outermost part of the leading flank, due to the impact of the fluid against the tooth.
In a 0D model all these variables are lumped together in the discharge coefficient that is not known a priori and depends on the specific geometry and operating conditions. Hence, with a lumped parameter model, the matching with the experimental data can be done only by tuning for each speed the discharge coefficients of the flow area between the inlet volume and the chambers, but it is obvious that such a model cannot be predictive at all.
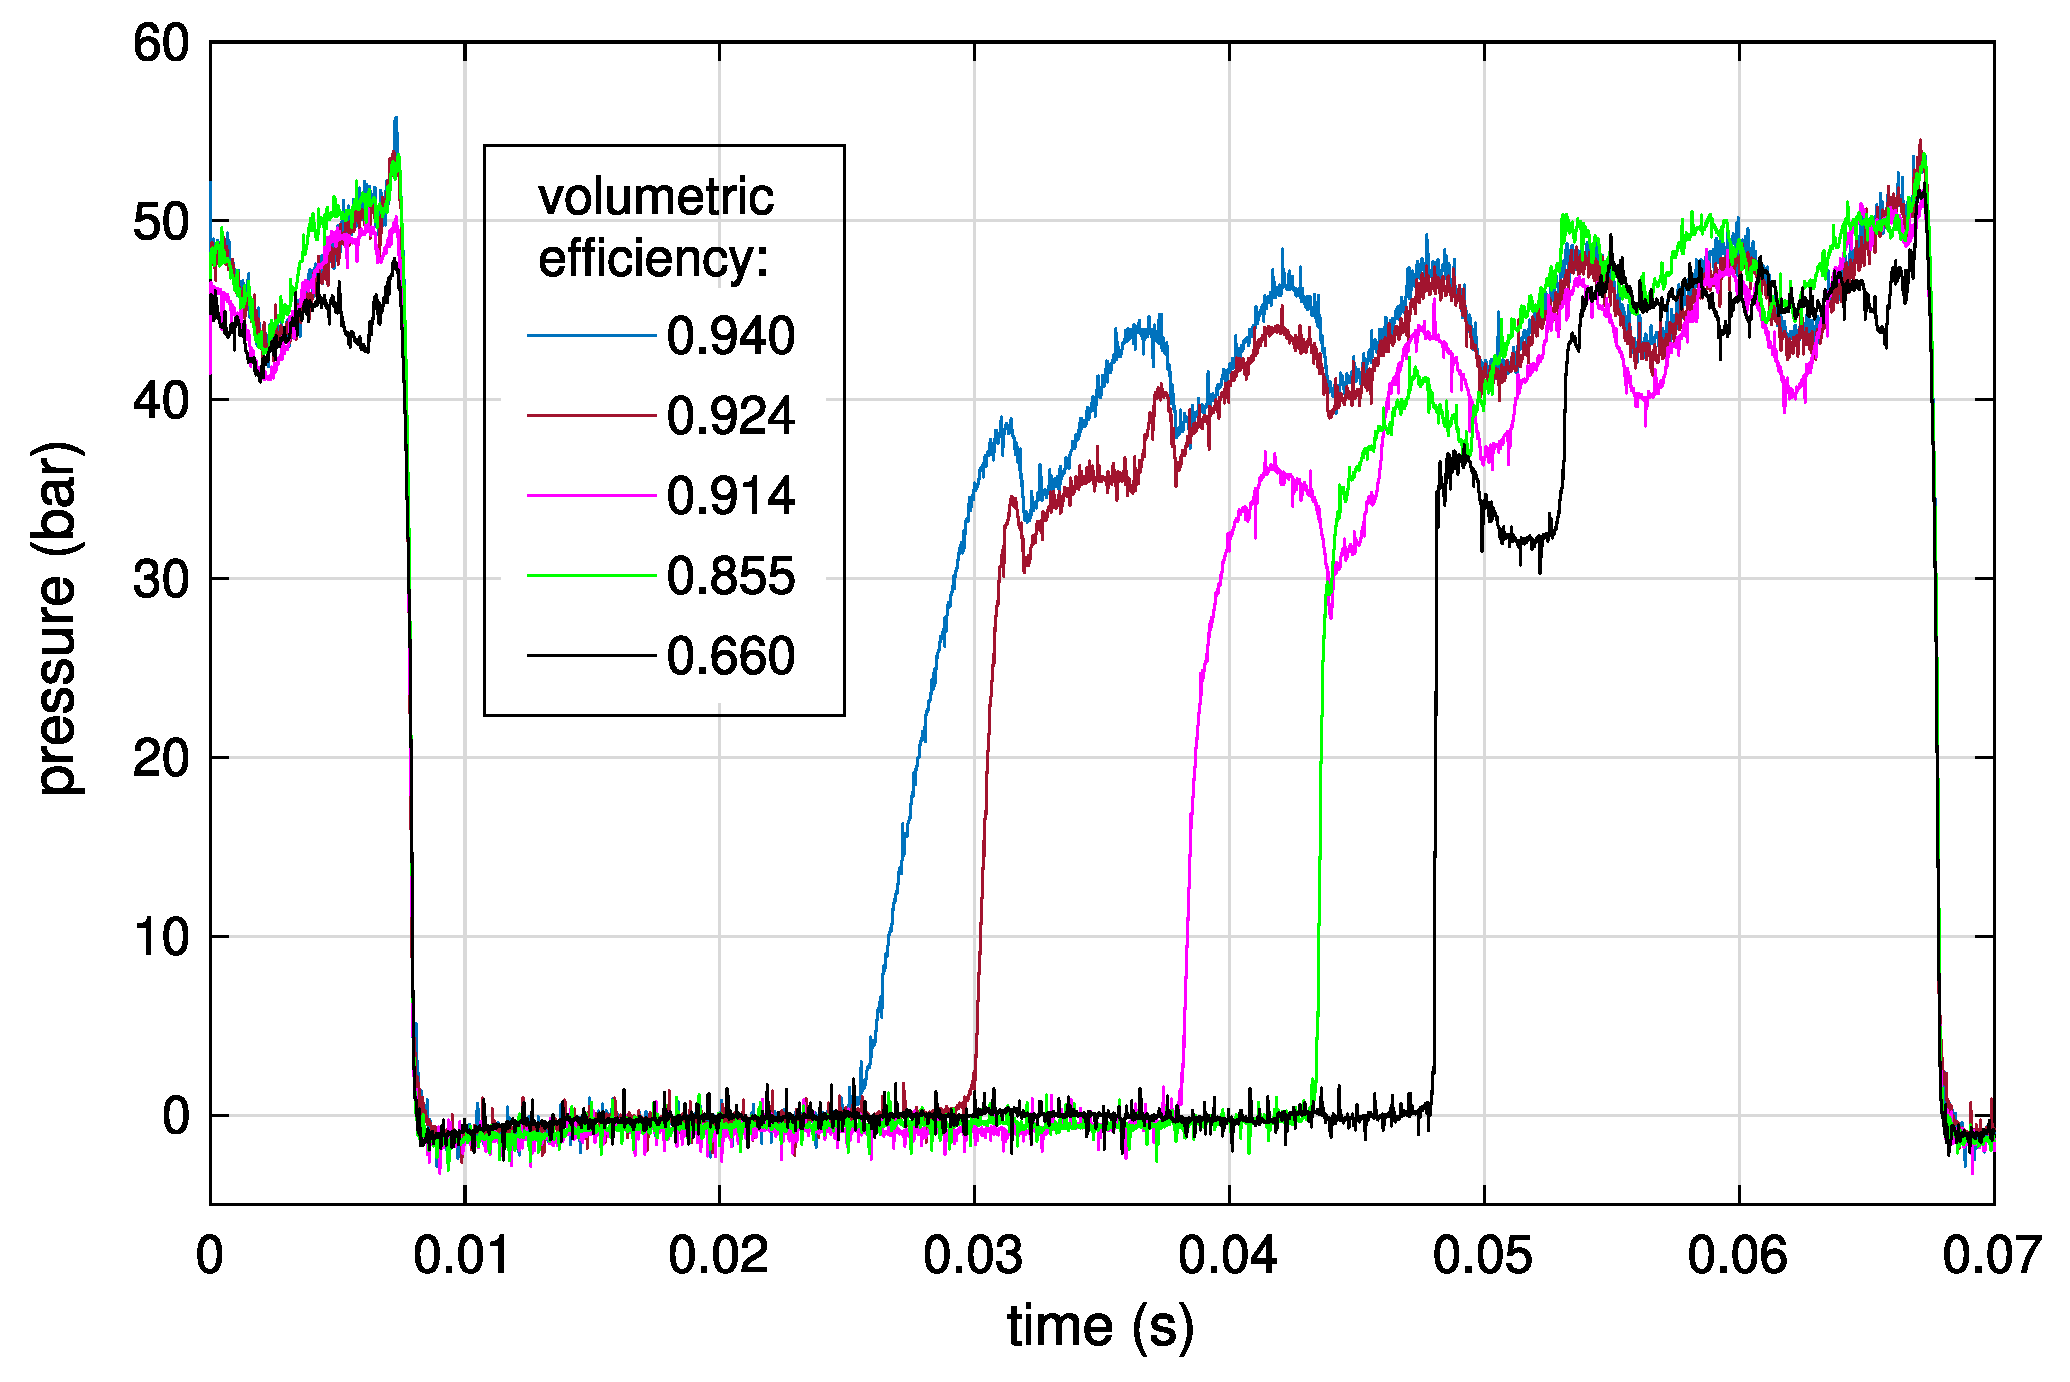
To conclude, in
Figure 16 a graph showing what happens in the tooth space chamber in conditions of incomplete filling is reported. The tests were performed in a similar way as the measurements of
Figure 14. Each curve was obtained with a different setting of the relief valve RV1 corresponding to a different value of the delivered flow rate and therefore of the volumetric efficiency. As the incomplete filling increases, the leakage flow towards the tooth space takes more and more time to fill completely the volume and the pressurization is progressively delayed. In the case of severe cavitation (black curve), the pressurization occurs only when the flow area between the tooth space and the delivery volume opens.
6. Conclusions
With the continuous growth of the computational capabilities of the mid-range workstations, the 3D CFD simulation of entire machines is becoming more and more common. Generally, it is believed that the only drawback of the CFD simulation is the high computational time, while as far as accuracy is concerned, it is always better than a 0D model. However, it is also well known that the external gear machines represent a case where some important characteristics, such as the micro-movements of the components, can be managed only in a lumped parameter model.
With reference to CFD models, in this paper two aspects have been highlighted.
Firstly, the tooth space pressure history can be predicted very well in different operating conditions, without any specific tuning, as long as a reasonably high eccentricity ratio of the bushings is used. In the CFD model, the eccentricity was generated by translating the axes of the gears along a perpendicular direction with respect to the line joining the theoretical centers towards the inlet volume. On the contrary, poor results are obtained.
Secondly, also the minimum pressure for which the pump is able to work with complete filling of the chambers can be estimated with a good confidence without the tuning on experimental data. This feature makes the CFD model particularly suitable for determining the limit conditions in terms of maximum speed or maximum allowable pressure drop in the suction line. Hence, a typical application is the optimization of the geometry of the suction side for increasing the maximum working speed of the pump.
In conclusion, this research has brought to evidence by means of focused experimental validations the type of studies for which a CFD approach has to be preferred.


