
Impact of Time-Use Behaviour on Residential Energy Consumption in the United Kingdom


Abstract
:1. Introduction
- (i).
- Which energy-relevant activities are undertaken more or less often when comparing regular and irregular work patterns?
- (ii).
- How does the duration of energy-relevant activities change with regular and irregular work patterns?
- (iii).
- How does the energy intensity of energy-relevant activities change in response to different work patterns?
2. Conceptual Framework
2.1. Types of Work Schedules
2.2. Timing and Duration
2.3. Location
2.4. Sequential Order
2.5. Estimation of Energy Consumption Based on Activity Data
3. Data and Variables
3.1. Dependent Variables
Estimating Likely Energy Use
3.2. Explanatory Variables
3.2.1. Work Time and Work Pattern Calculation
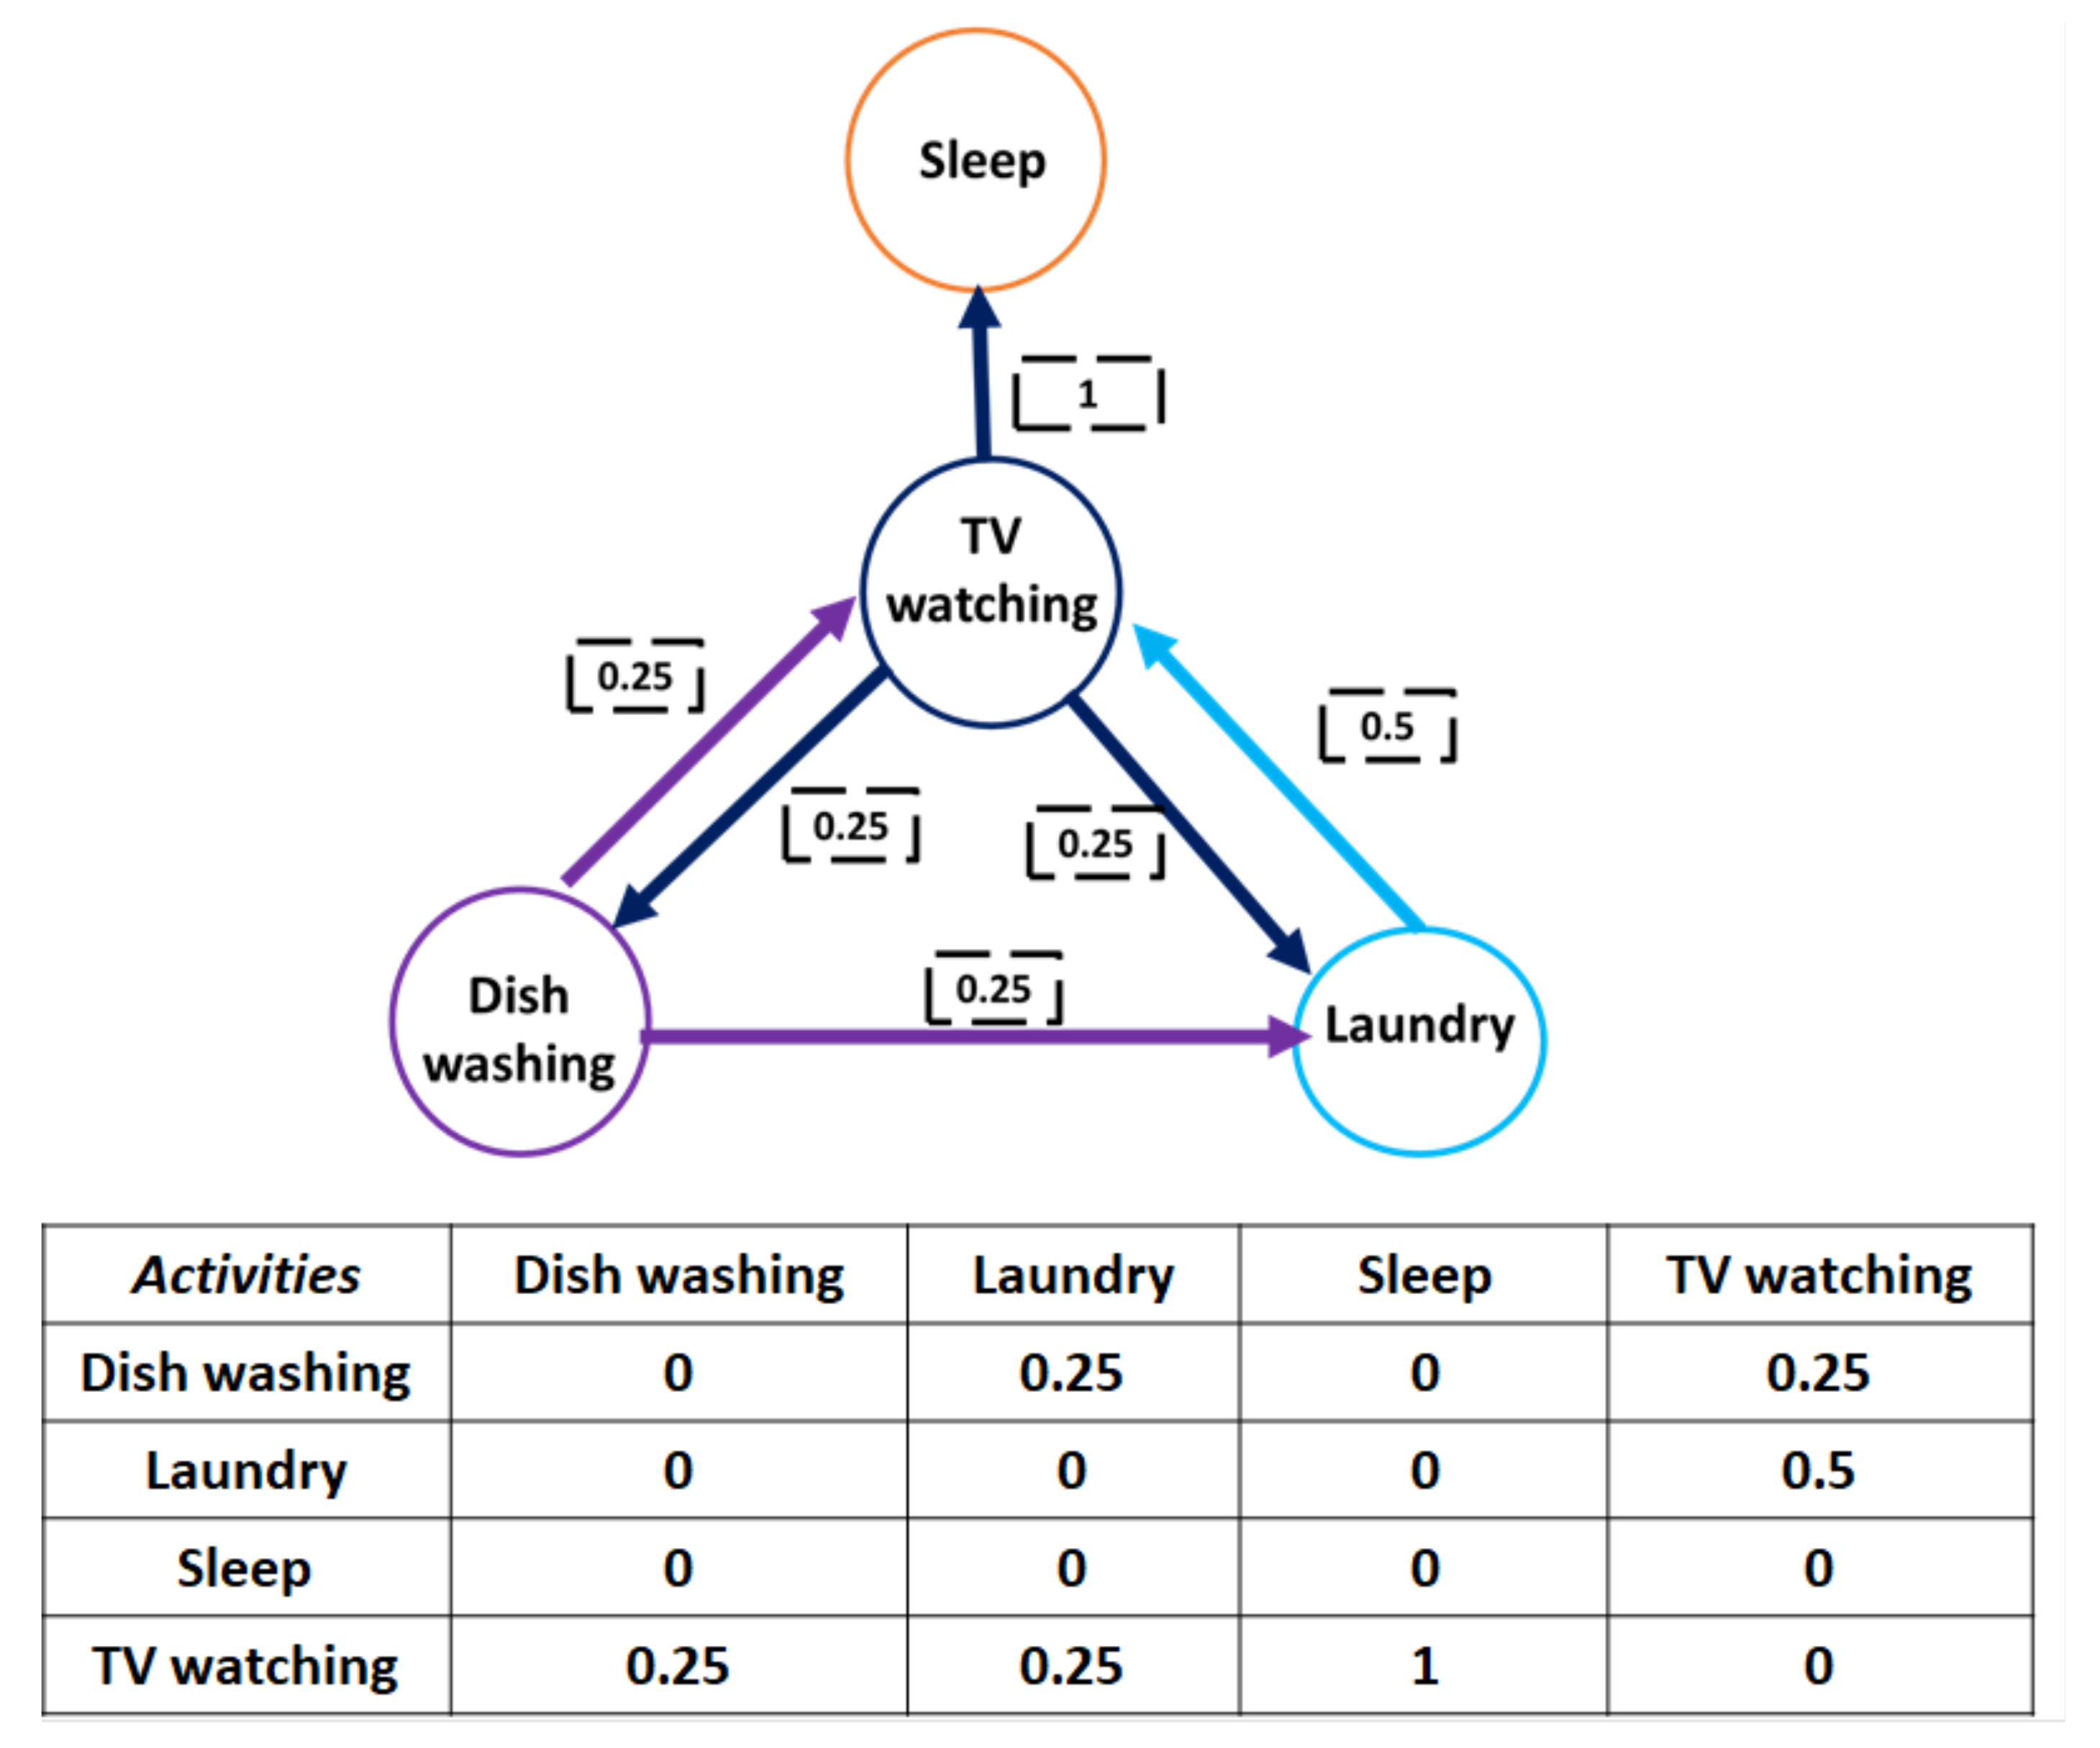
3.2.2. Betweenness Centrality of Activities
3.2.3. Time-Dependence
3.2.4. Regression Analysis
4. Results
4.1. Time-Use Results
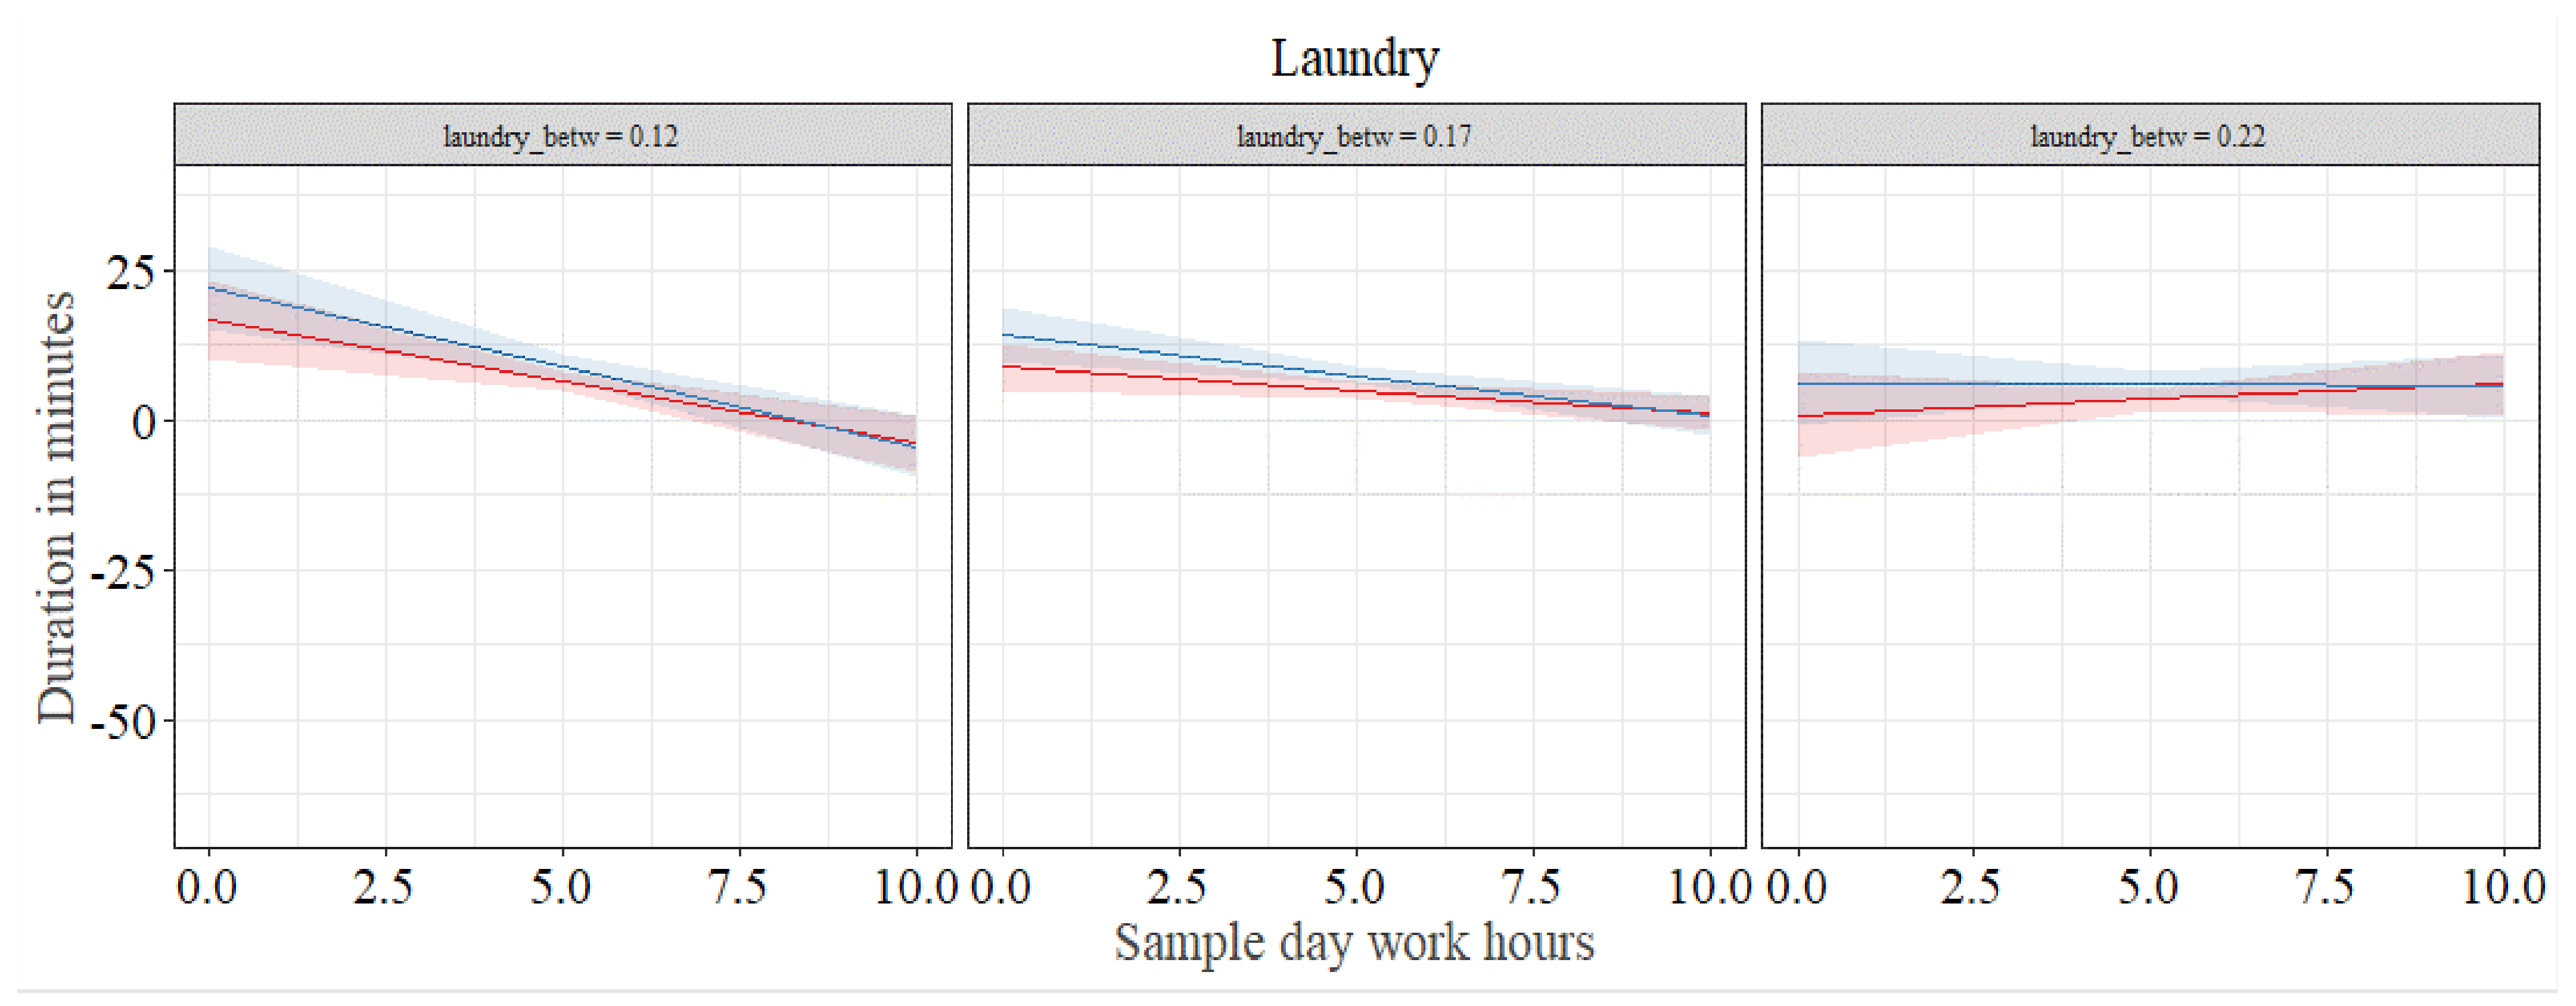
4.2. Investigating the Position of Activities throughout Workdays
4.3. Energy Intensity Results
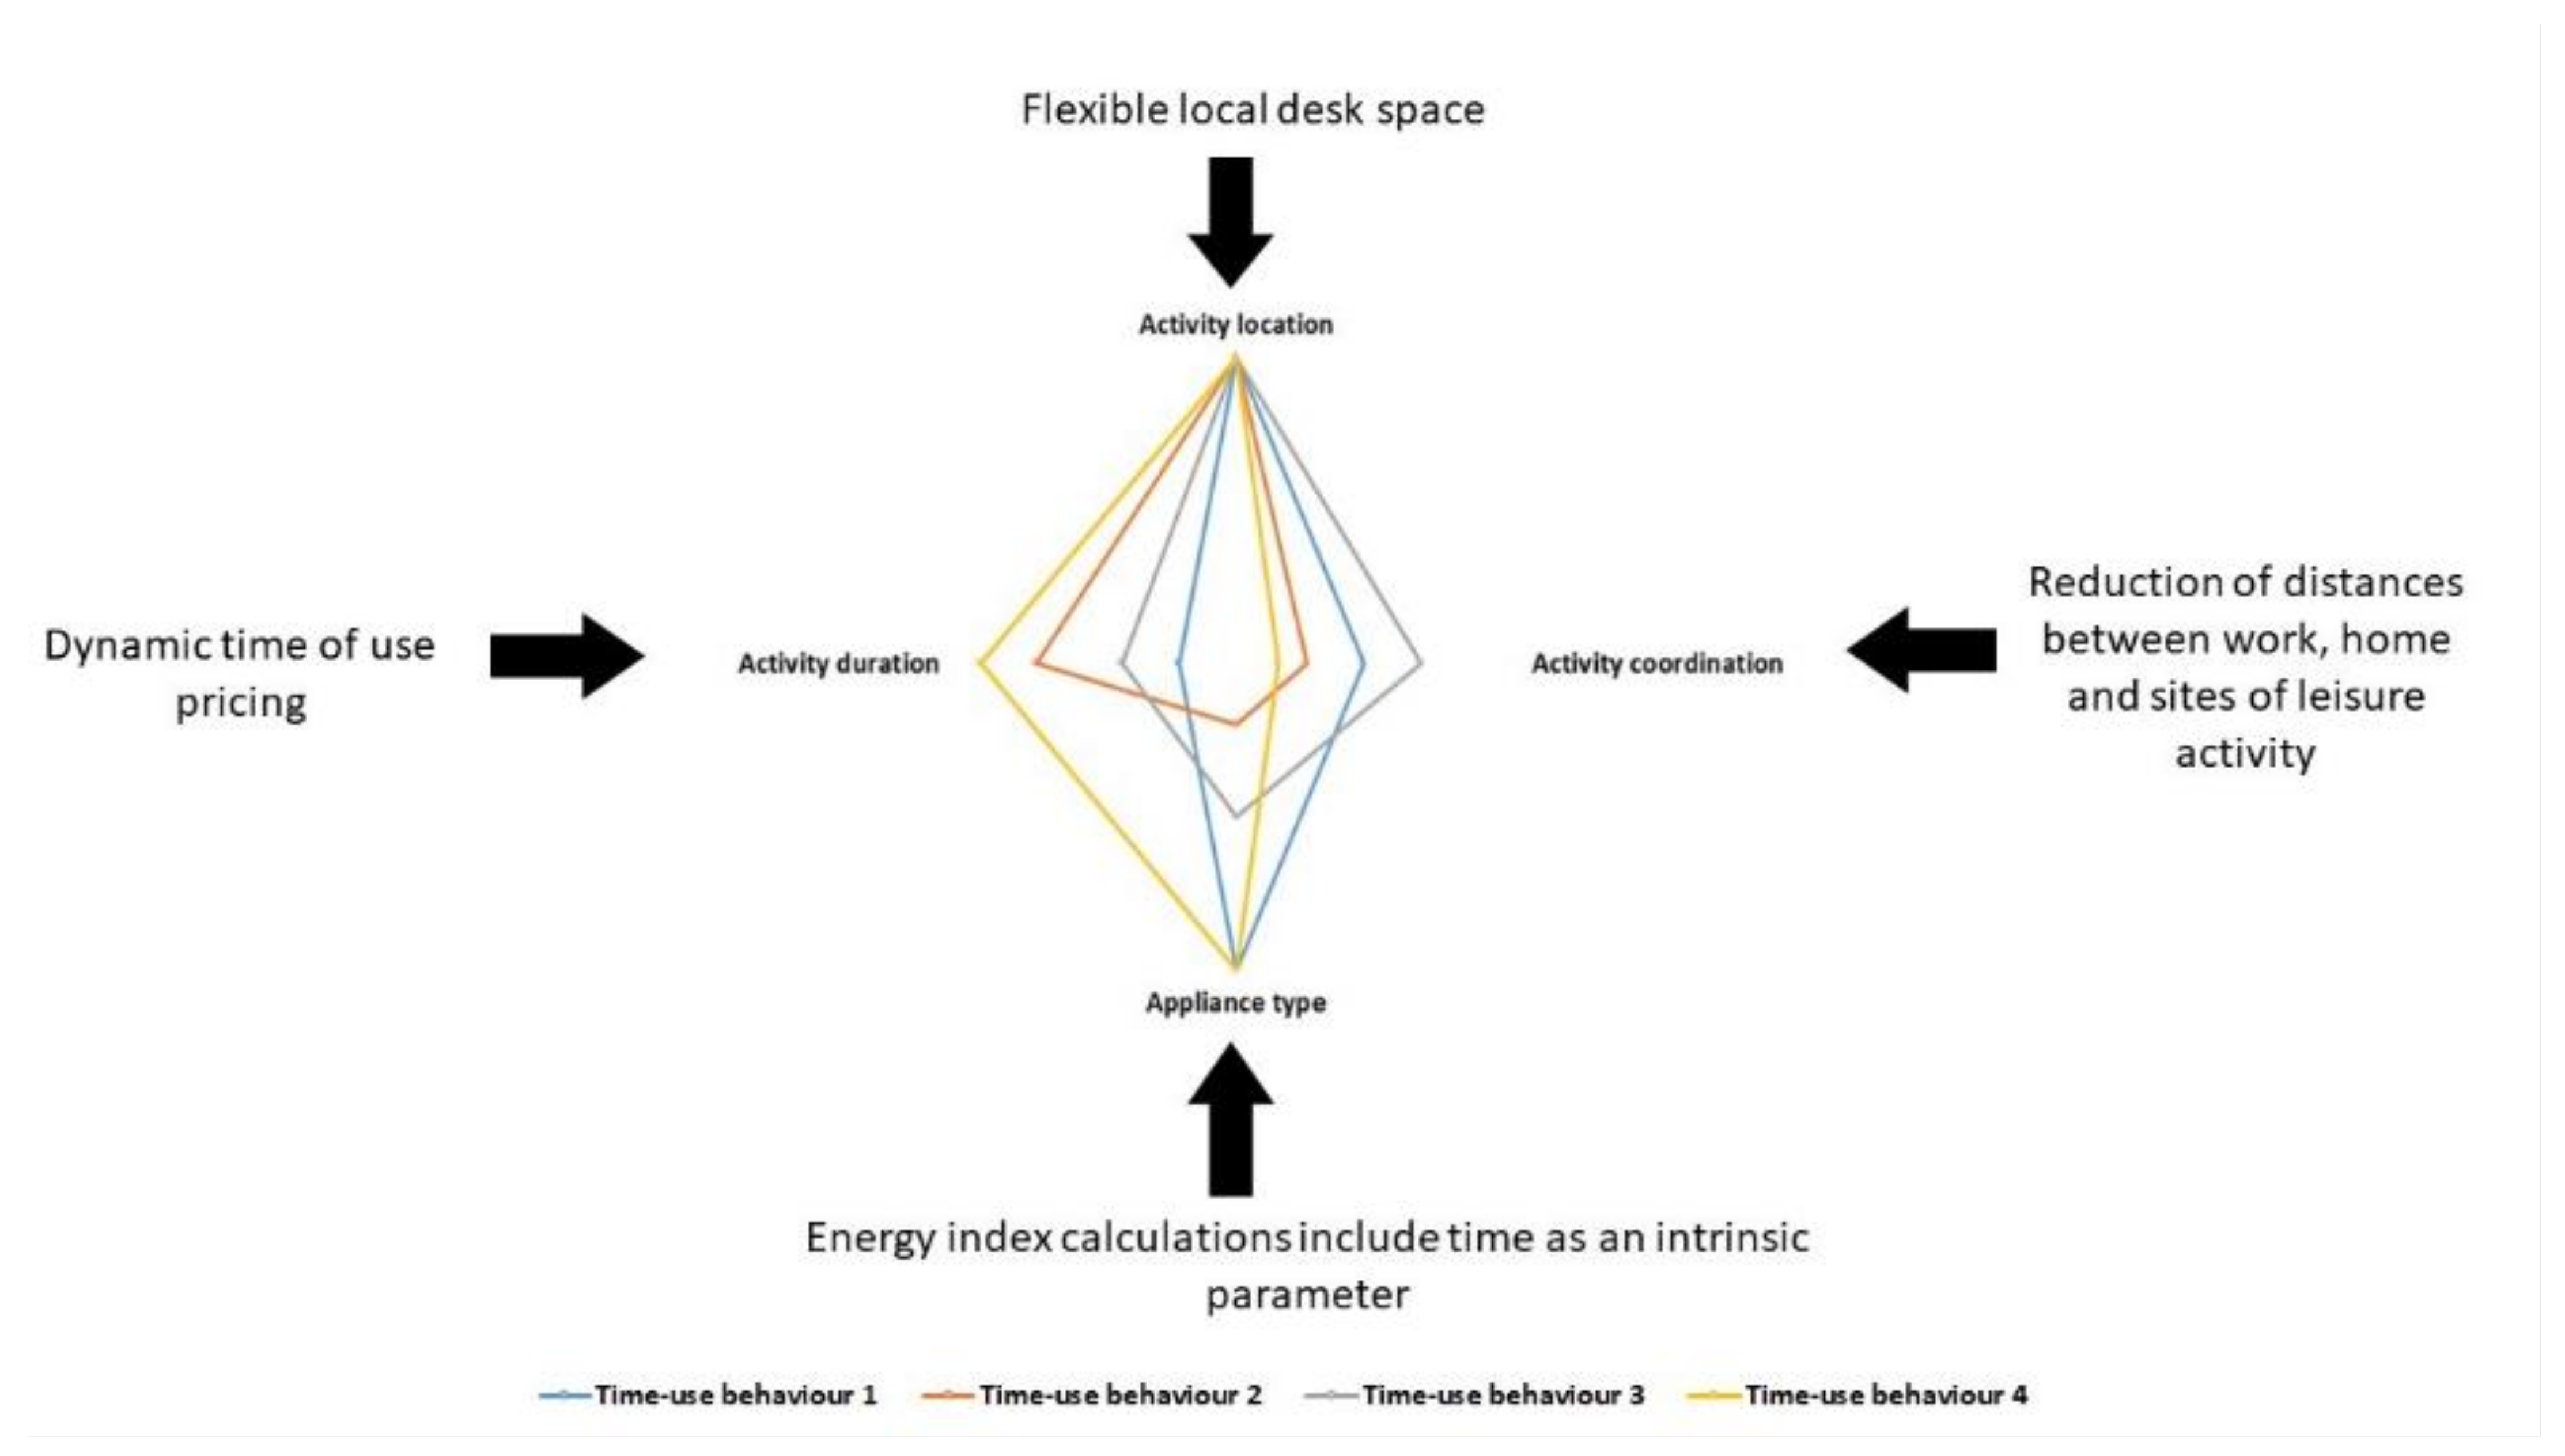
5. Discussion and Policy Implications
6. Limitations
7. Conclusions
Author Contributions
Funding
Institutional Review Board Statement
Informed Consent Statement
Data Availability Statement
Conflicts of Interest
Appendix A. Systematic Review of Previous Time-Use Behaviour Studies

| Author | Data | Weekly Work Patterns | Data Resolution | Sample Size |
|---|---|---|---|---|
| Lesnard [47] | UK Time Use Survey (2000) | Identified five types of workdays and seven types of workweeks and more varieties of part-time work in the UK. | 15 min—Seven days | 4944 individuals |
| Lesnard [48] | French Time-Use Survey 1985/86 and 1998/99 | Used three indexes (conjugal parent–child and parent–child time) to measure off-scheduling and calculated work synchronicity percentages based on the ratio of the number of hours of simultaneous work to the number of hours at least one spouse works (the length of the family workday) | 10 min—One day | 17,832 individuals |
| Glorieux [49] | Belgian Time Use Survey (1966-1999) | Distinguished between four types of non-standard work times: (1) evening work, from 7:00 pm to 10:00 pm on any day of the week; (2) night work, from 10:00 pm to 6:00 am on any day of the week; (3) Saturday work, from 6:00 am to 7:00 pm on Saturdays; and (4) Sunday work, from 6:00 am to 7:00 pm on Sundays. Standard work times refer to weekdays between 6:00 am and 7:00 pm | 10 min—One weekday and weekend | 3211 individuals |
| Glorieux [50] | Flemish Time Use Survey (1994–2004) | Identified 12 different time-use patterns in terms of the amount of paid and unpaid work and the dominant leisure activity (i.e., watching TV or more active leisure activities) | 15 min—Seven days | 2285 individuals |
| Barnes [35] | UK Time Use Survey (2000) | Identified atypical work schedules based on weekly work grid diaries and performed a cross-sectional ordinary least squares (OLS) regression, which revealed that time spent with children, and time spent on particular activities involving children, is negatively associated with atypical working patterns (including weekend working) of both fathers and mothers. | 15 min—Seven days | 1028 individuals |
| Minnen [46] | Belgian Time Use Survey (1966–1999) | Used two dimensions of paid work to typify weekly work patterns. The first dimension is the number of hours worked, which indicates the continuum of part-time through full-time work (i.e., 40 h/week) to overwork (i.e., extended workweek). The second dimension is the percentage of work performed on non-standard periods, which we define as weekend work (i.e., work performed on weekend days from 6 am to 7 pm), evening work (i.e., work performed all days from 7 pm to 10 pm) and night work (i.e., work performed on all days from 10 pm to 6 am the next day). The ‘standard workweek pattern’ has to meet the standard of both dimensions, that is, contain about 40 h of paid work and the least percentage of work performed on non-standard working periods. | 15 min—Seven days | 6330 individuals |
| Chenu [51] | French Time-Use Survey 1998/99 | Defined a dissimilarity index to quantify the gap between dual earners work schedules and to explore how married couples who have similar or different patterns of work hours engage in other activities. | 15 min—Seven days | 1488 individuals |
| Author | Data | Method | The Application of the Sequence Analysis Method |
|---|---|---|---|
| Glorieux [49] | Belgian Time-Use Surveys from 1966 and 1999 | Optimal matching algorithm (Dynamic Hamming Distance) | Using a sequencing method, the authors were able to identify 12 types of work schedules. |
| Glorieux [50] | Belgian Time-Use Surveys from 1999 and 2004 | Optimal matching algorithm | Using sequence and cluster analysis, the authors distinguished between 12 different time-use patterns and labelled them in terms of the amount of paid and unpaid work and the dominant leisure activity (i.e., watching TV or more active leisure activities). |
| Hellgren [21] | Swedish time-use survey conducted in 2010 | Regression modelling compared with optimal matching algorithm | Using an approach that takes the sequence of activities into account allows to gain a better understanding of how people plan their day in the context of their daily activities |
| Lesnard [52] | Two French time-use surveys (1985, 1998) | Optimal matching analysis | Twelve configurations of family workdays of French families are uncovered |
| Lesnard [47] | Two French time-use surveys (1986, 1999) | Optimal matching algorithm (Dynamic Hamming Distance) | Off-scheduling is widespread and on the rise, according to this analysis of the empirical typology of couple’s work schedules built using optimal matching. |
| Lesnard [53] | French time-use survey conducted in 1999 | Optimal matching algorithm (Dynamic Hamming Distance) | A typology of nine workweek schedules was derived using two-stage optimal matching |
| Lesnard [47] | 7-day diary data from the UK 2000–2001 | Two-stage optimal matching | Using two-stage optimal matching the authors identified five types of workdays and seven types of workweeks and more varieties of part-time work in the UK. |
| Minnen [46] | Belgian time-use surveys of 1999 and 2005 | Optimal matching algorithm (Dynamic Hamming Distance) and Ward’s Hierarchical Clustering | Using optimal matching the authors identified 10 weekly work patterns. |
| Study | Data | Activities | Data Resolution | Sample Size |
|---|---|---|---|---|
| Richardson [54] | UK Time Use Survey (2000) | Washing, Ironing, House cleaning, Laundry, Watching TV, Cooking, Other (at home) | 10 min—one weekday and weekend | 10,000 individuals |
| Chiou [55] | American Time-Use Survey (2008) | Sleeping, Computer use for leisure, TV and movies, Research and homework, Wating and drinking | 10 min—one weekday and weekend | 13,000 individuals |
| Widén [32] | Statistics Sweden (SCB) (1996) | Away, Sleeping, Cooking, Dishwashing, Washing, TV, Computer, Audio, Other | 5 min—one weekday and weekend | 463 individuals in 179 households |
| López-Rodríguez [56] | Spanish National Institute of Statistics (2010) | Personal care, Food preparation and conservation, Washing dishes, Clean house and garden, Doing laundry, Ironing, Watching TV, Watching DVD or video, Listening to radio, Listening to records, Using computer | 10 min—one weekday and weekend | 19,295 individuals from 9541 households |
| Wilke [57] | French Time-Use Survey | Other, Other leisure, Conversation, Relax, Read, Study, Watch TV or video, Listen to music, Dances or parties, Religious/Civic activities, Sleep, Meals and snacks, Dress/personal care, Childcare, Gardening, Odd jobs, Housework, Cook, wash up, School, classes, Paid work | 10 min—one weekday and weekend | 15,441 individuals from 7949 households |
| Neu [58] | National Time-Use Survey of Ireland (2005) | Washing, Ironing, House cleaning, Laundry, Watching TV, Cooking, Other (at home) | 15 min—one weekday and weekend | 1089 individuals from 567 households |
| Aerts [59] | Belgian Time-Use Survey (TUS) | Away, At home but awake, Sleeping | 10 min—one weekday and weekend | 6400 individuals from 3455 households |
| Fischer [60] | German TUS (2002) | Entertainment, Laundry, Cooking, Dish washing, Other | 10 min | 14,000 individuals from 5200 households |
| Torriti [61] | UK Time Use Survey (2005) | Preparing food, Washing, Cleaning, Washing clothes, Watching TV, Computer | 10 min—one weekday and weekend | 3554 diaries |
| Anderson [30] | UK TUS 1985 and 2005 | Laundry | 10 min (2005) 1-diary day 15 min (1985)—each day of the selected week | 4854 individuals |
| Palm [62] | Statistics Sweden (SCB) (2010/2011) | Cooking, Doing laundry, Watching TV | 10 min—one weekday and weekend | 6477 individuals |
| Barthelmes [24] | Danish Time Use Survey (2008/09) | Sleeping, Toilette, Eating, Cooking/washing dishes Cleaning/washing clothes, Practical work Family care/free time, Relaxing/TV/IT, Not at home, Others | 10 min—one weekday and weekend | 9640 individuals from 4679 households. |
| Liu [63] | Danish Time Use Survey (2008/09) | Sleeping, Cooking, Washing dishes, Laundry, Cleaning, Leisure, Away, Other | 10 min—one weekday and weekend | 9640 individuals from 4679 households |
| Ramírez-Mendiola [26] | UK Time Use Survey (2015) | Absence, Sleep, Generic active, occupancy TV watching, Food preparation, Laundering, Dish washing, ICT related | 10 min—one weekday and weekend | 10,208 individuals from 4733 households |
| Yamaguchi [64] | Japanese TUD (Statistics Bureau of Japan 2006) | Activities are classified as routine and non-routine activities. Routine activities include: sleeping, work/school, having breakfast, lunch, dinner and bathing. Non-routine activities include: laundry and watching TV. | 15-min intervals—two sequential days | 8,291 diaries collected from people aged 10 or older in 3866 households. |
| Yilmaz [25] | French Time Use Data (2010) | Sleeping, Cleaning clothes, Cleaning dishes, Cooking, Eating in, Listening, Watching TV, Computer, Other (at home), Other (outside) | 10 min—one weekday and weekend | 27,903 individuals |
| Escobar [65] | Spanish National Institute of Statistics (2010) | Cleaning clothes, Cleaning dishes, Cooking, Eating in, Watching TV, Computer | 10 min—one weekday and weekend | 19,295 individuals from 9541 households |
| Buttitta [66] | UK Time Use Survey (2015) | Away, At home and active, Home asleep | 10 min—one weekday and weekend | 10,208 individuals from 4733 households |
| Torriti [67] | UK Time Use Survey (2014/15) | Preparing food, Washing, Cleaning, Washing clothes, Watching TV, Computer | 10 min—one weekday and weekend | 3554 diaries |
References
- Srivastava, A.; Van Passel, S.; Laes, E. Dissecting demand response: A quantile analysis of flexibility, household attitudes, and demographics. Energy Res. Soc. Sci. 2019, 52, 169–180. [Google Scholar] [CrossRef]
- Torriti, J. Price-based demand side management: Assessing the impacts of time-of-use tariffs on residential electricity demand and peak shifting in Northern Italy. Energy 2012, 44, 576–583. [Google Scholar] [CrossRef]
- Bartusch, C.; Wallin, F.; Odlare, M.; Vassileva, I.; Wester, L. Introducing a demand-based electricity distribution tariff in the residential sector: Demand response and customer perception. Energy Policy 2011, 39, 5008–5025. [Google Scholar] [CrossRef]
- Buhl, J.; Acosta, J. Work less, do less? Sustain. Sci. 2015, 11, 261–276. [Google Scholar] [CrossRef]
- Carroll, J.; Lyons, S.; Denny, E. Reducing household electricity demand through smart metering: The role of improved information about energy saving. Energy Econ. 2014, 45, 234–243. [Google Scholar] [CrossRef]
- Department for Business, Energy and Industrial Strategy. Statistics on Electricity from Generation through to Sales. Available online: https://assets.publishing.service.gov.uk/government/uploads/system/uploads/attachment_data/file/904805/DUKES_2020_Chapter_5.pdf (accessed on 27 September 2021).
- Gershuny, J.; Sullivan, O. United Kingdom Time Use Survey, 2014–2015; Centre for Time Use Research, University of Oxford: Oxford, UK, 2017. [Google Scholar] [CrossRef]
- Klein, F.; Drews, S.; Savin, I.; van den Bergh, J. How work patterns affect leisure activities and energy consumption: A time-use analysis for Finland and France. Energy Res. Soc. Sci. 2021, 76, 102054. [Google Scholar] [CrossRef]
- Nässén, J.; Holmberg, J. Quantifying the rebound effects of energy efficiency improvements and energy conserving behaviour in Sweden. Energy Effic. 2009, 2, 221–231. [Google Scholar] [CrossRef]
- Nässén, J.; Larsson, J. Would shorter working time reduce greenhouse gas emissions? An analysis of time use and consumption in Swedish households. Environ. Plan. C Gov. Policy 2015, 33, 726–745. [Google Scholar] [CrossRef]
- Office of Gas and Electricity Markets. Demand Side Response—A Discussion Paper. Available online: https://www.ofgem.gov.uk/ofgem-publications/57026/dsr-150710.pdf (accessed on 27 September 2021).
- Sullivan, O.; Gershuny, J. Speed-Up Society? Evidence from the UK 2000 and 2015 Time Use Diary Surveys. Sociology 2017, 52, 20–38. [Google Scholar] [CrossRef] [Green Version]
- Gershuny, J. Busyness as the badge of honor for the new superordinate working class. Soc. Res. 2005, 72, 287–314. [Google Scholar]
- Bittman, M.; Wajcman, J. The Rush Hour: The Character of Leisure Time and Gender Equity. Soc. Forces 2000, 79, 165–189. [Google Scholar] [CrossRef]
- Sorrell, S.; Gatersleben, B.; Druckman, A. Energy Sufficiency and Rebound Effects. Available online: https://www.energysufficiency.org/libraryresources/library/items/energy-sufficiency-and-rebound-effects-concept-paper/ (accessed on 27 September 2021).
- Williams, E.D. Assessing the potential of telecommuting as an energy savings technology in Japan. In Proceedings of the IEEE International Symposium on Electronics and the Environment, Boston, MA, USA, 19–22 May 2003; pp. 147–152. [Google Scholar] [CrossRef]
- Matthews, H.S.; Williams, E. Telework Adoption and Energy Use in Building and Transport Sectors in the United States and Japan. J. Infrastruct. Syst. 2005, 11, 21–30. [Google Scholar] [CrossRef]
- Kitou, E.; Horvath, A. External air pollution costs of telework. Int. J. Life Cycle Assess. 2007, 13, 155–165. [Google Scholar] [CrossRef]
- Burkinshaw, J.R. Commuting and the Role of Flexible Working Practices. Ph.D. Thesis, University of Leeds, Leeds, UK, 2018. [Google Scholar]
- Durand-Daubin, M.; Anderson, B. Changing Eating Practices in France and Great Britain: Evidence from Time-Use Data and Implications for Direct Energy Demand. In Demanding Energy; Palgrave Macmillan: Cham, Switzerland, 2017; pp. 205–231. [Google Scholar] [CrossRef]
- Hellgren, M. Extracting More Knowledge from Time Diaries? Soc. Indic. Res. 2014, 119, 1517–1534. [Google Scholar] [CrossRef]
- Vagni, G.; Widmer, E.D. Couple Time and Partnership Quality: An Empirical Assessment Using Diary Data. Available online: https://osf.io/preprints/socarxiv/k7nxm/ (accessed on 27 September 2021).
- Cornwell, B. Network Analysis of Sequence Structures. In Sequence Analysis and Related Approaches; Springer: Cham, Switzerland, 2018; pp. 103–120. [Google Scholar] [CrossRef] [Green Version]
- Barthelmes, V.M.; Li, R.; Andersen, R.K.; Bahnfleth, W.; Corgnati, S.P.; Rode, C. Profiling occupant behaviour in Danish dwellings using time use survey data. Energy Build. 2018, 177, 329–340. [Google Scholar] [CrossRef]
- Yilmaz, S.; Rinaldi, A.; Patel, M. DSM interactions: What is the impact of appliance energy efficiency measures on the demand response (peak load management)? Energy Policy 2020, 139, 111323. [Google Scholar] [CrossRef]
- Mendiola, J.L.R.; Grünewald, P.; Eyre, N. Linking intra-day variations in residential electricity demand loads to consumers’ activities: What's missing? Energy Build. 2018, 161, 63–71. [Google Scholar] [CrossRef]
- Yu, B.; Zhang, J.; Wei, Y.-M. Time use and carbon dioxide emissions accounting: An empirical analysis from China. J. Clean. Prod. 2019, 215, 582–599. [Google Scholar] [CrossRef]
- Stankovic, L.; Liao, J.; Wilson, C. Measuring the energy intensity of domestic activities from smart meter data. Appl. Energy 2016, 183, 1565–1580. [Google Scholar] [CrossRef] [Green Version]
- Asgari, H.; Jin, X. An evaluation of part-day telecommute impacts on work trip departure times. Travel Behav. Soc. 2017, 12, 84–92. [Google Scholar] [CrossRef]
- Anderson, B. Laundry, energy and time: Insights from 20 years of time-use diary data in the United Kingdom. Energy Res. Soc. Sci. 2016, 22, 125–136. [Google Scholar] [CrossRef] [Green Version]
- Torriti, J. Understanding the timing of energy demand through time use data: Time of the day dependence of social practices. Energy Res. Soc. Sci. 2017, 25, 37–47. [Google Scholar] [CrossRef]
- Widén, J.; Lundh, M.; Vassileva, I.; Dahlquist, E.; Ellegård, K.; Wäckelgård, E. Constructing load profiles for household electricity and hot water from time-use data—Modelling approach and validation. Energy Build. 2009, 41, 753–768. [Google Scholar] [CrossRef]
- Freeman, R.B. Job satisfaction as an economic variable. Am. Econ. Rev. 1816, 68, 135–147. [Google Scholar]
- Stewart, J. Getting started with time-use data. J. Time Use Res. 2018, 14, 1–10. [Google Scholar] [CrossRef]
- Barnes, M.; Bryson, C.; Smith, R. Working Atypical Hours: What Happens to ‘Family Life’? Available online: https://www.researchgate.net/publication/274078158 (accessed on 27 September 2021).
- Druckman, A.; Buck, I.; Hayward, B.; Jackson, T. Time, gender and carbon: A study of the carbon implications of British adults' use of time. Ecol. Econ. 2012, 84, 153–163. [Google Scholar] [CrossRef] [Green Version]
- Southerton, D. Analysing the Temporal Organization of Daily Life: Social constraints, practices and their allocation. Sociology 2006, 40, 435–454. [Google Scholar] [CrossRef]
- Mori, I. Consumer Experiences of Time of Use Tariffs. Available online: https://www.ipsos.com/ipsos-mori/en-uk/DownloadPublication/1506_Ipsos-MORI-report-on-Consumer-Experiences-Of-Time-Of-Use-Tariffs.pdf (accessed on 27 September 2021).
- Hook, A.; Court, V.; Sovacool, B.K.; Sorrell, S. A systematic review of the energy and climate impacts of teleworking. Environ. Res. Lett. 2020, 15, 093003. [Google Scholar] [CrossRef] [Green Version]
- Lucas, J.; Galarraga, I. Green Energy Labelling. In Green Energy and Efficiency; Springer: Cham, Switzerland, 2014; pp. 133–164. [Google Scholar] [CrossRef]
- Brühl, J.; Smith, G.; Visser, M. Simple is good: Redesigning utility bills to reduce complexity and increase understanding. Util. Policy 2019, 60, 100934. [Google Scholar] [CrossRef]
- Boyano, A.; Espinosa, N.; Villanueva, A. Rescaling the energy label for washing machines: An opportunity to bring technology development and consumer behaviour closer together. Energy Effic. 2019, 13, 51–67. [Google Scholar] [CrossRef] [Green Version]
- McKenna, E.; Higginson, S.; Grunewald, P.; Darby, S.J. Simulating residential demand response: Improving socio-technical assumptions in activity-based models of energy demand. Energy Effic. 2017, 11, 1583–1597. [Google Scholar] [CrossRef] [Green Version]
- Anable, J.; Marsden, G. Covid-19 Transport, Travel and Social Adaptation Study: Understanding Behaviour Change with Neighbourhood Characteristics. Available online: https://www.creds.ac.uk/publications/covid-19-transas-understanding-behaviour-change-with-neighbourhood-characteristics/ (accessed on 27 September 2021).
- Mehlig, D.; ApSimon, H.; Staffell, I. The impact of the UK’s COVID-19 lockdowns on energy demand and emissions. Environ. Res. Lett. 2021, 16, 054037. [Google Scholar] [CrossRef]
- Minnen, J.; Glorieux, I.; van Tienoven, T.P. Who works when? Towards a typology of weekly work patterns in Belgium. Time Soc. 2016, 25, 652–675. [Google Scholar] [CrossRef]
- Lesnard, L.; Kan, M.Y. Investigating scheduling of work: A two-stage optimal matching analysis of workdays and workweeks. J. R. Stat. Soc. Ser. A Stat. Soc. 2010, 174, 349–368. [Google Scholar] [CrossRef] [Green Version]
- Lesnard, L. Off-Scheduling within Dual-Earner Couples: An Unequal and Negative Externality for FamilyTime. Am. J. Sociol. 2008, 114, 447–490. [Google Scholar] [CrossRef]
- Glorieux, I.; Mestdag, I.; Minnen, J. The Coming of the 24-hour Economy? Changing work schedules in Belgium between 1966 and 1999. Time Soc. 2008, 17, 63–83. [Google Scholar] [CrossRef] [Green Version]
- Glorieux, I.; Laurijssen, I.; Minnen, J.; Van Tienoven, T.P. In Search of the Harried Leisure Class in Contemporary Society: Time-Use Surveys and Patterns of Leisure Time Consumption. J. Consum. Policy 2010, 33, 163–181. [Google Scholar] [CrossRef]
- Chenu, A.; Robinson, J.P. Synchonicity in the Work Schedules of Working Couples. Available online: https://www.bls.gov/opub/mlr/2002/article/synchronicity-in-the-work-schedules-of-working-couples.htm (accessed on 27 September 2021).
- Lesnard, L. Schedules as sequences: A new method to analyze the use of time based on collective rhythm with an application to the work arrangements of French dual-eaner couples. Electron. Int. J. Time Use Res. 2004, 1, 60–84. [Google Scholar] [CrossRef]
- Lesnard, L.; Pol, T.D.S. Patterns of Workweek Schedules in France. Soc. Indic. Res. 2008, 93, 171–176. [Google Scholar] [CrossRef]
- Richardson, I.; Thomson, M.; Infield, D.; Clifford, C. Domestic electricity use: A high-resolution energy demand model. Energy Build. 2010, 42, 1878–1887. [Google Scholar] [CrossRef] [Green Version]
- Chiou, Y.-S.; Carley, K.M.; Davidson, C.I.; Johnson, M.P. A high spatial resolution residential energy model based on American Time Use Survey data and the bootstrap sampling method. Energy Build. 2011, 43, 3528–3538. [Google Scholar] [CrossRef]
- López-Rodríguez, M.; Santiago, I.; Trillo-Montero, D.; Torriti, J.; Moreno-Munoz, A. Analysis and modeling of active occupancy of the residential sector in Spain: An indicator of residential electricity consumption. Energy Policy 2013, 62, 742–751. [Google Scholar] [CrossRef]
- Wilke, U.; Haldi, F.; Scartezzini, J.-L.; Robinson, D. A bottom-up stochastic model to predict building occupants' time-dependent activities. Build. Environ. 2013, 60, 254–264. [Google Scholar] [CrossRef]
- Neu, O.; Oxizidis, S.; Flynn, D.; Pallonetto, F.; Finn, D. High resolution space-time data: Methodology for residential building simulation modelling. In Proceedings of the 13th International Building Performance Simulation Association (Building Simulation 2013), Chambéry, France, 25–28 August 2013. [Google Scholar]
- Aerts, D.; Minnen, J.; Glorieux, I.; Wouters, I.; Descamps, F. A method for the identification and modelling of realistic domestic occupancy sequences for building energy demand simulations and peer comparison. Build. Environ. 2014, 75, 67–78. [Google Scholar] [CrossRef]
- Fischer, D.; Härtl, A.; Wille-Haussmann, B. Model for electric load profiles with high time resolution for German households. Energy Build. 2015, 92, 170–179. [Google Scholar] [CrossRef]
- Torriti, J. A review of time use models of residential electricity demand. Renew. Sustain. Energy Rev. 2014, 37, 265–272. [Google Scholar] [CrossRef]
- Palm, J.; Ellegård, K.; Hellgren, M. A cluster analysis of energy-consuming activities in everyday life. Build. Res. Inf. 2017, 46, 99–113. [Google Scholar] [CrossRef]
- Liu, X.; Yang, Y.; Li, R.; Nielsen, P.S. A Stochastic Model for Residential User Activity Simulation. Energies 2019, 12, 3326. [Google Scholar] [CrossRef] [Green Version]
- Yamaguchi, Y.; Shimoda, Y. A stochastic model to predict occupants’ activities at home for community-/urban-scale energy demand modelling. J. Build. Perform. Simul. 2016, 10, 565–581. [Google Scholar] [CrossRef]
- Escobar, P.; Martínez, E.; Saenz-Díez, J.; Jiménez, E.; Blanco, J. Modeling and analysis of the electricity consumption profile of the residential sector in Spain. Energy Build. 2019, 207, 109629. [Google Scholar] [CrossRef]
- Buttitta, G.; Finn, D.P. A high-temporal resolution residential building occupancy model to generate high-temporal resolution heating load profiles of occupancy-integrated archetypes. Energy Build. 2019, 206, 109577. [Google Scholar] [CrossRef]
- Torriti, J.; Yunusov, T. It’s only a matter of time: Flexibility, activities and time of use tariffs in the United Kingdom. Energy Res. Soc. Sci. 2020, 69, 101697. [Google Scholar] [CrossRef]


| Information framing | Information framing is extremely effective at utilising behavioural principles and heuristics that people already employ when making decisions. When presented with the option of paying more for a lower-efficiency model or paying less for a higher-efficiency alternative, loss aversion causes consumers to consider purchasing an energy-efficient appliance. To improve framing information, use useful time frames and metrics that are easy to understand. |
| Innovative product design and physical environments | Innovative product design and physical environments can influence customer’s habits, as consumers frequently take habits for granted rather than thinking through energy-relevant decisions. Consider for example, attractive, informative smart energy meters located in obvious places and connected to smartphone or web applications, which would enable consumers to better understand their energy bills. |
| Changes to the default policy | Promotion of a sustainable transportation policy to replace long-distance commuting. This could include concerted efforts to replace biking with driving or to bridge the gap between workplace and home by promoting home or flexible working. |
| Time-Use Activity | Employed Electricity Appliance | Average Electrical Load (kW) | Proportion of Dwellings with Appliance (%), Source: UKTUS 2014/2015 | |||
|---|---|---|---|---|---|---|
| Regular | Irregular | |||||
| Full-Time | Part-Time | Full-Time | Part-Time | |||
| Preparing food | Microwave | 1.25 | 95.25% | 93.58% | 92.15% | 94.00% |
| Washing clothes | Tumble dryer | 2.50 | 64.39% | 63.77% | 64.24% | 62.50% |
| Washing machine | 0.41 | 99.11% | 98.30% | 98.94% | 99.25% | |
| Watching TV | TV | 0.08 | 98.07% | 97.17% | 96.95% | 97.88% |
| TV receiver box | 0.03 | 74.93% | 75.28% | 68.00% | 69.00% | |
| Washing the dishes | Dish washer | 1.13 | 56.23% | 54.91% | 60.02% | 56.50% |
| Irregular Work Patterns | Regular Work Patterns | |||
|---|---|---|---|---|
| Full-Time (n = 853) | Part-Time (n = 800) | Full-Time (n = 674) | Part-Time (n = 530) | |
| Sample Day Work Hours | ||||
| Mean | 8.23 | 6.10 | 5.79 | 6.16 |
| SD | 3.07 | 4.25 | 3.86 | 3.77 |
| Median | 8.50 | 7.00 | 7.50 | 7.66 |
| Min–Max | 0.00–23.25 | 0.00–19.5 | 0.00–24.00 | 0.00–24.00 |
| Age | ||||
| Mean | 43.03 | 41.81 | 42.64 | 41.69 |
| SD | 12.16 | 13.16 | 13.00 | 12.49 |
| Median | 44.00 | 43.00 | 44.00 | 42.00 |
| Min–Max | 16.00–75.00 | 16.00–81.00 | 16.00–73.00 | 16.00–74.00 |
| Gender | ||||
| Mean | 1.47 | 1.507 | 1.48 | 1.46 |
| SD | 0.49 | 0.50 | 0.40 | 0.49 |
| Median | 1.00 | 2.00 | 1.00 | 1.00 |
| Min–Max | 1.00–2.00 | 1.00–2.00 | 1.00–2.00 | 1.00–2.00 |
| Household size | ||||
| Mean | 2.95 | 2.93 | 3.03 | 2.96 |
| SD | 1.28 | 1.18 | 1.30 | 1.32 |
| Median | 3.00 | 3.00 | 3.00 | 3.00 |
| Min–Max | 1.00–8.00 | 1.00–7.00 | 1.00–8.00 | 1.00–8.00 |
| Number of children | ||||
| Mean | 0.66 | 0.607 | 0.61 | 0.65 |
| SD | 0.93 | 0.89 | 0.88 | 1.04 |
| Median | 0 | 0 | 0 | 0 |
| Min–Max | 0.00–4.00 | 0.00–4.00 | 0.00–5.00 | 0.00–5.00 |
| Regular Work Patterns | Dish Wash | Food Preparation | House Clean | Ironing | Laundry | TV | |
|---|---|---|---|---|---|---|---|
| WT | Estimates | −0.17 | −2.26 | −5.89 * | −0.77 | −5.19 ** | −11.57 ** |
| Standard error | 0.98 | 1.72 | 2.40 | 2.22 | 1.63 | 4.26 | |
| WT2 | Estimates | −0.02 | −0.02 | 0.26 | −0.01 | 0.37 * | 0.46 |
| Standard error | 0.09 | 0.16 | 0.24 | 0.22 | 0.17 | 0.40 | |
| Betweenness | Estimates | 24.66. | −6.34 | −14.03 | −1.54 | −59.57 ** | −12.58 |
| Standard error | 14.13 | 14.69 | 27.34 | 36.38 | 18.44 | 35.78 | |
| Full−time | Estimates | −2.07 | −3.00 | −9.05 ** | −1.95 | 5.39 ** | −12.16 |
| Standard error | 1.81 | 4.05 | 3.37 | 1.83 | 1.76 | 11.76 | |
| Age | Estimates | 0.17 *** | 0.37 *** | 0.18 * | 0.11 ** | 0.07. | 0.98 *** |
| Standard error | 0.04 | 0.09 | 0.07 | 0.04 | 0.04 | 0.22 | |
| Gender | Estimates | 5.84 *** | 18.24 *** | 7.42 *** | 4.56 *** | 8.49 *** | −20.62 *** |
| Standard error | 0.98 | 2.18 | 1.80 | 0.99 | 0.97 | 5.47 | |
| HH size | Estimates | 0.77 | −1.81 | −0.60 | 0.72 | 0.83. | −1.45 |
| Standard error | 0.50 | 1.12 | 0.93 | 0.51 | 0.48 | 2.80 | |
| Numchild | Estimates | 1.23 . | 6.53 *** | 2.52 * | 0.34 | 0.74 | −5.20 |
| Standard error | 0.68 | 1.52 | 1.25 | 0.69 | 0.67 | 3.76 | |
| WT * Full−time | Estimates | 0.32 | −0.19 | 1.13 * | 0.28 | −0.59 * | 2.80 * |
| Standard error | 0.25 | 0.57 | 0.47 | 0.26 | 0.25 | 1.42 | |
| WT * Betweenness | Estimates | −4.20 | 3.02 | 9.49 | −2.46 | 26.01 ** | 14.33 |
| Standard error | 5.70 | 4.66 | 12.49 | 15.53 | 9.61 | 16.09 | |
| WT2 * Betweenness | Estimates | 0.09 | −0.16 | −0.87 | 0.26 | −2.06 * | −1.40 |
| Standard error | 0.54 | 0.41 | 1.27 | 1.58 | 0.99 | 1.59 | |
| Intercept | −7.40 . | 8.51 | 17.86 * | −4.39 | −0.39 | 147.55 *** | |
| N | 1206 | 1206 | 1206 | 1206 | 1206 | 1206 | |
| R2 | 0.092 | 0.138 | 0.130 | 0.056 | 0.117 | 0.092 | |
| R2 adjusted | 0.083 | 0.130 | 0.122 | 0.047 | 0.109 | 0.084 | |
| Irregular Work Patterns | Dish Wash | Food Preparation | House Clean | Ironing | Laundry | TV | |
|---|---|---|---|---|---|---|---|
| WT | Estimates | −0.13 | −0.70 | −0.26 | −6.50 *** | 0.84 | −0.8 |
| Standard error | 0.72 | 1.60 | 1.64 | 1.57 | 1.05 | 4.27 | |
| WT2 | Estimates | 0.01 | −0.04 | 0.01 | 0.45 *** | −0.06 | −0.14 |
| Standard error | 0.05 | 0.11 | 0.13 | 0.12 | 0.08 | 0.29 | |
| Betweenness | Estimates | −8.62 | −35.58 * | 20.34 | −20.02 | 46.33 ** | 77.15 . |
| Standard error | 12.65 | 14.46 | 22.01 | 33.31 | 17.86 | 43.48 | |
| Full−time | Estimates | 6.36 ** | 13.98 ** | 14.32 *** | 2.94 . | 2.56 | 30.03 * |
| Standard error | 2.12 | 5.02 | 3.48 | 1.57 | 2.23 | 14.28 | |
| Age | Estimates | 0.18 *** | 0.51 *** | 0.16 ** | 0.09 *** | 0.11 ** | 0.43 * |
| Standard error | 0.03 | 0.08 | 0.05 | 0.02 | 0.03 | 0.21 | |
| Gender | Estimates | 3.41 *** | 17.64 *** | 8.33 *** | 2.54 *** | 3.99 *** | −26.15 *** |
| Standard error | 0.84 | 1.93 | 1.40 | 0.59 | 0.88 | 5.33 | |
| Household size | Estimates | −0.54 | −1.66 . | −0.02 | 0.31 | 1.29 ** | −9.34 *** |
| Standard error | 0.45 | 1.00 | 0.77 | 0.31 | 0.49 | 2.70 | |
| Number of children | Estimates | 2.33 *** | 6.12 *** | 2.81 ** | −0.12 | 0.03 | −0.44 |
| Standard error | 0.61 | <0.001 | 1.03 | 0.42 | 0.66 | 3.77 | |
| WT * Full−time | Estimates | −0.01 * | −0.03 ** | −0.02 ** | −0.01 * | −0.00 | −0.05 . |
| Standard error | 0.00 | 0.004 | 0.01 | 0.00 | 0.00 | 0.03 | |
| WT * Betweenness | Estimates | 0.02 | 0.11 | −0.01 | 0.74 *** | −0.15 . | −0.27 |
| Standard error | 0.06 | 0.08 | 0.13 | 0.18 | 0.09 | 0.22 | |
| WT2 * Betweenness | Estimates | −0.08 | −0.27 | −0.07 | −3.03 *** | 0.47 | 0.60 |
| Standard error | 0.28 | 0.35 | 0.62 | 0.85 | 0.40 | 0.98 | |
| Intercept | −2.70 | −5.30 | −13.31 . | −3.49 | −14.21 ** | 182.69 *** | |
| N | 1653 | 1653 | 1653 | 1653 | 1653 | 1653 | |
| R2 | 0.056 | 0.114 | 0.082 | 0.089 | 0.051 | 0.086 | |
| R2 adjusted | 0.050 | 0.108 | 0.076 | 0.082 | 0.045 | 0.080 | |
| Regular Work Time | Dish Wash | Television | Tumble Dryer | Washing Machine | |
|---|---|---|---|---|---|
| WT | Estimates | −0.00 | −0.02 ** | −0.22 ** | −0.04 ** |
| Standard error | 0.02 | 0.00 | 0.07 | 0.01 | |
| WT2 | Estimates | −0.00 | 0.00 | 0.02 * | −0.00 *** |
| Standard error | 0.00 | 0.00 | 0.01 | 0.00 | |
| Betweenness | Estimates | 0.46. | −0.02 | −2.48 ** | −0.41 |
| Standard error | 0.27 | 0.05 | 0.77 | 0.13 | |
| Full−time | Estimates | 0.02 | −0.02 | 0.22 ** | 0.04 ** |
| Standard error | 0.04 | 0.01 | 0.07 | 0.01 | |
| Age | Estimates | 0.00 *** | 0.00 *** | 0.00. | 0.00. |
| Standard error | 0.00 | 0.00 | 0.00 | 0.00 | |
| Gender | Estimates | 0.11 *** | −0.03 *** | 0.35 *** | 0.06 *** |
| Standard error | 0.02 | 0.01 | 0.03 | 0.01 | |
| Household size | Estimates | 0.01. | −0.00 | 0.02. | 0.01 * |
| Standard error | 0.01 | 0.00 | 0.03 | 0.00 | |
| Number of children | Estimates | 0.02. | −0.01 | 0.03. | 0.01 |
| Standard error | 0.01 | 0.00 | 0.03 | 0.00 | |
| WT *Full−time | Estimates | 0.01 | 0.00 * | −0.02 * | −0.00 |
| Standard error | 0.00 | 0.00 | 0.01 | 0.00 | |
| WT * Betweenness | Estimates | −0.08 | 0.02 | 1.08 ** | 0.18 *** |
| Standard error | 0.11 | 0.02 | 0.40 | 0.07 | |
| WT2 * Betweenness | Estimates | 0.00 | −0.00 | −0.09 * | −0.01 *** |
| Standard error | 0.01 | 0.00 | 0.04 | 0.01 | |
| Intercept | −0.14. | 0.20 *** | −0.02 | 0.00 | |
| N | 1206 | 1206 | 1206 | 1206 | |
| R2 | 0.092 | 0.092 | 0.114 | 0.117 | |
| R2 adjusted | 0.083 | 0.084 | 0.106 | 0.109 | |
| Irregular Work Time | Dish Wash | Television | Tumble Dryer | Washing Machine | |
|---|---|---|---|---|---|
| WT | Estimates | −0.02 | −0.01 | 0.12 ** | 0.02 ** |
| Standard error | 0.01 | 0.01 | 0.04 | 0.01 | |
| WT2 | Estimates | 0.00 | 0.00 | −0.01. | −0.00. |
| Standard error | 0.00 | 0.00 | 0.00 | 0.00 | |
| Betweenness | Estimates | −0.64 ** | 0.03 | 3.73 *** | 0.61 *** |
| Standard error | 0.24 | 0.05 | 0.76 | 0.12 | |
| Full−time | Estimates | 0.02 | 0.01 | −0.01 | −0.00 |
| Standard error | 0.04 | 0.02 | 0.09 | 0.01 | |
| Age | Estimates | 0.00 *** | 0.03 . | 0.00 *** | 0.00 *** |
| Standard error | 0.00 | 0.05 | 0.00 | 0.00 | |
| Gender | Estimates | 0.08 *** | −0.03 *** | 0.19 *** | 0.03 *** |
| Standard error | 0.02 | 0.01 | 0.04 | 0.01 | |
| Household size | Estimates | −0.01 | −0.01 *** | −0.05 ** | 0.01 ** |
| Standard error | 0.01 | 0.00 | 0.02 | 0.00 | |
| Number of children | Estimates | 0.04 *** | −0.00 | −0.00 | −0.00 |
| Standard error | 0.01 | 0.01 | 0.03 | 0.00 | |
| WT * Full−time | Estimates | 0.00 | 0.00 | −0.00 | 0.00 |
| Standard error | 0.00 | 0.00 | 0.01 | 0.00 | |
| WT * Betweenness | Estimates | 0.11 | 0.00. | 0.01 | −0.13 |
| Standard error | 0.08 | 0.02 | −0.80 | 0.04 | |
| WT2 * Betweenness | Estimates | −0.00 | −0.00 | 0.24 ** | 0.01 ** |
| Standard error | 0.01 | 0.00 | 0.04 | 0.00 | |
| Intercept | 0.04 | 0.26 *** | 0.02. | −0.16. | |
| N | 1653 | 1653 | 1653 | 1653 | |
| R2 | 0.059 | 0.047 | 0.052 | 0.054 | |
| R2 adjusted | 0.053 | 0.041 | 0.045 | 0.047 | |
Publisher’s Note: MDPI stays neutral with regard to jurisdictional claims in published maps and institutional affiliations. |
© 2021 by the authors. Licensee MDPI, Basel, Switzerland. This article is an open access article distributed under the terms and conditions of the Creative Commons Attribution (CC BY) license (https://creativecommons.org/licenses/by/4.0/).
Share and Cite
Lőrincz, M.J.; Ramírez-Mendiola, J.L.; Torriti, J. Impact of Time-Use Behaviour on Residential Energy Consumption in the United Kingdom. Energies 2021, 14, 6286. https://doi.org/10.3390/en14196286
Lőrincz MJ, Ramírez-Mendiola JL, Torriti J. Impact of Time-Use Behaviour on Residential Energy Consumption in the United Kingdom. Energies. 2021; 14(19):6286. https://doi.org/10.3390/en14196286
Chicago/Turabian StyleLőrincz, Máté János, José Luis Ramírez-Mendiola, and Jacopo Torriti. 2021. "Impact of Time-Use Behaviour on Residential Energy Consumption in the United Kingdom" Energies 14, no. 19: 6286. https://doi.org/10.3390/en14196286
APA StyleLőrincz, M. J., Ramírez-Mendiola, J. L., & Torriti, J. (2021). Impact of Time-Use Behaviour on Residential Energy Consumption in the United Kingdom. Energies, 14(19), 6286. https://doi.org/10.3390/en14196286