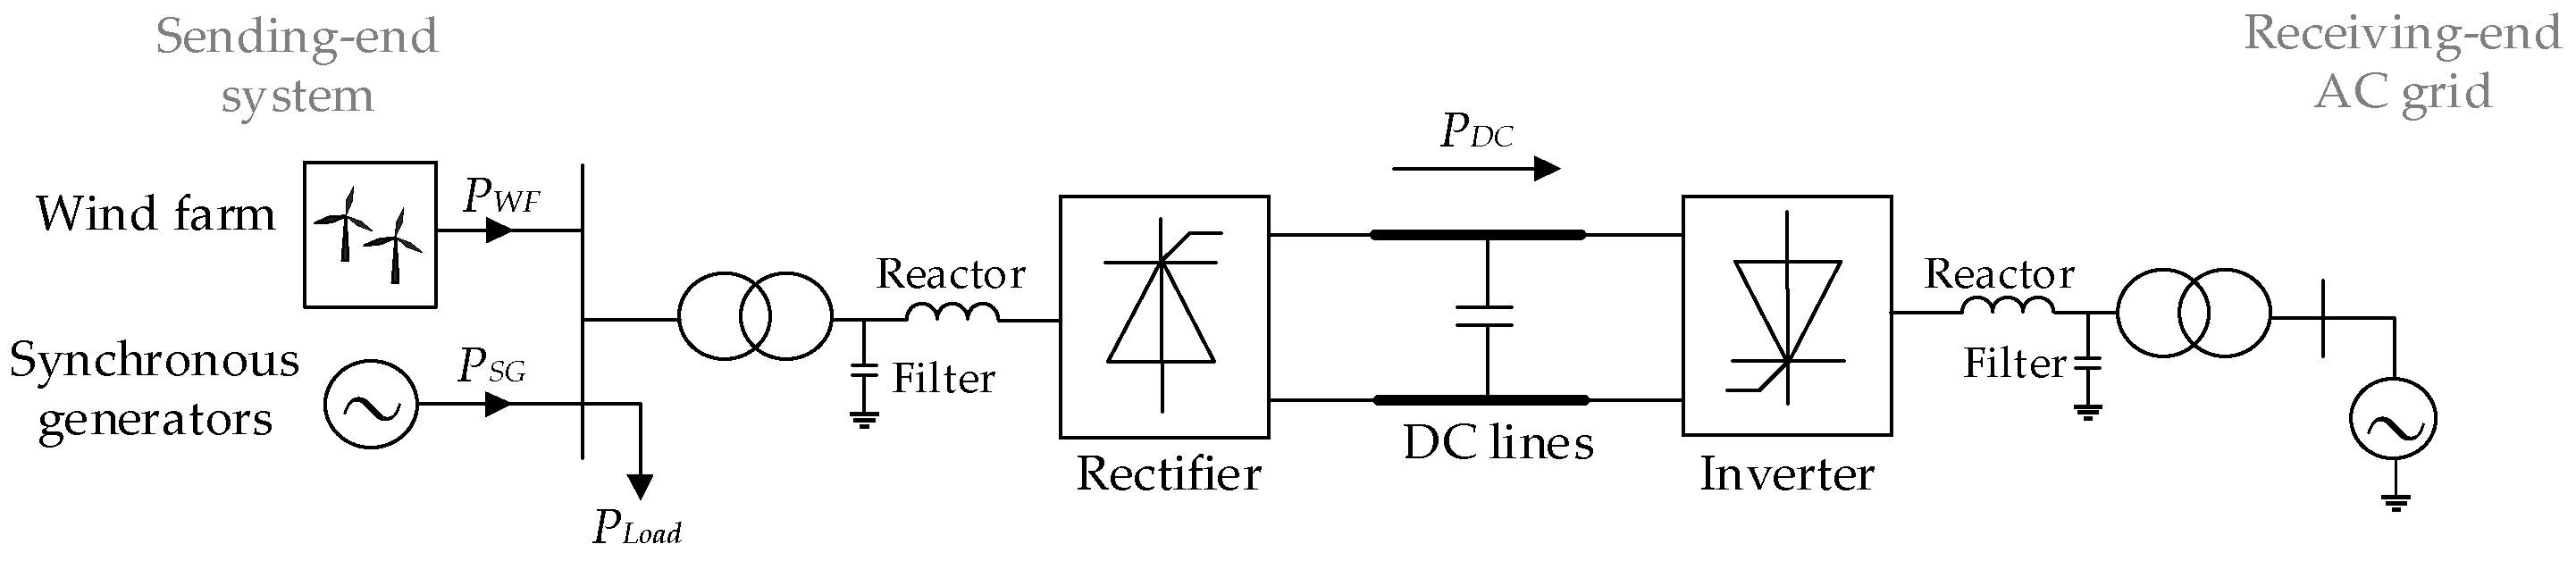
Figure 1.
Configuration of HVDC asynchronous interconnected grid with WF.
Figure 1.
Configuration of HVDC asynchronous interconnected grid with WF.
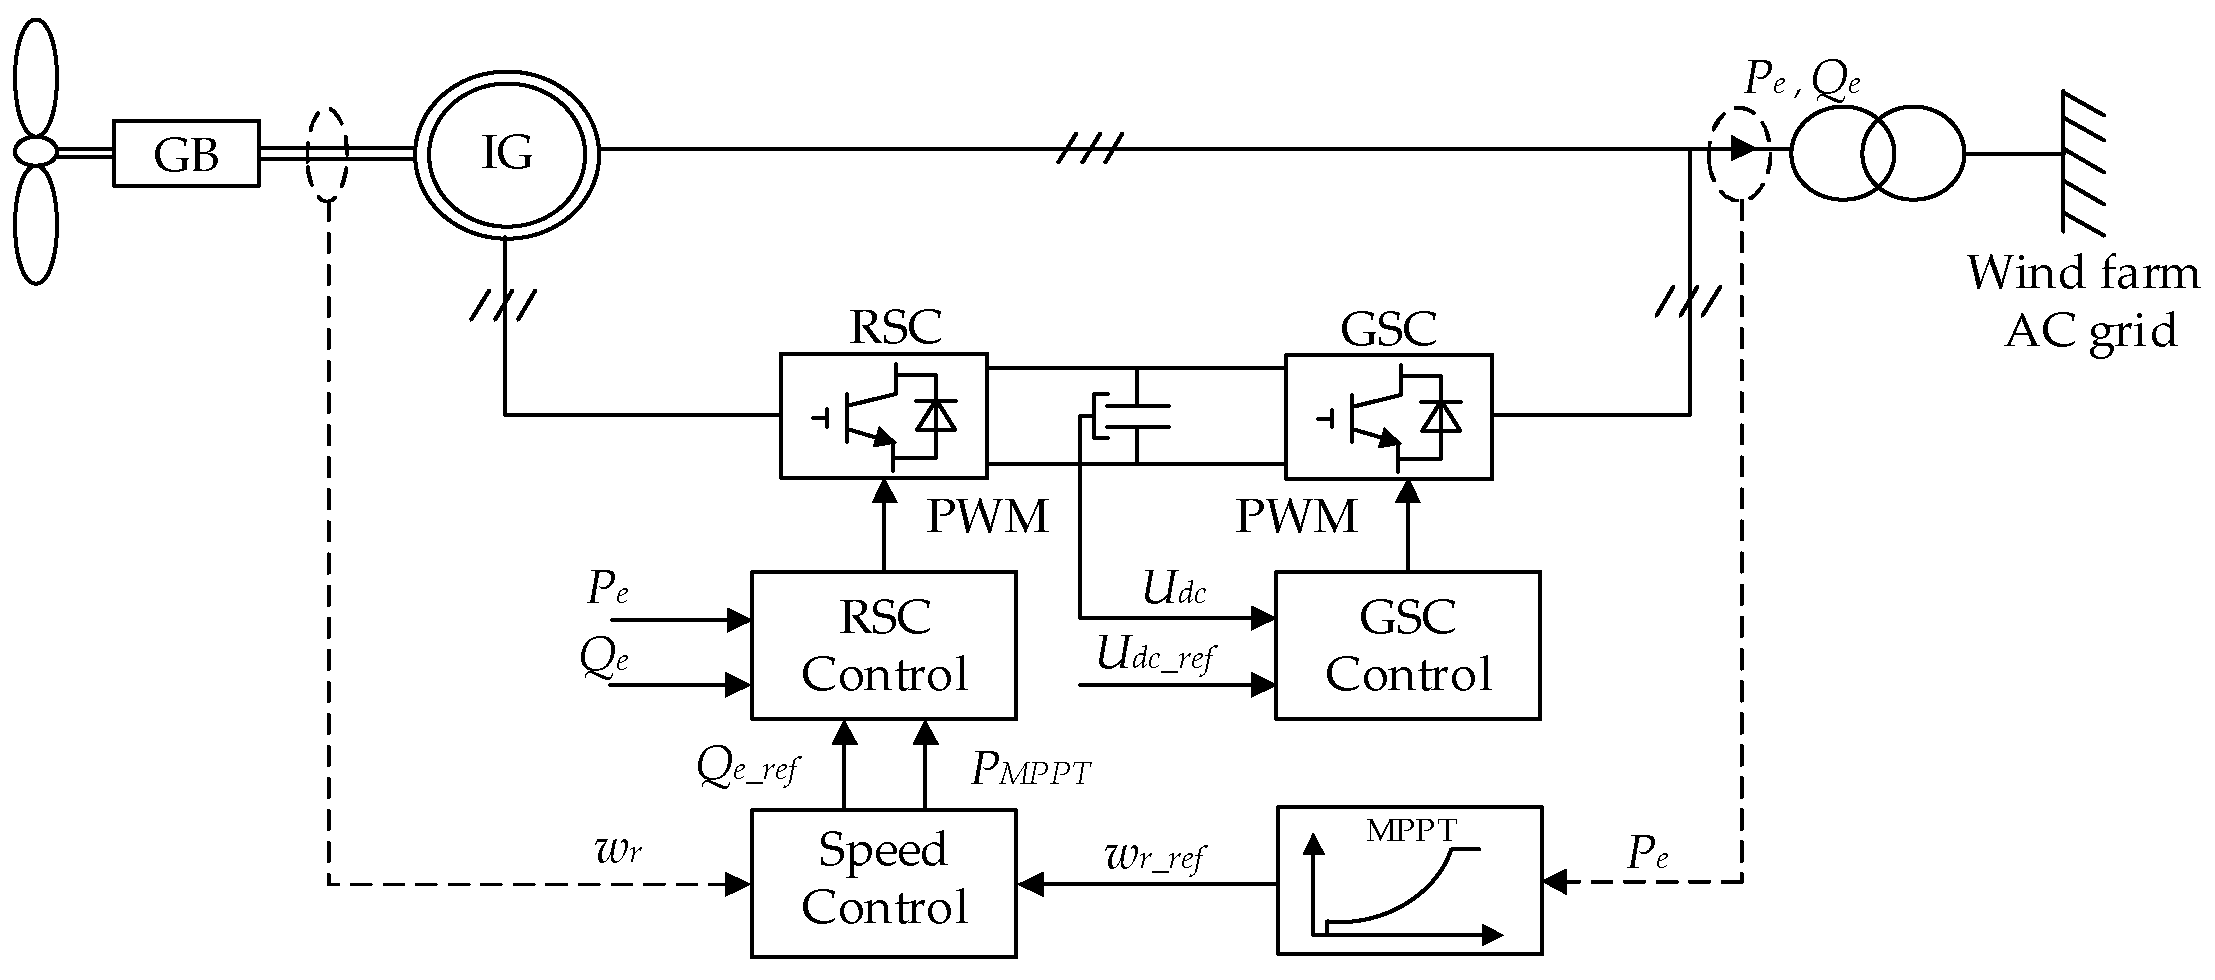
Figure 2.
The structure diagram of the grid-connected DFIG.
Figure 2.
The structure diagram of the grid-connected DFIG.
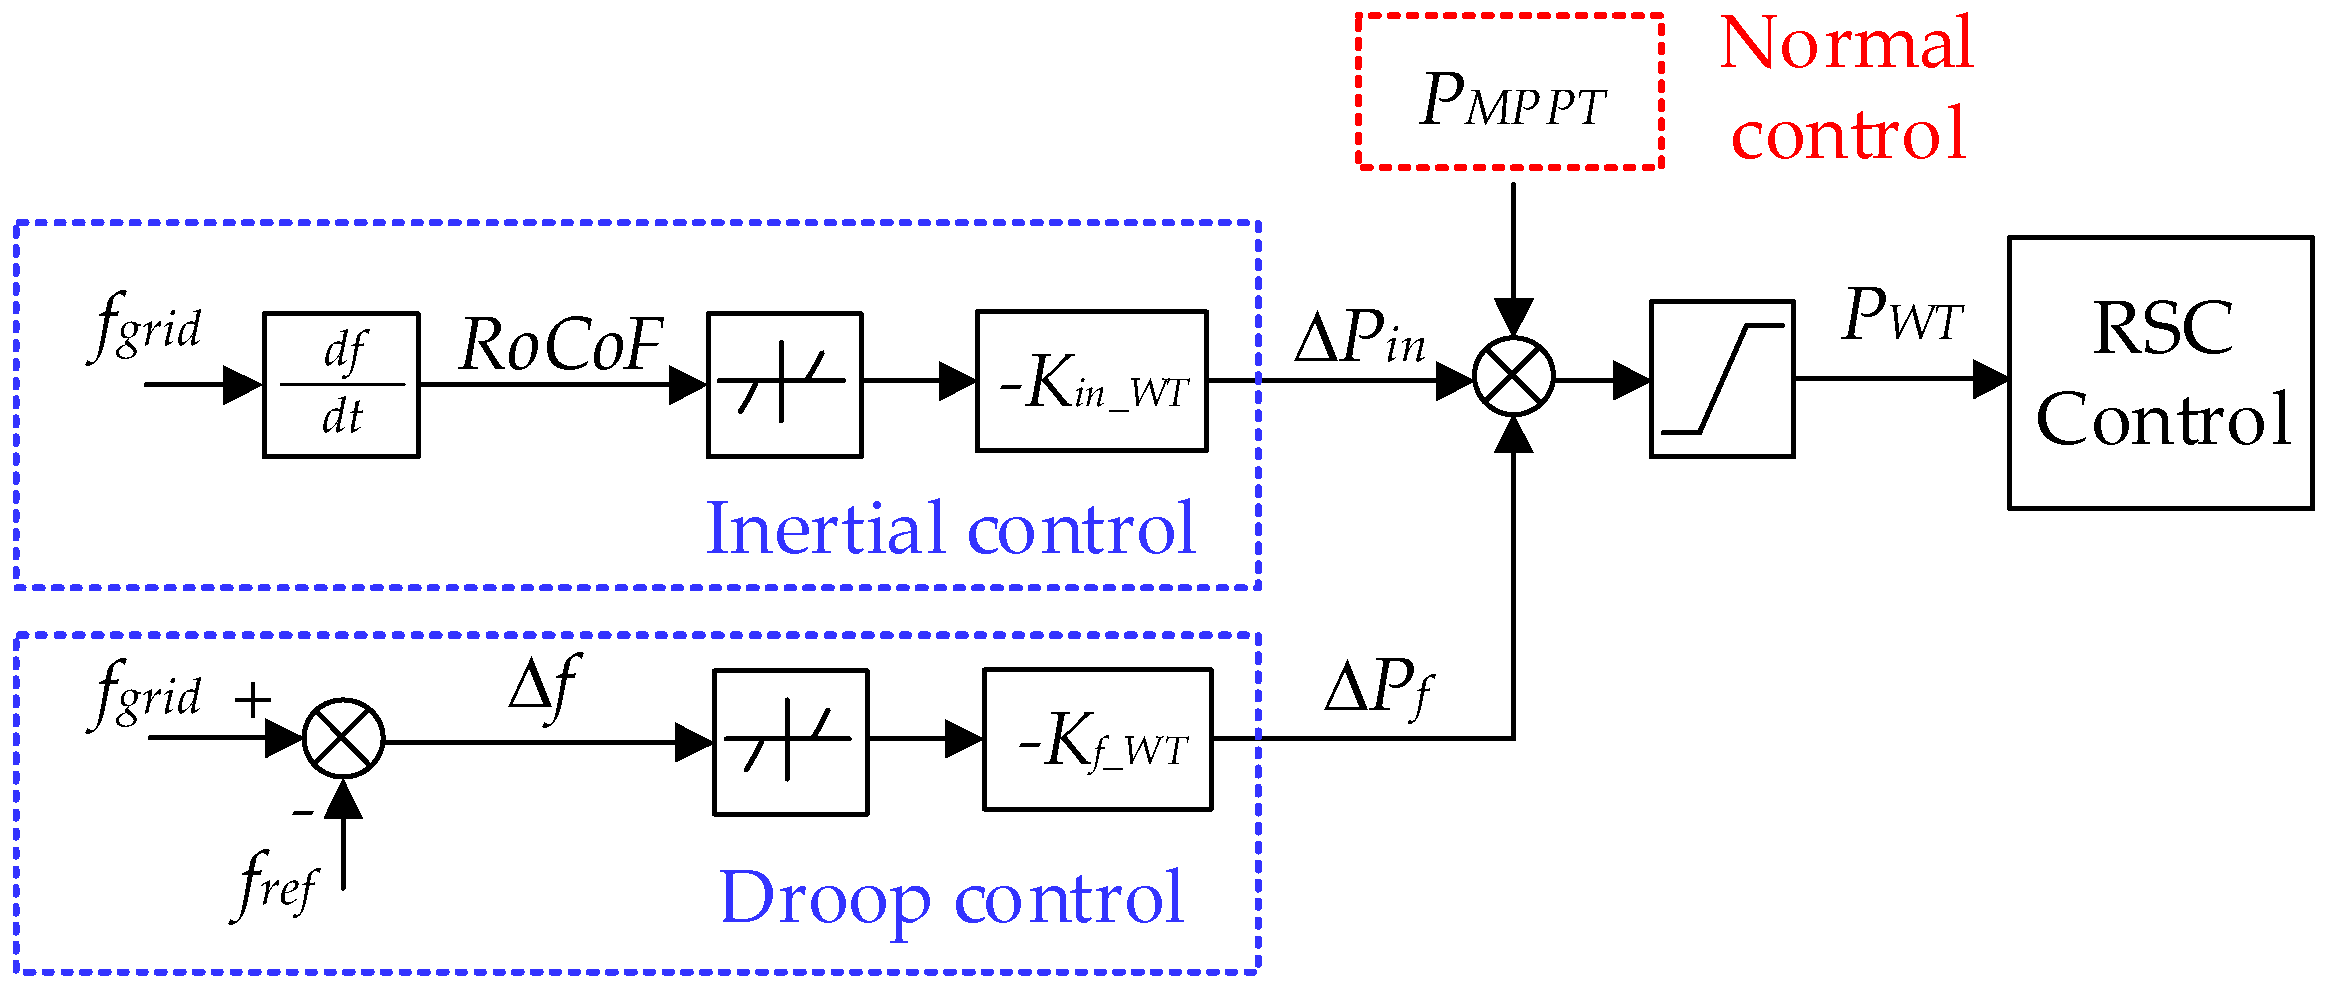
Figure 3.
Frequency droop and inertia control for DFIG.
Figure 3.
Frequency droop and inertia control for DFIG.
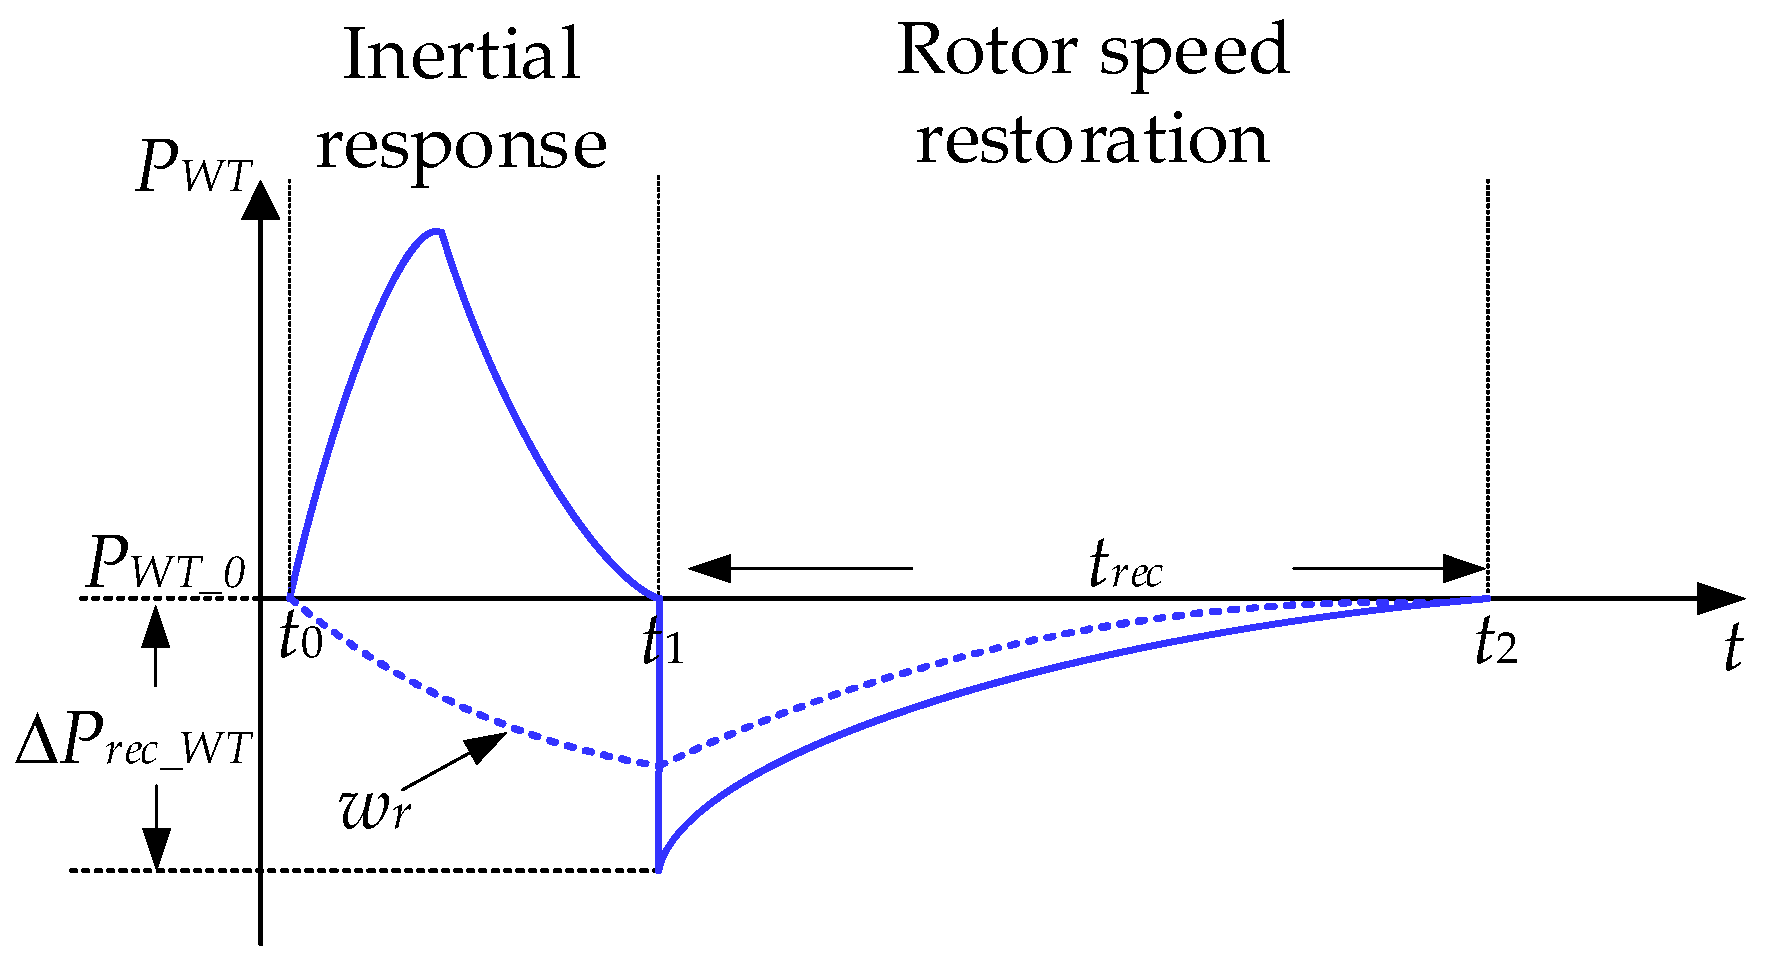
Figure 4.
Active power and rotor speed change of DFIG during the frequency response stage.
Figure 4.
Active power and rotor speed change of DFIG during the frequency response stage.
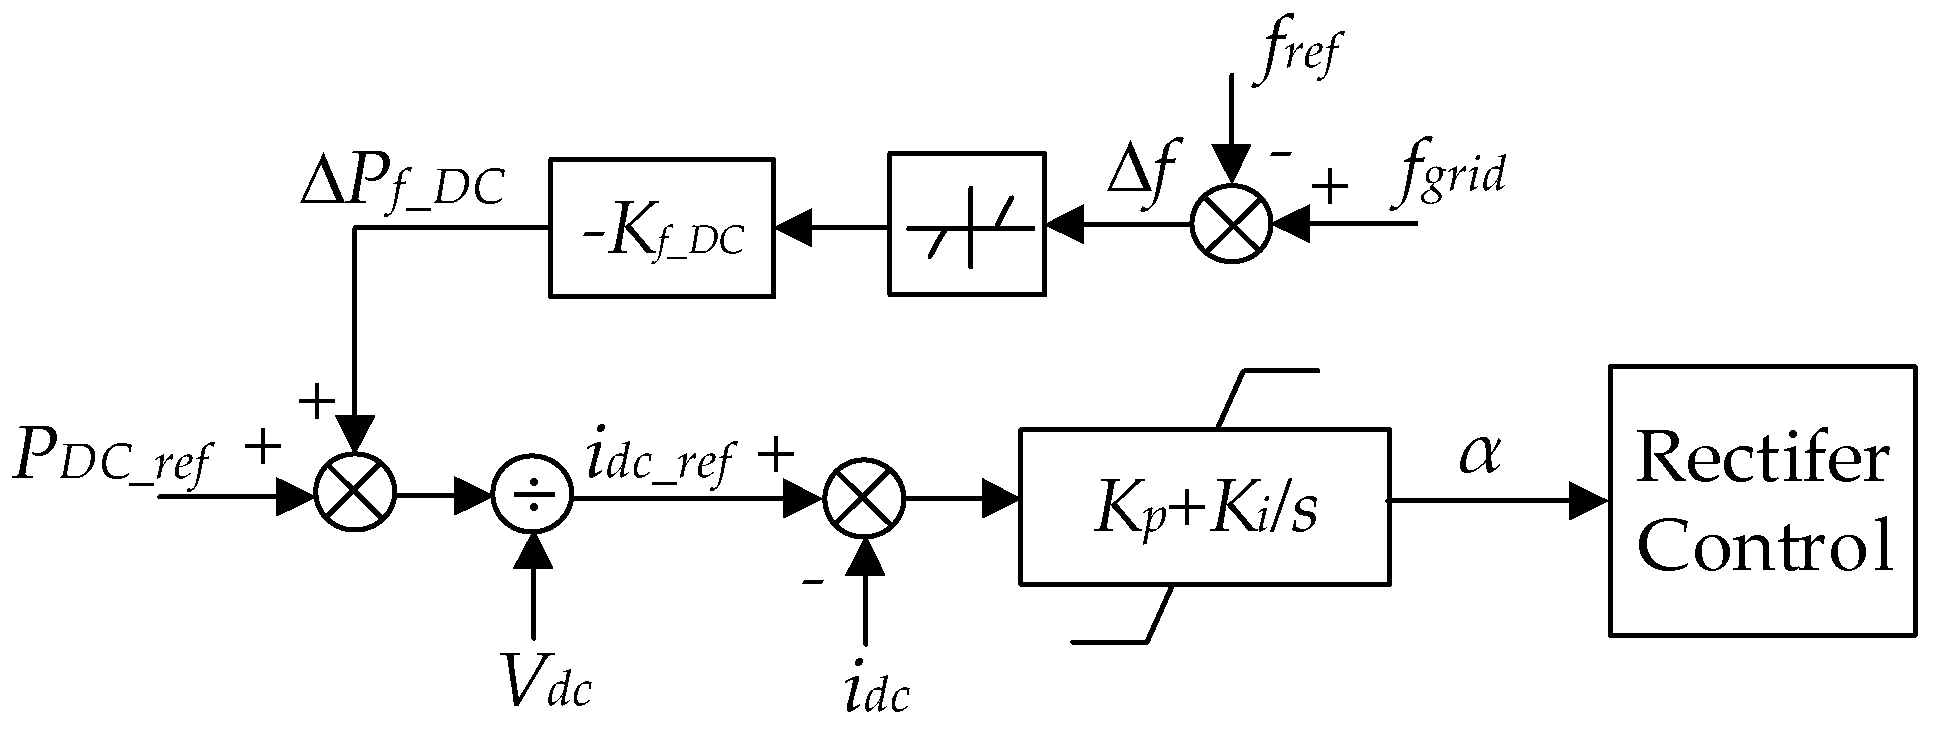
Figure 5.
Frequency–power droop control for the HVDC rectifier convertor.
Figure 5.
Frequency–power droop control for the HVDC rectifier convertor.
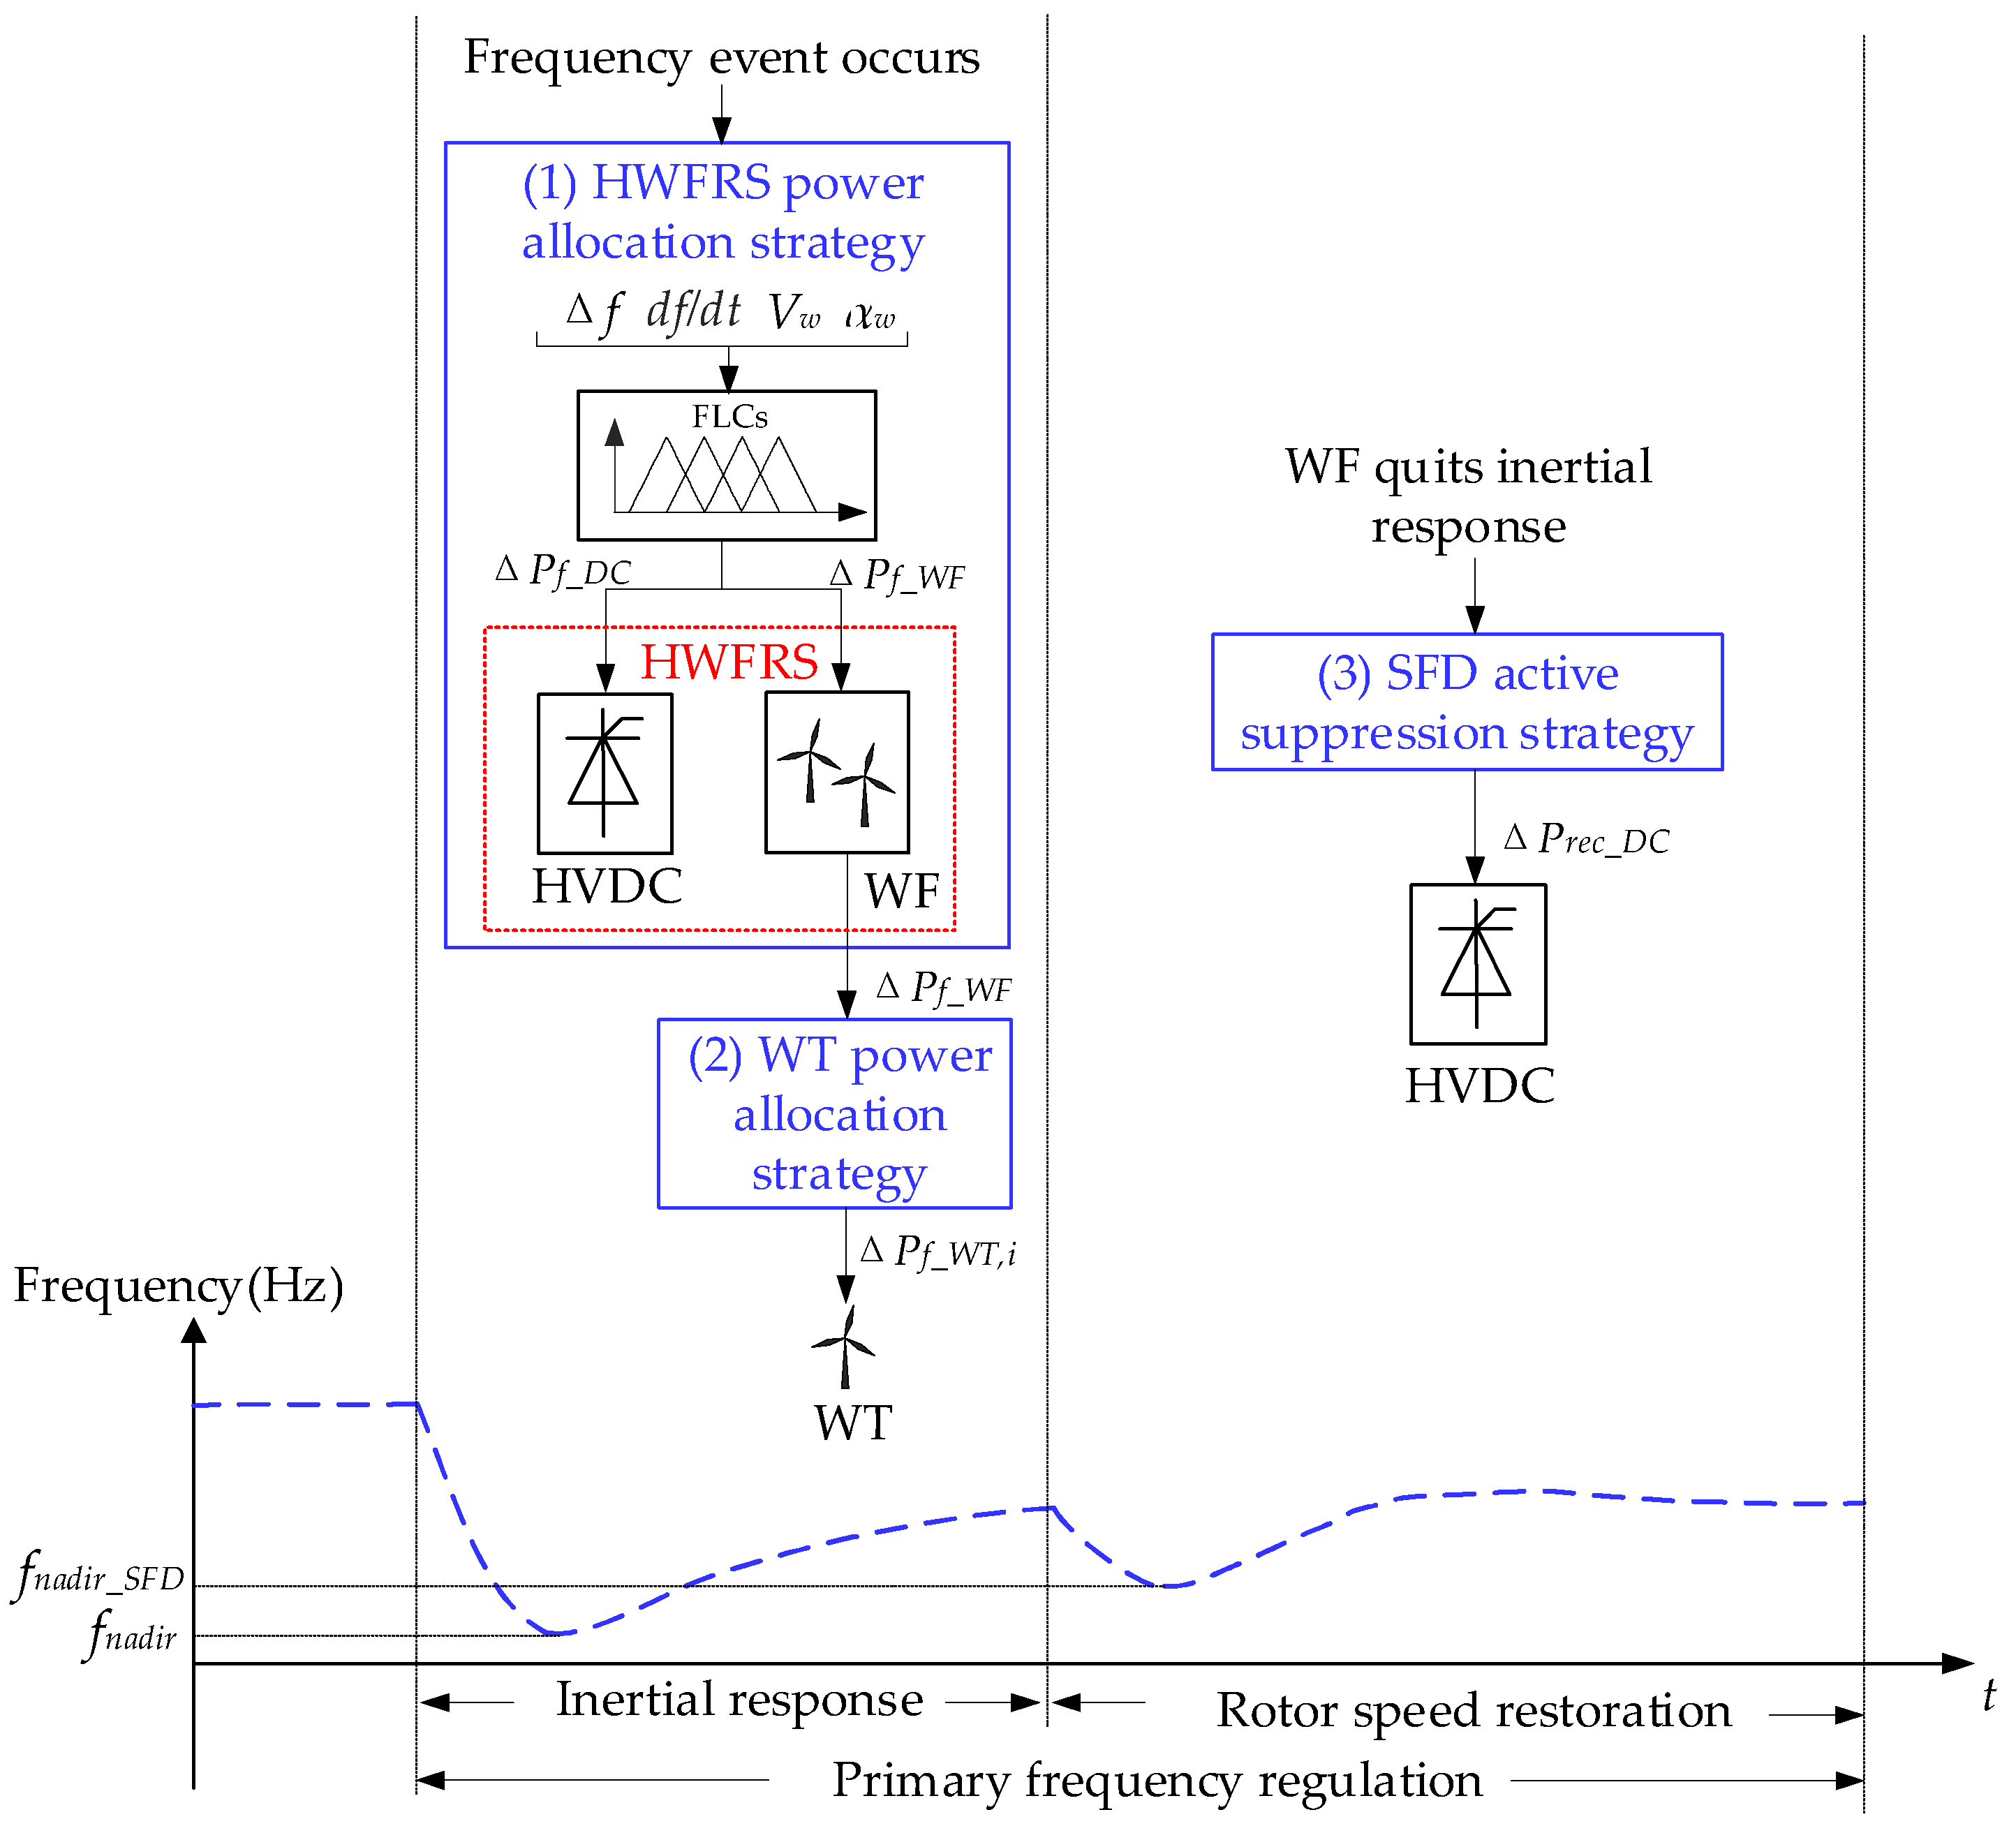
Figure 6.
HVDC-WF frequency coordinated control strategy.
Figure 6.
HVDC-WF frequency coordinated control strategy.
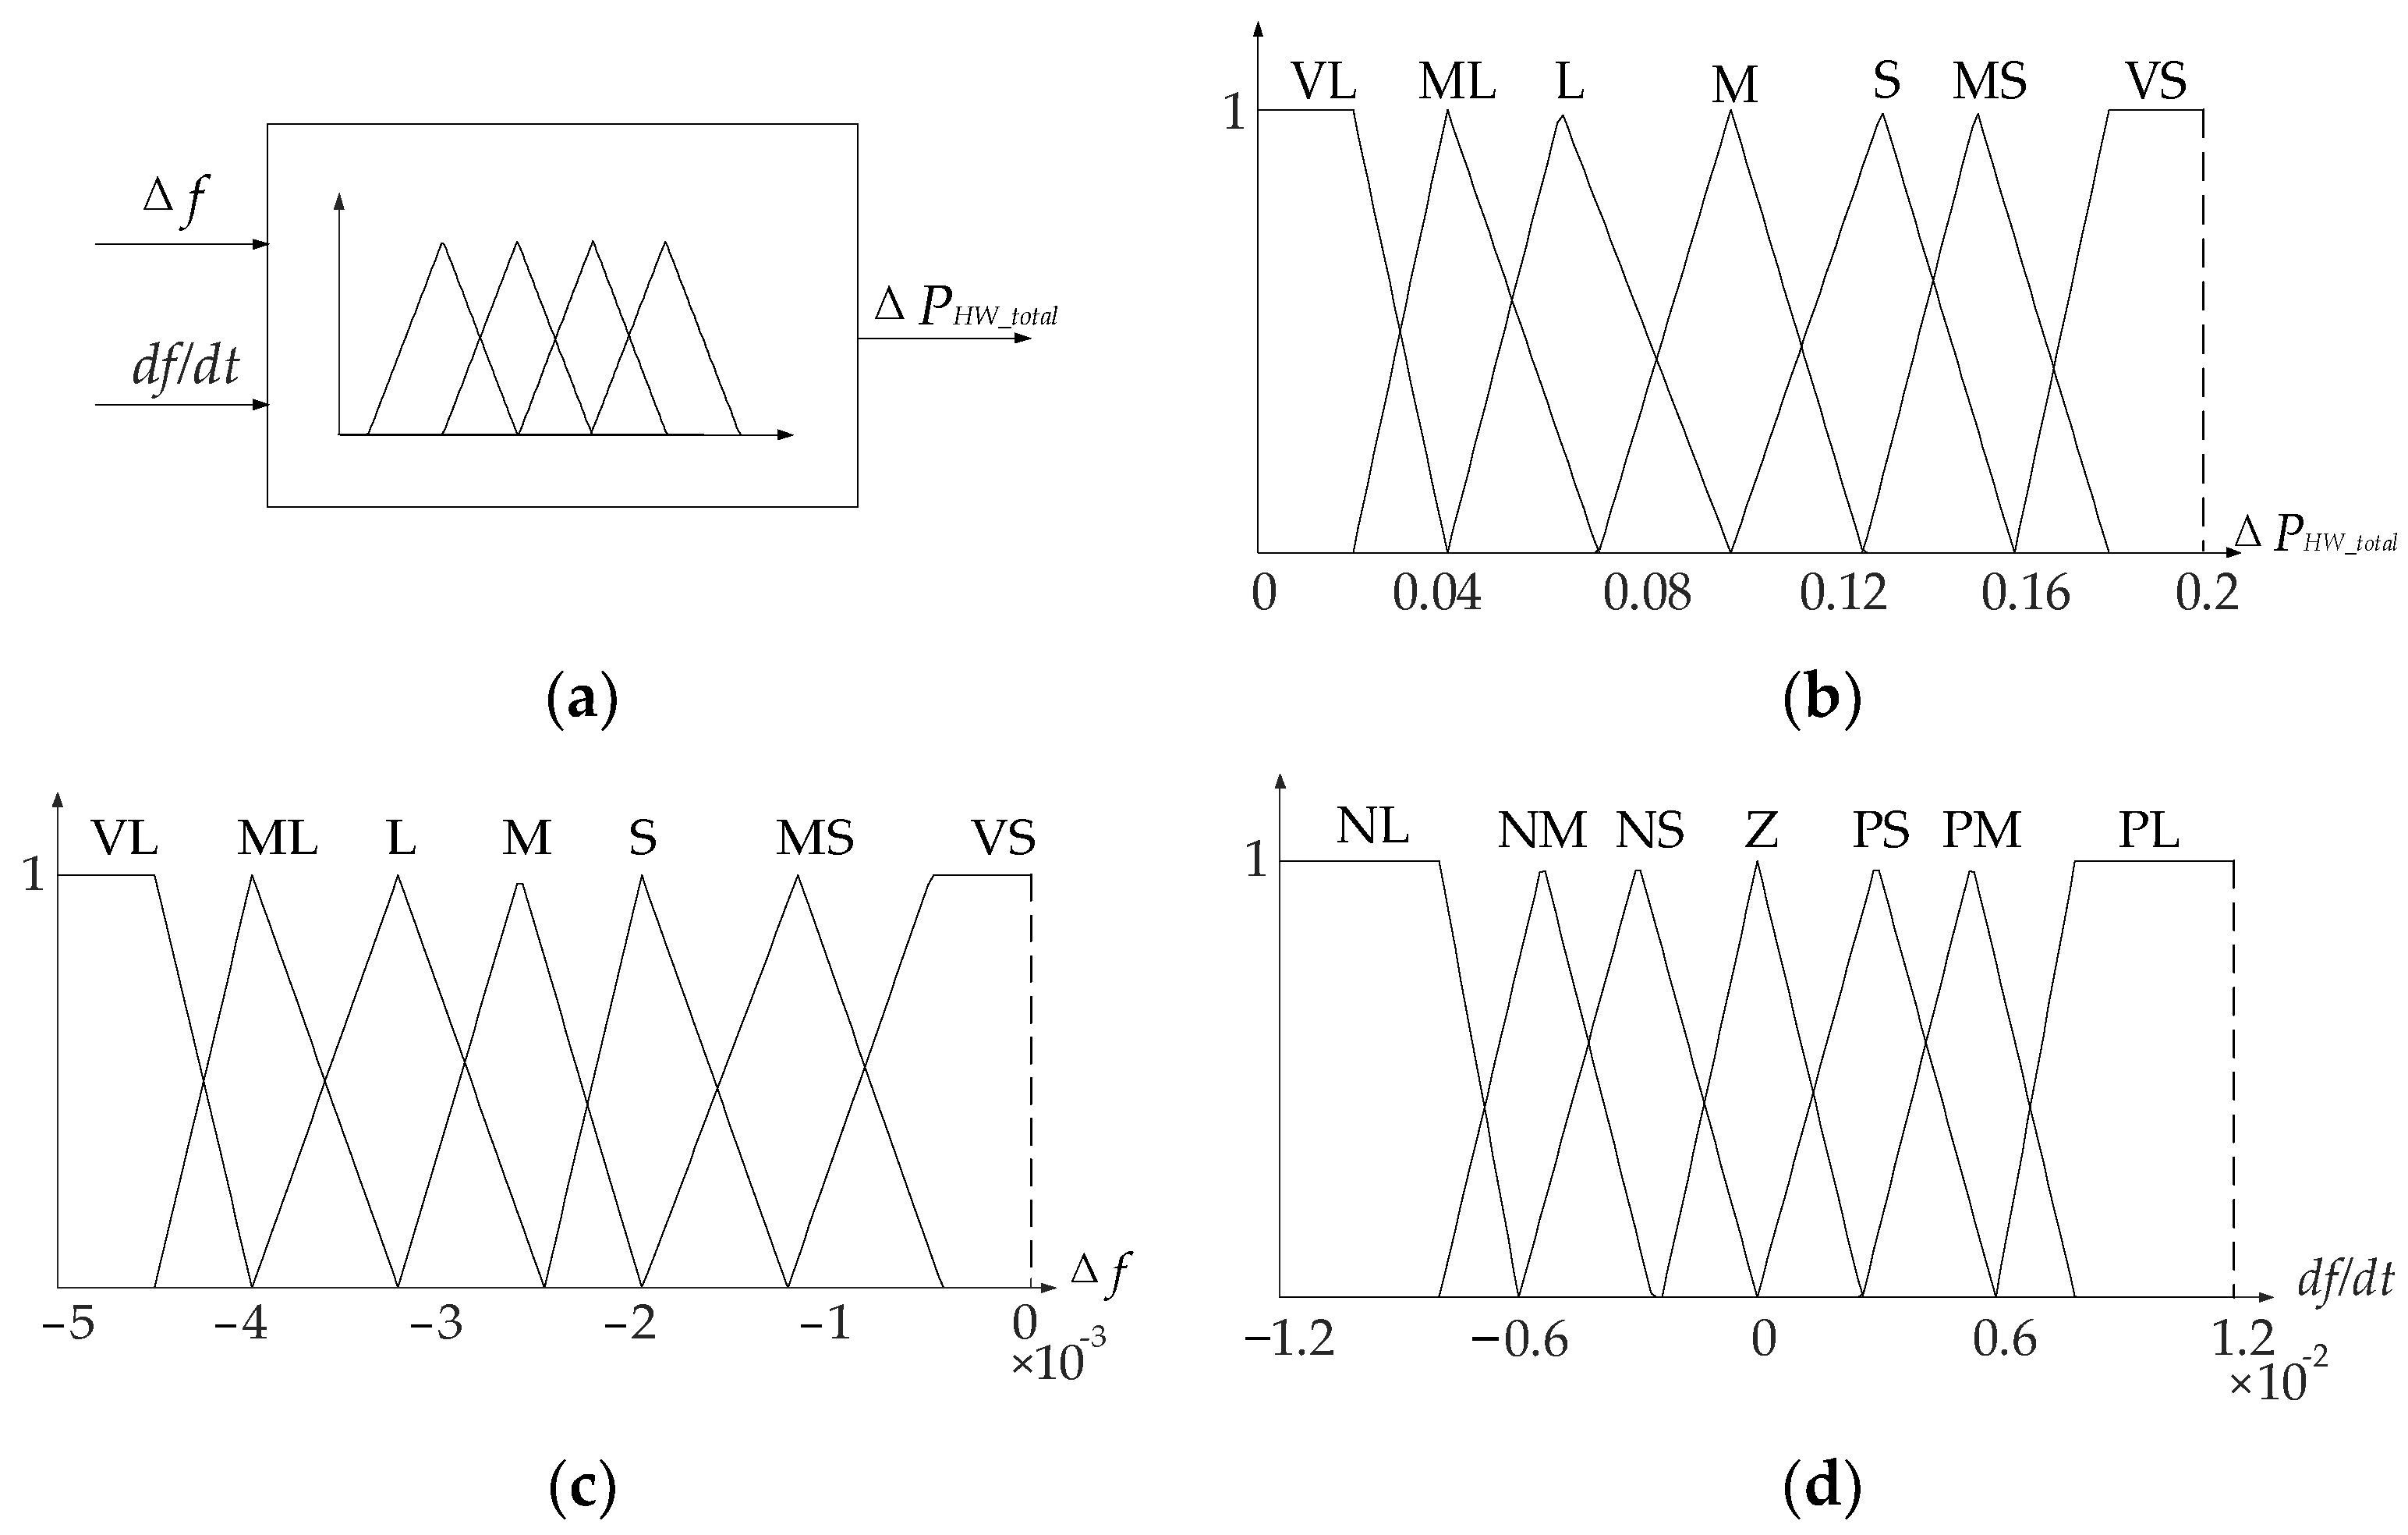
Figure 7.
The structure diagram and membership of FLC-1. (a) The structure diagram of FLC-1, (b) the membership function of ΔPHW_total, (c) the membership function of Δf, and (d) the membership function of df/dt.
Figure 7.
The structure diagram and membership of FLC-1. (a) The structure diagram of FLC-1, (b) the membership function of ΔPHW_total, (c) the membership function of Δf, and (d) the membership function of df/dt.
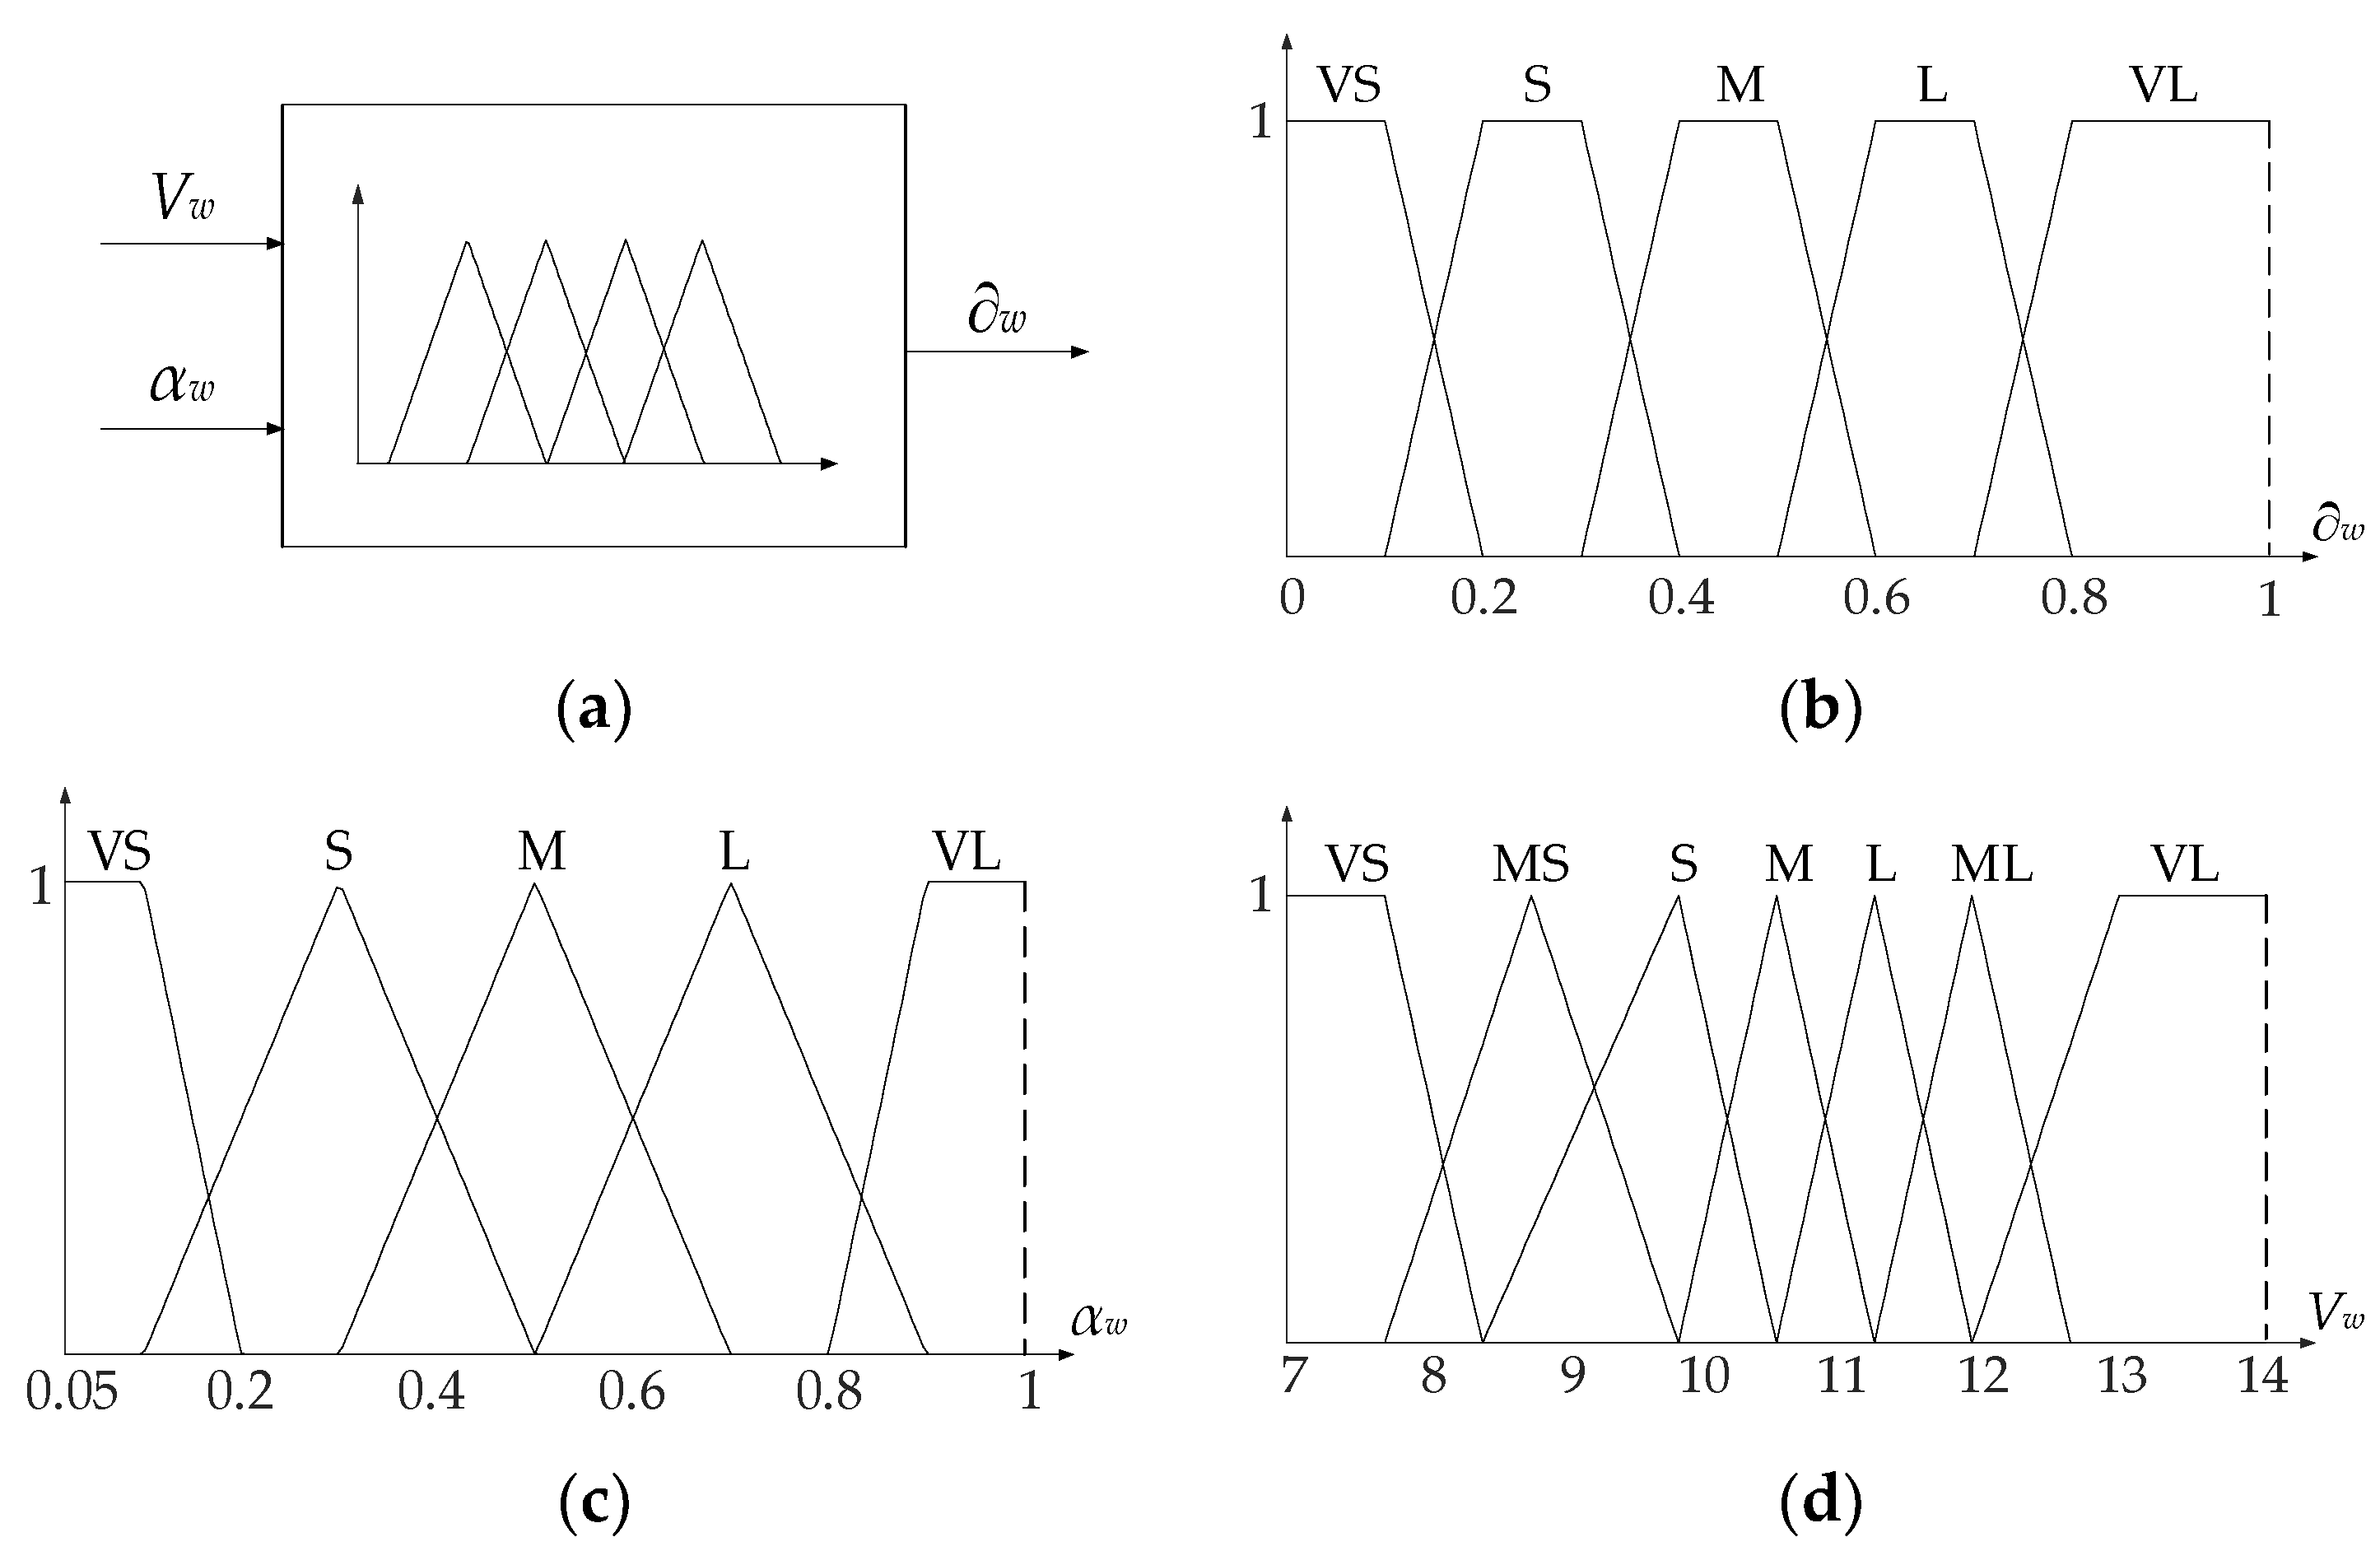
Figure 8.
The structure diagram and membership of FLC-2. (a) The structure diagram of FLC-2, (b) the membership function of ∂w, (c) the membership function of αw, and (d) the membership function of Vw.
Figure 8.
The structure diagram and membership of FLC-2. (a) The structure diagram of FLC-2, (b) the membership function of ∂w, (c) the membership function of αw, and (d) the membership function of Vw.
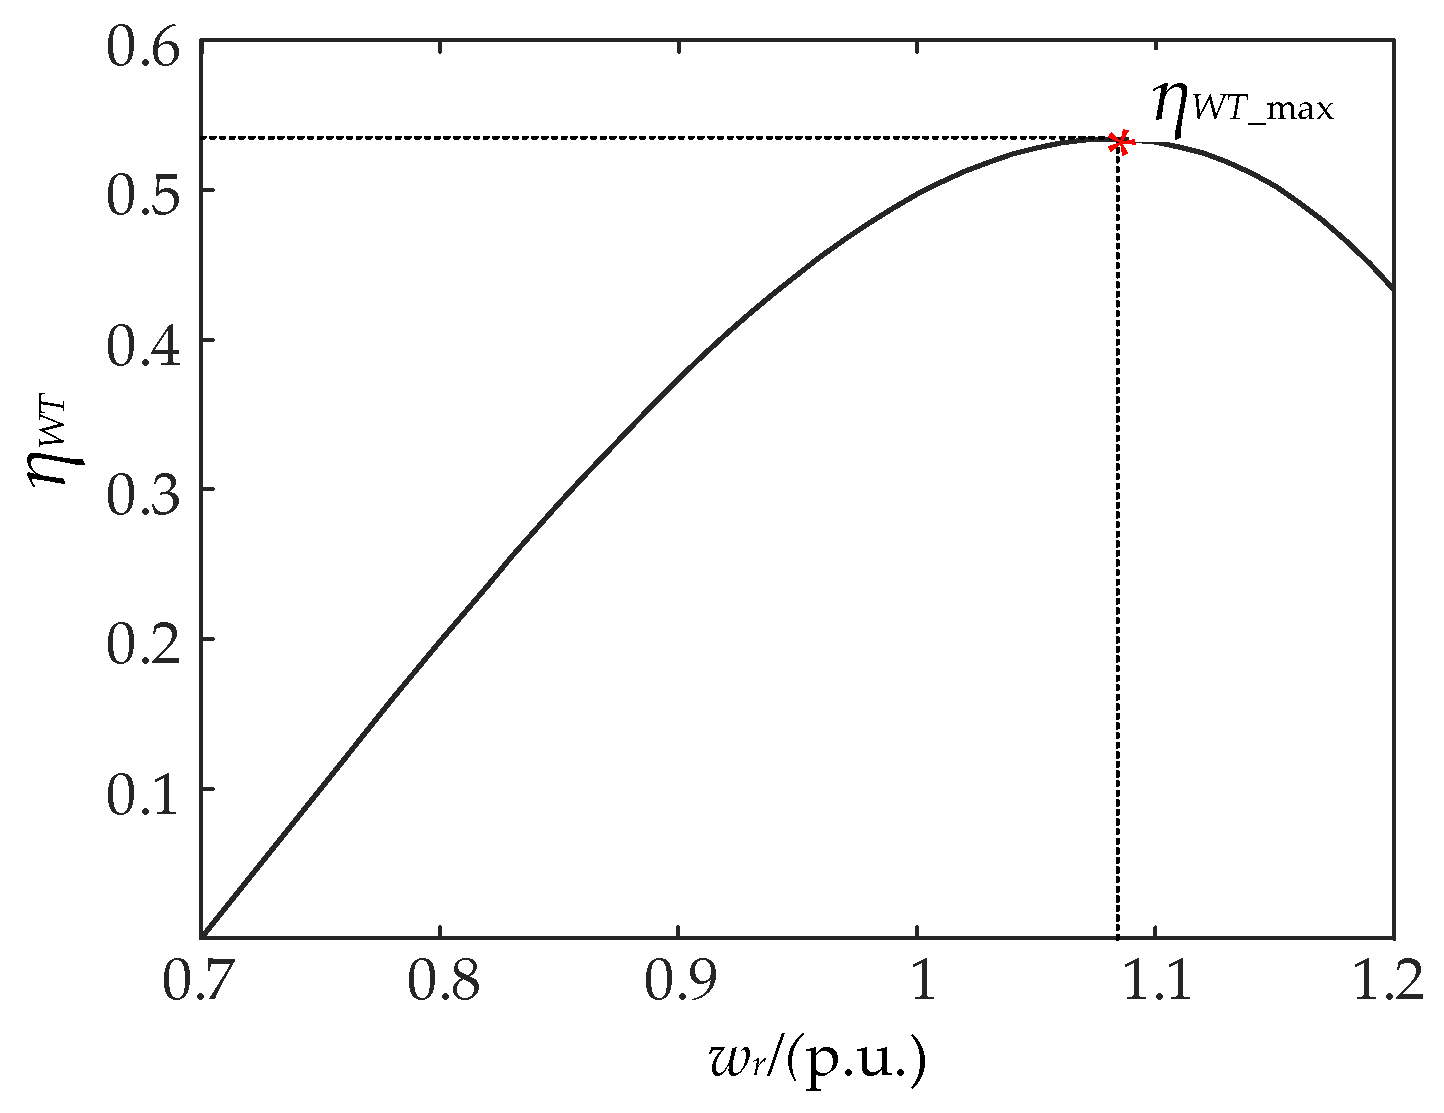
Figure 9.
Curve of frequency regulation capability coefficient ηWT.
Figure 9.
Curve of frequency regulation capability coefficient ηWT.
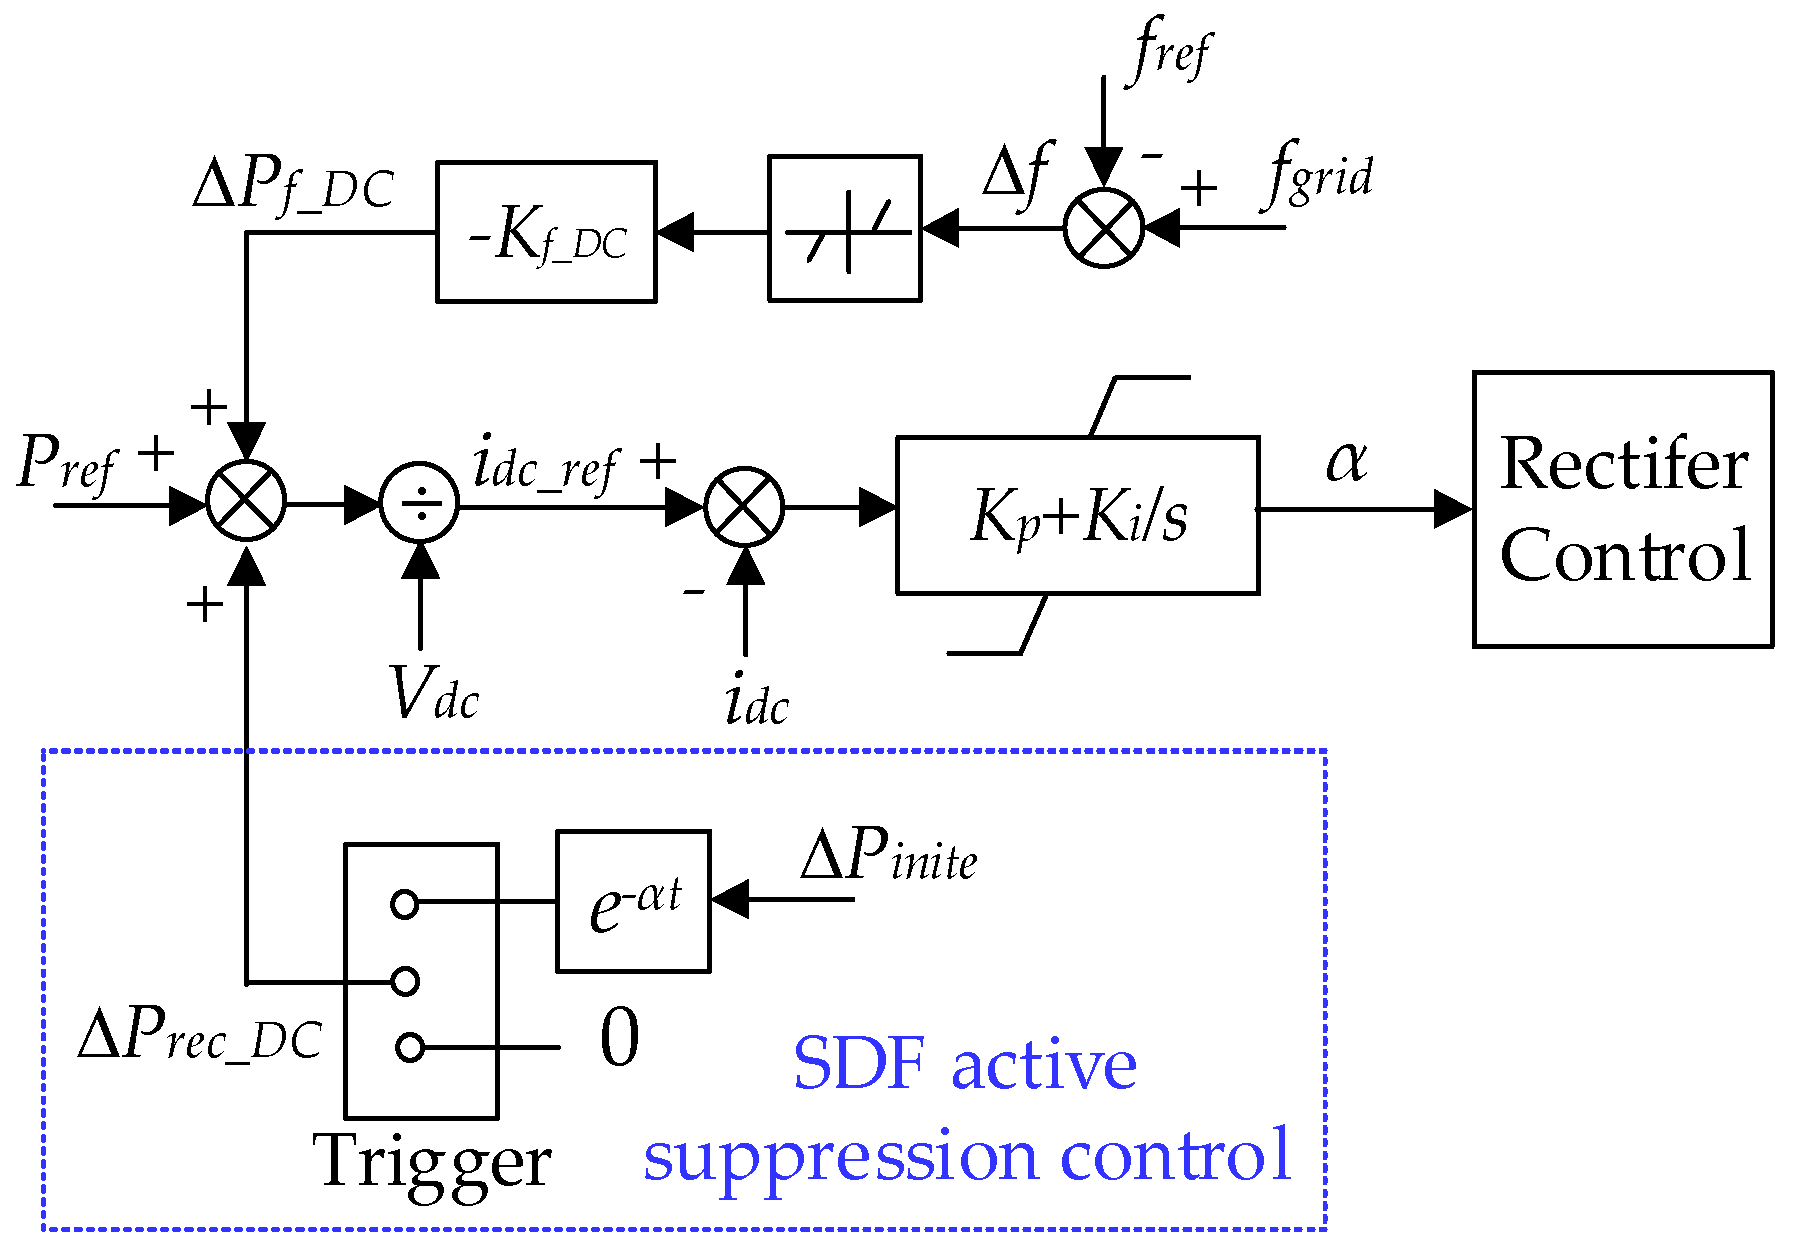
Figure 10.
SFD active suppression control for HVDC.
Figure 10.
SFD active suppression control for HVDC.
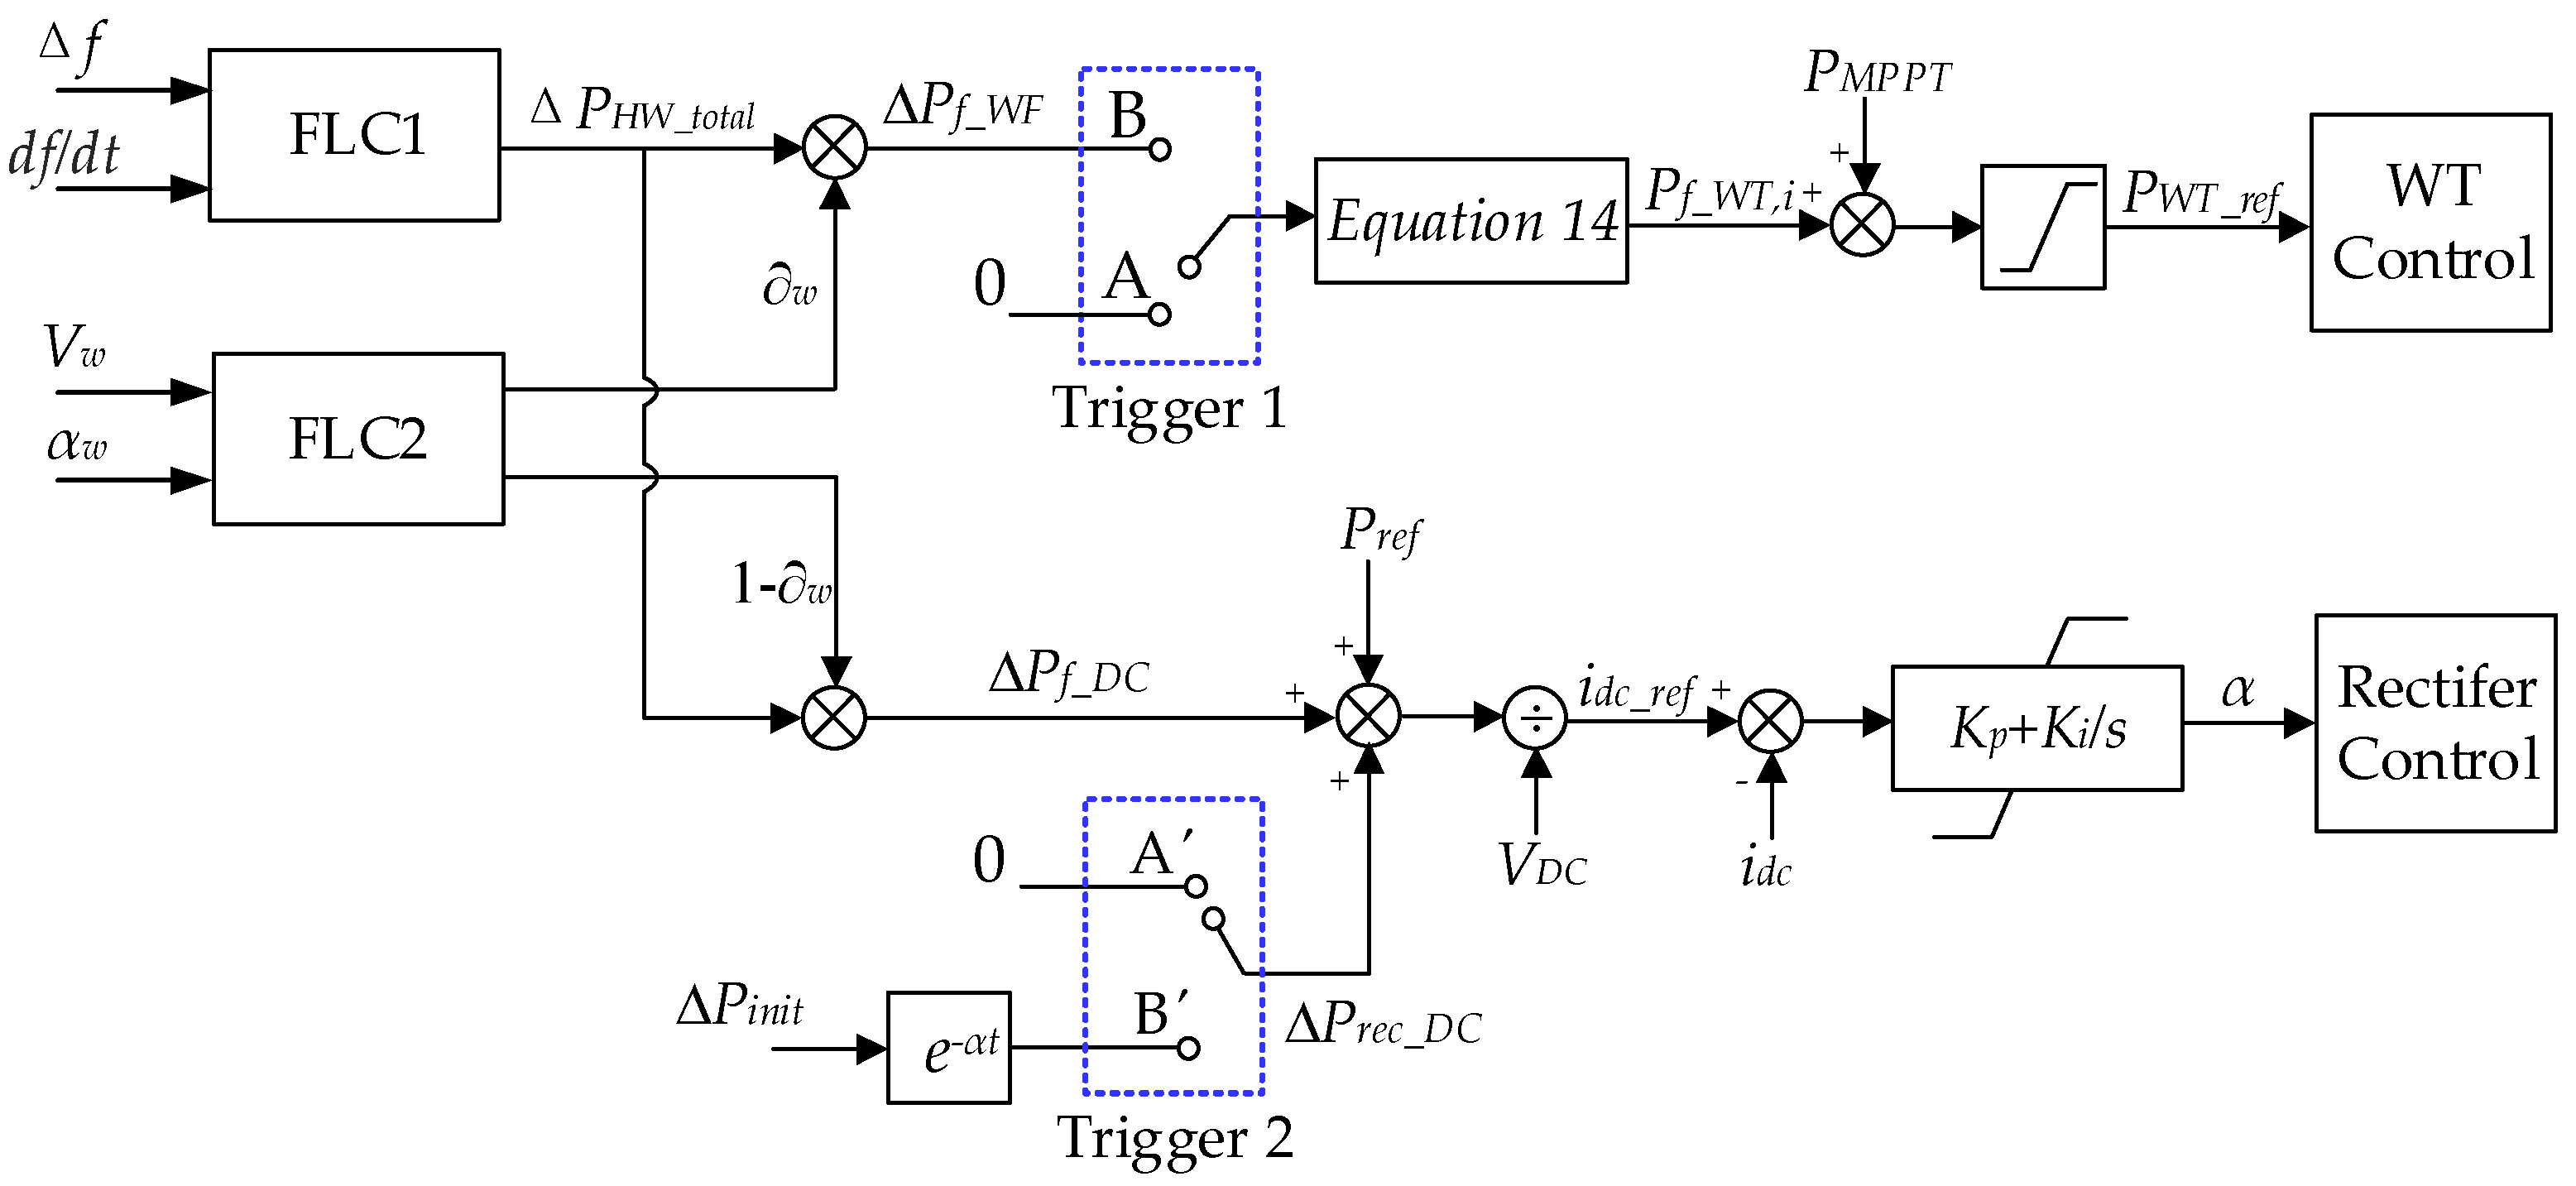
Figure 11.
The control block-diagram of HWFRS.
Figure 11.
The control block-diagram of HWFRS.
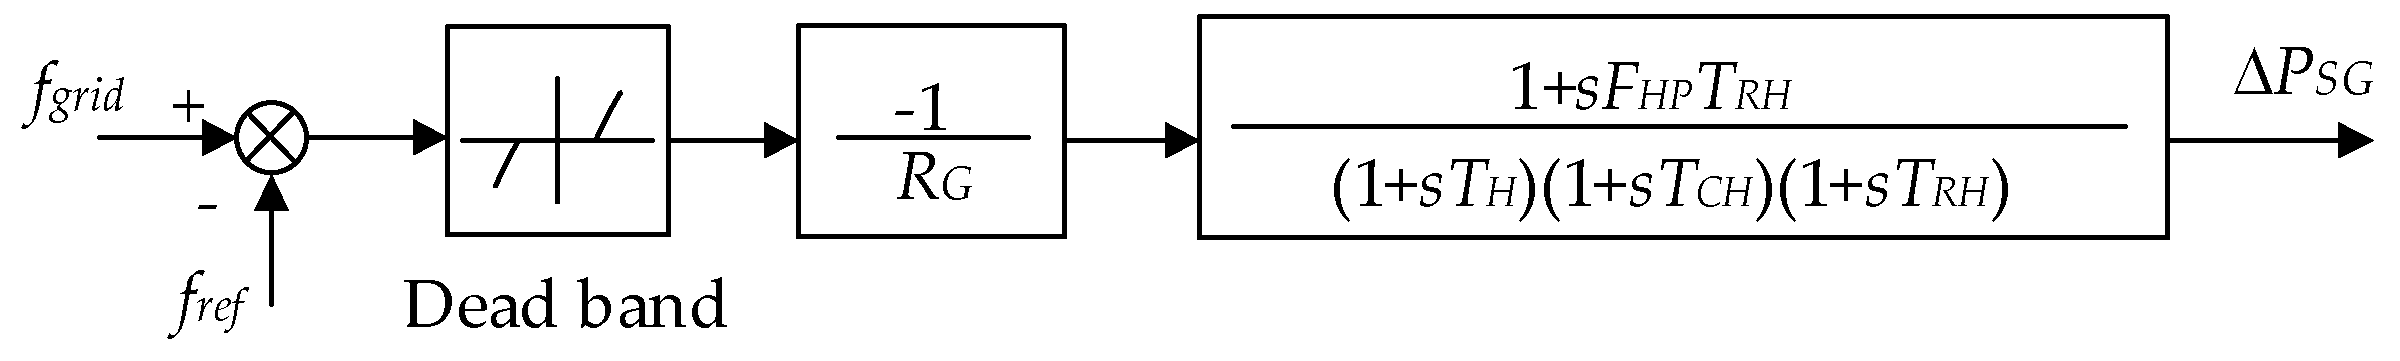
Figure 12.
Structure of the steam turbine governor.
Figure 12.
Structure of the steam turbine governor.
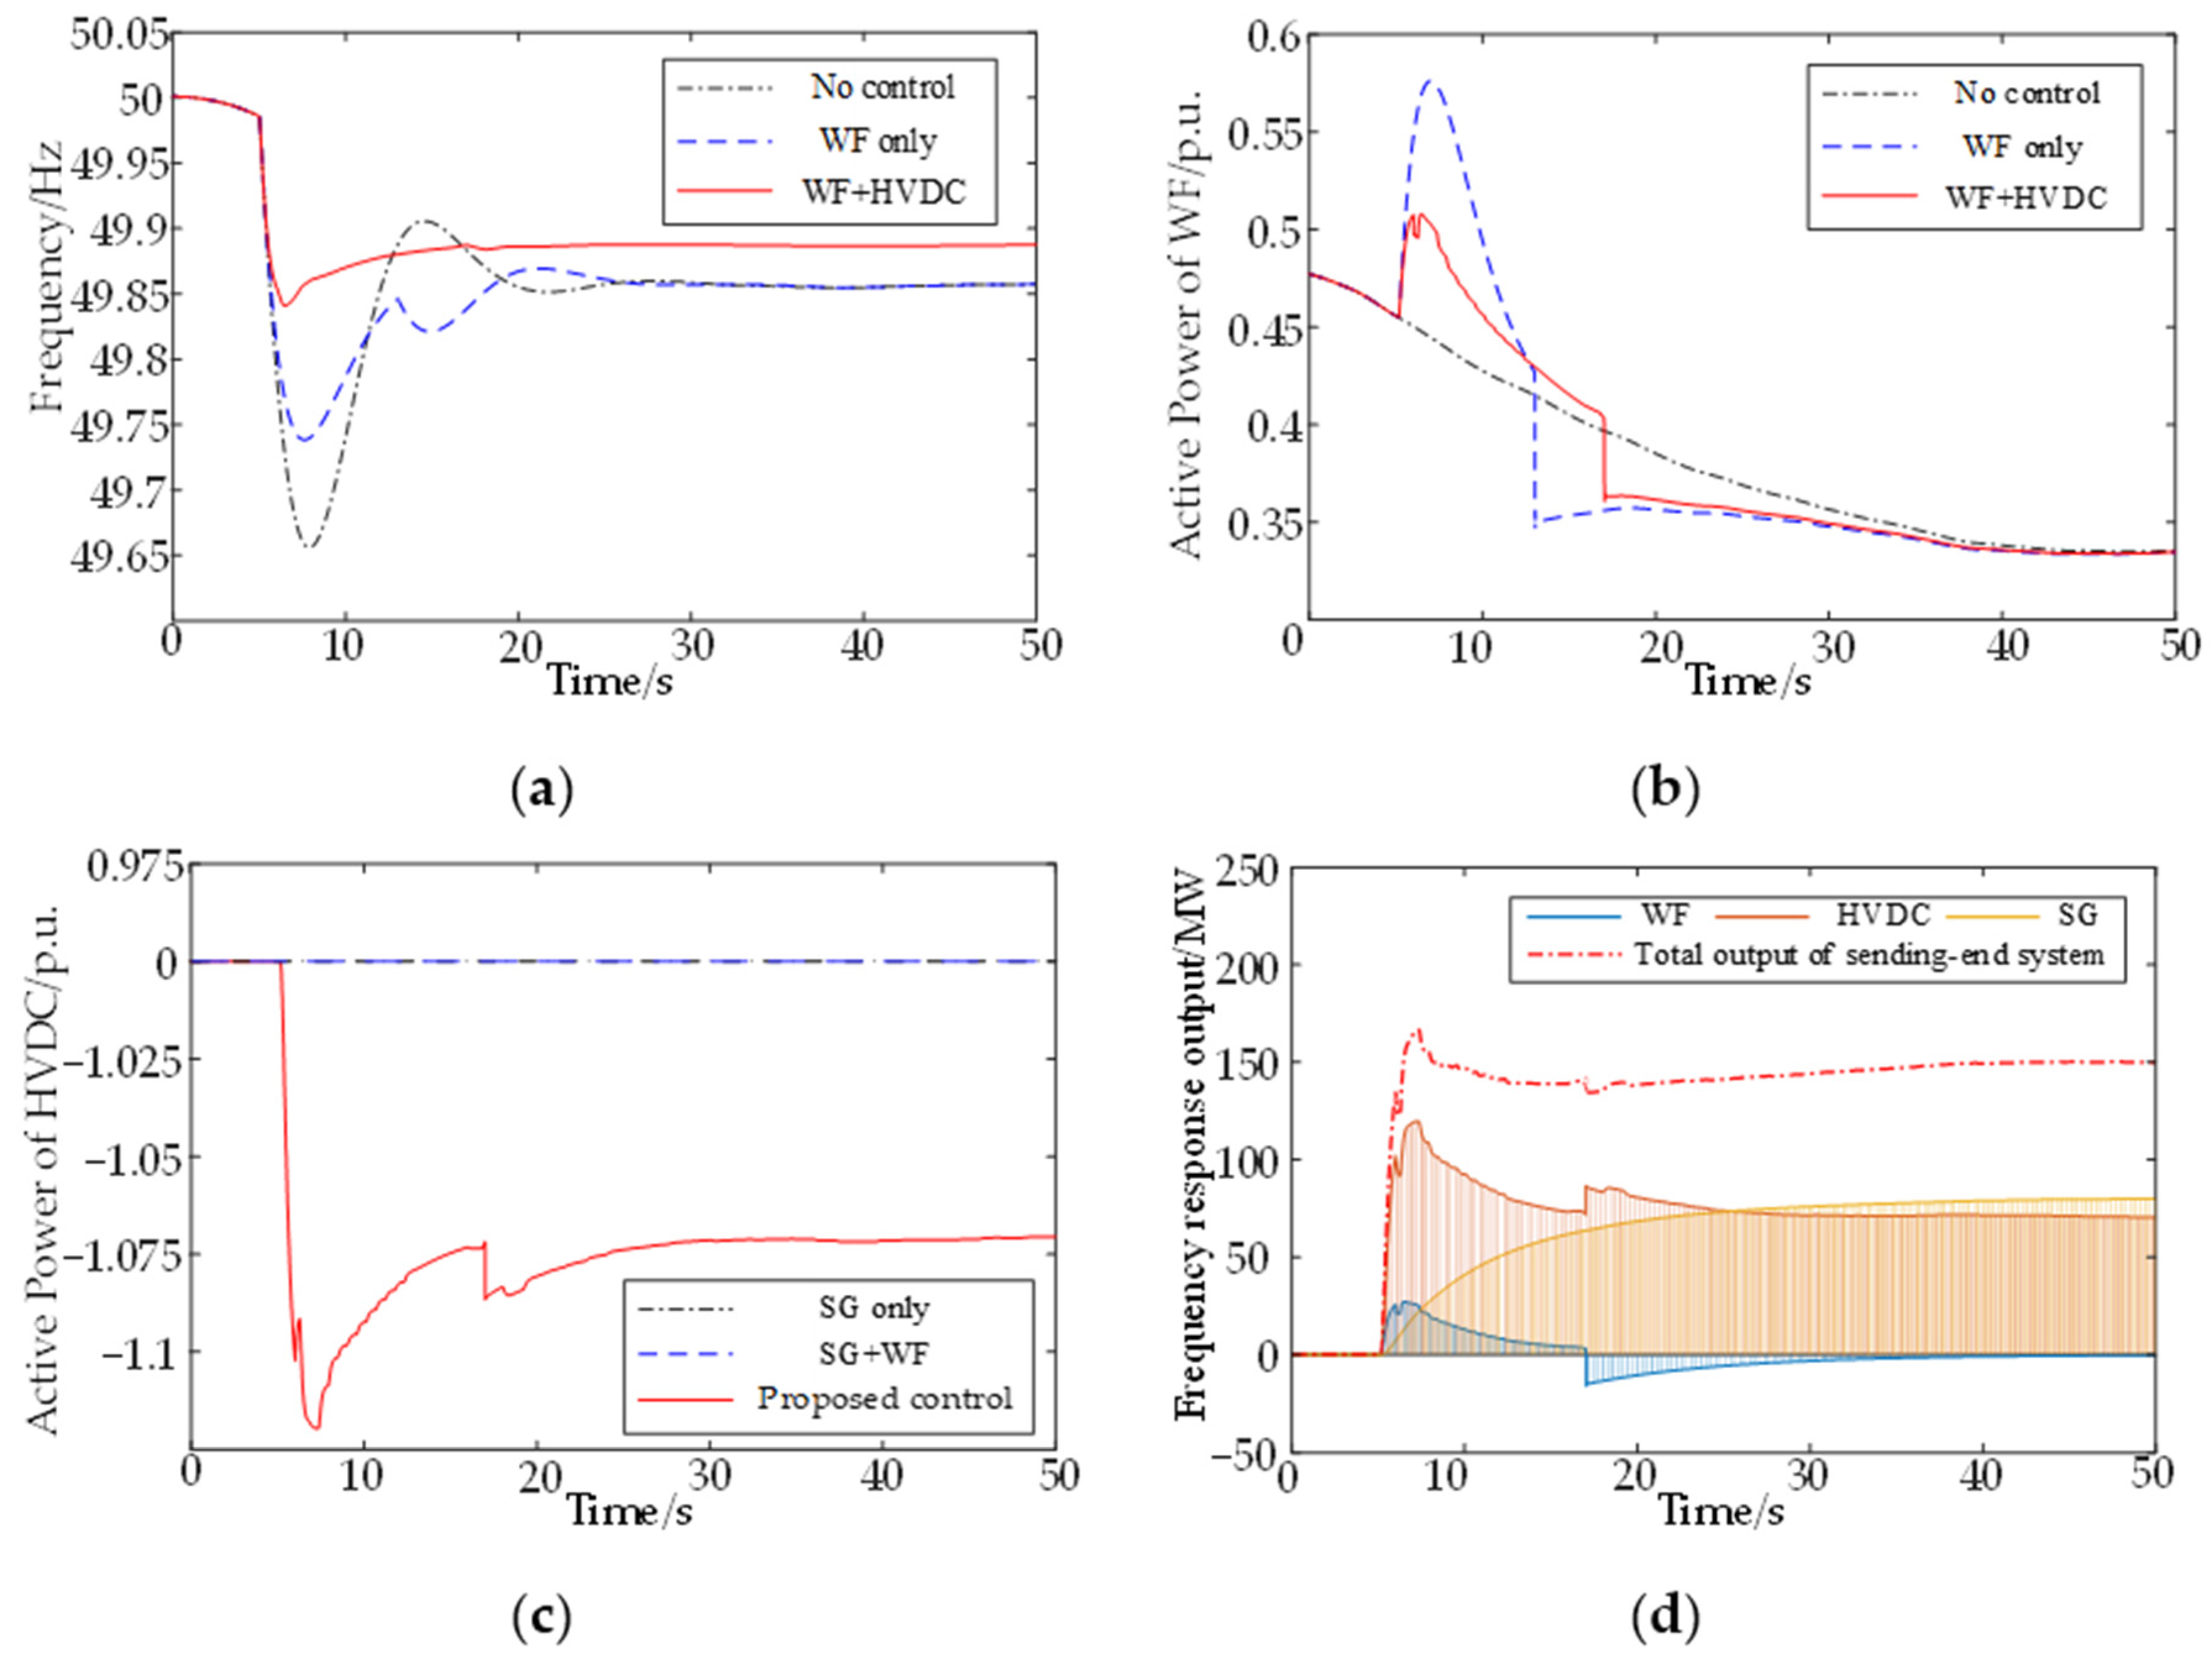
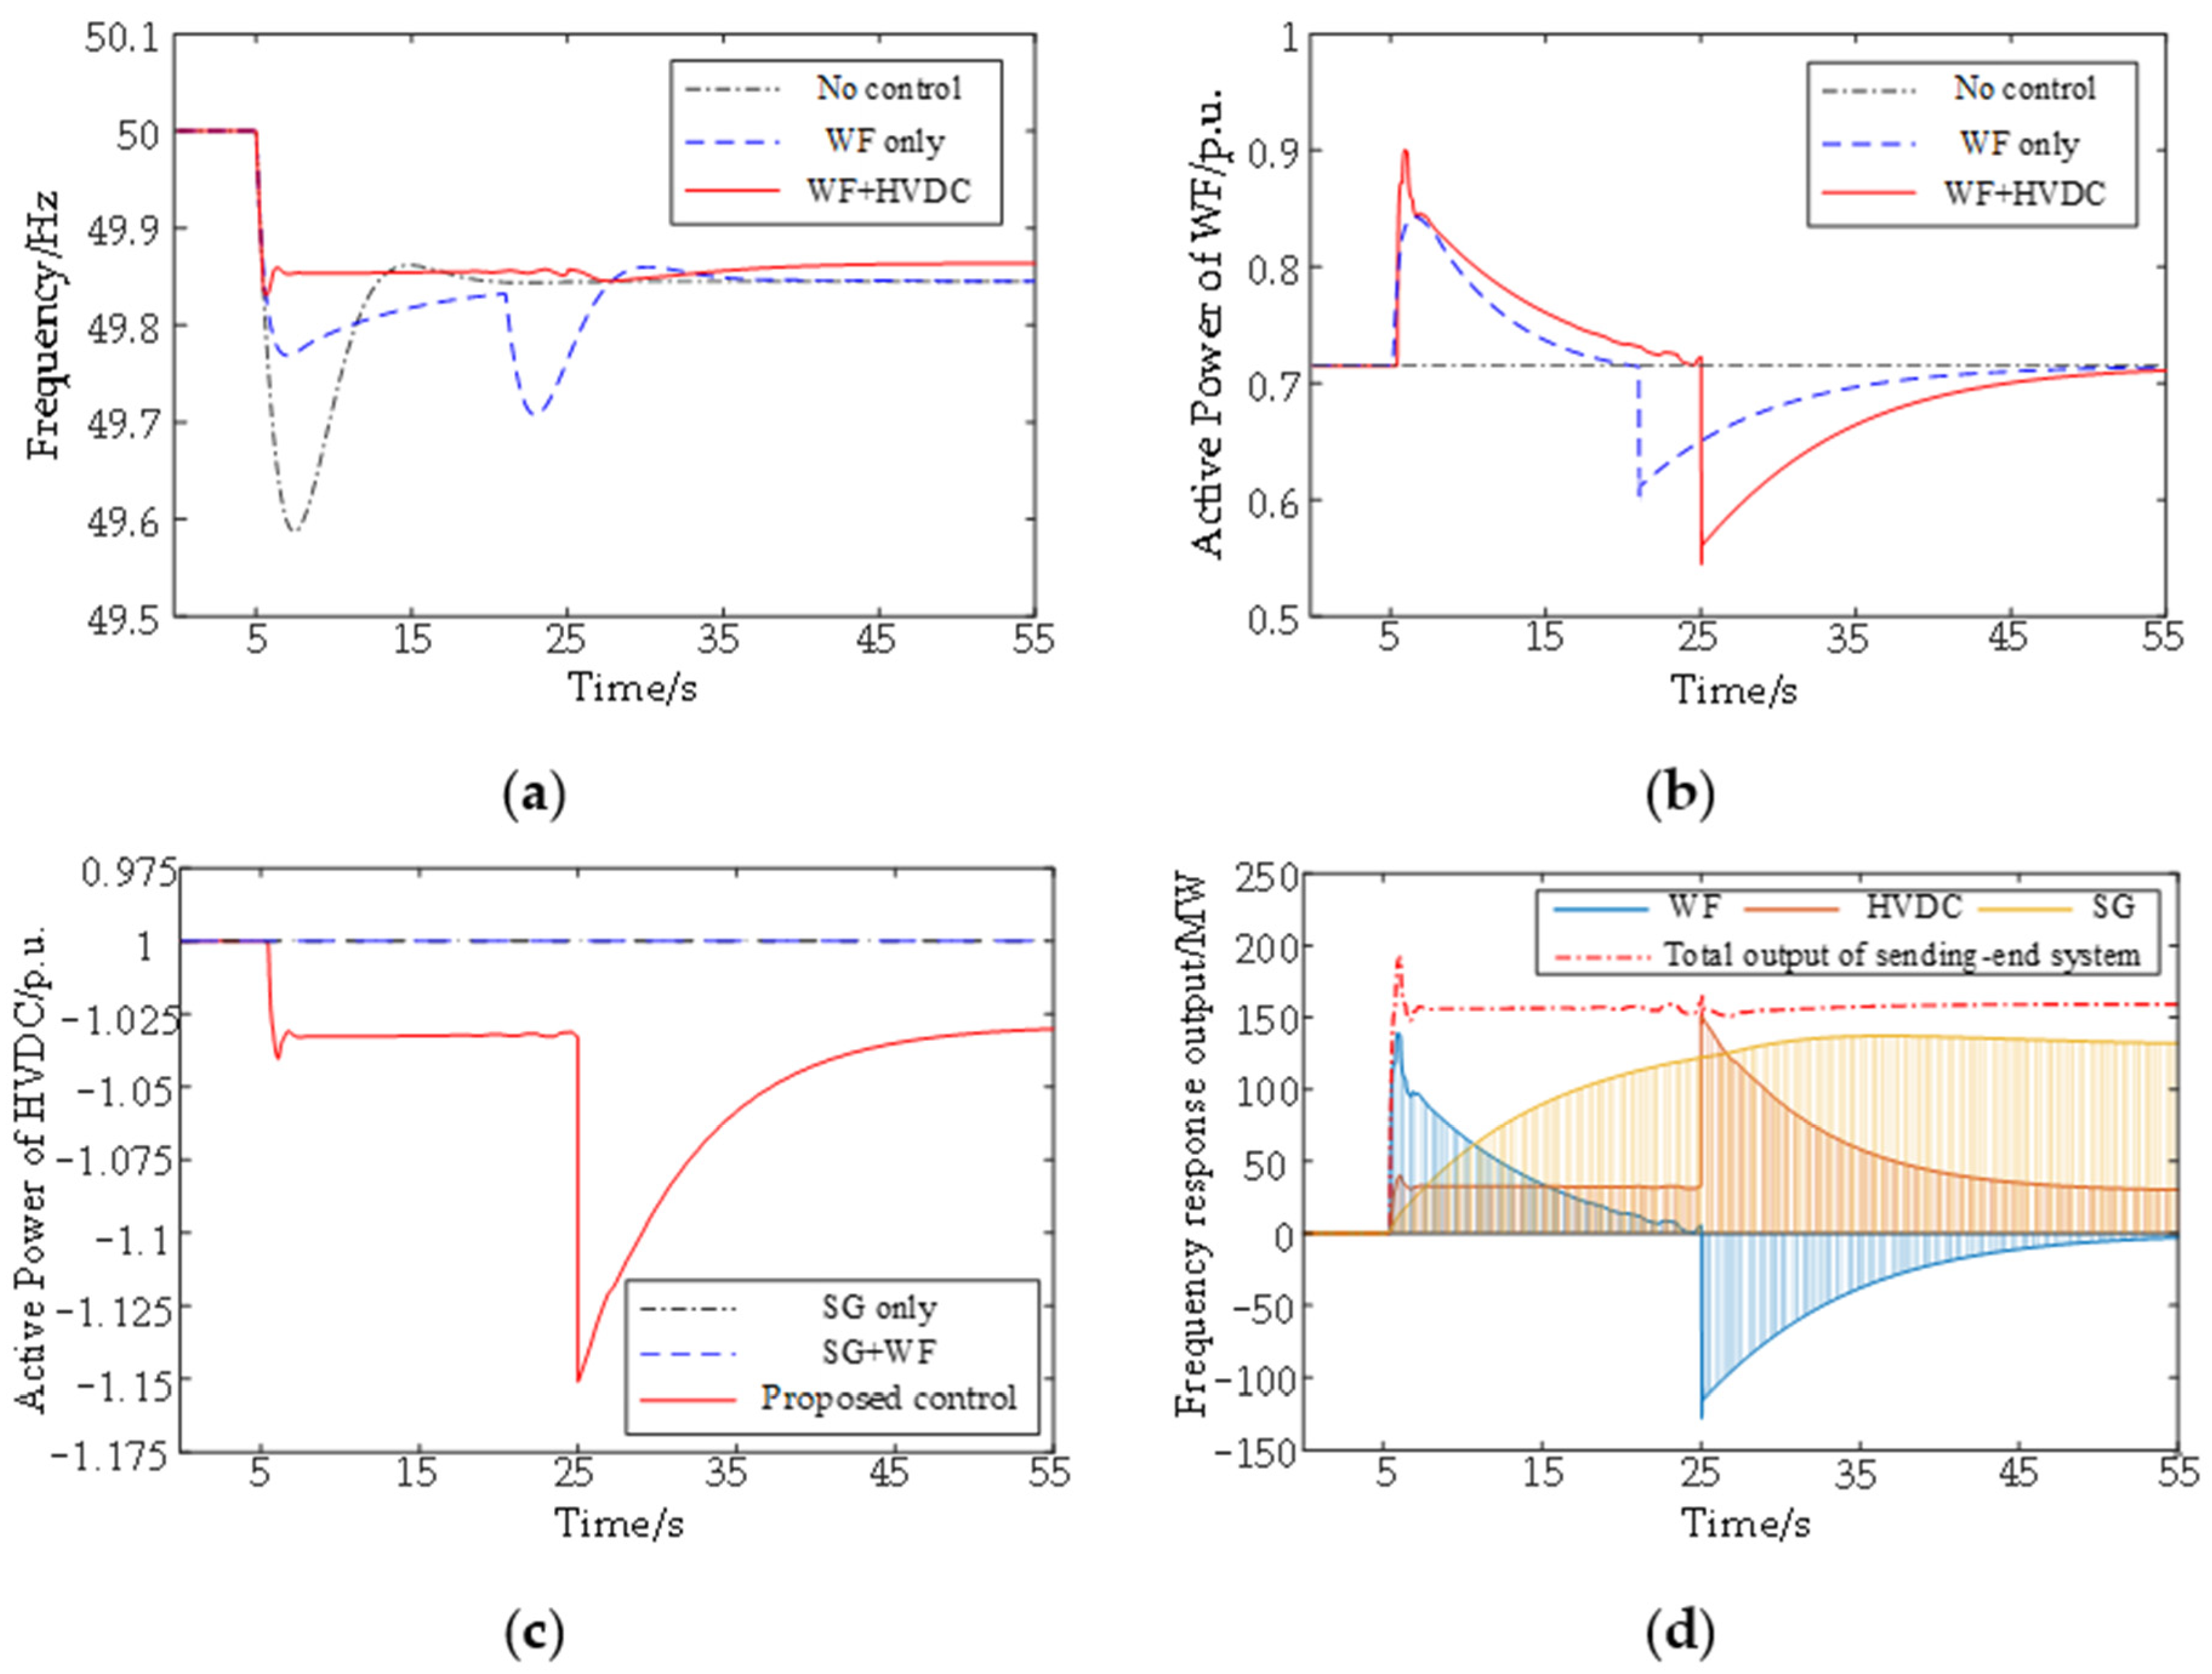
Figure 13.
Simulation results under high wind power permeability and high wind speed condition. (a) Sending-end system frequency, (b) active power of WF, and (c) active power of HVDC, (d) frequency response output of sending-end system.
Figure 13.
Simulation results under high wind power permeability and high wind speed condition. (a) Sending-end system frequency, (b) active power of WF, and (c) active power of HVDC, (d) frequency response output of sending-end system.
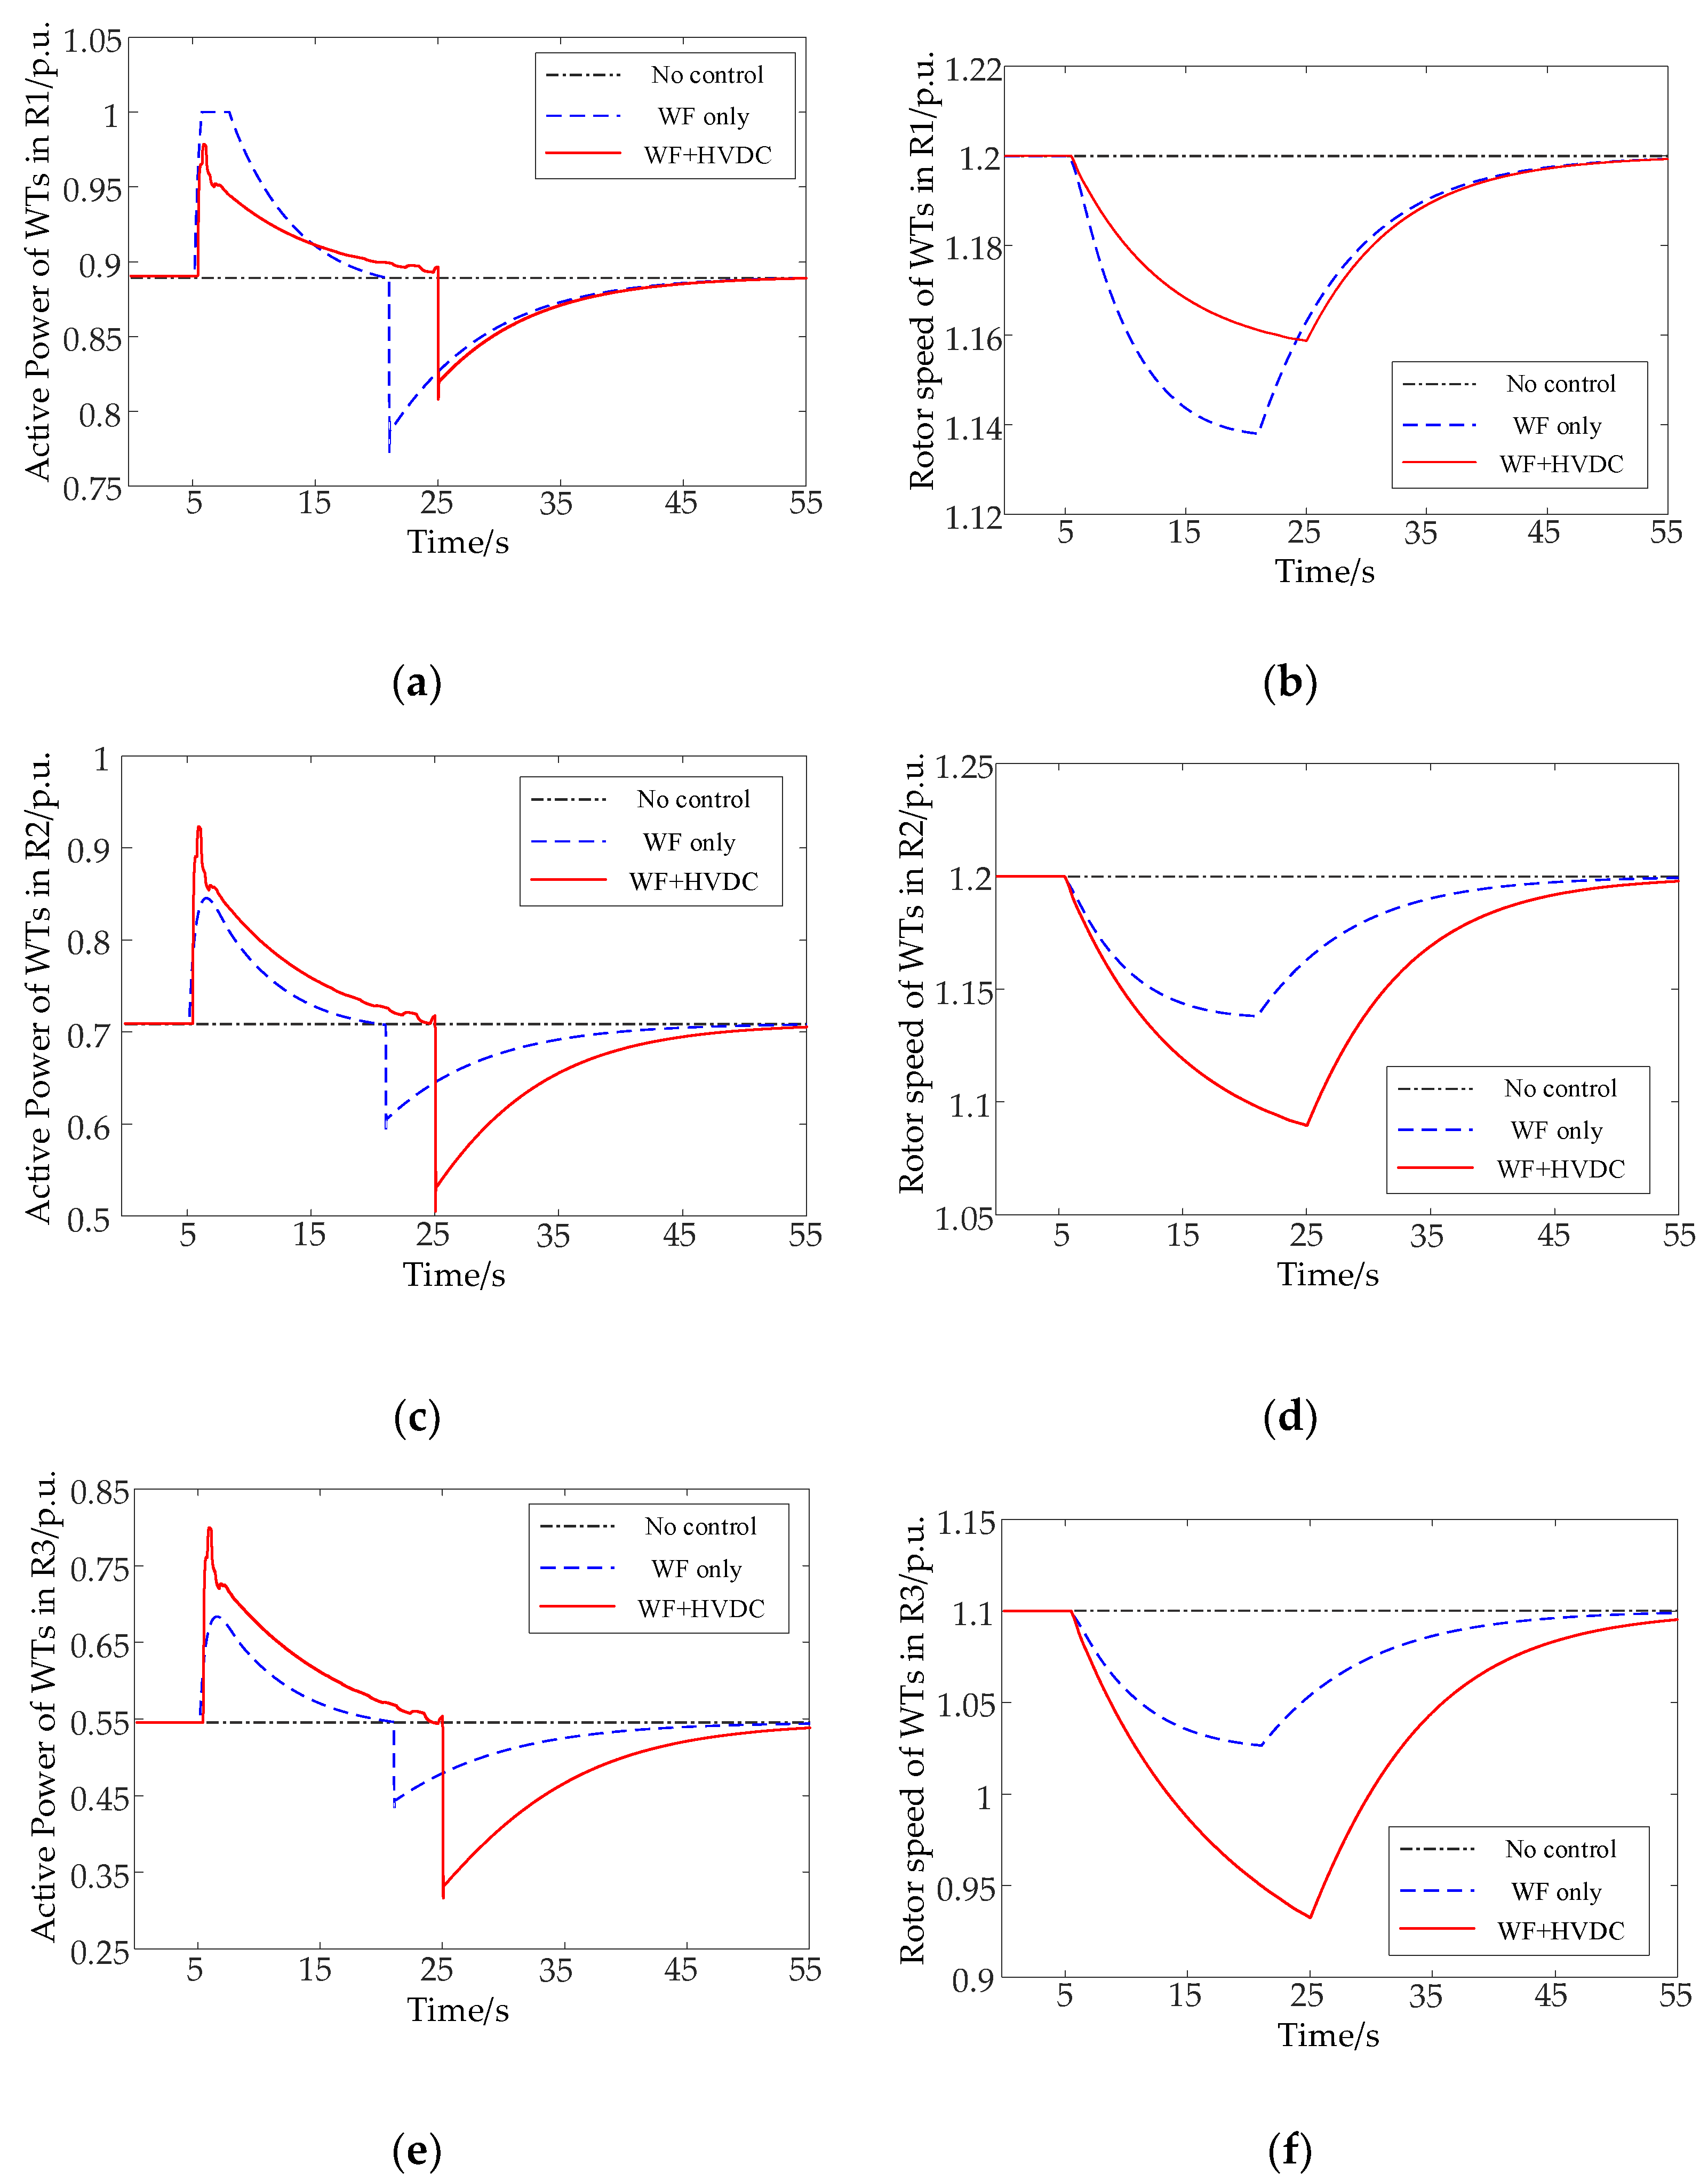
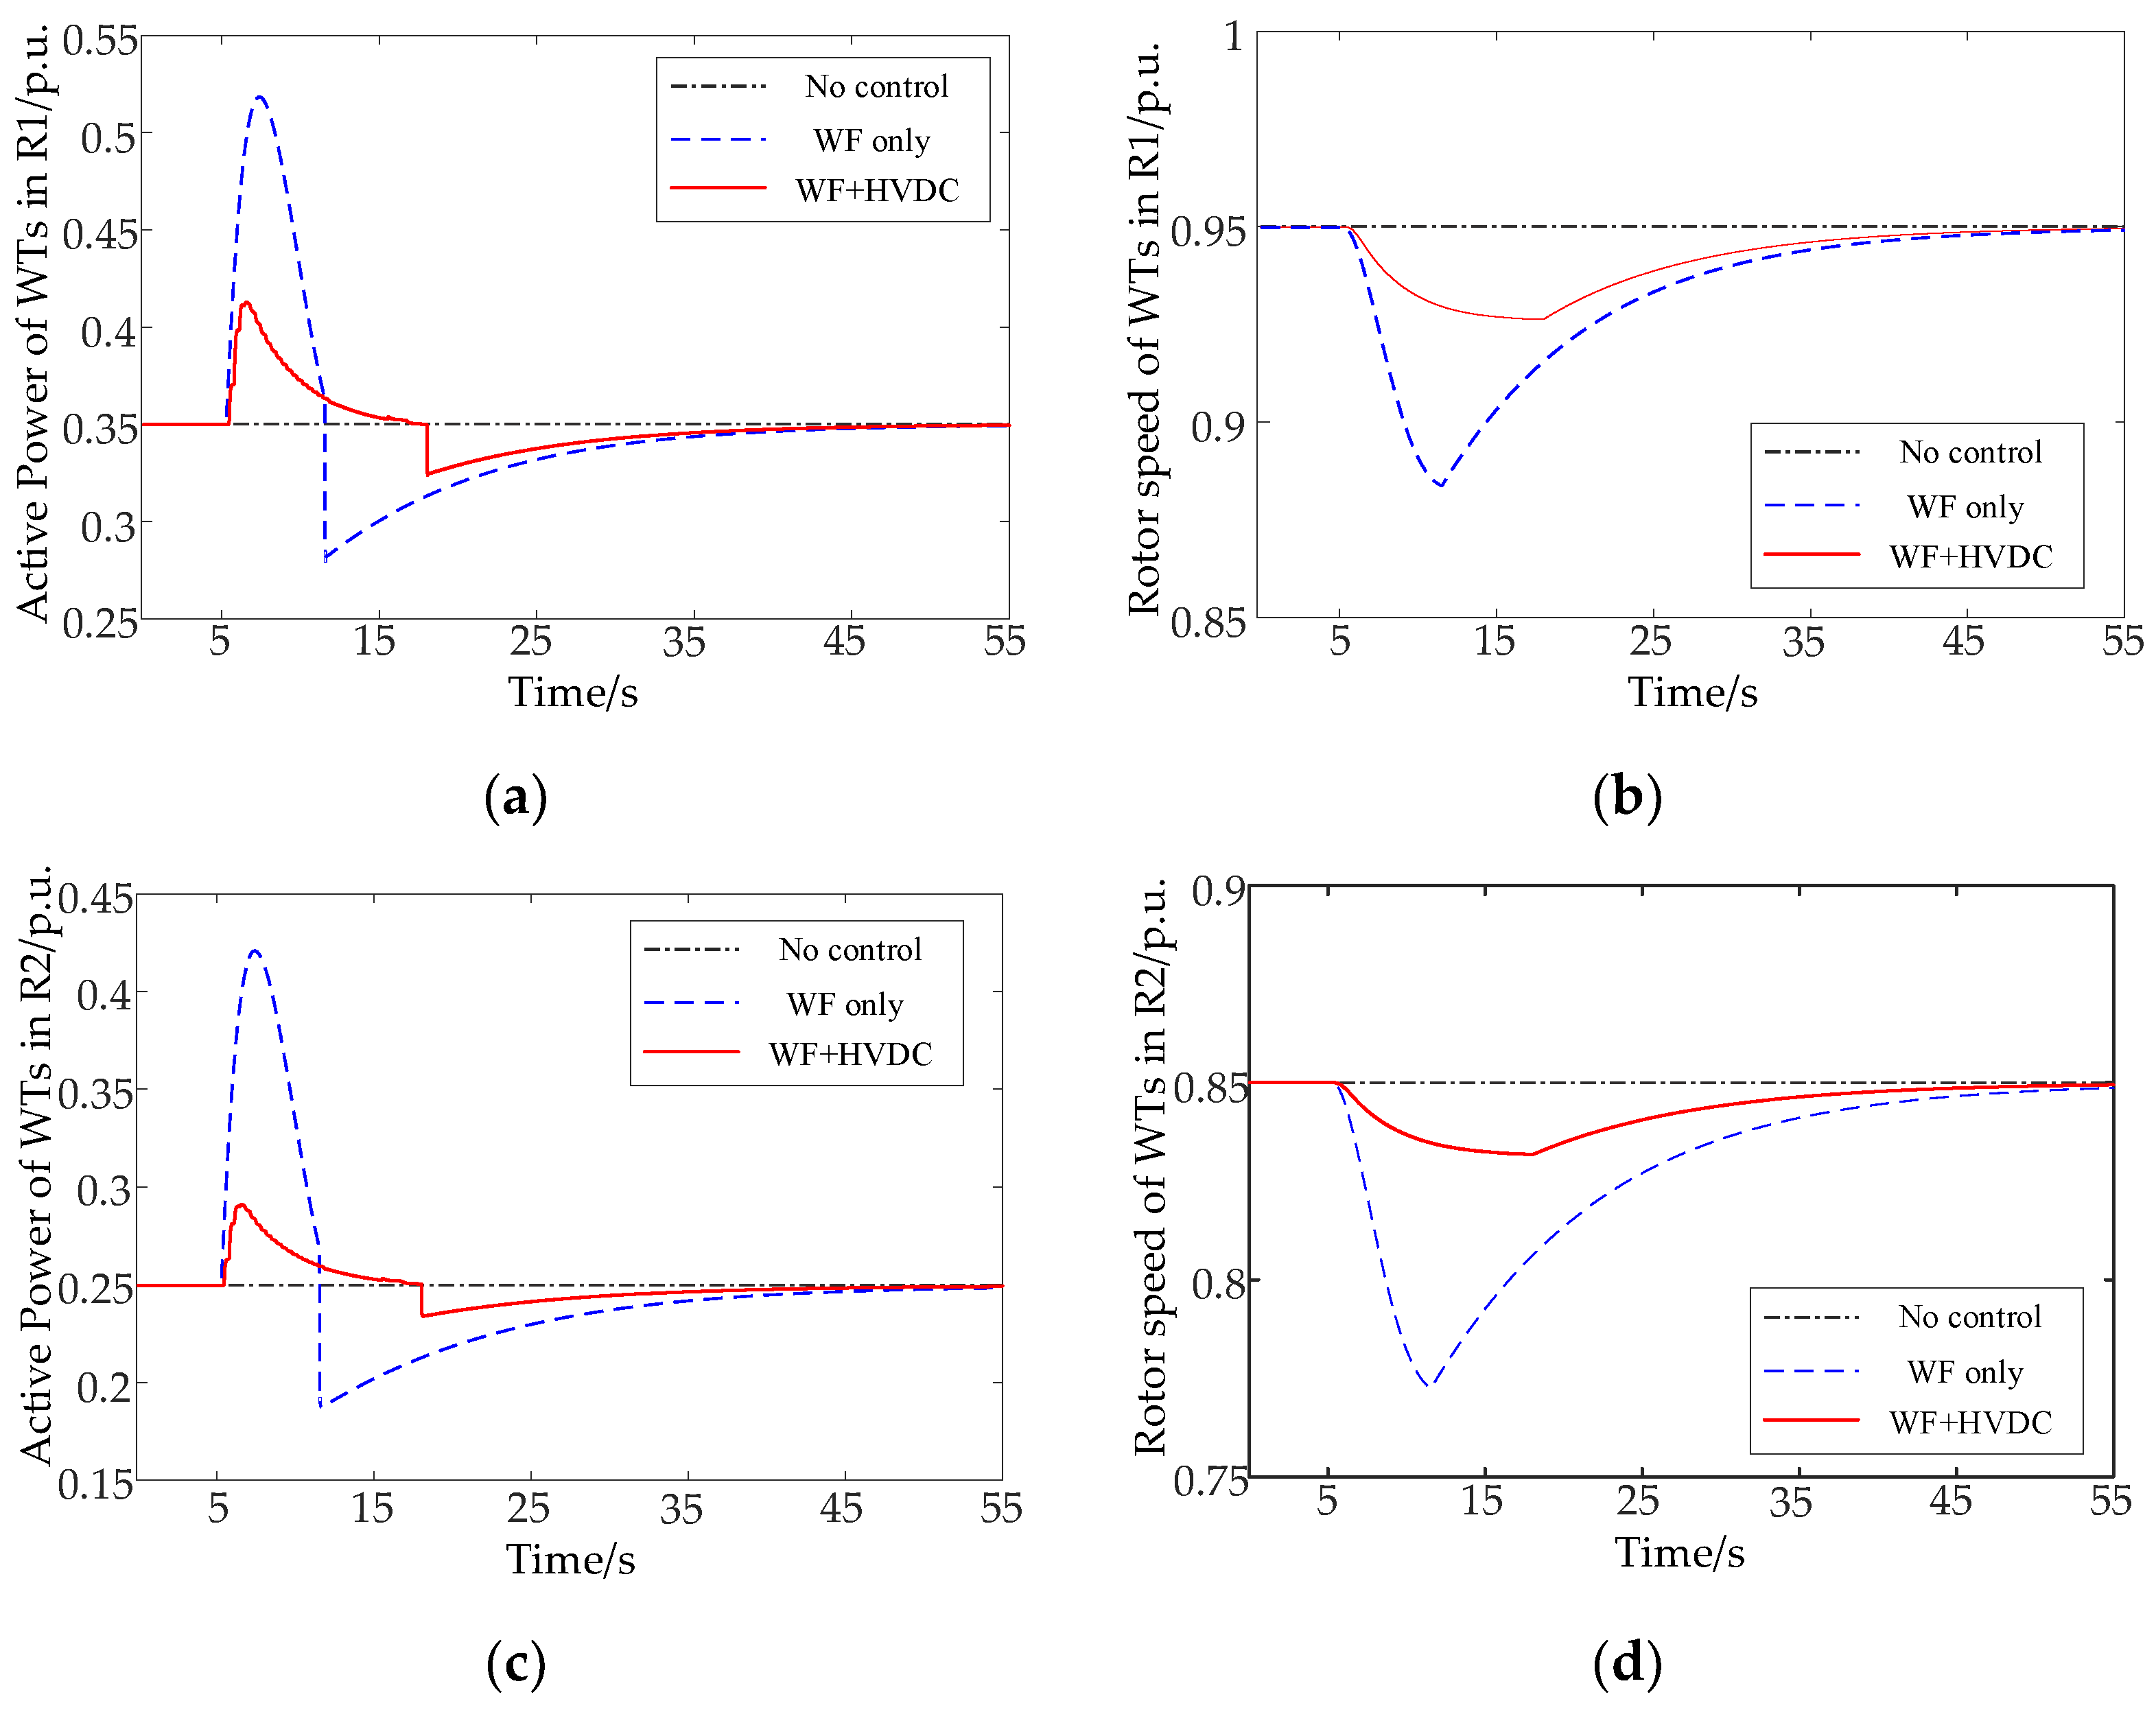
Figure 14.
Active power and rotor speed of WTs in each subarea. (a) Active power of WTs in R1, (b) rotor speed of WTs in R1, (c) active power of WTs in R2, (d) rotor speed of WTs in R2, (e) active power of WTs in R3, and (f) rotor speed of WTs in R3.
Figure 14.
Active power and rotor speed of WTs in each subarea. (a) Active power of WTs in R1, (b) rotor speed of WTs in R1, (c) active power of WTs in R2, (d) rotor speed of WTs in R2, (e) active power of WTs in R3, and (f) rotor speed of WTs in R3.
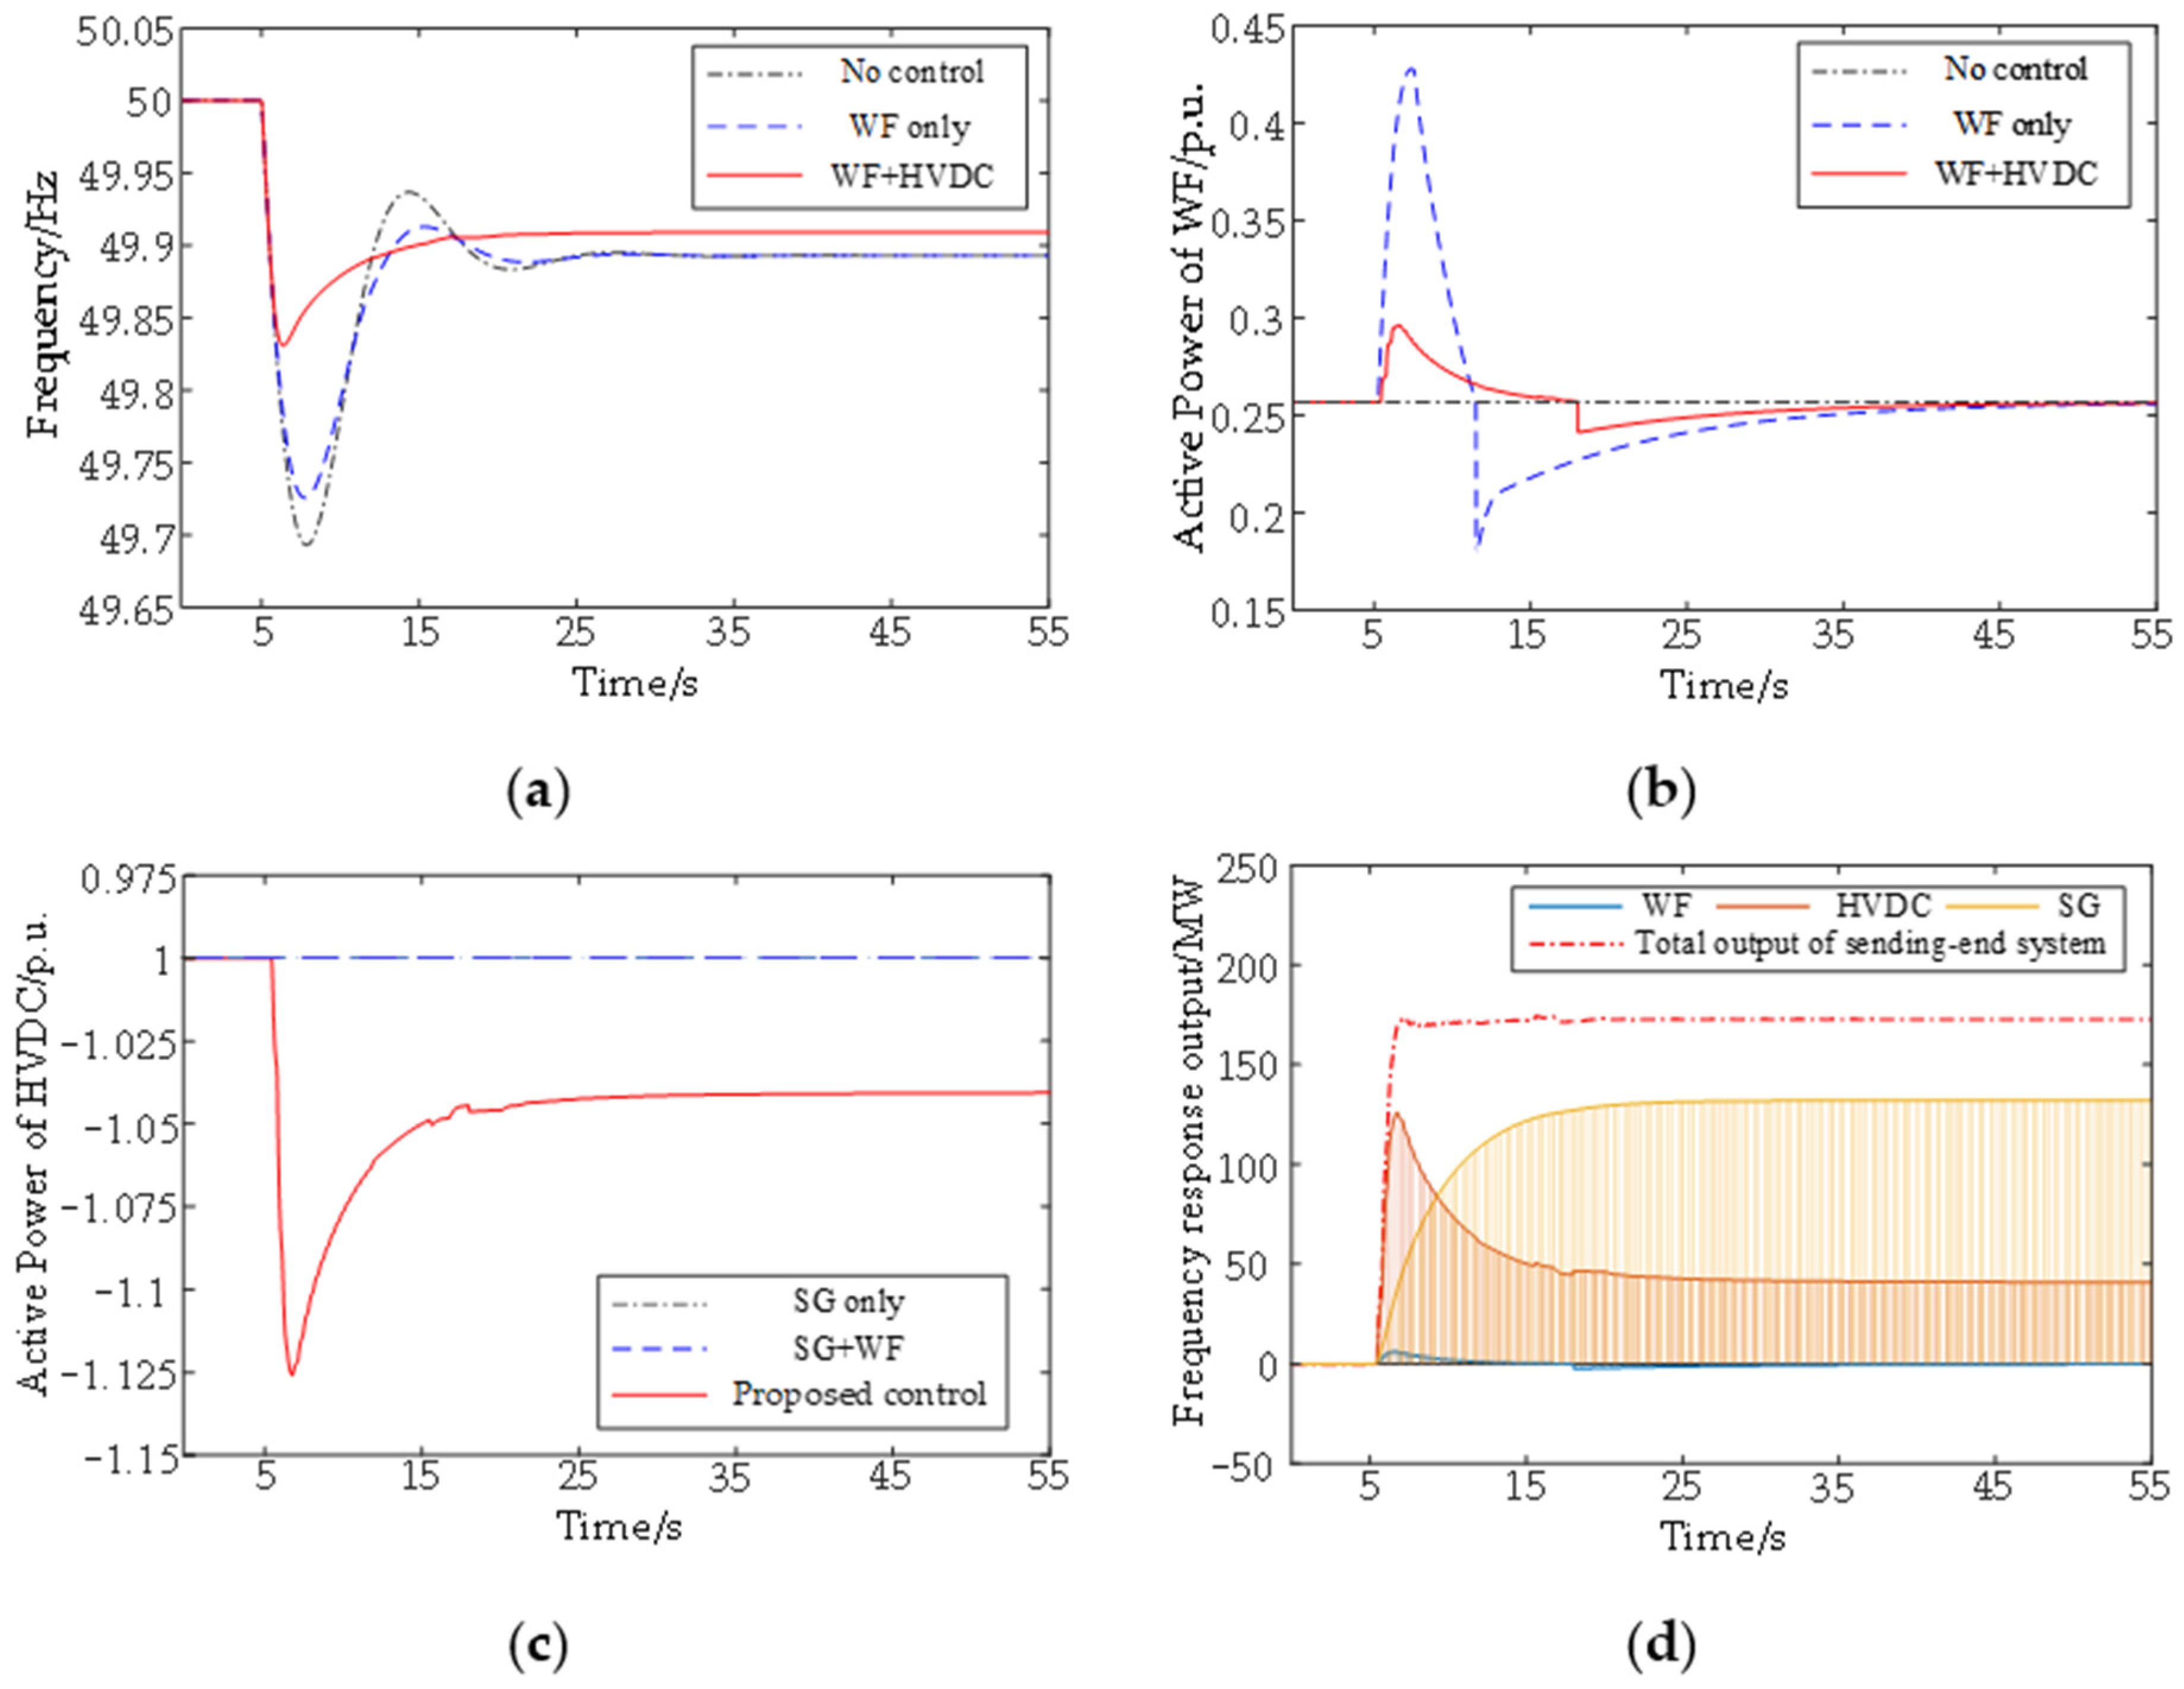
Figure 15.
Simulation results under low wind power permeability and low wind speed condition. (a) Sending-end system frequency, (b) active power of WF, and (c) active power of HVDC, (d) frequency response output of sending-end system.
Figure 15.
Simulation results under low wind power permeability and low wind speed condition. (a) Sending-end system frequency, (b) active power of WF, and (c) active power of HVDC, (d) frequency response output of sending-end system.
Figure 16.
Active power and rotor speed of WTs in each subarea. (a) Active power of WTs in R1, (b) rotor speed of WTs in R1, (c) active power of WTs in R2, (d) rotor speed of WTs in R2, (e) active power of WTs in R3, and (f) rotor speed of WTs in R3.
Figure 16.
Active power and rotor speed of WTs in each subarea. (a) Active power of WTs in R1, (b) rotor speed of WTs in R1, (c) active power of WTs in R2, (d) rotor speed of WTs in R2, (e) active power of WTs in R3, and (f) rotor speed of WTs in R3.
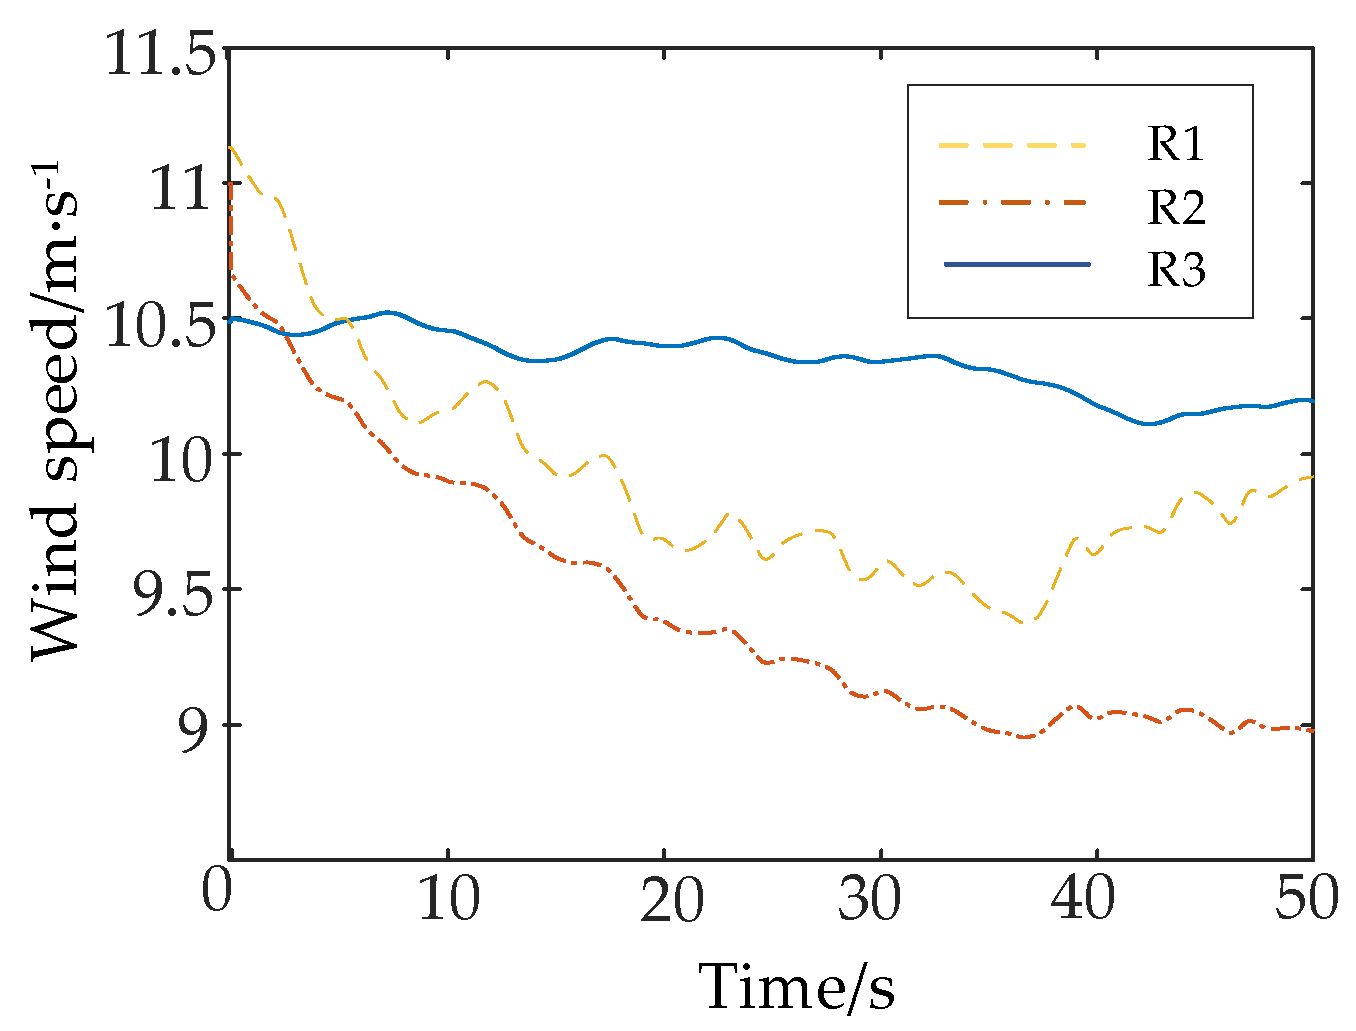
Figure 17.
Wind speed curves of variable wind speeds in different subareas of WF.
Figure 17.
Wind speed curves of variable wind speeds in different subareas of WF.
Figure 18.
Simulation results under middle wind power permeability and variable wind speed condition. (a) Sending-end system frequency, (b) active power of WF, and (c) active power of HVDC, (d) frequency response output of sending-end system.
Figure 18.
Simulation results under middle wind power permeability and variable wind speed condition. (a) Sending-end system frequency, (b) active power of WF, and (c) active power of HVDC, (d) frequency response output of sending-end system.
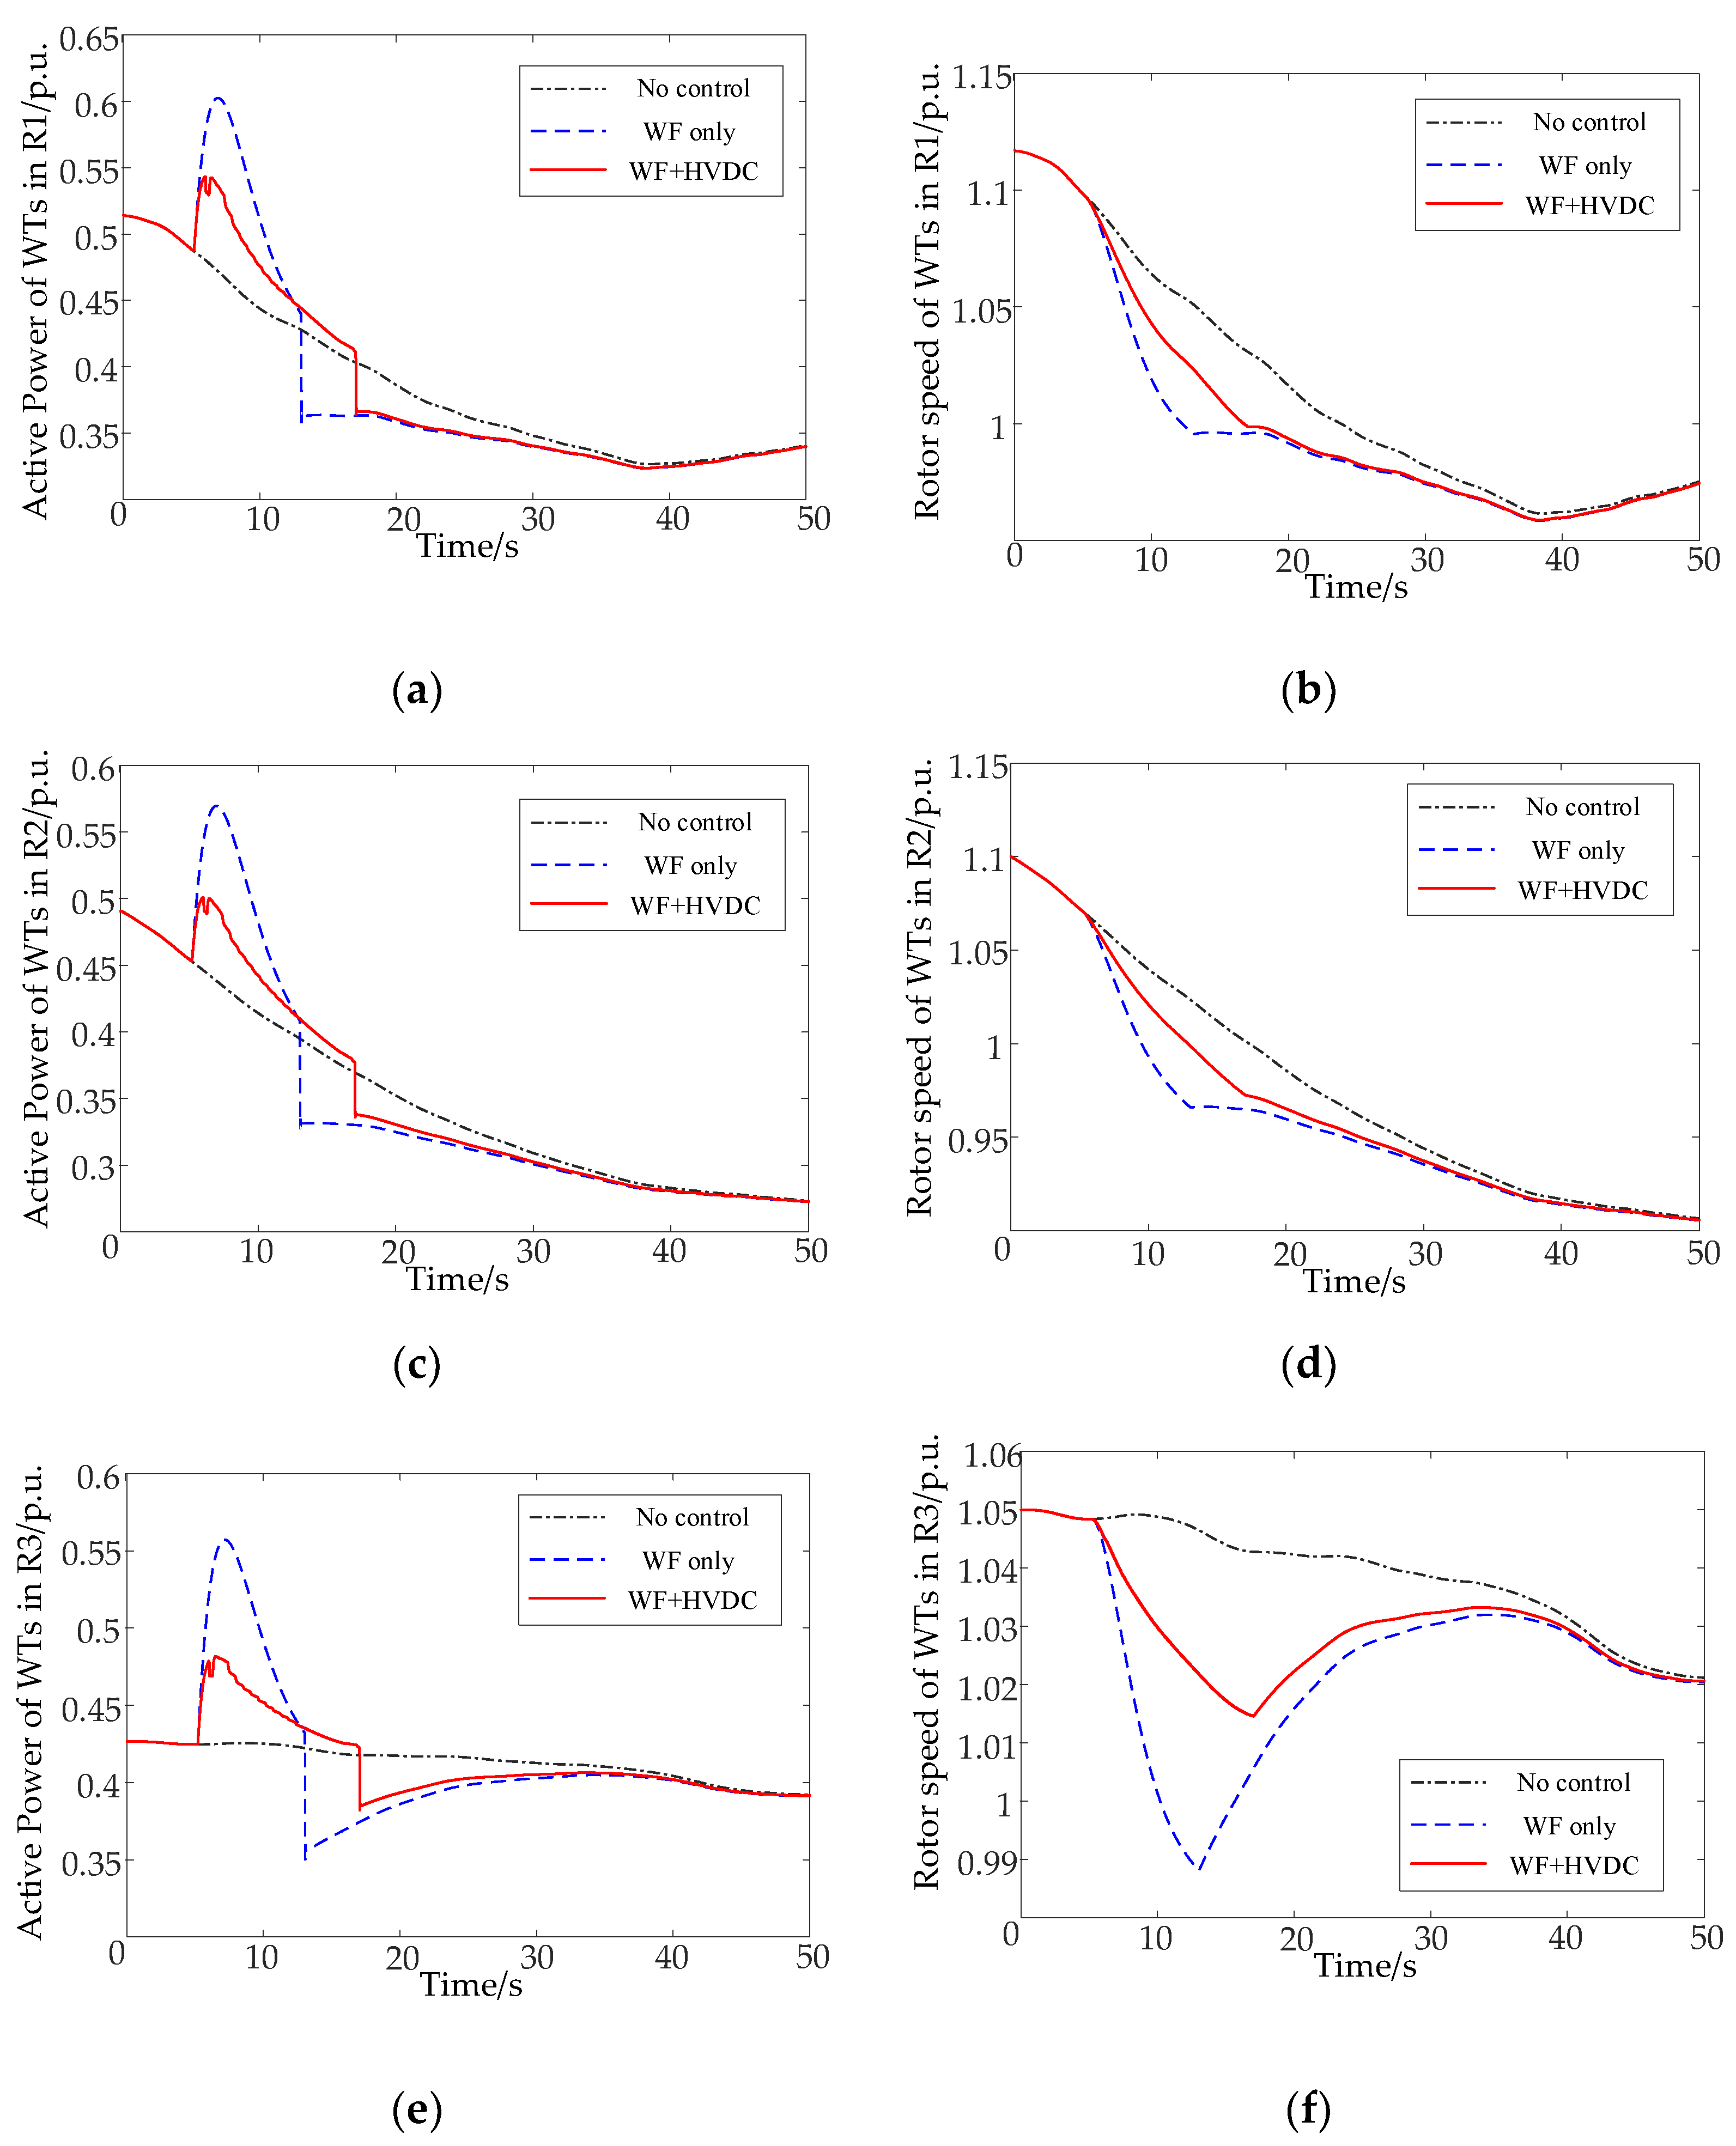
Figure 19.
Active power and rotor speed of WTs in each subarea. (a) Active power of WTs in R1, (b) rotor speed of WTs in R1, (c) active power of WTs in R2, (d) rotor speed of WTs in R2, (e) active power of WTs in R3, and (f) rotor speed of WTs in R3.
Figure 19.
Active power and rotor speed of WTs in each subarea. (a) Active power of WTs in R1, (b) rotor speed of WTs in R1, (c) active power of WTs in R2, (d) rotor speed of WTs in R2, (e) active power of WTs in R3, and (f) rotor speed of WTs in R3.
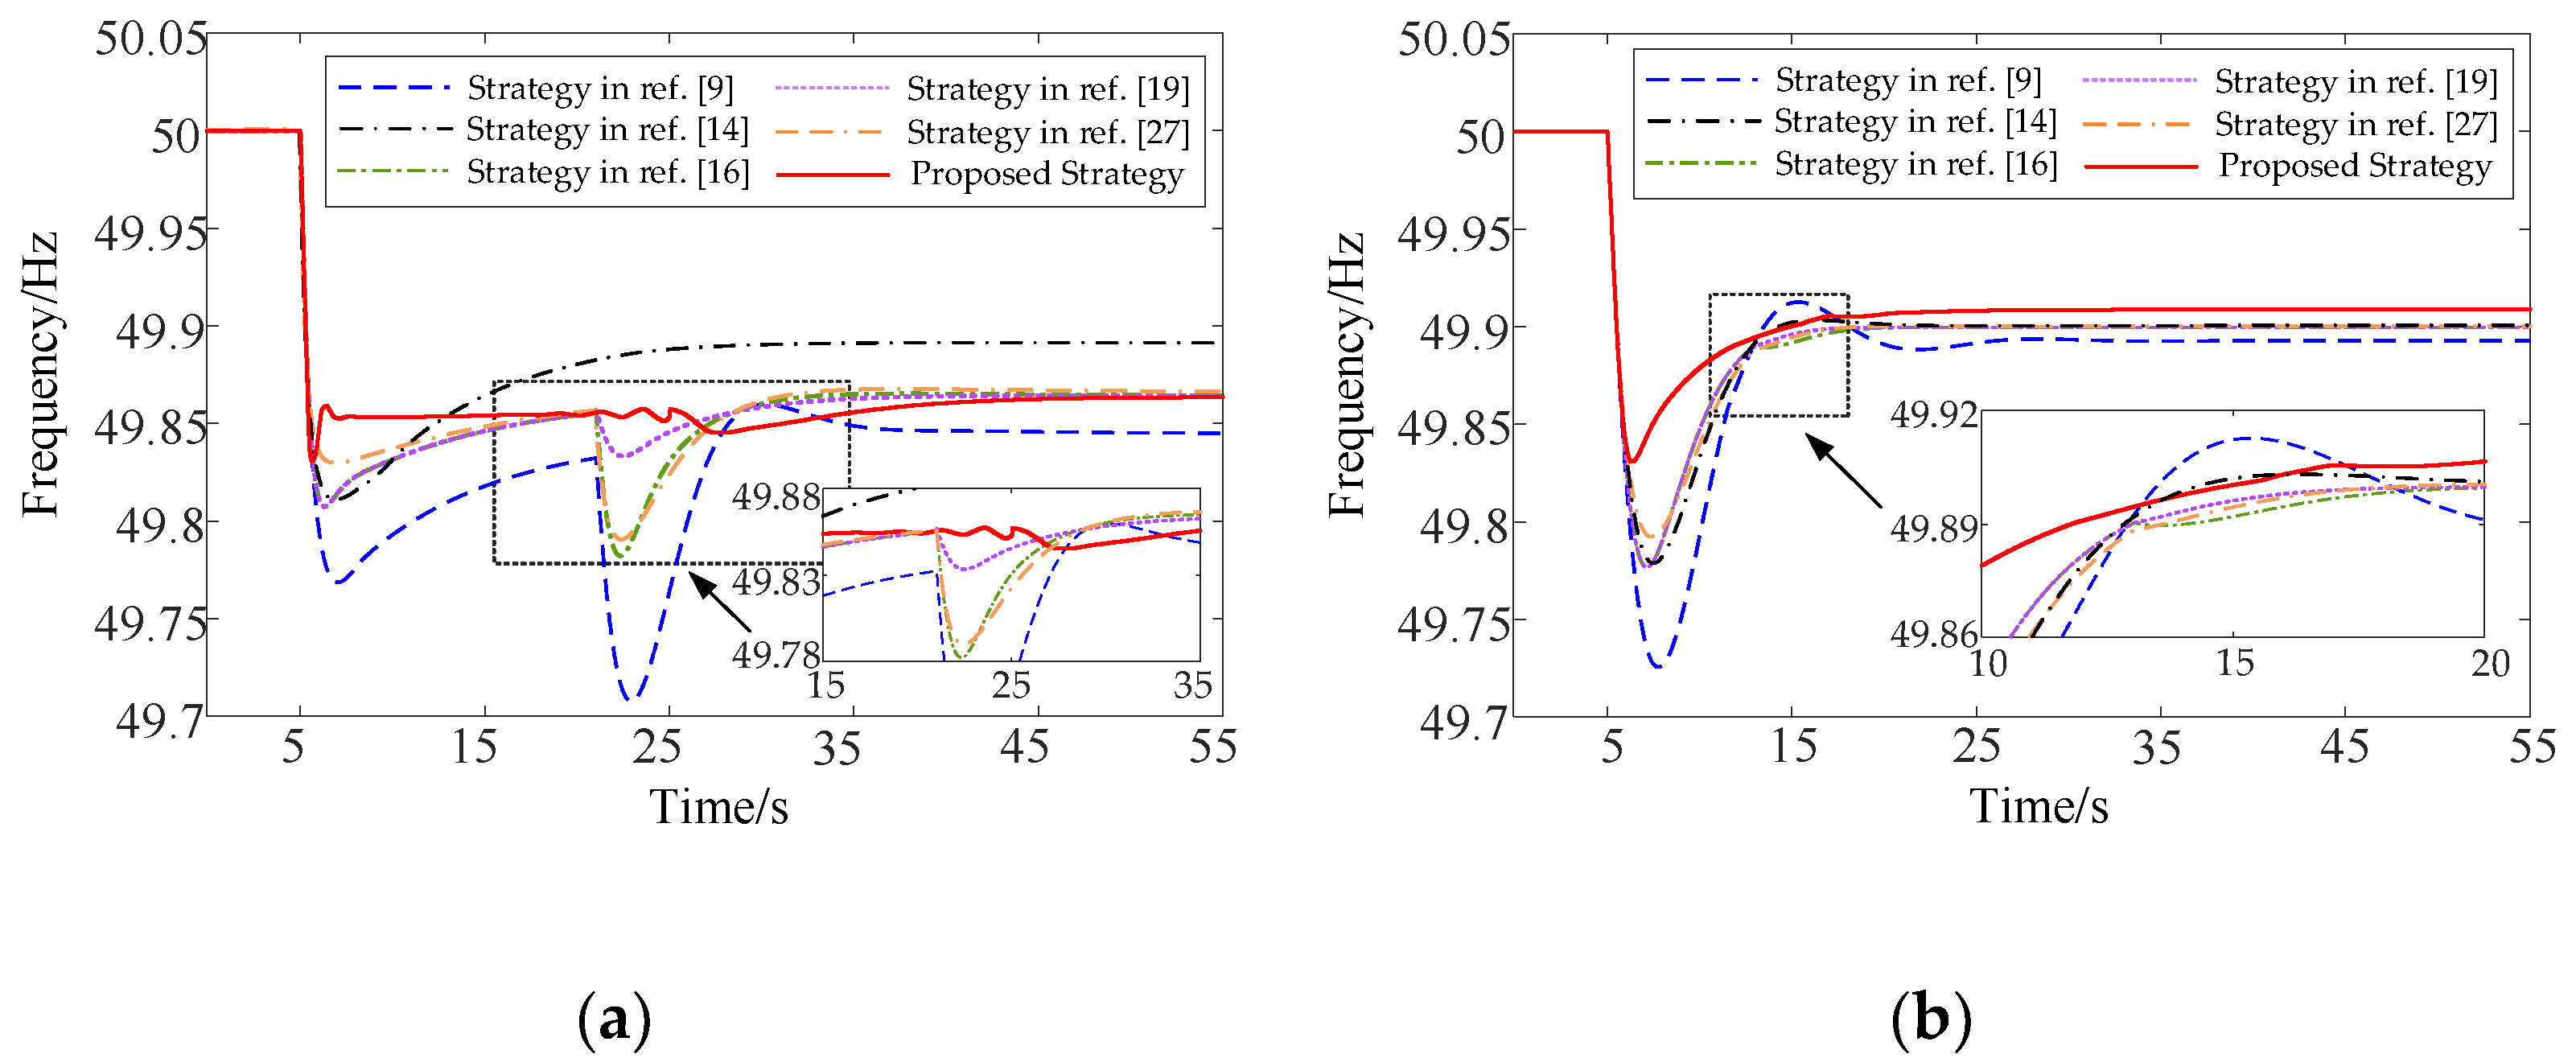
Figure 20.
Sending-end system frequency. (a) Sending-end system frequency based on the operating conditions of Case 1 and (b) sending-end system frequency based on the operating conditions of Case 2.
Figure 20.
Sending-end system frequency. (a) Sending-end system frequency based on the operating conditions of Case 1 and (b) sending-end system frequency based on the operating conditions of Case 2.
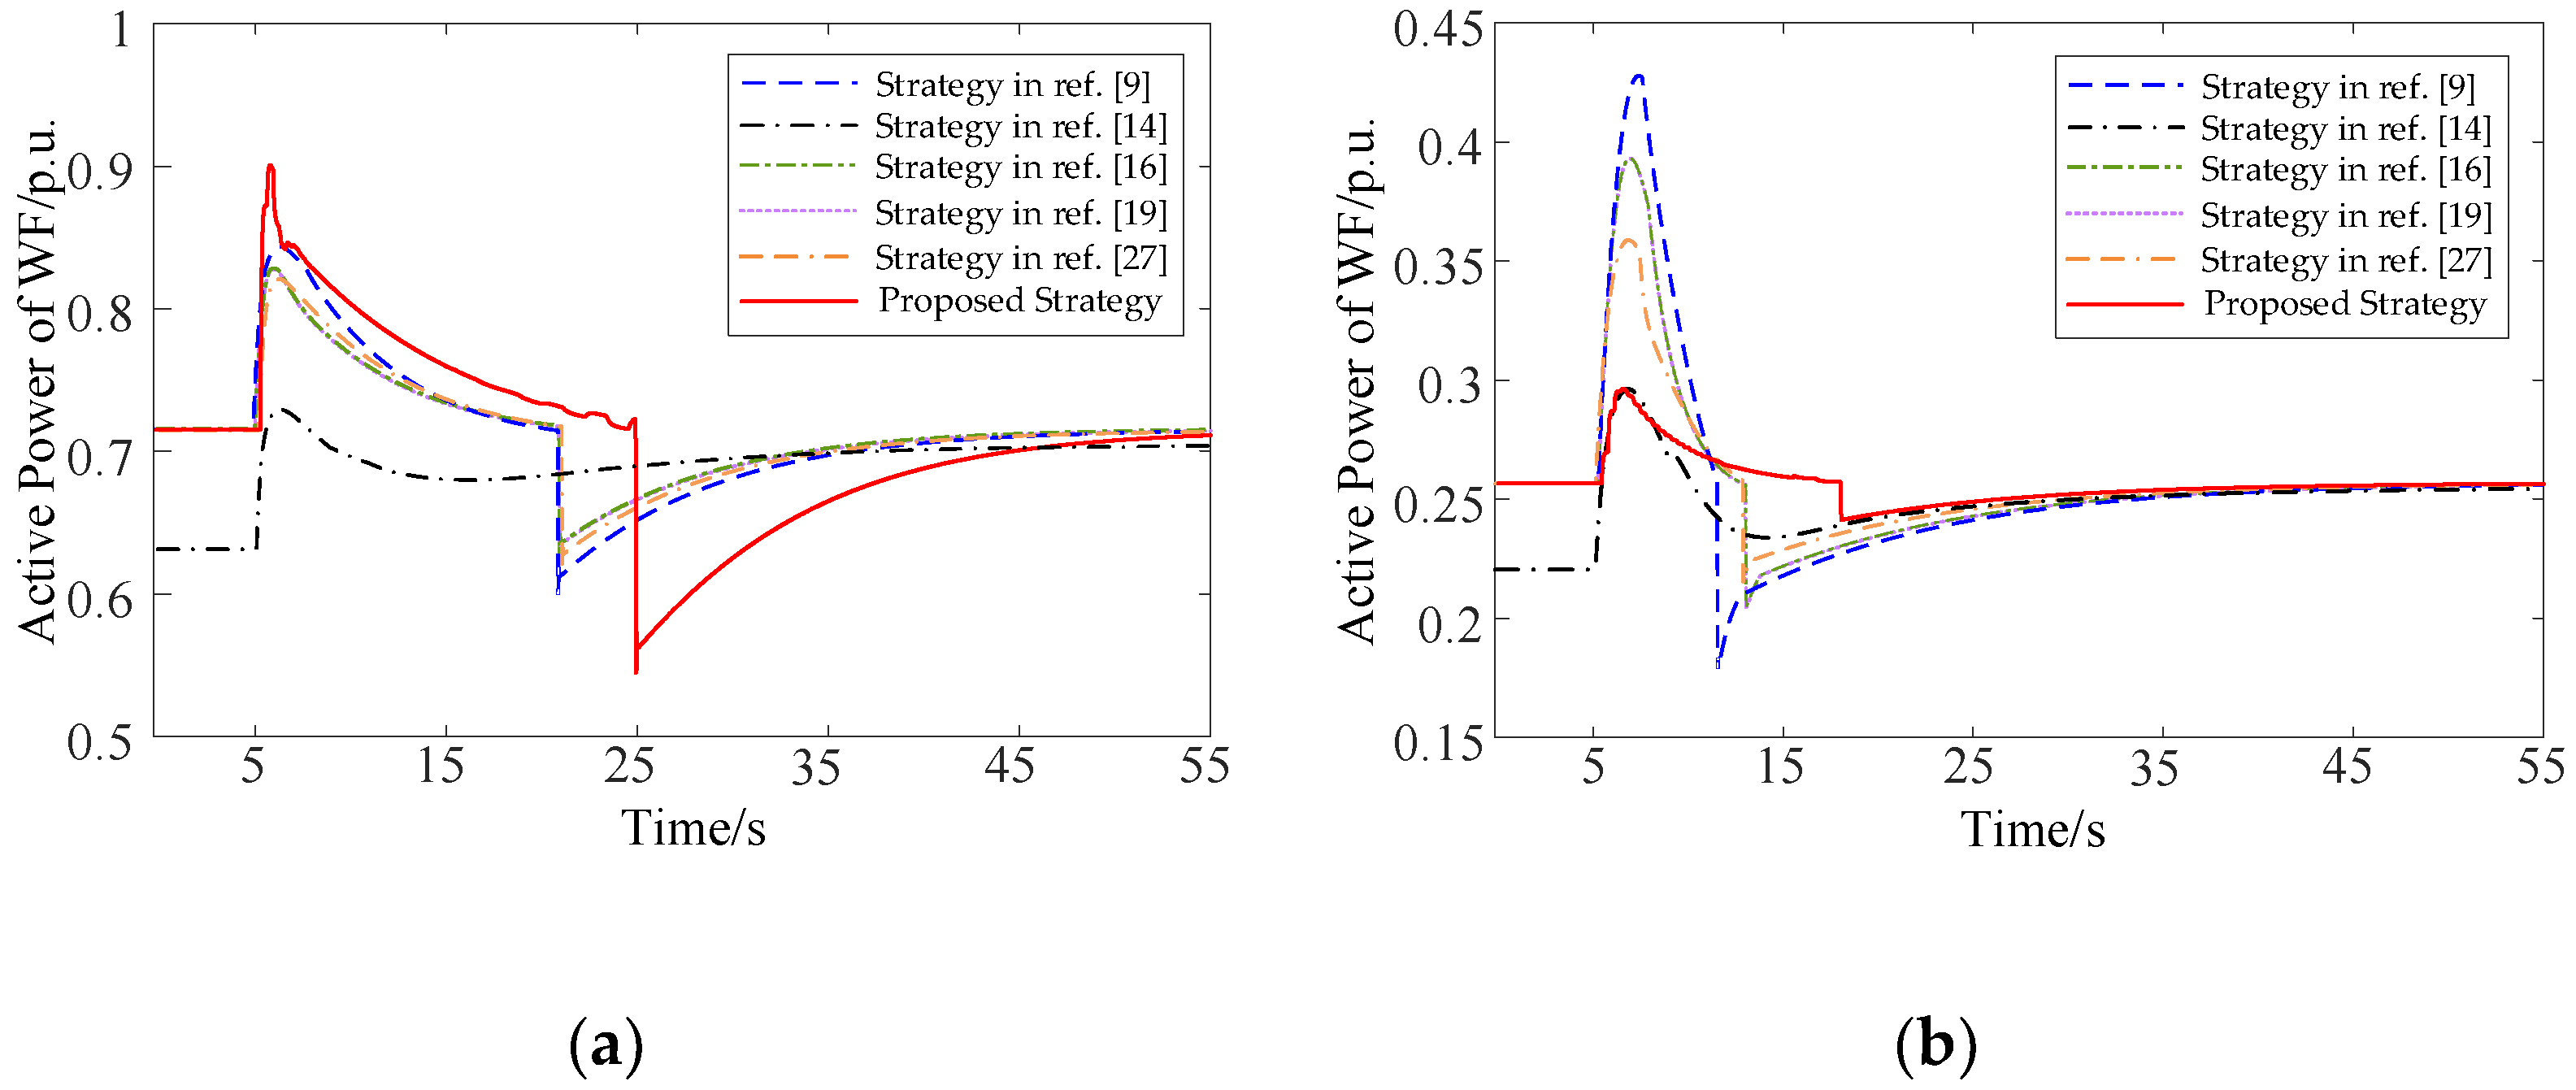
Figure 21.
Active power of WF. (a) Active power of WF based on the operating conditions of Case 1 and (b) active power of WF based on the operating conditions of Case 2.
Figure 21.
Active power of WF. (a) Active power of WF based on the operating conditions of Case 1 and (b) active power of WF based on the operating conditions of Case 2.
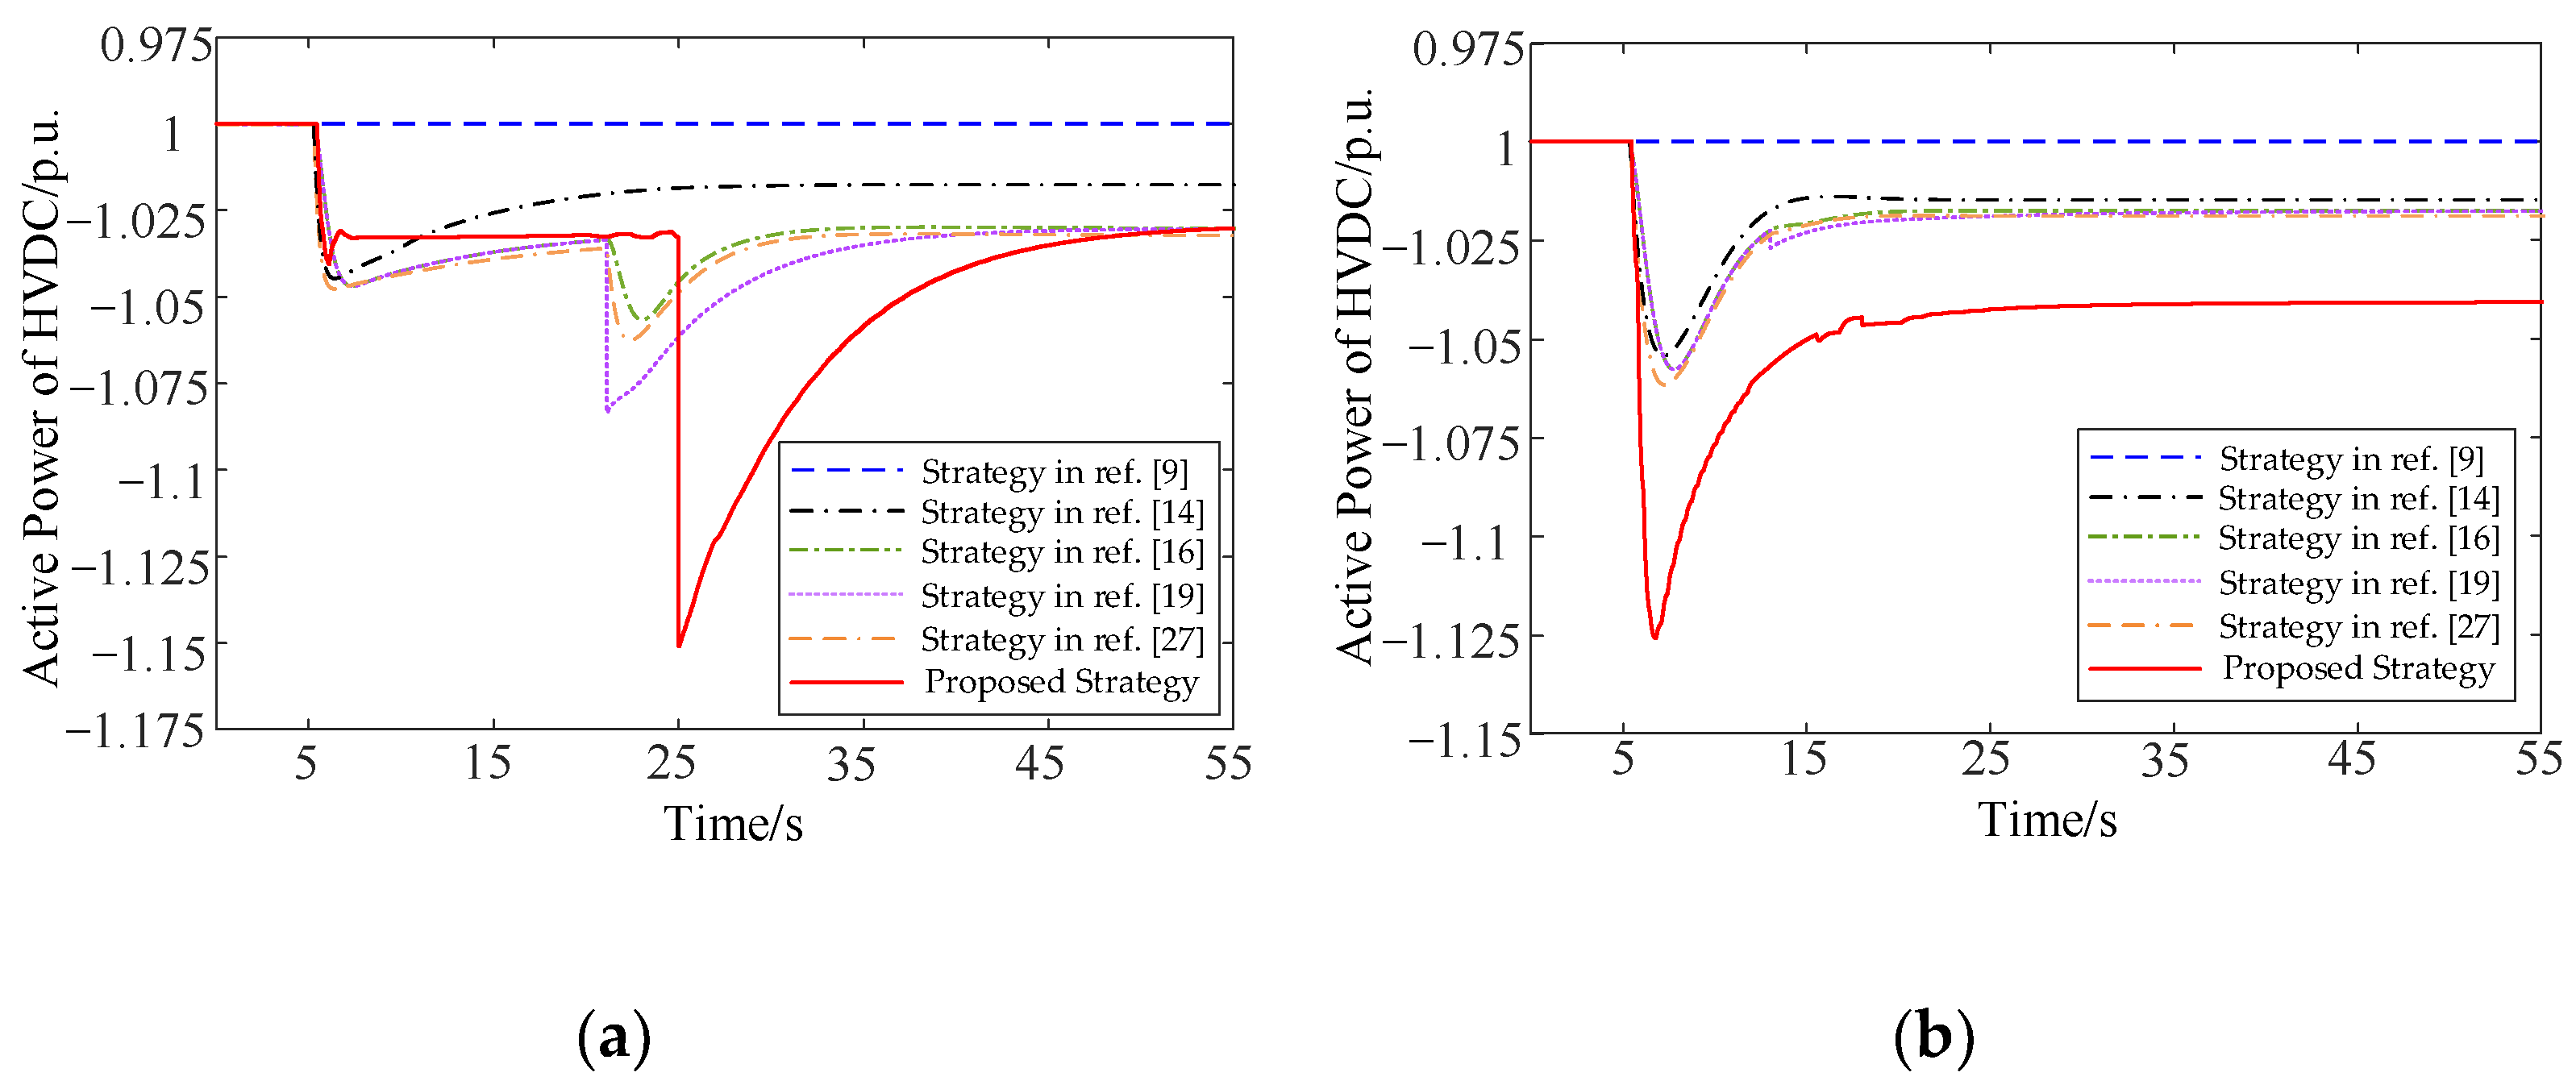
Figure 22.
Active power of HVDC. (a) Active power of HVDC based on the operating conditions of Case 1 and (b) active power of HVDC based on the operating conditions of Case 2.
Figure 22.
Active power of HVDC. (a) Active power of HVDC based on the operating conditions of Case 1 and (b) active power of HVDC based on the operating conditions of Case 2.
Table 1.
The rules of FLC-1.
Table 1.
The rules of FLC-1.
| Δf | df/dt |
|---|
| NL | NM | NS | Z | PS | PM | PL |
|---|
| VS | L | L | M | S | MS | MS | VS |
| MS | ML | L | L | M | S | S | MS |
| S | VL | ML | L | L | M | S | S |
| M | VL | VL | ML | L | M | M | S |
| L | VL | VL | VL | ML | L | M | M |
| ML | VL | VL | VL | ML | ML | L | M |
| VL | VL | VL | VL | VL | ML | ML | L |
Table 2.
The rules of FLC-2.
Table 2.
The rules of FLC-2.
| αw | Vw |
|---|
| VS | MS | S | M | L | ML | VL |
|---|
| VS | VS | VS | VS | VS | S | S | VS |
| S | VS | VS | VS | S | M | M | VS |
| M | VS | VS | S | M | L | L | S |
| L | VS | S | S | M | L | VL | S |
| VL | S | S | M | L | VL | VL | M |
Table 3.
Parameters of the test system. (a) Parameters of the SG, (b) parameters of the HVDC system, and (c) parameters of the DFIG.
Table 3.
Parameters of the test system. (a) Parameters of the SG, (b) parameters of the HVDC system, and (c) parameters of the DFIG.
| (a) |
| System Element | Parameter | Value |
| Synchronous generator | Droop coefficient of steam turbine RG | 5% |
| Inertia constant HSG | 5 s |
| Rated frequency | 50 Hz |
| Dead band fdb_steam | ±0.033 Hz |
| Inlet chamber time constant TH | 0.28 s |
| Crossover time constant TCH | 4 s |
| Reheater time constant TRH | 0.3 s |
| Power coefficient of cylinder FHP | 0.5 |
| (b) |
| System Element | Parameter | Value |
| HVDC system | Capacity | 1200 MW |
| Rate DC voltage | ±500 kV |
| Cable length | 100 km |
| Cable resistance | 0.05 Ω/km |
| (c) |
| System Element | Parameter | Value |
| DFIG | Capacity | 5.5 MW |
| Rate voltage | 0.69 kV |
| Rate output power | 5 MW |
| Inertia constant HWT | 4.6 s |
| Rate rotor speed | 1.2 p.u. |
Table 4.
Frequency control methods of HVDC and WF in different control strategies.
Table 4.
Frequency control methods of HVDC and WF in different control strategies.
| Strategies | Frequency Control Method |
|---|
| HVDC | WF |
|---|
| No control | No supplementary frequency control | No supplementary frequency control |
| WF only | No supplementary frequency control | Comprehensive control |
| WF + HVDC | Proposed coordinated frequency control | Proposed coordinated frequency control |
Table 5.
Simulation results under high wind power permeability and high wind speed conditions.
Table 5.
Simulation results under high wind power permeability and high wind speed conditions.
| Strategies | fnadir/Hz | tnadir/s | fnadir_SFD/Hz | tnadir_SFD/s |
|---|
| No control | 49.59 | 7.50 | / | / |
| WF only | 49.77 | 7.04 | 49.71 | 23.09 |
| WF + HVDC | 49.83 | 5.64 | 49.85 | 27.60 |
Table 6.
Simulation results under low wind power permeability and low wind speed condition.
Table 6.
Simulation results under low wind power permeability and low wind speed condition.
| Strategies | fnadir/Hz | tnadir/s | fnadir_SFD/Hz | tnadir_SFD/s |
|---|
| No control | 49.69 | 7.85 | / | / |
| WF only | 49.73 | 7.82 | / | / |
| WF + HVDC | 49.83 | 6.39 | / | / |
Table 7.
Simulation results under middle wind power permeability and variable wind speed condition.
Table 7.
Simulation results under middle wind power permeability and variable wind speed condition.
| Strategies | fnadir/Hz | tnadir/s | fnadir_SFD/Hz | tnadir_SFD/s |
|---|
| No control | 49.66 | 7.87 | / | / |
| WF only | 49.74 | 7.61 | 49.82 | 15.10 |
| WF + HVDC | 49.84 | 6.52 | 49.88 | 18.10 |
Table 8.
Control strategies of a HVDC-WF system for frequency response.
Table 8.
Control strategies of a HVDC-WF system for frequency response.
| Strategies | Frequency Control Method |
|---|
| HVDC | WF |
|---|
| Strategy in ref. [9] | No supplementary frequency control | Comprehensive control |
| Strategy in ref. [14] | Frequency derivative droop control | De-loading control |
| Strategy in ref. [16] | Frequency deviation droop control | Comprehensive control |
| Strategy in ref. [19] | Back-up frequency response control with power compensation | Comprehensive control |
| Strategy in ref. [27] | Adaptive frequency regulation control | Adaptive frequency regulation control |
| Proposed strategy | Proposed coordinated frequency control | Proposed coordinated frequency control |
Table 9.
Simulation results of different control strategies based on the operating conditions of Case 1 and Case 2.
Table 9.
Simulation results of different control strategies based on the operating conditions of Case 1 and Case 2.
| Operation Condition | Strategies | fnadir/Hz | tnadir/s | fnadir_SFD/Hz | tnadir_SFD/s |
|---|
| Case 1 | Strategy in ref. [9] | 49.77 | 7.04 | 49.71 | 23.09 |
| Strategy in ref. [14] | 49.81 | 7.33 | / | / |
| Strategy in ref. [16] | 49.81 | 6.33 | 49.78 | 22.40 |
| Strategy in ref. [19] | 49.81 | 6.33 | 49.83 | 22.50 |
| Strategy in ref. [27] | 49.83 | 7.01 | 49.79 | 22.62 |
| Proposed strategy | 49.83 | 5.64 | 49.85 | 27.60 |
| Case 2 | Strategy in ref. [9] | 49.73 | 7.82 | / | / |
| Strategy in ref. [14] | 49.78 | 7.61 | / | / |
| Strategy in ref. [16] | 49.78 | 7.18 | 49.88 | 13.95 |
| Strategy in ref. [19] | 49.78 | 7.18 | / | / |
| Strategy in ref. [27] | 49.79 | 7.40 | / | / |
| Proposed strategy | 49.83 | 6.39 | / | / |
Table 10.
Frequency response output of different control strategies based on the operating conditions of Case 1 and Case 2.
Table 10.
Frequency response output of different control strategies based on the operating conditions of Case 1 and Case 2.
| Operation Condition | Strategies | ΔPWF_max/p.u. | tWF_max/s | ΔPDC_max/p.u. | tDC_max/s |
|---|
| Case 1 | Strategy in ref. [9] | 0.128 | 6.93 | / | / |
| Strategy in ref. [14] | 0.098 | 6.34 | 0.045 | 6.42 |
| Strategy in ref. [16] | 0.112 | 6.38 | 0.055 | 23.00 |
| Strategy in ref. [19] | 0.112 | 6.38 | 0.083 | 21.00 |
| Strategy in ref. [27] | 0.107 | 6.31 | 0.062 | 22.30 |
| Proposed strategy | 0.183 | 5.94 | 0.151 | 25.00 |
| Case 2 | Strategy in ref. [9] | 0.156 | 7.58 | / | / |
| Strategy in ref. [14] | 0.088 | 7.09 | 0.054 | 7.23 |
| Strategy in ref. [16] | 0.136 | 7.02 | 0.058 | 7.93 |
| Strategy in ref. [19] | 0.136 | 7.02 | 0.058 | 7.93 |
| Strategy in ref. [27] | 0.102 | 7.12 | 0.062 | 7.16 |
| Proposed strategy | 0.037 | 6.60 | 0.125 | 6.78 |


