1. Introduction
The Sønderborg geothermal plant is one of three plants (Thisted, Margretheholm, Sønderborg) in Denmark [
1], located northeast of Sønderborg towards Augustenborg Fjord [
2]. The location of the Sønderborg geothermal plant was based on the data from the geothermal wells rather than a geological screening forecast. In other words, the economic calculations were based on the actual measured values, such as depth, temperature, estimated reservoir parameters, and core material from other boreholes [
3].
The geothermal production from the Sønderborg plant started in the spring of 2013 from the sandstones of the Gassum formation (Upper Triassic-Lower Jurassic) at a depth of about 1250 m TVD [
4]. The geothermal fluid is extracted with an average temperature of around 48 °C and a salinity of 15% to produce heat which is distributed to the district heating system [
5]. This plant was designed to produce up to 12 MW from the geothermal fluid using adsorption heat pumps [
1], which are powered by a boiler unit with two woodchip fired boilers. The combination of geothermal energy and woodchips has therefore reduced the CO
2 emissions from the district heating production. At the beginning of the project, the CO
2 emissions were reduced from 58,000 to 4800 tons annually, which is more than 90% if we consider woodchips as a CO
2 neutral. This huge reduction in the climate gas emissions from the district heating production could support the Sønderborg municipality’s ambitious goal of CO
2 neutrality by 2029 [
6]. However, due to different technical problems, the Sønderborg plant stopped producing heat from geothermal fluid in December 2018 [
7].
Objectives
The present research is aimed at showing the field experience of the Sønderborg geothermal plant in which pronounced injectivity problems have been observed. This work gives an overview of the regional and local geology, construction of the wells and field experience. An improved understanding of the reinjection problems during heat-mining in low-temperature geothermal plants is given by an evaluation of the water chemistry and PHREEQC chemical speciation simulations in a time-scale perspective.
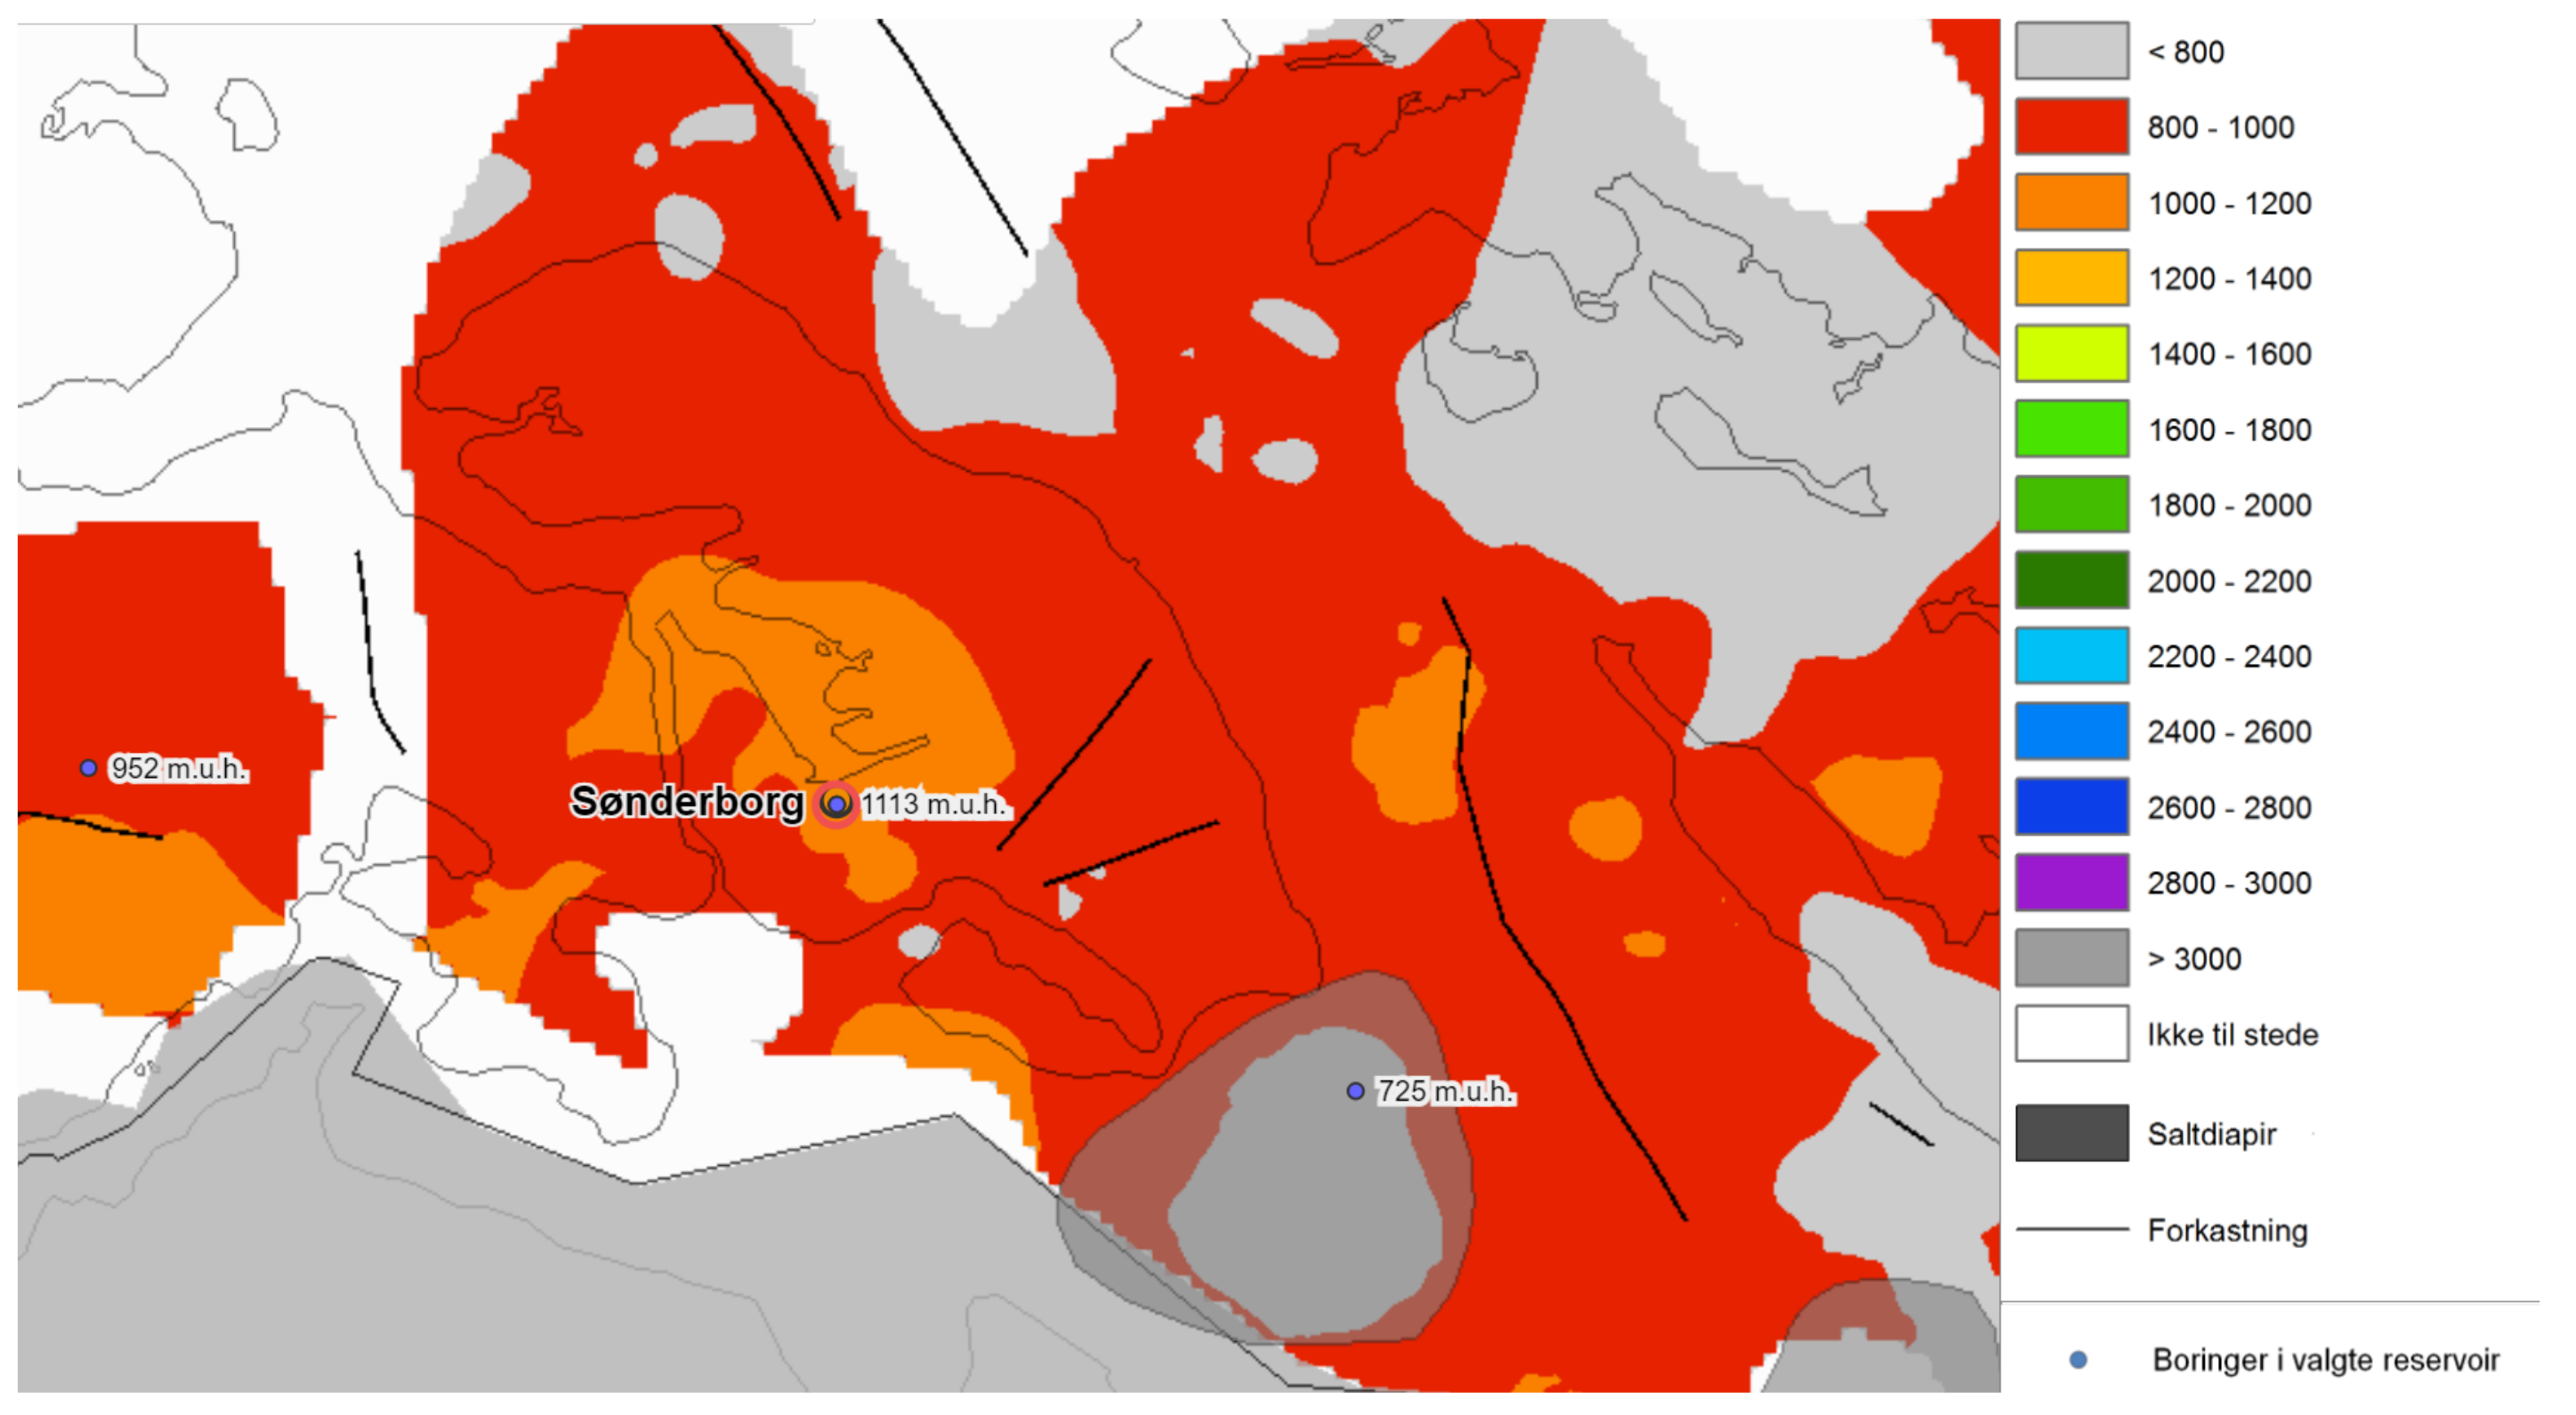
2. Geological Setting
The Sønderborg area is located south of Ringkøbing – Fyn High in the North German Basin [
2]. The producing reservoir for geothermal extraction belongs to the Upper Triassic-Lower Jurassic Gassum formation as shown in
Figure 1 [
1,
8].The formation extends to the northwest out into the North Sea area. Larsen [
9] interpreted the depositional environment of the Gassum formation as deltaic. Subsequent, Bertelsen [
10] subdivided the Gassum formation into three members based on a re-evaluation of existing wire-line logs, lithological and biostratigraphical reports. The lower G-1 member is an upwards coarsening unit of claystone, siltstone, and relatively well-sorted, fine- to coarse-grained sand with angular to sub-angular grain forms. The overlying G-2 member is dominated by claystone with minor siltstone and fine-grained sandstone. The G-3 member is dominated by well-sorted, fine-grained sand with angular to sub-rounded grain shapes (in places with coal fragments). This member ranges from silty claystone to fine-grained sandstone and siltstone [
2,
11].
According to Vosgerau et al. [
8], the Gassum formation can be considered to be the best-known sandstone reservoir in Denmark with an overall thickness of 30–150 m and excellent rock properties. This formation is dominated by fine to medium-grained light gray sandstones, alternating with darker-colored mudstones/siltstones and locally thin coal seams [
13]. After an initial deposition of Rotliegend coarse-grained clastic sediments in the northern Germany Basin, a long period of subsidence occurred where thick deposits of Zechstein salt were formed followed by deposition of sand, mud, carbonate, and fewer salt formations in the Triassic and Early Jurassic [
2]. During those periods, large amounts of sand eroded from the Scandinavian basement area and locally from the Ringkøbing–Fyn High were transported by rivers to the subsiding Danish area. The sand was deposited as marine shoreface, forming relatively continuous and widely distributed sandstone bodies. It was also deposited in river channels, estuaries and lagoons [
14]. The succeeding fault activity that split up the sandstone bodies and diagenetic processes (compaction, mineral precipitation, and dissolution) impacted significantly the reservoir properties [
2].
A report presented by Vosgerau et al. [
2] indicates that the potential geothermal sandstone reservoirs in the southern part of Denmark are present in the Lower Triassic Bunter Sandstone Formation and in the Upper Triassic–Lower Jurassic Gassum formation. Both reservoirs were the primary target for geothermal extraction in the Sønderborg area. However, during the drilling operations for the geothermal well (Sønderborg-1), the Bunter formation was not encountered and therefore the Gassum formation was the only one tested [
1]. Geological Survey of Denmark and Greenland (GEUS) interpreted the rock composition within Gassum formation for the Sønderborg area based on a log interpretation of lithology, which was confirmed by the drilling cuttings. In the Gassum formation, the lower G-1 member and the upper G-3 member are of great interest because of the rock properties [
2].
3. Wellsite Construction
The Danish Oil and Natural Gas A/S (DONG) group (now Oersted A/S) was granted with a license to explore and exploit the Danish geothermal resources in 1977. The outcomes from the first drilling activities in Års, Farsø in Himmerland were disappointing. This is because a poor rock conductivity made it impossible to produce 100 °C geothermal water discovered at 3000 m. However, a sandstone layer (Gassum formation) with good rock properties at 1250 m was found in Thisted. A pilot project in that location was established in 1984 by DONG, which was expanded to the current plant in 1988 [
15]. A renewed campaign of DONG VE A/S assisted by GEUS was initiated with financial support from the European Union, which resulted in the Margretheholm and Sønderborg geothermal plants [
4]. The license for exploration and production of geothermal energy in the Sønderborg area was granted to Sønderborg Fjernvarme and DONG Energy in 2007 [
6]. The same year, as the first phase of the project, a new seismic survey was completed, which indicated that the two wells (injector and producer) should be placed outside the town [
1].
The drilling activities of the two wells, doublet type, started (spud) in March 2010. The primary target was a formation of the Lower Cretaceous (Bunter sandstone) that was expected to be encountered at 2100 m. It was planned to produce 15 MW heat from 250 m
3/h of around 68 °C, 21% saline geothermal water [
16]. Initially, a deviated well to a vertical depth of 2401 meters was drilled and the Bunter formation was not found. Thereafter, 150 m of the Zechstein formation was encountered. This means that the target, the Bunter formation, was not present at the drilled location. Therefore, as the intersected Gassum formation was expected to have been damaged by the high mud weight, it was decided to side-track the well and use the shallower Gassum sandstone formation at around 1100 m TVD [
17].
Gamma-ray (GR), potential reservoir sand (PRS), porosity (PHIE) and permeability (PERM) well logs were acquired for Sønderborg 1-A (injector), whereas GR was the only one registered for Sønderborg 2 (producer). The petrophysical log interpretation for Sønderborg 1-A and Sønderborg can be found in Vosgerau et al. [
2]. Based on those well logs, it was possible to interpret porosity and the thickness of both gross sand and the potential reservoir for Sønderborg-1. On the other hand, only the lithology and thickness of gross sand was interpreted for Sønderborg-2 since only a few logs were run.
The results from the petrophysical interpretation within the Gassum formation and subdivision for both Sønderborg 1-A and Sønderborg 2 wells is presented in
Table 1. In the mentioned table, the gross thickness (zone that has a clay content of less than 30%) was determined assuming that the amount of clay is proportional to the response of the gamma log minus the background radiation. The net thickness, on the other hand, was based on a porosity cut-off of >15% corresponding to a permeability of 2.5 mD by the help of a modeling software. In addition, cemented intervals and coals were removed from the net reservoir as well. The porosity (
) was determined by a clay-corrected density log and a density of 2.65 g/cm
[
2,
17,
18]. As observed in
Table 1, the net reservoir thickness is 39 and 40 m for Sønderborg-1A and Sønderborg-2, respectively. Those values indicate that basically, all sand present in Gassum formation constitutes potential reservoir sand that is displayed as different zones: upper sandstone (USd), lower sandstone (LSd) and shale (Sh). Consequently, the reservoir for Sønderborg-1A and Sønderborg-2 comprises two sand units separated by a claystone sequence. The depths for those zones in MDRT (measured depth below rotary table) and TVDMSL (true vertical depth referenced to mean sea level) are:
Sønderborg 1-A
Upper sand unit, USd: 1148-1170 m MDRT (1106-1125 m TVDMSL)
Lower sand unit, LSd: 1196-1216 m MDRT (1148-1166 m TVDMSL)
Sønderborg 2
Upper sand unit, USd: 1288-1304m MDRT (1147-1161 m TVDMSL)
Lower sand unit, LSd: 1343-1365 m MDRT (1194- 1213 m TVDMSL)
The stratigraphic interpretation for the Sønderborg wells was based on the findings from the drilling operation and on the biostratigraphic analyses. Therefore, it constitutes an updated zonation of the Gassum formation in the Sønderborg area. It is important to highlight that the zonation presented in
Table 1 is similar to the one presented by Bertelsen [
10]. In other words, USd corresponds to G-1 member, Sh to G-2 member, and LSd to G-3 member.
Both wells were completed with gravel packs, being the separation between them of about 10 m at the surface level and 700 m at reservoir level (1.2 km) [
19]. Different issues during the completion operation in Sønderborg 1-A, such as laborious NaCl salt mixing, no further progress of completion string, and hole filling, made challenging to set the sand screens (7.63
OD, Baker wire-wrapped) in-depth [
17]. On the other hand, it was not sure if the entire sand face was covered or not (lower section of screens left uncovered). This is because the screen out pressure was reached earlier after only 50% of the total theoretical volume [
18]. The casing design and well completions for both wells can be found in
Figure 2.
As observed in
Figure 2, Sønderborg 1-A, and Sønderborg 2 wells have been drilled from larger to smaller holes in four stages (conductor, surface, anchor, and production casings). Wired-wrapped sand screens on a 7
blank pipe were set to depth and gravel-packed. This was done to stabilize the Gassum formation, minimizing the sand movement into the wells.
After completion, Sønderborg-1A, and Sønderborg-2 were tested. The production test was carried out with an electrical submersible pump (ESP) and other equipment such as mobile crane, handling equipment and power tong [
17,
18]. It had a sequence of 2 × 12 h production intervals at 100 m
3/h, each interval was followed by a build-up of 12 h. Moreover, a different sequence was performed in Sønderborg-2 well to further verify its communication with the other well. This sequence was 4 × 2 h production intervals at 100 m
3/h followed by a build-up of 2 h. During the production test for Sønderborg-2, a total of 3200 m
3 was produced. It is important to highlight that the final flow rate for Sønderborg-1A was 93 m
3/h with a total of 760 m
3 flowed/injected.
The interpretation of the test for Sønderborg-1A, and Sønderborg-2 wells is presented in
Table 2. The fluid properties were calculated based on a laboratory analysis of formation water samples done by GEUS, the average gradient was determined using a temperature of 8 °C at surface and the measured temperature of 46.9 °C at 1127.14 m true vertical depth (TVD). Notice that the measured temperature is higher than regional temperature (38.43 °C at 1127.14 m TVD) calculated through an equation presented in [
20].The reason of such variation could be because Sønderborg-1A is located near a major salt structure [
17].
The results for kh and skin factor for the two sand layers (USd and LSd) in the reservoir are presented in
Table 3. As observed, there is a high communication between the two wells but also a large skin factor (especially in the lower layer, +54), affecting in 80% the pressure drawdown [
17,
18]. Those values were estimated based on well log and well testing interpretation using a reservoir model. The achieved rate in the well tests for Sønderborg 1-A was 60 m
3/h, whereas, for Sønderborg 2 was 100 m
3/h. Please note that the uncertainty of kh and skin for Sønderborg 1-A and Sønderborg 2 is large since the production rate of each layer was not measured directly.
When the surface facilities were ready in 2013, a clean-up pumping, and soft acidizing operation was performed using an acid injection unit from the Copenhagen geothermal plant. That unit consisted of a container with a small acid pump and an acid/inhibitor mixing tank. Briefly, the operation to remove the bound carbonate mud cake consisted of pumping geothermal water to a basin and then through the filters together with acid (geothermal brine+15% HCl) into the production well. The injection well was cleaned up in the same way [
1,
21].
4. Geothermal Plant Overview
The surface facilities were installed in Sønderborg between 2012 and 2013, with a heat pump plant located next to the district heating net some kilometers from the geothermal wells. The geothermal plant was designed to produce up to 12 MW from 48 °C highly saline water, 15% NaCl (
w/
v), by using four absorption heat pumps. This geothermal plant only runs in the wintertime, while the heat demand in the summer is covered by waste incineration [
1,
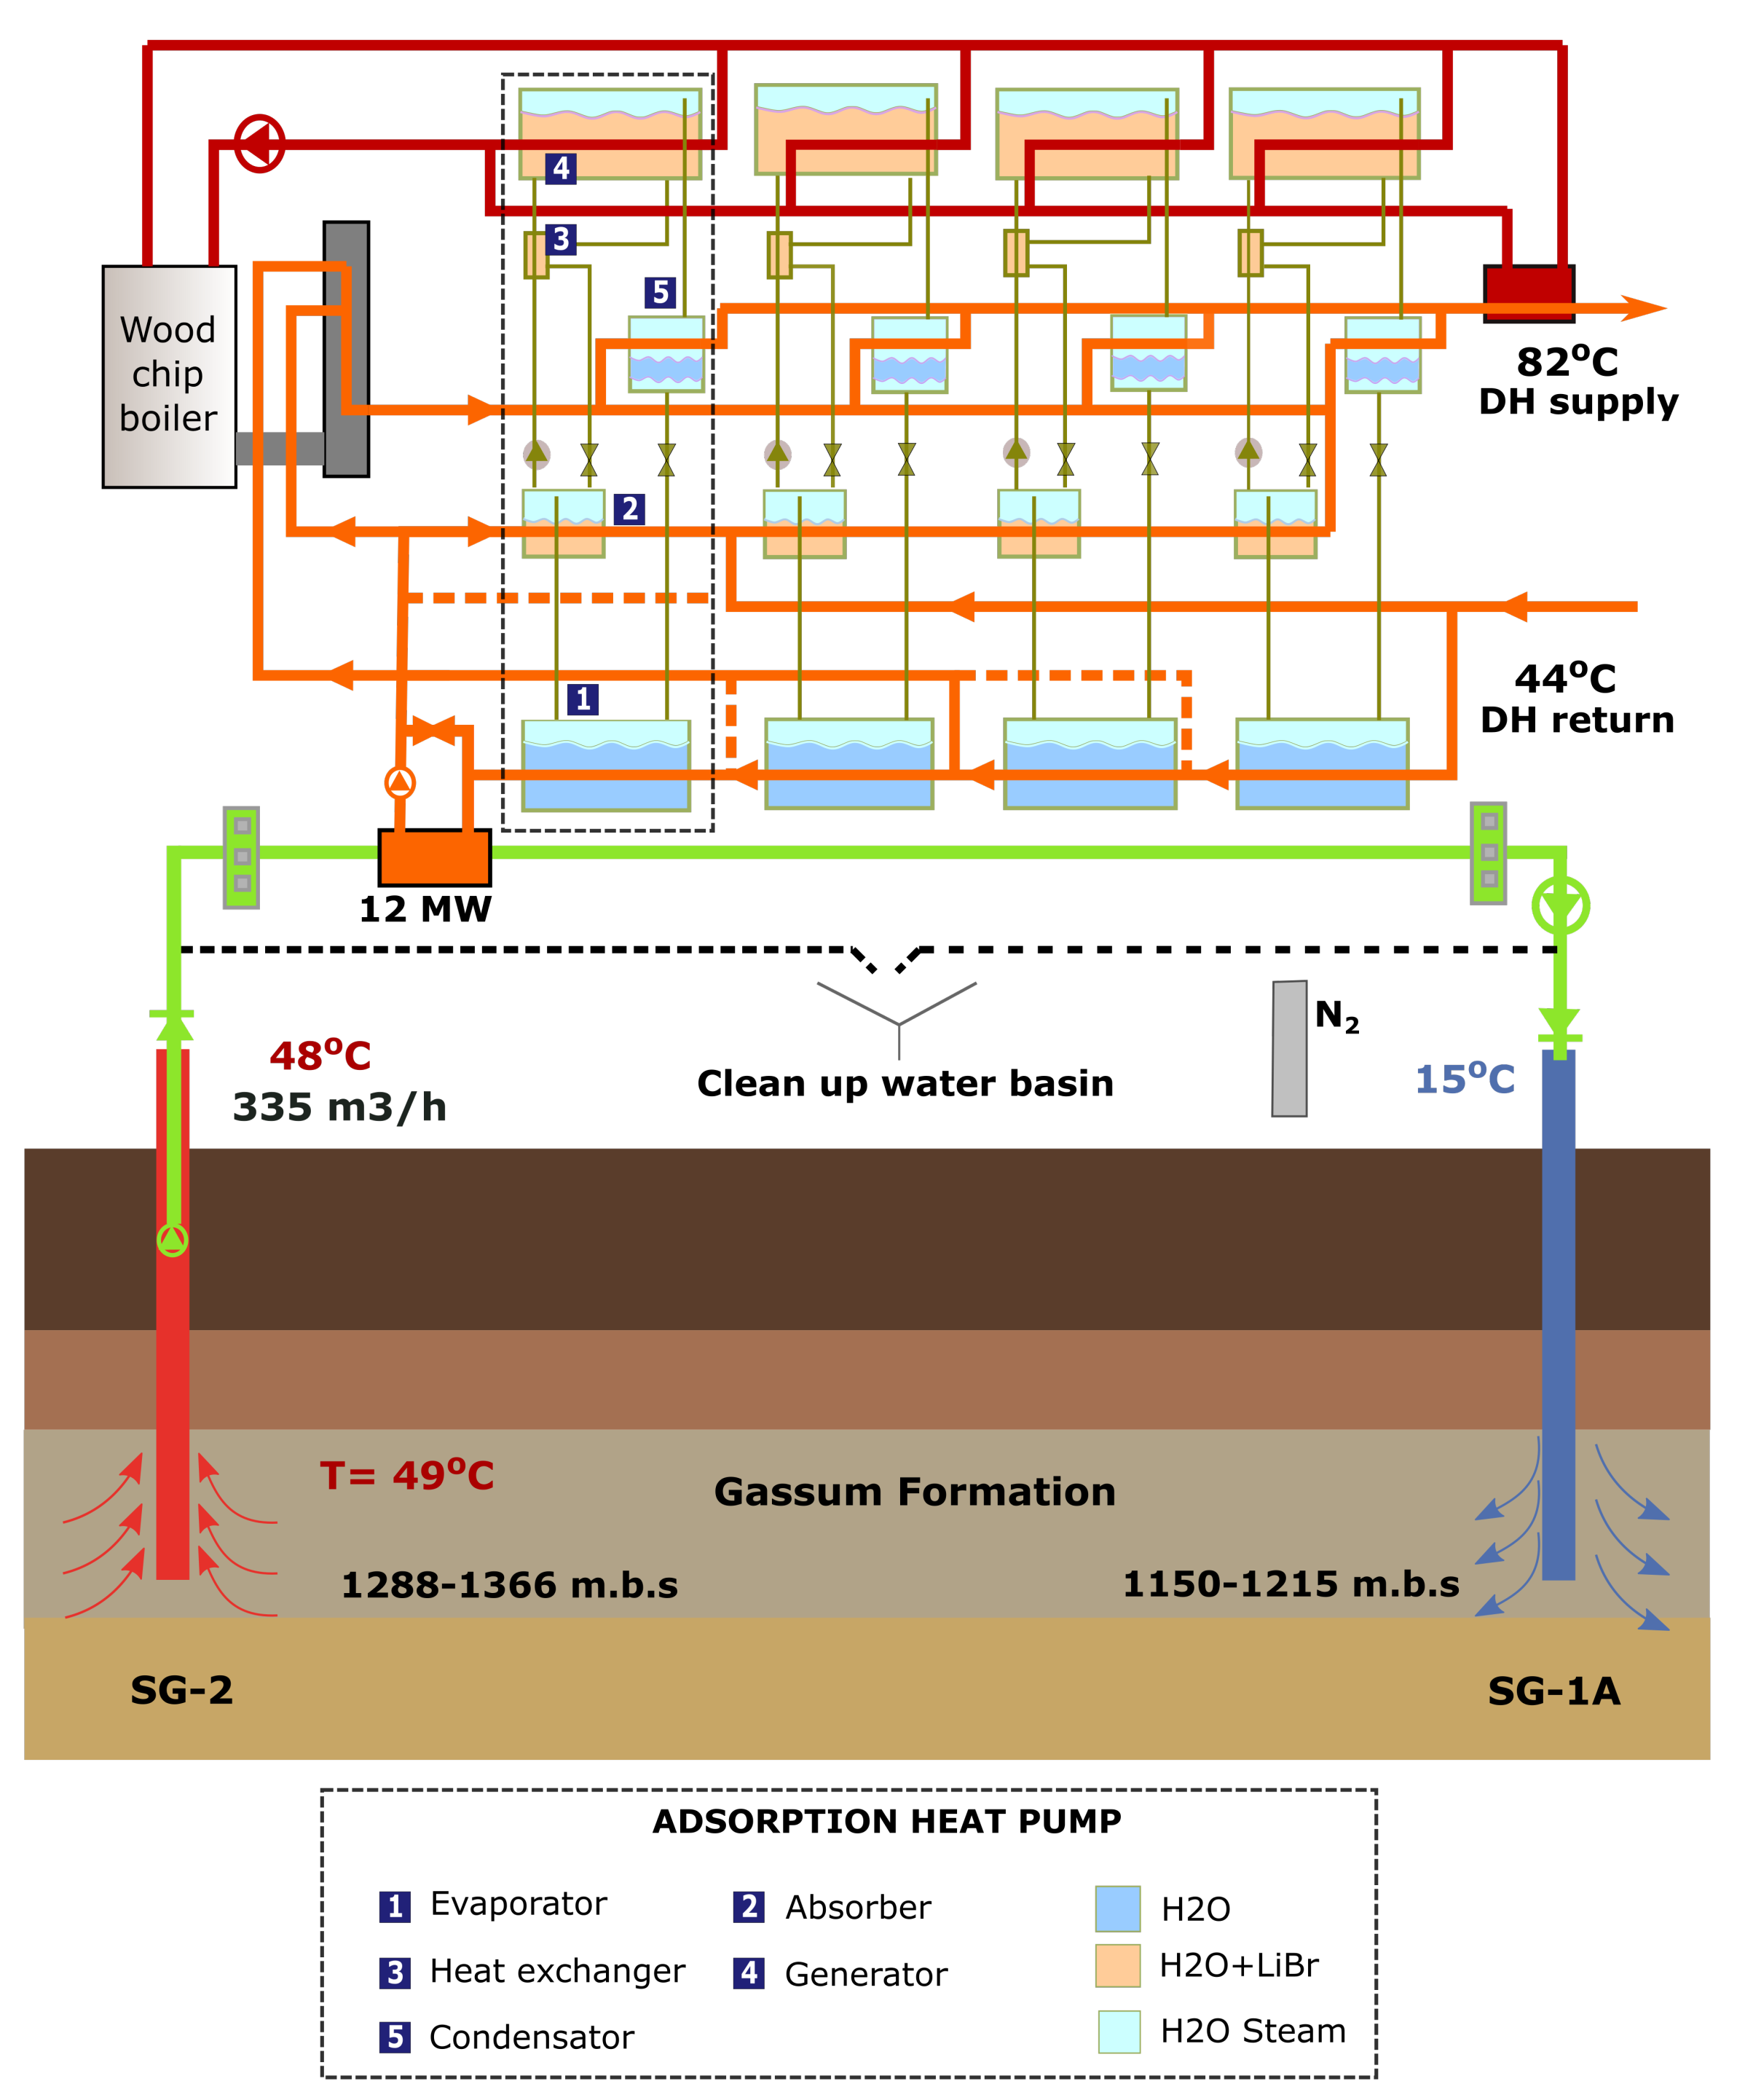
21].
Figure 3 shows a sketch of the Sønderborg geothermal plant that is split into two separate sites, the geothermal loop and heat pump plant due to risk of sealing fractures in the area. The geothermal loop (green circuit), located at the well site roughly 4 km to the east of the heat pump plant, includes pumps, heat exchangers, drains for removal of air contaminated water, cartridge filters, and a basin. The main usage of the basin is to collect geothermal water from filter drains, and remove “old water” in the production well/surface facilities after the plant stops temporarily. The heat pump plant is located close to the local combined heating and power (CHP) plant, where it is possible to feed the produced energy into the district heating (DH) network. The heat plant (orange circuit) has four absorption heat pumps that cool down the DH water at 44 °C to about 12 °C. Thereafter, the chilled DH water is pumped to the heat exchangers in the geothermal loop that bring this fluid to about 45 °C. Driven heat (red circuit) for the adsorption pumps is provided by two wood chip boilers (biomass) [
1,
21].
As observed in
Figure 3, the heat pumps are composed by an absorber, evaporator, heat exchanger, generator, and condenser. Those heat pumps work by means of thermal/chemical processes with water as the working medium. Lithium bromide (LiBr) is used to keep a low pressure in the evaporator which allows the boiling of water at room temperature. Briefly the heat pump principle is explained as follows. LiBr+H
2O mixture in the absorber sucks up water vapors from the evaporator. This is because LiBr is an extremely water-absorbent salt. The heat given off during this process is transferred to the district heating water and at the same time the LiBr+H
2O mixture is diluted. A smaller circulation pump lifts the weak LiBr+H
2O mixture from the absorber through a heat exchanger and into the generator, which is filled up with this mixture creating a reservoir. Heat is added to the generator by means of an external steam or hot water supply to initiate the separation process. All the H
2O will start to boil off and fill up the condenser with hot water vapor, therefore, releasing its energy to the district heating water before it is led back to the evaporator. On the other hand, heavy LiBr particles will sink to the bottom and form a concentrated liquid. This hot liquid flows down to the heat exchanger, where it transfers its heat. Once the concentrated LiBr liquid has cooled down, it moves to the absorber where it is mixed with the water before repeating the loop [
22].
Pronounced injectivity problems have characterized the Sønderborg plant, which according to Guddat and Juul [
23] are atypical for geothermal plants in general. It was expected that 350 m
3/h could be produced in 2013; however, it was not possible to reach the designed rate. Sønderborg 1-A needed a clean-up to allow a full injection capacity [
21]. A camera inspection showed that the wall of the injection well was not clean, and the screen openings seemed plugged up (the open area in the gravel pack screen slots was quite small). Rotating scrubbers in the gravel pack zone and pumping water out of the well was used to clean up the well [
24]. Soft acidizing has also helped to reduce the injection pressure. For instance, the injection pressure was reduced from 41 to 11 bar by adding 0.38 m
3 of 15% HCl to the injection water. This was done after air ingress at a leaking wellhead gasket [
24]. “Rocking the well” (RWT) operations, depressing the fluid level, were applied when the injection rate dropped to 75 m
3/h. However, the RWT was unsuccessful and the unforeseen injectivity problems continued. The plant was shut down on 20 December 2018 due to pressure build-up in the injection well [
7,
25].
As observed in [
26], the drawdown pressure has been kept almost constant during its operation. The flow rate and injection pressure have changed over time, especially from 2015 until 2017. In this sense, an average flow rate of 137 m
3/h with an average pressure of 66 bars was reinjected in winter 2013. However, an average injection pressure of 68 bars was used in 2017 to displace on average 97 m
3/h, which is a much smaller flow rate. This trend clearly shows how difficult it has been to reach the planned production target because of the challenging injectivity of the heat-depleted geothermal brine.
It is suspected that the 0.152 mm slots in the gravel pack screens were clogged by mill scale from the injection well casing (Fe) combined with deposition of rust flakes (Fe). Both rust flakes and grains with sulfides (ZnS, FeS) have been observed in filter extracts [
27]. According to Guddat and Juul [
23], the operational difficulties in the injection well are attributed principally to calcite scaling, deposition of corrosion products, precipitation of sulfides which are attributed to a bacterial reduction of sulfates due to the high concentration of sulfate in the geothermal fluid. Balling et al. [
26] used a history matched reservoir simulation model constructed in Petrel and Eclipse software to assess the production performance and if the decreasing injectivity could be attributed to flow barriers in the reservoir. Those authors found that the decreasing performance of the Sønderborg wells is not related to barriers in the reservoir but mainly to obstacles in the wellbore or near the wellbore area, which are related to scaling or corrosion products.
5. Water Chemistry
As presented in the previous section, the injectivity issues seemed to be partly related to changes in the water chemistry. In this section, fluctuations in the ionic composition of the geothermal fluid are presented and analyzed.
Geothermal brine is composed by a wide range of chemical compounds that vary from low to high concentration. The major elements are sodium, magnesium, calcium, bicarbonate, chloride, sulfate, and carbon dioxide. Other elements at low concentration can also be present, such as silica, iron, lead, barium, and strontium [
28]. The performance of the geothermal power plant and the long-term functioning of the system can be greatly influenced by the chemical composition of the geothermal fluid and how it might change during the operation [
29].
The characteristics of the Sønderborg geothermal plant taken from Cobos & Søgaard [
30] are presented in
Table 4. As observed the geothermal fluid has a high concentration of sodium, calcium, magnesium, chloride, and sulfate. This composition could indicate that when the original formation water was exposed to high temperatures, some minerals diffused or precipitated into the aqueous phase [
30]. The salinity of the Sønderborg formation water is 96–97 g/L expressed as chloride concentration and the Total Dissolved Solids (TDS) is 157 g/L [
2]. Holmslykke et al. [
31] mentioned that the high salinity of the Sønderborg brine is because of the diffusion of Cl
− ions from the underlying Zechstein salt deposits, present in most of the North German Basin, into the original formation water.
Piper diagram is an effective graphic procedure for presenting the water chemistry of a water sample or samples. It was proposed for the first time by Hill [
32] and modified by Piper [
33]. The diagram contains a central rhombus-shaped area and two triangles. The percentage of the cations (Ca, Mg, and Na+K) are represented in the left side triangle, whereas the percentage of the major anions (Cl, SO
4, and CO
3+HCO
3) are shown in the right-side triangle. The two ternary triangles are then projected onto a rhombus-shaped plot, which is divided in 6 different regions that corresponds to 5 classification zones [
34].
Figure 4 shows the chemical classification of Sønderborg brine samples taken in different operational years. As observed, the samples are sodium and sulfate dominated. The projection of the major cations and anions onto the central diamond field indicates that the brine samples are dominated by alkalis and strong acids (non-carbonate alkali > 50%). In other words, alkali metals exceed alkaline earth metals. Sønderborg brine has a higher amount of sodium (Na) and potassium (K) than magnesium (Mg), calcium (Ca), strontium (Sr) and barium (Ba). Please note that the red squares (concentration in the brine) are being slightly displaced, which could indicate that the composition of the geothermal fluid has changed over time.
Scale formation and corrosion are directly related to the geothermal fluid characteristics due to their chemical complexity, which results in extreme and harsh conditions for a geothermal plant [
36].
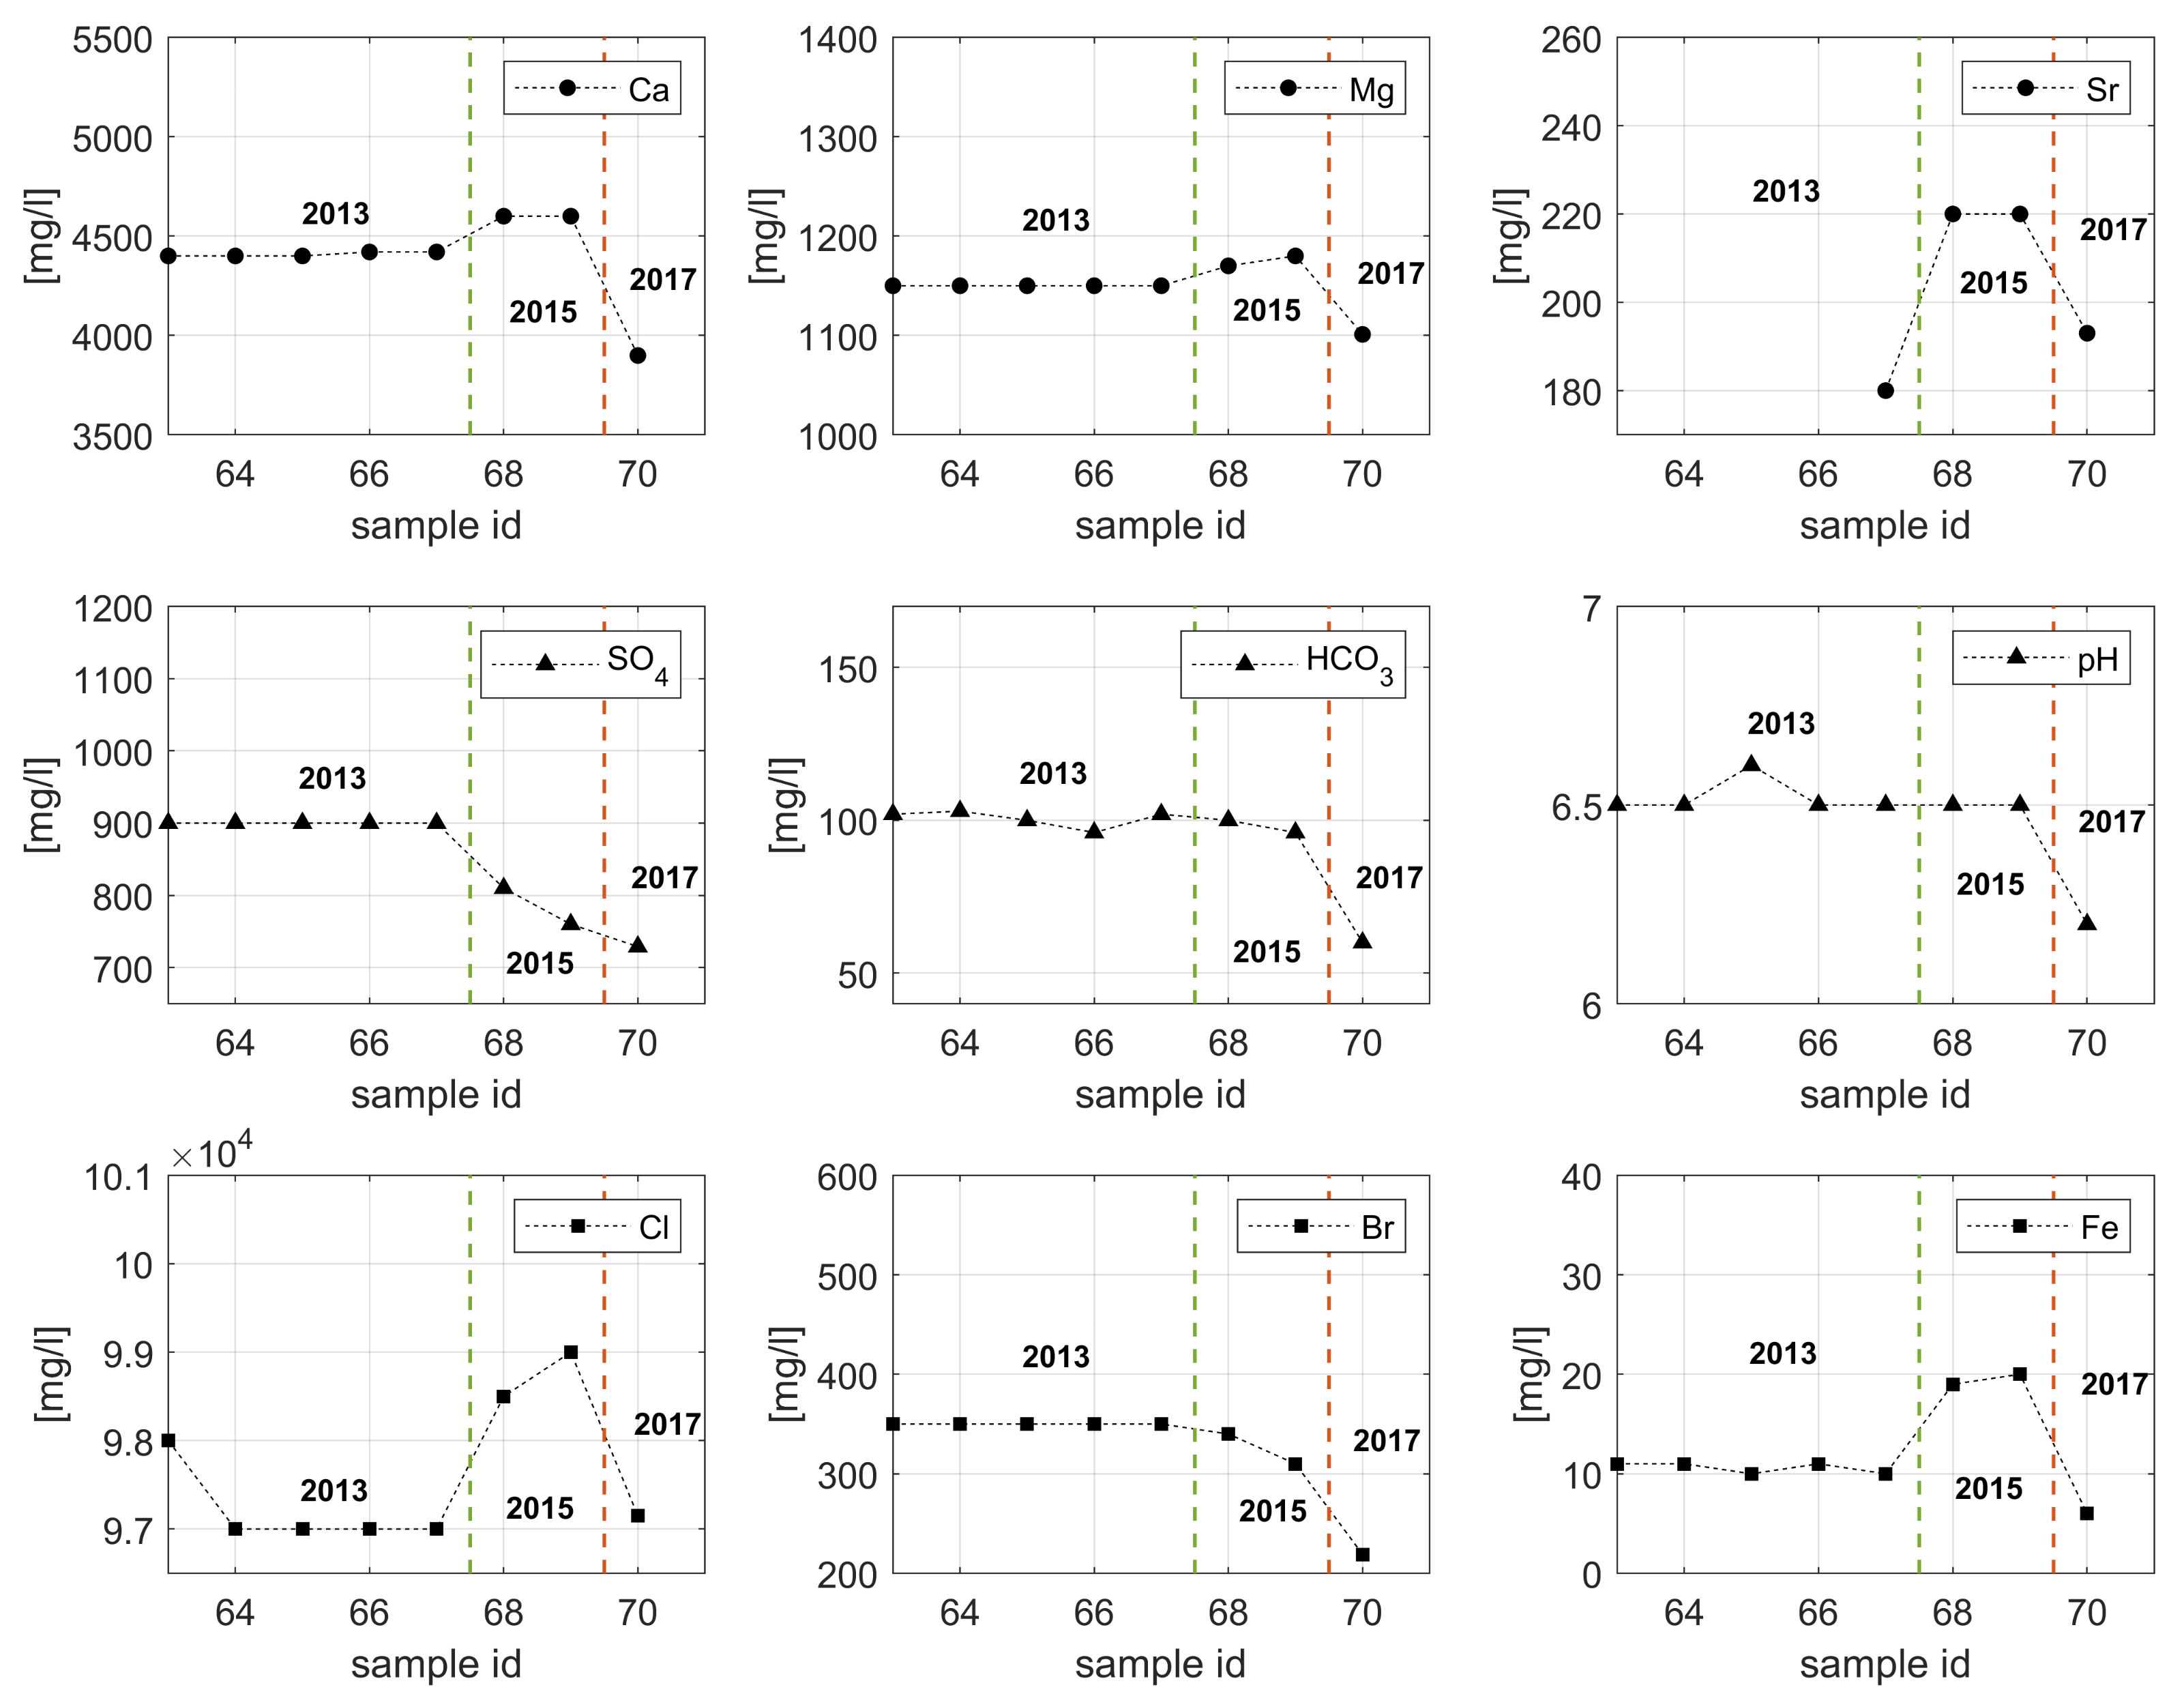
Figure 5 shows the changes in the ionic composition, alkalinity and pH over time for the Sønderborg geothermal brine.
As observed in
Figure 5, no major changes occur during 2013 since the concentration of the cations and anions are almost constant. However, this equilibrium has been altered since 2015. The fluid samples taken in 2015 show a higher concentration of Ca
2+, Mg
2+, and Sr
2+, whereas the concentration of SO
42− is much lower than in the original samples. The concentration of the divalent cations (Ca
2+, Mg
2+, and Sr
2+) decreased in 2017, which is also the case for SO
42−. It is plausible that the high concentration of calcium, and strontium ions resulted in the precipitation of sulfate scales, such as CaSO
4, and SrSO
4. Those scales are formed according to the following equations:
Sulfate depositions lead to a significant reduction in the rock permeability, productivity and scaling of wellbore tubulars [
37,
38]. The main issue with sulfate scales is that those deposits are adherent, hard, and almost insoluble in mineral acids or other common solvents, and difficult to remove mechanically [
37]. Bader [
37], Vetter and Kandarpa [
39] found that changing the SO
42− concentration from 8192 mg/L to 256 mg/L reduces considerably the CaSO
4 precipitation in the production wells. In order to prevent sulfate scale precipitation, the SO
42− ion in the injection water must be reduced to 15 mg/L [
37].
The reduction in concentration of Ca
2+ and HCO
3− ions observed in
Figure 5 could indicate the formation and precipitation of CaCO
3 scale through Equation (
3) [
40]
Calcium carbonate scales can be removed using milling tools or by pumping acids being hydrochloric acid (HCl), an effective chemical to dissolve scale under the most conditions. Concentrations ranging from 5–15% are normally used to dissolved CaCO
3, which follows the reaction presented in Equation (
4) [
41].
Mill scale on the inner part of surplus well tubing located at the plant revealed significant amounts of rust flakes. The presence of mill scale, which contains goethite, akaganiete, lepidocrocite, hydroxyapatite, aragonite, and calcite, is not uncommon in new tubings. However, it should be completely removed when the tubings are used for geothermal wells. Due to a poor adhesion to the surface, mill scale would be easily removed from the tubing. In other words, if the mill scale was not removed from the 9 5/8
tubing that makes the majority of the Sønderborg 1-A well, a volume of 0.1 m
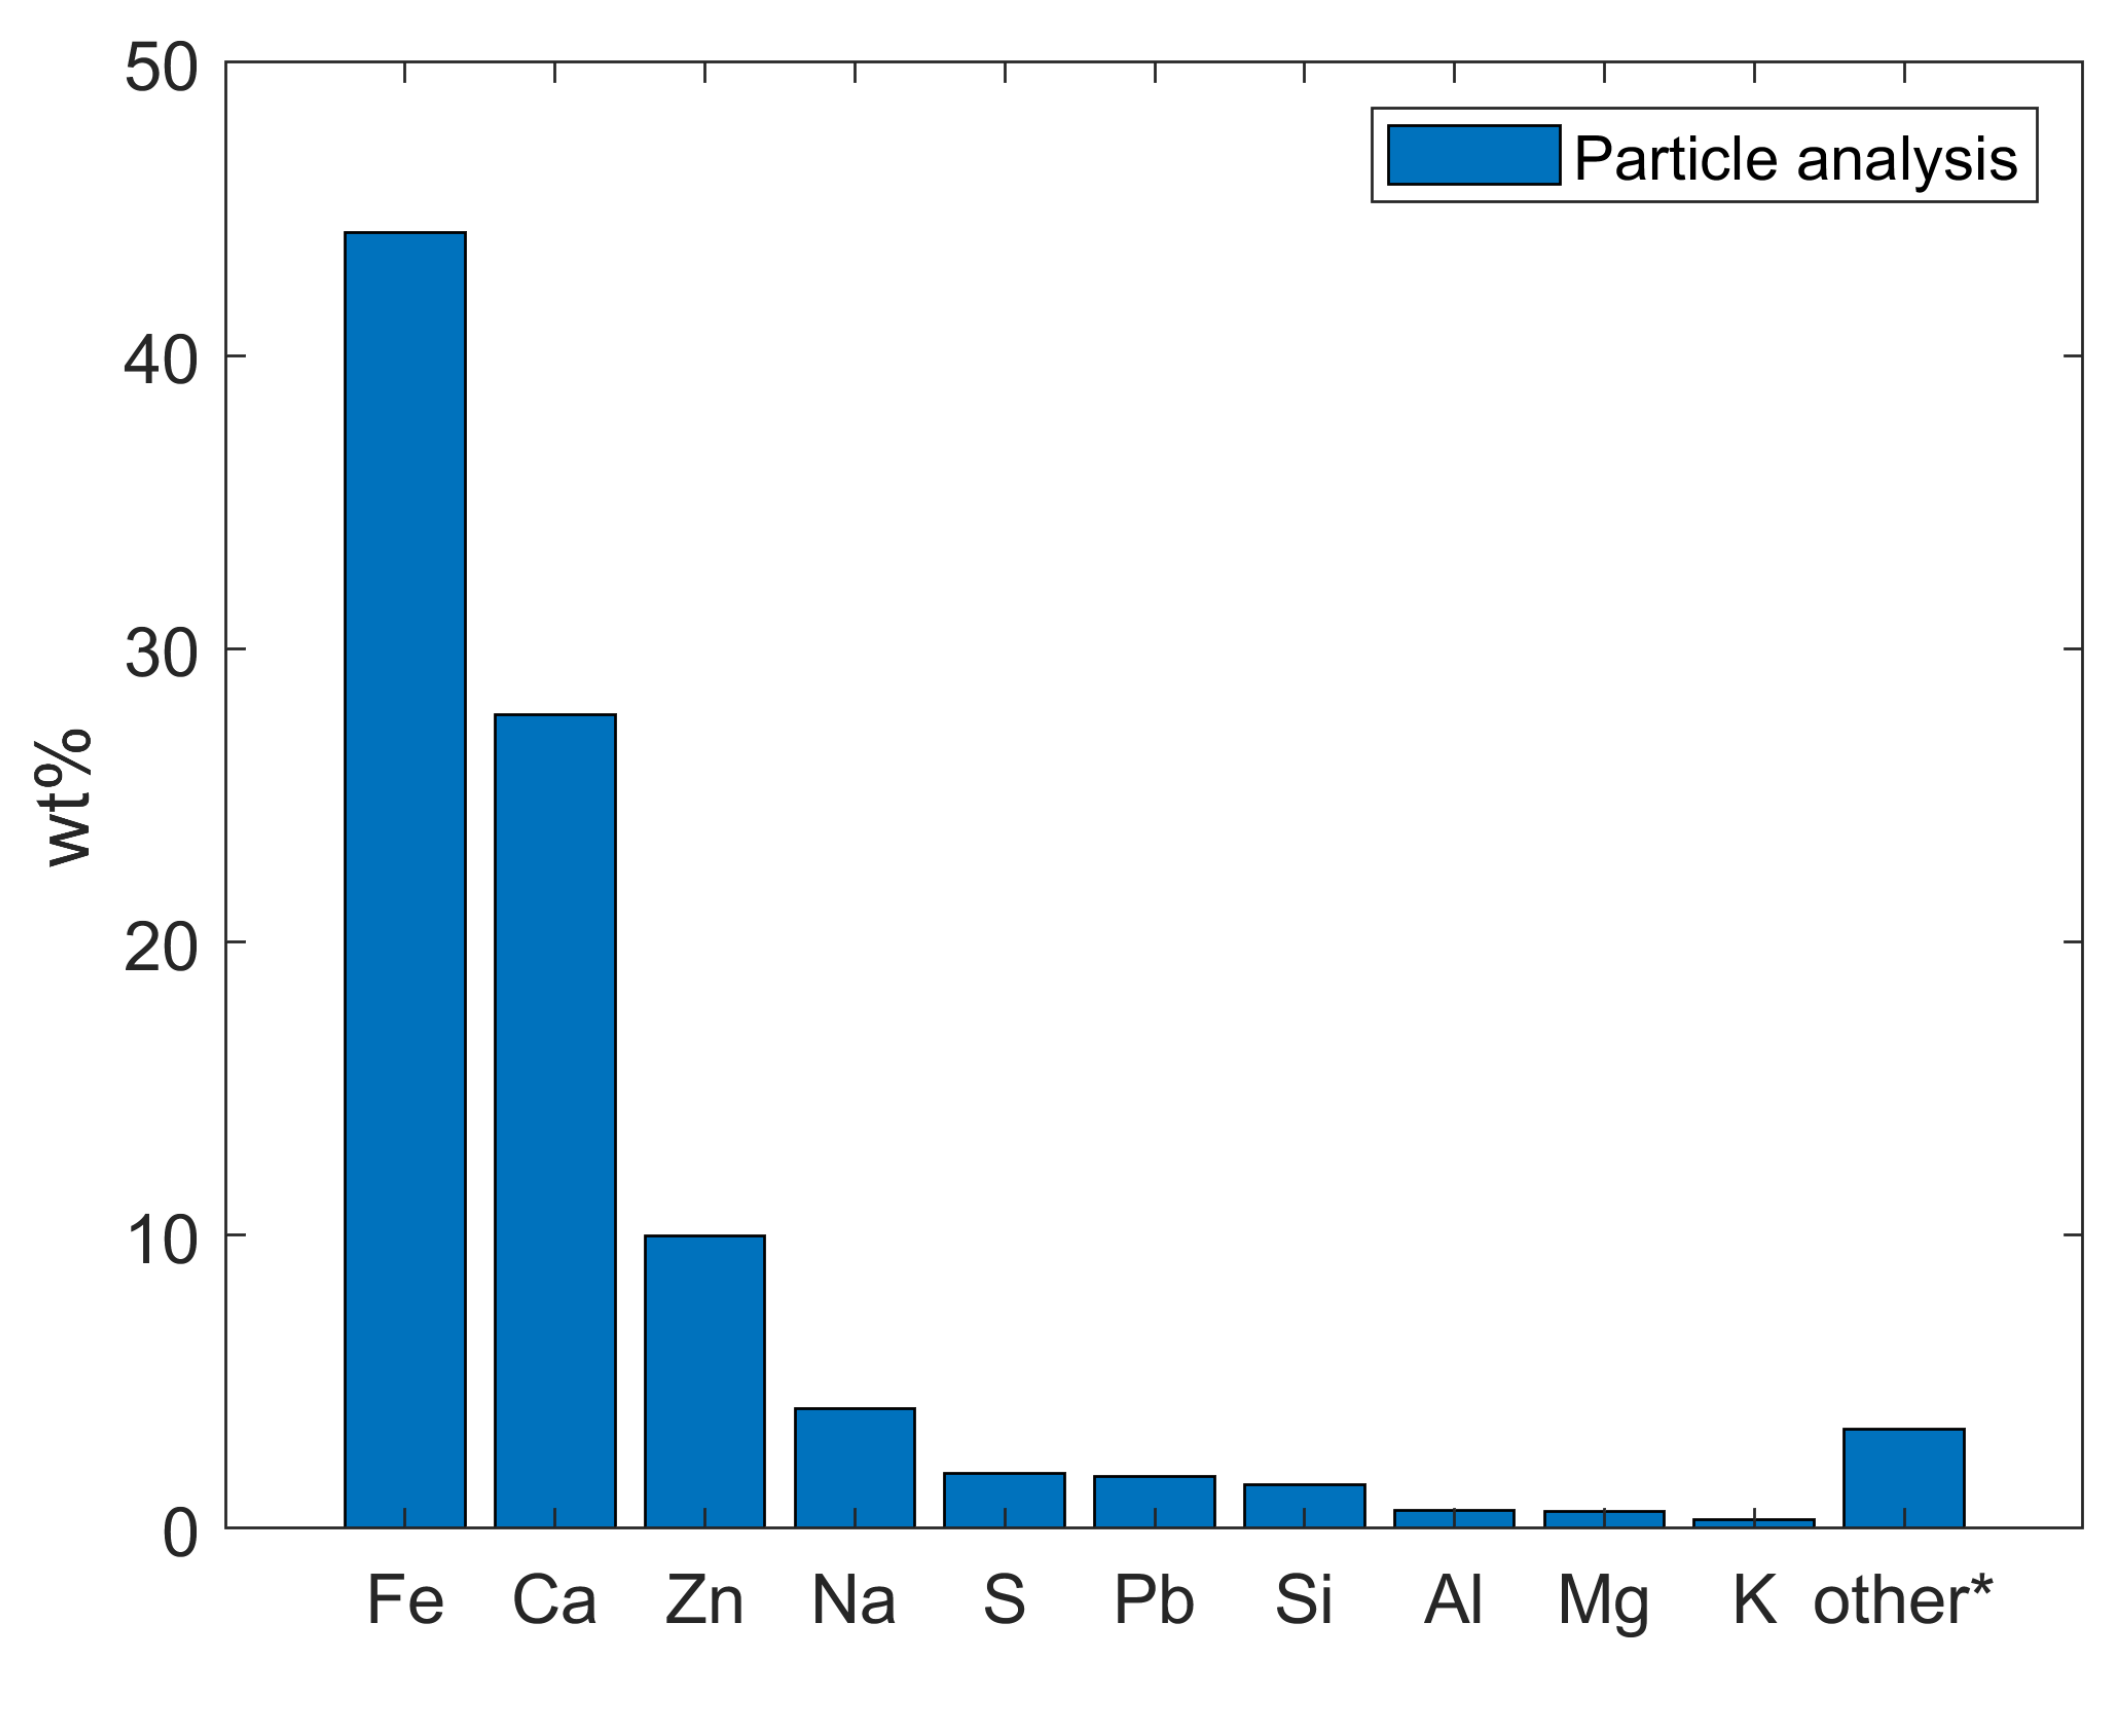
3/100 m tubing (62 kg/100 m) would have been released, enough to fill it up the injection well assuming a dense packing. This hypothesis is strongly supported by the particles collected in the injection well, which results are presented in
Figure 6. As observed, the weight percentage (wt%) of iron is higher than the other compounds in the collected samples, which confirms the presence of iron flakes in the reinjection well (Sønderborg 1-A). The tests done by Mathiesen et al. [
25] showed that mill scale is extremely difficult to dissolve using an acidic treatment since it was largely unaffected even after being exposed to 2% HF and 5% HCl at 50 °C.
The increment of Fe(II) concentration over time could be associated with mineral dissolution and/or corrosion of tubulars. As presented previously, Gassum formation is mainly composed of sandstone, siltstone, and claystone. From those sedimentary rocks, claystone and siltstone are partly made of iron [
42]. Siderite cement, ferrous-containing early cement, can also be presented in the Gassum formation since the sediments were deposited under humid climate conditions [
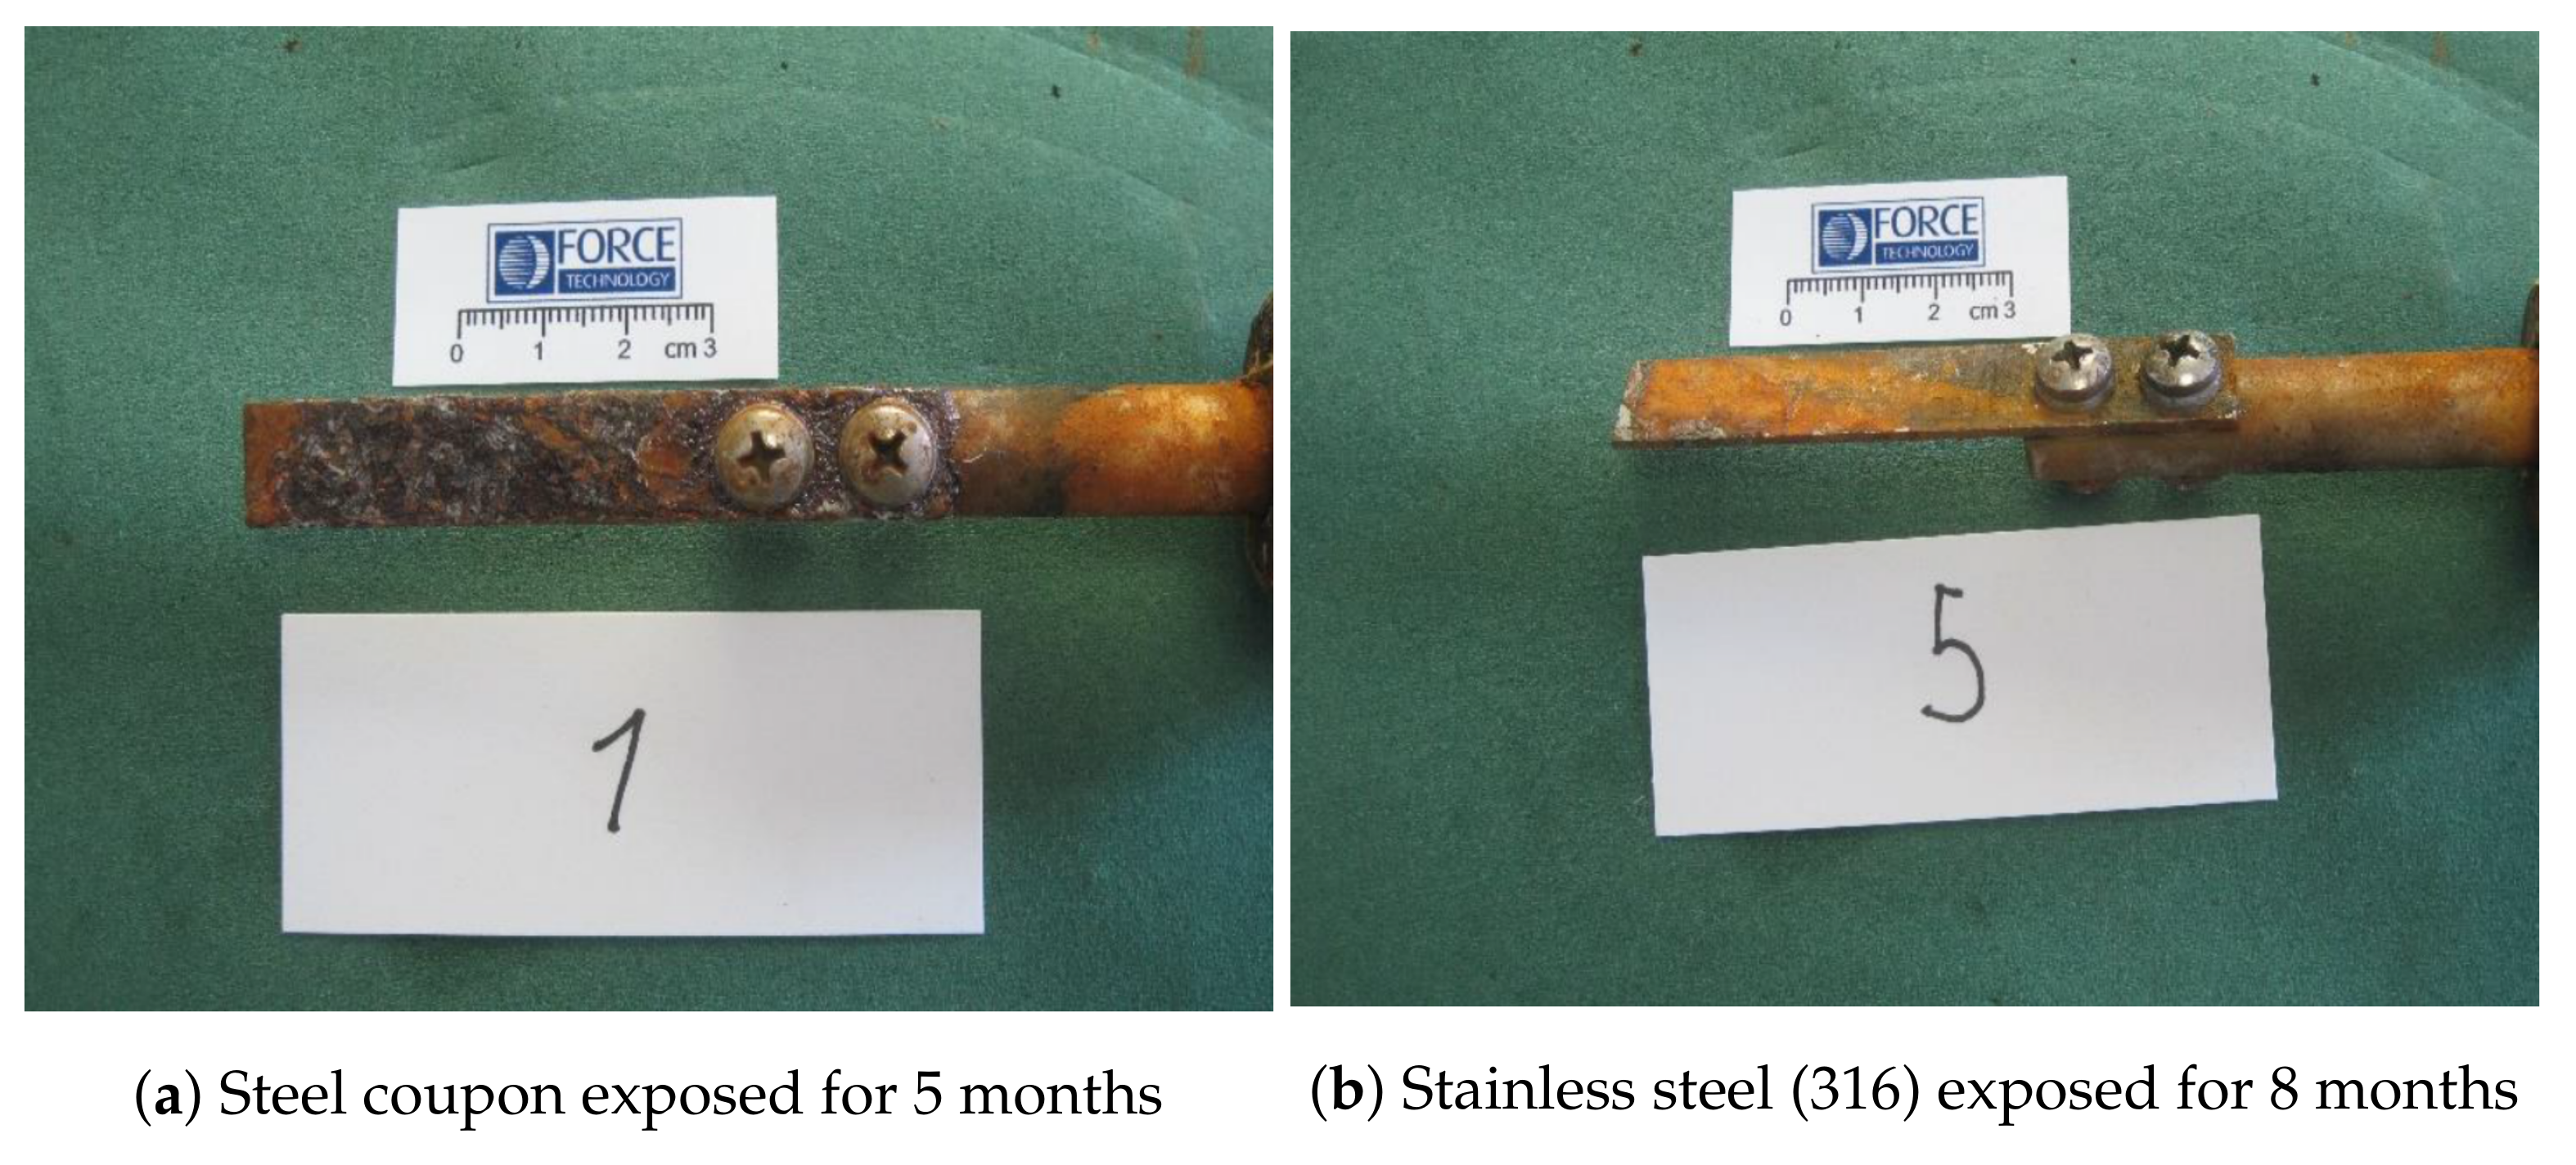
43]. Thus, the weathering of iron-rich minerals could have slowly increased the iron concentration in the brine. However, the most plausible reason for the huge iron concentration increment is a corrosion problem as shown in
Figure 7. The results of on-site monitoring campaign carried out from February 2017 to May 2017, November 2017 to April 2018 and October 2018 to December 2018 by Force Technology indicates ingress of air into the surface plant, possibly at the injection pump. The oxygen ingress was evident in the anodes placed in filters made of stainless steel AISI 316 (see
Figure 7b). The anodes were depleted after roughly 6 months, which is far away from what could be expected from changing the filters alone. It is believed that the oxygen ingress caused a relatively high corrosion rate of steel that ranged from 0.1 to 0.3 mm/year [
25].
The superficial pitting corrosion of the stainless steel coupons shown in
Figure 7b could be due to the presence of halide ions, chloride (Cl) bromide (Br) ions. According to Czernichowski-Lauriol [
44], chloride ions cause local breakdown of passive films, which in turn results in pitting, crevice corrosion and stress corrosion cracking. Moreover, chlorides form stable complex ions (FeCl
+, FeCl
02) that can result in accelerated corrosion. Tsutsumi et al. [
45] found that pitting corrosion progress when the chloride concentration exceeded 6 M with a relative humidity of less than 65%. A clear passive film can also be broken down in bromide containing solutions, which in turn promotes a localized corrosion. Prando et al. [
46] mentioned that the susceptibility to pitting corrosion depends on halides nature and follows the order Cl
− < I
− < Br
− < F
−. In that series, fluoride (F
−) can dissolve completely the passive layer, whereas bromide (Br
−) destroys the protective film locally.
Both corrosion (e.g., iron flakes) and scaling products could have caused the unforeseen injectivity problems in which the injection pressure was higher than the system design pressure. Cobos and Søgaard [
30] observed a 9% permeability reduction on average when Sønderborg brine was injected into Berea sandstone core plugs since the initial permeability to the brine was higher than the measured permeability during the brine injection. These authors mentioned that a discontinuity in the fluid injection creates a higher permeability reduction. For instance, one of the core plugs obtained a brine permeability of 80 mD before injection, whereas the permeability was reduced to 69 mD after restarting the injection. This injectivity problem was associated with iron precipitation within the porous medium. In the same article, it was mentioned that the injection of diluted geothermal brine with citric acid from SaltPower electricity generation is a feasible solution to avoid iron precipitation inside the porous media.
6. PHREEQC Simulations
A chemical speciation analysis using the numerical code PHREEQC and its Pitzer database was also performed to further interpret the changes in the brine composition. PHREEQC is an aqueous modeling software provided by the U.S. Geological Survey (USGS) that can simulate chemical reactions based on pH, redox and equilibrium behavior. The software uses an ion-association model and Debye Hückel expressions to account for the non-ideality of aqueous solutions. This is because the simulation results obtained with the ion-association model are not reliable at high ionic strengths (in the range of seawater and above), thus, an ionic-strength term in the Debye Hückel expressions is needed to fit for the major ions using chloride mean-salt activity-coefficient data. For high ionic-strength fluids, a geochemical model based on an ion-interaction theory (such as the Pitzer equation) must be used for accurate predictions [
47]. As presented previously, the Sønderborg geothermal plant produces heat from a 15% saline fluid. Therefore, Pitzer specific interaction approach is needed to model the precipitation in the geothermal brine under different conditions, as several reactions are possible.
Batch-reaction calculations were used for the simulations, in which the geothermal formation brine and reinjection fluid were equilibrated with the major mineral (quartz). The in situ and reinjection temperatures, fluid composition over time were taken from a database found in the Perform Project for the Sønderborg Geothermal plant [
27]. The fluid pressure of the Gassum reservoir was inferred to be hydrostatic (9.79 kPa/m) assuming a water density of 1.1 g/cm
3. An example of the input data used for the speciation simulations is presented in
Table 5. As observed, the simulations consisted of mixing two solutions; being the first one the injection fluid and the second one the reservoir fluid that is in equilibrium with the major minerals. In the example presented in
Table 5, solution 1 was mixed with solution 2 equilibrated with quartz (major mineral). The composition of those solutions corresponds to 2015 and it was taken from the database found in [
27]. A similar procedure was used for the other years.
The results of the saturation index (SI) for selected minerals are presented in
Table 6. Those indices indicate the state of the geothermal fluid with respect to selected minerals, in which positive and negative values show super-saturation and under-saturation.
According to Wasch et al. [
48], a mineral is over-saturated (super-saturation state) and hence precipitates when the SI value is above 0. On the other hand, the mineral is under-saturated and therefore it does not precipitate when the SI value is below 0. The selected minerals are anhydrite (CaSO
4), aragonite/calcite (CaCO
3), barite (BaSO
4) and celestine (SrSO
4). As observed in
Table 6, Sønderborg geothermal brine in 2010 was saturated with respect to carbonate minerals with SI equal to 0.33 and 0.53 for aragonite/calcite and with respect to barite (SI equal to 0.12). The Sønderborg geothermal brine was not saturated with respect to anhydrite and celestine minerals (SI < 0). The same trend also occurred in 2015, where the brine was saturated with respect to the selected minerals. The samples taken in 2017 shows that the brine was only saturated with calcite but not with the other minerals. The obtained saturation index are in accordance with the changes in the water chemistry presented previously. The injectivity issues seems to be related to the super-saturation of the brine (SI above 0). It is suspected that a sudden nucleation took place followed by a precipitation, which in turn led to under-saturated brine with negative SI’s and clogging of the gravel pack in the sand screens.


