
Smart Building Energy Inefficiencies Detection through Time Series Analysis and Unsupervised Machine Learning


Abstract
:
1. Introduction
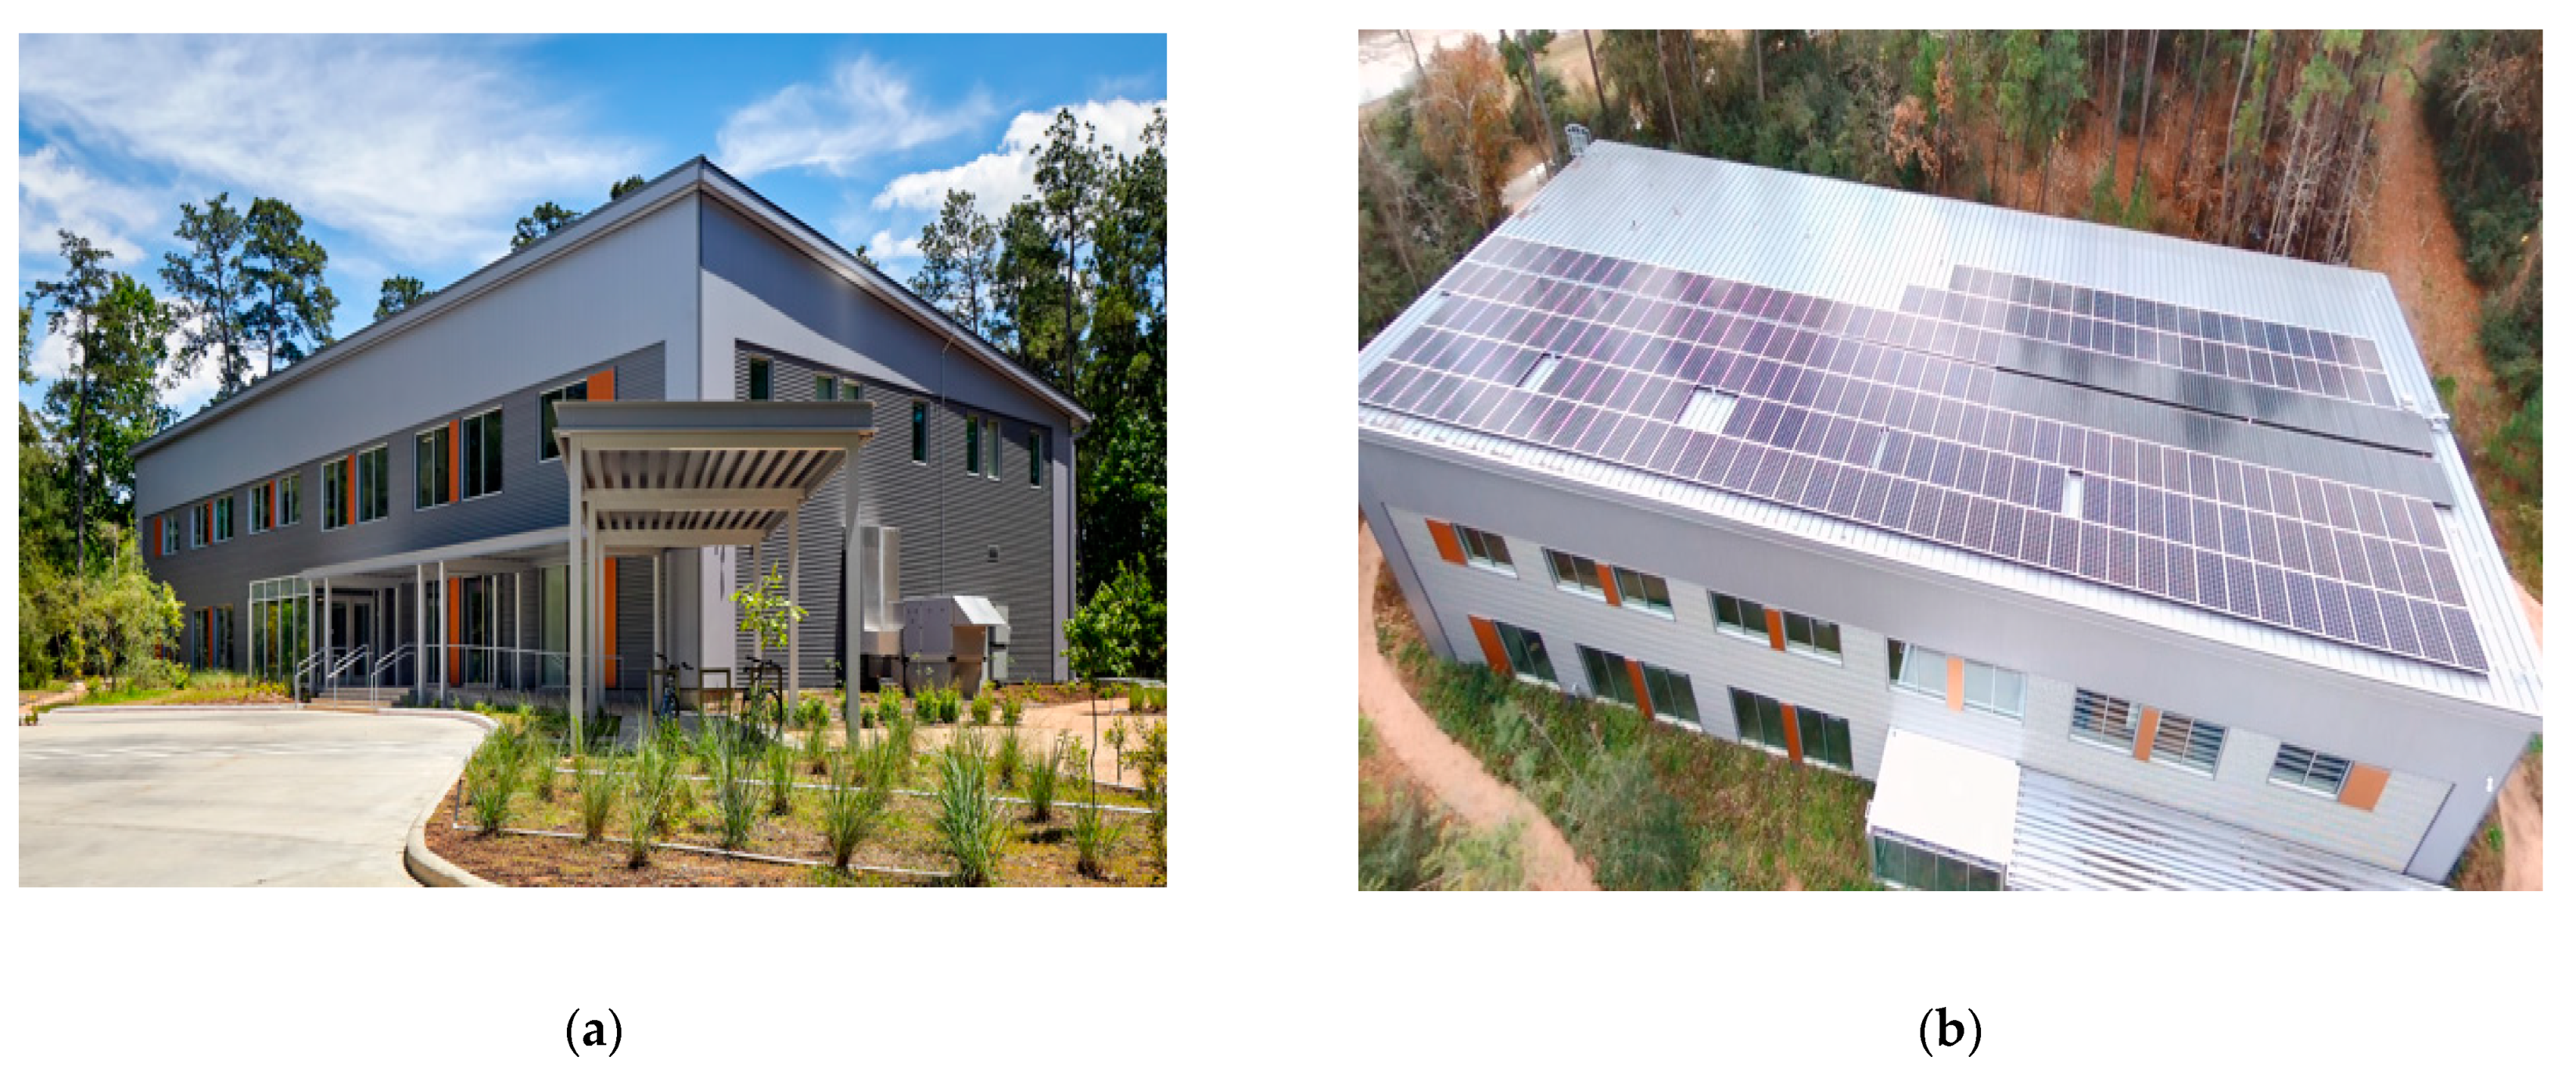
- This paper presents, in detail, a data analysis process applied to data collected from Houston Advanced Research Center (HARC).
- This paper demonstrates the significance of using unsupervised ML techniques to identify inefficiencies.
- This paper demonstrates the importance of using occupant activities in the way building is managed.
- This paper quantifies the possible energy savings that AI can provide in the operations of HVAC systems, even in highly efficient buildings.
2. Heating, Ventilation, and Air Conditioning (HVAC): An Overview and Literature Review
3. Data Collection, Description and Exploration
3.1. Data Collection and Description
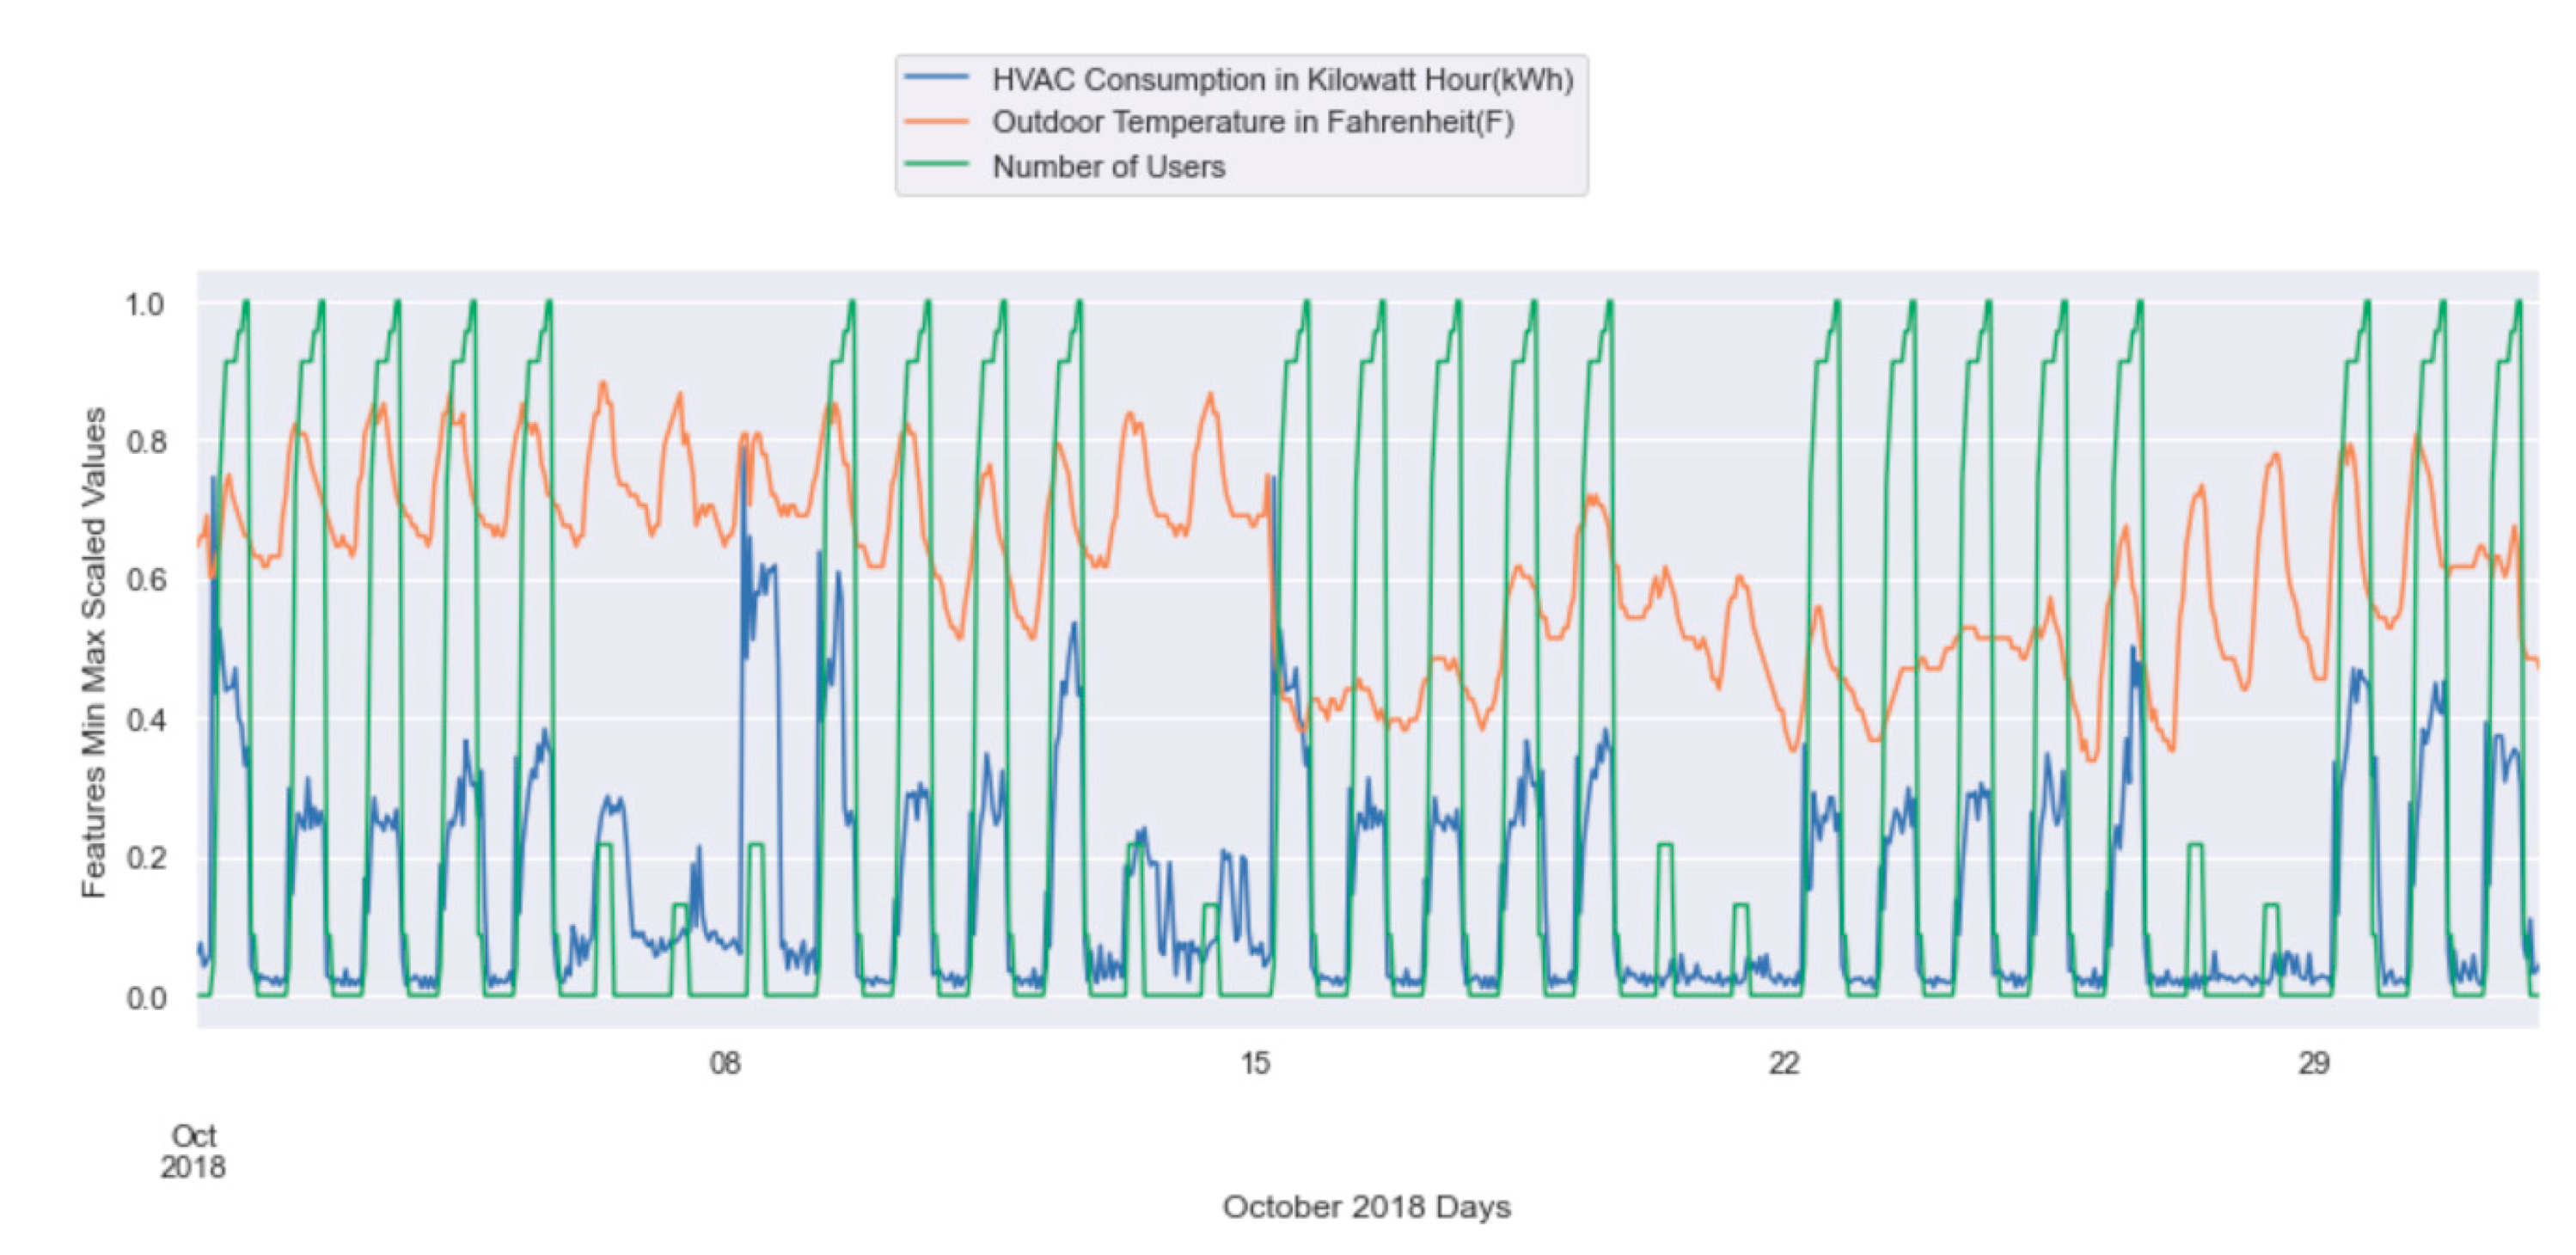
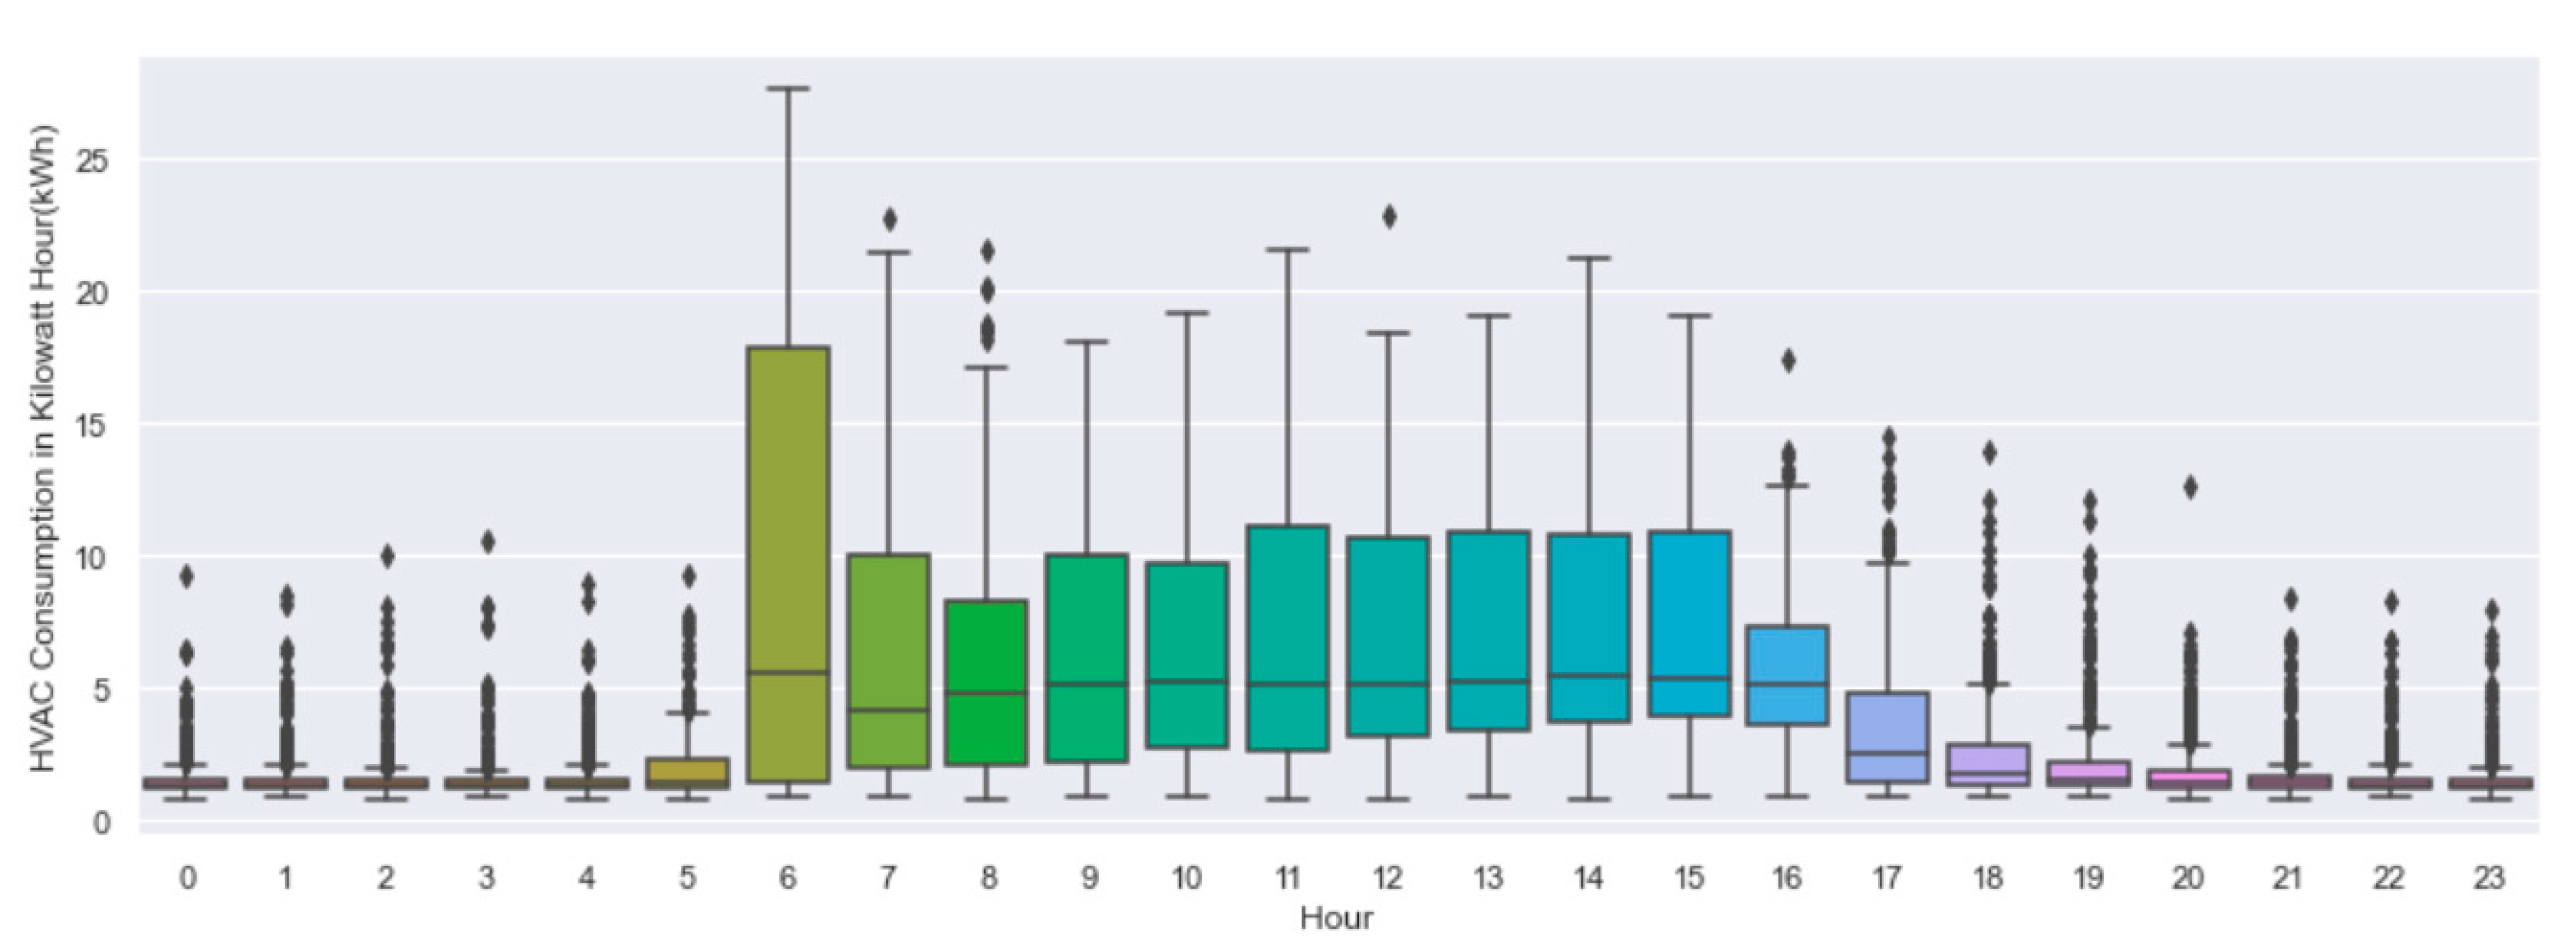
3.2. Data Preparation and Exploration
- We replaced a missing row with the average of the previous two rows.
- If more than one row was missing, and because the consumption was a pattern repeated weekly, we replaced the missing rows a similar day’s timeslot data.
- We changed the data sampling rate from a 1 min interval to a 1 h interval for better visualization of the data.
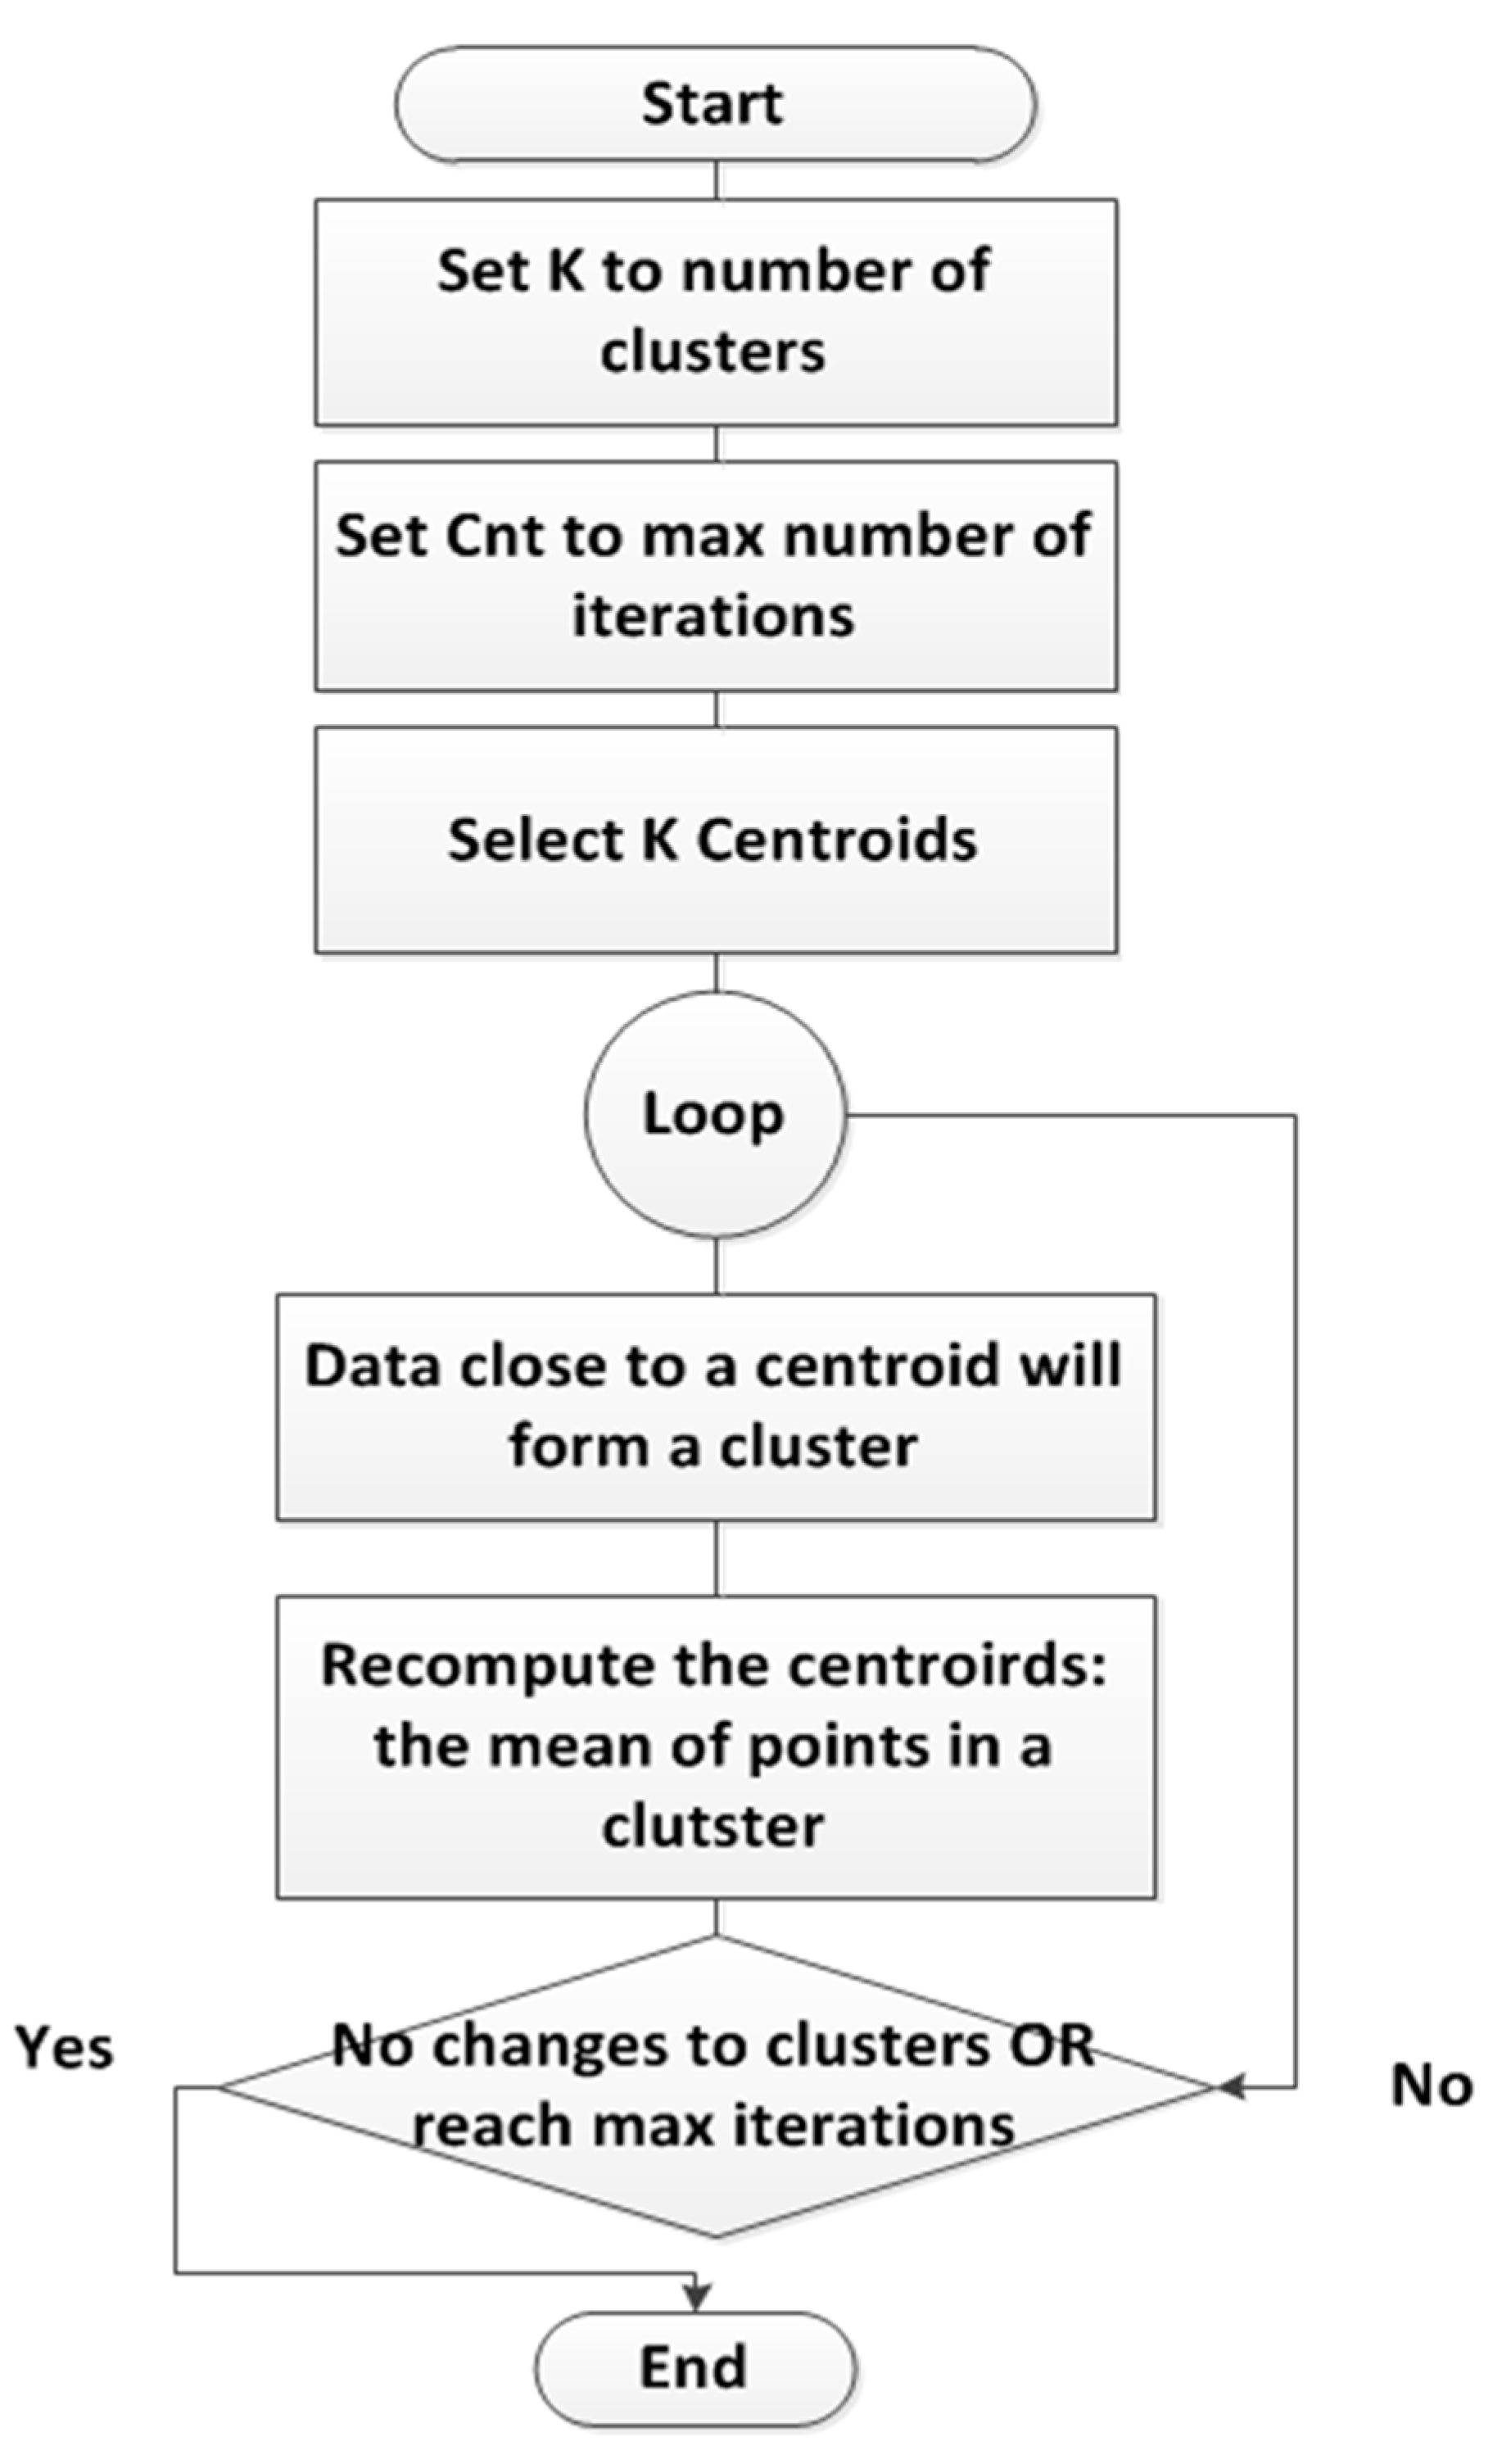
4. K-Means Clustering Algorithm: A Step-by-Step Process
- Randomly choose a datapoint to be a cluster center
- For every other datapoint, compute the distance (let’s call it D(x)) from a point to the cluster center
- Choose the next centroid such that the probability of choosing a point is proportional to D(x)2
- Repeat the above two steps until the right number of centroids are found
5. Applying K-Means: Results and Discussion
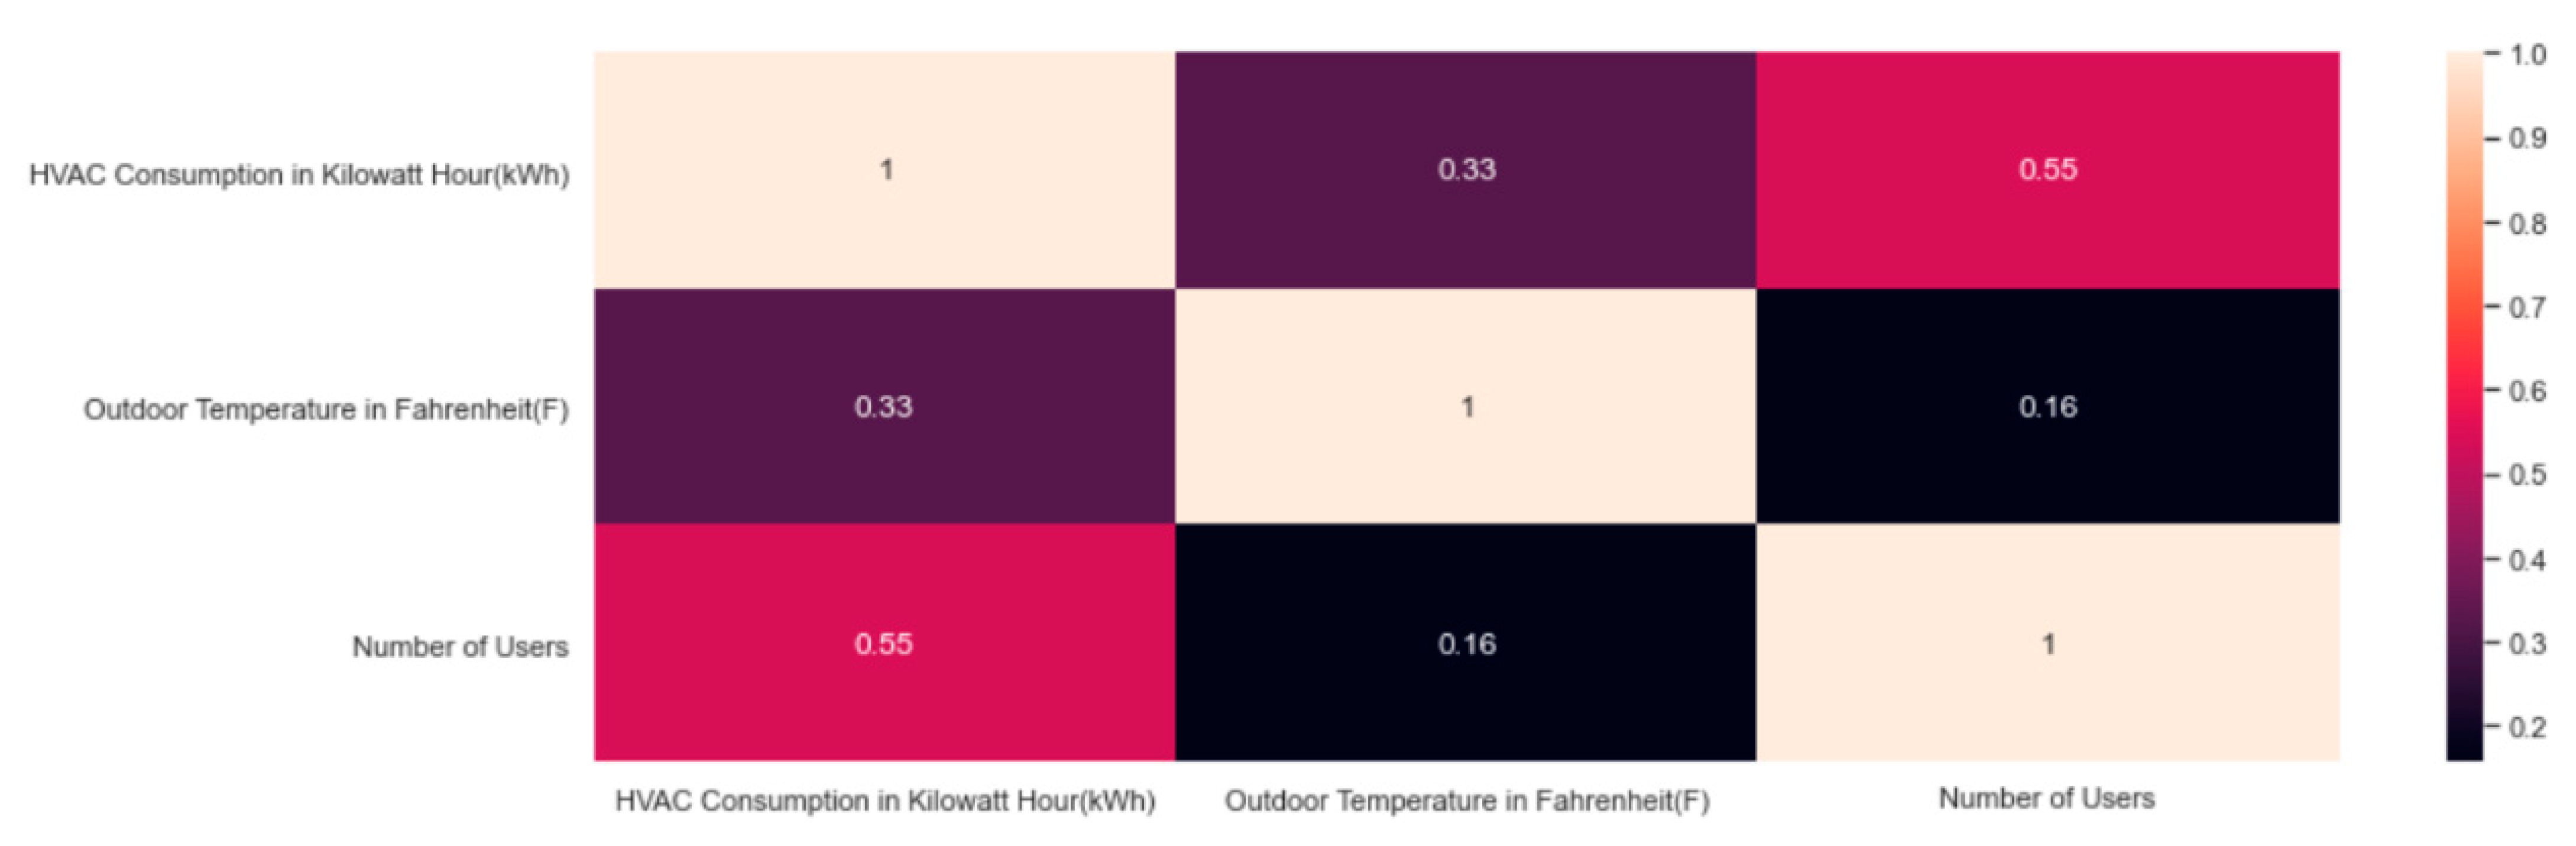
5.1. Clustering HVAC Consumption and Outdoor Temperature
5.2. Clustering HVAC Consumption and Number of Users
6. Conclusions and Future Work
Author Contributions
Funding
Institutional Review Board Statement
Informed Consent Statement
Data Availability Statement
Conflicts of Interest
References
- Air Conditioning. Department of Energy. Available online: https://www.energy.gov/energysaver/home-cooling-systems/air-conditioning (accessed on 11 September 2020).
- Javed, A.; Larijani, H.; Wixted, A. Improving Energy Consumption of a Commercial Building with IoT and Machine Learning. IT Prof. 2018, 20, 30–38. [Google Scholar] [CrossRef] [Green Version]
- ENERGY STAR Certification for Your Building. ENERGY STAR Buildings and Plants. ENERGY STAR. Available online: https://www.energystar.gov/buildings/facility-owners-and-managers/existing-buildings/earn-recognition/energy-star-certification (accessed on 18 January 2021).
- Talei, H. Smart Campus Energy Management System: Advantages, Architectures, and the Impact of Using Cloud Computing. In Proceedings of the ICSDE ’17, Rabat, Morocco, 21–23 July 2017. [Google Scholar]
- Ardiyanto, D.; Pipattanasomporn, M.; Rahman, S.; Hariyanto, N. Suwarno Occupant-based HVAC Set Point Interventions for Energy Savings in Buildings. In Proceedings of the 2018 International Conference and Utility Exhibition on Green Energy for Sustainable Development (ICUE), Phuket, Thailand, 24–26 October 2018; pp. 1–6. [Google Scholar]
- Capozzoli, A.; Piscitelli, M.S.; Gorrino, A.; Ballarini, I.; Corrado, V. Data analytics for occupancy pattern learning to reduce the energy consumption of HVAC systems in office buildings. Sustain. Cities Soc. 2017, 35, 191–208. [Google Scholar] [CrossRef]
- Lu, J.; Sookoor, T.; Srinivasan, V.; Gao, G.; Holben, B.; Stankovic, J.; Field, E.; Whitehouse, K. The smart thermostat. In Proceedings of the 8th ACM Conference on Embedded Networked Sensor Systems—SenSys ’10, Delft, The Netherlands, 6–8 November 2010; pp. 211–224. [Google Scholar]
- Fan, C.; Xiao, F.; Wang, S. Development of prediction models for next-day building energy consumption and peak power demand using data mining techniques. Appl. Energy 2014, 127, 1–10. [Google Scholar] [CrossRef]
- Fan, C.; Xiao, F.; Li, Z.; Wang, J. Unsupervised data analytics in mining big building operational data for energy efficiency enhancement: A review. Energy Build. 2018, 159, 296–308. [Google Scholar] [CrossRef]
- Gaitani, N.; Lehmann, C.; Santamouris, M.; Mihalakakou, G.; Patargias, P. Using principal component and cluster analysis in the heating evaluation of the school building sector. Appl. Energy 2010, 87, 2079–2086. [Google Scholar] [CrossRef]
- Wall, J.; Guo, Y.; Li, J.; West, S. A Dynamic Machine Learning-Based Technique for Automated Fault Detection in HVAC Systems. ASHRAE Trans. 2011, 117, 449–456. [Google Scholar]
- Yu, F.; Chan, K. Assessment of operating performance of chiller systems using cluster analysis. Int. J. Therm. Sci. 2012, 53, 148–155. [Google Scholar] [CrossRef]
- Fan, C.; Xiao, F.; Yan, C. A framework for knowledge discovery in massive building automation data and its application in building diagnostics. Autom. Constr. 2015, 50, 81–90. [Google Scholar] [CrossRef]
- Howard, P.; Runger, G.; Reddy, T.A.; Katipamula, S. Automated Data Mining Methods for Identifying Energy Efficiency Opportunities Using Whole-Building Electricity Data. ASHRAE Trans. 2016, 122, 422–433. [Google Scholar]
- Yu, F.; Chan, K. Using cluster and multivariate analyses to appraise the operating performance of a chiller system serving an institutional building. Energy Build. 2012, 44, 104–113. [Google Scholar] [CrossRef]
- Li, G.; Hu, Y.; Chen, H.; Li, H.; Hu, M.; Guo, Y.; Liu, J.; Sun, S.; Sun, M. Data partitioning and association mining for identifying VRF energy consumption patterns under various part loads and refrigerant charge conditions. Appl. Energy 2017, 185, 846–861. [Google Scholar] [CrossRef]
- Cerquitelli, T.; Chicco, G.; Di Corso, E.; Ventura, F.; Montesano, G.; Del Pizzo, A.; Gonzalez, A.M.; Sobrino, E.M. Discovering electricity consumption over time for residential consumers through cluster analysis. In Proceedings of the 2018 International Conference on Development and Application Systems (DAS), Suceava, Romania, 24–26 May 2018; pp. 164–169. [Google Scholar] [CrossRef]
- Tang, F.; Kusiak, A.; Wei, X. Modeling and short-term prediction of HVAC system with a clustering algorithm. Energy Build. 2014, 82, 310–321. [Google Scholar] [CrossRef]
- Xiao, F.; Fan, C. Data mining in building automation system for improving building operational performance. Energy Build. 2014, 75, 109–118. [Google Scholar] [CrossRef]
- Ren, X.; Yan, D.; Hong, T. Data mining of space heating system performance in affordable housing. Build. Environ. 2015, 89, 1–13. [Google Scholar] [CrossRef] [Green Version]
- Dobiáš, J.; Macek, D. Leadership in Energy and Environmental Design (LEED) and its Impact on Building Operational Expenditures. Procedia Eng. 2014, 85, 132–139. [Google Scholar] [CrossRef] [Green Version]
- ASHRAE. Thermal Environmental Conditions for Human Occupancy (ANSI/ASHRAE 55-2017); American Society of Heating, Refrigeration and Air-Conditioning Engineers: Atlanta, GA, USA, 2017; Available online: https://www.ashrae.org/technical-resources/standards-and-guidelines (accessed on 15 August 2021).
- Anderson, A.; Rezaie, B. Geothermal technology: Trends and potential role in a sustainable future. Appl. Energy 2019, 248, 18–34. [Google Scholar] [CrossRef]
- Air Conditioner Basics Part II—Thermodynamics. Available online: https://sandium.com/general-hvac/air-conditioner-basics-part-ii-thermodynamics.html (accessed on 1 August 2021).
- Serale, G.; Fiorentini, M.; Capozzoli, A.; Bernardini, D.; Bemporad, A. Model Predictive Control (MPC) for Enhancing Building and HVAC System Energy Efficiency: Problem Formulation, Applications and Opportunities. Energies 2018, 11, 631. [Google Scholar] [CrossRef] [Green Version]
- Li, W.; Koo, C.; Hong, T.; Oh, J.; Cha, S.H.; Wang, S. A novel operation approach for the energy efficiency improvement of the HVAC system in office spaces through real-time big data analytics. Renew. Sustain. Energy Rev. 2020, 127, 109885. [Google Scholar] [CrossRef]
- Papadopoulos, S.; Kontokosta, C.; Vlachokostas, A.; Azar, E. Rethinking HVAC temperature setpoints in commercial buildings: The potential for zero-cost energy savings and comfort improvement in different climates. Build. Environ. 2019, 155, 350–359. [Google Scholar] [CrossRef]
- Do, H.; Cetin, K.S. Data-Driven Evaluation of Residential HVAC System Efficiency Using Energy and Environmental Data. Energies 2019, 12, 188. [Google Scholar] [CrossRef] [Green Version]
- Jung, W.; Jazizadeh, F. Human-in-the-loop HVAC operations: A quantitative review on occupancy, comfort, and energy-efficiency dimensions. Appl. Energy 2019, 239, 1471–1508. [Google Scholar] [CrossRef]
- Erickson, V.L.; Carreira-Perpiñán, M.Á.; Cerpa, A.E. Occupancy Modeling and Prediction for Building Energy Management. ACM Trans. Sens. Networks 2014, 10, 1–28. [Google Scholar] [CrossRef] [Green Version]
- Lawton, R. Time Series Analysis and its Applications. Int. J. Forecast. 2001, 17, 299–301. [Google Scholar] [CrossRef]
- Benesty, J.; Chen, J.; Huang, Y.; Cohen, I. Optimal Filters in the Time Domain. Natur. Comput. Ser. 2009, 2, 1–18. [Google Scholar] [CrossRef]
- Talei, H.; Essaaidi, M.; Benhaddou, D. An End to End Real Time Architecture for Analyzing and Clustering Time Series Data: Case of an Energy Management System. In Proceedings of the 2018 6th International Renewable and Sustainable Energy Conference (IRSEC), Rabat, Morocco, 5–8 December 2018; pp. 1–7. [Google Scholar]
- Tureczek, A.; Nielsen, P.S.; Madsen, H. Electricity Consumption Clustering Using Smart Meter Data. Energies 2018, 11, 859. [Google Scholar] [CrossRef] [Green Version]
- Tureczek, A.M.; Nielsen, P.S.; Madsen, H.; Brun, A. Clustering district heat exchange stations using smart meter consumption data. Energy Build. 2019, 182, 144–158. [Google Scholar] [CrossRef]
- Bahmani, B.; Kumar, R.; Vassilvitskii, S. Scalable K-Means++. ArXiv 2012, arXiv:1203.64025, 622–633. [Google Scholar] [CrossRef]
- Elbow Method—Yellowbrick v1.1. Documentation. Available online: https://www.scikit-yb.org/en/latest/api/cluster/elbow.html (accessed on 1 October 2020).
- Sklearn.metrics.silhouette_score—Scikit-Learn 0.23.2. Documentation. Available online: https://scikit-learn.org/stable/modules/generated/sklearn.metrics.silhouette_score.html (accessed on 1 October 2020).
- Sklearn.metrics.davies_bouldin_score—Scikit-Learn 0.23.2. Documentation. Available online: https://scikit-learn.org/stable/modules/generated/sklearn.metrics.davies_bouldin_score.html (accessed on 1 October 2020).
- Sklearn.metrics.calinski_harabasz_score—Scikit-Learn 0.23.2. Documentation. Available online: https://scikit-learn.org/stable/modules/generated/sklearn.metrics.calinski_harabasz_score.html (accessed on 1 October 2020).
- Nepal, B.; Yamaha, M.; Sahashi, H.; Yokoe, A. Analysis of Building Electricity Use Pattern Using K-Means Clustering Algorithm by Determination of Better Initial Centroids and Number of Clusters. Energies 2019, 12, 2451. [Google Scholar] [CrossRef] [Green Version]
- Sklearn.preprocessing.MinMaxScaler—Scikit-Learn 0.23.2. Documentation. Available online: https://scikit-learn.org/stable/modules/generated/sklearn.preprocessing.MinMaxScaler.html (accessed on 1 October 2020).
- Sklearn.preprocessing.StandardScaler—Scikit-Learn 0.23.2. Documentation. Available online: https://scikit-learn.org/stable/modules/generated/sklearn.preprocessing.StandardScaler.html (accessed on 1 October 2020).
- Klearn.preprocessing.RobustScaler—Scikit-Learn 0.23.2. Documentation. Available online: https://scikit-learn.org/stable/modules/generated/sklearn.preprocessing.RobustScaler.html (accessed on 1 October 2020).
- Yuan, C.; Yang, H. Research on K-Value Selection Method of K-Means Clustering Algorithm. J 2019, 2, 226–235. [Google Scholar] [CrossRef] [Green Version]
- Wang, N.; Zhang, J.; Xia, X. Energy consumption of air conditioners at different temperature set points. In Proceedings of the IEEE Africon 11, Victoria Falls, Zambia, 13–15 September 2011; pp. 1–6. [Google Scholar] [CrossRef]


| Data Aspect | Description |
|---|---|
| Before Wrangling | |
| Initial data Dimension | 12 by 525477 |
| Description | 1 min interval data that represent the following features: date, timeslot, others in kilowatt (kW), plug loads in kilowatt (kW), lighting in kilowatt (kW), HVAC consumption in kilowatt (kW), total in kilowatt (kW), others in kilowatt hour (KWh), plug kilowatt hour (KWh), lighting in kilowatt hour (KWh), HVAC consumption in in kilowatt hour (KWh), total in kilowatt Hour (KWh) |
| Sampling Rate | 1 min |
| Number of rows missing | 123 |
| After Wrangling | |
| Final Dimensions | 3 by 8760 |
| Sampling Rate | 1 h |
| Number of rows | 8760 |
| Data Span Period | From October 2018 to September 2019 |
| Day/Time Slot | 00:00 05:59 | 06:00 06:59 | 07:00 07:59 | 08:00 08:59 | 09:00 09:59 | 10:00 13:59 | 14:00 15:59 | 16:00 17:59 | 18:00 19:59 | 20:00 23:59 |
|---|---|---|---|---|---|---|---|---|---|---|
| Working | 0 | 1 | 7 | 17 | 19 | 21 | 22 | 23 | 2 | 0 |
| From 00:00 to 7:59 | From 8:00 to 12:59 | From 13:00 to 23:59 | ||||||||
| Saturday | 0 | 5 | 0 | |||||||
| Sunday | 0 | 3 | 0 | |||||||
| Vacation | 0 | 5 | 0 | |||||||
| Metric Name | Description | Mathematical Formula | Interpretation of Score |
|---|---|---|---|
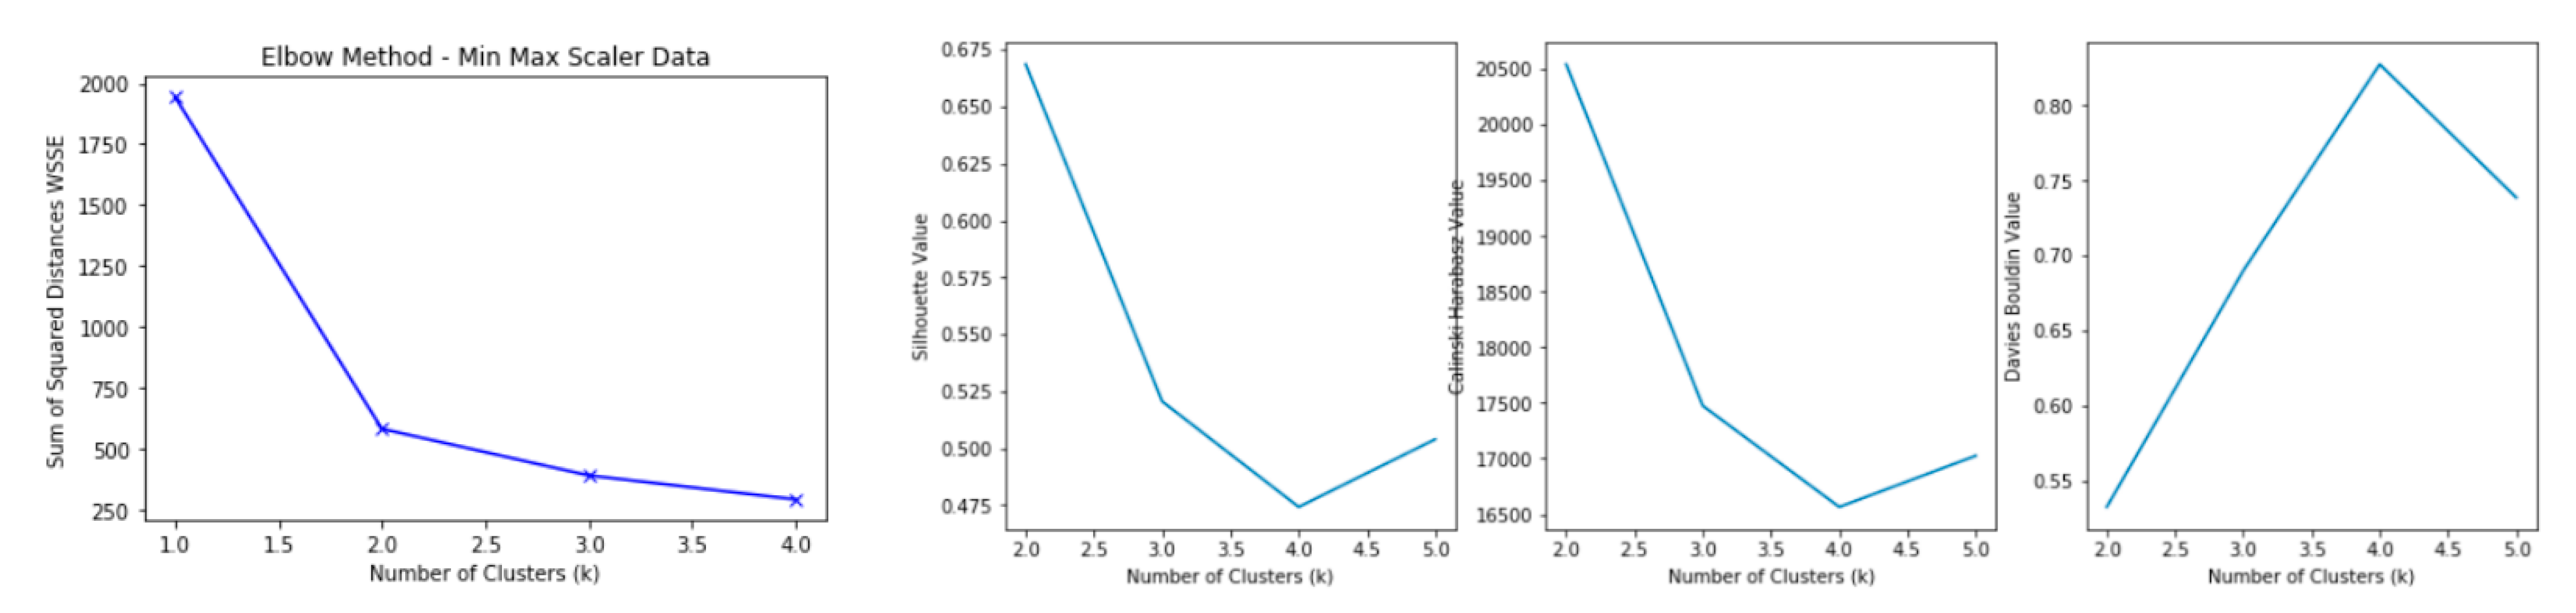
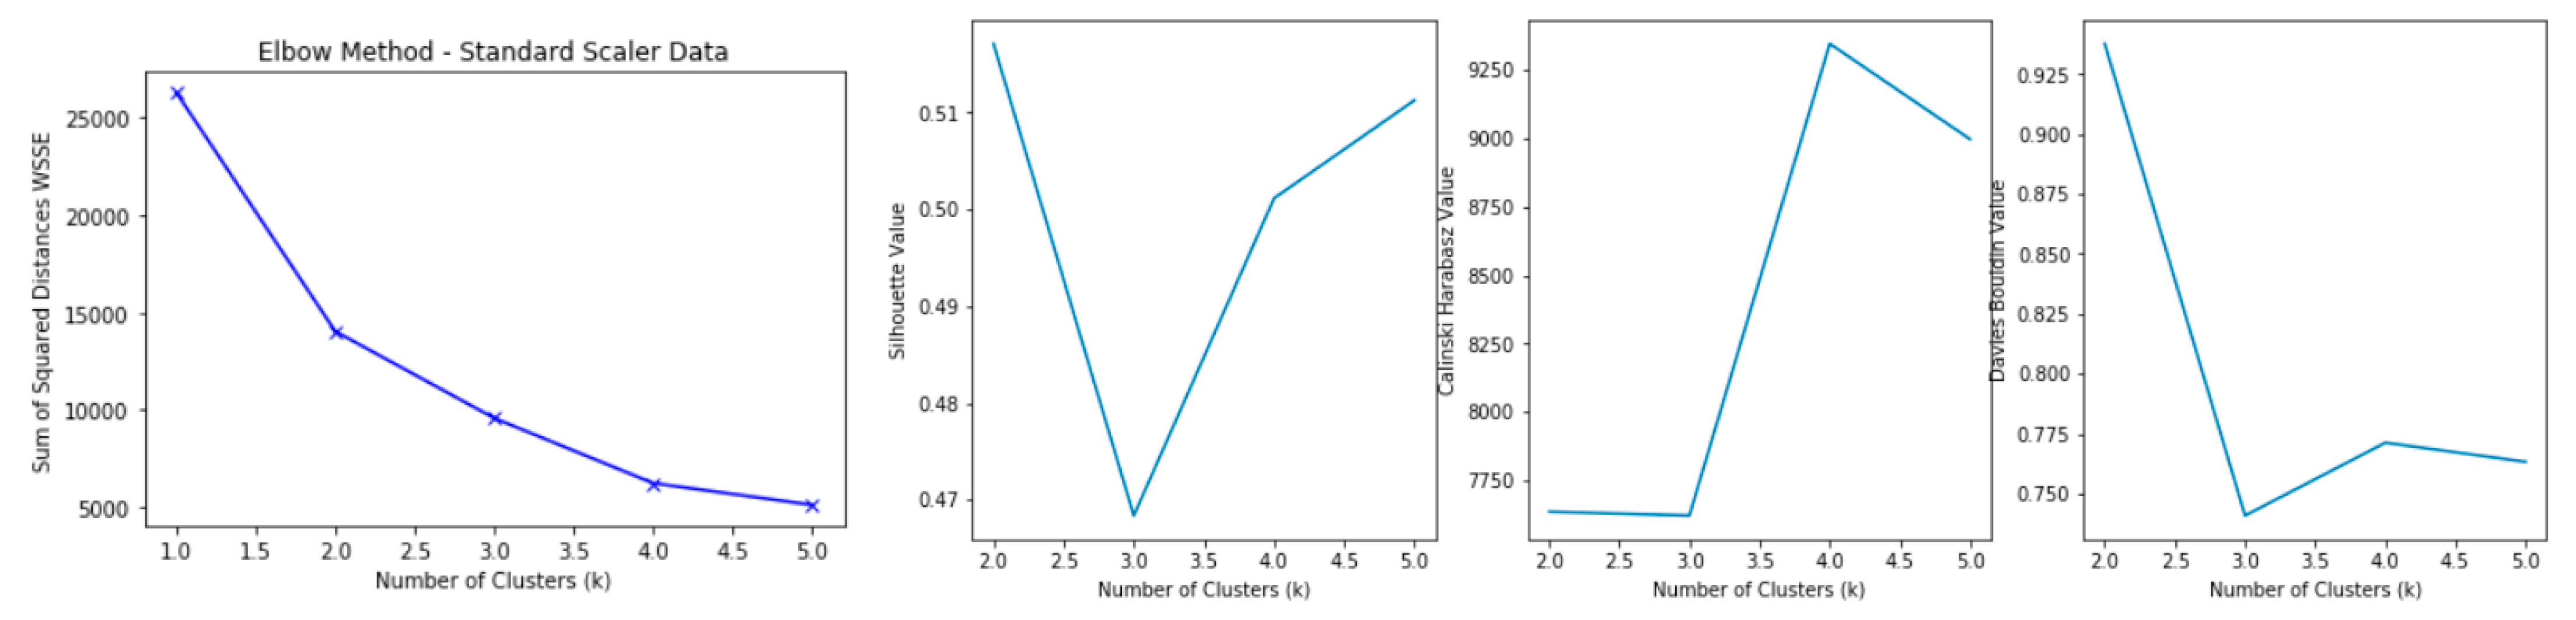
| Elbow Method [37] | Looks at the within-cluster sum square (measures the intra-cluster variation) as a function of the number of clusters | WSSE = | Lower is better (homogenous clusters), as a higher score represents more heterogeneous clusters |
| Silhouette Score [38] | Used to study the separation distance between the resulting clusters | Silhouette Score = x: mean distance to the points in the closest cluster y: the mean intra cluster distance | Silhouette Score value is in the range of (1, 1) +1 indicates that the sample is far away from the neighboring clusters. A value of 0 indicates that the sample is on or very close to the decision boundary between two neighboring clusters and negative values indicate that those samples might have been assigned to the wrong cluster. |
| Davies Bouldin Score [39] | The average similarity measure of each cluster with its most similar cluster, where similarity is the ratio of within-cluster distances to between-cluster distances. | Davies Bouldin Score = where icd refers to intra cluster distance | Minimum score is 0 with lower values indicating better clustering |
| Calinski Harabasz Score [40] | The score is defined as ratio of the sum of between clusters dispersion and of inter-cluster dispersion | Calinski Harabasz Score = where bcd refer to between cluster dispersion and icd refer inter cluster dispersion | Higher score refers to better defined clusters |
| Scaling Method | Description | Mathematical Formula |
|---|---|---|
| Min-Max Scaler | Used to normalize data in the range of [0,1] For each value in the feature, the minimum value is subtracted and then divided by difference between the original maximum and original minimum [42] | |
| Standard Scaler | Used to rescale the distribution of the data by subtracting the mean and then dividing by the standard deviation [43] | |
| Robust Scaler | Primary used to remove the effect of outliers as the centering and scaling of this scaler are based on percentiles [44] |
| Scaling Method | Clusters Size | ||
|---|---|---|---|
| Cluster 0 | Cluster 1 | Cluster 2 | |
| Min-Max Scaler | 3775 | 2545 | 2440 |
| Standard Scaler | 3630 | 2569 | 2561 |
| Robust Scaler | 1095 | 5725 | 1940 |
| Clusters Content | Min Max Scaling | Standard Scaling | Robust Scaling | ||||||
|---|---|---|---|---|---|---|---|---|---|
| Cluster # | Number of Data Points | HVAC kWh | Outdoor Temperature (F) | Number of Data Points | HVAC kWh | Outdoor Temperature (F) | Number of Data Points | HVAC kWh | Outdoor Temperature (F) |
| 0 | 4247 | 2.332612 | 78.75936 | 4228 | 2.314971 | 78.85005 | 4143 | 2.254525 | 79.09003 |
| 1 | 3167 | 2.961723 | 55.12472 | 3161 | 2.902028 | 55.19329 | 3168 | 2.795683 | 55.53346 |
| 2 | 1346 | 12.74543 | 83.57281 | 1371 | 12.75034 | 82.94384 | 1449 | 12.5911 | 81.40787 |
| Month | Oct_18 | Nov_18 | Dec_18 | Jan_19 | Feb_19 | Mar_19 | Apr_19 | May_19 |
|---|---|---|---|---|---|---|---|---|
| Number of timeslots | 254 | 325 | 85 | 319 | 177 | 114 | 70 | 2 |
| Hour | 0 | 1 | 2 | 3 | 4 | 5 | 6 | 7 | 8 | 9 | 10 | 11 | 12 | 13 | 14 | 15 | 16 | 17 | 18 | 19 | 20 | 21 | 22 | 23 |
|---|---|---|---|---|---|---|---|---|---|---|---|---|---|---|---|---|---|---|---|---|---|---|---|---|
| Freq | 18 | 22 | 17 | 20 | 29 | 32 | 85 | 112 | 112 | 113 | 105 | 94 | 88 | 79 | 71 | 73 | 73 | 76 | 37 | 25 | 18 | 13 | 14 | 14 |
| Clusters Content | Min Max Scaling | Standard Scaling | Robust Scaling | ||||||
|---|---|---|---|---|---|---|---|---|---|
| Cluster # | Number of Data Points | HVAC kWh | N_Users | Number of Data Points | HVAC kWh | N_Users | Number of Data Points | HVAC kWh | N_Users |
| 0 | 5973 | 1.988811 | 0.693286 | 1711 | 5.62081 | 20.877265 | 5716 | 1.791676 | 0.621064 |
| 1 | 2440 | 7.964945 | 20.47541 | 6029 | 2.051677 | 0.713717 | 1984 | 5.705946 | 17.899194 |
| 2 | 347 | 14.778369 | 2.951009 | 1020 | 14.17153 | 14.804902 | 1060 | 14.037649 | 15.153774 |
| Timeslots | Increase in HVAC Consumption: Explanation |
|---|---|
| All working days 6:00 to 7:00 a.m. | Setpoint was changed |
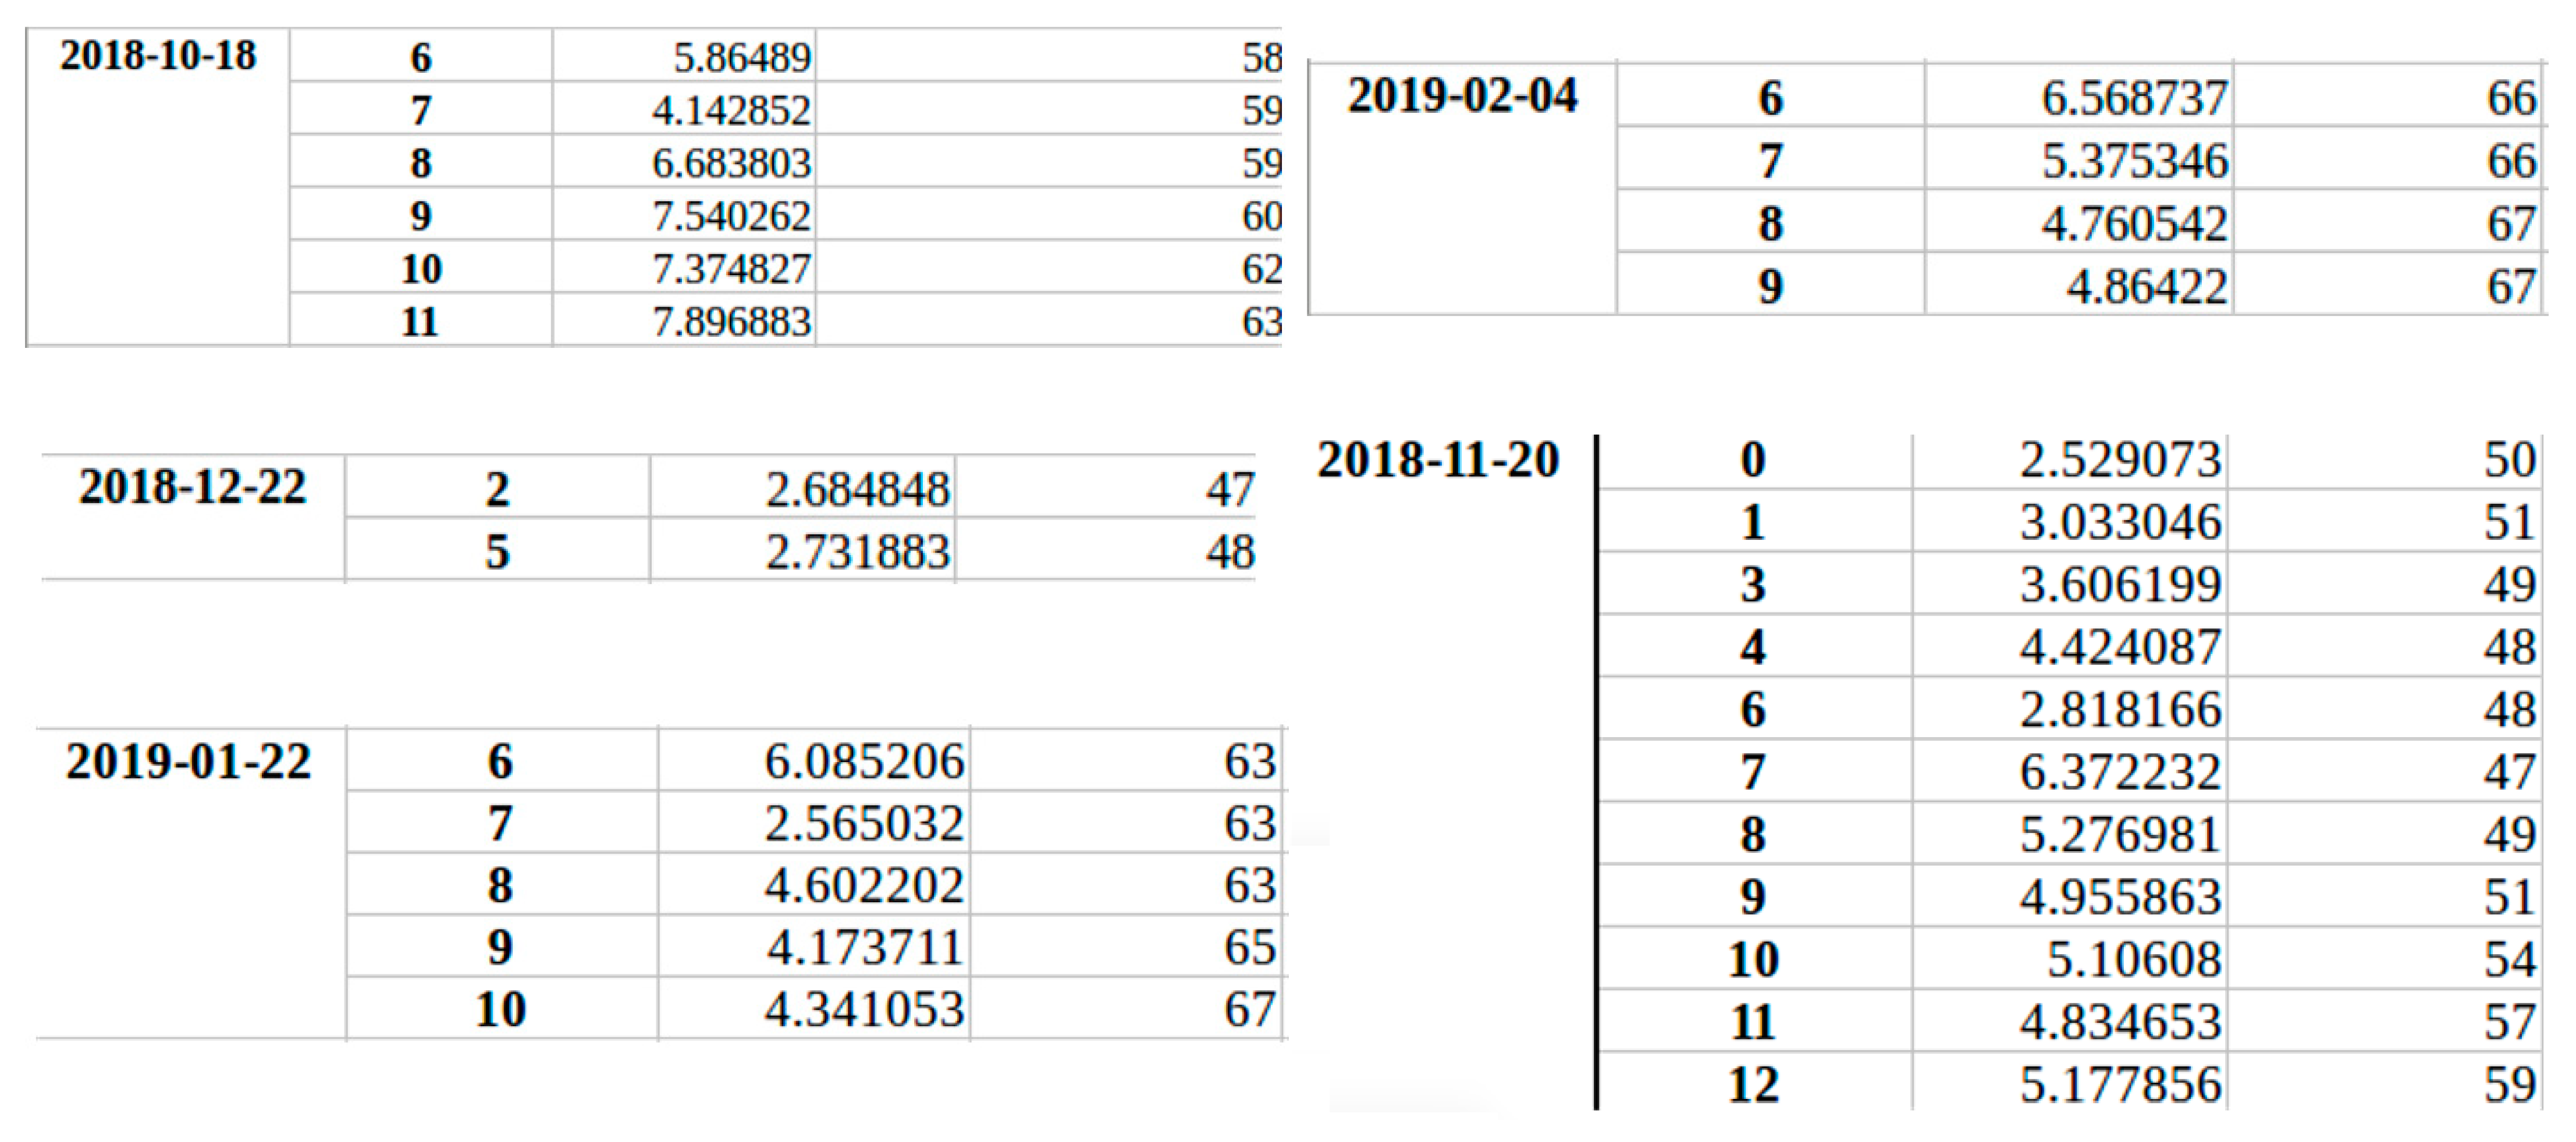
| Some 6:00 a.m. to 7:00 a.m. slots for vacations still have a high consumption Example: 23,24 November; 31 December 2018, 21 January 2019, 18 February | Some areas did not switch to unoccupied mode properly in the BAS system, causing an inefficiency |
| - Columbus Day (Monday: 8 October 2018): 06:00 a.m. to 17:00 - Thanksgiving Day (Thursday: 22 November 2018) - Saturday 10 August 2019: high consumption from 7:00 a.m. to 17:00 | Either HARC staff worked during this day, or the day was not input as a vacation day in the system, causing an inefficiency |
| November 24, 2018: 3:00 a.m.: 11 kWh 26 November: 2:00 a.m. and 5:00 a.m.: more than 9 kWh | Either an outlier or inefficiency. The building had a minimum temperature setpoint of 65F. When a zone reached that temperature during winter nights, the heating systems warmed up that specific zone. |
| For all working days between 6:00 a.m. to 17:00 | The control system did not allow the configuration of occupancy-based setpoints |
| Hour | 0 | 2 | 3 | 4 | 5 | 6 | 7 | 13 | 14 | 15 | 16 | 17 | 18 | 20 |
|---|---|---|---|---|---|---|---|---|---|---|---|---|---|---|
| Freq | 1 | 1 | 1 | 1 | 1 | 8 | 2 | 4 | 3 | 3 | 4 | 4 | 2 | 1 |
| Clusters Content | Min Max Scaler | Standard Scaler | Robust Scaler | ||||||
|---|---|---|---|---|---|---|---|---|---|
| HVAC kWh | Outdoor Temperature (F) | N_Users | HVAC kWh | Outdoor Temperature (F) | N_Users | HVAC kWh | Outdoor Temperature (F) | N_Users | |
| Cluster 0 | 2.92041 | 79.321325 | 0.79497 | 1.98926 | 79.047934 | 0.625069 | 13.87707 | 83.121461 | 15.52785 |
| Cluster 1 | 7.96495 | 74.409836 | 20.4754 | 8.98954 | 76.07863 | 18.82016 | 1.774806 | 70.057293 | 0.747598 |
| Cluster 2 | 2.35077 | 55.230648 | 0.8503 | 2.39227 | 54.342054 | 1.759859 | 5.714216 | 66.734021 | 17.44433 |
Publisher’s Note: MDPI stays neutral with regard to jurisdictional claims in published maps and institutional affiliations. |
© 2021 by the authors. Licensee MDPI, Basel, Switzerland. This article is an open access article distributed under the terms and conditions of the Creative Commons Attribution (CC BY) license (https://creativecommons.org/licenses/by/4.0/).
Share and Cite
Talei, H.; Benhaddou, D.; Gamarra, C.; Benbrahim, H.; Essaaidi, M. Smart Building Energy Inefficiencies Detection through Time Series Analysis and Unsupervised Machine Learning. Energies 2021, 14, 6042. https://doi.org/10.3390/en14196042
Talei H, Benhaddou D, Gamarra C, Benbrahim H, Essaaidi M. Smart Building Energy Inefficiencies Detection through Time Series Analysis and Unsupervised Machine Learning. Energies. 2021; 14(19):6042. https://doi.org/10.3390/en14196042
Chicago/Turabian StyleTalei, Hanaa, Driss Benhaddou, Carlos Gamarra, Houda Benbrahim, and Mohamed Essaaidi. 2021. "Smart Building Energy Inefficiencies Detection through Time Series Analysis and Unsupervised Machine Learning" Energies 14, no. 19: 6042. https://doi.org/10.3390/en14196042
APA StyleTalei, H., Benhaddou, D., Gamarra, C., Benbrahim, H., & Essaaidi, M. (2021). Smart Building Energy Inefficiencies Detection through Time Series Analysis and Unsupervised Machine Learning. Energies, 14(19), 6042. https://doi.org/10.3390/en14196042