Abstract
In a resorption heat pump, the adsorption and desorption reaction of ammonium chloride (NH4Cl) with ammonia (NH3) is of interest as a Low Temperature Salt (LTS). Reviewing previously published NH4Cl-NH3 equilibrium lines, ammonium chloride appears to offer useable working temperatures (50–70 °C) in the 10–15 bar pressure range during the adsorption reaction, and provides beneficial working conditions for the desorption reaction, when compared with alternative LTS candidates at atmospheric pressure. The NH4Cl-NH3 adsorption and desorption reactions, using a NH4Cl composite salt, have been evaluated under dynamic ‘real-world’ conditions in a Large Temperature Jump (LTJ) experimental testing rig; although there are concerns with mass transfer characteristics, the salt exhibits no hysteresis between the adsorption and desorption reactions, contrary to previous literature. The experimentally obtained equilibrium line values for the reaction enthalpy and entropy are 29,835 J/mol and 207 J/(mol∙K), respectively. Using a semi-empirical model, the NH4Cl composite salt has been successfully characterised, enabling the prediction of salt reaction behaviour. The model constants, A and n, identified are 4.5 and 5 for adsorption and 5 and 4 for desorption, with an overall salt active fraction (applicable to both reactions) of 0.98. Overall, the working equilibrium line and the dynamic performance of ammonium chloride has been investigated and the applicability of NH4Cl as a LTS for a resorption heat pump determined.
1. Introduction
1.1. Research Justification
In a resorption heat pump arrangement, Yang et al. [1] highlight that one of the major limiting factors when considering a salt pairing, is the ability of the Low Temperature Salt (LTS) to desorb at low vapour pressures. When considered alongside the uptake values of ammonia (NH3) per gram of salt, Table 1, the salts ammonium chloride (NH4Cl), sodium bromide (NaBr) and barium chloride (BaCl2) are the most frequently reviewed for LTS applicability. Bao and Wang [2], provide a useful summary table of previous resorption working pair studies. However, not detailed clearly in previous works is the dynamic characterisation of the ammonia-ammonium chloride reaction across the working pressure range for a resorption heat pump application. The characterisation of the salt will enable the prediction of the ammonia-ammonium chloride reaction to imposed pressure and temperature conditions. Understanding the kinetics and dynamic performance of ammonium chloride, a single-phase change (3-0) reaction with ammonia refrigerant, will enable an assessment of the suitability of the salt as a low temperature adsorbent in a resorption heat pump configuration.

Table 1.
Key characteristics of LTS candidates (Data taken from: a [3], b [4] and c [5]).
1.2. Background
Ammonia sorption cycles can be used in gas-fired heat pumps (GFHP) and have the potential to reduce carbon dioxide (CO2) emissions from domestic heating systems. Interest in sorption reactions in the UK has developed over recent years as a consequence of climate change targets [6] and the opportunity to develop more efficient heating systems using reversible sorption reactions.
The reversible reactions of halide salts with ammonia in a resorption configuration (where the condenser and evaporator in conventional ab/adsorption system is replaced by a second sorbent reactor), works on the principle of different thermochemical equilibrium properties for different salts [7,8,9]. For the same working pressure, two different salts have different equilibrium temperatures, and the careful selection of the salt pairing can provide wide-ranging applications for refrigeration, heat pumping and thermal transforming. The broad applicability of reversible ammonia-salt reactions, alongside optimised salt pairings, was identified by Alefeld [10], who stated that “reactions can be found […] over a wide temperature range,” as well as identifying that salts available as adsorbents are inexpensive. Therefore, selecting salts as a low-cost adsorbent, coupled with a resorption configuration with a reduced number of components, offers a comparatively low-cost alternative to conventional heat pump cycles.
A simplistic outline for the operation of a single-effect resorption heat pump, operating with two different salts and using ammonia as a refrigerant, is shown in Figure 1. The salt with the higher equilibrium temperature (greater ammonia affinity) is termed the High Temperature Salt (HTS) and the salt with a lower equilibrium temperature (lower ammonia affinity) is referred to as the Low Temperature Salt (LTS). The temperature levels TL, TM and TH are detailed in a later paragraph in the introduction.
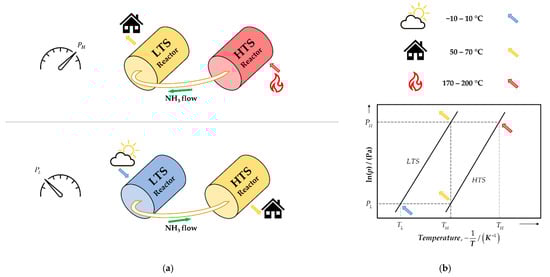
Figure 1.
(a) Block diagram showing the operation of two linked salt reactors in a resorption configuration with heat flows during the high-pressure and low-pressure phases. (b) The temperature levels and simplified Clapeyron diagram for the cycle. For detail on temperature level definitions refer to Section 1.2, and for the equilibrium lines, see Figure 2.
Previous and present research at The University of Warwick (Warwick) has focused on the reversible sorption reactions of ammonia with activated carbon [11,12], using physical sorption (van der Waals attraction between adsorbent and adsorbate), but chemical sorption (chemisorption) reactions in comparison, which use reversible chemical reactions, offer higher adsorption quantities (>1 kg/kg) [13]. The use of a resorption configuration has the additional advantage of using the reversible reaction heat of halide-salts with ammonia, which can be almost double the latent heat of vaporisation [14,15].
A note on refrigerant selection; the desirable characteristics of an adsorbate (refrigerant) are to have: high heats of reaction compared to sensible heating of the adsorbent; thermal stability; environmental harmlessness; and ideally be non-toxic. Work at Warwick has considered water, methanol and ammonia as potential candidates. Critoph [16] discusses the merits of a series of adsorbates, concluding that methanol and ammonia are strong contenders for heat pumping applications. Ammonia has no ozone depletion potential, no global warming potential and although is toxic, when considering pressure and instability of methanol above 120 °C and reviewing the operating temperatures of a UK based heating system in the following paragraph, ammonia is determined to have the best potential.
For applicability in a GFHP, a single-effect resorption configuration needs to operate from three temperature levels, which for a UK domestic heating application are well defined. To ensure compatibility with existing gas burner technology, the high temperature heat input, TH, is the temperature of heat delivered by a conventional gas burner, considered to be in the region 170 to 200 °C. The medium temperature heat output, TM, is the required delivery temperature for domestic space heating and hot water purposes. The stipulation by the UK Health and Safety Executive (HSE) is that hot water should be distributed at 50 °C (or higher) to prevent Legionella growth [17], hence, a medium temperature, TM in the 50 to 70 °C range is necessary. Finally, ambient heat is utilised for the low temperature heat input, TL. Taken from the UK Meteorological (MET) office climate averages for Coventry (Coundon) from 1981 to 2010, the minimum average annual temperature was 6.4 °C, with an average minimum monthly temperature (February) of 1.3 °C [18]. Therefore, resorption system design needs to consider candidate salts that provide a sufficient temperature equilibrium drop in the low temperature heat input, TL, range of −10 to +10 °C, to drive a desorption chemisorption reaction during the low-pressure phase.
Using the three temperature ranges identified and the widely referenced thermodynamic equilibrium reaction data for chloride salts with ammonia from Neveu and Castaing [5,19], a figure can be generated to begin to consider candidate salts and potential salt pairings, Figure 2.
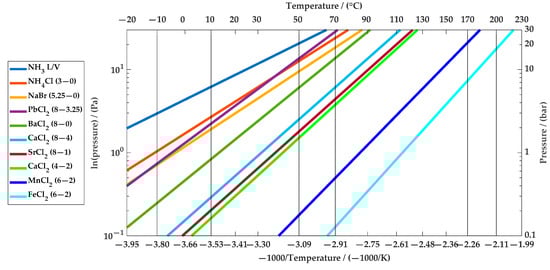
Figure 2.
Plot of Pressure vs. −1000/Temperature, with the temperature bands TL (blue, left), TM (centre, orange) and TH (right, red) highlighted. See Appendix A, Table A1 for data values.
Based on the equilibrium lines in Figure 2, ammonium chloride (NH4Cl), sodium bromide (NaBr), lead chloride (PbCl2) and barium chloride (BaCl2) can be considered as candidates for the LTS. However, NH4Cl is the only candidate salt, for the −10 to 10 °C low temperature heat input, that operates at working pressures on or above atmospheric pressure. To ensure a suitable power density and overall performance from the ammonia-salt reactions, working at, or above, atmospheric pressure is highly valuable when considering mass transfer for the completion of the sorption reaction [20,21,22,23].
The data presented in this article are used to research and analyse NH4Cl performance with regard to LTS resorption heat pump applications, with the: identification of a single equilibrium line; dynamic behaviour understanding of the salt; and the identification of modelling parameters to characterise the salt. These findings enable performance predictions of the salt performance to imposed temperature and pressure conditions.
1.3. Summary
To summarise the position and methodology of the work, the ammonium chloride salt was impregnated in an Expanded Natural Graphite (ENG) sheet to improve thermal conductivity and to reduce swelling and agglomeration [24,25]. The salt in ENG—termed a composite salt adsorbent (sorbent)—was tested using the Large Temperature Jump (LTJ) method [25,26] to drive the chemisorption reactions. The ENG is used as a host matrix for the adsorbent ammonium chloride salt to address poor thermal conductivity of the salt itself, in addition to dispersing the salt through the porous structure.
Rapid heating or cooling of the sorbent in an LTJ experiment, to initiate the adsorption or desorption reaction, respectively, imitates realistic reaction conditions of the composite salt in a resorption heat exchanger. The measured temperature and pressure profiles during the reaction therefore show a representative dynamic response of the salt, and the equilibrium conditions for the reaction at different temperature and pressure conditions can be measured. This is in comparison to experimental work conducted using Rubotherm sorption analysis, which heats and cools the salt comparatively slowly and does not highlight the dynamic response.
Using empirically obtained equilibrium lines from the measured temperature and pressure data, a semi-empirical model developed by Critoph et al. [27], based on previous published work by Mazet et al. [28], is used to define model parameters: salt active fraction; heat transfer resistance (gap between composite and heat transferring wall); and model constants, A’s and n’s (separate for adsorption and desorption)), which characterises the salt performance. Using the model parameters, predictions of the practical performance of NH4Cl can be made and used in future models to predict the performance in a resorption heat pump cycle.
In the subsequent sections, details of the materials, experimental methodology and analysis methodology, used for the characterisation of the ammonium chloride composite salt, are presented. The results and analysis section follows, drawing together the key findings, before concluding on the suitability of the ammonium chloride salt for low temperature salt resorption heat pump applications.
2. Methods and Materials
The LTJ method was used to analyse the performance of the NH4Cl composite salt, using the same configuration as detailed by Hinmers and Critoph [25]. The LTJ ‘unit-cell’ reactor is a double pipe heat exchanger (shell and tube), with the composite salt occupying the tube side and the heat transfer fluid flowing through the shell side. The arrangement consists of a ¾’’ O.D. stainless steel tube (shell), welded with cuffs around a ½’’ O.D. stainless steel tube (tube) to form the reactor, Figure 3.
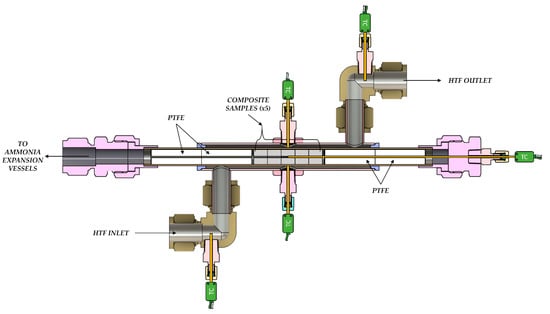
Figure 3.
Cross-section through the double pipe large temperature jump (LTJ) ‘unit-cell’ reactor, shown insulated in Figure 4. The composite salt samples occupy the tube side, with the heat transfer fluid (HTF) flowing around the tube in the shell side. PTFE (polytetrafluoroethylene) sections shown are used to fill any void or ‘dead volume’ in the tube side, not occupied by the composite samples. Threaded thermocouple fittings and thermocouples (TC) are shown for completeness.
The shell side heat transfer fluid (Huber M20.235.20, Huber, Offenburg, Germany) is supplied from two air-cooled temperature-controlled circulator baths (Huber Ministat 240, Huber, Offenburg, Germany). The temperature ‘jump’ is generated by setting the baths to different temperatures and controlling the flow through a pneumatically controlled valve manifold, operated using a two-way switch. The tube side (ammonia side) connects to the experimental rig through Swagelok face seals.
Insulated sheathed Type K thermocouples are used to measure temperature, except for the tube side wall, where a pair of grounded Type K thermocouples are used to obtain an average wall temperature. A Danfoss AKS 32 pressure transmitter (060G2080, Danfoss, Nordborg, Denmark), calibrated using a deadweight pressure tester, was used to monitor the pressure in the system. All measurement devices were connected to a National Instruments (NI) CompactDAQ for data acquisition, using NI LabView (NI, Austin, US) to display and save real-time data. The thermocouples were connected using a NI 9214 thermocouple module and the pressure transducer signal through a NI 9220 analogue input module.
The prepared composite samples, see Section 2.1, were placed in the reactor and connected to the experimental rig. The complete experimental setup is shown in Figure 4 and a schematic diagram of the rig is detailed in Appendix B, Figure A1.
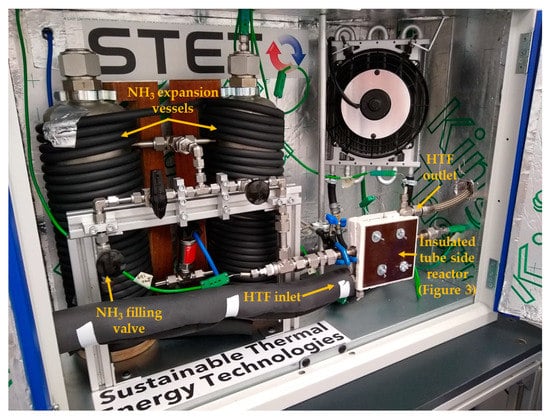
Figure 4.
The complete large temperature jump experimental test rig. Connections to DAQ: thermocouple cables, green and pressure transducer, blue.
The rig and reactor were evacuated, the reactor isolated and the rig expansion vessels filled with ammonia. A separate air-cooled temperature-controlled circulator bath (Ministat 240, Huber, Offenburg, Germany) using water as the heat transfer fluid was used to regulate the temperature of the expansion vessels through the hose wrapping seen in Figure 4. Once stable temperature and pressure conditions were reached, the reactor and the composite samples were exposed to ammonia by opening the reactor to the expansion vessels. A series of LTJ tests were conducted using the published equilibrium data for NH4Cl from An et al. [3] as a guide to observe the phase change at different pressures in the range 0.5–8 bar.
2.1. Composite Material Preparation
The composite material is an ammonium chloride salt (method applicable to other salts) impregnated in an ENG sheet (SIGRATHERM® Graphite Lightweight Board, ECOPHIT® L10/1500, SGL Carbon, Wiesbaden, Germany), 10 mm thick, 1500 g/m2 area weight and a density of 150 kg/m3. The sheet is cut into disks that fit into the ½’’ I.D. tube side bore using a waterjet cutter. Each of the disks are dried and a 1 mm hole drilled through the centre. The central hole allows the composite sample centre temperature to be measured during the chemisorption reaction using a stainless steel sheathed thermocouple. The PTFE sections, Figure 3, were also manufactured with a central hole drilled for gas transport and to be able to access the samples with a thermocouple.
Five disks are used in the reactor and all are dried in an oven (ED-S 56, Binder, Tuttlingen, Germany) for 30 min at 150 °C. A solution of ammonium chloride was produced on a mixing plate (Stuart heat-stir US152, Cole Palmer, Stone, UK) into which the dried samples were submerged and then placed under vacuum for 24 h. The samples were then removed from the solution and placed in an oven at 200 °C for 1 h to evaporate water from the samples resulting in the composite salt [25].
The mass of the dried ENG disks and the mass of the dried composite samples were measured immediately after removal from the oven and an uptake of salt calculated.
Salt uptake into the composite samples is determined from the strength of the salt solution. For the set of experiments reported in this article, two ‘full’ concentrated composite samples and one set of ‘half’ (reduced concentration) samples were produced using ≥99.5% ACS grade ammonium chloride. In the first ‘full’ concentrated sample set, 7.48 g of salt in 25.09 g of water, gave an uptake of 0.435 g (ENG mass = 0.648 g; salt-to-ENG ratio = 0.67); in the second ‘full’ sample set, 9.29 g of salt in 25.23 g of water, lead to an uptake of 0.471 g (ENG mass = 0.666 g; salt-to-ENG ratio = 0.71); for the final ‘half’ concentrated samples, 4.71 g of salt in 25.46 g of water, gave an uptake of 0.188 g (ENG mass = 0.648 g; salt-to-ENG ratio = 0.29). The density of ammonium chloride used in the MATLAB® (MathWorks, Natick, MA, US) model (Results Section 3.2.2) is 1519 kg/m3 [29].
2.2. Analysis Methodology
An example of a complete LTJ cycle output is shown in Figure 5, with the temperature of the tube side wall (driving temperature), the centre composite sample thermocouple and pressure for the system plotted.
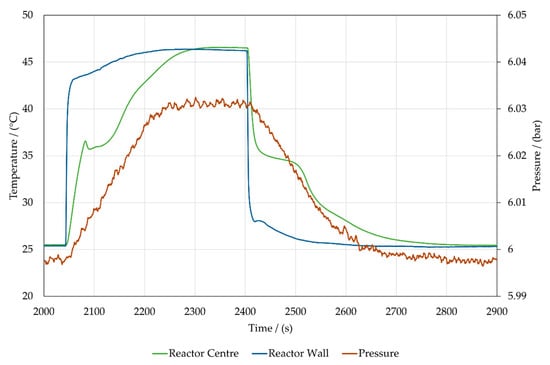
Figure 5.
An example Large Temperature Jump (LTJ) graphical output for ammonium chloride. The tube side wall temperature (driving temperature) and the composite sample centre temperature read from the primary y-axis and the pressure from the secondary y-axis. Plotted is a desorption reaction followed by an adsorption reaction, with clear phase changes for both reactions.
To determine individual salt equilibrium pressures and temperatures, an adsorption or desorption reaction dataset is analysed in MATLAB® and two plots are generated, as illustrated for one such p-T pair in Figure 6. The first, Figure 6a, is the centre temperature profile (K) plotted against time (s) and the second, Figure 6b, is a plot of ln(p) (Pa) versus −1000/T (1000/K). A linked data cursor is programmed between the two plots to determine the onset of adsorption or desorption—by recording the onset temperature and pressure noted by the data cursor. For each experimental dataset (an adsorption or desorption reaction), an equilibrium ‘point’ is recorded and from which a scatter graph is generated, and a linear regression fitted to the data to obtain the working equilibrium lines.
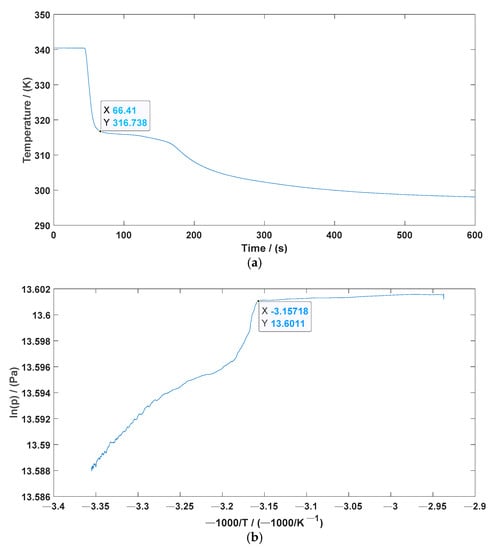
Figure 6.
An example of the two MATLAB® plot outputs with a linked datatip readout for an adsorption reaction at approximately 8 bar with a temperature jump of 70 °C to 25 °C. (a) Plot of the composite sample temperature (K) against time (s) with the start of the isothermal phase change highlighted—in this case at 66.4 s and 316.7 K. (b) Plot of ln(p) (Pa) versus −1000/T (1000/K) with the onset of adsorption visibly clear with a sharp change in ln(p) value indicating the onset.
The analysis method is summarised here and in Figure 6, with the resultant equilibrium line plotted and explained in Section 3.1.
2.3. Heat Transfer and Reaction Kinetics
An empirically informed heat transfer and reaction model was programmed using MATLAB®, to be able to simulate the dynamic response of the ammonium chloride salt to a LTJ test. The reaction model is based on work by Mazet, Amouroux and Spinner [28,30]; Lebrun and Spinner [31]; and uses the mass of adsorbate and reaction state based methodology more recently developed by Critoph et al. [27], from which the main equations used to model the behaviour are summarised.
Equation (1) details the Mazet equation [28] on which the model is based,
where: X is the advancement of the reaction (0 to 1); p is the pressure; pEQ is the equilibrium pressure; and A and n are constants. Critoph et al. [27] developed the advancement model to a physical adsorbent ‘mass based’ model, based on the mass of adsorbate in each state during the reaction. The main reaction equations are as follows,
where A and B refer to masses of adsorbent associated with A mols and B mols of adsorbed ammonia, respectively; for ammonium chloride which reacts as 3 NH3/.0 NH3, A = 3, B = 0. pEQ for Equations (1)–(3) is calculated from the Clapeyron equation:
where: ΔH is the reaction enthalpy change (J/mol); ΔS is the reaction entropy change (J/(mol∙K)); R0 is the universal gas constant, 8.413 (J/(mol∙K)); and T is the temperature (K). Note that an assumption of the derivation of the Clapeyron equation is that the processes are reversible. This implies that if (irreversible) hysteresis is present the reaction enthalpy cannot be calculated accurately from the slope of the non-equilibrium line.
To model the composite salt samples, a one-dimensional radial finite volume model was developed, discretising the composite samples radially and defining the tube side wall temperature (experimentally measured) as a boundary condition to the first radial element. Each volume is treated as a lumped parameter with heat flows across the control volume boundary and enthalpy flows from the chemisorption reaction.
Critoph et al. [27,32] and Atkinson et al. [33] detail the heat transfer model using an unsteady application of the first law for each control volume. The heat transfer model considers changes in internal energy of the ENG, salt, adsorbate and gas within the control volume, as well as considering the enthalpy flows of the masses of gas adsorbate entering or leaving each control volume. The equations for heat transfer during adsorption and desorption are not repeated for succinctness, refer to [27,33] for details.
Hinmers and Critoph [25] explain the iterative process of the model. To summarise, an equal pressure rise (or drop) is assumed across all control volumes in a small time-step, with knowledge of the heat flows into/out of each volume and the kinetic equation, the temperature change of each control volume can be calculated and a corresponding quantity of sensible heating, or adsorption/desorption of ammonia can be determined. Heat and mass balance equations are used to check continuity.
The model requires the identification of five parameters to match the model output to the experimentally observed data. These are the: thermal conductivity of ENG; wall heat transfer coefficient (characterised by an ammonia gas gap between the tube side wall and composite sample); fraction of salt accessible to gas (active fraction); and the two reaction rate constants (A and n), Equations (2) and (3), which are different for adsorption and desorption. To test the validity of the obtained constants, the data are matched across the experimental pressure range and for different temperature jumps at the same pressure.
For modelling purposes, five nodes were simulated and a time step of between 0.001 and 0.05 s ensured model stability.
3. Results and Discussion
3.1. Equilibrium Lines
For each experimental dataset in adsorption and desorption, an equilibrium data point was recorded, and a scatter graph plotted. For the three sample sets (2 × ‘full’ and 1 × ‘half’) tested, the data correlated well across the range of temperatures and pressures tested with no hysteresis present, contrary to previously published hysteresis bands [34]. All three adsorption and desorption data sets are plotted as a single series, adsorption with the black and orange markers (●) and desorption with black and blue (♦) markers, Figure 7.
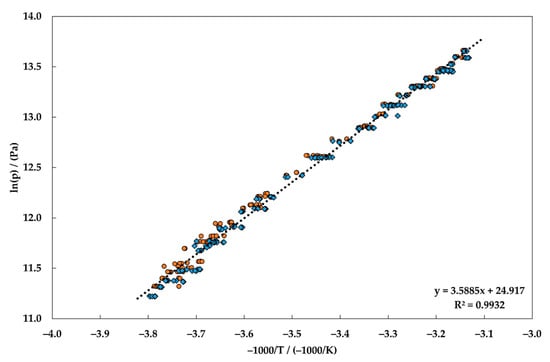
Figure 7.
Scatter graph for all data points for adsorption (black and orange circles) and desorption (black and blue diamonds) across all sample sets tested. A linear regression line (dotted line) is plotted through the complete data set; a fit of 0.99 indicates a strong positive correlation and the resulting line of best fit equation is displayed.
The linear regression fit is used to calculate a new working equilibrium line, which is then compared to existing literature data [3,8,34,35], Figure 8. The gradient of the new working equilibrium line visually matches across the range to existing literature lines, indicating the heat of reaction has been correctly measured. The percentage differences in the gradient from Furrer [36], An et al. [3] and Oliveria et al. [34] are within 11%.
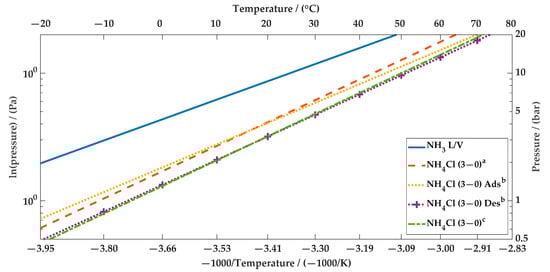
Figure 8.
Plot of Pressure (0.5 to 20 bar) vs. −1000/Temperature showing the ammonia liquid/vapour line, a single reported line from An et al. [3] a, Oliveira et al. [34] adsorption and desorption lines b and this work from Figure 7 c.
The calculated enthalpy and entropy values for the single experimental line are 29,835 J/mol and 207 J/(mol∙K), respectively.
3.2. Large Temperature Jump (LTJ) Modelling Results
Using the calculated equilibrium data to determine the reaction onset during the temperature jump and matching the ‘gap’ (heat transfer resistance) to observe the correct heat transfer, the remaining model parameters—active fraction, A, and n—were determined.
The constants remain valid across the range of pressures tests and can be used to simulate and predict the performance of the ammonium chloride salt to an imposed temperature change crossing the phase equilibrium line.
3.2.1. Concentration Influence
The ‘half’ (or reduced) concentration samples were considered in the subsequent analysis because of mass transfer concerns with the ‘full’ uptakes, Figure 9.
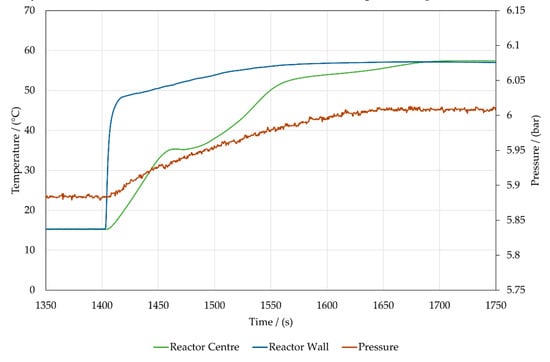
Figure 9.
Example LTJ desorption output for a 15 to 55 °C temperature jump, using a ‘full’ concentrated composite sample set, exhibiting a curved pressure rise indicating mass transfer issues.
The curved nature of the pressure curve shows the tests are mass transfer rather than heat transfer limited, whereas, running LTJ tests with a ‘half’ concentrated sample set yielded a result with a comparatively linear pressure rise, Figure 10. This suggests the salt has a better distribution through the ENG with smaller crystal sizes and consequently, the analysis in the following section has been based on the ‘half’ concentrated sample data.
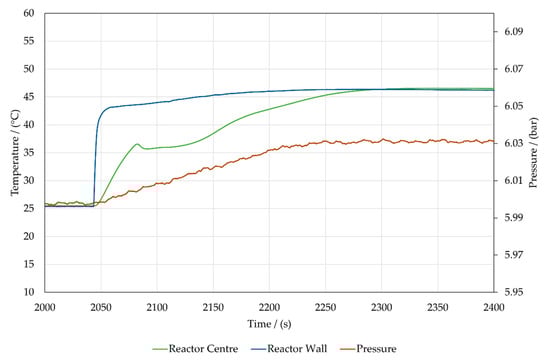
Figure 10.
Example LTJ desorption output for a 25 to 45 °C temperature jump, using a ‘half’ concentrated composite sample set, exhibiting a linear pressure rise with the reaction indicating heat transfer limitations.
The impact of greater uptake and effect on the temperature and pressure profiles should be noted for future research and testing of ammonium chloride.
3.2.2. MATLAB® Modelling Results
Through iterative trial and error, the adsorption and desorption kinetic reaction constants, Equations (2) and (3), were determined. Once the conductivity of the ENG [25] and the heat transfer resistance (gap—obtained by finding the optimum balance of matching the initial centre temperature profile change and the rate of pressure change) were set, the remaining constants were found through observing the impact of changing each constant on the simulated response, noting the change, noticing the interaction between the constants and repeating for each constant. Regarding visible changes to the model output, the active fraction, which is the amount of salt available to the reaction, most obviously affects the duration of the isothermal phase change and the pressure rise; the constant A, which is an assumed constant Arrhenius term [28], affects the gradient of the slope at the end of the reaction, after the isothermal phase change, where the composite samples heat (or cool) to the wall driving temperature; the power constant n, which represents an approximation to the order of the reaction, impacts how long the reaction takes to complete adsorption or desorption, affecting the shape of the temperature and pressure profiles following the isothermal phase change.
The active fraction to match in both adsorption and desorption was found to be 0.98. The reaction constants, A and n, for adsorption were found to be 4.5 and 5, respectively and in desorption 5 and 4, respectively.
Using the same characterisation methodology, the published values from Hinmers and Critoph [25] for barium chloride are: for desorption, A = 3.5 and n = 2; and for adsorption, A = 0.1 and n = 1.
Figure 11, shows model outputs for an adsorption and desorption reaction at 7.0 bar and Figure 12, shows the outputs for reactions at 2.0 bar.
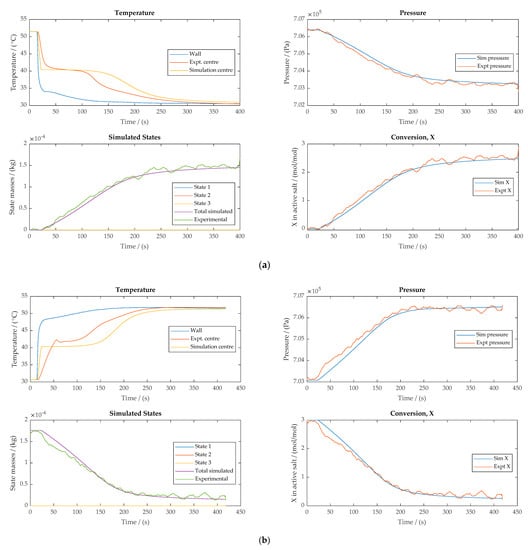
Figure 11.
Model outputs for an LTJ test at 7.0 bar for (a) adsorption and (b) desorption.
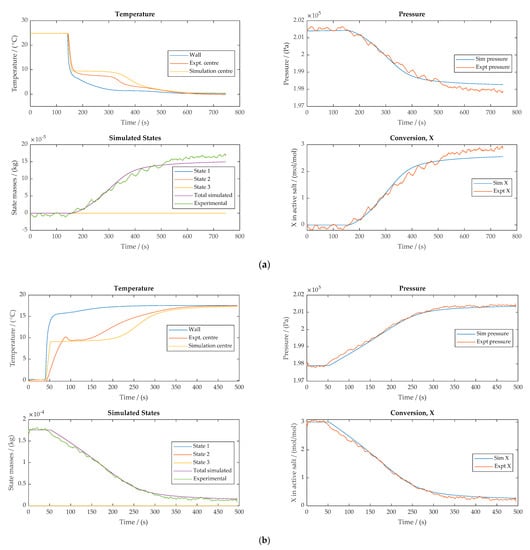
Figure 12.
Model outputs for an LTJ test at 2.0 bar for (a) adsorption and (b) desorption.
As reported by Hinmers and Critoph [25], Figure 11b and Figure 12b show a ‘supersaturated’ state, where the temperature of the composite sample exceeds equilibrium, before returning to the observed isothermal phase change temperature. Although the characteristic is seen in results across the pressure range, the ability of the model to predict the onset is not affected and provides confidence in the model outputs.
The characteristic is not as clearly observed in the adsorption reactions, Figure 11a and Figure 12a.
In adsorption, the pressure profile model match is very good across the tested pressure range and the temperature profile match is representative and indicative of the varying temperature within the composite samples.
For desorption, as with adsorption, the pressure profile match is very good across the tested pressure range and the temperature profile is again representative of the sample under test. Although there is a deviation in the temperature profile during the initial temperature change (rise or fall) towards the isothermal phase change, the remaining temperature profile, in particular following the isothermal phase change, matches well to the experimental data.
A summary of outputs across the tested pressure range are shown in Appendix C, Figure A2a–h.
One anomalous characteristic has sometimes been observed in low pressure testing (<1.5 bar). During testing, when approaching lower pressure experiments, the salt exhibits a change in behaviour which is triggered by a clear and distinct heat release during an adsorption cycle.
An example of anomalous adsorption behaviour seen in Figure 13. It is certain that the sample is no longer behaving homogenously and that some portion is suddenly reacting, but we do not have a precise explanation. The sample always recovers from the anomaly and the reaction proceeds to completion without further issue. It can be returned to high pressure desorption and adsorption with repeatability. However, on repetition of low pressure cycles the anomalies can recur although not necessarily in the same place or with the same magnitude. This behaviour does not preclude the use of the salt in real machines, but it would be good to have a better knowledge of it.
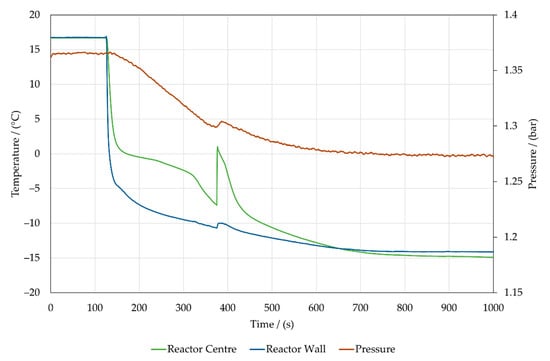
Figure 13.
Plot showing the anomalous adsorption behaviour, visible in the temperature and the pressure profile.
With regard to the performance of the salt in a resorption heat pump cycle, there is an importance of discerning the behaviour of adsorption during a high-pressure phase and desorption characteristics during the low-pressure phase.
For adsorption during the high-pressure phase, referring to Section 1 (Figure 1b) for the temperature regions of interest, and Figure 7 for the new working equilibrium line, an adsorption temperature of 50–70 °C will be possible at working pressures of 10–19 bar (50 °C at 10 bar, 60 °C at 14 bar and 70 °C at 19 bar), within suitable working bounds for future domestic heating systems.
For desorption at low (ambient) temperature, during the low-pressure phase, results from experiment and simulation show that ammonium chloride can achieve fast desorption cycles (10 min) at desorption driving temperatures of 5–10 °C during tests at 1 bar. To achieve the same desorption conditions with BaCl2, for example, a working pressure of 0.3 bar (negative pressure system) is necessary.
Positive pressure systems are more resilient, in that small outward leaks do not necessarily lead to immediate lack of function, whereas inward leaks of air (in negative pressure systems) result in rapid reductions in performance. Additionally, a higher working pressure can reduce any mass transfer issues.
Therefore, ammonium chloride should be considered as a promising candidate for the LTS in a resorption heat pump configuration; particularly when considering the low-pressure phase desorption cycle for which ambient heat conditions are exploited.
4. Further Work
Further work is required to understand in detail the structural changes of the salt as low-pressure tests are approached and whether there is any potential impact on performance.
Additionally, competing candidate LTSs should be characterised, e.g., barium chloride and sodium bromide (excluding lead chloride because of hazards with the salt). Characterisation of all three salts will enable a comprehensive understanding of the performance of LTS salt candidates, and an informed decision can be made on the selection of the LTS in a proof-of-concept resorption machine.
5. Conclusions
Large Temperature Jump (LTJ) experiments have been successfully completed over a range of pressures on an ammonium chloride-ENG salt composite adsorbent, using ammonia as the adsorbate. Temperature and pressure conditions imposed on the composite salt are representative of full-scale applications and the test results have enabled refinement of the working equilibrium line, with reaction enthalpy and entropy values of 29,835 J/mol and 207 J/(mol∙K), respectively.
Although mass transfer concerns are prevalent with higher salt loading, tests with a designed lower uptake were analysed. After identifying the active fraction as 0.98 and the reaction constants, A and n, for adsorption as 4.5 and 5, respectively, and for desorption 5 and 4, respectively, the model was able to successfully match the temperature and pressure profiles over the range of pressure tests (and temperature jumps) conducted.
The results provide confidence in being able to predict the performance of ammonium chloride as a LTS in a resorption system and further work will look to assess other possible candidates and build towards the manufacture of a proof-of-concept resorption machine.
Author Contributions
Conceptualisation, R.E.C., G.H.A. and S.H.; methodology, S.H. and G.H.A.; software, R.E.C., G.H.A. and S.H.; validation, R.E.C., G.H.A., S.H. and M.v.d.P.; formal analysis, G.H.A.; investigation, G.H.A.; resources, R.E.C. and M.v.d.P.; data curation, G.H.A.; writing—original draft preparation, G.H.A.; writing—review and editing, R.E.C., G.H.A., S.H. and M.v.d.P.; visualisation, G.H.A.; supervision, R.E.C.; project administration, G.H.A.; funding acquisition, R.E.C. All authors have read and agreed to the published version of the manuscript.
Funding
This research was supported by an EPSRC Standard Research Grant (EP/V011316/1) on “Sorption Heat Pump Systems” and an EPSRC DTP studentship (EP/R513374/1, project reference: 2199243) with the School of Engineering at The University of Warwick.
Data Availability Statement
The data presented in this study are available in the main text or attached Appendices.
Acknowledgments
From the University of Warwick, thanks go to Charles Joyce for technical guidance and for manufacturing the materials needed to conduct the LTJ tests; thanks also go to Stan Shire for guidance on weekly meetings.
Conflicts of Interest
The authors declare no conflict of interest.
Appendix A
| Salt | M.W./(g/mol) | Reaction Heat (ΔH)/(J/mol) | Reaction Entropy (ΔS)/(J/(mol∙K)) |
|---|---|---|---|
| NH3 L/V | 17.03 | 22,863 | 191.6 |
| NH4Cl (3-0) | 53.49 | 29,433 | 207.9 |
| NaBr (5.25-0) | 102.89 | 30,491 | 208.8 |
| PbCl2 (8-3.25) | 278.11 | 34,317 | 223.6 |
| BaCl2 (8-0) | 208.23 | 37,665 | 227.3 |
| CaCl2 (8-4) | 110.98 | 41,013 | 230.3 |
| SrCl2 (8-1) | 158.53 | 41,431 | 228.8 |
| CaCl2 (4-2) | 110.98 | 42,268 | 229.9 |
| MnCl2 (6-2) | 125.84 | 47,416 | 228.1 |
| FeCl2 (6-2) | 126.75 | 51,266 | 228.0 |
Appendix B
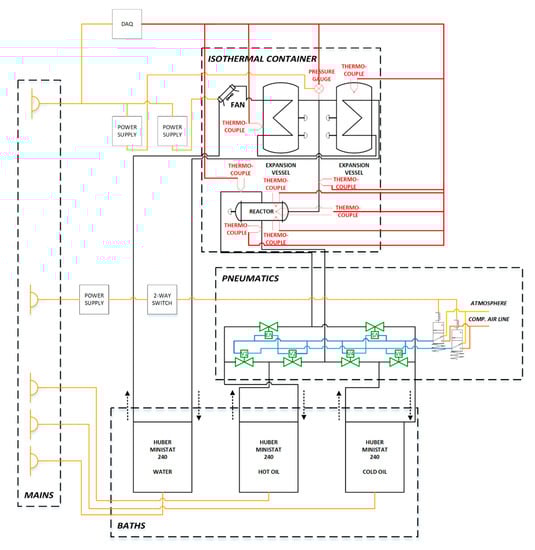
Figure A1.
Large Temperature Jump block diagram showing the practical setup, with pneumatic control and measurement system.
Appendix C
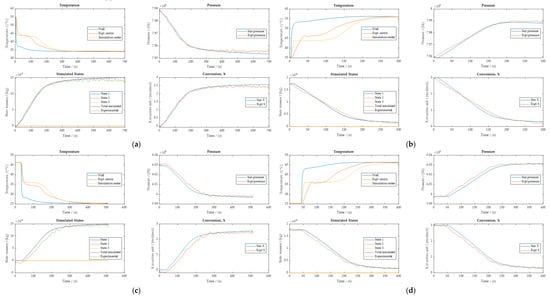
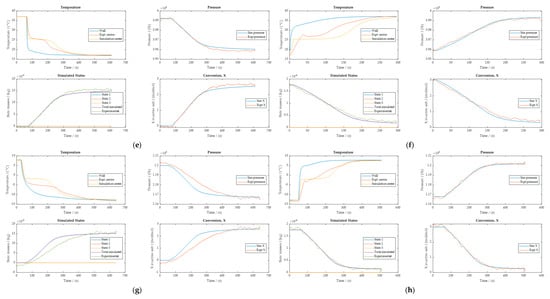
Figure A2.
Adsorption (left) and desorption (right) model outputs for LTJ tests at: (a,b) 8.0 bar; (c,d) 6.0 bar; (e,f) 4.0 bar; and (g,h) 1.2 bar.
References
- Yang, Z.; Qu, M.; Gluesenkamp, K.R. Ammonia-based chemisorption heat pumps for cold-climate heating applications: A comprehensive review. Appl. Therm. Eng. 2020, 179, 115674. [Google Scholar] [CrossRef]
- Bao, H.S.; Wang, R.Z. A Review of Reactant Salts for Resorption Refrigeration Systems. Int. J. Air Cond. Refrig. 2010, 18, 165–180. [Google Scholar] [CrossRef]
- An, G.L.; Wang, L.W.; Gao, J. Two-stage cascading desorption cycle for sorption thermal energy storage. Energy 2019, 174, 1091–1099. [Google Scholar] [CrossRef]
- Bao, H.; Ma, Z.; Roskilly, A.P. A chemisorption power generation cycle with multi-stage expansion driven by low grade heat. Energy Convers. Manag. 2017, 150, 956–965. [Google Scholar] [CrossRef]
- Neveu, P.; Castaing, J. Solid-gas chemical heat pumps: Field of application and performance of the internal heat of reaction recovery process. Heat Recovery Syst. CHP 1993, 13, 233–251. [Google Scholar] [CrossRef]
- Climate Change Act. 2008. Available online: http://www.legislation.gov.uk/ukpga/2008/27/contents (accessed on 20 March 2021).
- Neveu, P.; Castaing-Lasvignottes, J. Development of a numerical sizing tool for a solid-gas thermochemical transformer—I. Impact of the microscopic process on the dynamic behaviour of a solid-gas reactor. Appl. Therm. Eng. 1997, 17, 501–518. [Google Scholar] [CrossRef]
- Bao, H.S.; Oliveira, R.G.; Wang, R.Z.; Wang, L.W.; Ma, Z.W. Working pairs for resorption refrigerator. Appl. Therm. Eng. 2011, 31, 3015–3021. [Google Scholar] [CrossRef]
- Li, T.X.; Wang, R.Z.; Kiplagat, J.K.; Chen, H. Experimental study and comparison of thermochemical resorption refrigeration cycle and adsorption refrigeration cycle. Chem. Eng. Sci. 2010, 65, 4222–4230. [Google Scholar] [CrossRef]
- Alefeld, G. Energiespeicherung durch heterogen-verdampfung. I. Physikalish-technische grundlagen (Energy storage by heterogeneous evaporation. I. Technical and physical principles). Wärme 1975, 81, 89–93. [Google Scholar]
- Rivero-Pacho, A.M.; Critoph, R.E.; Metcalf, S.J. Modelling and development of a generator for a domestic gas-fired carbon-ammonia adsorption heat pump. Renew. Energy 2017, 110, 180–185. [Google Scholar] [CrossRef] [Green Version]
- Low Carbon Heating Technology Innovation: Grant Scheme. 2017. Available online: https://www.gov.uk/government/publications/low-carbon-heating-technology-innovation-grant-scheme (accessed on 7 September 2021).
- Wang, L.W.; Wang, R.Z.; Oliveira, R.G. A review on adsorption working pairs for refrigeration. Renew. Sustain. Energy Rev. 2009, 13, 518–534. [Google Scholar] [CrossRef]
- Worsøe-Schmidt, P. A solar-powered solid-absorption refrigeration system. Int. J. Refrig. 1979, 2, 75–84. [Google Scholar] [CrossRef]
- Worsøe-Schmidt, P. Solar refrigeration for developing countries using a solid-absorption cycle. Int. J. Ambient. Energy 1983, 4, 115–124. [Google Scholar] [CrossRef]
- Critoph, R.E. Activated carbon adsorption cycles for refrigeration and heat pumping. Carbon 1989, 27, 63–70. [Google Scholar] [CrossRef]
- Health and Safety Executive (HSE). Managing Legionella in Hot and Cold Water Systems. Available online: https://tinyurl.com/swsd2wz4 (accessed on 8 March 2021).
- UK Meteorological (MET) Office. Coventry (West Midlands Conurbation). MET Office. Available online: https://tinyurl.com/e55jb55r (accessed on 26 March 2021).
- Lepinasse, E.; Spinner, B. Production de froid par couplage de réacteurs solide-gaz I: Analyse des performances de tels systèmes (Cold production through coupling of solid-gas reactors I: Performance analysis). Int. J. Refrig. 1994, 17, 309–322. [Google Scholar] [CrossRef]
- Li, T.X.; Wang, R.Z.; Kiplagat, J.K.; Wang, L.W.; Oliveira, R.G. Thermodynamic study of a combined double-way solid–gas thermochemical sorption refrigeration cycle. Int. J. Refrig. 2009, 32, 1570–1578. [Google Scholar] [CrossRef]
- Wang, R.; Wang, L.; Jingyi, W. Adsorption Refrigeration Technology Theory and Application; John Wiley & Sons: Singapore, 2014. [Google Scholar]
- Bao, H.S.; Oliveira, R.G.; Wang, R.Z.; Wang, L.W. Choice of Low Temperature Salt for a Resorption Refrigerator. Ind. Eng. Chem. Res. 2010, 49, 4897–4903. [Google Scholar] [CrossRef]
- Goetz, V.; Spinner, B.; Lepinasse, E. A solid-gas thermochemical cooling system using BaCl2 and NiCl2. Energy 1997, 22, 49–58. [Google Scholar] [CrossRef]
- Van der Pal, M.; Critoph, R.E. Performance of CaCl2-reactor for application in ammonia-salt based thermal transformers. Appl. Therm. Eng. 2017, 126, 518–524. [Google Scholar] [CrossRef]
- Hinmers, S.; Critoph, R.E. Modelling the ammoniation of barium chloride for chemical heat transformations. Energies 2019, 12, 4404. [Google Scholar] [CrossRef] [Green Version]
- Aristov, Y.I.; Dawoud, B.; Glaznev, I.S. Elyas A new methodology of studying the dynamics of water sorption/desorption under real operating conditions of adsorption heat pumps: Experiment. Int. J. Heat Mass Transf. 2008, 51, 4966–4972. [Google Scholar] [CrossRef]
- Critoph, R.E.; Hinmers, S.; Atkinson, G.H. Ammonia-salt sorption: Testing and analysis, modelling and validation. Presented at the International Sorption Heat Pump Conference (Virtual). In Proceedings of the International Sorption Heat Pump Conference (Virtual), Berlin, Germany, 26 August 2021; p. 100. [Google Scholar]
- Mazet, N.; Amouroux, M.; Spinner, B. Analysis and experimental study of the transformation of a non-isothermal solid/gas reacting medium. Chem. Eng. Commun. 1991, 99, 155–174. [Google Scholar] [CrossRef]
- Haynes, W.M.; Lide, D.R. CRC Handbook of Chemistry and Physics, 92nd ed.; CRC Press: Boca Raton, FL, USA, 2011; pp. 4–46. [Google Scholar]
- Mazet, N.; Amouroux, M. Analysis of heat transfer in a non-isothermal solid-gas reacting medium. Chem. Eng. Commun. 1991, 99, 175–200. [Google Scholar] [CrossRef]
- Lebrun, M.; Spinner, B. Models of heat and mass transfers in solid-gas reactors used as chemical heat pumps. Chem. Eng. Sci. 1990, 45, 1743–1753. [Google Scholar] [CrossRef]
- Hinmers, S.; Atkinson, G.H.; Critoph, R.E.; van der Pal, M. Ammonia-Salt Reactions for Heat Pumping and Thermal Transforming Applications. Presented at the Heat Powered Cycles (HPC). In Proceedings of the Heat Powered Cycles (HPC), Bilbao, Spain, 16–19 September 2021. [Google Scholar]
- Atkinson, G.H.; Critoph, S.R.; Hinmers, E. Development of an ammonia-halide salt MATLAB® model. In Proceedings of the International Sorption Heat Pump Conference (Virtual), Berlin, Germany, 22–25 August 2021; Volume 47. [Google Scholar]
- Oliveira, R.G.; Xu, J.; Wang, C.Y.; Wang, R.Z. Resorption system for simultaneous heat and cold production. In Proceedings of the International Sorption Heat Pump Conference (ISHPC), Seoul, Korea, 23–26 September 2008. [Google Scholar]
- Touzain, P. Thermodynamic values of ammonia salt reactions for chemical sorption heat pumps. In Proceedings of the International Sorption Heat Pump Conference, Munich, Germany, 24–26 March 1999; pp. 225–238. [Google Scholar]
- Furrer, M. Thermoanalytical Study of Selected Complexes of Inorganic Chlorides with Ammonia and Ammonia Derivatives, Switzerland. 1980. Available online: http://inis.iaea.org/search/search.aspx?orig_q=RN:13652849 (accessed on 22 March 2020).
Publisher’s Note: MDPI stays neutral with regard to jurisdictional claims in published maps and institutional affiliations. |
© 2021 by the authors. Licensee MDPI, Basel, Switzerland. This article is an open access article distributed under the terms and conditions of the Creative Commons Attribution (CC BY) license (https://creativecommons.org/licenses/by/4.0/).