Article

Multi-Criteria Optimization of Energy-Efficient Cementitious Sandwich Panels Building Systems Using Genetic Algorithm

by
Ehsan Mirnateghi
1 and
Ayman S. Mosallam
2,*
1
FirstElement Fuel Company, Irvine, CA 92617, USA
2
Civil & Environmental Engineering Department, University of California, Irvine, CA 92697, USA
*
Author to whom correspondence should be addressed.
Energies 2021, 14(18), 6001; https://doi.org/10.3390/en14186001
Submission received: 8 July 2021 / Revised: 26 August 2021 / Accepted: 10 September 2021 / Published: 21 September 2021

Abstract

:
This paper presents results of a study that focuses on developing a genetic algorithm (GA) for multi-criteria optimization of orthotropic, energy-efficient cementitious composite sandwich panels (CSP). The current design concept of all commercially produced CSP systems is based on the assumption that such panels are treated as doubly reinforced sections without the consideration of the three-dimensional truss contribution of the orthotropic panel system. This leads to uneconomical design and underestimating both the strength and stiffness of such system. In this study, two of the most common types of commercially produced sandwich were evaluated both numerically and experimentally and results were used as basis for developing a genetic algorithm optimization process using numerical modeling simulations. In order to develop a sandwich panel with high structural performance, design optimization techniques are needed to achieve higher composite action, while maintaining the favorable features of such panels such as lightweight and high thermal insulation. The study involves both linear and nonlinear finite element analyses and parametric optimization. The verification and calibration of the numerical models is based on full-scale experimental results that were performed on two types of commercially produced sandwich panels under different loading scenarios. The genetic algorithm technique is used for optimization to identify an optimum design of the cementitious composite sandwich panels. The GA technique combines Darwin’s principle of survival of fittest and a structured information exchange using randomized crossover operators to evolve an optimum design for the cementitious sandwich panel. Parameters evaluated in the study include: (i) shear connectors’ geometry, its volume fraction and distribution; (ii) exterior cementitious face sheets thickness and (iii) size and geometry steel wires reinforcements. The proposed optimization method succeeded in reducing cost of materials of CSP by about 48% using genetic algorithm methodology. In addition, an optimized design for CSP is proposed that resulted in increasing the panel’s thermal resistance by 40% as compared to existing panels, while meeting ACI Code structural design criteria. Pareto-optimal front and Pareto-optimal solutions have been identified. Correlation between the design variables is also verified and design recommendation are proposed.

1. Introduction

In response to the increasing global awareness of the energy consumption and environmental impact, engineers and the construction industry are facing great challenges in developing energy-efficient and environmentally compatible civil infrastructures systems. Cementitious sandwich panel (CSP) construction system is an example of an alternative sustainable building technology that satisfies such major challenges. Compared to traditional reinforced concrete, CSP can meet all design demands with its modular design, efficient use of cementitious materials, lightweight, superior flexural strength and thermal and acoustics insulation capabilities.
Sandwich construction has been widely used by different industries in both structural and non-structural applications such as packaging and protective materials [1]. For example, the aerospace industry has been utilizing such technique since the 1950s. For aerospace application, the main attractive reason of using such system is to produce high-performance, ultra-light-weight structures. Aerospace grade of sandwich panels is typically manufactured using relatively expensive materials such as graphite/epoxy composite face sheets and high-performance aluminum or composite honeycomb core materials.
In the past few decades, applications of sandwich panels were introduced to the construction industry. One of the successful applications of sandwich panels is for repair and rehabilitation of reinforced concrete, steel and wood structural members [2,3,4]. In addition, and due to superior energy absorption and damping capabilities, sandwich panels have been utilized as a collision protection system for reinforced concrete bridges [5]. In addition to its superior thermal insulation characteristics, the light-weight feature of sandwich construction provides added benefits for eliminating the use of cranes and heavy transporting and lifting equipment at construction site (refer to Figure 1).
Historically, the majority of commercially produced sandwich panel systems available were developed by machine manufacturers rather than structural engineers. As a result, steel wire diameters, both for panel faces and shear connectors are randomly selected and in most cases are inadequate to resist most of the lading requirements for residential and commercial buildings with some few exceptions. Due to the fact that these panels are prefabricated where all design parameters are fixed, all published studies were constrained by manufacturers’ design parameters, even if such components are less than those required by building codes. For this reason, there is an urgent need to evaluate both the structural value, as well as sustainability benefits of the CSP system and provide guidance for next-generation of CSP with optimum structural and energy efficiency characteristics. In addition, the current practice for designing CSP building systems adopted by majority of engineers, ignores the three-dimensional truss geometry of such orthotropic panel systems and panels are treated conservatively as a doubly reinforced section. In fact, for conservative design, in most cases, the negative reinforcement is also ignored due to lack of confidence of a non-conventional systems in general. This overdesign leads to uneconomical design and underestimation of both strength and stiffness of such systems.
Another important issue is difficulty of predicting the degree composite action of such systems that influences the structural efficiency of the orthotropic sandwich panels. Figure 2 illustrates the concept of composite action that is mainly dependent on stiffness, strength and the arrangement of the through-the-thickness shear connectors that determine level of rigidity of a typical sandwich construction. As mentioned earlier, one of the major deficiencies of the CSP current design practice followed by the structural engineers today is neglecting the major effect of shear connectors (through-the-thickness steel wires) when calculating ultimate capacity of CSP panels under different loading conditions (axial loads, in-plane loads, out-of-plane, etc.). In addition, and by ignoring the partial composite action capacity of the panel’s section, structural calculations are commonly performed assuming zero composite action (see Figure 2a) and accordingly, the panel’s two exterior reinforced mortar faces (refer to Figure 2) are assumed to deform separately without taking into consideration of shear connectors contribution to section rigidity and overall strength of the CSP panel. This leads to panel’s section overdesign that ultimately affect negatively on the system economic feasibility and the lightweight advantages of the system.
This study aims at developing an optimization protocol of orthotropic CSP composite systems. The optimization process includes structural, cost and energy efficiency of CSP panel systems. Using both linear and nonlinear finite element analyses. The verification and calibration of the numerical models are performed using full-scale experimental results of two types of commonly used sandwich panels subjected to different loading scenarios. The comprehensive experimental program was conducted at the University of California, Irvine (UCI), for assessing structural performance of different CSP systems [6,7]. All tests were performed in accordance with the Acceptance Criteria (AC15) published by the International Code Council Evaluation Service (ICC-ES) [8].
The UCI full-scale experimental program covered wide spectrum of mechanical characterization the two CSP panel systems including in-plane shear assessment of walls, out-of-plane flexural behavior of slabs, beams and walls, in-plane quasi-static and full-reversal cyclic shear behavior of walls with and without sustained gravity loadings and axial compression, both centric and eccentric axial compression behavior of walls. Results of these studies indicated that structural performance of CSP is highly dependent on the number, spacing and mechanical properties of through-the-thickness steel connectors, which also contribute to the global strength and stiffness of CSP panels. Furthermore, experimental results showed that both flexural strength and stiffness of these sandwich panels decreases as the connector’s inclination angle decreases. On the other hand, the shear transfer wires, connecting the two faces of the CSP panels creates a local thermal bridge through the insulator core of CSP. The effect of local thermal bridging due to the existence of the through-the-thickness steel connectors also depends on the number, diameter and the inclination angle of such elements. As a result, one can see that there is a tradeoff between shear properties and thermal insulation efficiency of the CSP system. For this critical reason, there is an urgent need to optimize these systems in order to achieve the target shear capacity required for producing the desired effective composite action, while maximizing the thermal insulation capacity of such panels.
Using UCI experimental results [6], Bajracharya et al. [9] presented results of a finite element numerical analysis to predict load deformation behaviour of CSP slabs. Kabir et al. [10] conducted an investigation that focused on assessing the non-linear performance of CSP wall panels used as infill of a steel frame subjected to cycling loads. Results indicated the use of CSP panels as an infill wall retrofit system enhanced the ductility of the hybrid steel frame system. A study on dynamic characteristics of a scaled down 4-story building constructed with CSP system was performed by Kabir and Rezaifar [11]. It was concluded that the CSP panel system is sensitive to high frequency ground motion due to its high rigidity and for this reason a special ductile detailing is required when CSP panels are used as shear walls in seismic zones. Results of experimental and numerical analysis studies of CSP floor sandwich panels with parallel and inclined shear transfer connectors are reported in Refs. [12,13].
In this study, commercially available CSP panels are evaluated, both numerically and experimentally and results are used to form basis for the proposed optimization models. Next, a cost optimization parameter is defined. Details of the design optimization model and process adopted in this study are described hereafter.

2. Description and Classification of Existing CSP Technology

A typical CSP panel consists of a three-dimensional welded wire reinforcement skeleton with a modified fire-retardant Expanded PolyStyrene (EPS) insulation core. Concrete or structural mortar are applied at the site to both sides of the panel using pneumatic mortar spray machines or manually as shown in Figure 3.
For any composite or sandwich system, shear transfer elements determine the degree of composite action that influences the ultimate strength, stiffness, ductility and ultimate failure mode of the CSP structural member [14]. For this reason, the shear transfer elements must be designed such that it possesses adequate strength, stiffness, and connectivity (proper welding to exterior steel wire meshes) in order to transfer both horizontal and vertical shear stresses. According to this critical design parameter, CSP system can be classified into two following two classes:
Load-Bearing CSC Panel System with Inclined Shear Connectors (Class I): This class of panels is capable of transferring both gravity and lateral loads (e.g., wind and earthquake forces). The shear transfer elements for this class are in the form of inclined through-the-thickness high-strength cold-rolled wires with variable angles depending on the core thickness. These inclined wire reinforcements could either be individual pieces Figure 3 or continuous diagonals of warren trusses inserted through-the-thickness of the EPS core as shown in Figure 4. The distribution and number of diagonal reinforcements varies according to member type. For example, for members subjected to high out-of-plane flexural loads (e.g., floor and roof slabs), the spacing of the inclined shear connectors ranges from 100 to 150 stiches (wires) per square meter. However, for members that are mainly subjected to in-plane loads and/or light out-of-plane forces, the number of through-the-thickness shear web reinforcement reduces to 80 wire per square meter. The typical web reinforcement diameter ranges from 3.0 mm to 3.5 mm depending on the span-to-depth ratio, load type and boundary conditions. The face sheet (mesh) steel reinforcements are in the form of 3.0 mm diameter wire mesh with a grid size of 50 × 100 mm or 50 × 50 mm, depending on flexural demand. In both cases, the main reinforcement is long direction is 20 Φ 3.0 mm per linear meter of panel’s width. This type of panels may be used in moderate-to-high seismic zones depending on the use of additional special ductile detailing such as boundary elements.
Load-Bearing CSC Panel System with Parallel Shear Connectors (Class II): This class of panels is suitable for wall and partition applications due to the insufficient number and detail of shear reinforcements. As shown in Figure 5, the shear transfer elements are in the form of individual stitched parallel wires. The average number of through-the-thickness shear transfer elements per square meters is in the range of 27 to 40, which is about 27% of the corresponding number of Class I panels described earlier. Due to the parallel arrangement of the widely spaced shear transfer elements with a limited capability of horizontal shear transfer, especially at early stage of out-of-plane loading. As member’s deflection buildup and due to curvature, the parallel shear connectors away from the centerline will start to slightly rotate generating a moderate capacity for shear stress transfer. However, and depending on the intensity of the out-of-plane loading, this moderate shear transfer capacity occurs at a deflection exceeds serviceability set forth by most of the building codes. One strategy for avoiding this issue is shaping the core as a ripped slab with hot-rolled steel reinforcement as shown in Figure 5. As shown in this figure, the required core depth in this case is increased that affect the economic advantages of the system. In addition, the existence of unreinforced foam cover below the ribs may attract hair cracks.
Another issue with parallel shear connectors’ pattern is that there is a potential movement of the EPS foam core while applying the cementitious mortar that makes it very difficult to control the thickness the face layers. In order to avoid this potential core movement, two ineffective methods are adopted by the manufactures that includes (i) providing a steel stopper systems at the end, or (ii) the use of wavy EPS foam core where steel meshes are rested on wave crests. The latter method creates an issue of violating code requirements [15] where wires resting on top of the foam are not surrounded entirely by concrete or mortar as shown in Figure 5c.
For a typical panel of this class, a relatively lighter face sheet steel reinforcement is provided. The common steel mesh grid size is 80.0 × 75.0 mm that is translated to a main reinforcement in the long direction, about 14 Φ 2.5 mm per linear meter of panel’ width. However, reinforcement patterns may vary for different panels’ manufacturers. This type of panels may be used in low-to-moderate seismic zones provided that additional special ductile detailing is provided, such as boundary elements.
A summary of CSP panels’ classification as described above is detailed in the Table 1.

3. Cost Optimization of Reinforced Concrete Structures

Optimizing sandwich panel systems requires consideration of design variables as discrete quantities. Genetic algorithms (GAs) are best suited for unconstrained optimization problems [16] and it is necessary to transform the constrained problem into an unconstrained one. Therefore, a penalty-based transformation method is proposed. The penalty parameter depends on the degree of constraint violation, which is found to be well suited for a parallel search using the genetic algorithm. A genetic algorithm presented herein is a modified simple genetic algorithm (SGA) proposed by Goldberg [17] that is based on natural genetics. It combines Darwin’s principle of survival of the fittest and a structured information exchange using randomized operators to evolve an efficient search mechanism.
The majority of structural optimization published papers deals with minimization of the weight of a structure (e.g., [18,19,20]). Despite the fact that weight of a structure constitutes a significant part of the cost, minimization of the cost is the final objective for optimum use of available resources. In cost minimization, however, additional difficulties are encountered. These difficulties include definition of the cost function and uncertainties and fuzziness involved in determining the cost parameters. As a result, only a small fraction of the structural optimization papers published deal with minimization of the cost [21,22].
The majority of published papers on cost optimization of concrete structures focus on beams or girders [21]. For reinforced and prestressed concrete beams, the general cost function is commonly expressed by the following relation:
Cm = Ccb + Csb + Cpb + Cfb + Csbv + Cfib
where Cm = total materials cost; Ccb = cost of concrete; Csb = cost of flexural (bending) reinforcing steel; Cpb = cost of prestressing steel; Cfb = cost of the formwork; Csbv = cost of shear reinforcing steel; and Cfib = cost of fibers used in concrete mix. It should be noted that Equation (1) is a general relation that is reduced for special cases. For example, in case of CSP panel, costs of prestressing steel and fibers is set to zero.
Goble and Lapay [23] minimize the cost of post-tensioned prestressed concrete T- beams using the gradient projection method (GPM) [24]. In their study, the cost function included the first four terms of Equation (1) indicating that the optimum design seems to be unaffected by changes in cost coefficients. This conclusion was invalidated by other recent studies. Kirsch [25] presents results of a study that focused on achieving the minimum cost design of continuous, two-span prestressed concrete beams subjected to constraints on the stresses, prestressing force and on tendon vertical coordinates using an approximation that involves reducing the nonlinear optimization problem to an approximate linear case and solving the reduced linear problem via the linear programming (LP) method. In this case, the cost function included only both the first and third terms of Equation (1). Friel [26] proposed a closed-form solution for defining an optimum ratio of steel to concrete (ρs) that is used to calculate the minimum cost of a simply supported rectangular reinforced concrete (RC) beams using ultimate moment constraints defined in ACI 318-19 code [15]. The cost function is similar to Equation (1); however, costs of both prestressing steel (Cpb) and fibers (Clib) are neglected and an additional term for cost increase due to the increase of the building height was included. Friel [26] concluded that cost of formwork and the increased building height related cost did not significantly influence the calculated optimum cost.
Brown [27] proposed an iterative procedure for cost minimization based on optimum selection of overall thickness of simply supported one-way slabs subjected to uniformly distributed loads using only flexural constraints set forth by ACI 318-19 code [15]. In this case, the cost function included only the first two terms of Equation (1). The cost savings obtained from the study was up to 17%. Naaman [28] performed a comparative study on minimum cost and minimum weight designs for both simply supported prestressed rectangular beams and one-way slabs based on ACI 318-19 code [15] requirements. The cost function includes the first, third and fourth terms in Equation (1) and was optimized by the direct search technique. It was concluded that the minimum weight and minimum cost solutions give approximately similar results only in cases where the ratio of cost of concrete per cubic meter to the cost of steel per kilogram is more than 60. Otherwise, the minimum cost approach yields a more economical solution. It was also concluded that for ratios much smaller than 60, as for the majority of projects in United States, the cost optimization approach yields substantially more economical solutions.

4. Design Optimization

4.1. General

Design optimization refers to the process that aims to achieving certain optimum design parameters that satisfy specific conditions related to design performance, while minimizing (or maximizing) a measurable aspect of the target design. The main structural components of a typical CSP system are the cementitious face mortar (or concrete) and the steel wires placed at the exterior faces and through the EPS foam core thickness. In computing the objective function, the densities of these main components and the corresponding unit costs are considered. The performance requirements of an optimum structural design may not necessarily be limited to structure’s thermo-mechanical response, but it can include different concepts such as packaging, design envelope, or even maintenance. However, the scope of the current study is design variables optimization, while structural response is controlled by ACI 318-19 code [15] recommended constraints. One of the goals of optimization of CSP system is achieving highest strength-to-weight ratio, while maximizing thermal resistance of the CSP structural member. The optimization model is based on a simply supported CSP panel with fixed thickness that is subjected to out-of-plane flexural loading. In this case, deflection (response) reflects directly CSP panel strength.
Due to the fact that the current study is one of the pioneering studies that focuses on establishing an optimization process for CSP building system, a new methodology that is based partially on previous works on similar structures needs to be developed. For example, a previous study by Lemonge et al. [29], focuses on minimum-weight optimization process that is applied to a space truss structure where both continuous design variables, such as the coordinates of the nodes, as well as discrete variables, such as the cross-sectional areas of commercially available bar sizes are included in the analysis. Accordingly, and similar to the strategy adopted by Lemonge et al. [29], a base design is selected from available CSP commercially produced design. In this study, the CSP design (Class I) with inclined shear transfer steel wires connectors that was extensively tested at UCI [6] is used in the proposed optimization model described later in this paper. A description of different design optimizing variables is discussed in the following section.

4.2. Design Variables

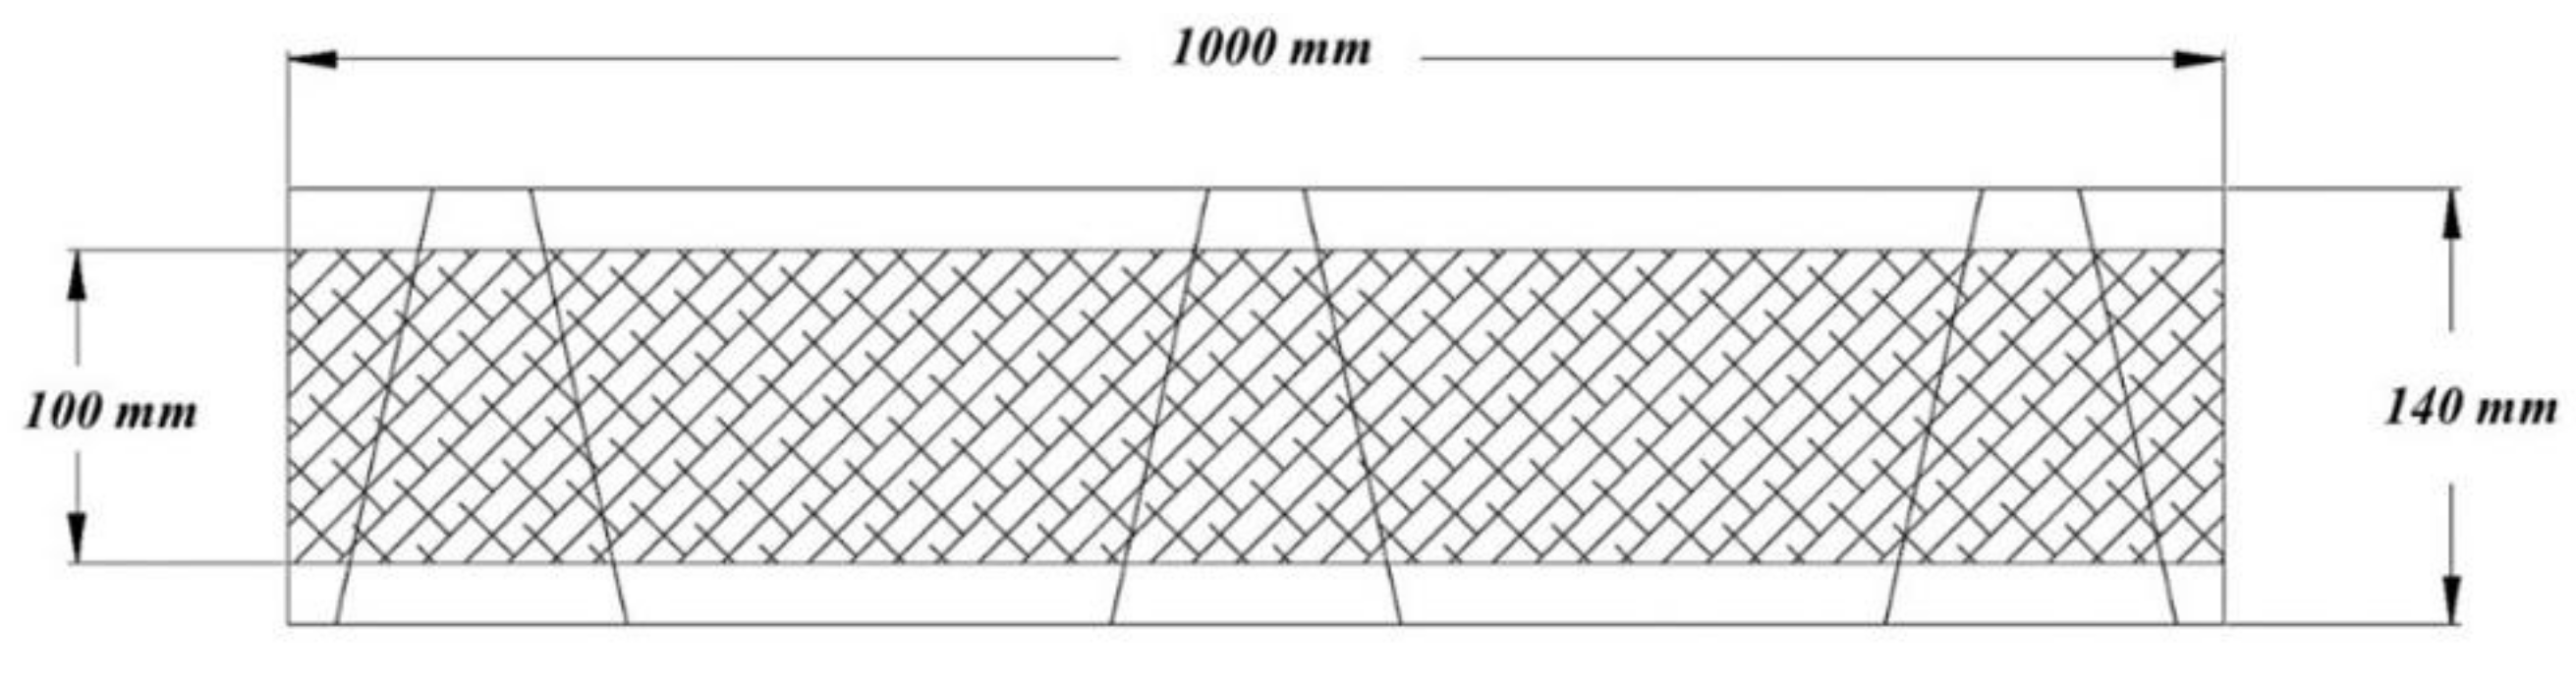
Due to the fact that the number of degrees of freedom in the design of cementitious sandwich panel is large, this study designates a specific design area as boundary condition. A 1000 × 1000 × 100 mm (L × W × D) where D is the thickness of modified EPS foam core as shown in Figure 6. A symmetric boundary condition for geometric design for the CSP is selected in this paper to evaluate sensitivity reinforcement design, which has a high effect on both cost and thermal insulation of the CSP which are the target of this study. In this study, a series of design variables are introduced for CSP topology optimization that includes: (I) shear connectors cross-section and configuration, (ii) number of bays and number of modules, (iii) exterior steel wire flat meshes cross-section and configuration, (iv) top and bottom cementitious mortar face thicknesses and (v) steel mesh reinforcement ratio. Table 2 lists the design variables used in the optimization process indicating the discrete possible options.
Although certain design variables are continuous, in order to reach an optimized design that is both mathematically and practically feasible, a set of discrete options that are based on American Wire Gauge (AWG) steel wire sizes [30] is selected for alternative design patterns. Other parameters in the design of the CSP panel are dependent on parameters described in Table 2, as well as geometry of specified CSP system to be optimized (i.e., EPS modified foam core thickness, angle of inclination of shear connectors, etc.).
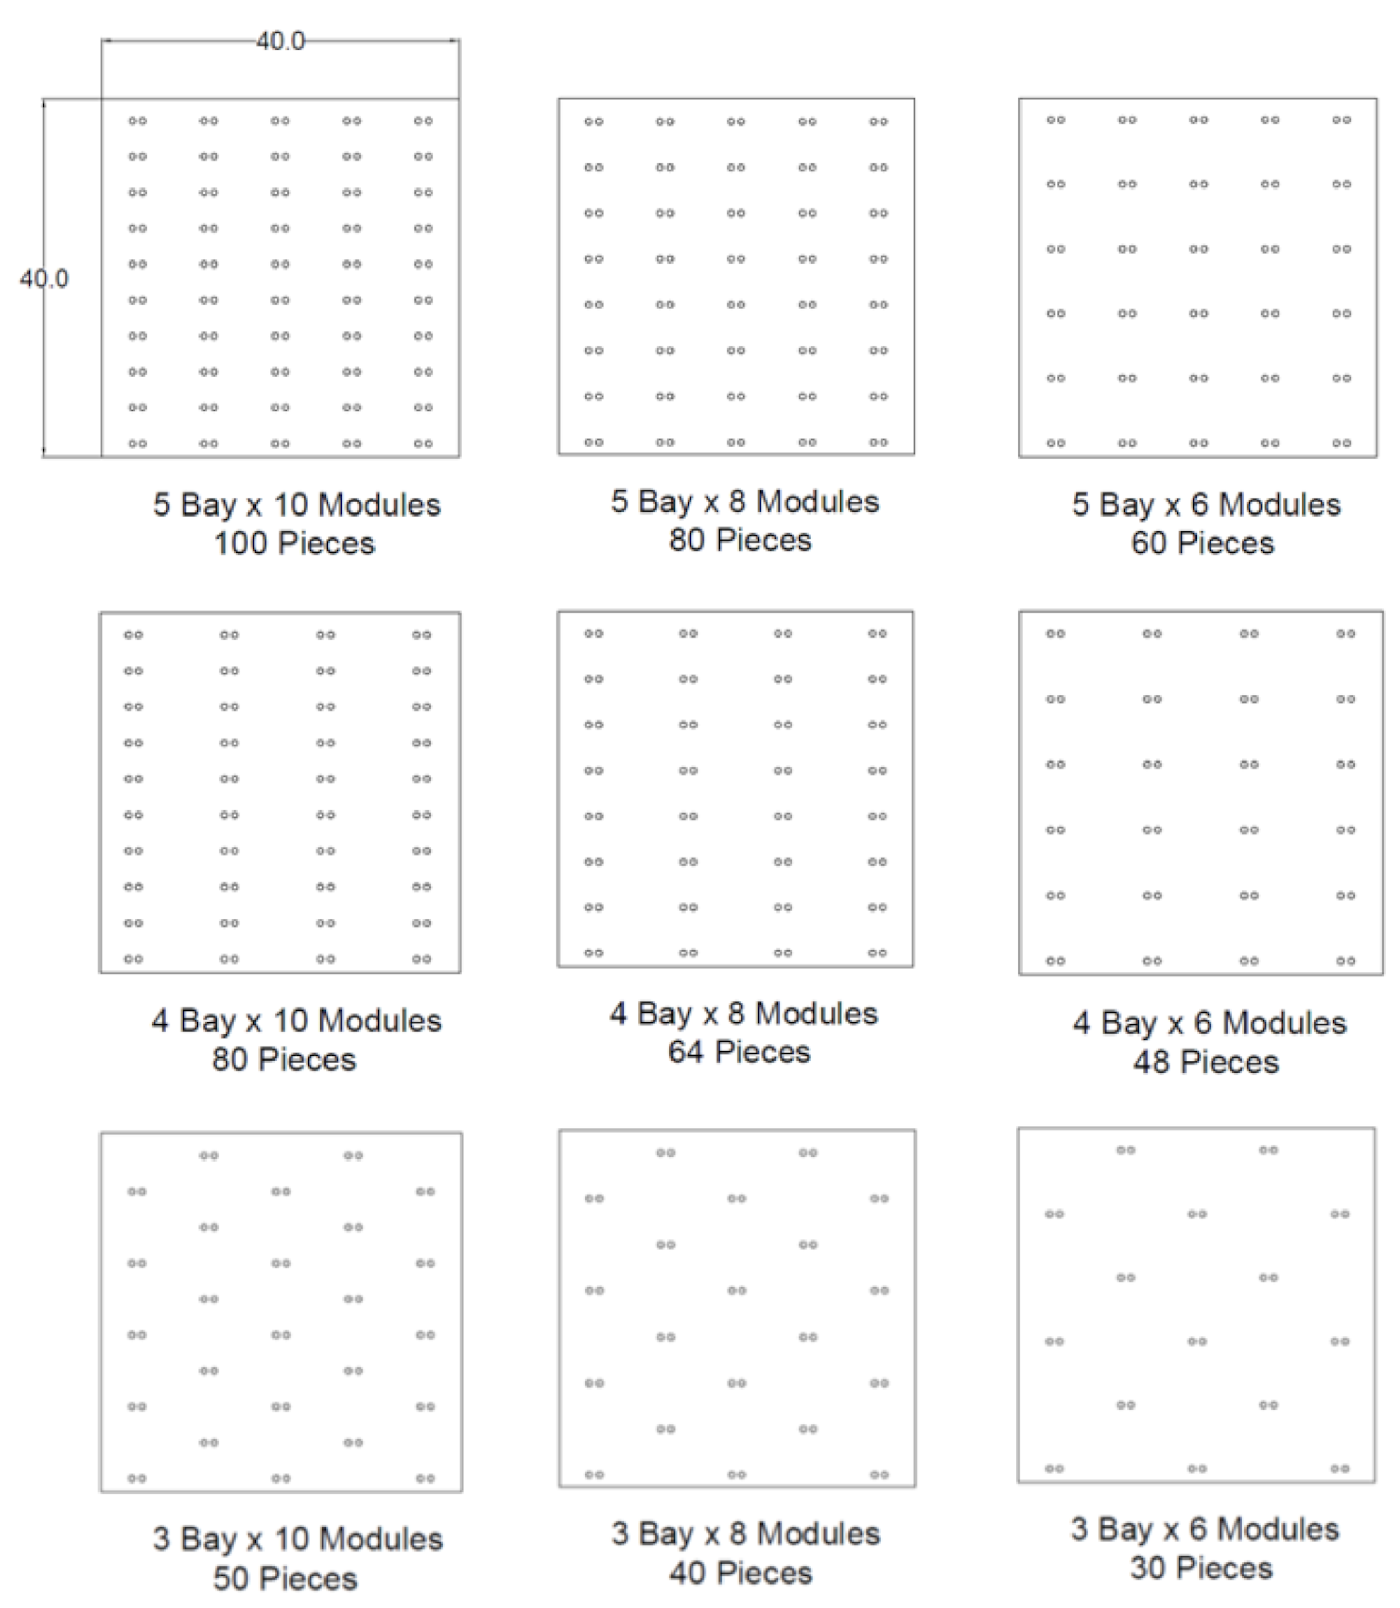
Figure 5 shows the topography of possible designs based on the number of bays and modules listed in Table 2. The topography of shear connectors is based on a rectangular distribution except the third row which is based on the star shape distribution that will be studied in the optimization process.
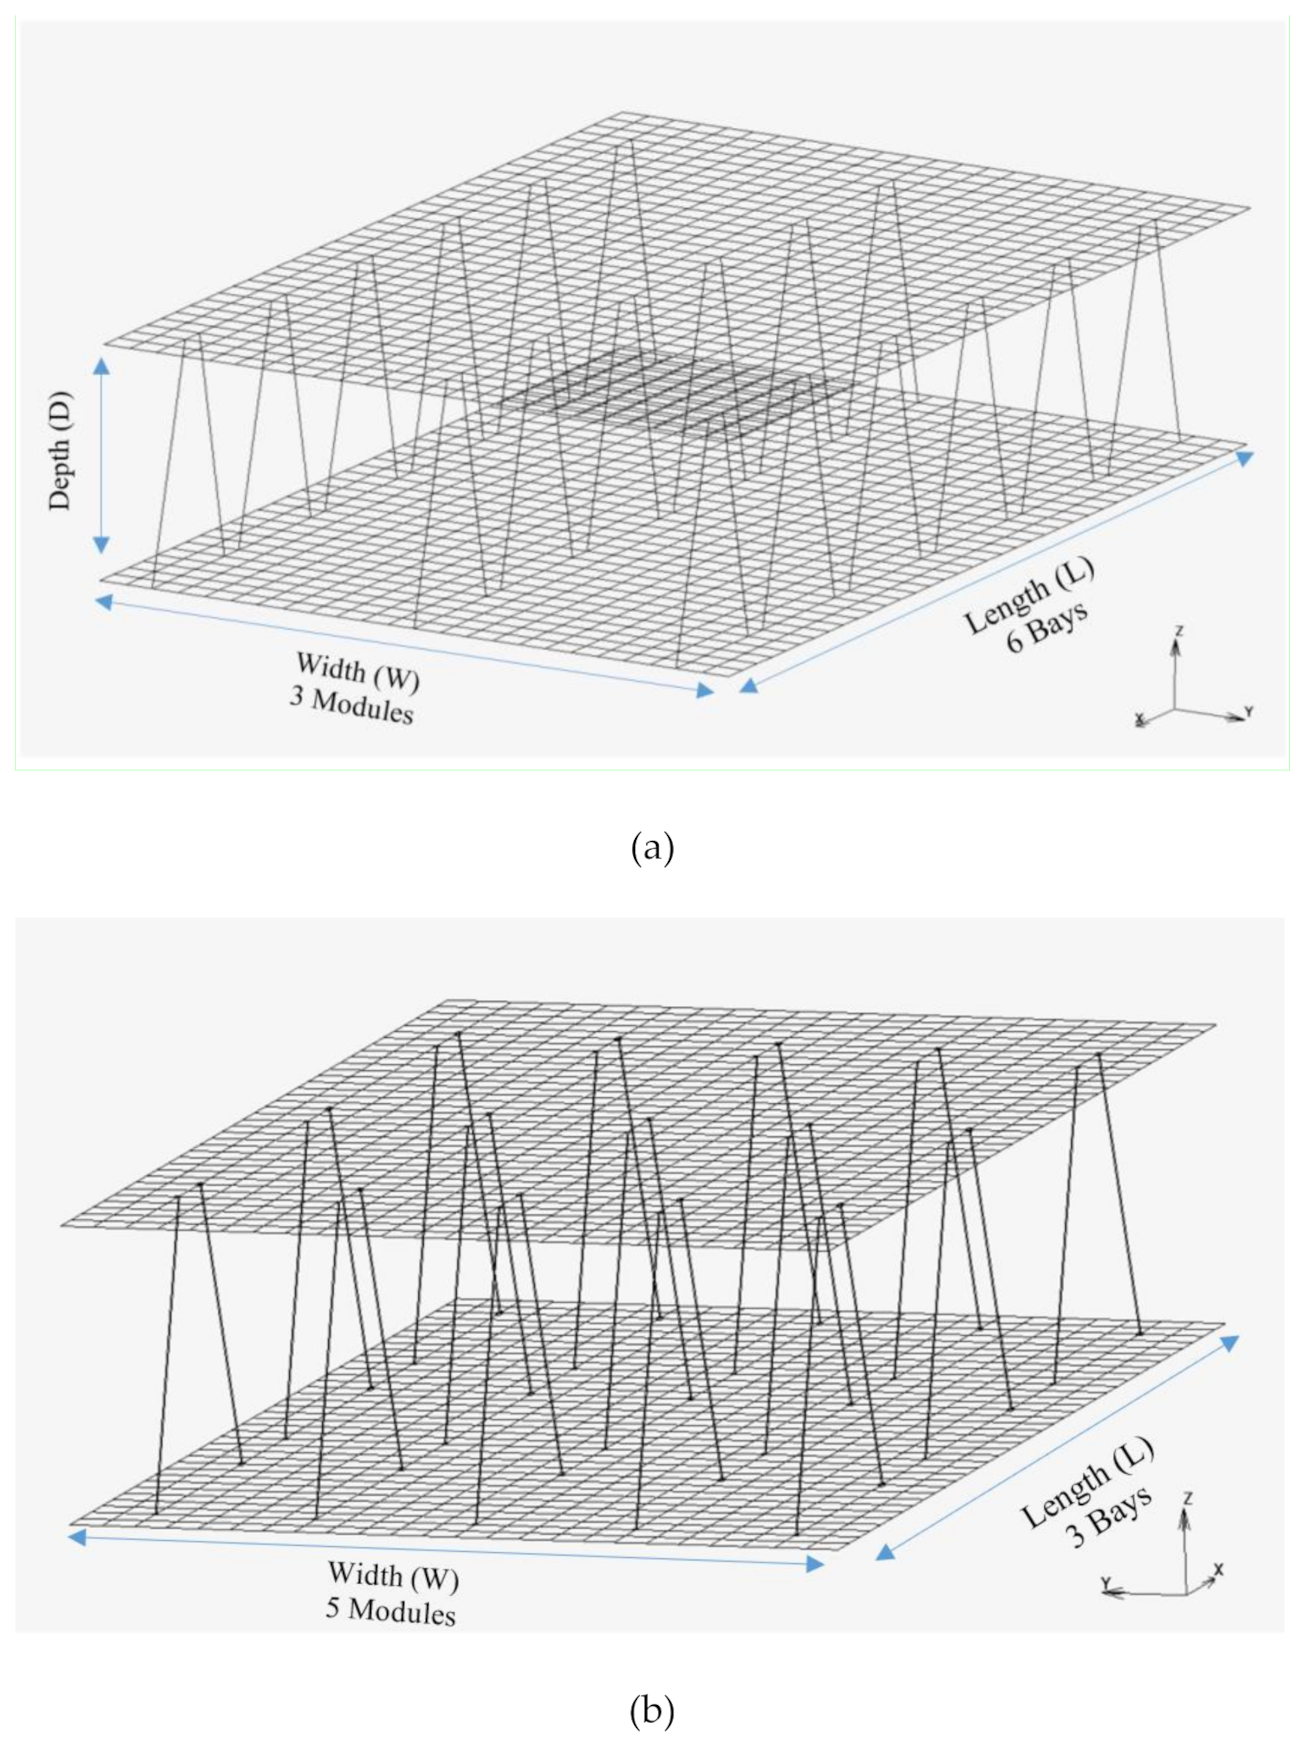
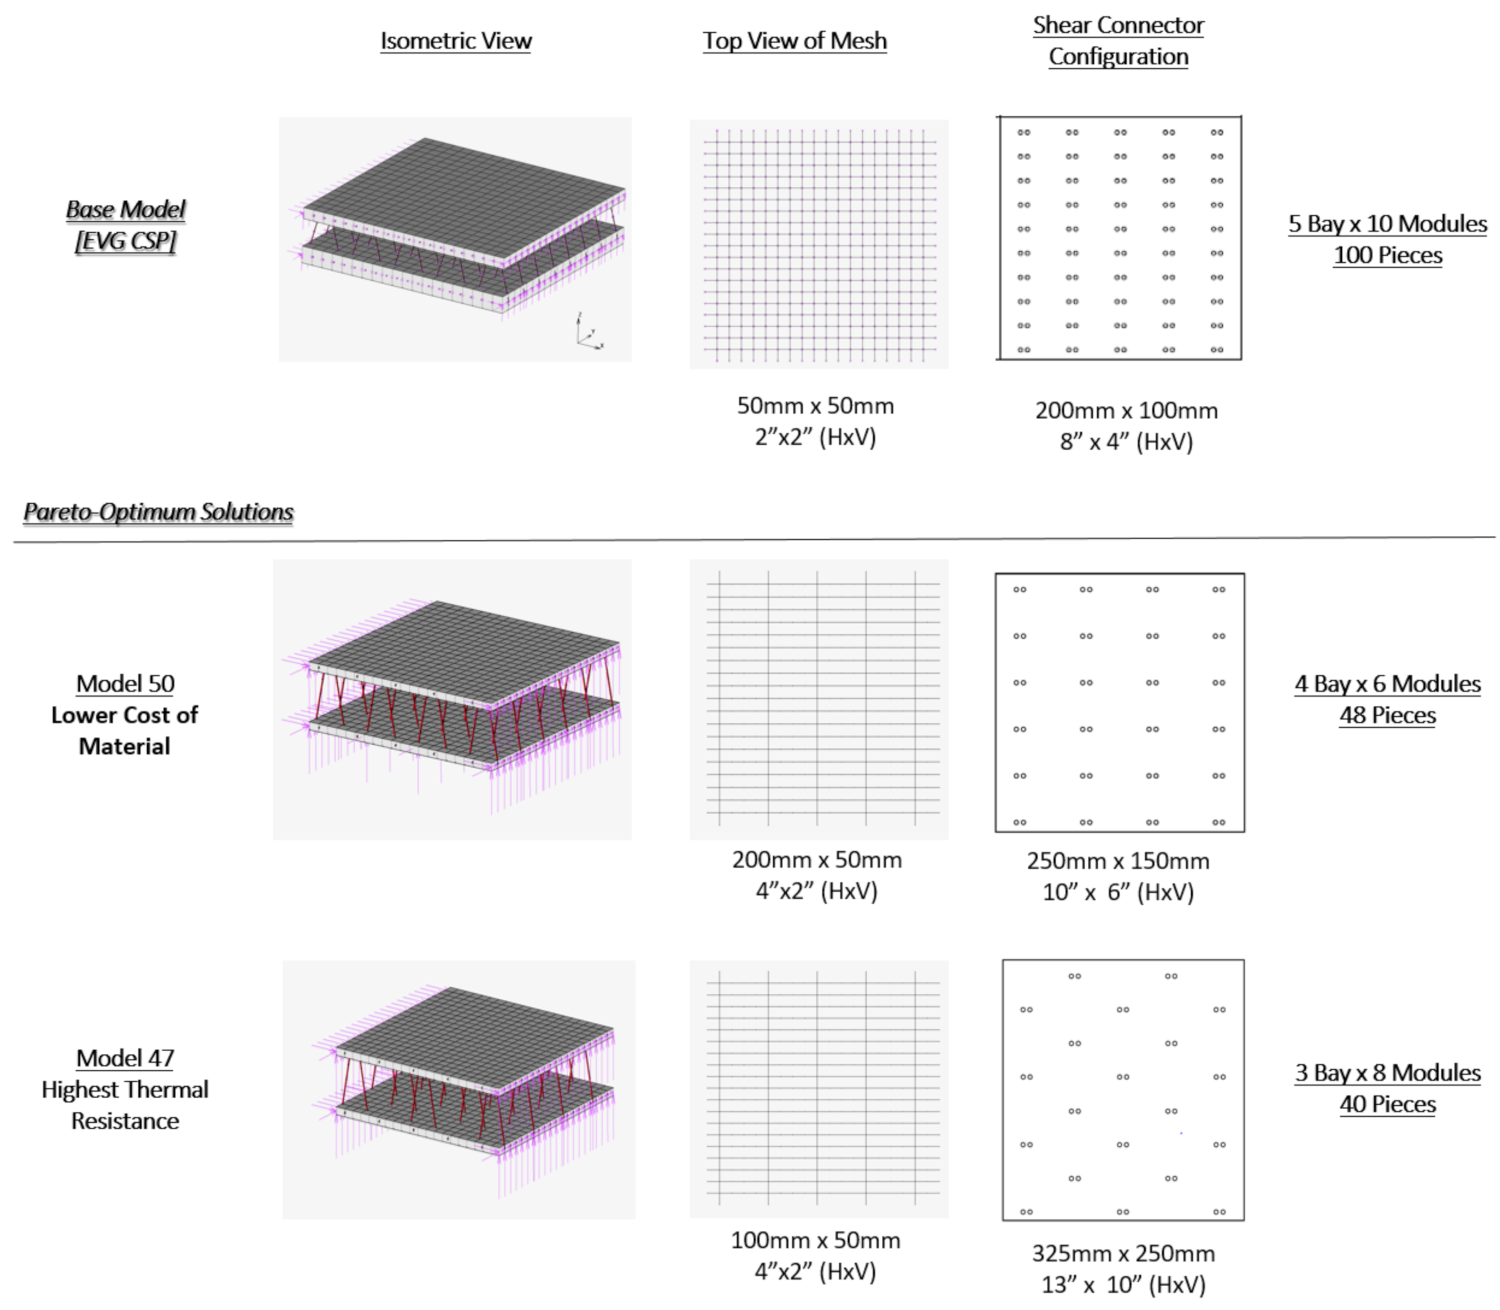
Figure 7 presents two possible solutions (three and five modules) for CSP configuration. Each module is composed of two face sheets, steel wire meshes and steel wires shear connectors connecting the two faces. This figure shows distinct structural solutions for the same area of CSP. The first solution utilizes a larger number of modules, probably with “thinner” cross-sectional areas, whereas the second solution uses a smaller number of modules, probably with “thicker” cross-sectional areas and different number of bays between the CSP systems (refer to Figure 8).

4.3. Design Constraints

Along with material properties and in order to control the optimization process, design constraints are introduced. For example, when CSP panel is designed as a floor or a roof slab for residential buildings, the immediate deflection due to the live load for flat roofs and floors according to ACI 318-19 [15] code section 24.2.2, should be less than L/360, where L is the clear span of the floor. Therefore, this value was used as the upper limit for the panel nodal displacement that is defined by following relation:
u j u m a x 1 0           j = 1 ,   2   ,     ,   n
where umax is equal to L/360 based on section 24.2.2 of the ACI 318-19 code [15], for displacement in the loading direction.
In performing the optimization process using finite element analysis, constraints are imposed on strain, stress, and displacement in response quantities. For stresses and strains, the constraints are imposed on the elements and for displacements, the constraints are imposed on the nodes. In this analysis, stress and strain components and other related functions (e.g., von Mises equivalent and principal stresses, stresses on prescribed planes), as well as generalized stress quantities are constrained. Similarly, translation and rotation components of displacement, resultant and directed displacements, as well as relative displacements between nodes are also constrained.

4.4. Objective Function

In the design optimization process of the CSP panel system, two different objective functions are defined. One objective function is set to minimize materials cost, while maintaining the set constraints. As mentioned earlier, since this optimization process includes more than one material (mortar and steel wires), the specification of different mass densities and unit costs are also taken into account in the computing the objective function.
The total CSP cost is derived from both cost of materials and energy cost. It should be noted that in some situations the industry may have specific goals for which the total cost is defined differently. This study, therefore, provides guidelines for achieving optimum result depending on different needs of the industry.
As stated earlier, the objective of the current optimization analysis is to minimize the panel’s total cost that can be expressed by Equation (3). The first term of right hand side of the equation represents materials cost, and the second term represents the cost of energy, while the third term represents the constraint.
f x 1 = C s W s W s b 2 + C m W m W m b 2 + α R t b R t 2 + β u F E A u m a x 1 +
where
f(x) is the objective function to minimize the total cost of the panel;
Cs is the weight factor for steel;
Ws is total weight of steel in proposed design of CSP;
Wsb is a constant value based on the total weight of steel in the base model CSP;
Cm is weight factor for mortar;
Wm is total weight of concrete in proposed design of CSP;
Wmb is a constant value based on the total weight of mortar in the base model CSP;
α is a weight factor for cost of energy which depends on the specific location weather data and unit price of energy and life span of the building;
Rt is the equivalent thermal resistance of proposed CSP;
Rtb is the equivalent thermal resistance of base CSP;
β is the objective function penalty factor;
uFEA is the maximum deflection of proposed CSP in each finite element analysis run;
Umax is the maximum deflection allowed per section 24.2.2 of the ACI 318-19 code [15]; and
(x)+ = x if x > 0 and (x)+ = 0, otherwise.

4.5. Materials Cost

The weights of both steel and cementitious mortar are calculated using the following equations:
W s = i = 1 n ρ s A i L i
where ρs is the density of the steel; Li and Ai is the length and area of the ith bar of shear connectors and steel meshes on each face.
W m = ρ m ( t b + t t ) × A
where ρm is the density of mortar applied at each exterior face; tb and tt are the bottom and top thicknesses of cementitious faces, respectively; and A is the CSP area.
In order to evaluate steel weight factor, an approximate current unit price of steel is used. The unit price of steel at the time of the analysis, is about $0.79 for a 3.65 m long cold-rolled steel wire with a diameter of 3.175 mm (equivalent to # 8 steel wire gauge). Density of cold-rolled steel is assumed to be 7850 kg/m3. As a result, the unit price of steel is set to be USD 3.40/kg that is used for evaluating steel weight factor in the composite objective function for the multi-objective optimization conducted in this study. In this study, an approximate unit price for ready-mix mortar is taken as USD 130.0/m3 for structural mortar with a 28-day compression strength of fc′ = 20.0 MPa. The mortar density is assumed to be 2400 kg/m3, with a unit price of USD 0.055/kg. It should be mentioned that what is important in this study is the ratio of price of steel to price of mortar (Cs/Cc), not the actual individual price of steel and mortar. In a study conducted by Naaman [27] for optimization of reinforced concrete slabs, it was found that the ratio for concrete cost to steel cost per pound for most projects in the United States is about 60. It should be noted that the price is used as a weight factor for optimization function and the objective function absolute value does not evaluate the actual cost of the CSP.

4.6. Cost of Energy

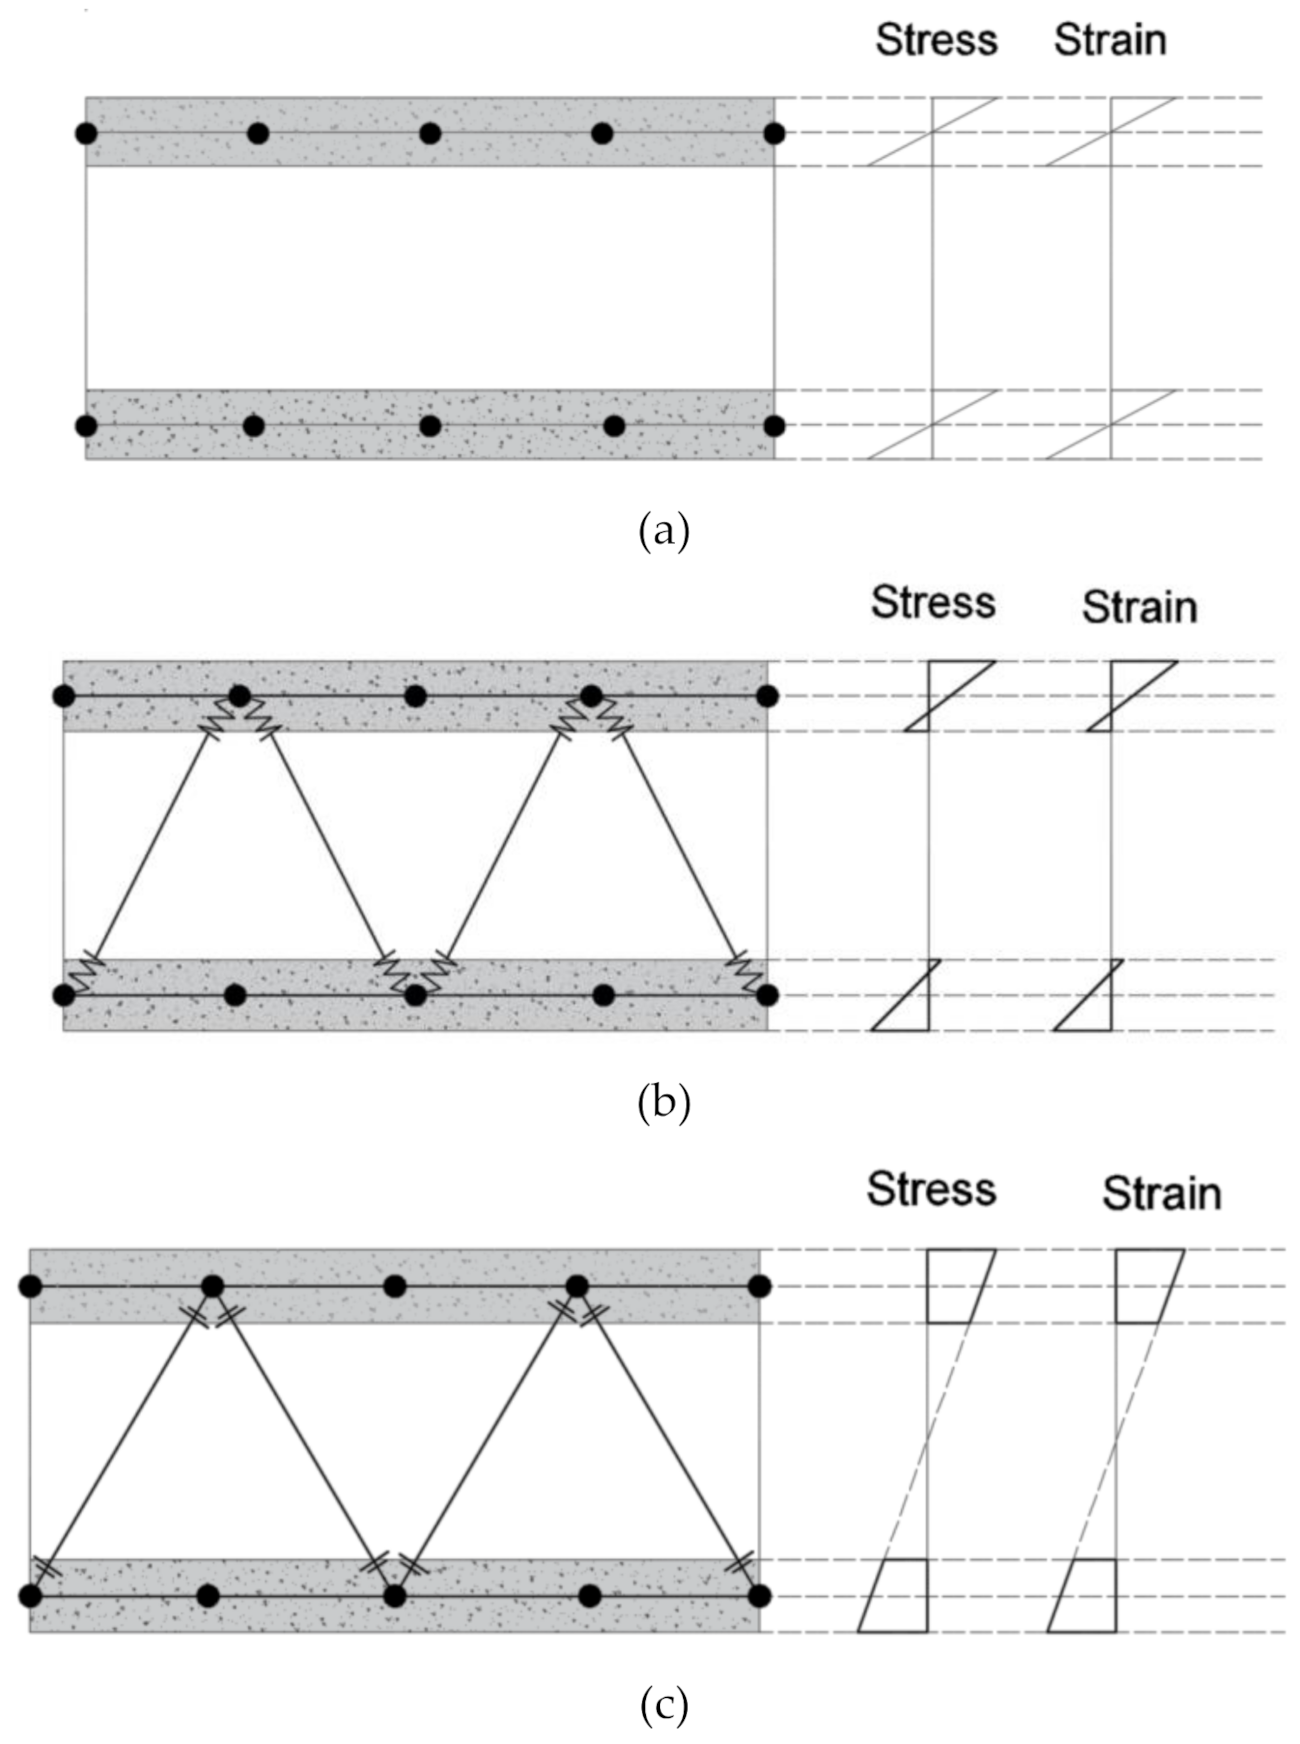
One of the key features of the CSP building system is its superior thermal insulation capabilities. Therefore, it is vital to evaluate the insulation performance of a typical CSP construction when performing the optimization process. It is important to realize that existence of major tradeoff between panel shear strength and thermal insulation due to the thermal bridging phenomena generated by through-the-thickness shear transfer steel wires. This conflict has larger effect for panels with inclined connectors (Class I) as compared those with parallel steel wires shear connectors (Class II). The steel shear transfer wires connecting the two cementitious layers of the panel creates thermal bridges across the thickness that leads to a reduction of thermal insulation efficiency of the panel.
Thermal conductivity (k or λ) is material dependent parameter that defines the ability of the material to conduct heat with units Watts per meter Kelvin (W/mK). Accordingly, materials with lower value of thermal conductivity are good insulators, while those with higher values of thermal conductivity are good conductors.
In order to determine materials thermal characteristics, steady-state experiments are used to measure heat transfers from the warmer side of a test specimen to its cooler side. Thermal resistance is a material’s heat property that indicates its resistance to a heat flow. Two indicators are used for defining thermal resistance: (i) the absolute thermal resistance (Rt) and (ii) the specific thermal resistance or thermal resistivity (Rλ). The absolute thermal resistance (Rt) is a property of a particular component with defined thickness, area and shape and its unit’s kelvins per watt (K/W). The thermal Resistivity (Rt) is the reciprocal of thermal conductivity (λ). On the other hand, the specific thermal resistance or thermal resistivity (Rλ) is a property of a specific material where geometrical information is required in order to calculate heat transfer. The units of the specific thermal resistance is kelvin meters per watt (K·m/W). In calculating the thermal resistance, one should calculate the thermal insulation factor (R) is a measure of thermal resistance that measures thermal resistance of unit area of a material. A greater and efficient insulation is achieved as the R-value increases. In SI units, the units of the R-vale is (m2·K)/W. This value is dependent not only on type of materials, but also its thickness and density. Using this value for calculating transferred heat will required an area as well as a temperature difference. As an alternative for evaluating thermal efficiency of building components is the thermal transmittance factor known as the U-factor that consider heat losses due thermal conduction radiation and convection. The U-factor is defined as the rate of heat transfer through an element or group of elements divided by temperature difference across the element with SI units of W/(m2·K). In this case, a lower value of U-factor indicates that the material has better insulation. This factor is commonly used in US and Canada.
There are several analogues that may be used to model different steady-state and unsteady-state heat transfer problems. This includes (i) hydraulic analogues (water and air flows), (ii) membrane analogues and (iii) electrical network analogues. The most common analogues that is used for modeling heat transfer problems is the electrical network analogues.
In this study, thermal resistance and heat flow through a typical section of a CSP wall or roof thermal resistance of the sandwich CSP panel system is modelled by the electrical network analogues where heat flow is represented by current, temperatures represented by voltages, heat sources are represented by constant current sources and resistors and thermal capacities are represented by capacitors (refer to Table 3). If the layers of insulators are stacked on top of each other (or side-by-side), the insulator is modeled in series and the individual insulator resistance values are summed together. However, when the insulators are in positioned parallel to each other, the reciprocal (1/R) value of the individual insulators will be added together. For a typical CSP wall or roof system, shown in Figure 1, there are combinations of series and parallel insulators in the system. 
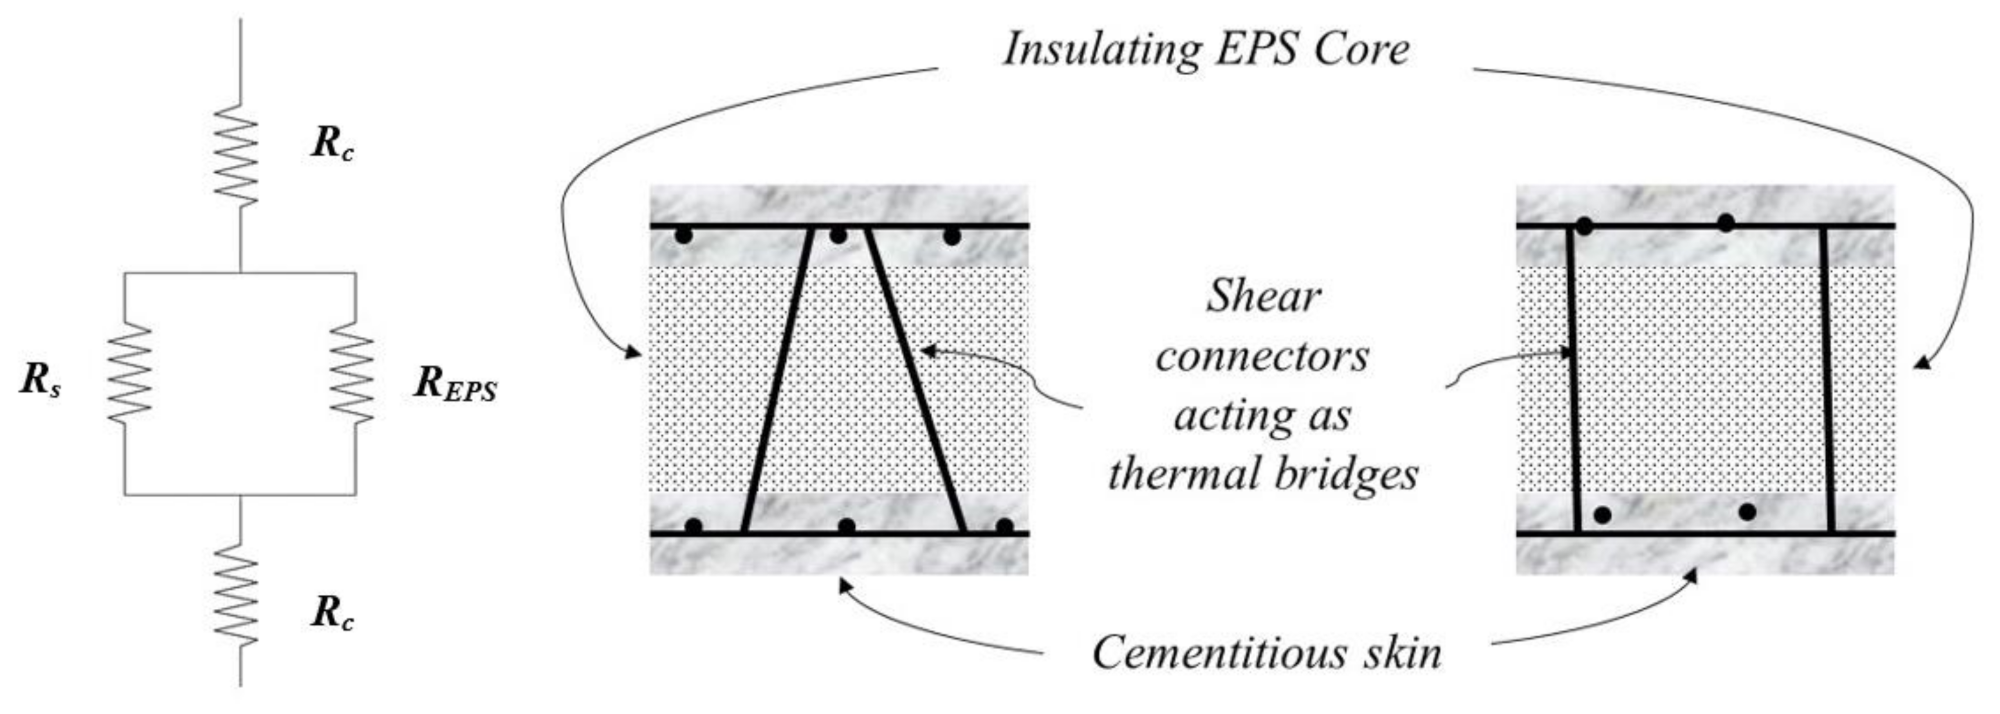
Figure 9 shows the diagram for an equivalent thermal circuit for a CSP as a combination of cementations skins, insulator EPS foam core and steel thermal bridges.
Equation (5) is a parametric formulator for evaluating the thermal resistance of the CSP based on the analogues diagram illustrated in Figure 7.
R t = 2 R C + ( R E P S × R s ) R E P S + R i n
where Rt is the absolute thermal resistance of the material in kelvin per Watt (K/W) and Rc, Rs and REPS are the thermal resistances of mortar, steel, and EPS foam core, respectively. It should be noted that thermal resistance is not totally a material property, as it depends on the geometry of the material and it is derived from Fourier’s Law for heat conduction. The following equation is used to calculate the absolute thermal resistance and is valid as long as parameters x and λ are constant throughout the specimen.
R t = x A × λ
where:
Rt: is the absolute thermal resistance (across the length of the material), K/W
x: is the thickness of the material (measured on a path parallel to the heat flow), m
λ: is material thermal conductivity, W/(K·m) and
A: is the cross-sectional area (perpendicular to heat flow path), m2
The following equation proposed by Qomi et al. [31] is used for calculating energy loss due to heat loss while maintaining a temperature in the building at base temperature:
E = T o T o u t R e f f × S × t
where: E (W·h) is the heating or cooling energy required to maintain inside temperature of To (K) when the outside temperature is Tout (K) during the interval exposure, S (m2) is the surface area of the building; t is time (h) and Reff (m2 K/W) is the effective thermal resistance of building material.
In order to evaluate outside temperature fluctuation based on temperature inside the building at any location (ToTout), degree-days data is used. Degree-days are a special type of weather data computed from outside air temperature readings. It is a measurement unit that quantifies the air temperature fluctuation as compared to a defined base temperature. Heating and cooling degree-days are used mainly to estimate energy consumption of buildings. There are two types of degree-day data useful for calculating energy loss in the buildings. In cold regions, heating degree-days (HDD) measures the drop of temperature and corresponding duration below certain target temperature base level, while cooling-degree-days (CDD) is used in hot regions to estimate the increase of temperature and corresponding duration above certain target temperature base level. These two data are added together throughout the year to determine the required energy for maintaining inside temperature (base temperature) of buildings. An example of a database that collects degree-day data for different weather stations worldwide is described in Ref. [31].
Using Equation (7), the energy loss (E) through CSP panels can be calculated by substituting the degree-day for one-year data as (ΔT.t), converting degree-day data to degree-hour, selecting a unit area S = 1.0 m2; and substituting with the CSP effective thermal resistance, Reff that is calculated as follows:
  • Thermal conductivity: λCementitious mortar = 0.5 W/mK, λEPS = 0.03 W/mK, λSteel = 54 W/mK
  • Thickness of cementitious mortar face sheets: Top face = 0.0508 m, Bottom face = 0.0381 m, thus, the total cementitious mortar thickness, x ≈ 0.09 m
  • Thickness of EPS foam core ranges from 10 cm to 20 cm,
  • Number of steel wires shear connectors/m2 = 100
  • Diameter of steel wires shear connectors = 0.002794 m,
  • Cross-sectional area of each steel wire = 0.009 m2, with a total per m2 = 0.00006 m2
  • Length of shear connectors connecting the two faces = 0.14 m
Using Equation (7), individual thermal resistances are calculated as follow:
R c = x A × λ C e m e n t i t i o u s   m o r t a r   = 0.09   m 1.0   m 2 × 0.5 W mK = 0.18   K / W
R E P S   10   cm   c o r e = x A × λ E P S   = = 0.1   m 1.0   m 2 × 0.03 W mK = 3.39   K W
R E P S   20   cm   c o r e = x A × λ E P S   = = 0.2   m 1.0   m 2 × 0.03 W mK = 6.78   K W
R s = x A × λ S   = = 0.14   m 0.00061   m 2 × 54 W mK = 4.22   K W
R e f f 10 cm   c o r e = R C + ( R E P S × R s ) R E P S + R s = 0.18 + 3.39 4.22 3.39 + 4.22 = 2.06   K / W
R e f f 20 cm   c o r e = R C + ( R i n × R s ) R i n + R i n = 0.18 + 6.77 4.22 6.77 + 4.22 = 2.78   K / W
Now, substituting the values of Reff in Equation (7), the heat loss for one year is calculated as follows:
E = T o T o u t R e f f × S × t = 1500 2.06 × 1 × 24 / 1000 = 17.84   kWhr   per   unit   CSP
E = T o T o u t R e f f × S × t = 1500 2.78 × 1 × 24 / 1000 = 12.94   kWhr   per   unit   CSP
The cost of energy = E × CE, where CE is energy unit price (in USA, it is about 0.12 USD/kWh). It should be noted that energy cost varies linearly with degree-day units of different locations around the world [32].
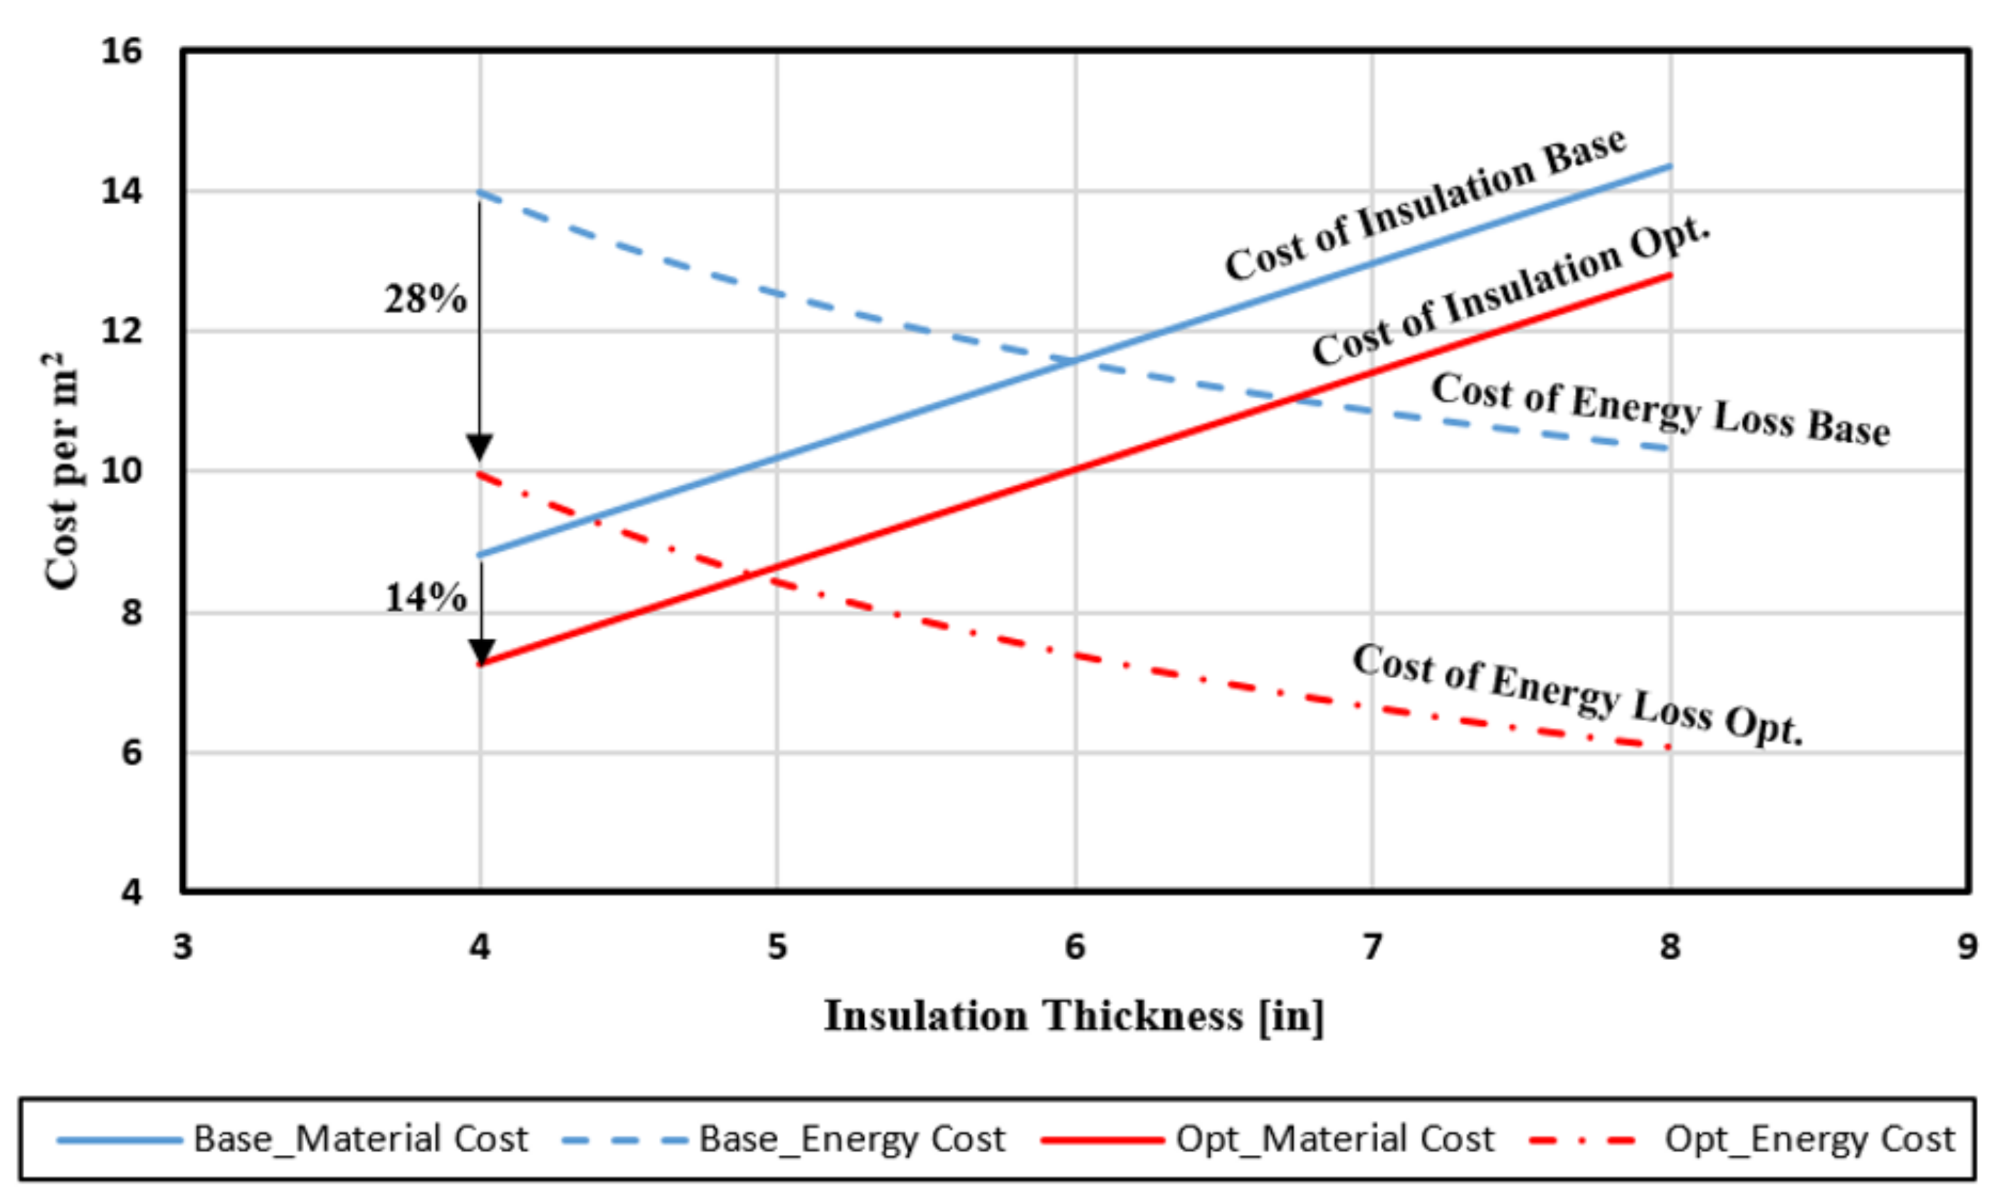
In the preceding numerical calculations, only two ESP foam core thicknesses were used, however, to generate a meaningful plot that identifies the effect of core thickness on overall performance of atypical CSP panel, energy loss should be calculated for insulation thickness small step sizes. This information is useful for comparing the cost of material to cost of energy at the end of optimization process.
Using materials average unit prices described earlier for cold-formed steel wires and ready-mix mortar and applying these values in the cost of energy and degree-day data equation, the total cost of the base panel is estimated and presented in the Table 4. Next, a contribution factor for each parameter is identified and normalized to be used as a weight factor in the optimization process. These contribution factors were selected as they are based on the design variables which are the objective function of this study. The cost of labor is neglected as the changed in the design of the CSP panels variable studied in this paper does not affect the cost of labor.

5. Optimization Analysis Using Genetic Algorithm

Optimizing sandwich panel systems requires considering design variables as discrete quantities. Genetic algorithms (GAs) are effective in solving unconstrained optimization problems. For this reason, constrained problems must be converted to unconstrained ones in order to efficiently use this technique. Therefore, a penalty-based transformation method is proposed. In this protocol, the penalty parameter is dependent on constraint violation level. Such parameter is suitable for performing parallel search when genetic algorithm is utilized. The genetic algorithm presented herein is a modified simple genetic algorithm (SGA) that is based on natural genetics and was proposed by Goldberg [17]. It combines Darwin’s principle of survival of the fittest and a structured information exchange using randomized operators in order to develop an efficient search mechanism. A high penalty factor will result in missing the optimized variables, whereas the low penalty factor will result in a slow convergence of objective function. In this study, it was found a constant penalty factor of 100 is both computing cost efficient and the results were consistence when lower penalty factor were used in the objective function.

Optimization Procedure Using Genetic Algorithm

In this section, a description of the five steps adopted in performing the genetic algorithm optimization is presented. Figure 10 shows the summary flowchart illustrating the genetic algorithm proposed for a CSP optimization.
Step 1:Define objective function and constraints
In order to use the genetic algorithm for optimization of a typical CSP building panels system, an objective function f(x) subjected to constants g(x) should be first defined. The objective function and constraints defined by Equation (2) for CSP panels materials and heat loss cost reductions are utilized in genetic algorithm optimization. Accordingly, a violation coefficient, C, is proposed in the following conditions:
If gi(x) > 0, then ci = gi(x); or
If gi(x) ≤ 0, then ci = 0.
where:
C = j = 1 m c j
where m is the number of constraints. In this study, similar constrain for maximum displacement due to the live load based on ACI 318-19 code 24.2.2 [15]. Now, the modified objective function ϕ(x) is written, incorporating the constraint violation as:
ϕ(x) = f(x) (1 + KC)
where parameter K has to be judiciously selected as penalty parameter depending on the required influence of a violated individual in the next generation. Next, the genetic algorithm is used to conduct unconstrained optimization of ϕ(x) as described in Step 2.
Step 2:Define the first generation based on design variables
A discrete list of values that design variables can take is populated. Since genetic algorithm works on coded design variables, it is necessary to code e design variables into a string. A Trinary code (also called Base 3 code) is selected, since there are three different values for each design parameter. A population group of five CSP is generated as per design variables listed in Table 5, where 1, 2 and 3, each refer to design parameter values, Level 1, Level 2 and Level 3, accordingly.
Step 3:FEA Modeling
In this analysis, each CSP system is modeled using FEM preprocessor such as MENTAT and consequently analyzed using FEA solver, MSC MARC [33,34] in order to obtain the objective function f(x) for each model. For each model, a violation factor, C, is computed using information obtained from Step 1. Values of the modified objective function f(x) are then computed using Equation (9). The result is listed in row 3 of Table 5. Details of different numerical models developed in this study, including materials parameters, boundary conditions, types of finite elements, etc., along with a comparison between numerical and full-scale experimental results are provided in Ref. [35].
Step 4:Compute fitness function
In this step, f(x) is converted into the corresponding fitness values. This is done in such a way that the best individual has maximum fitness. Goldberg [17] suggests that for minimization problems, f(x) should be subtracted from a large constant, so that all the fitness values are nonnegative and that individuals get fitness values according to their actual merit. In this proposal, the value of this constant is obtained by adding the maximum and minimum values of f(x). The expression for fitness becomes:
Fi = [f(x)max + f(x)min] − fi(x)
where: Fi is the fitness of the ith individual. Here, the subscript i is introduced to indicate the individual in the population (refer to row 4 of Table 5).
Step 5:Crossover and reproduction
The fifth step involves producing population for the next generation, which are the offspring of the current generation. For this purpose, two genetic operators, namely, reproduction and crossover, are applied. The reproduction operator selects the fit individuals from the current population and places these individuals in a mating pool. In this case, highly fitted individuals get more copies in the mating pool, while less fitted ones get fewer copies. The worst fit individuals die off as the number of individuals in the next generation became the same as the initial generation.
The reproduction operator is implemented in the following manner. The factor ( F i F ¯ ) for all individuals is calculated, where F ¯ is the average fitness. This factor is defined as the expected count of individuals in the mating pool. Next, this factor is converted into an actual count by appropriately rounding off so that individuals get copies in the mating pool proportional to their fitness. This process of reproduction confirms the Darwinian principle of survival of the fittest. In this step, the crossover operator is applied using crossover parameters that are generated randomly. The first step is to matching individuals in the mating pool that is randomly performed. Once the pairs are decided, it is necessary to identify the crossover sites. The crossover is performed by initially considering two strings A and B as follow:
A = x1 x2 |x3 x4 x5| x6 x7 x8
B = y1 y2 |y3 y4 y5| y6 y7 y8
Now, let the cross sites generated be 2 and 5. The cross sites are then randomly selected and are marked in the strings as vertical lines. After crossover process, string A is transformed into A′ and B transformed into to B′ as follows:
A′ = x1 x2 |y3 y4 y5| x6 x7 x8
B′ = y1 y2 |x3 x4 x5| y6 y7 y8
The new optimized population is generated after the crossover process and the genetic algorithm process is repeated until the fitness factor ratio ( F i F ¯ ) converges to 1.0. Row 5 of Table 5, presents results of the fitness factor ratio among the population of the first generation that is generated from the objective function results that appear in row 4 of Table 5. This fitness factor is used to identify a mate for each model for cross over and reproduction of the new generation. In this process, highly-fitted individuals are assigned as 2, while less-fit individuals are assigned as 1 and the worst-fit individual dies off. From results listed in row 6 of Table 5, one can see that Models 1 and 4 have higher fitness factor ratios and, hence, they are graded as 2. On the other hand, Models 2 and 3 are on the next stage and are graded as 1. In addition, results indicated that Model 5 has the lowest fitness factor ratio and, therefore, is graded zero and dies off in this generation. This process of reproduction confirms the Darwinian principle of survival of the fittest.

6. Optimization Analysis Results

As stated earlier, the main objective of this optimization process is to reduce the cost of CSP sandwich panel system considering both materials energy costs. Accordingly, the objective function is developed to represent both parts of the cost, while penalizing models with excessive deflection that exceeds ACI 318-19 code [15] allowable deflection requirements. The result of the optimization process using genetic algorithm is shown in Figure 11. The results clearly illustrate the objective function is reduced in each generation of genetic algorithm thought the process explained in the previous section. However, after tenth generation, the result converges to certain value of objective function, which illustrate the optimized results. This process optimized the CSP from randomly generated models in the first generation, based on the design variables limits defined in the process; the genetic algorithm process reduced the objective function by more than 50% at the tenth generation compare to the first generation.
This optimization process is better studied by including objective function parameters for reducing total cost of the CSP that includes cost of material and energy loss. The tenth optimization generation described in Figure 12, shows that the cost of CSP materials is reduced by 45%, while the energy cost has dropped by 28% as compared to the base model associated cost. This is appreciable reduction was achieved by increasing the CSP thermal resistance of Model 47 from 2.06 [m2.K/W] (R-12). At the same time, the weight of the individual CSP panel is reduced by 97.0 kg (from 225.0 kg of the base model to 128.0 kg for the Model 50).
Figure 12 presents the history of CSP panel cost and thermal resistance generated in GA optimization. As shown in Figure 10, the average cost of material in optimization process decreased by almost 45% in the tenth generation of genetic algorithm. At the same time, the optimization process increased CSP thermal transmittance by 35% as compared to the base model while meeting ACI 318-19 Code [15] design criteria.

6.1. Pareto-Optimal Front

A pareto-optimal front is a non-dominated optimal solutions set that is selected in case that no improvement to the objective can be achieved unless another objective, at least, scarified. Figure 11 shows the search path adopted for identifying the genetic algorithm optimum solutions for achieving maximum thermal resistance, while minimizing panel cost. Optimization results converged as shown at the bottom right-hand side of the objective space (refer to Figure 13). These tenth generation models, appear on the right hand side, have been optimized with respect to both materials cost, as well as thermal resistance. However, one can see that there is a trade-off between results of these models. Table 6 presents a comparison between pareto-optimal solutions and base model results obtained from different optimization models using genetic algorithm in the tenth generation. In the optimization process, the top and bottom mesh is changed from 1:1 ratio to 1:2 ratios, where the wires perpendicular to direction of the slab has been reduced to the minimum requirement for shrinkage that is not contributing to CSP slab or wall stiffness. As shown in Figure 13, shear connectors configuration changed from a rectangular array to a star-shaped array in order to achieve optimum thermal resistance, while maintaining efficient by shear load transfer, as well as meeting ACI 318-19 code [15] strength and stiffness constrains. In Model 50, a higher number of shear connectors is used, as compared to Model 47, in order to improve the composite action of CSP panel section and to reduce tension flexural reinforcement as compared to that of Model 47. As a result, Model 50 has less amount of steel, which reduces the total material cost in comparison with Model 47, which has higher cost but with better thermal resistance. Thus, none of these two solutions better than the other with respect to both objectives and there is trade-off between the two models. However, many other solutions exist in the objective space, which are joined together using the curve shown in Figure 12. This curve is called pareto-optimal front and models lying on this curve are called pareto-optimal solutions.
The optimized pareto-optimal-frontier models provide the designer with a number of optimized design protocols options to choose from according to design preference. For example, if the cost of material is the priority, while meeting the design requirements, designer can choose Model 50, for example, where materials cost is reduced by 48% with 35.6% increase in the thermal resistance value. On the other hand, if the design priority is thermal insulation, while meeting other design requirements, designer can select Model 47 where thermal resistance value is increased by 40%, while materials cost decreased by only 38%. A comparison between CSP models design specifications in tenth generation vs. those associated with the base model is listed in Table 7. The results can also be seen in Figure 14 in Pareto-optimal front plot in the objective space where both Model 50 and Model 47 are on the Front Curve of Pareto-Optimal Curve.

6.2. Design Variables Correlation

One important issue to be considered is the correlation between the variables in any type of parametric optimization. As mentioned earlier, the main advantage of CSP panel systems as compared to the conventional solid structural elements, is in utilizing materials and thermal insulation efficiently that leads to energy saving.
One of the influential design variables is the through-the-thickness steel wires connecting the two faces of CSP that contributes to the degree of composite action of the CSP. Achieving higher degree of composite action leads to optimum use of materials and higher flexural efficiency of the CSP panel. However, at the same time, these steel wires create a thermal bridge between the two faces of the CSP that reduces the thermal resistance of CSP panels. Figure 15 illustrates the correlation between the shear transfer steel wires and equivalent thermal resistance of a typical CSP panel. In this figure, thermal resistance is normalized with respect to CSP thermal resistance of the with minimum steel wire ratio within design variables limit which is thirty 11-gauge (ϕ 2.31 mm) steel wires per square meter. As shown in Figure 15, the thermal resistance of the panel’s EPS foam core decreases up to half, as the steel ratio increases from thirty 11-gauge (ϕ 2.31 mm) steel wires to eighty 7-gauge (ϕ 3.67 mm) steel wires, which is equivalent to 0.01% and 0.08%, respectively. Correlation between thermal resistance and stiffness of CSP in different generations of genetic algorithm optimization process is presented in Figure 16.
Figure 17 represent graphically the topology optimization of CSP vs. the base model. From this figure, one can see that there is tradeoff a tradeoff correlation between thermal resistance and stiffness of CSP. This is due to the correlation between the design variables of steel wires shear connector and thermal resistance described earlier.
In studying correlation between variables in the thermal insulation of the building material, the most important correlation is the one between materials cost and cost of energy loss that are directly related to the insulation thickness as shown in Figure 18. For this reason, the thickness of EPS foam core was kept constant. Results presented in Figure 18 illustrate the benefits of the new optimize design for CSP (blue curves). For example, optimization results of Model 47 shows that the cost of material decreased by 14% and energy cost, which is inversely related to thermal insulation, is reduced by 28%.

7. Conclusions

This research focused on developing a reliable and numerically tested optimization for a new generation of an orthotropic cementitious composite sandwich panel system (CSP) that meets all thermo-mechanical performance design targets. Optimization results provided an improved and optimum panel design that meets thermal insulation as well as the ACI 318-19 [15] minimum code requirements. The optimized panels developed in this study are lighter, economic (use less steel) and have a better thermal installation performance. The optimized CSP design that was accomplished using genetic algorithm (GA) results in 45% materials cost reduction and a saving of energy cost by 28% as compared to the base model (state-of-the-art panels). This is achieved, for example, by increasing CSP thermal resistance from 2.06 (m2·K/W) (R-12) for the base model to 2.89 (m2·K/W) (R-16), for Model 47. Using pareto-frontier, other optimum solutions have been identified. For example, if the material cost has higher priority, while meeting design requirements, designer can select, for example, Model 50 where the cost of material is reduced by 48%, with 35.6% increase in thermal resistance. On the other hand, if the insulation is the main priority, while meeting other design requirements, designer can choose Model 47, for example, where thermal resistance value is increased by 40%, while materials cost is decreased only by 38%.
Based on CSP optimization results obtained from this study, the following adjustments can be made to the commercially available CSP panels:
  • Diagonal shear transfer steel wires are prone to buckling under both horizontal and vertical shear loads. In order to improve the panel’s shear transfer performance, larger diameter steel wires are recommended, in lieu of smaller diameter steel wires that are currently utilized. This will provide better flexural stiffness by maximizing the composite action of the sandwich panel.
  • Results of this study indicated that the use of larger diameter for diagonal steel wires, results in a lower volume of shear connectors. Consequently, and as a direct result of this reduction, thermal bridging will be minimized and the overall panel cost will be discounted. An optimum ratio of 1:5 for steel wire shear connectors to exterior steel meshes is recommended.
  • Results of this study indicated that exterior steel wire mesh subjected to compression can be reduced while meeting section 7.6.1.1 of ACI 318-19 code [15] minimum reinforcement requirement for shrinkage and temperature. However, one should consider potential local buckling of the main steel wire reinforcement when designing lateral steel wires spacing of CSP member compression side.
  • Currently, all exterior steel meshes used for commercially produced CSP panels uses a ratio of 1:1, although the lateral steel wires do not contribute to the panel stiffness since these panels are designed as one-way slabs. Therefore, it is recommended to use 1:2 wire mesh ratio to reduce the cost of the panel.
  • In geographic locations with high temperature fluctuation, a ratio of 1:5½ for shear connectors to steel mesh grids, on each face is recommended (e.g., Model 47).
  • Additional studies are recommended to investigate the use of stainless steel or polymer composites, at least for shear connectors and other types of sustainable core materials such as biomaterials made of agriculture waste such as pretreated compressed rice straws and husks, as well other crops waste.
Although this optimization study focused on cementations sandwich panels (CSP), it can further be adopted for optimizing other sandwich building systems such as insulated concrete forms (ICF) panels, polymer composites sandwich panels and other structural insulating panels (SIP).
Following procedures described in this study, other parameters can be added or replaced in the optimization function to enhance results. For example, cost parameters such as labor and manufacturing costs or other materials variations to be implemented in producing such panel system. Other performance requirements such as: sounds insulation or humidity insulation, impact and blast resistance can also be included in the optimization process.

Author Contributions

Conceptualization, A.S.M., E.M., methodology, A.S.M., E.M.; software, E.M. and A.S.M.; validation E.M. and A.S.M.; formal analysis, E.M. and A.S.M.; investigation, E.M. and A.S.M.; resources, A.S.M.; data curation, writing—original draft preparation; writing—review and editing, A.S.M. and E.M.; visualization, E.M. and A.S.M.; supervision, A.S.M.; project administration, A.S.M.; funding acquisition, A.S.M. Both authors have read and agreed to the published version of the manuscript.

Funding

This research received no external funding.

Institutional Review Board Statement

Not applicable.

Informed Consent Statement

Not applicable.

Data Availability Statement

Not applicable.

Conflicts of Interest

The authors declare no conflict of interest.

References

  1. Garbowski, T.; Gajewski, T. Determination of Transverse Shear Stiffness of Sandwich Panels with a Corrugated Core by Numerical Homogenization. Materials 2021, 14, 1976. [Google Scholar] [CrossRef]
  2. Mosallam, A.; Elsanadedy, H.M.; Almusallam, T.H.; Al-Salloum, Y.A.; Alsayed, S.H. Structural evaluation of reinforced concrete beams strengthened with innovative bolted/bonded advanced FRP composites sandwich panels. Compos. Struct. 2015, 124, 421–440. [Google Scholar] [CrossRef] [Green Version]
  3. Mosallam, A. Structural evaluation and construction of fiber-reinforced polymer composites strengthening systems for the Sauvie Island Bridge. J. Compos. Constr. 2007, 11, 236–249. [Google Scholar] [CrossRef]
  4. Mosallam, A.S. Structural evaluation and design procedure for wood beams repaired and retrofitted with FRP laminates and honeycomb sandwich panels. Compos. Part B Eng. 2016, 87, 196–213. [Google Scholar] [CrossRef] [Green Version]
  5. Mosallam, A.S.; Bayraktar, A.; Elmikawi, M.; Pul, S.; Adanur, S. Polymer Composites in Construction: An Overview. SOJ Mater. Sci. Eng. 2014. Available online: https://symbiosisonlinepublishing.com/materialsscience-engineering/materialsscience-engineering07.php (accessed on 15 March 2015).
  6. El Demerdash, I. Structural Evaluation of Sustainable Orthotropic Three-Dimensional Sandwich Panel System. Ph.D. Thesis, Department of Civil & Environmental Engineering, University of California, Irvine, CA, USA, 2013. [Google Scholar]
  7. Botello, B. Experimental Evaluation of Sandwich Panels with Parallel Shear Connectors for Building Applications. Master’s Thesis, Civil & Environmental Department, University of California, Irvine, CA, USA, 2014. [Google Scholar]
  8. ICC-ES AC15. Concrete Floor, Roof and Wall Systems and Concrete Masonry Wall Systems; ICC-Evaluation Service Inc.: Brea, CA, USA, 2019. [Google Scholar]
  9. Bajracharya, R.M.; Lokuge, W.P.; Karunasena, W.; Lau, K.T.; Mosallam, A.S. Structural Evaluation of Concrete Expanded Polystyrene Sandwich Panels for Slab Applications. In Proceedings of the 22nd Australasian Conference on the Mechanics of Structures and Materials (ACMSM 22), Sydney, Australia, 11–14 December 2012. [Google Scholar]
  10. Kabir, M.Z.; Rahai, A.R.; Nassira, Y. Non-linear response of combined system, 3D wall panels and bending steel frame subjected to seismic loading. WIT Trans. Built Environ. 2006, 85. Available online: https://www.witpress.com/Secure/elibrary/papers/HPSM06/HPSM06069FU1.pdf (accessed on 15 March 2015).
  11. Kabir, M.Z.; Rezaifar, O. Shaking table examination on dynamic characteristics of a scaled down 4-story building constructed with 3D-panel system. Structures 2019, 20, 411–424. [Google Scholar] [CrossRef]
  12. Gara, F.; Ragni, L.; Roia, D.; Dezi, L. Experimental behaviour and numerical analysis of floor sandwich panels. Eng. Struct. 2012, 36, 258–269. [Google Scholar] [CrossRef]
  13. Benayoune, A.; Samad, A.A.A.; Trikha, D.; Ali, A.A.; Ellinna, S. Flexural behaviour of pre-cast concrete sandwich composite panel—Experimental and theoretical investigations. Constr. Build. Mater. 2008, 22, 580–592. [Google Scholar] [CrossRef]
  14. Poluraju, P.; Rao, G.A. Behaviour of 3d-Panels for Structural Applications under General Loading: A State-of-the-Art. Int. J. Res. Eng. Technol. 2014, 3, 173–181. [Google Scholar]
  15. Alajmi, A.; Wright, J. Selecting the most efficient genetic algorithm sets in solving unconstrained building optimization problem. Int. J. Sustain. Built Environ. 2014, 3, 18–26. [Google Scholar] [CrossRef] [Green Version]
  16. Goldberg, D.E. Genetic Algorithms; Addison-Wesley Longman Publishing Co.: Boston, MA, USA; ISBN 978-0-201-15767-3.
  17. Park, C.H.; Lee, W.I.; Han, W.S.; Vautrin, A. Weight minimization of composite laminated plates with multiple constraints. Compos. Sci. Technol. 2003, 63, 1015–1026. [Google Scholar] [CrossRef]
  18. Helal, M.; Fathallah, E. Multi-objective optimization of an intersecting elliptical pressure hull as a means of buckling pressure maximizing and weight minimization. Mater. Test. 2019, 61, 1179–1191. [Google Scholar] [CrossRef]
  19. Mirfarhadi, S.A.; Estekanchi, H.E.; Sarcheshmehpour, M. On optimal proportions of structural member cross-sections to achieve best seismic performance using value based seismic design approach. Eng. Struct. 2021, 231, 111751. [Google Scholar] [CrossRef]
  20. Sarma, K.C.; Adeli, H. Cost Optimization of Concrete Structures. J. Struct. Eng. 1998, 124, 570–578. [Google Scholar] [CrossRef]
  21. Raju, P.M.; Manasa, A.; Rohini, G. Cost optimization of a rectangular singly reinforced concrete beam by Generalized Reduced Gradient method. IOP Conf. Ser. Mater. Sci. Eng. 2021, 1025, 012005. [Google Scholar] [CrossRef]
  22. Goble, G.G.; Lapay, W.S. Optimum design of prestressed beams. ACI J. 1971, 68, 712–718. [Google Scholar]
  23. Arora, J.S. Introduction to Optimum Design, 3rd ed.; Elsevier: Amsterdam, The Netherlands, 2012; ISBN 978-0-12-381375-6. [Google Scholar]
  24. Kirsch, U. Optimum design of prestressed beams. Comput. Struct. 1972, 2, 573–583. [Google Scholar] [CrossRef]
  25. Friel, L.L. Optimum singly reinforced concrete sections. ACI 1974, 71, 556–558. [Google Scholar]
  26. ACI 318-19. Building Code Requirements for Structural Concrete; American Concrete Institute (ACI): Farmington Hills, MI, USA, 2019. [Google Scholar]
  27. Brown, R.H. Minimum Cost Selection of One-Way Slab Thickness. J. Struct. Div. 1975, 101, 2585–2590. [Google Scholar] [CrossRef]
  28. Naaman, A.E. Minimum Cost Versus Minimum Weight of Prestressed Slabs. J. Struct. Div. 1976, 102, 1493–1505. [Google Scholar] [CrossRef]
  29. Lemonge, A.; Barbosa, H.; Fonseca, L. A genetic algorithm for the design of space framed structures. In XXIV CILAMCE–Iberian Latin-American Congress on Computational Methods in Engineering; Ouro Preto, Brazil, 2003; Volume 6, ISSN 2675-6269. [Google Scholar]
  30. Standard Wire Gauge Chart for AWG Conversion. Available online: https://www.sigmaaldrich.com/content/dam/sigma-aldrich/articles/biology/marketing-assets/wire-gauge-conversion-chart-mk.pdf (accessed on 15 May 2015).
  31. Qomi, M.J.A.; Noshadravan, A.; Sobstyl, J.M.; Toole, J.; Ferreira, J.; Pellenq, R.J.-M.; Ulm, F.-J.; Gonzalez, M.C. Data analytics for simplifying thermal efficiency planning in cities. J. R. Soc. Interface 2016, 13, 20150971. [Google Scholar] [CrossRef] [PubMed] [Green Version]
  32. Bizee Degree Days. Available online: https://www.degreedays.net (accessed on 12 December 2016).
  33. Sisman, N.; Kahya, E.; Aras, N.; Aras, H. Determination of optimum insulation thicknesses of the external walls and roof (ceiling) for Turkey’s different degree-day regions. Energy Policy 2007, 35, 5151–5155. [Google Scholar] [CrossRef]
  34. MSC MARC. Volume A: Theory and User Information; MSC Software: Newport Beach, CA, USA, 2014. [Google Scholar]
  35. MSC MARC. Volume B: Element Library; MSC Software: Newport Beach, CA, USA, 2014. [Google Scholar]
Figure 1. Light-weight feature of CSP building system.
Energies 14 06001 g001
Figure 2. Different Types of Possible Composite Action in CSP Panels: (a) Non-Composite Action; (b) Partial Composite Action; (c) Full Composite Action.
Energies 14 06001 g002
Figure 3. Details of a typical cementitious sandwich panel with individual welded wire shear connectors (Class I).
Energies 14 06001 g003
Figure 4. Continuous Warren truss-type CSP systems.
Energies 14 06001 g004
Figure 5. CPS Panels Shear Reinforcements: (a) Panels with parallel wires shear reinforcement (Class I), (b) Ribbed floor panels with parallel wires shear reinforcement (Class II), (c) Portions of wire surfaces covered by EPS foam.
Energies 14 06001 g005
Figure 6. Boundary conditions of CSP with inclined shear transfer connectors.
Energies 14 06001 g006
Figure 7. Design option for structural configuration: (a) three modules with 6 bays, (b) five modules with 3 bays.
Energies 14 06001 g007
Figure 8. Top view of CSP Topography Configuration options for shear connectors.
Energies 14 06001 g008
Figure 9. Equivalent thermal circuit for a typical CSP panel.
Energies 14 06001 g009
Figure 10. Genetic algorithm flowchart for sandwich panel optimization.
Energies 14 06001 g010
Figure 11. Objective function vs. genetic algorithm generations history.
Energies 14 06001 g011
Figure 12. History of CSP cost and thermal resistance in GA optimization.
Energies 14 06001 g012
Figure 13. GA search path for cost and thermal resistance optimization excluding panelized members.
Energies 14 06001 g013
Figure 14. Pareto-optimal front plot in the objective space.
Energies 14 06001 g014
Figure 15. Correlation between shear transfer and thermal resistance of CSP panels.
Energies 14 06001 g015
Figure 16. Correlation between thermal resistance and stiffness of CSP panels.
Energies 14 06001 g016
Figure 17. Graphical representation of CSP Topology Optimization using GA.
Energies 14 06001 g017
Figure 18. Effects of optimization on insulation and energy cost.
Energies 14 06001 g018
Table 1. Existing CSP Panel classification.
ClassificationClass IClass II
Shear Connector TypeInclinedParallel
Load Bearing CapabilityGravity and LateralPartition *
Average Shear Transfer Element≈100/m2≈30/m2
Shear Connector Diameter3 mm 2.5 mm
Steel Mesh (Top and Bottom)50 × 50 mm80 × 75 mm
* Additional reinforcement required for load bearing capabilities to meet building codes requirements.
Table 2. Design variables for optimization of CSP system.
ParameterUnitLevel 1Level 2Level 3
Bays/1.0 m Length#345
Modules/1.0 m Width#6810
Shear Connector Diameter cm0.23 0.27 0.35
Steel Mesh Diameter (Top)cm0.23 0.27 0.35
Steel Mesh Diameter (Bottom)cm0.23 0.27 0.35
Mortar Thickness (Top)cm2.5 5.0 7.5
Mortar Thickness (Bottom)cm2.5 5.0 7.5
Wire Steel Mesh RatioRatio1:11:21:4
Table 3. Electrical Network Analogues for Heat Transfer Modeling.
ParameterThermalElectrical
PotentialTemperatureVoltage
ResistanceResistance to heat flowElectrical resistance
FluxHeat transfer rateElectrical current
CapacitanceThermal capacityCapacitors
Table 4. Estimation of Weight Factors used in this Study.
ParameterSteelMortarHeat Loss *Total
Cost in Base Model$11.88$12.18$2.59$26.65
Normalized Contribution Factor0.420.430.151
* Calculated for the City of Irvine, California, USA for a 10-Year Period.
Table 5. Genetic Algorithm Analysis of First Generation and Birth of Second Generation.
1Individual Number12345
21st Generation1332213213322131323212221211133311111113
3Objective function, f(x)20.8126.5425.9210.6828.42
4Fitness function, Fi18.2912.5613.1828.4210.68
5Fi/F1.100.760.791.710.64
6Survival of fittest21120
7Mates43210
8Crossover 123320
9Crossover 245540
102nd Generation1211213213321131323222221332133313111131
Table 6. Comparison of Pareto-Optimal Solutions to Base Model.
1Individual Number474950
3Weight of Steel−38%−47%−48%
4Weight of Mortar−14%−14%−43%
5Total Weight−15%−15%−43%
6Thermal Resistance, Rt40%36%35.6%
7Materials Cost −38%−47%−48%
Table 7. CSP specifications comparison 10th generation to base model.
ParameterUnitsBase ModelModel 47Model 49Model 50
Number of Shear ConnectorPieces per m2100405048
Shear Connector Sizemm2.92.32.32.3
Top Mesh Wire Sizemm2.92.32.32.3
Bottom Mesh Wire Sizemm2.92.92.32.3
Top Mortar Thicknessmm38505025
Bottom Mortar Thicknessmm50252525
Steel Mesh Spacing (LXW)mm50 × 5050 × 10050 × 10050 × 100
Weight of Mortarkg220126126126
Weight of Steelkg3.62.221.91.88
Thermal Resistancem2 K/W2.062.892.812.79
(1 mm = 0.039 in), (1 m2 = 10.5 ft2), (1 kg = 2.2 lbs.) (1 m2 K/W [RSI] = 5.67 h ft2 °F/BTU [R-Value]).
Publisher’s Note: MDPI stays neutral with regard to jurisdictional claims in published maps and institutional affiliations.

