Article

Identification of Critical Components in the Complex Technical Infrastructure of the Large Hadron Collider Using Relief Feature Ranking and Support Vector Machines

1
Center for Applied Mathematics, Ecole Polytechnique, Institut Polytechnique de Paris, Route de Saclay, 91120 Palaiseau, France
2
Energy Department, Politecnico di Milano, Via Lambruschini 4, 20156 Milan, Italy
3
Engineering Department, CERN, 1211 Geneva, Switzerland
4
Centre de Recherche sur les Risques et les Crises (CRC), MINES ParisTech, PSL Research University, 06904 Sophia Antipolis, France
*
Author to whom correspondence should be addressed.
Energies 2021, 14(18), 6000; https://doi.org/10.3390/en14186000
Submission received: 28 June 2021 / Revised: 3 September 2021 / Accepted: 14 September 2021 / Published: 21 September 2021
(This article belongs to the Special Issue Special Issue of ESREL2020 PSAM15)

Abstract

:
This work proposes a data-driven methodology for identifying critical components in Complex Technical Infrastructures (CTIs), for which the functional logic and/or the system structure functions are not known due the CTI’s complexity and evolving nature. The methodology uses large amounts of CTI monitoring data acquired over long periods of time and under different operating conditions. The critical components are identified as those for which the condition monitoring signals permit the optimal classification of the CTI functioning or failed state. The methodology includes two stages: in the first stage, a feature selection filter method based on the Relief technique is used to rank the monitoring signals according to their importance with respect to the CTI functioning or failed state; the second stage identifies the subset of signals among those highlighted by the Relief technique that are most informative with respect to the CTI state. This identification is performed on the basis of evaluating the performance of a Cost-Sensitive Support Vector Machine (CS-SVM) classifier trained with several subsets of the candidate signals. The capabilities of the methodology proposed are assessed through its application to different benchmarks of highly imbalanced datasets, showing performances that are competitive to those obtained by other methods presented in the literature. The methodology is finally applied to the monitoring signals of the Large Hadron Collider (LHC) of the European Organization for Nuclear Research (CERN), a CTI for experiments of physics; the criticality of the identified components has been confirmed by CERN experts.

1. Introduction

The identification of components critical for the functionalities of industrial and manufacturing systems is of essential importance to detect bottlenecks to which consolidation efforts must be directed, aiming at reducing the probability of abnormal conditions, number of shutdowns and recovery time [1,2]. When the structure function of the system and the reliabilities of its components are known, components critical for the successful functionality of the system can be identified by traditional reliability and risk analysis methods by calculating the so-called component importance measures [3,4]. However, this is unattainable for CTIs, which are large-scale systems of systems composed of thousands of interdependent and interconnected components executing diverse functions and using distinct technologies, e.g., hydraulics, mechanics, and electronics [5,6]. Due to their topological complexity, their spatial distribution, and the distinctions in their functionalities and technologies, the systems of a CTI are designed and constructed independently, and then assembled relying on the direct physical interfaces and considering functional dependencies that only take into account the theoretical scenarios of operation [2,7]. Throughout the life of a CTI, its systems evolve over time to maintain their operation, improve their performance, expand their functions, etc. [7]. This evolution modifies the physical interconnections between the systems of the CTI, which consequently alters the functional dependencies among the components and, therefore, their criticalities [1,8,9].
For two decades, there has been a growing interest from academy, industry and governments in investigating novel and alternative methods for identifying criticalities in different types of CTIs. Hausken [10] proposed a methodology combining defense–attack models and risk analysis, which analytically identifies critical interdependencies among complex infrastructures, and applied it to identify economically critical interdependencies among different industrial sectors in the USA. Wu et al. [11] developed a method relying on network theory for identifying potential geographical and physical interdependencies triggering cascading failures among different infrastructures in situations of touristic attacks. Chopra and Khanna [12] proposed a method based on network and graph theories for the identification of interdependencies among different infrastructures that could magnify the effects of natural disasters on the resilience of the US national economy. Zio and Ferrario [13] developed a system-of-systems modeling framework for analyzing the risk of accidents caused by external events (specifically earthquakes) in a nuclear power plant. Their proposed framework made it possible to consider the interdependent infrastructures in which the plant was embedded (e.g., power and water distribution networks), through the use of Muir Web and Monte Carlo simulation for the quantitative evaluation. Genge et al. [14] presented a sensitivity analysis-based method that required knowledge of the system dynamics in order to highlight the critical control variables regarding cyber-attacks on infrastructures. Patterson and Apostolakis [15] developed a method, combining network theory and Monte Carlo simulation, for identifying critical geographical sectors in dependent infrastructures.
These methods, however, face serious challenges hindering their practical application to CTIs, which requires detailed knowledge of the CTI structure function, architecture and/or dynamics, which is not attainable for complex and evolving systems [1].
Recently, two data-driven approaches have been developed for the analysis of components criticality in CTIs. A wrapper feature selection method based on the use of a differential evolution algorithm for the identification of the subset of monitoring signals that optimizes the performance of a Support Vector Machine model classifying the CTI functioning/failed state was proposed in Baraldi et al. [16]. Although the method was successfully applied to a dataset involving 200 monitoring signals of a real CTI, the computational cost associated with the wrapper feature selection algorithm represents a practical limitation on the size of the CTI to which the method can be applied. Lu et al. [17] developed a data-driven method for the estimation of the importance measures of CTI components based on the use of a random forest model for classifying the CTI functioning/failed state as a function of the individual components’ states. The method relies on the assumption that the functioning/failed state of each individual component is known, which is not possible for many real CTIs.
To tackle these challenges, this work presents a contribution in the form of a novel data-driven methodology for the identification of components critical for CTI production availability, based on the processing of a large amount of monitoring data of the CTI. These data include the values of hundreds of signals registered over long periods of time and under several operational conditions of the CTI. The methodology relies on the selection of the subset of signals most relevant and informative with respect to the CTI state, i.e., functioning or failed. Then, the critical components are identified as those whose states are monitored by the selected subset of signals.
The identification of the subset of relevant/informative signals is accomplished via a two-stage methodology. The first stage is formulated as a feature selection problem, i.e., the identification of the subset of monitoring signals that allows the development of the best-performing model for the classification of the CTI functioning/failed state [18,19]. Most feature selection methods can be categorized as either filter or wrapper methods [20]. Filter methods are based on computation, directly from the data and independently of the specific model used for classification, of a numerical evaluation index, which is used to score individual features or features subsets according to their importance or relevance with respect to the classification output [18,20]. On the contrary, wrapper feature selection methods select an optimal subset of features for developing the classification model itself, i.e., the classification model is wrapped within a search algorithm (i.e., optimizer), which aims to identify the feature subset that provides the best classification performance [16,21].
In this work, wrapper feature selection methods are not considered because of the scale of the system, which is characterized by a very large number of monitoring signals. This makes the application of wrapper methods to the whole CTI infeasible, due to the computational effort required for training and testing a dedicated classifier for each of the candidate subsets of features explored by the optimization algorithm [22,23]. Therefore, a filter method based on the Relief ranking technique is employed to identify potential candidate signals related to the CTI state [18,19]. The Relief feature ranking algorithm has been chosen in this work due to its relatively low computational requirements, tolerance to noise, and robustness to feature interactions [24]. The Relief ranking algorithm assigns a proxy statistic, or a score, to each individual feature: low scores are assigned to features that have different values for neighboring instances belonging to the same class, and high scores are assigned to features that have different values for neighboring instances belonging to different classes. The scores assigned by Relief express the relative importance, or relevance, of each feature with respect to the output (i.e., the binary CTI state in our case of interest). These scores range from −1 (worst) to +1 (best), and provide valuable knowledge of the system [18].
The second stage involves a procedure for identifying the subset of most informative signals for the CTI state, among those top-ranked by Relief. This subset is searched by maximizing the performance of a CS-SVM classifier [25,26] of the CTI state on a set of data different from that used for the previous stage of Relief feature ranking. The procedure evaluates the performance of CS-SVM classifiers sequentially built by adding, each iteration, the next top-ranked signal (feature). Therefore, in the first step, only the first-top feature is included in the feature subset, in the second iterating, the second-top feature is added to the feature subset, and the procedure is repeated as long as the performance increases. Then, the components referred to by the chosen subset of top-ranked features are identified as critical.
The main novelties of this work are:
(i)
the development of a method for the identification of critical components in CTIs that relies fully on data and, thus, unlike most of the existing methods of CTI analysis, it does not require detailed knowledge of the CTI;
(ii)
the application of the method to the real and complex CTI of the CERN LHC, on the basis of a large amount of monitoring data collected over one year of operation, in contrast to most existing methods of CTI analysis, which investigate simplified and theoretical cases of CTIs.
A two-stage procedure has been adopted for the validation of the proposed method: (i) the individual steps of the proposed method, i.e., the classification using the CS-SVM, the feature ranking provided by the Relief algorithm, and the method for the quantification of the information content of a subset of features have been verified considering 15 benchmark labeled datasets from the Knowledge Extraction based on Evolutionary Learning (KEEL) repository [25,27]; (ii) the identification of the critical components in CTIs has been validated by means of a real case study involving 260 monitoring signals of the LHC particle accelerator of CERN, which is a large-scale and complex system of systems, in which the failure of individual components/units directly influences the accelerator performance and its total availability for physics experiments [28,29]. Since the ground-truth importance ranking of the CTI components is not available, the obtained results have been directly validated by expert judgment of CERN operators knowledgeable of the CTI behavior and its malfunctioning.
The remainder of this paper is structured as follows. The problem of the identification of critical components in CTIs is formulated in Section 2. The proposed methodology based on the Relief feature ranking algorithm is described in Section 3. The performance of the proposed method is validated on the basis of different benchmark datasets in Section 4. The application of the proposed methodology for the identification of the components critical in the CTI of the CERN LHC is shown in Section 5. Finally, the work is concluded in Section 6.

2. Problem Statement

This work addresses a CTI composed of a large number, M , of components whose individual states (functioning or failed) are unknown. The CTI functioning or failed state at time t is denoted using a binary variable:
x C T I t = 1 i f   t h e   C T I   i s   f a i l e d         0 i f   t h e   C T I   i s   f u n c t i o n i n g    
The CTI functioning or failed state x C T I t is assumed to be known to the plant operators. Additionally, the CTI is monitored by a number of N > M sensors, measuring a set of N physical quantities of the CTI components, y t = y 1 t , y 2 t , , y n , ,   y N t , such as pressures, temperatures and electrical signals, which implicitly contain real-time information about the CTI individual component states. Figure 1 shows a schematic representation of the information collected by monitoring the CTI components.
The goal of this study is to identify the set of components critical for the state of the CTI, c = c 1 ,   c 2 , ,   c , ,   c q , with q < M and c c 1 , ,   c M for any = 1 , , q . To achieve this goal, this work exploits the information content of a dataset D involving a history of instances y k , x C T I k , k = 1 , K , where y k is the vector of signal values collected at past time instant k and x C T I k 0 , 1 represents the associated state of the CTI (0 refers to failed state and 1 to functioning state). Henceforth, we denote the patterns with failed state as positive and belonging to the minority class, while we denote those with functioning state as negative and belonging to the majority class. In fact, since CTI failure is a rare event, the number of positive patterns K + is considerably smaller than that of negative patterns K , i.e., K + K .
In this work, the principal hypothesis is the existence of an unknown function G :   x C T I t = G y t , representing a relation between the values of the monitoring signals y (t) and the state of the system x C T I t . The conjecture is that if a data-driven classifier x C T I t = G y t can be developed with acceptable classification performance, the hypothesis of the existence of the function x C T I t = G y t can be verified.
Hence, the problem of the identification of the set of components c critical for the CTI state is linked to that of identifying the subset of signals y = y 1 , y 2 ,   , y r , , y R with r < N and y r y 1 , y 2 , , y i , , y N , which are most relevant for determining the CTI state x C T I . A subset of signals y 1 is assumed to be more relevant to the CTI state, x C T I , than a subset of signals y 2 if the performance of a classifier G 1 y 1 :   x C T I = G 1 y 1 , developed using the instances y 1 k , x C T I k , k = 1 , K , is superior to the performance of a classifier G 2 y 2 :   x C T I = G 2 y 2 , developed using the instances y 2 k , x C T I k , k = 1 , K . This, then, leads to the definition of the problem of selecting the subset of signals   y that permits the development of the best data-driven classifier G of the CTI state. In other words, searching for the best subset of signals y is led by the performance of the classifier G developed using y . Eventually, the critical components c are identified as those whose operating states are monitored by the optimal subset of signals y .
It is worth mentioning that with respect to the quality of the monitoring data collected from industrial systems, the performance of the classification method could be reduced by: (i) missing measurements resulting from the failure to collect or store signal values at few time instances [30] and (ii) gross errors due to sensor faults, such as freezing, drifting and miscalibration [31,32]. To address these problems, missing data imputation and data reconciliation methods have been developed and successfully applied for improving the quality of the data collected from industrial systems. Interested readers can refer to [33,34].

3. Methodology

To identify the optimal subset of monitoring signals y that allows the best classification of the CTI state (i.e., function or failed), this work proposes a methodology based on the following steps (Figure 2):
  • sorting the monitoring signals according to their importance/relevance to the CTI state using the Relief-based feature ranking algorithm (Section 3.1);
  • identifying the best performing features subset, y , by the quantification of the information content (Section 3.2);
  • identifying as critical components those whose states are monitored by the best feature subset y .

3.1. Relief-Based Feature Ranking

The Relief algorithm is a supervised filter method for feature selection that provides a proxy statistic for each feature (also called feature weight), which acts as a measure of the relevance of the feature with respect to a target concept [24]. It was originally designed for application to binary classification problems with discrete or continuous features, and was then generalized to handle multi-class classification and regression problems [18]. The Relief algorithm is also able to rank features of different types, such as continuous, discrete, binary, categorical and textual.
Relief assigns low scores to features that have different values for neighboring instances belonging to the same class and high scores to features that have different values for neighboring instances belonging to different classes [24]. Consider a dataset D containing instances y k , x C T I k ,   k = 1 , , K , where the k t h instance records the features values, y k = y 1 k , y 2 k , , y n k , , y N k , and the corresponding CTI functioning/failed state, x C T I k = 0 / 1 . The Relief algorithm first initializes the weights of the features to zero, W = w 1 , w 2 , , w j , , w N = 0 . Then, the weights are updated over V iterations corresponding to V instances, V K , randomly selected without replacement. In the v t h iteration, v = 1 , 2 , V , the features weights are updated on the basis of the difference between their values at this instance, y v , and their values at the Q nearest neighbour instances, y q v , q = 1 , 2 , , Q , of each class:
W v = W v 1 q = 1 x C T I y q v = x C T I   y v Q d i f f y v , y q v V . Q + x C T I y q v x C T I   y v p x C T I y q v 1 p x C T I   y v . q = 1 Q d i f f y v , y q v V . Q
d i f f y v , y q v = y v y q v m a x y m i n y
where p x C T I y q v and p x C T I   y v are the prior probabilities of the class (i.e., CTI state 0/1) to which the instances y q v and y v belong, respectively, which can be estimated from the training data. Notice that the larger the difference of the feature values for instances of the same class, the smaller the assigned weights (second term of Equation (1)) and the larger the difference of the feature values for instances of different class, the larger the assigned weight (third term of Equation (1)). The obtained weights are normalized between −1 and +1, and the normalized weight vector, W = w 1 , w 2 , , w N , is used to rank the N features according to their informativeness or relevance. Finally, the ranked signals y r n k = y 1 , y 2 , , y 𝓀 , ,   y N are obtained, where y 𝓀 is the 𝓀 th most important feature with respect to the CTI state, x C T I , among all the N features. For further details on the Relief algorithm, the reader is invited to consult [18].

3.2. Quantification of the Information Content of the Top-Ranked Feature Subsets

The feature ranking information provided by the Relief technique is used to select the subset of input signals for building a classification model [18]. Commonly adopted practical solutions include directly choosing a predefined maximum number of top-ranked features or selecting a subset of top-ranked features for which the importance weights are higher than a certain threshold.
Assuming that the subset of the top-ranked features most informative of the CTI state is the one that allows to obtain the best classification of the CTI functioning or failed state, the following iterative procedure has been adopted in this work. At the first iteration, an empirical classifier is built to receive in input the first top-ranked feature y 1 and provide as output the CTI state x C T I , and its performance is evaluated. Improved classifiers are then obtained by iteratively adding the next top-ranked feature in the input. In other words, at the generic i-th iteration, the empirical classifier, G i y i r n k s b :   x C T I = G i y i r n k s b , y i r n k s b = y r n k y 1 : y 𝓀 = i , receiving as input the top-ranked features up to the i - t h one, is developed and its classification performance is evaluated. The procedure stops when adding the next top-ranked feature to the inputs produces a classifier that has a performance that does not improve upon that of the previous classifiers.
With respect to the choice of the proper metric to be used for assessing the classification performance, the G m e a n and F m e a s u r e metrics are typically considered in the case of highly imbalanced datasets [25]:
G m e a n = R e c a l l × S p e c i f i c i t y
F m e a s u r e = 2 × R e c a l l × P r e c i s i o n R e c a l l + P r e c i s i o n
R e c a l l = T P T P + F N     ,     S p e c i f i c i t y = T N T N + F P   ,         P r e c i s i o n = T P T P + F P
where TP, TN, FP and FN are the numbers of true positives, true negatives, false positives and false negatives, respectively. The two metrics can take any value within the range [0,1], with 0 indicating the worst performance and 1 the best.
The recall metric greatly rewards the accurate classification of the rare positive instances, specificity slightly penalizes the wrong classification of the relatively large number of negative instances and precision heavily penalizes large number of FP predictions [25]. Since the G m e a n is the geometric mean of recall and specificity, its values can be large even if the false alarm rate value is high [25], which is harmful in industrial practice. Therefore, the additional consideration of the F m e a s u r e , which is the harmonic mean of sensitivity and precision, is necessary to consider false alarms. In this work, as a compromise between the two measures, we also consider the following utility function to assess the performance of the classifiers:
U = η   F m e a s u r e + 1 η G m e a n
where η 0 , 1 is a weighting parameter that balances the importance of the F m e a s u r e and the G m e a n : lower values of η result in a performance measure, U , that gives more importance to triggering true alarms than avoiding false alarms, and vice versa. In this work, the same importance is given to the two metrics F m e a s u r e and G m e a n , i.e., η is set equal to 0.5.

3.3. Classifier

Different types of classification methods, such as artificial neural networks [35,36], SVMs [37], random forest [17], decision trees [38] and k-nearest neighbors [39], can be used to classify the CTI functioning/failed state from monitoring signals. In this work, SVM classifiers have been adopted, since they offer high classification performance, low computational cost, and ability to handle imbalanced datasets by using its Cost-Sensitive adjustment [26,40].
Given a set of input–output training data, SVM maps the input-data original space into a high-dimensional feature space through a basis or kernel function that can be of different types, e.g., linear, polynomial, Gaussian, etc. [41]. Then, the problem becomes the determination of a linear decision boundary separating the training instances of the different classes. The identification of the optimal decision boundary implies the maximization of a distance, also called margin, from the decision boundary to its nearest positive and negative training instances, which are referred to as the support vectors [41].
Given the typical high reliability of CTIs, most of the instances of monitoring signals are recorded while the CTI is operating in the functioning state (majority class), while very few instances correspond to CTI failure events (minority class). To efficiently handle such imbalanced datasets, the Cost-Sensitive setting of the SVM is considered [25]. CS-SVM assigns a greater cost to the incorrect classification of minority class instances than to that of majority class instances. Specifically, the cost value associated with a class is set to be equal to the inverse of the number of available instances belonging to the class.
The CS-SVM hyperparameters, such as the kernel scale, are optimized using a grid search procedure. We also considered the Gaussian kernel type, since it has shown very satisfactory results in several different applications [26,40]. The implementation of CS-SVM classifiers is accomplished via the “fitcsvm” algorithm included in the statistics and machine learning toolbox of Matlab [42].

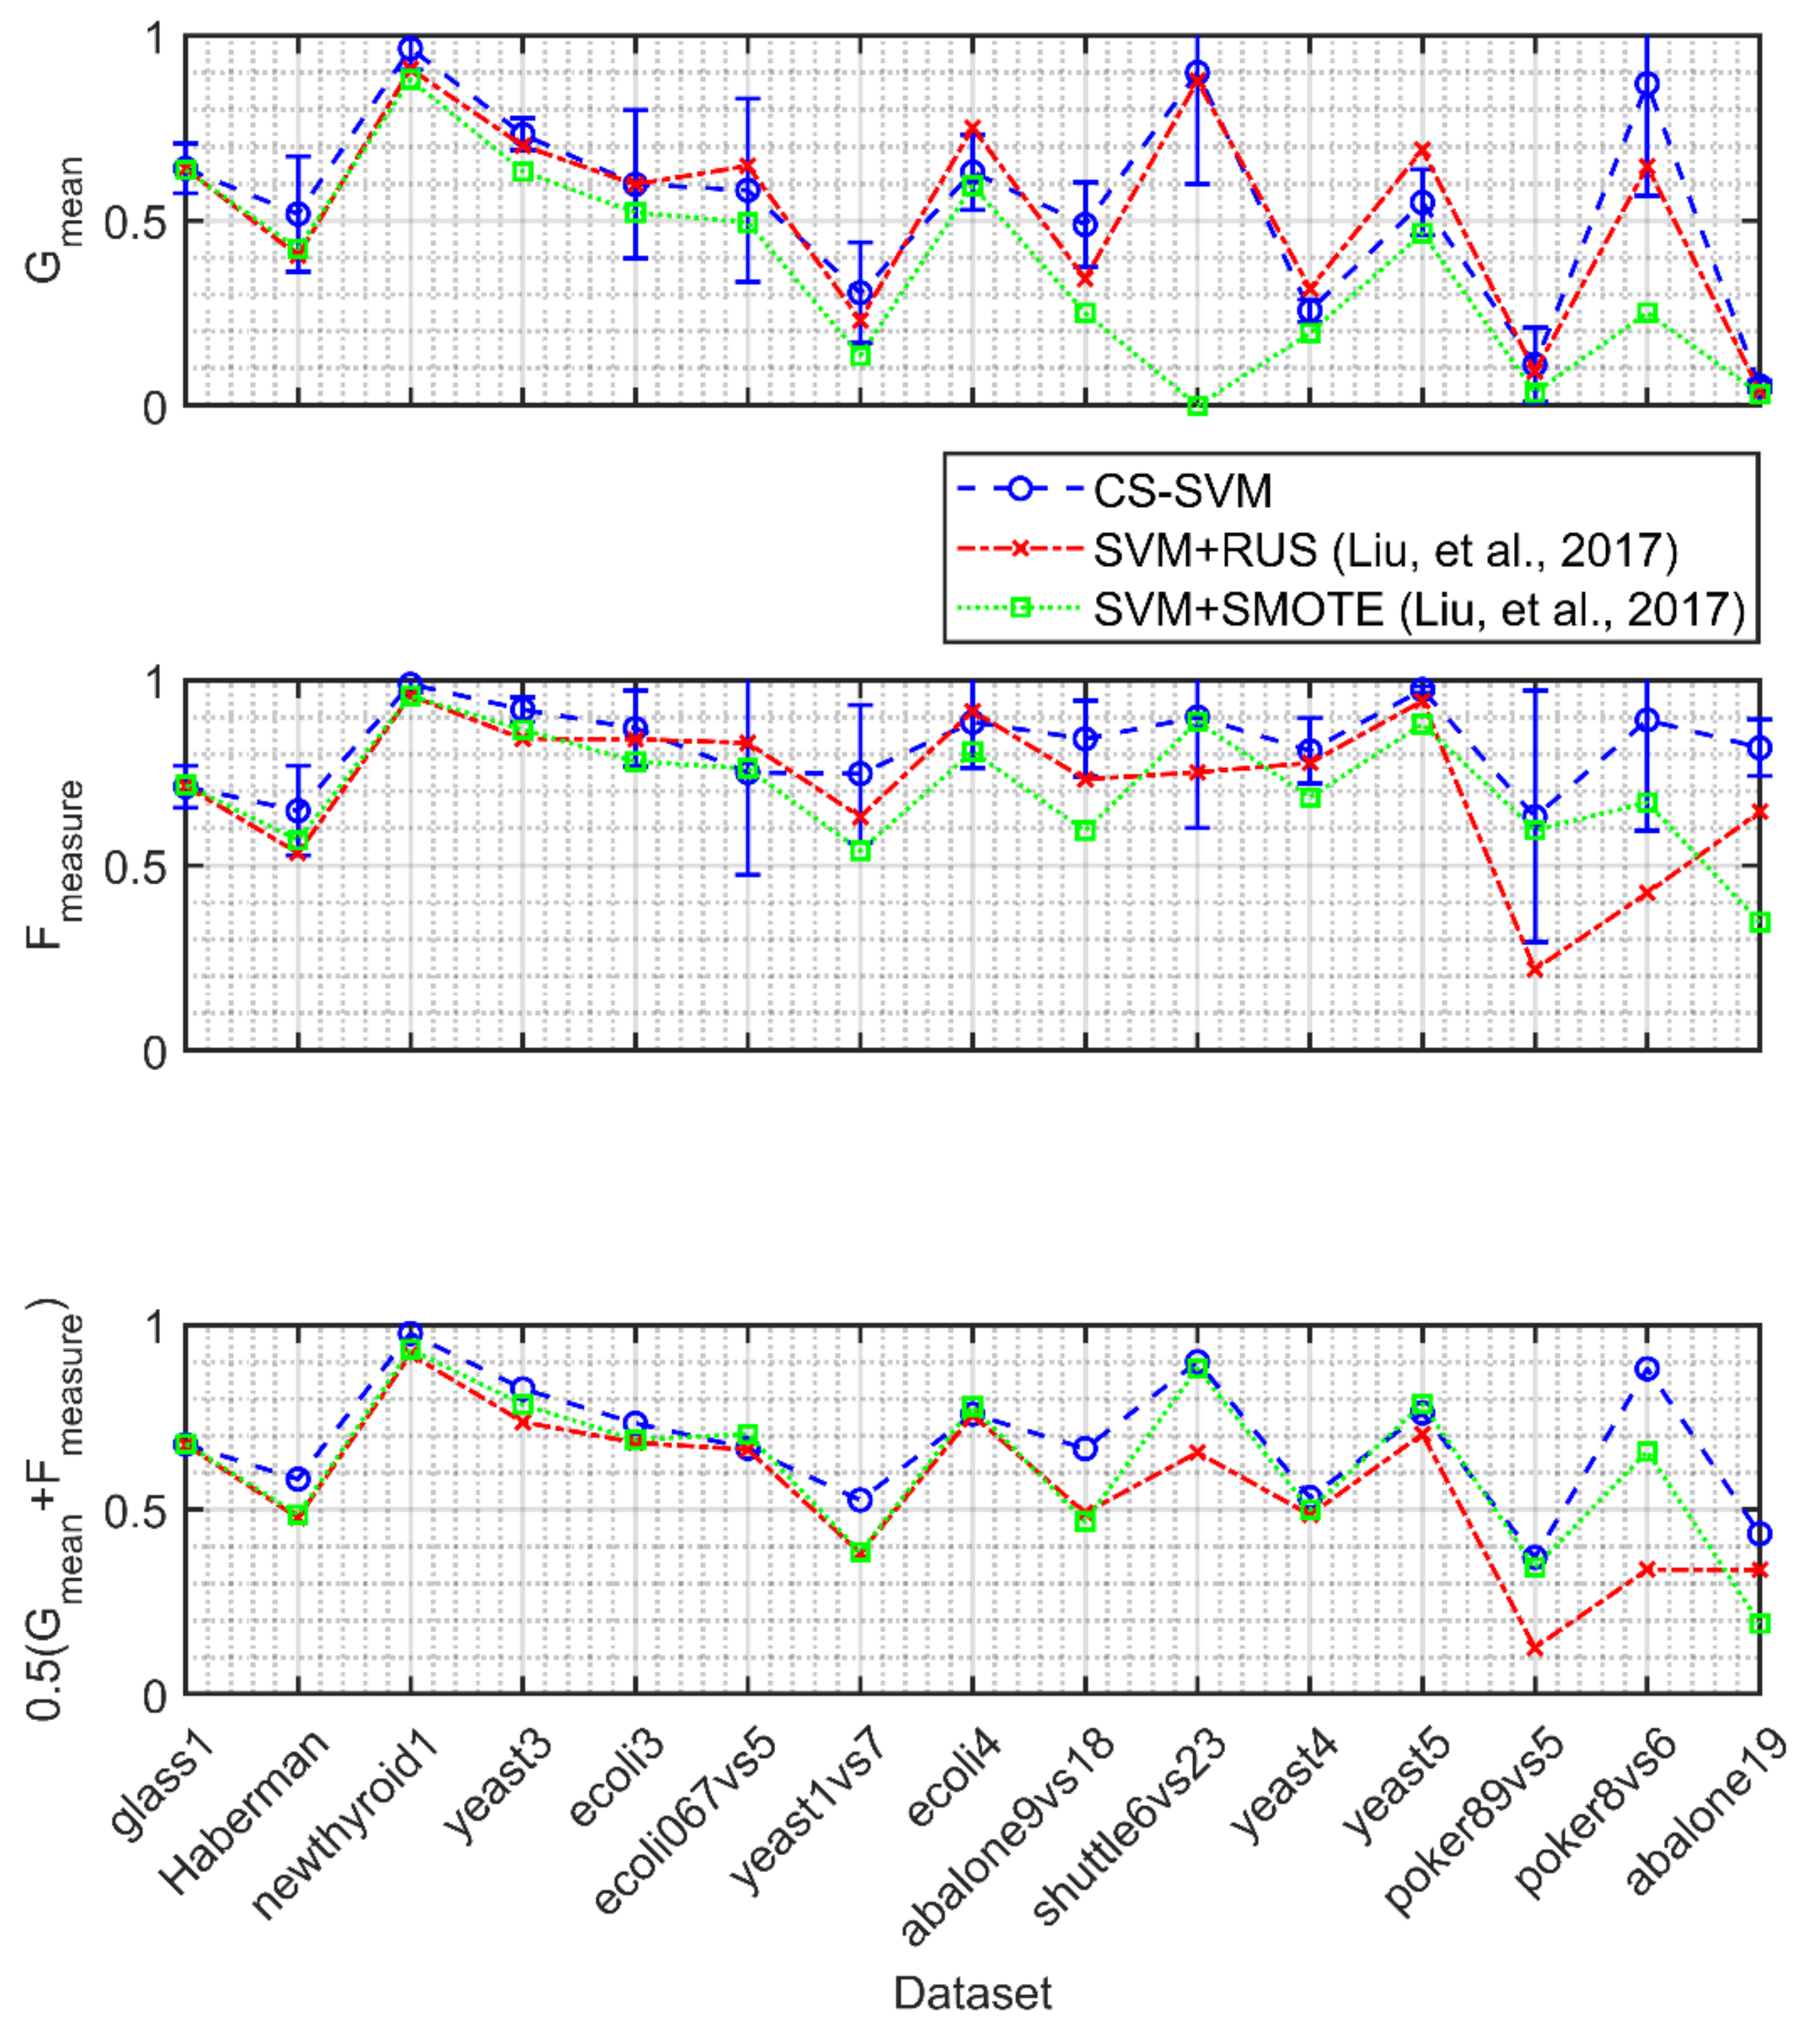
4. Validation of Proposed Method on Benchmark Datasets

In this section, the performance of the proposed method is validated using 15 benchmarks classification datasets taken from the Knowledge Extraction based on Evolutionary Learning (KEEL) repository, which are characterized by high imbalance ratios [27]. Table 1 shows the main characteristics of these benchmark datasets. The validation of the method is based on the following steps: (1) the evaluation of the performance of the CS-SVM model in the classification of highly imbalanced datasets (Section 4.1), (2) the evaluation of the capability of the Relief algorithm of ranking the importance of the signals (Section 4.2); (3) the analysis of the robustness of the developed feature selection method with respect to the presence of noisy measurements and a large number of irrelevant features (Section 4.3) and (4) the quantification of the information content in the selected features (Section 4.4).
All the performances were obtained by applying a 10-fold cross-validation procedure and using a grid search for setting the parameters of the Gaussian kernel scale (see Section 3.2) of the CS-SVM. Note that the Relief method uses the same training data as the CS-SVM (i.e., nine folds of data).

4.1. Validation of the CS-SVM Classifier

This analysis involves a comparison between the classification performance of a CS-SVM that receives in input all the features and two other SVM-based approaches developed by Liu et al. [25] for imbalanced datasets, which are based on Random Under Sampling (RUS) and Synthetic Minority Over-sampling Technique (SMOTE). The work of Liu et al. [25] has been selected as benchmark, since it is the most recent work using filter feature selection, SVM classification and dealing with highly imbalanced datasets. Other methods based on wrapper feature selection approaches are not considered here, since they are not applicable to systems where hundreds of signals are measured, due to their unaffordable computational cost.
According to the results shown in Figure 3, the CS-SVM classifier outperforms two of the techniques (RUS and SMOTE) most commonly used in the literature for handling imbalanced datasets in binary classification, over at least 11 out of 15 datasets. Therefore, it can be concluded that the CS-SVM can be used for the classification of CTI datasets containing a large proportion of negative (functioning state) patterns.

4.2. Validation of the Relief Feature Ranking

The CS-SVM classifier is used in combination with the proposed Relief-based feature ranking method, considering as input for the classifier all the features with importance weight greater than or equal to half of the weight value associated to the first-ranked feature. Figure 4 compares the classification performance of the CS-SVM receiving as input the feature subset chosen by the Relief feature ranking method with that of the CS-SVM receiving as input all of the features, and with that of the method proposed in [25]. This latter method combines (i) a filter-based feature selection technique that calculates an index measuring the Between-Class Separability (B-CS) for each individual feature, (ii) an instance selection technique that considers the B-CS and a variable Local Fitness (LF) index, and (iii) a classification model, based on cost-sensitive least square SVM, which is built using only the features and the instances selected in steps (i) and (ii).
Figure 4 shows that the classifiers, trained using only the features identified by the Relief algorithm (i.e., CS-SVM + Relief, represented by red crosses), provide better performances than the classifiers trained using all the input features (blue circles), over the majority of the datasets. Additionally, the proposed method (CS-SVM + Relief) outperforms the method developed by Liu et al., 2017 [25] on seven datasets considering the F m e a s u r e , ten datasets considering the G m e a n and eight datasets considering U . In the datasets in which the proposed method does not outperform the method in [25], it still achieves very competitive performance.

4.3. Analysis of the Relief Robustness

To further verify the robustness of the Relief technique with respect to measurement noise and irrelevant features, the following test is carried out. A modified version of the dataset “poker8vs6” is artificially generated. It includes: (i) the original 10 signals, which will be referred to as A , B , C , D , E , F , G , H , I , J , (ii) 50 artificial signals obtained by adding Gaussian noise to a fraction, P r %, of the instances of the original signals, assuming five different combinations of σ and P r for each original signal (see Table 2), and (iii) 60 pure Gaussian noise signals. Notice that the dataset “poker8vs6” has been chosen for this analysis because it is one of the considered datasets characterized by the largest imbalance ratios and the smallest number of positive instances (Table 1).
The dataset is randomly divided into two subtests with similar imbalance ratios: the first subset includes 90% of the instances and is used for feature ranking by the Relief method, whereas the second subset contains 10% of the instances and is used for the quantification of the information content. Figure 5 shows the ranking obtained using the Relief algorithm for the 120 features of the modified dataset and their corresponding weights, and Table 3 reports the obtained 20 top-ranked features and their corresponding weights. The notation “ C _ 0.3 _ 0.2 ”, for example, refers to the artificial signal generated from the original signal C by adding a Gaussian noise of standard deviation equal to 0.3 to 20 % of the instances.
The robustness of the Relief feature selection against noisy measurements and irrelevant features is effectively proven by the obtained results, since the Relief is able to efficiently reject a large number of irrelevant features and to properly rank the relevant features with respect to the amount of noise affecting their measurements. This can be confirmed by the observation that: (1) the artificial signals always follow in the ranking the corresponding original ones (e.g., signal “ C _ 0.2 _ 0.1 ”) is ranked after signal C , (2) when artificial signals generated from the same original signal are considered, the larger the noise ( σ ) and the fraction of disturbed instances ( P r %), the lower the signal ranking (e.g., signal A _ 0.2 _ 0.1 is ranked before A _ 0.3 _ 0.2 ), which is coherent with the fact that the addition of noise degrades the signal importance with respect to the true binary output, and (3) all the artificial signals present in the 20 top-ranked signals are generated from the five top-ranked signals. Additionally, the first appearance of a pure noise signal in the ranking is in position 46 out of 120, and the last 60 signals in the ranging include 45 pure noise signals, which, again, supports the ability of Relief to rank the irrelevant/non-informative signals.

4.4. Validation of the Information Content Quantification Procedure

Finally, the procedure proposed in Section 3.2 for selecting a proper subset of the most relevant, informative features is applied to the same modified data “poker8vs6”. A CS-SVM classifier is trained and tested 120 times, where, each time, the next top-ranked feature is added to the input of the classifier. The classifiers are trained using the same data previously used in the features ranking stage (90% of the total set), and the classification performance metrics are calculated considering the test set composed of data not used in the feature ranking stage (10% of the total set). Figure 6 shows the performances of the classifiers over the first 35 iterations, since the remaining are not providing improved performances. Note that the increase of the size of the optimal signal subset complicates the engineering interpretations, and, as expected, reduces the classification accuracy due to the curse of dimensionality. The most satisfactory performances with the lowest number of signals are achieved using the three top-ranked features ( F measure = 1 , G mean = 1 and U   = 1 ). Notice that the procedure of the quantification of the information content is shown to be able to identify a small set of features providing the best performance, which cannot be improved by adding other features. Additionally, these results show the capability of the proposed methodology as a whole (Relief + CS-SVM + information quantification procedure) of handling noisy measurements and irrelevant features in the data.

5. Case Study: The CERN LHC Electrical Network

The LHC of CERN is a technical infrastructure that provides the services required for the operation of its particle accelerators and experimental areas [43]. Since components malfunctioning, failures or external events can directly influence the performance of the accelerators and total availability for the physics experiments, CERN’s technical infrastructure is considered to be critical [44,45,46]. The analysis of the LHC’s operation during 2016 revealed that a large amount of the total LHC downtime was caused by electrical disturbances, which led to interruption of the experiments and dumping of the accelerated beams of particles [29]. Therefore, it is of significant importance to identify those components that are responsible for the electrical disturbances propagation to the circulating beam and, therefore, are critical with respect to the CTI availability (because they are responsible of the beam dump in case of electrical disturbances).
For this reason, the case study concerns the propagation of electrical disturbances in the CERN’s electrical network [47], which is responsible for distributing electrical power on CERN’s campus that extends over a 27 km circumference across the French–Swiss borders, through a hierarchical structure of power lines or levels starting from the top-hierarchy, 400 kV line, to the bottom, 400 V line. Electrical disturbances are caused by surges or short circuits that can be generated inside or outside CERN’s electrical network and propagate in different ways depending on the operational state and conditions of the CERN CTI components (e.g., healthy, degraded, faulty, under maintenance, etc.). When these disturbances reach critical components, such as power converters, the stability required for controlling the superconducting magnets current is not guaranteed, and consequently, the LHC beams are preventively stopped (an operation called beam dump in technical jargon) to avoid any possible damage to the LHC components.
The LHC electrical network is geographically decomposed into eight zones, which are referred to as LHC Points 1, 2, 3, 4, 5, 6, 7 and 8, and is functionally decomposed into the LHC lines at 400 kV, 66 kV, 18 kV, 3.3 kV and 400 V. Starting from the top-hierarchy, 400 kV line, to the bottom-hierarchy, 400 V line, the number of components/units and parameters to be monitored explodes exponentially from hundreds to tens of thousands. At first, we considered perturbations coming from upper-level hierarchy components to be the most likely to distribute external and internal disturbances due to the hierarchical organization of the network.
As a result, we consider a dataset, D , including a number of N = 260 monitoring signals, whose values were collected during the year 2016 by sensors installed on distribution switchboards and breaker units at the 66 kV and 18 kV lines of the LHC electrical network. The dataset contains K = 3670 instances collected during the occurrence time of an electrical disturbance, which was detected by oscilloscopes installed in specific locations. Since among these instances (electrical disturbances events) only 48 ( K + ) of them have led to the beam dump ( x C T I = 1 ), the dataset is characterized by a very large imbalance ratio of 75.46.
Given the limited number of missing values in the dataset and the high quality of both the instrumentation used to monitor the CTI and its calibration plan, the application of missing data imputation and data reconciliation methods is not required in this case study.

5.1. Feature Selection and Informativeness Quantification

The dataset is randomly split into two subsets of similar imbalance ratios: the set used for feature ranking by the Relief method includes 90% of the instances and the set used for the quantification of the information content contains 10% of the instances. The Matlab [42] function “relieff”, considering all the instances V = K for the weights updating and Q = 6 nearest-neighborhood parameter, has been employed.
Figure 7 shows the obtained ranking and the associated weights of the 260 signals of the considered dataset, where the signals of each line (66 kV and 18 kV) are highlighted by a different color. Notice that most of the top-ranked features are from the 18 kV line. In particular, only one feature from the 66 kV line is present among the 10 top-ranked features and three among the 20 top-ranked features. This indicates that signals from the LHC 66 kV line are less informative with respect to the LHC state than those from the 18 kV line. This is in accordance with the fact that the 66 kV line is higher in the hierarchy of the electrical network, and it is further away from the sensitive components connected to the LHC. In contrast, the 18 kV line is at the bottom of the network hierarchy and directly feeds components critically affecting the LHC operation, such as power converters.
As previously discussed, the Relief algorithm returns only the ranking/weights of the signals, without directly selecting a proper subset of the most relevant or informative signals. This task has been performed by applying the procedure proposed in Section 3.2. In practice, the first classifier is built using the first top-ranked feature, the second classifier is built using the first two top-ranked features, and the procedure is repeated until no clear improvement in the performance is obtained. The classifiers are trained using the same data previously used in the features ranking stage (90% of the total set), whereas, in order to avoid overfitting and to achieve a fair comparison among different feature subsets, the performance indices of the classification have been calculated using a test set formed by data not used during the feature ranking stage (10% of the total).
Figure 8 shows the performances of the developed classifiers over the first 35 iterations. The subset of the top-ranked features formed by 24 signals, which provide the maximum U function value, is selected. It includes 19 signals from the 18 kV line and 5 signals from the 66 kV line. Table 4 shows the details of the identified 24 critical signals.

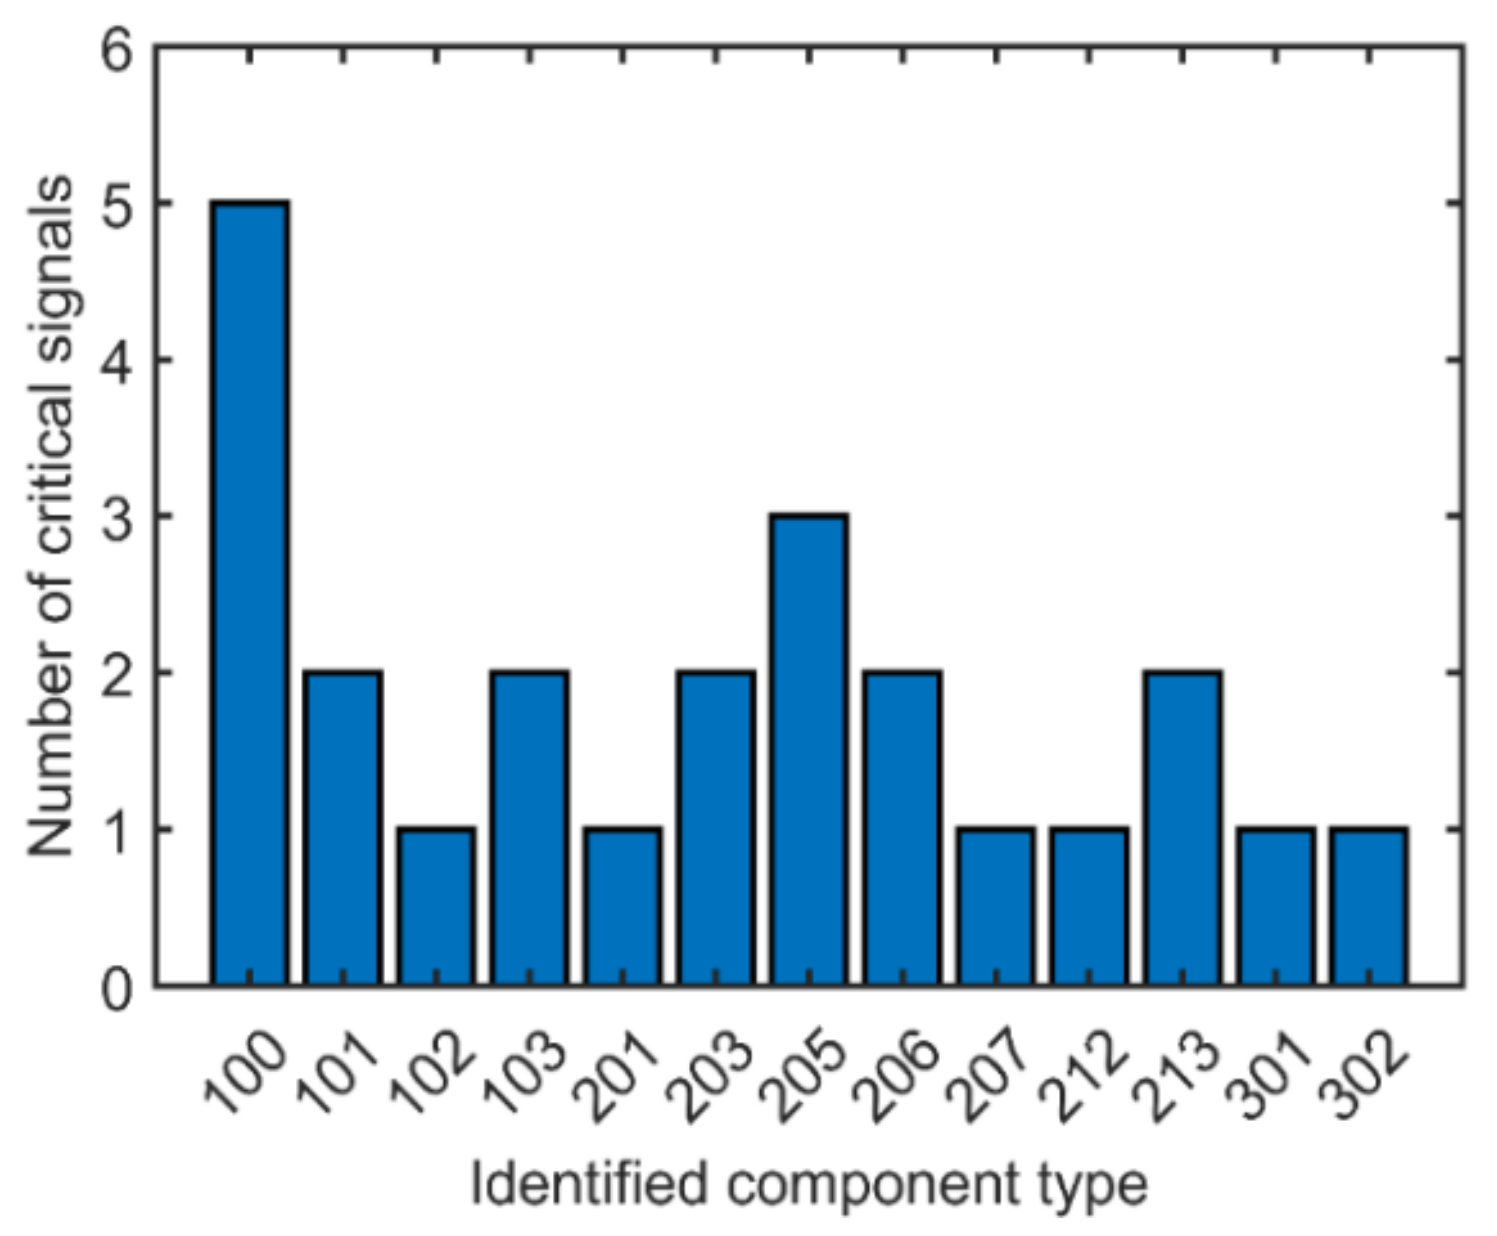
5.2. Engineering Analysis of the Best Features Subset

In this section, the 24 top-ranked features selected by the proposed method have been analyzed, revealing that 12 components from the LHC 18 kV line and one component from the 66 kV line can be identified as critical, among tens of components related to all the 260 signals collected from both the 18 kV and 66 kV lines. The analysis of the geographic distribution of the identified critical components over the CERN CTI area is illustrated in Figure 9a. According to the obtained results, the most critical components are situated in the areas of the CTI corresponding to points 1, 2, 4, 5, and 6, which indicates the criticality of these geographical sections with respect to other sections, such as 3, 7 and 8. A third analysis performed on of the selected signals (see Figure 9b) reflected that all selected critical features were power signals. Finally, an analysis was performed to explore the distribution of the identified signals over the critical components (Figure 10). Notice that component number 100 of the 66 kV line and component number 205 of the 18 kV line have the maximum number of signals among the 24 top-ranked signals subset.
The criticality of the 13 identified components (mostly power converters) has been confirmed by CERN operators, who support these results by the fact that these specific components belong to the 18 kV power distribution level, which is the most sensitive to perturbations, since it directly feeds the power converters that supply current to the superconducting magnet system. Furthermore, the identified geographical areas are characterized by the presence of old-generation power converters.

5.3. Discussion

The results of the analysis, i.e., the identified critical components, can be used to optimize maintenance, monitoring, control, design retrofit and update plans for improving the CTI’s reliability and availability.
For example, maintenance can be optimized by following intensive inspection and preventive policies of the identified critical components, while ensuring a minimum availability level of spares. Additionally, the monitoring system of the CTI can be improved by enhancing the sensors installed on the critical components and prioritizing their monitoring signals to supervise the overall state of the CTI. Operation and control of the CTI can benefit from the identification of critical components through the definition of safe operational scenarios able to minimize failure risks, robust control regimes able to immunize the critical components against disturbances, and efficient failure recovery procedures able to quickly retrieve the states of critical components to their normal conditions. In the case study here considered, the obtained results suggest that priority should be given to upgrading the old power converters of the 18 kV line zones.
The expected bottlenecks of the proposed method for critical components identification in CTIs are, by nature, the same ones faced by most data-driven approaches. They mainly include: (a) the quality of data, (b) their information content, and (c) the need for expert knowledge to interpret/validate the obtained results. With respect to (a), missing values, sensor failure and gross errors are expected to reduce the performance of the ranking provided by relief, and, therefore, affect the identification of the critical components. In such situations, missing data imputation [30] and reconciliation techniques [31] can be used to enhance data quality. With respect to (b), the main criticality is that data collected when the CTI is in a failed state, which, given the high reliability of CTIs, can be insufficient for analysis. In this work, we have tackled this challenge by considering data collected over a long period of time (a whole year of operation) and developing a method properly tailored to deal with imbalanced datasets. With respect to (c), benchmark datasets that mimic the complexity of real-world problems have been employed for the verification of the proposed method (see Section 4). It is the opinion of the authors that a validation of the obtained results, when the ground-truth criticality of the components is not known, as in most real situations, requires the contributions of expert judgment to confirm the outcomes.

6. Conclusions

This work proposes a novel data-driven methodology for the identification of critical components in CTIs, based on the analysis of hundreds of monitoring signals recorded over long periods of time and under different operational conditions of the CTI. The problem has been addressed as a feature selection one with the objective of identifying the subset of signals allowing the best classification of the CTI functioning or failed state.
A filter approach for feature selection based on the Relief technique is used to rank the monitoring signal with respect to the CTI state. The informativeness of different subsets of the top-ranked features are quantified by assessing the performances of a CS-SVM classifier built using the different subsets. The CTI critical components are identified as those associated with the subset of the top-ranked signals that achieves the best classification of the CTI state by means of a CS-SVM.
The performance of the methodology has been verified using literature benchmarks characterized by highly imbalanced datasets. The performance of the CS-SVM built with the subset of the top-ranked features identified by the Relief algorithm shows high competitiveness to those obtained by other methods in the literature.
Finally, the methodology has been applied to the monitoring signals of the CERN’s electrical network, leading to the identification of specific components, LHC areas (points 1, 2, 4, 5 and 6), type of signals (power) and even hierarchical levels (18 kV), for which the criticality has been confirmed by the equipment experts and operators.
Future research lines will include: (i) analyzing the robustness and sensitivity of the method performance with respect to uncertainties, such as the quality of the data that may include missing values, noise and/or gross errors, and (ii) testing different techniques that can perform the same function, i.e., different filter feature ranking methods and different classification models.

Author Contributions

Conceptualization, A.S., P.B., A.C., L.S. and E.Z.; methodology, A.S., P.B., A.C., L.S. and E.Z.; software, A.S., P.B., A.C., L.S. and E.Z.; validation, A.S., P.B., A.C., L.S. and E.Z.; formal analysis, A.S., P.B., A.C., L.S. and E.Z.; investigation, A.S., P.B., A.C., L.S. and E.Z.; resources, A.S., P.B., A.C., L.S. and E.Z.; data curation, A.S., P.B., A.C., L.S. and E.Z.; writing—original draft preparation, A.S., P.B., A.C., L.S. and E.Z.; writing—review and editing, A.S., P.B., A.C., L.S. and E.Z.; visualization, A.S., P.B., A.C., L.S. and E.Z. All authors have read and agreed to the published version of the manuscript.

Funding

This research received no external funding.

Institutional Review Board Statement

Not applicable.

Informed Consent Statement

Not applicable.

Data Availability Statement

Not applicable.

Conflicts of Interest

The authors declare no conflict of interest.

References

  1. Zio, E. Challenges in the vulnerability and risk analysis of critical infrastructures. Reliab. Eng. Syst. Saf. 2016, 152, 137–150. [Google Scholar] [CrossRef]
  2. Antonello, F.; Baraldi, P.; Shokry, A.; Zio, E.; Gentile, U.; Serio, L. A Novel Association Rule Mining Method for the Identification of Rare Functional Dependencies in Complex Technical Infrastructures from Alarm Data. Expert Syst. Appl. 2021, 170, 114560. [Google Scholar] [CrossRef]
  3. Tian, D.; Zhao, C.; Wang, B.; Zhou, M. A Memcif-In method for safety risk assessment in oil and gas industry based on interval numbers and risk attitudes. Eng. Appl. Artif. Intell. 2019, 85, 269–283. [Google Scholar] [CrossRef]
  4. Bisht, S.; Kumar, A.; Goyal, N.; Ram, M.; Klochkov, Y. Analysis of Network Reliability Characteristics and Importance of Components in a Communication Network. Mathematics 2021, 9, 1347. [Google Scholar] [CrossRef]
  5. Zio, E.; Sansavini, G. Vulnerability of Smart Grids With Variable Generation and Consumption: A System of Systems Perspective. IEEE Trans. Syst. Man Cybern. Syst. 2013, 43, 477–487. [Google Scholar] [CrossRef] [Green Version]
  6. Ahmed, H.; La, H.M.; Gucunski, N. Review of Non-Destructive Civil Infrastructure Evaluation for Bridges: State-of-the-Art Robotic Platforms, Sensors and Algorithms. Sensors 2020, 20, 3954. [Google Scholar] [CrossRef]
  7. Johansson, J.; Hassel, H.; Zio, E. Reliability and vulnerability analyses of critical infrastructures: Comparing two approaches in the context of power systems. Reliab. Eng. Syst. Saf. 2013, 120, 27–38. [Google Scholar] [CrossRef]
  8. Shokry, A.; Baraldi, P.; Castellano, A.; Gentile, U.; Serio, L.; Zio, E. A Methodology for the Identification of the Critical Components of the Electrical Distribution Network of CERN’s Large Hadron Collider. In Proceedings of the 30th European Safety and Reliability Conference—ESREL2020, Venice, Italy, 1–5 November 2020. [Google Scholar]
  9. Antonello, F.; Baraldi, P.; Shokry, A.; Zio, E.; Gentile, U.; Serio, L. Association rules extraction for the identification of functional dependencies in complex technical infrastructures. Reliab. Eng. Syst. Saf. 2020, 209, 107305. [Google Scholar] [CrossRef]
  10. Hausken, K. Defence and attack of complex interdependent systems. J. Oper. Res. Soc. 2013, 70, 364–376. [Google Scholar] [CrossRef]
  11. Wu, B.; Tang, A.; Wu, J. Modeling cascading failures in interdependent infrastructures under terrorist attacks. Reliab. Eng. Syst. Saf. 2016, 147, 1–8. [Google Scholar] [CrossRef]
  12. Chopra, S.S.; Khanna, V. Interconnectedness and interdependencies of critical infrastructures in the US economy: Implications for resilience. Phys. A Stat. Mech. Appl. 2015, 436, 865–877. [Google Scholar] [CrossRef]
  13. Zio, E.; Ferrario, E. A framework for the system-of-systems analysis of the risk for a safety-critical plant exposed to external events. Reliab. Eng. Syst. Saf. 2013, 114, 114–125. [Google Scholar] [CrossRef] [Green Version]
  14. Genge, B.; Kiss, I.; Haller, P. A system dynamics approach for assessing the impact of cyber attacks on critical infrastructures. Int. J. Crit. Infrastruct. Prot. 2015, 10, 3–17. [Google Scholar] [CrossRef]
  15. Patterson, S.; Apostolakis, G. Identification of Critical Locations Across Multiple Infrastructures for Terrorist Actions. Reliab. Eng. Syst. Saf. 2007, 92, 1183–1203. [Google Scholar] [CrossRef] [Green Version]
  16. Baraldi, P.; Castellano, A.; Shokry, A.; Gentile, U.; Serio, L.; Zio, E. A Feature Selection-Based Approach for the Identification of Critical Components in Complex Technical Infrastructures: Application to the CERN Large Hadron Collider. Reliab. Eng. Syst. Saf. 2020, 201, 106974. [Google Scholar] [CrossRef]
  17. Lu, X.; Baraldi, P.; Zio, E. A data-driven framework for identifying important components in complex systems. Reliab. Eng. Syst. Saf. 2020, 204, 107197. [Google Scholar] [CrossRef]
  18. Urbanowicz, R.J.; Meeker, M.; LaCava, W.; Olson, R.S.; Moore, J.H. Relief-based feature selection: Introduction and review. J. Biomed. Inform. 2018, 85, 189–203. [Google Scholar] [CrossRef] [PubMed]
  19. Ma, J.; Gao, X. A filter-based feature construction and feature selection approach for classification using Genetic Programming. Knowl.-Based Syst. 2020, 196, 105806. [Google Scholar] [CrossRef]
  20. Jovic, A.; Brkić, K.; Bogunovic, N. A review of feature selection methods with applications. In Proceedings of the 38th International Convention on Information and Communication Technology, Electronics and Microelectronics (MIPRO), Opatija, Croatia, 25–29 May 2015. [Google Scholar]
  21. Mafarja, M.; Mirjalili, S. Whale optimization approaches for wrapper feature selection. Appl. Soft Comput. 2018, 62, 441–453. [Google Scholar] [CrossRef]
  22. Pourpanah, F.; Shi, Y.; Lim, C.P.; Hao, Q.; Tan, C.J. Feature selection based on brain storm optimization for data classification. Appl. Soft Comput. 2019, 80, 761–775. [Google Scholar] [CrossRef]
  23. Liu, X.; Liang, Y.; Wang, S.; Yang, Z.; Ye, H. A Hybrid Genetic Algorithm with Wrapper-Embedded Approaches for Feature Selection. IEEE Access 2018, 6, 22863–22874. [Google Scholar] [CrossRef]
  24. Le, T.T.; Urbanowicz, R.J.; Moore, J.H.; McKinney, B.A. STatistical Inference Relief (STIR) feature selection. Bioinformatics 2019, 35, 1358–1365. [Google Scholar] [CrossRef] [PubMed]
  25. Liu, J.; Li, Y.F.; Zio, E. A SVM framework for fault detection of the braking system in a high speed train. Mech. Syst. Signal Process. 2017, 87, 401–409. [Google Scholar] [CrossRef] [Green Version]
  26. Liu, J.; Zio, E. Integration of feature vector selection and support vector machine for classification of imbalanced data. Appl. Soft Comput. 2019, 75, 702–711. [Google Scholar] [CrossRef]
  27. Alcalá-Fdez, J.; López, S.G.; Hilario, A.F.; Martín, J.; Velázquez, I.; Rus, J.; Morales, V.; Muñoz, J. KEEL: Knowledge Extraction based on Evolutionary Learning. 2005. Available online: http://sci2s.ugr.es/keel/datasets.php (accessed on 30 January 2020).
  28. Brüning, O.; Burkhardt, H.; Myers, S. The Large Hadron Collider. Prog. Part. Nucl. Phys. 2012, 67, 705–734. [Google Scholar] [CrossRef] [Green Version]
  29. Nielsen, J.; Serio, L. Technical Services: Unavailability Root Causes, Strategy and Limitations. In Proceedings of the 7th Evian Workshop on LHC Beam Operation, Evian Les Bains, France, 13–15 December 2016. [Google Scholar]
  30. Osman, M.; Abu-Mahfouz, A.M.; Page, P.R. A Survey on Data Imputation Techniques: Water Distribution System as a Use Case. IEEE Access 2018, 6, 63279–63291. [Google Scholar] [CrossRef]
  31. Loyola-Fuentes, J.; Smith, R. Data reconciliation and gross error detection in crude oil preheat trains undergoing shellside and tubeside fouling deposition. Energy 2019, 183, 368–384. [Google Scholar] [CrossRef]
  32. Xie, R.; Jan, N.M.; Hao, K.; Chen, L.; Huang, B. Supervised Variational Autoencoders for Soft Sensor Modeling With Missing Data. IEEE Trans. Ind. Inform. 2020, 16, 2820–2828. [Google Scholar] [CrossRef]
  33. Albuquerque, J.; Biegler, L. Data reconciliation and gross error detection for dynamic systems. AIChE J. 1996, 42, 2841–2856. [Google Scholar] [CrossRef]
  34. Behroozsarand, A.; Afshari, S. Data reconciliation of an industrial petrochemical plant case study: Olefin plant (Hot section). Comput. Chem. Eng. 2020, 137, 106803. [Google Scholar] [CrossRef]
  35. Xiao, H.; Cao, M.; Peng, R. Artificial neural network based software fault detection and correction prediction models considering testing effort. Appl. Soft Comput. 2020, 94, 106491. [Google Scholar] [CrossRef]
  36. Khumprom, P.; Yodo, N. A Data-Driven Predictive Prognostic Model for Lithium-ion Batteries based on a Deep Learning Algorithm. Energies 2019, 12, 660. [Google Scholar] [CrossRef] [Green Version]
  37. Itania, S.; Lecron, F.; Fortemps, P. A one-class classification decision tree based on kernel density estimation. Appl. Soft Comput. 2020, 91, 106250. [Google Scholar] [CrossRef] [Green Version]
  38. Liu, X.; Li, Q.; Li, T.; Chen, D. Differentially private classification with decision tree ensemble. Appl. Soft Comput. 2018, 62, 807–816. [Google Scholar] [CrossRef]
  39. Lu, J.; Qian, W.; Li, S.; Cui, R. Enhanced K-Nearest Neighbor for Intelligent Fault Diagnosis of Rotating Machinery. Appl. Sci. 2021, 11, 919. [Google Scholar] [CrossRef]
  40. Mathew, J.; Pang, C.K.; Luo, M.; Leong, W.H. Classification of Imbalanced Data by Oversampling in Kernel Space of Support Vector Machines. IEEE Trans. Neural Netw. Learn. Syst. 2018, 29, 4065–4076. [Google Scholar] [CrossRef] [PubMed]
  41. Xu, G.; Zhou, H.; Chen, J. CNC internal data based incremental cost-sensitive support vector machine method for tool breakage monitoring in end milling. Eng. Appl. Artif. Intell. 2018, 74, 90–103. [Google Scholar] [CrossRef]
  42. Mathworks. Matlab. 2019. Available online: https://www.mathworks.com/products/matlab.html (accessed on 1 September 2019).
  43. CERN. LHC Brochure; CERN: Geneva, Switzerland, 2016. [Google Scholar]
  44. Wielgosz, M.; Mertik, M.; Skoczeń, A.; De-Matteis, E. The model of an anomaly detector for HiLumi LHC magnets based on Recurrent Neural Networks and adaptive quantization. Eng. Appl. Artifi-cial Intell. 2018, 74, 166–185. [Google Scholar] [CrossRef]
  45. Gentile, U.; Serio, L. A Machine-learning based methodology for performance analysis in particles accelerator facilities. In Proceedings of the 2017 European Conference on Electrical Engineering and Computer Science (EECS), Bern, Switzerland, 17–19 November 2017. [Google Scholar]
  46. Todd, B.; Ponce, L.; Apollonio, A.; Walsh, D.J. LHC Availability 2017: Standard Proton Physics; Rep. CERN-ACC.NOTE-2017-0063; CERN: Geneva, Switzerland, 2017. [Google Scholar]
  47. Kahle, K. Proceedings of the CAS–CERN Accelerator School: Power Converters, Baden, Switzerland, 7–14 May 2014. arXiv 2016, arXiv:1607.028682015. [Google Scholar]
Figure 1. Schematic representation of CTI monitoring.
Energies 14 06000 g001
Figure 2. Schematic representation of the proposed methodology.
Energies 14 06000 g002
Figure 3. Comparison between the classification performances of the CS-SVM, SVM based on RUS and SVM based on SMOTE.
Energies 14 06000 g003
Figure 4. Comparison between the classification performances of the three methods: CS-SVM, CS-SVM + Relief and Liu et al.’s method [25].
Energies 14 06000 g004
Figure 5. Relief weights and ranking for the features of the modified poker8vs6 dataset.
Energies 14 06000 g005
Figure 6. Performances, on the test set, of the CS-SVM classifiers built with different subsets of the Relief top-ranked features.
Energies 14 06000 g006
Figure 7. Relief weights and ranking for the LHC 66 kV and 18 kV monitoring signals.
Energies 14 06000 g007
Figure 8. Performances, on the test set, of the CS-SVM classifiers built with different subsets of the Relief top-ranked features.
Energies 14 06000 g008
Figure 9. Location of the identified critical components (a) and type of selected signals (b).
Energies 14 06000 g009
Figure 10. Number of critical signals associated with each identified type of component.
Energies 14 06000 g010
Table 1. Characteristics of the considered benchmark datasets.
DatasetNumber of Signals ( N ) Number of Instances ( K ) Number of Minority Class Instances ( K + ) Imbalance Ratio
( K / K + )
glass19214761.82
Haberman3306812.78
newthyroid15215355.14
yeast3814841638.1
ecoli37336358.6
ecoli067vs562202010
yeast1vs774593014.3
ecoli473362015.8
abalone9vs1887314216.4
shuttle6vs2392301022
yeast4814845128.1
yeast5814844432.73
poker89vs51020752582
poker8vs61014771785.88
abalone198417432129.44
Table 2. Values of the five different conditions ( σ   and   P r %) applied to each original signal.
Combination i i i i i i i v v i
σ   *0.10.20.30.40.5
P r %2030405060
* Noise is added to the values of the signals scaled between 0 and 1.
Table 3. Twenty top-ranked features of the modified “poker8vs6” dataset.
RankSignalWeight
1A0.215
2G0.210
3C0.207
4E0.200
5I0.189
6G_0.2_0.10.144
7A_0.2_0.10.134
8E_0.2_0.10.133
9I_0.2_0.10.132
10C_0.2_0.10.129
11C_0.3_0.20.105
12G_0.4_0.30.101
13B0.096
14I_0.3_0.20.092
15A_0.3_0.20.091
16E_0.3_0.20.090
17F0.087
18G_0.3_0.20.086
19H0.085
20J0.084
Table 4. List of the 24 top-ranked signals by Relief.
Signal RankSignal
Tag
Relief
Weight
Network
Line
Signal
Type
Component NumberLHC Geographic
Zone
1EMD205_SLASH_5E_PM10_STAR_0.24918 kVpower205Point 5
2EMD212_SLASH_5E_PM10_STAR_0.23318 kVpower212Point 5
3EHD100_SLASH_4E_Q10_DASH_0.22766 kVpower100Point 4
4EMD302_SLASH_1E_PM10_STAR_0.22418 kVpower302Point 1
5EMD203_SLASH_1E_PM10_STAR_0.22218 kVpower203Point 1
6EMD213_SLASH_5E_PM10_STAR_0.20918 kVpower213Point 5
7EMD101_SLASH_4E_PM10_STAR_0.20518 kVpower101Point 4
8EMD213_SLASH_5E_Q_STAR_0.20318 kVpower213Point5
9EMD205_SLASH_1E_PM10_STAR_0.20218 kVpower205Point 1
10EMD203_SLASH_1E_Q_STAR_0.18918 kVpower203Point 1
11EMD205_SLASH_6E_S_STAR_0.18818 kVcurrent205Point 6
12EMD206_SLASH_4E_EA+0.18418 kVpower206Point 4
13EMD206_SLASH_2E_PM10_STAR_0.18018 kVpower206Point 2
14EMD101_SLASH_2E_PM10_STAR_0.16318 kVpower101Point 2
15EHD100_SLASH_6E_P10+0.16066 kVpower100Point 6
16EHD100_SLASH_6E_MPD0.15866 kVcurrent100Point 6
17EMD103_SLASH_2E_QM0.15718 kVpower103Point 2
18EMD102_SLASH_2E_PM10_STAR_0.15718 kVpower102Point 2
19EMD103_SLASH_2E_PMAX+0.15718 kVpower103Point 2
20EMD207_SLASH_1E_Q_STAR_0.15618 kVpower207Point 1
21EHD100_SLASH_4E_MQD0.15666 kVcurrent100Point 4
22EMD201_SLASH_4E_Q_STAR_0.15418 kVpower201Point 4
23EMD301_SLASH_5E_PM0.15018 kVpower301Point 5
24EHD100_SLASH_6E_P0.14166 kVpower100Point 6
Publisher’s Note: MDPI stays neutral with regard to jurisdictional claims in published maps and institutional affiliations.

