1. Introduction
In the recent years, the impact of human activities on the environment has become a main concern for governments and institutions, committed in a common effort to preserve a healthy and safe environment for the worldwide population. The global climate change is the clearest evidence of the excessive pressure on the ecosphere caused by the emissions of carbon dioxide and greenhouse gases, mostly produced by the combustion of fossil fuels. In such situation, the preservation of a healthy environment for our future generations will substantially rely on successful decarbonization strategies. The latest scientific findings [
1] show that the reduction of greenhouse gas emissions is still not sufficient for counteracting the current global warming effect, and an additional common effort is thus required from all levels of government, businesses, and organizations, for reversing the current trend. Despite the need for global outcomes, however, the current environmental challenges call for the implementation of context-specific actions and for the adoption of consumption and production models more aligned to the goals of sustainable development. Modern cities, in particular, are major contributors to the environmental degradation, being responsible for 64% of the world’s total primary energy demand and 74% of gross global electricity generation, and producing 70% of direct CO
2 emissions [
2]. Implementing efficient and sustainable urban operational models is thus a challenge “smart” cities must undertake in the immediate future. The smart city model must also provide a response to the ongoing urbanization process, causing people to move from the countryside to the metropolises. More than two thirds of the global population are in fact expected to live in urban areas by 2050, and most of the urban growth will take place in developing countries [
3]. In addition, the growth of online retail, confirmed by steady increase of digital commerce transactions at more than a 20% compound annual growth rate (CAGR) through 2022, with more than 17% of Business to Consumer (B2C) online sales worldwide [
4], has promoted the spread of new business models comprising direct delivery to consumers’ homes, even for fresh food and groceries. In such context, the establishment of appropriate supply chain management strategies is a crucial step for the successful implementation of the sustainable development goals, which should ultimately translate into more stable, efficient, and ethical supply chains. In particular, the establishment of solutions for reducing the harmful impact of last mile supply chains in urban areas is seen as a main goal of sustainable development [
5].
Last-mile logistic systems play a critical role for the sustainability of the urban environment, being responsible for a large number of vehicle movements related to passenger and freight transport. In particular, optimizing urban logistics in terms of sustainability and efficiency is a complex issue, considering the heterogeneity of the goods transported and the conflicting objectives of the several stakeholders involved [
6]. Indeed, customers are interested in quick and reliable delivery services, local authorities are committed in improving the livability of the urban environment, and distribution companies are concerned with increasing the efficiency of the delivery operations while ensuring good service levels. A further element of complexity is represented by the limitations of urban transportation networks, particularly in Europe, where denser urban situations and ancient infrastructures are frequently present in city centers. Establishing effective next-generation urban delivery services and undertaking appropriate decisions at the strategic, tactical and operational levels is thus of fundamental importance to achieve the above mentioned objectives. In this regard, the deployment of urban mobility systems based on Electric vehicles (EVs) has recently gained considerable attention due to their better environmental performance, compared with traditional fossil fueled vehicles.
This research, in particular, focuses on the last-mile distribution systems based on small Unmanned Aerial Vehicles (UAVs) or drones which require the establishment of urban infrastructures constituted by proximity distribution centers and charging stations. Delivery systems based on UAVs, are thus typically designed according to a two-tier supply chain structure, where customers’ demand is served by the coordinated activities of transportation systems operating last mile delivery services to final destinations (customers) through urban depots refilled by centralized distribution centers located outside the city. Optimizing the design of such infrastructures is a complex task since their efficiency is strictly related to their operational performance, and a straightforward evaluation of the per-kilometer operating cost or of the tailpipe emissions of the transportation vehicles is not sufficient to ensure efficient and sustainable operations. The objective of this study is to analyze the energy efficiency of aerial logistic systems for last mile urban delivery, and to propose a new original methodology to obtain a realistic estimate of the overall energy consumed by the swarm of delivery drones operating from an urban depot, taking into account the extension of the area served and its specific features. Such problem has received scarce attention in the scientific literature, although it is of paramount importance in the strategic design of aerial delivery systems, and for appropriately sizing of energy storage and recharging infrastructures. Additionally, the design of the supportive infrastructures influences the overall efficiency of the logistic system, thus impacting both the fixed and operational expenses, and, ultimately its overall efficiency. The lack of reliable studies in such regard complicates the comparative evaluation of different solutions, therefore hampering the strategic decision processes of urban policy makers and logistic service operators. Based on such considerations, the specific research question addressed in this paper concerns the evaluation of the expected energy consumption per day of an urban consolidation depot operated within an aerial logistic system, starting from the estimation of the demand of delivery services originating from the customers. In particular, the methodology proposed is based on the calculation of the average energy consumption per delivery trip, and on the estimation of the overall expected distance travelled by the swarm of drones to fulfill the clients’ daily requests. This latter element is obtained estimating the demand of delivery services in a specific area and assessing the share of such demand that can be transferred to aerial vehicles, considering their payload limitation. The lack of detailed analyses about the weight and volume distribution of parcels in a delivery system constitutes relevant source of uncertainty in the strategic design of an aerial distribution system, which might turn relevant in the choice between a fixed (i.e., based on urban depots) or mobile infrastructure (i.e., hybrid drone-van delivery system).
In the following paragraphs, after reviewing the relevant literature in
Section 2, an original methodology is proposed in
Section 3 to evaluate the energetic consumption of the supportive infrastructures for a drone delivery service, based on the service demand in urban area with fixed population density and order frequency. An application of this methodology in a realistic scenario is then proposed in
Section 4 while the results obtained are discussed in
Section 5, comparing the performance of ground and aerial distribution systems. The conclusions show the importance of appropriate infrastructure design for the energetic efficiency of the delivery system, thus offering original insights about the practical viability of aerial urban distribution.
2. Literature Review
The topic of city logistics, referred to the optimization of transport vehicle movements in urban areas taking into consideration the related externalities [
7], has emerged in the last 20 years, within the broader framework of supply chain management. A considerable research effort has been focused in particular upon the analysis of urban transportation systems, and on their relevant impact on social welfare and livability of the urban environment [
8]. Urban last mile parcel distribution is the less efficient stage of distribution networks [
9], accounting for up to 30% of all vehicle kilometers travelled in metropolitan areas [
10]. In such context, the recent technological advances in energy storage systems, electric propulsion, autonomous guide and aerial transportation, represent an unprecedented opportunity to substantially reshape urban logistic systems and to increase their efficiency and sustainability. In particular, the use UAVs for last mile delivery has gained popularity in the last 5 years [
11,
12,
13,
14,
15] as a promising alternative to traditional ground distribution, with enhanced sustainability and cost effectiveness. UAVs are also attractive for logistic operators because they are not affected by the congestion of the urban road network, thus allowing for faster and more reliable services. The counterpart of such benefits is the limited endurance of delivery drones and their small payload. Such limitations generally restrict the operational range of urban aerial logistic systems to short distance deliveries of parcels weighing less than 2 kg, which however constitute a significant share of urban deliveries, accounting to 86% of amazon deliveries [
16]. With such features, the market potential of aerial urban logistic systems has attracted the interest of several commercial logistic operators. Amazon Prime Air [
17] is probably the most popular example, but other less known examples are the HorseFly UAV Delivery system [
18], the DHL Parcel delivery system based on Parcelcopter [
19], and the aerial platform developed by UPS [
20]. The optimization of aerial logistic systems has also become a relevant research topic, involving approaches aimed at optimizing the operations of autonomous drones operating delivery services from depots located in close proximity of the final destinations [
21], as well as hybrid systems involving the employment of heterogenous vehicles. In particular, the drone-truck cooperative approach, is considered a very effective operational scheme, involving several configurations such as single van—single drone [
12,
22,
23,
24,
25], single van—multiple drones [
26,
27,
28,
29,
30], and Multiple van—multiple drones [
31,
32,
33].
The research mentioned above mostly focuses on the optimization of city logistic systems at the operational level (e.g., optimized routing), while much less research effort has been committed to the design of the logistic supportive infrastructures, and to the related strategic decision problems. In such regard, the location problem of drone launching and recharging stations and drone swarm deployment was proposed by Mozzaffari et al. [
34], while Scott & Scott [
35] studied the optimization of the location of a central depot for aerial parcel delivery in healthcare. Additional contributions were given byHong et al. [
36] investigated the design of station locations and delivery routes with limited endurance and by Shavarani et al. [
37] who investigated a hierarchical drone facility location problem with limited flight distance, optimizing the number launching and recharging stations to minimize the total cost. These studies demonstrate that single-tier distribution systems, based on extra-urban consolidation and distribution centers, which constitute the backbone of traditional distribution systems are inadequate for short-range EVs. Indeed, due to their limited endurance, such vehicles can be employed in urban logistic operations only with the introduction of an additional tier of proximity infrastructures allowing direct delivery services to the final customers. Such infrastructures, known in the literature as urban consolidation, distribution or transshipment centers [
38] constitute the fundamental bricks of the two-tier urban distribution systems based on EVs. Such systems involve extra-urban CDCs located at the outskirts of the urban zone, operating a first level of consolidation, and a second set of infrastructures, located inside the city for last mile distribution [
39,
40,
41]. The popularity of two-tiers distribution systems has recently increased with the proliferation of single day delivery for the B2C e-commerce market. The advent of e-commerce has in fact changed the scenario of urban logistics, increasing the segment of fast and cheap parcel delivery services and increasing the number of “small parcels” (3–6 kg), compared to “mailers,” (0–3 kg), and “large deliveries” (more than 6 kg). Modern city distribution systems hence require new operating models and infrastructures to coordinate and optimize the delivery operations in double-tier logistic networks. Referring to aerial delivery services operated by drones, this approach results in the deployment of urban supportive infrastructures acting as depots and charging/launching stations. An example of such systems is represented by Amazon’s PrimeAir patented concept [
42] involving drone delivery fulfillment centers located within cities and other densely populated areas. According to amazon’s concept, such infrastructures would be designed like hives, involving truck bays at the ground level and a multitude of take-off/landing platforms on the sides of their structure. These towers would also be equipped with appropriately sized recharging stations and robotic systems for consolidation/transshipment operations.
Recent investigations [
43,
44] however, have risen a scientific debate about the energetic performance of drone based distribution systems, questioning their energy-efficiency in most realistic scenarios, and arguing that such systems actually require more energy than ground delivery systems, particularly in urban areas where customer density is high and truck tours are comparatively short. In rural settings, with longer distances among the customers, the energy demand of drone delivery systems is comparable to electric trucks, provided environmental conditions are favorable. Contrarily to the general perception that aerial delivery systems are more effective in highly congested environments, hence, their performance in such condition actually reduces, because they are forced to operate on a one-to-one delivery scheme due to their limited endurance and payload. Such scheme is less efficient in terms of distance travelled, compared to the one-to-many scheme of ground vehicles, capable of visiting several clients on a single route, with a smaller overall distance travelled. The substantial reduction in the energy consumption per unit distance of aerial vehicles, consequent to their lower mass, however, balances such disadvantage, thus generating a complex trade-off.
It must be remarked, finally, that the energetic performance of a logistic system does not necessarily reflect into its economic effectiveness, since many costs are related to economic and organizational elements. For example, the energy price is influenced by the government impositions which are typically higher for fossil fuels, while the insurance cost of drones is nowadays uncertain. Furthermore, the operational cost of remote piloted or autonomous vehicles can benefit of a much lower labor cost compared to vehicles requiring a driver. For example, amazon’s operational scheme involves a single operator to control at least 12 drones [
45]. Finally, taking into account the externalities (social welfare and environmental impact) it must be remarked that ground vehicles powered by combustion engines are highly impacting due to the emissions of pollutants and to their substantial contribution in increasing traffic congestion, while UAVs are affected by critical safety issues.
3. Methodology
In this section, a methodology is proposed for evaluating the energetic consumption of a swarm of drones servicing a circular area from a depot located in the center. The expected overall energy required on a daily basis to operate the fleet of drones can be calculated as the product of the expected energy consumed by a single drone in a delivery cycle (
Ec) and the expected number of deliveries per day (
Nd) in the area considered, according to Equation (1).
The expected number of deliveries per day is assumed to be a function of the customers’ requests for e-commerce B2C demand, and results from a simplified demand modeling approach, discussed below. The expected energy consumed per delivery cycle is a function of the average length of the delivery cycle, and depends upon the features of the drones. The additional assumptions are:
- -
Each delivery point represents the demand for one package;
- -
Drones can only carry lightweight packages due to their limited payload;
- -
Each drone can carry a single package;
- -
Drones must depart from and return to the depot;
- -
The drones have a limited endurance;
- -
The drones move according to Euclidean distance;
- -
The speed of the drones is constant;
3.1. Demand Modeling and Estimation
This section discusses the estimation of the demand of urban delivery services related to the e-commerce B2C market that can be accomplished by UAVs, considering their payload restrictions (equal to 2 kg in this study). In such regard, a straightforward approach could be to derive demand forecasts from historical data through time series analysis, which however is impossible in the context here analyzed because aerial parcel delivery is a service not yet operational, and no historical data exists about the related demand.
The assessment of the e-shopping attitude of customers in a specific area, and its impact on urban freight transport is a topic recently investigated by many authors, and empirical studies demonstrate it is significantly influenced by the socio-economic conditions (e.g., sex, income, age, etc.) in the area considered [
46]. A detailed analysis in such regard was proposed by Comi and Nuzzolo [
47] while a detailed modelling framework based on experimental data collected in the city of Rome was proposed by Comi [
48]. The relation between the spatial localization of population and the volume of B2C deliveries, (i.e., the demand density) in a specific area has also been a topic frequently investigated [
49,
50,
51]. In particular, Cao et al. [
52] developed a structural equation model to describe the connections between spatial attributes and e-shopping in the Minneapolis-St. Paul metropolitan area. Indicative data in such regard can be retrieved in the case study presented by Chubassi et al. [
53] for the city of Austin in Texas (US) which is referred to cargo bike deliveries in three urban areas (central business district, University of Texas at Austin, and Far West neighborhood) and reports 3.632 people/mi
2 and 85 deliveries/mi for the first area, 14.246 people/mi
2 and around 82 deliveries/mi for the second and 2.977 people/mi
2, and 35 deliveries/mi for the third.
The above-mentioned studies may offer some useful indications about the B2C e-commerce demand generation process and the related impact on the deliveries in urban areas, however, the lack of information about the weight of the parcels delivered prevents the straightforward extraction of significant data for aerial logistics. For example, the data on urban deliveries reported by Edwards et al. [
54], are referred to non-food product with an average weight of less than 25 kg and a volume less than 450 cubic inches.
An alternative approach to retrieve significant information about the B2C ecommerce demand can be the analysis of the actual vehicle movements in a specific area, as a descriptor of the demand of freight services. Such approach has recently gained popularity in the context the design and management of city logistic systems, with the spread of urban surveillance systems and image processing techniques. Arnold et al. [
55] for example adopted such approach within a simulation study employing cargo bikes and delivery points, while Caldarelli et al. [
56] proposed a methodology for the design of urban consolidation centers based on traffic data analysis.
Since the formulation of a demand modelling approach is out of our scope, the potential request of aerial deliveries in a specific area has been simply calculated, according to Equation (2), as the product of the population density (
d), the demand frequency (
f) and the area of the region of interest (
A). Such parameters are assumed as constants considering the limited dimensions of the area serviced by the aerial vehicles.
The fraction of deliveries that can be performed by drones, can thus be expressed through a coefficient
as:
Equation (3) finally provides an estimation of the demand of areal delivery services in a specific area, which is a fundamental element for the design of the supportive infrastructures, discussed in the section below.
3.2. Energy Consumption
The energy required for operating the fleet of transport vehicles involved in last mile delivery services constitutes a substantial part of the overall energy consumed in the supply chain. The strategic choice of an energy-efficient logistic system and related infrastructure may hence represent a substantial cost saving in such regard, considering their entire lifecycle. The methodology discussed below aims at evaluating the energy consumption of the delivery drones referring to a standard delivery cycle consisting in picking up the parcel from the depot, travelling to the client’s location, dropping the load and returning back unloaded to the starting point. Without loss of generality, we can refer to a drop-off service, since a pickup cycle involves the same operations in reversed order. The energy consumed by a multicopter (
Ec) in a delivery cycle can thus be calculated according to the following Equation (4), considering the radial (horizontal) and movements and the energy required for hovering, in flight sequence.
where
and
represent the energy consumed in the radial movement and corresponding hover related to the first half-cycle performed by the drone carrying the payload from the depot to the client, while
and
represent the energy consumed in the second half-cycle (client to depot) in unloaded conditions.
The energetic performance of an aerial vehicle is strictly related to its design features [
57], and, in particular, substantial differences exist between fixed wing and rotary wing vehicles due to their fundamentally different flight dynamics. Although fixed wing vehicles are generally more efficient, rotary wing vehicles (“multicopters”) are mostly employed in parcel delivery, due their capability of taking off and landing vertically, and hovering on a fixed position. Neglecting external factors affecting the vehicle performance (e.g., climatic conditions) and the energy needed to feed the onboard electronics, the power consumption during the flight is mostly related to lift the UAV and to overcome the parasitic drag forces that counter-act its movement in the air. Several empirical and analytical drone energy consumption models can be found in the literature providing a reliable approximation of the energy consumption as a function of the payload weight and vehicle speed [
58,
59,
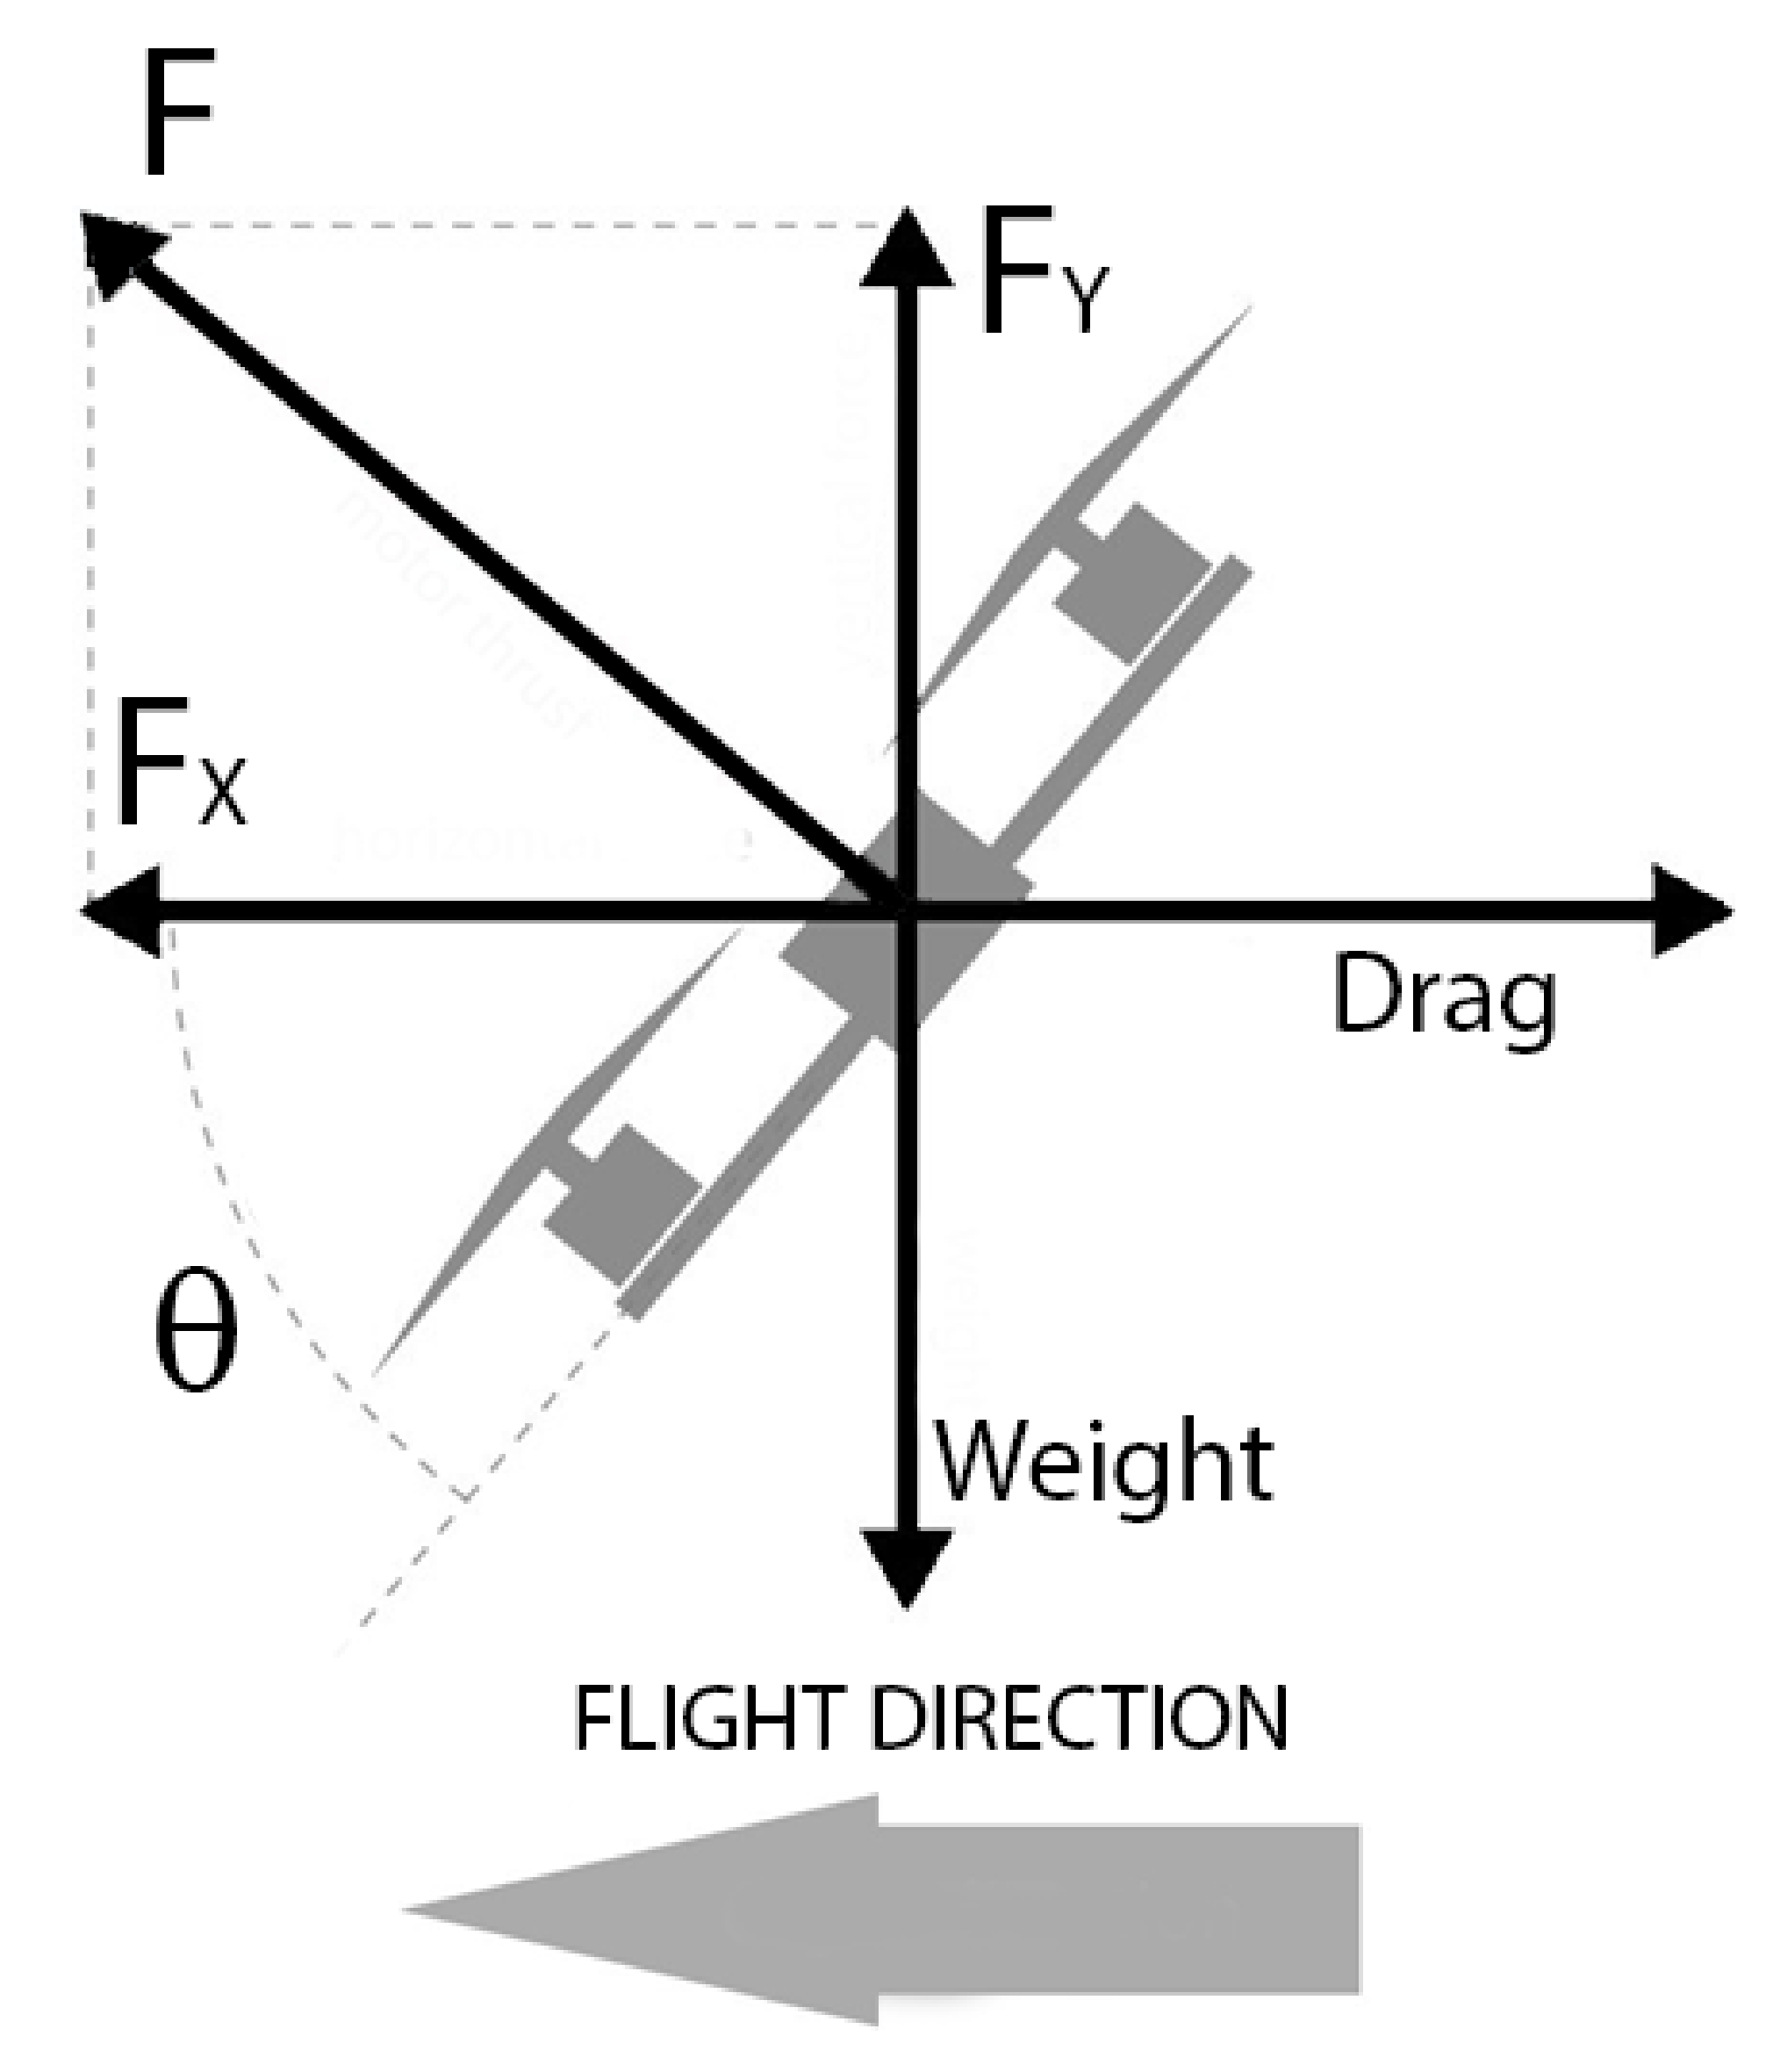
60]). When referring to small delivery drones, a simplified approach consists in calculating the energy consumed during the flight considering a steady-state flight condition where the lift force and the drag force (acting opposite to the direction of motion) are balanced in a general Newton’s equilibrium [
16,
61]. as represented in the following Equations (5) and (6) and
Figure 1.
where
D = drag force,
F = thrust force,
L = lift Force,
m = mass and
g = gravity acceleration.
The composition of the two components of the thrust force originates a resulting force normal to the tilt angle (
θ) of the drone, as depicted in
Figure 1:
Referring to Equation (5), the of the lifting force generated by the rotor(s) pushing the air down can be calculated as [
62]:
where
Ar is the overall rotor area (i.e., the area of a single rotor multiplied by the number of rotors),
ρ is and the density (1.22 kg/m
3 at the level of the sea at 15 °C) and
sair is the air speed through the propellers. For simplicity, Equation (7) is referred to vertical hovering (
θ = 0) condition, and can be considered valid for small values of
θ (i.e., small speeds). The air speed of a hovering drone can thus be calculated as:
The corresponding power consumed is related to the change in kinetic energy of the air divided by the time interval, and can be calculated according to the following equation [
11]:
It is then possible to calculate the energy consumed for hovering the drone during the delivery cycle time
tc considering the distance flown (
l) and the flying speed
s:
where
FM is the “figure of merit” of the aircraft.
Referring to second equilibrium condition, (Equation (6)), the horizontal force counteracts the drag force
where
cd is a drag coefficient related to the shape of the drone (≅0.6),
Ad is the cross-sectional area of the drone in the direction of motion, and
s is the drone speed relative to the surrounding air (a no wind condition is assumed). The power consumed by the drone when flying at a speed
s thus results:
Such equation shows that speed significantly increases the energy consumption for counteracting the drag force. In particular, steady state flight at slow speed is the most efficient condition, while rapid changes in the directions or adverse environmental conditions (e.g., wind) may result in a substantial performance loss.
Finally, the overall power required by the drone to reach a generic destination can be calculated as the sum of the power components required to hover and move horizontally simultaneously. An overall efficiency factor
is finally introduced to take into account all the energy losses related to the battery system and to the propellers. The model is approximated since it does not take into account the issues related to the changes in the airflow direction through the propellers when the tilt angle changes, nor it considers the different cross section of the drone and the vertical movements required for landing and taking off.
The energy required by the drone to complete a delivery cycle can thus be calculated as:
The expected distance of a delivery point can be determined as the average radial distance from the center of all the points within a circular coverage area (
A). Assuming customers are uniformly distributed, the expected distance can be calculated as:
where
R is the radius of the coverage area and
f(r) = 2
πr.
The corresponding expected energy consumption per delivery cycle can be calculated as:
The distance flown on a delivery cycle (
A/
R) and its average duration can also be calculated as:
where
tf is the time related to additional operations such as package load and battery swap.
The total energy consumed on a daily basis by the aerial logistic system can be obtained from Equation (1), as a function of the coverage area, the demand frequency, the demand density and the weights of the drone and the payload, by means of the following Equation (19):
Based on the results above it also possible to estimate the total distance (
) flown and the overall time (
) required to complete the deliveries:
Finally, a rough estimation of the fleet of drones required to perform the delivery tasks in a fixed delivery window can be obtained as:
where
is the delivery window.
The methodology described above allows the calculation of the elements required for dimensioning and evaluating the energy consumption of the swarm of drones operating the delivery services from a central depot. Based on the methodology proposed, a realistic numerical application is presented in the following section.
4. Numerical Application
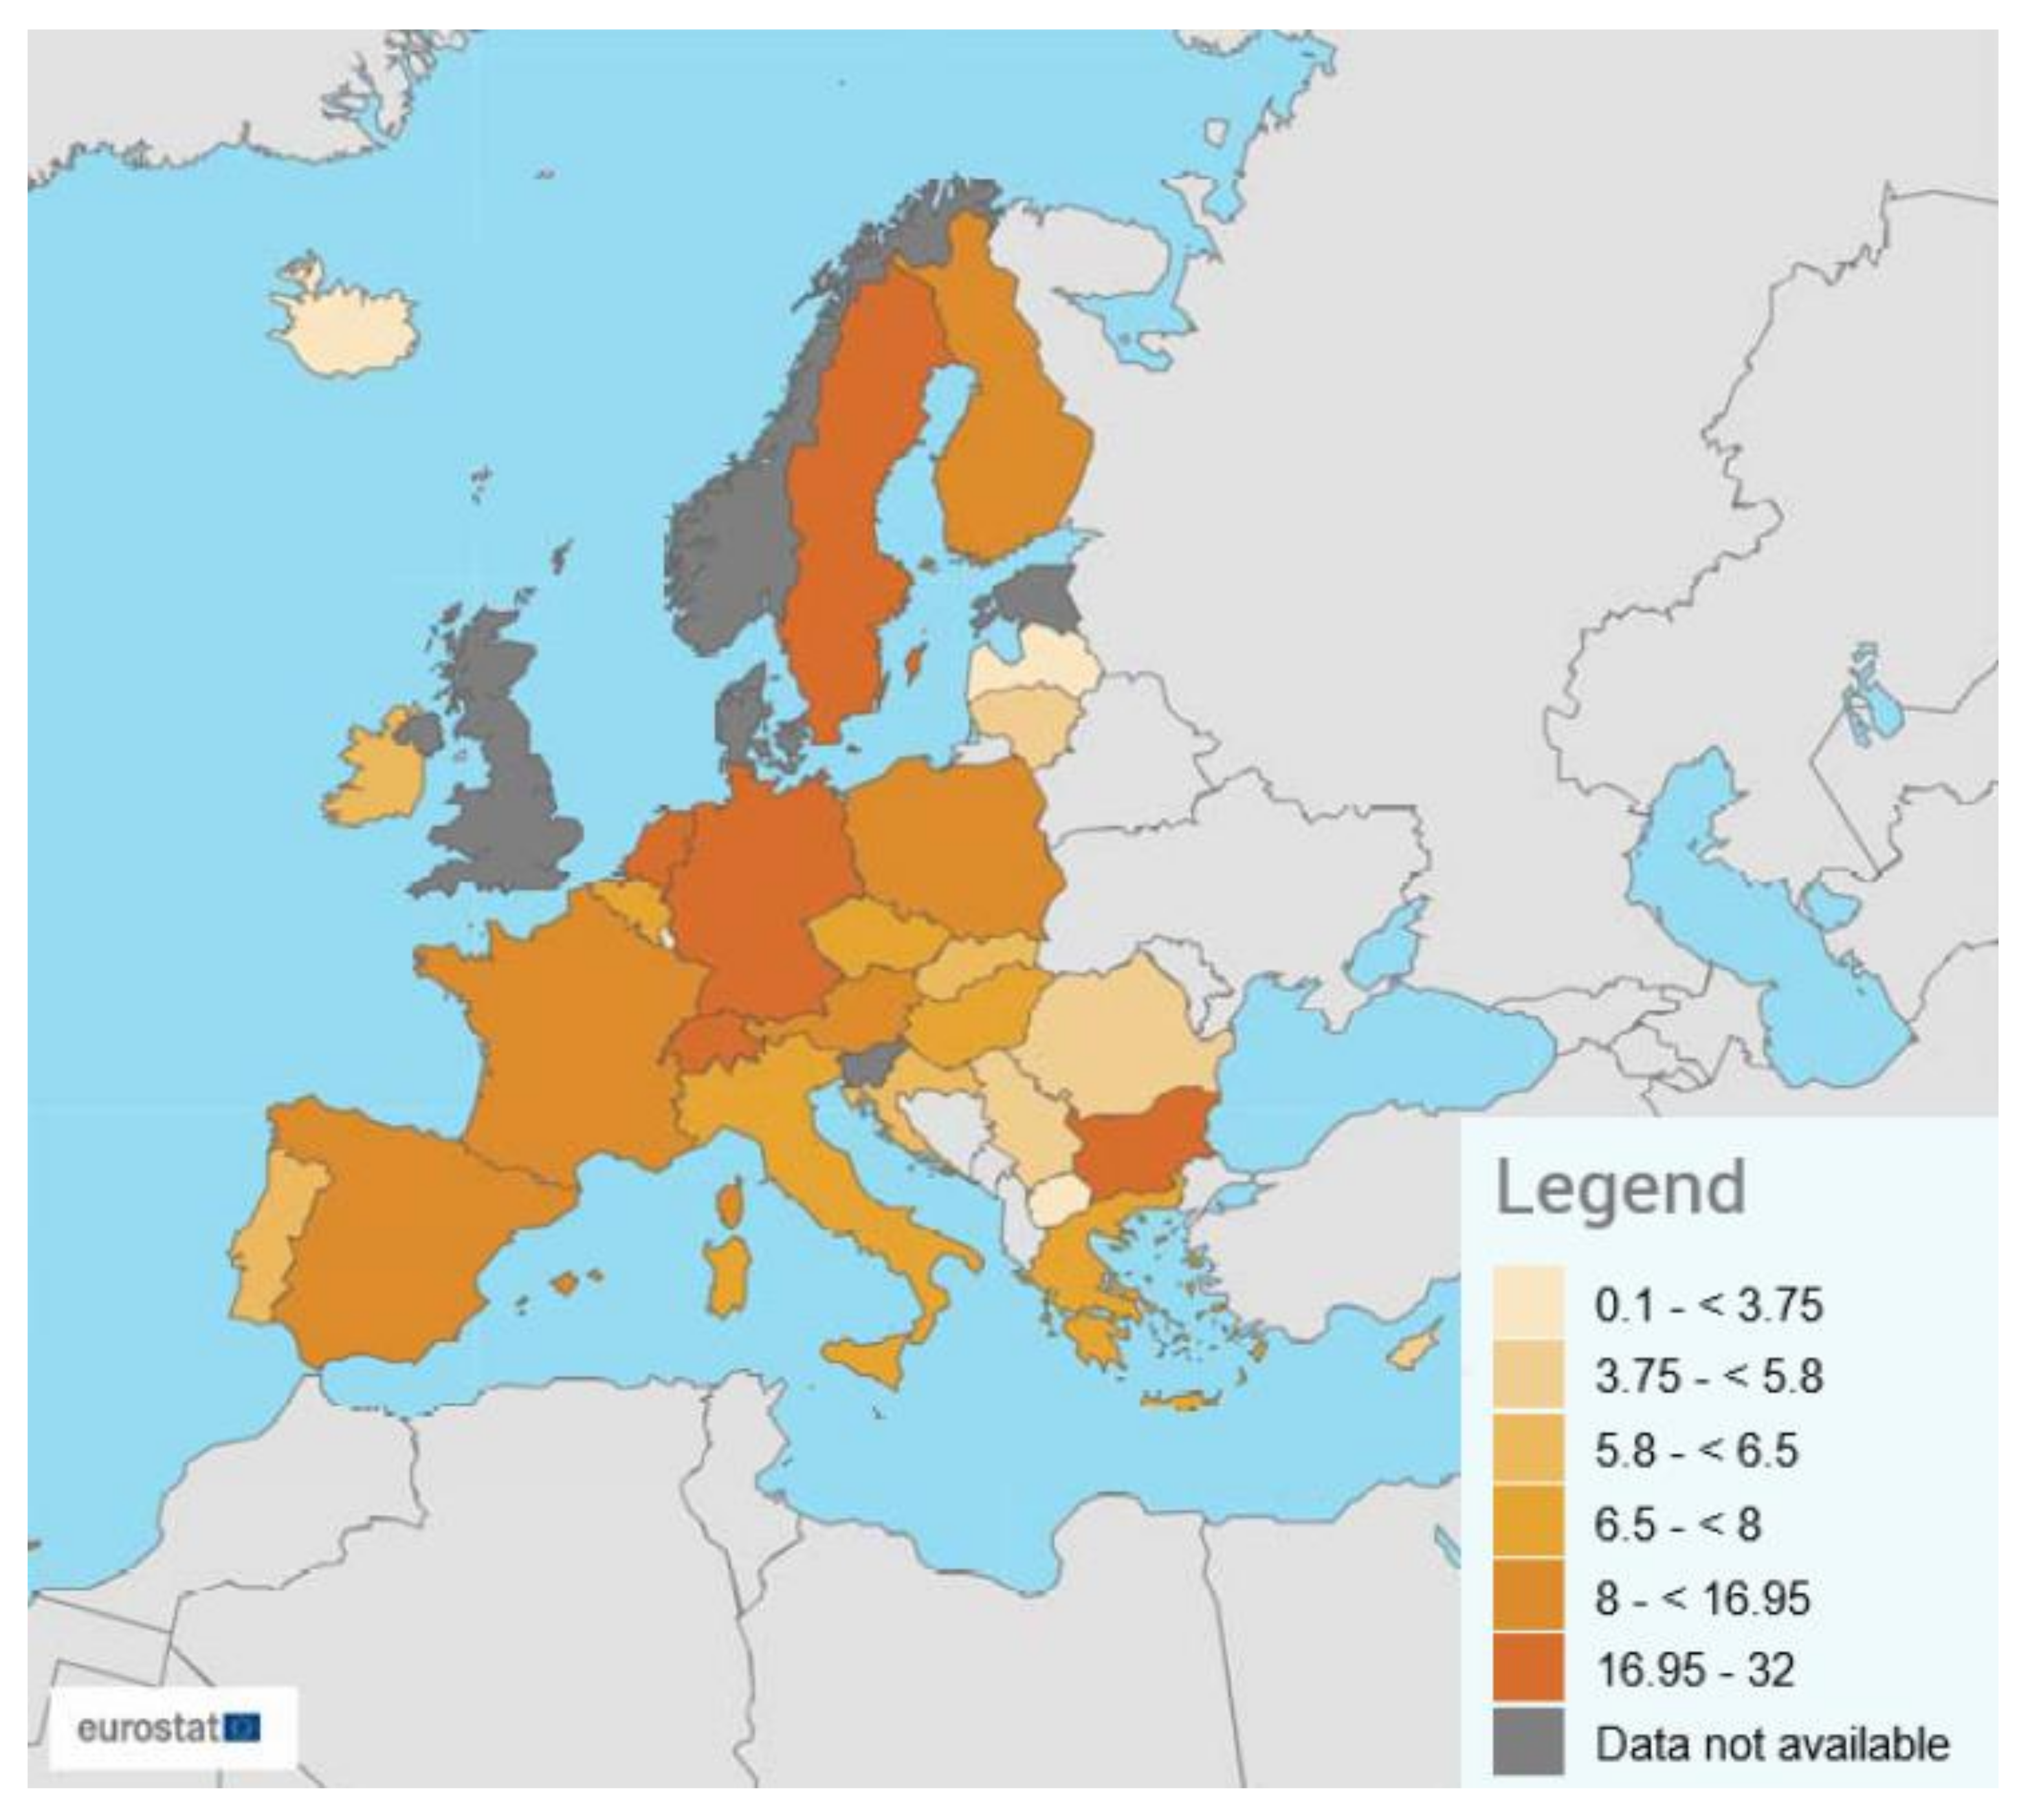
This section discusses a realistic application of the methodology described for estimating the energy consumption of an aerial parcel delivery system fulfilling the demand originating from the B2C e-commerce orders in the surrounding coverage area. A preliminary analysis of urban distribution services has been performed, based on the Eurostat (2020) estimates about the total volumes of domestic parcel services in all EU member states. The dataset is freely available over the internet and provides the number of parcels handled by all operators including courier, express and parcel services referred to year 2018. According to such data (see
Figure 2), Germany is the most active country in Europe, with an average value of 32 parcels delivered yearly per person, followed by Bulgaria with 24.8 and the Netherlands with 20.4.
The overall average deliveries calculated on a national basis, however, do not allow for detailed analysis of the geographical variations of the demand density (e.g., rural and urban areas) and of the time-related variations of the demand frequency (e.g., increased number of deliveries during Christmas time). The lack of reliable information at a more detailed geographical and temporal scale is presumably attributable to the fragmentation of the EU market into national niches operated by a multitude of public and private delivery operators. For the purposes of our study, relevant information about the demand of parcel deliveries related to e-commerce B2C can be retrieved in a recent report from McKinsey [
63] which analyses B2C ecommerce trends in 17 countries, focusing on the number of parcels being dispatched. The analysis is based on data referred to year 2017, and reports a number of parcels per person of 24 and 22 in Germany and in the United Kingdom respectively, followed by Ireland, Sweden and Italy with 15, 6 and 2 parcels per person per year respectively. Although the statistical analysis performed is not clearly documented, based on such data the average national daily demand density can be roughly calculated dividing the annual data by 365, thus obtaining the values reported in
Table 1. According to such results, for example, the city of Milano with approx. 1.4 million inhabitants over an area of approx. 180 km
2, generates approx. 770,000 deliveries per day.
The average demand frequencies reported in
Table 1, can be taken as reference for estimating the potential demand related to parcels weighting less than 2 kg, operable by delivery drones. Based on such data, the number of aerial delivery services required can be calculated as a function of the specific features of the area covered. For example, referring to an average value of 0.0329 deliveries per person per day (which is the value reported in
Table 1 for The Netherlands), and considering a percentage of parcels weighting less than 2 kg equal to 80%, which is close to the data reported by D’Andrea [
16], in an urban area with a population density of 2500 inhabitants per km
2, the resulting demand density for drone delivery services is:
Similarly, the demand for parcel delivery services in a rural area with a population density of 250 inhabitants per km
2, the corresponding demand density is:
The overall energy required for operating an aerial delivery service, can now be calculated as a function of the radius of the area covered, considering the specific power consumption of the delivery drone employed. As discussed before, the energy consumption related to drone operations is strictly linked to the technical features of the vehicle and to distance flown in the delivery mission. In such regard, a brief analysis of the solutions currently available on the market has been performed, obtaining the information summarized in
Table 2. The Amazon Prime Air multicopter features a gross weight of 25 kg, a flying range of approx. 32 km, a speed of 80 km/h and a payload of approx. 2 kg [
17]. Another popular UAV for logistic operations is the DHL Parcelcopter 4.0 [
19], capable of flying for approximately 60 km at a speed of 130 km/h, with a payload of 1.2 kg. The Matternet M2 features a maximum distance of 20 km, a cruising speed of 70 km/h and a payload of 2 kg [
20]. Referring to the scientific literature, Drones are generally assumed to move faster than ground vehicles, with speeds ranging between 15 and 35 mph [
12], reaching even 120 km/h in some cases [
64]. Clearly, the high variability in drones’ speed can be reconducted to different vehicle configurations, however it also reflects an inherent uncertainty due to the lack of experimental data in real operating conditions.
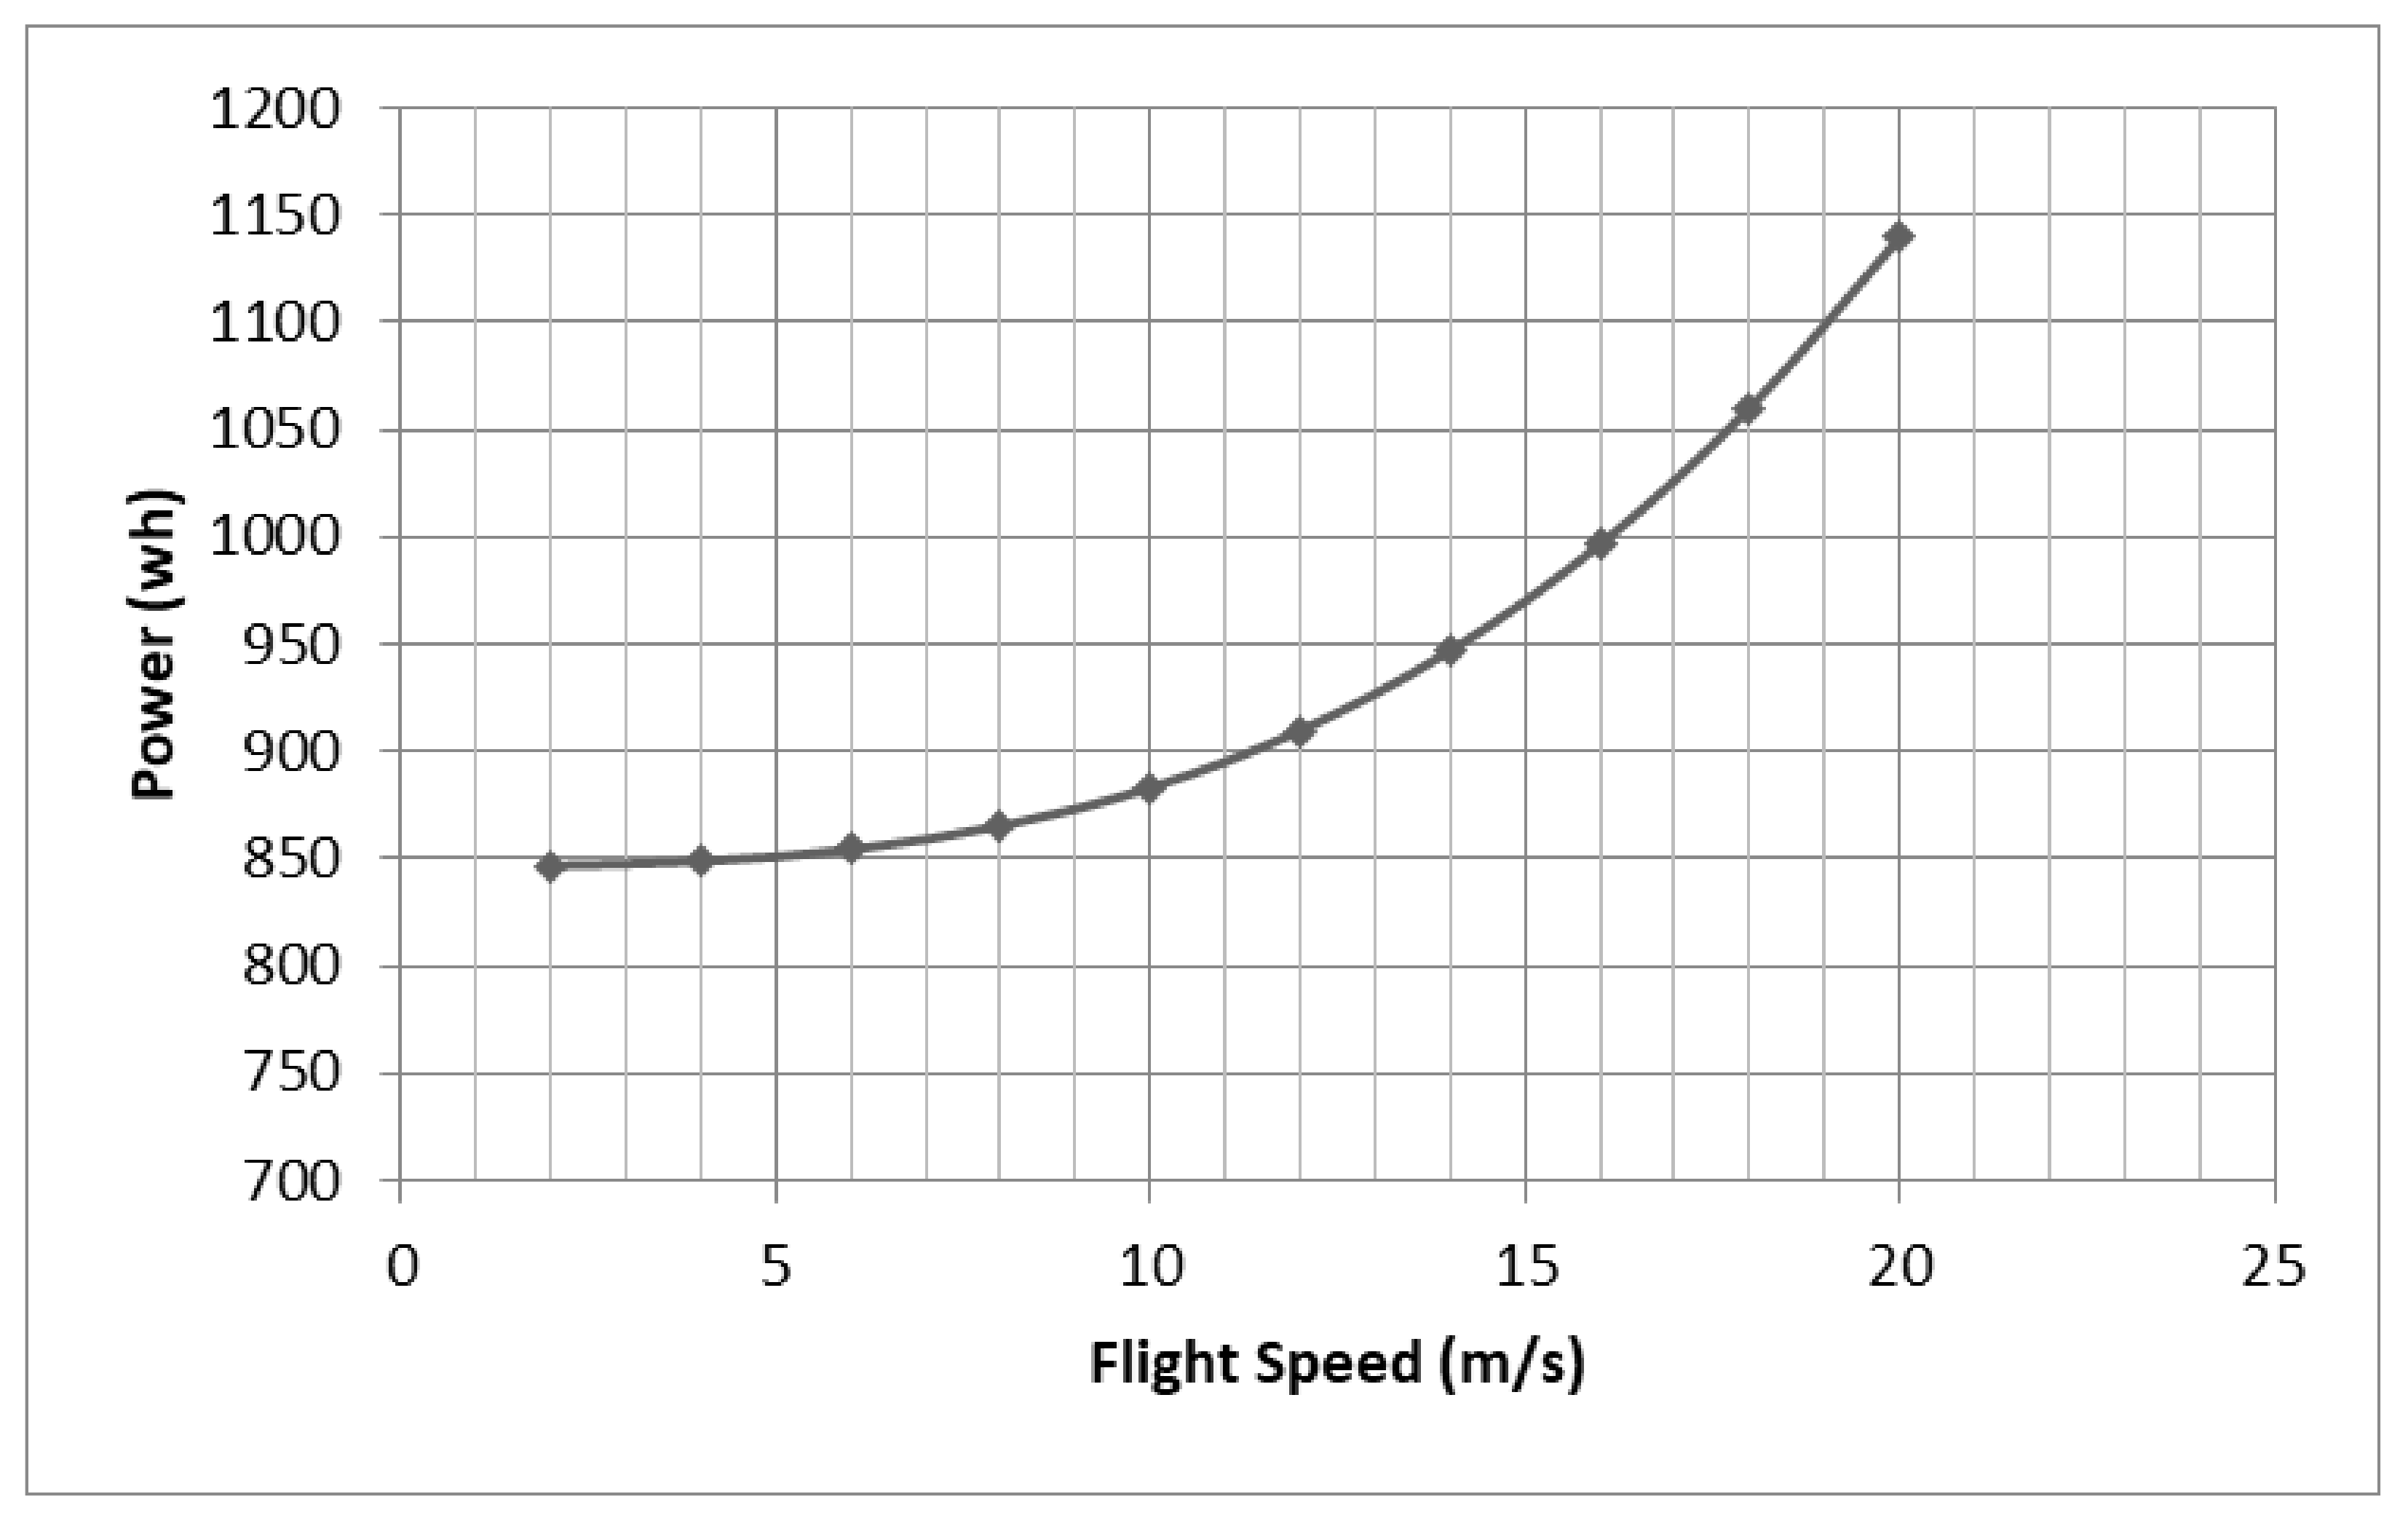
For the purpose of this study, we will refer to a UAV with similar features to the Matternet M2, i.e., a quadrotor featuring a gross weight of 11.5 kg and a payload of 2 kg. It has been assumed a cruise flying speed of 8 m/s (≅29 km/h) and a cross sectional area (
of 0.1 m
2, which makes sense for a drone with a frame of 0.3 × 0.35 m. The resulting empty weight factor is 0.67 and the overall efficiency of the system has been assumed equal to 0.8. The diameter of the rotors is 0.48 m, and the energy consumption for hovering is approx. 846 W, while the additional energy required for horizontal translation increases with the speed as given in
Figure 3. Finally, a fixed time of 1 min per cycle has been considered for all the additional operations (landing, battery swap, parcel load and take off).
6. Discussion
The results obtained, confirm the concerns risen by some authors [
42], about the effectiveness of drone delivery systems in urban areas, with the risk that they might perform even worse than traditional ground vehicles. A simple demonstration of such situation can be provided considering that the average length of the route travelled by ground vehicles visiting the clients’ location can be approximated by the following equation [
65]:
The additional information for performing the comparisons between aerial and a ground delivery system, based on commercial data of diesel and electric powered vehicles, are provided in
Table 4. The data reported for the ground vehicles are referred to commercial values and can be easily found in several sources, while concerning the drone, the technical features reported are similar to the Matternet M2 [
20] as stated before. This drone is also similar to the Eagle delivery drone developed Flirtey [
66] in collaboration with several important institutions for delivering medical supplies, which is the first system obtaining the approval from the US Federal Aviation Administration.
The results of the comparison are given in
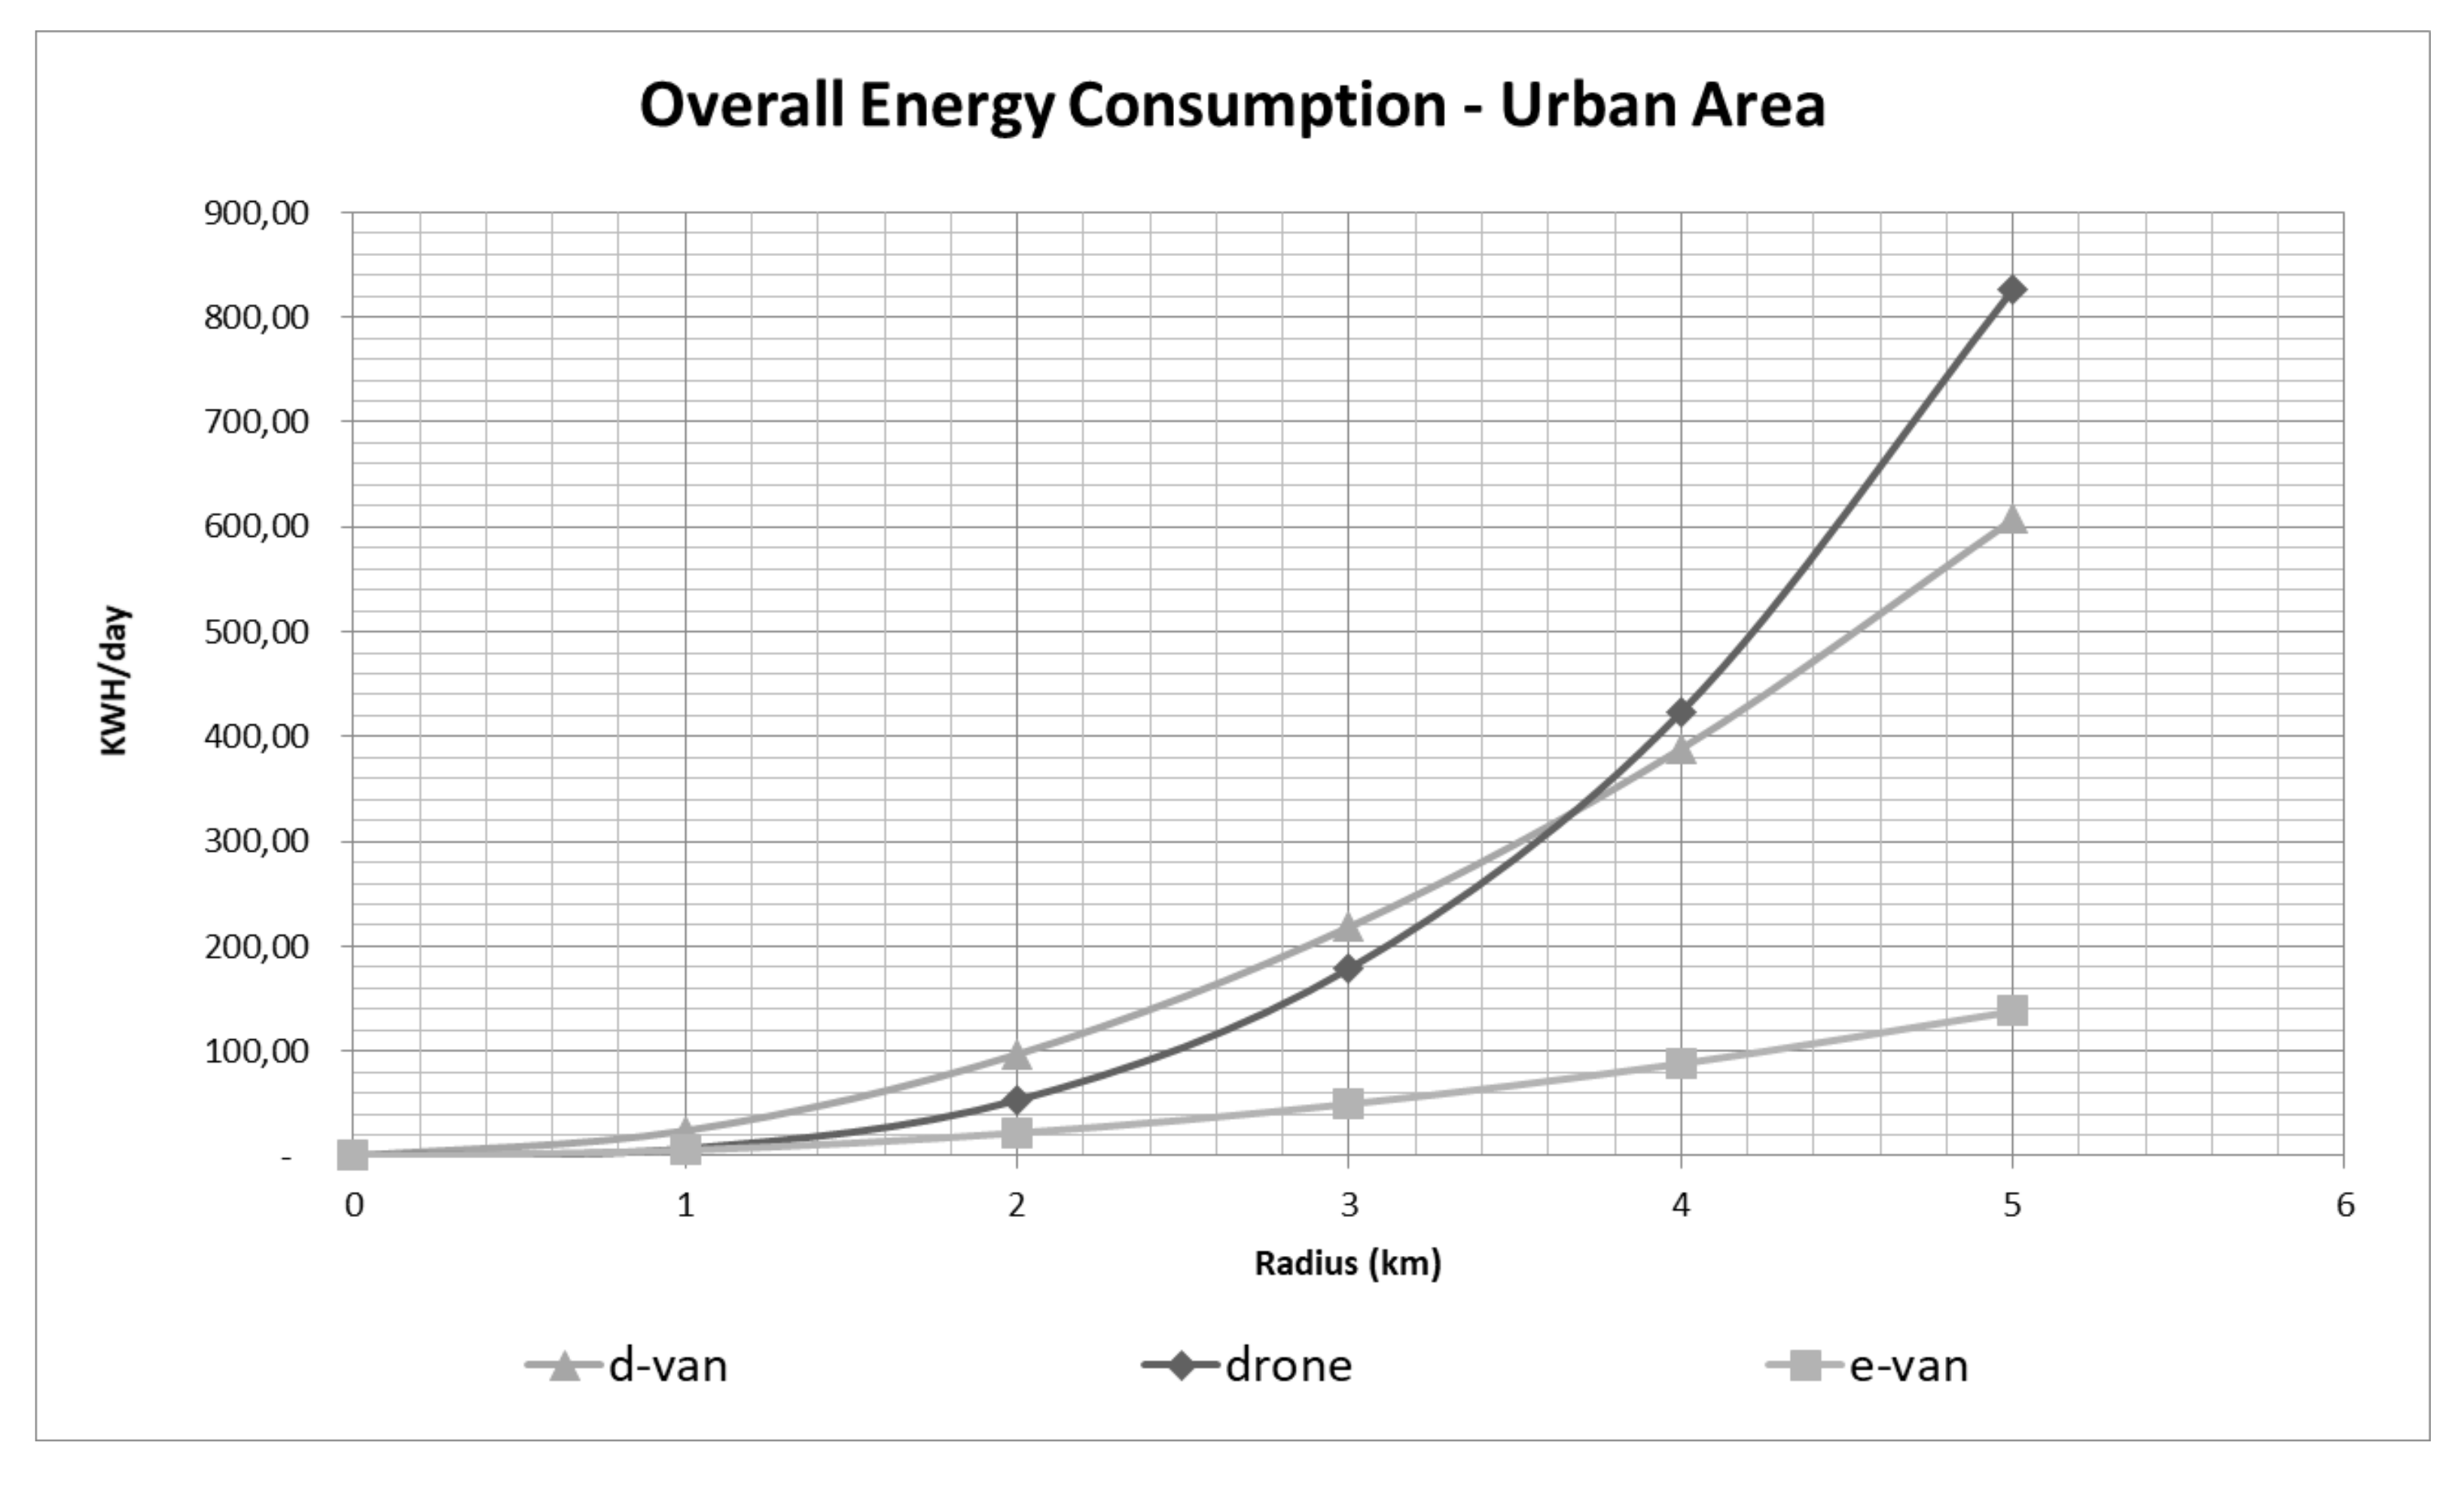
Figure 4 which reports the curves representing the energy consumed daily by the vehicles considered for performing the operations required to complete the deliveries. Referring to the drone, the curve reported is calculated according to Equation (19), while for the traditional ground vehicle the unit energy consumption considered is approx. 900 Wh/km, obtained considering a fuel consumption of approx. 9.5 lt/km and a specific energy of 34,200 kJ/L. The energy consumption of the electric vehicle is approx. 200 Wh/km, referred to a light delivery vehicle.
The overall energy consumption curves show a break-even point for the diesel van and the aerial system at a radius of the delivery area of approx. 3.5 km, while the energy consumption of the electric ground vehicle is fairly lower than the others. Although aerial vehicles are the most efficient distribution vehicles in terms of energy consumption per unit distance (approx. 30 Wh/km in the case here considered) due to their exiguous mass, they can actually perform worse than ground vehicles when referring to the entire logistic system. Concerning the debate about the convenience of a transportation solution rather than another, hence, the results obtained demonstrate that there is not a univocal best solution, because the dimension of the area covered play a fundamental role upon the energy efficiency of the entire logistic system. The results obtained rather highlight the crucial importance of appropriate sizing of infrastructures in the optimization of the logistic system. In the case considered, the aerial delivery infrastructures should cover areas not exceeding a radius of approx. 3.5 km to be competitive with a traditional distribution ground system. In such situation the expected demand of delivery services is 2023.36 parcels per day, and the corresponding overall distance travelled is 9442.37 km per day for the drone, and 270.42 km per day for the van. Assuming a travelling speed of 20 km/h for the ground vehicles and 29 km/h for the drone, the corresponding overall time required to complete the deliveries is 327.86 h for the drone and 18.98 h for the van. Considering a time window of 8 h the system would thus require a fleet of approx. 40 drones or 2 vans to complete the delivery. Finally, the logistic infrastructure should be able to provide approx. 283 kWh per day to the delivery drones, with battery switching at each delivery to preserve the necessary endurance. A fleet of 4 electric vans would instead be necessary to perform the ground delivery services.
Clearly, different configurations of the logistic system would impact the overall costs of the deliveries, therefore the picture could be substantially different in terms of economic profit. The price of different energetic sources (electricity and fossil fuels), in fact, is related to market conditions, and affected by government impositions, which might distort the reflection of energetic efficiency in the operational cost. Furthermore, a substantial element of the cost analysis is related to the fixed costs originating from the capital investment (amortized purchasing cost of the vehicles), the insurance cost and the wages of the drivers for the ground vehicles. In addition, referring to the cost of infrastructures, the energy storage infrastructure could generate an initial cost of almost 191 k€ in Lithium batteries or 63 k€ in Lead Acid accumulators. Such costs are also highly uncertain, considering the dynamics of the lithium battery market.
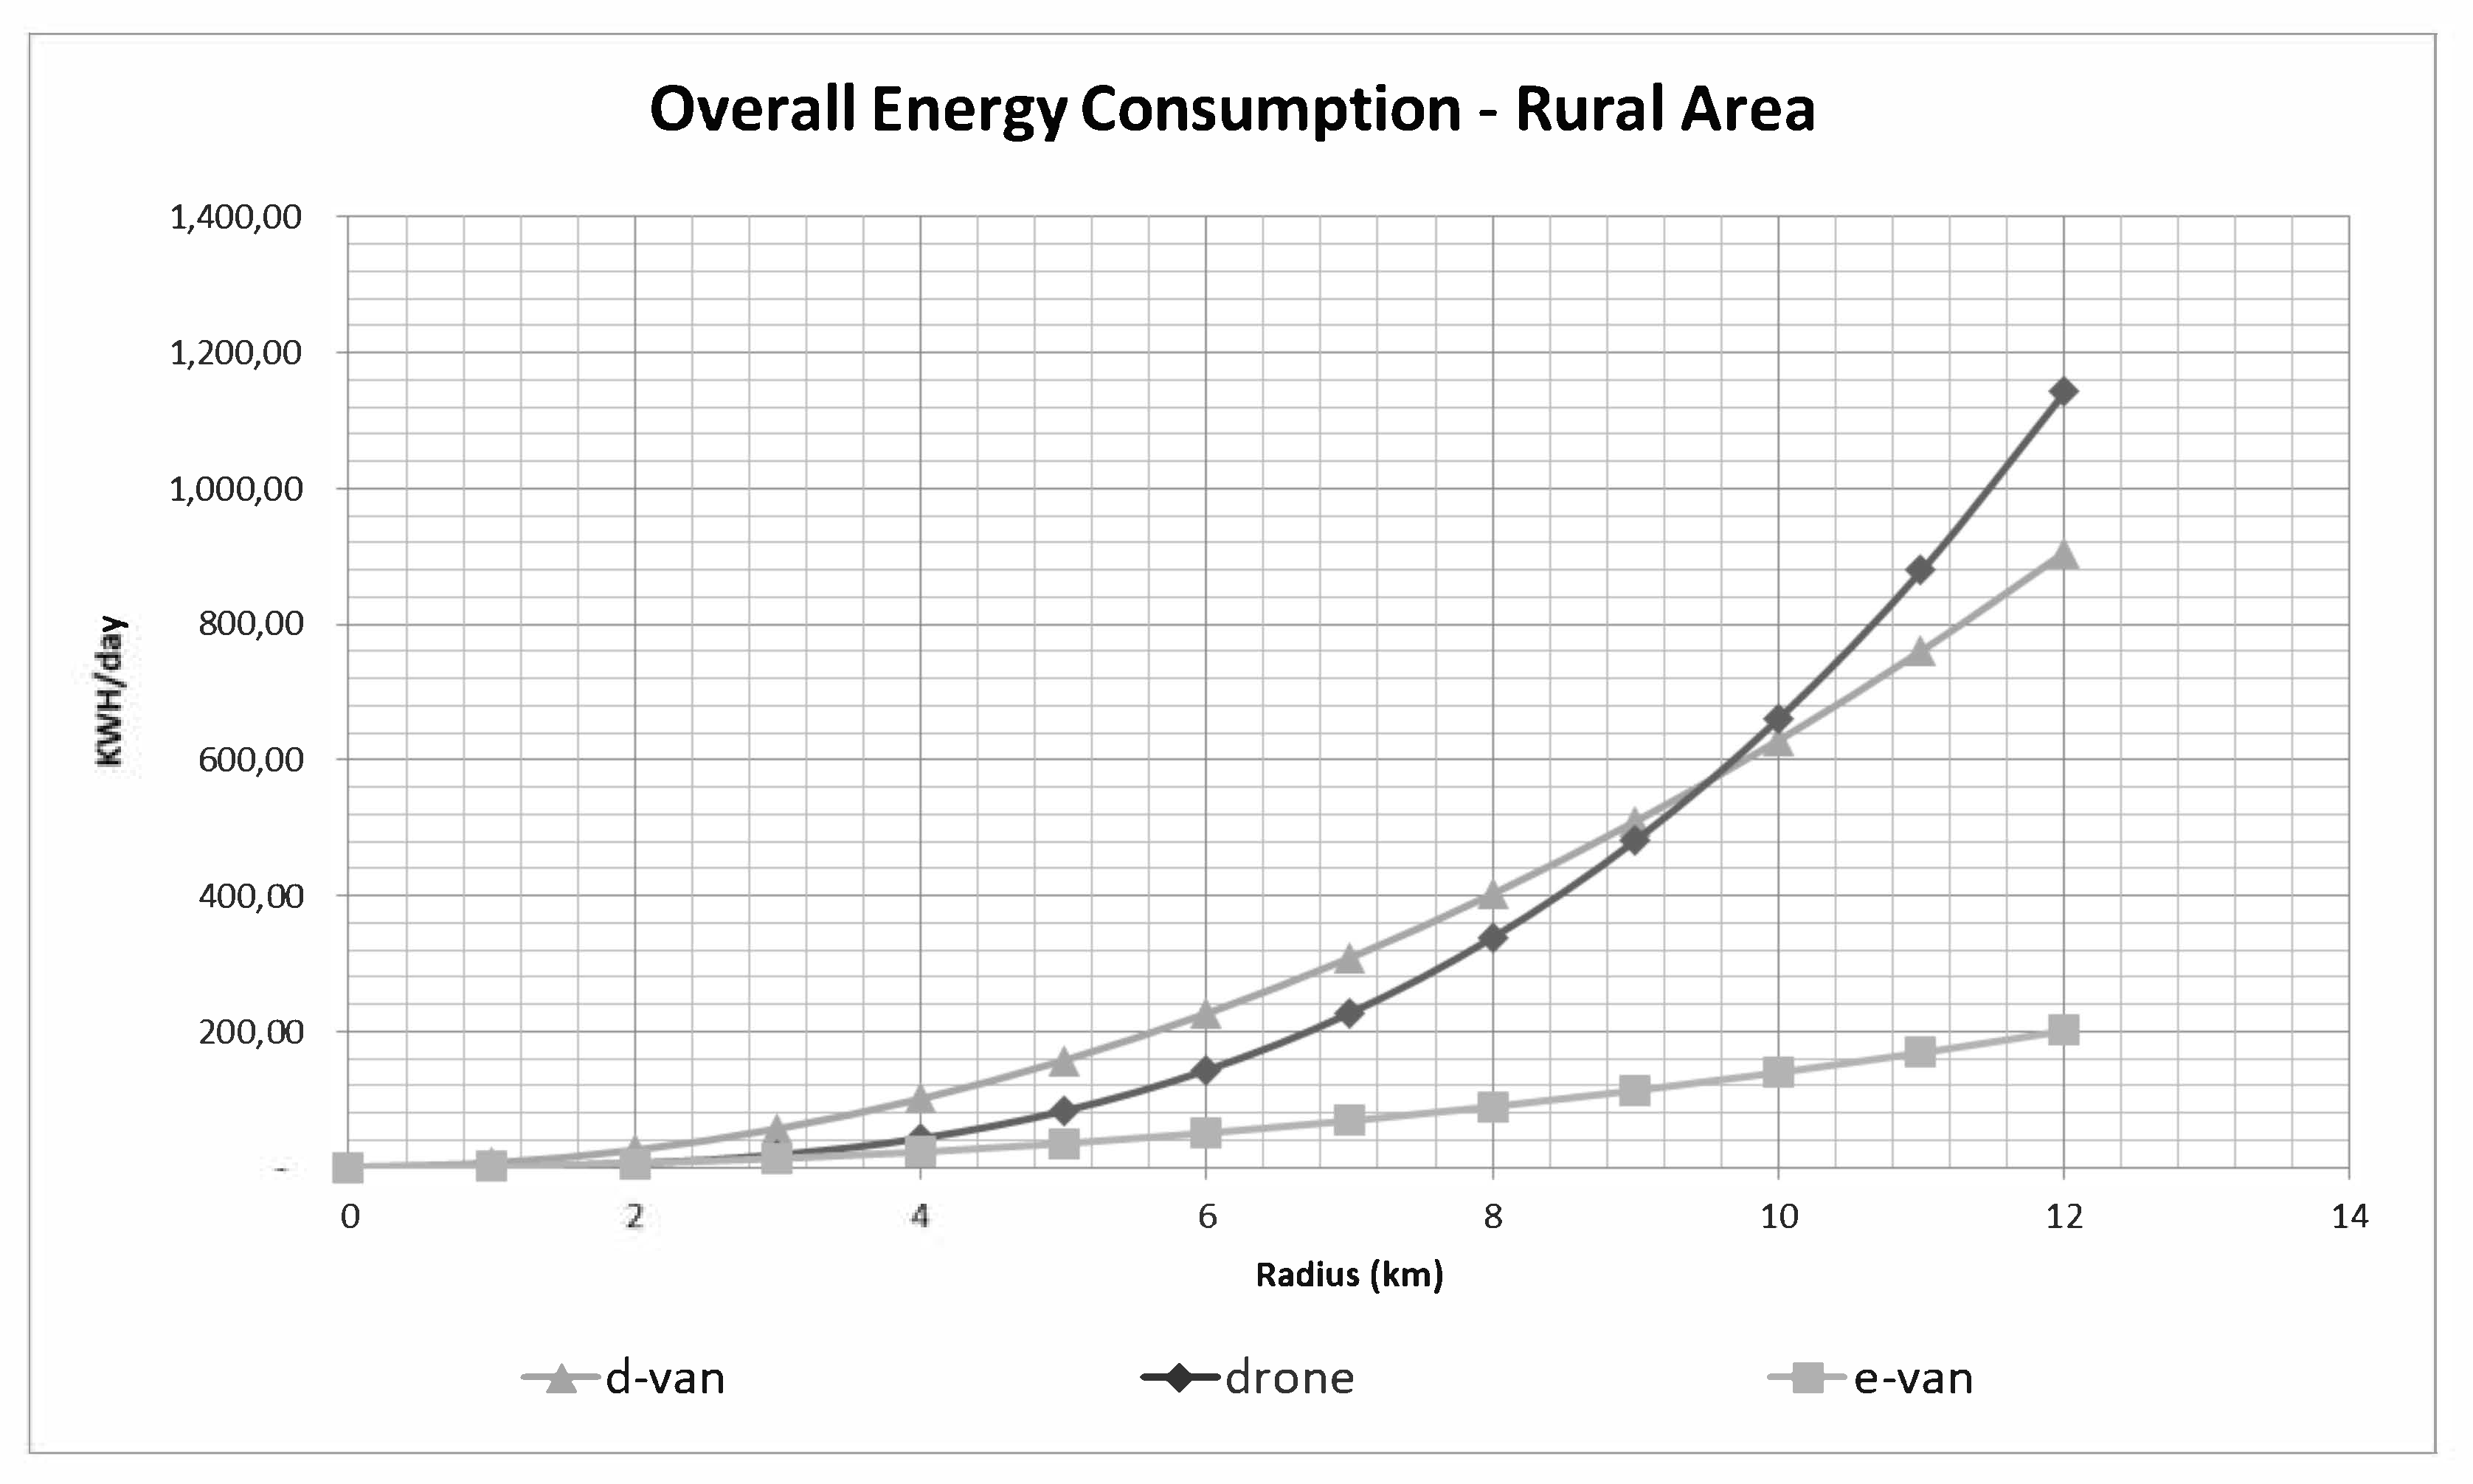
Finally, the same analysis has been performed considering a rural area with a density of 250 inhabitants/km
2, and the energy consumed per unit distance has been changed to 900 kWh/km and 200 kWh/km respectively for the diesel and the electric van, and the speed has been increased to 25 km/h in consequence of the reduced effect of traffic congestion. The results obtained, given in
Figure 5, show that due to the reduced number of deliveries, the effects of the inefficiencies related to the operational scheme of the aerial service are mitigated, and the breakeven point with the traditional ground vehicle is now at a coverage radius of approx. 9.5 km, which is close to the maximum range of a delivery drone in ideal weather conditions. The aerial delivery system is also slightly convenient compared to the ground electric system within a radius of almost 3.5 km. In such case, hence, the scenario is substantially different, and the limitation of the maximum endurance may become a significant constraint.
As a general conclusion, the results obtained show how the energy consumption of supportive aerial logistics infrastructures fundamentally relates to area serviced. The substantial increase of the energy consumption with the radius leads to the conclusion that in an urban context the aerial distribution is convenient in terms of energetic consumption only for a maximum radius of the serviced area of approx. 3.5 km. The same infrastructures, in a rural context would be convenient for a maximum operating radius of approx. 9 km. Such results are coherent with the those reported in the recent literature [
44], therefore the research proposed contributes to the knowledge of the sector by providing a reliable quantitative methodology to confirm empirical results. In addition, by introducing appropriate cost models for evaluating the fixed activation costs and the energy costs, the proposed model can be effectively employed for designing optimized aerial delivery infrastructures for covering bigger (city-wide) areas, thus offering relevant managerial insights.
The results obtained should also be considered in the view of the electrification process that is taking place in Europe. In particular, recent researches [
67] report that on an overall number of 199,825 charging stations in the European Union, approximately 25% are located in the Netherlands, 20% in Germany, 15% in France, and 14% in Great Britain. The remaining 25% is distributed among all the other countries that are in the early stages of the electrification process. The number of electric vehicles however does not follow the same distribution, and the percentage of commercial electric vehicles is still below 0.5% in the most populated countries. Recent studies [
68] referred to the road transportation also report that, considering an ambitious electrification strategy could decrease CO
2 emissions from light commercial vehicles by 30% by 2030, which is a total road transport emission reduction by roughly 3%. In such regard it must be pointed out that aelectric cargo bikes are arguably the most direct competitors to delivery drones In particular, the use of electric cargo bikes for short-range delivery is gaining popularity in Europe [
69], and recent a study [
70] reports that in European cities, potentially 42% of courier deliveries could be substituted by cargo bikes, while the results of the recent Cyclelogistics (2011–2014) and Cyclelogistics Ahead (2014–2017) projects indicate that, on average, 51% of all motorized journeys in European cities involving the transport of goods could easily be moved to e-cargo bikes [
71]. It must be pointed out however that although cargo bikes are a very effective solution from an energetic point of view, the presence of the driver substantially impacts the cost of service. The advent of autonomous guided vehicles might be in such regard a game changer in the near future.
Finally, it is worthwhile considering the combined used of aerial and ground transportation with appropriate design in last mile delivery. In particular aerial short-range distribution systems can be a viable opportunity in rural areas where road infrastructures are less developed or in particularly congested urban areas where the commercial speed of ground vehicles can be very low.
7. Conclusions
In the last decade, with the spread of electric mobility, the topic of city logistics has attracted a relevant research interest in the context of supply chain management. In such context, the possibility of employing UAVs for last-mile urban parcel delivery represents an attractive opportunity since aerial delivery services have proven their effectiveness in several specific contexts (e.g., vital medical supplies). The integration of UAVs into the distribution chain on a systematic basis, however, requires an additional tier of urban logistic facilities for performing the consolidation and transshipment activities, and for recharging the UAVs.
This study focuses on the energetic consumption of aerial distribution systems for last mile delivery, and proposes an original methodology to calculate the energy consumption of the related supportive infrastructures. To the best of our knowledge this is the first time such problem is considered from a quantitative perspective. The methodology proposed, considers the expected number of deliveries that can be performed by a drone in the area serviced, and the average distance travelled per trip. The comparison with the estimated energy consumption of ground vehicles shows that the efficiency of aerial logistics in last mile delivery is strictly linked to the coverage area.
The results obtained contribute to the scientific debate about the effectiveness of aerial distribution systems, by providing a reliable model for evaluating the energy consumption of aerial logistic systems, thus allowing the optimal sizing of the supportive infrastructures with respect to area serviced. The results obtained show in particular that although aerial delivery systems can actually outperform traditional ground proximity services, the range of effective operations drastically reduces as the population density (and corresponding service demand) increases. In particular, while aerial logistics can be effective in rural areas up to a range of approx. 9.5 km, this range reduces to approx. 3.5 km in urban areas. The suggested managerial insight is that optimized design of such infrastructures is crucial to outperform the traditional ground distribution systems. The research also demonstrates that aerial logistic systems for last mile delivery can be a convenient choice for quick and low-cost parcel distribution, provided urban supportive infrastructures are adequately designed. The deployment of such infrastructure as an additional tier of the supply chain can be however troublesome, particularly in old city centers. Some concerns may thus arise about the opportunity of such solution considering that electric ground vehicles may easily outperform aerial systems in many real contexts, and that due to the limitations of delivery drones and their inability to operate in adverse climatic conditions, aerial logistic systems would always require ground backup vehicles. The integration of aerial and ground logistic systems for last mile delivery, hence, is an interesting topic for further research considering the increasing trend of e-commerce related delivery services. In such regard, the spike in demand of e-commerce- and home-deliveries observed during the recent COVID19 outbreak and the consequent stress test that it has generated on urban logistic systems, could be indicative of future scenarios if these consumer patterns are sustained after the end of the outbreak.
Finally, the study suggests several directions for future research, including the lifecycle analysis of the infrastructures, and the introduction additional decision criteria within a multi criteria strategic optimization framework, while a substantial shortcoming is the difficulty of forecasting the demand of delivery services that can be performed by drones. Additionally, the methodology proposed relies on some relevant underlying assumptions, such as the demand modeling approach and to the energy consumption model. Referring to former, the lack of detailed information about the frequency and density of parcel deliveries, constitutes a significant limitation: the methodology proposed could thus be improved by implementing a more advanced demand modelling approach (e.g., taking into account the specific socio-economic conditions such as income, population age, etc.). Concerning the energy consumption issue, the simplified model proposed considers the energy required for horizontal translation and for hovering in static conditions, neglecting the energy consumed by the on-board electronic devices. The methodology proposed, however, can be extended to different aerial vehicles (e.g., octocpters or fixed wing) by introducing appropriate energy consumption models.


