Article

Addressing European Ocean Energy Challenge: The DTOceanPlus Structured Innovation Tool for Concept Creation and Selection

1
Infrastructure & Engineering, Energy Systems Catapult, Birmingham B4 6BS, UK
2
School of Engineering, Institute for Energy Systems, University of Edinburgh, Edinburgh EH9 3DW, UK
3
Wave Energy Scotland, Inverness IV2 5NA, UK
*
Author to whom correspondence should be addressed.
Energies 2021, 14(18), 5988; https://doi.org/10.3390/en14185988
Submission received: 13 August 2021 / Revised: 15 September 2021 / Accepted: 18 September 2021 / Published: 21 September 2021

Abstract

:
The whole energy system requires renewables that scale and produce reliable, valuable energy at an acceptable cost. The key to increasing the deployment of ocean energy is bringing down development and operating costs. This paper proposes a structured approach to innovation in ocean energy systems that would spur innovation and expand the market for ocean energy. This approach can be used by a wide range of stakeholders—including technology and project developers and investors—when considering creating or improving designs. The Structured Innovation design tool within the DTOceanPlus suite is one of a kind beyond the current state-of-the-art. It enables the adaptation and integration of systematic problem-solving tools based on quality function deployment (QFD), the theory of inventive thinking (TRIZ), and the failure modes and effects analysis (FMEA) methodologies for the ocean energy sector. In obtaining and assessing innovative concepts, the integration of TRIZ into QFD enables the designers to define the innovation problem, identifies trade-offs in the system, and, with TRIZ as a systematic inventive problem-solving methodology, generates potential design concepts for the contradicting requirements. Additionally, the FMEA is used to assess the technical risks associated with the proposed design concepts. The methodology is demonstrated using high-level functional requirements for a small array of ten tidal turbines to improve the devices layout and power cabling architecture. The Structured Innovation design tool output comprises critical functional requirements with the highest overall impact and the least organisational effort to implement, along with appropriate alternative solutions to conflicting requirements.

Graphical Abstract

1. Introduction

The global electricity supply is changing rapidly with the rise of variable renewable sources and low-carbon technologies. According to Ocean Energy Europe [1], Europe can meet 10% of its electricity demand from ocean energy sources and deliver 100 GW of capacity by 2050. European oceans and seas offer vast energy resources and can play an important role in delivering economic recovery and addressing the decarbonisation challenge [2]. However, technologies for harnessing ocean energy are not yet mature enough for widespread use. There are performance, reliability, and survivability challenges, leading to high energy costs compared with other energy sources. Despite relatively low maturity, the ocean energy sector can benefit from the established, more mature industries such as offshore wind, considering the many synergies and transfer possibilities between sectors. Leveraging these potential synergies can help address the challenges related to the cost competitiveness of ocean energy technologies.
Ocean Energy Europe estimates the global tidal energy resource at 1200 TWh/year and wave energy at 29,500 TWh/year [3,4]. Yet, tidal stream technologies are still at a precommercial stage and wave energy technologies are still at demonstration level. Wave energy developers, such as CorPower [5] and Bombora [6], continue to engage in innovation and demonstration activities, such as supported by the Wave Energy Scotland (WES) funding programme [7]. Tidal stream developers, such as Orbital Marine Power [8] and Nova Innovation [9], are working toward commercialisation through projects such as Integrating Tidal Energy into the European Grid (ITEG) [10] and Enabling Future Arrays in Tidal (EnFAIT) [11].
Reduction in the costs of ocean energy technologies could arise from an incremental reduction in the levelised cost of energy (LCOE) through economies of scale and learning by doing, both facilitated by subsidised deployment. This has been seen in other renewable energy technologies [12]. Step-change reductions in cost may also be required for ocean energy to make a meaningful contribution to upcoming net-zero targets. These could result from design improvements and innovations [13].
Net-zero transition calls for unprecedented innovation in advancing existing technologies and fostering innovative technologies, such as ocean energy projects at demonstration or first-of-a-kind precommercial stages. Using structured and systematic approaches to innovation will result in areas for improvement that provide the greatest impact on the overall designs to help achieve this level of step-change required and encourage the greatest value from investments [14]. For instance, one of the public funding bodies, WES, is supported the development of Mocean Energy and AWS Ocean energy [14] devices from a technology readiness level (TRL) 3 to 6 through a structured programme.
Across most industries, innovation comes hand in hand with the competitive position of firms. According to Chesbrough [15], companies are moving away from traditional research, development, and innovation (RD&I) models to more open and structured innovation approaches that combine internal and external ideas and respond to market needs. These models integrate the needs of the people, the process, the market, and the technology.
Nowadays, as described in [16], “most companies developing new products or services use a structured approach to innovation; to identify, create, and develop innovative solutions, measure “success” against their competitors, and manage the uncertainties and risks associated with the implementation processes. This is seen across a wide variety of sectors in companies such as ExxonMobil [17], Ford Automotive [18,19,20], Rolls-Royce [21], companies in the medical and pharmaceutical industry [22], and many more”. Despite the adoption of structured innovation methodologies in advanced and matured sectors (e.g., automotive), the adoption of structured innovation methodologies is less evident in the ocean energy sector (examples provided in Section 2.2). The ocean energy sector must achieve significant reductions in LCOE to become competitive with more established energy conversion technologies. The introduction of innovative technology concepts is vital to accelerate cost reduction. However, it is equally critical that developers select the most promising technologies to take into the development process to make the most efficient and effective use of limited funding and other resources.

1.1. Background

This section covers background on structured innovation best practices to date and how a similar approach can be used in the ocean energy industry.

1.1.1. Structured Innovation Best Practice

Conceptual design is the earliest phase of the design process in which an artefact’s functional requirements are defined. The process involves understanding the needs of the end-users and how to develop new or improved products, processes, or services that both benefit users and are sustainable in the market. The conceptual design approach recognises viable solutions by considering possible interactions, experiences, processes, and alternatives to a design. For decades, several design approaches have been developed for conceptual designs and creative thinking. In the early 1970s, creativity was measured by the rate of ideas a person would come up with over a specific time. The assumption was that a “quantitative increase of ideas would necessarily bring about a qualitative improvement” [23,24].
There have been numerous works dedicated to the understanding of creativity and innovation, describing the different approaches used in studies of creativity and the factors affecting creativity such as social impacts, nature influences, and other issues [25,26,27,28,29]. Some of the most common techniques are brainstorming, lateral thinking (six thinking hat), Synectics, Six Sigma, quality function deployment (QFD), and theory of inventive problem solving (TRIZ). These techniques use five fundamental methods: incremental improvement (evolution), synthesis of existing ideas, revolutionary approach, reapplication beyond the stated application, and creative insight (a complete shift or change of direction). A comprehensive review of these conceptual design methods and the current state-of-the-art in structured approaches to innovation can be found in [16,30,31]. However, the focus of this paper is to present the new approaches adapted for the ocean energy sector. These approaches comprise the integration of TRIZ into QFD for initial concept exploration, conflict assessment, and impact analysis.
TRIZ, a Russian acronym “Teoriya Resheniya Izobretatelskikh Zadatch”, translates to the theory of inventive problem solving. It is a problem-solving tool that resolves conflicts between design properties or requirements. The tool was invented and developed by the Soviet inventor Genrich S. Altshuller and colleagues from 1946 in the USSR [32,33]. The problem-solving tool goes beyond intuition, using logic, data, and research derived from studies of invention patterns in the global patent literature—patterns of inventive solutions to specific fundamental problems [22,32]. The value of TRIZ is “the suggestion of innovative principles that may stimulate the TRIZ practitioners’ creative thinking in overcoming a design conflict” [34]. TRIZ tools are primarily based on two concepts: (1) generalising problems and solutions and (2) eliminating contradictions. TRIZ, particularly, is less adopted; however, the industry recognises how powerful the tool is in suggesting innovative principles, overcoming design conflicts, and stimulating creative thinking.
Quality function deployment is a quality customer-driven design methodology that supports the design process for product development. The QFD method was developed in Japan by Yoji Akao and Shigeru Mizuno in the late 1960s to ensure the voice of customers features in the design engineering characteristics of products being developed [35]. As a structured approach, QFD is used to identify, prioritise the voice of the customer, and translate them into applicable technical requirements for each stage of product development and production [36,37].
Failure mode and effects analysis is a widely used design process implemented in the product design to evaluate the high-priority failure modes to estimate the components or subsystems performance and reliability and their failures. From its origin traced back to the military standards of the United States (MIP-P-1629), various organisations have expanded the implementation of the FMEA based on their specific needs as a standalone tool (e.g., process FMEA, failure modes, effects, and critical analysis (FMECA), or integrated into their design processes (e.g., QFD/FMEA, FMEA/hazard, etc.).
The review of structured innovation approaches in automotive, aerospace, and other sectors indicated that advanced and matured sectors had adopted a hybrid of QFD, TRIZ, and/or FMEA to identify and prioritise optimal designs for their products. These approaches were found to help define a design problem, reduce the possibility of omitting dependencies between requirements, support identifying trade-offs, and effectively manage the relationships between the objectives and performance measures. However, some limitations highlighted were how complicated the management of the process could be for larger matrices, the extensive effort required to collect the voice of the customer (known and unknown needs), and the tool’s inability to find alternative solutions to the identified contradictions.
Upon the above reviews, it was decided to focus on integrating these two design methods, QFD and TRIZ, to develop a structured innovation tool for the ocean energy sector. TRIZ is a tool that can complement the QFD in that the latter does not innovate, but coordinates the thoughts of the customer and the designers. The well-defined nature of these methods with research publications, combined with the abundance of educational resources, justified their selection. Since the customer’s satisfaction is achieved by delivering high-performance quality (QFD) and robust products, FMEA was integrated to support risks mitigation of concepts. Therefore, the QFD, TRIZ, and FMEA methods were selected to support the design of ocean energy concepts.

1.1.2. Ocean Energy Current Practice

As discussed in the introduction and [16], “the ocean energy sector’s primary focus is to create a market that drives innovation and competition. The adoption of structured innovation approaches in the sector is less evident in the literature. The US-based National Renewable Energy Laboratory (NREL) and Sandia National Laboratories use a structured innovation approach to identify and develop new wave energy converter concepts with high techno-economic performance potentials” [38]. Along with a stage-gate assessment tool, NREL and Sandia use their tools to implement the best technology development trajectory with respect to time, cost, and risks and assess the development path of these technologies with respect to their readiness levels and performance levels [39,40].
The Wave Energy Scotland project SEAWEED is developing a scenario creation tool to “identify attractive scenarios for exploiting wave energy resources”. “As a standalone package, the scenario creation tool facilitates the creation of concepts by scanning the design space and selecting the most attractive and achievable options. The evaluation is based on high-level metrics such as LCOE, CAPEX, commercial attractiveness, and achievability” [41].
The collaborative project TiPTORS between the Offshore Renewable Energy Catapult and Ricardo UK was carried out to develop a design for reliability process for tidal turbines’ power take-off units [42]. The core design process for this project started by capturing customer requirements using QFD. A fault tree, a root cause analysis, and the failure mode, effects and criticality analysis (FMECA) were integrated into the core process of the tool to mitigate the impacts of potential failures of the PTO units and define the overall reliability of the concepts proposed. It was highlighted that some trade-offs were likely to be derived from the set of the engineering specifications; however, within the literature, it was not clear what process was used to eliminate those trade-offs within the QFD matrix. The recommendation from this project was that the design for the reliability tool needs to be further tested to align with the industry standards [43].
The Energy Technology Institute (ETI) conducted Tidal Energy Converter System Demonstrator projects to “identify, develop and obtain the best routes and supply-chain options to commercially viable tidal stream technologies when deployed at array scale” [43]. The ETI aims, through these projects, to demonstrate the importance of the tidal energy sector within the whole energy system, and recognise and concentrate on the key technology and deployment challenges faced by the ocean energy sector. Among others, the combined QFD/FMEA tools were used to define the design, innovation, and optimisation of an array-scale coordinated collection of turbines [44].
Although these previous studies lay out the basis for applying structured innovation methods to the marine energy sector for specific stages of development or subsystems, a single integrated structured innovation approach for marine energy fully exploiting existing methods has not yet been developed.

1.2. Goal

For a sector such as ocean energy, where the number of design options is still very high, a structured innovation approach is needed to help users understand the complexity and interdependencies of the engineering challenge—resulting in a more efficient evolution from concept to commercialisation. To address this need, a tool for this purpose was developed and integrated into the DTOceanPlus suite of design tools for ocean energy [45]. The Structured Innovation design tool for ocean energy technologies proposed here presents a novel method for provoking innovation by representing the voice of the customer through the design process, managing risk, and producing new concepts. It does this by integrating various structured innovation approaches to guide the user in creating or improving concepts in a structured and step-by-step approach [46].
The work presented in the subsequent section assessed, adapted, and imported processes from other sectors to develop and validate a single Structured Innovation design tool for the ocean energy sector. This Structured Innovation design tool is intended to provoke innovation and help represent the voice of the customer through the design process, manage risk, and produce new concepts. The tool will allow the designer to understand the logical “art-of-the-possible” when considering the design targets, critical to the design’s success and commercial realisation. The art-of-the-possible, rather than the state-of-the-art, will help consider “the ideality of devices or processes limited by physics (e.g., Betz limit, yield strength, etc.) and extreme conditions to provoke new concepts” [46].
The Structured Innovation design tool for ocean energy technologies proposed here allows, for the first time, to “provoke innovation and help represent the voice of the customer through the design process, manage risk, and produce new concepts by integrating the following approaches” [46]:
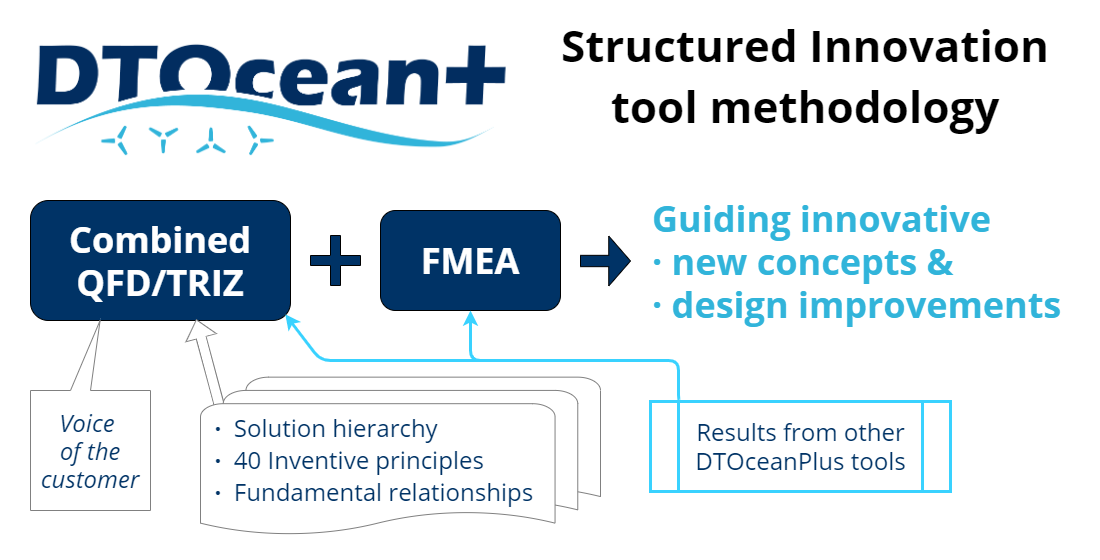
  • QFD defines the innovation problem, represents the voice of the customer, identifies trade-offs in the system, and makes immediate objective assessment visible and useful.
  • TRIZ generates potential solutions to the contradictions to meet the user requirements.
  • FMEA improves understanding of technical risk during the development process and offers risk mitigation and cost reduction opportunities.
New methods have not been invested within the Structured Innovation tool, but the QFD and TRIZ methods are combined to enhance their value. The integrated process will allow the user to quickly and thoroughly create innovative solutions using the TRIZ methods and inventive solutions within the QFD process.
This paper describes this Structured Innovation design tool, which was assessed, adapted, and developed from mature processes for the ocean energy sector. The paper is organised into five sections. Section 1 presents background information and best practices of mature and nascent industries for assessing innovations. Section 2 describes the core of the Structured Innovation tool methodology and the additional modules and interactions. The results of the use case examples, including the input parameters used and resource data, are also discussed. Section 3 offers a conclusion and recommendations for further work.

2. DTOceanPlus Structured Innovation Methodology

To enable a structured approach to address ocean energy engineering complexity where design options are numerous, a Structured Innovation design tool was developed within the DTOceanPlus project. The tool provokes the designer to consider and contemplate the interactions between technical solutions to a problem and the necessary compromises to meet the design intent or requirements. The tool is intended to provide the designer with a process, information, validated data, analysis, and comparative assessments. In this framework, the structure needs to be carefully considered not to constrain opportunistic innovation created by systematic thinking. The tool encourages the breakdown of functional fixedness—this is the cognitive bias that adults employ to quickly understand the operation of an object. This fixedness is countered by many features within the tool, including the TRIZ methods and additional resources to help them complete the process. The tool can be downloaded from [47], and more information can be found in [46,48,49].
The overall approach developed is summarised in Figure 1, and the remainder of this section discusses each stage in further detail.

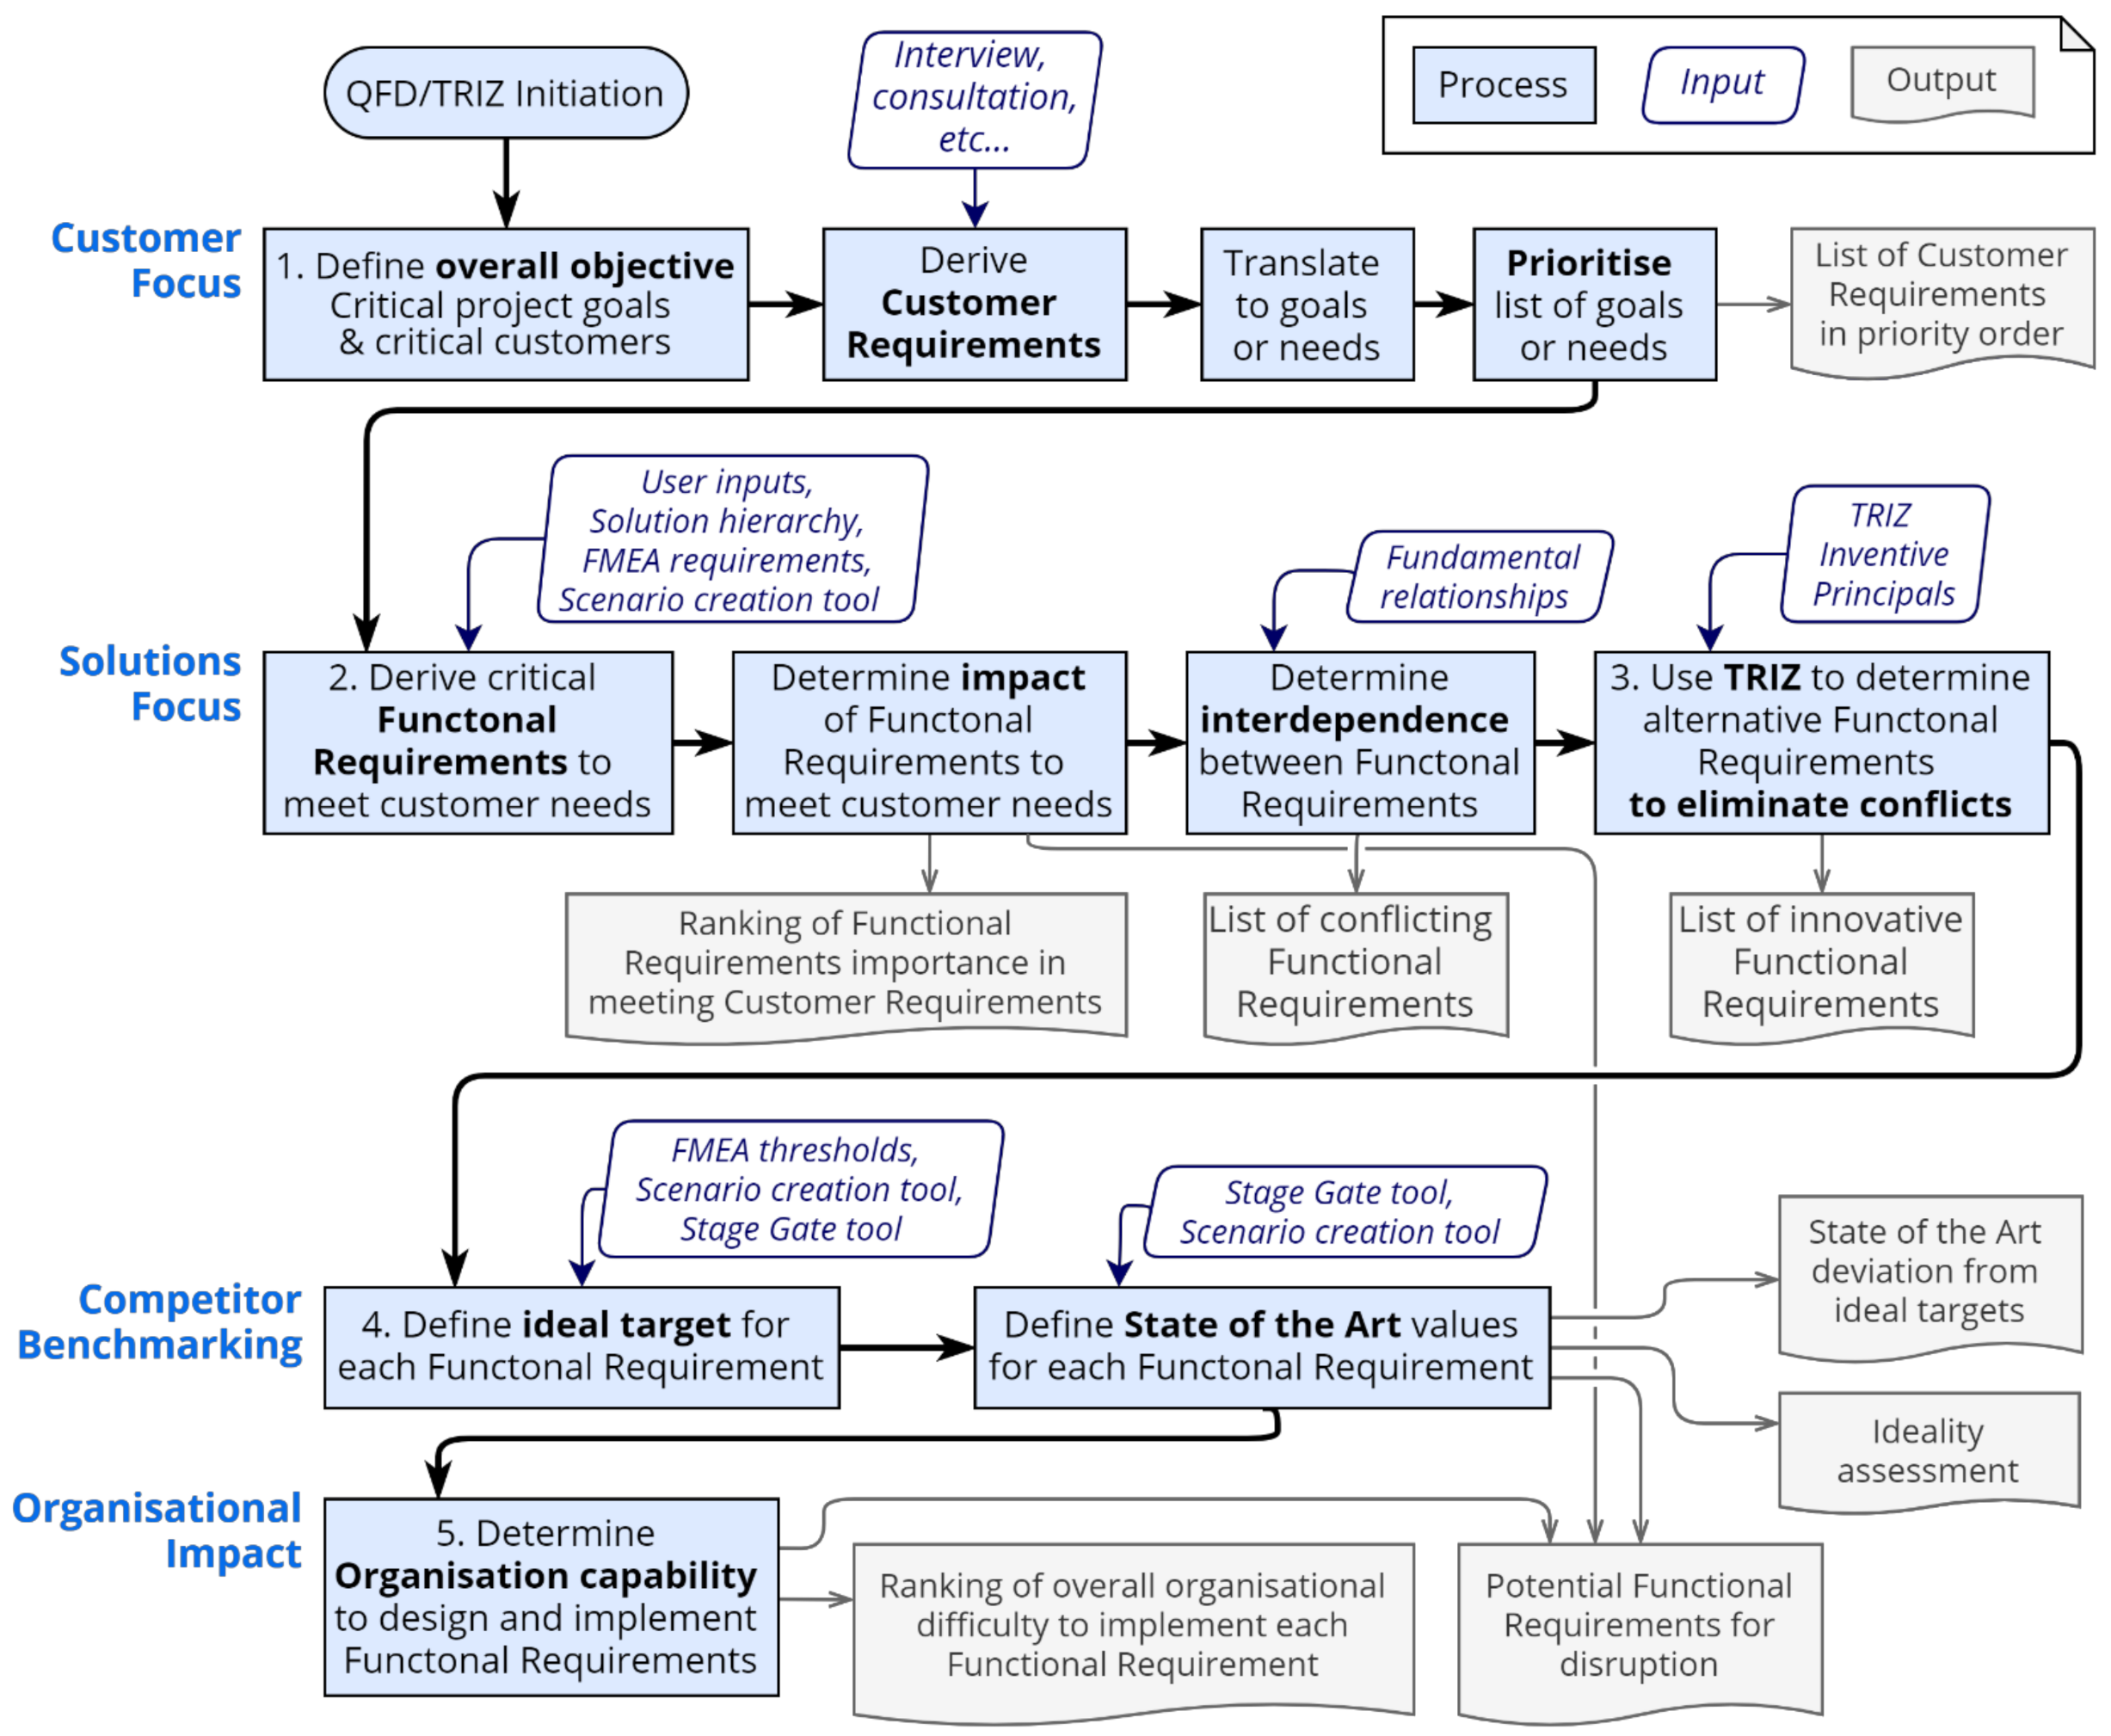
2.1. Main Structured Innovation Methodology (QFD/TRIZ)

The functionalities of the developed Structured Innovation tool are discussed in detail in this section with examples:

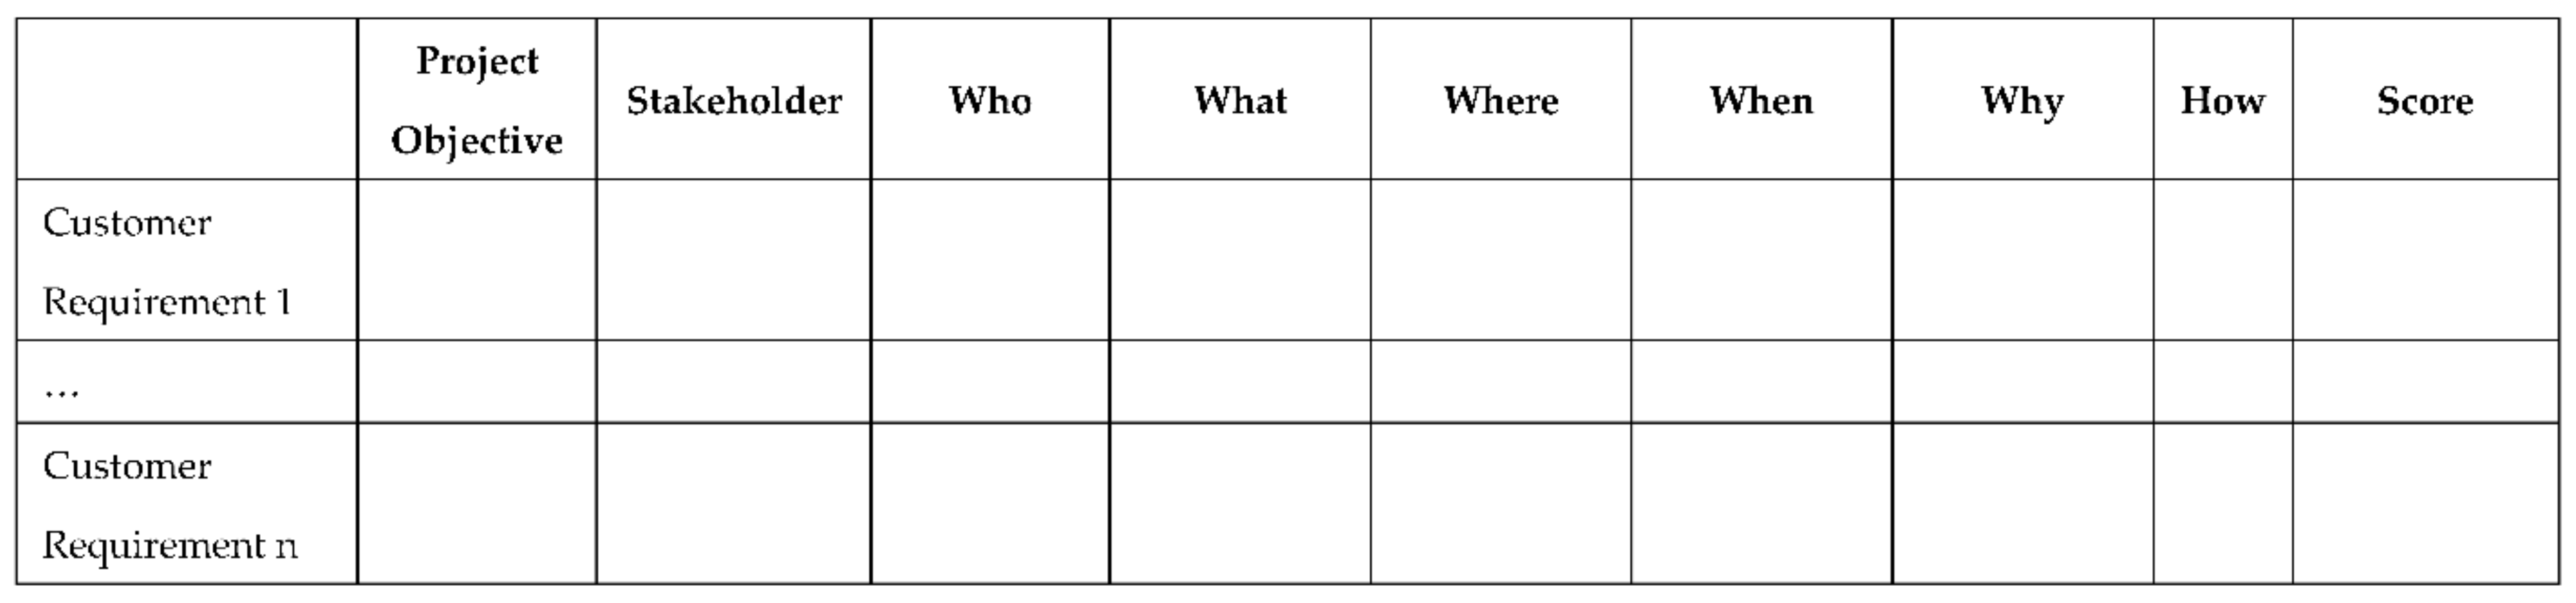
2.1.1. Definition of Overall Objective and Customer Requirements

The Structured Innovation tool’s first step is to define the voice of the customer. This means different things to various organisations, e.g., the voice of the technology or product, business or project, stakeholders, or end-users. The identification of who the customers are is crucial to the application of the tool. This should include customers/stakeholders directly or indirectly involved or affected by the product/service.
The requirements of the multitude of stakeholders could originate from market research, interviews, laws and regulations, contracts, operational modes, site conditions, external interfaces and utilities, industrial codes and standards, operator needs, the political, societal, economic, or environmental interest, and other sources [30]. These requirements can also be the result of design needs (design limitations), risk mitigation measures (FMEA outputs), or the art-of-the possible (ideal technology values rather than state-of-the-art).
An example of the types of questions that can be considered in defining the most critical customers and their objectives are provided below, with ways to capture this information in Figure 2:
  • Why is the project or the specific features desirable?
  • Who are the current or future potential users?
  • What are the most important business goals and future targets?
  • What are the most problematic products, processes, services, applications?
  • What are the current constraints? E.g., financial, technological, operational, environmental? Are there any alternatives?
  • Which markets or customers are the most critical?
  • Where is the process or product currently used? (Application, sector, potential future uses).
  • When and how is the product or service used?
  • What are the current state-of-the-art technologies?
While this step may be time-consuming in the design process, it encourages collaboration between the cross-functional teams and stakeholders, reducing subjectivity or bias, outputting a list of the most critical customer requirements and their relative importance. The customers rate these requirements based on their level of importance. A ratio scale priority or a series of pairwise comparisons technique, known as the analytical hierarchy process (AHP), is used in many cases.
In developing a new product, the customer requirements are usually general, vague, difficult to implement directly, and require further detailed definition. The example shown in Table 1 is for a tidal developer who needs to improve the device layout for an array of 20 tidal turbines.
The application of the structured innovation tool is also demonstrated using a wave energy use case where a public investor is looking to identify attractive areas of innovation for investment. In this example, customer requirements can also be obtained from the scenario creation tool, developed by Wave Energy Scotland [50], to provide a starting point for the use case of wave energy concept creation. This tool uses various databases to generate a combination of parameters such as CAPEX, efficiency, resource, and scale, representing attractive and achievable solutions for wave energy technology. The focus of the study is to identify high-potential, high-impact wave energy converters that are too early for private-sector investment but with great techno-economic potential.
In this example, shown in Table 2, the investor considers an attractive business case to be (1) affordable, (2) with low risk of investment, and (3) safe to operate with minimal environmental impact. To be profitable in today’s market, the investor sets a target LCOE of EUR 70/MWh, which is competitive with fossil fuels, e.g., combined-cycle gas turbines [51].
Example objectives, in this case, could be:
  • Wave energy converter with an LCOE of EUR 70/MWh”; since the scenario creation tool requires the user to define a target LCOE for their wave energy technology, which could be used for as a customer requirement in the Structured Innovation tool.
  • “Safe to operate”; since the scenario creation tool uses a default breakdown for operation and maintenance costs, the user may reduce or increase these when using the tool, which would allow them to enter the Structured Innovation tool with an understanding of how important this parameter is to their overall project objectives.
  • “Low environmental impact”; although this is not explored in the scenario creation tool, since the user will have generated several attractive scenarios, they could then enter the SI tool with some attractive scenarios and add in the important environmental impact consideration. This would ensure their attractive scenarios take this into account in their next stages of development in the Structured Innovation tool.

2.1.2. Definition of Functional Requirements

The customer requirements form the basis of the QFD methodology, ensuring that these are considered in the earliest stages of design and through all the following stages, resulting in a product that meets or exceeds the customers’ requirements. For each captured customer requirement described in Section 2.1.1, the (team of) designers will refine them into functional requirements that are achievable, measurable, and feasible target values. These functional requirements should reflect the functions sought in a product without assuming a design or solution [52]. This is the stage where creativity or innovation comes into play.
To support the definition of the functional requirements within the structured innovation tool, a multilevel list of potential solutions for marine energy is provided, known as solution hierarchy. The intention is to offer this hierarchy as an aide-mémoire and help the designers consider multiple solutions, starting with requirements of the energy trilemma (a balance between energy security, affordability, and decarbonisation). It lists potential solutions for each requirement—the team can then understand the potential for each requirement ideality, innovation, and thoroughness. This is discussed further in Section 2.2.2.
Once the functional requirements are defined, each functional requirement’s desired direction of improvement is determined (is higher or lower better?). A score is then used to determine the strength of the relationships between the customer requirements and the functional requirements (9: high, 4: medium, 1: low, 0: none), and a weighting is calculated to indicate the impact each functional requirement has on meeting the customer needs. The “direction of improvement” of each of the functional requirements could be informed, for example, by the scenario creation tool, with which the multiple attractive and achievable scenarios would highlight to the user which parameters they should maximise or minimise.
Continuing with the tidal array example, the defined functional requirements and the relationships between the customer and functional requirements are presented in Table 3.
A quality assurance (QA) test is performed within the Structured Innovation tool to ensure that the importance of each customer requirement is translated to the quality of the functional requirements. Where a warning is provided, the team must revisit the functional requirements’ strengths on the CRs or reprioritise (gathering the stakeholder) the importance of the customer requirements.
In the wave energy concept example, to ensure suitable technology is selected, it is necessary to consider the operational requirements based on resources and site conditions. These can then be translated into functional requirements for the overall system and subsystems. In this example, the scenario creation tool’s outputs were chosen as the critical functional requirements to meet the investor needs; this allows target values from the attractive scenarios to be entered in later steps of the Structured Innovation process. These requirements are shown in Table 4.
As part of the QFD, understanding functional requirements’ correlations or interdependencies is key to determining if the proposed functions are in conflict or synergy. The purpose is to identify areas where trade-off decisions, conflicts, and innovation may be required. A predefined six-point scale of low, medium, or high with a positive or negative impact is generally used as a qualitative assessment. These are assigned numerical values of ±1, ±4, and ±9. A positive correlation implies that increasing one functional requirement will result in the increase of the other. Likewise, a negative correlation implies that increasing one functionality will impede the other. In the example provided in Table 5, lowering hydrodynamic losses might mean increasing interdevice distances; this, in turn, will result in increasing installation and manufacturing costs instead of minimising these—highlighting conflicts in implementing both requirements.
Establishing these correlations requires an understanding of the relationships between the functions considered. These relationships are the engineering, physics, and fundamental economic relationships that connect different aspects of the design space and delimit it. A set of fundamental relationships was built to delimit the possible design space, draw comparisons between the functional requirements, and specify their limits. This is discussed further in Section 2.2.3, and for specific wave energy examples in [53].
The interdependencies between the functional requirements of the wave energy example are shown in Table 6.

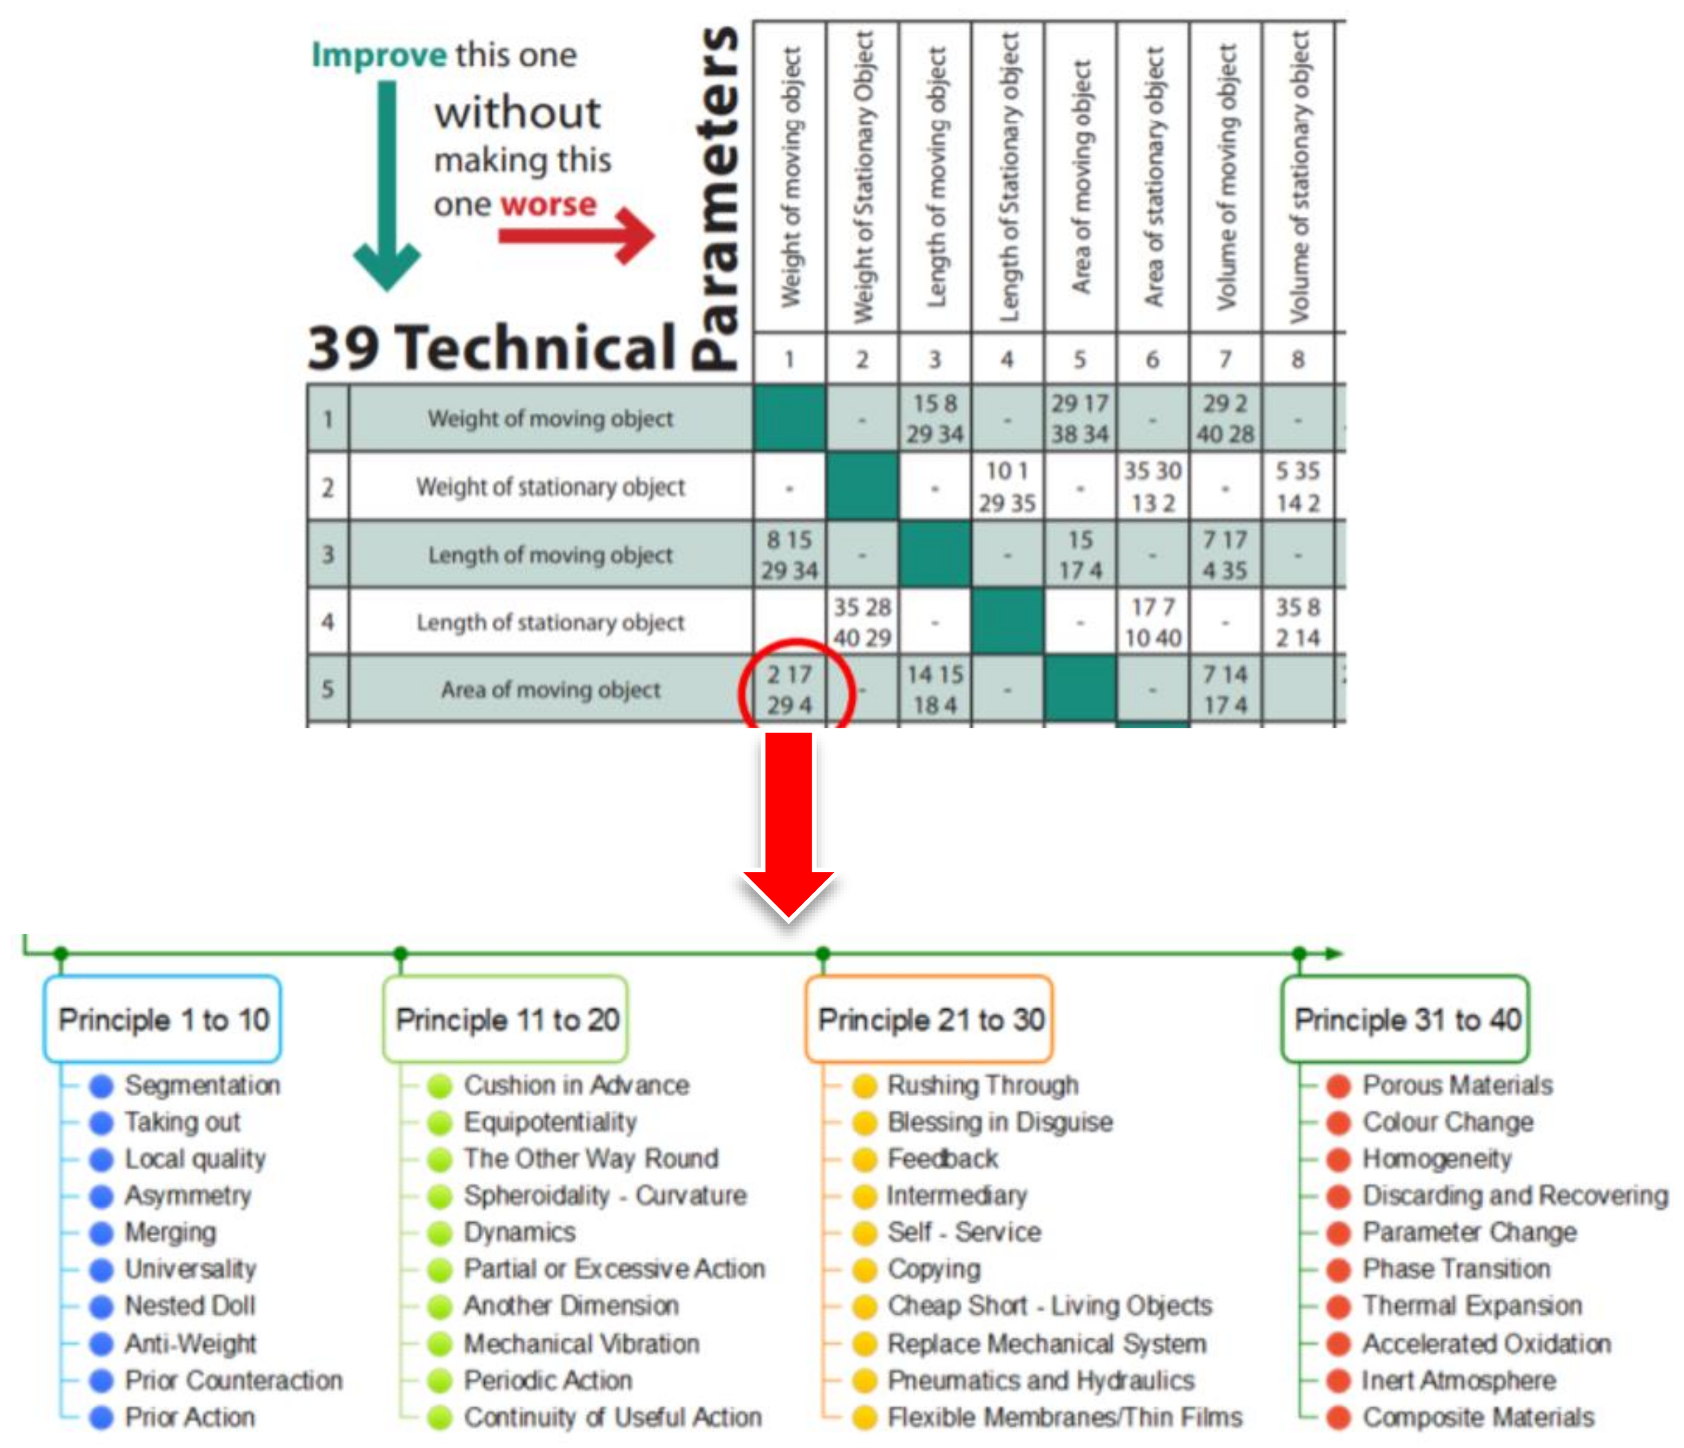
2.1.3. Solving Conflicts Using TRIZ Library

When contradictions arise during the design of products or processes, a trade-off between design parameters occurs. The traditional approach involves a brainstorming or trial-and-error process, resulting potentially in the inability to resolve contradictions beyond existing knowledge and experience. The integrated TRIZ/QFD process enables designers to examine the interdependencies between the functional requirements and help eliminate the contradictions associated with the strong negative relationships. TRIZ is a suite of tools that provides inventive inspiration for the designer—encouraging to look for existing solutions to similar problems at different scales and times. This allows the designer to adopt principles that might offer alternative, idealised solutions from other industries, countries, and times in history.
The 39 × 39 contradiction matrix, also known as the 39 engineering parameters, is one of the TRIZ tools implemented in the Structured Innovation tool. The matrix consists of 39 specific parameters that are presented based on their ability to either improve or worsen each of the other parameters and, thus, the design or operational conditions [30,32].
The TRIZ 40 inventive principles is another TRIZ tool that presents potential solutions to technical contradictions identified in the 39 × 39 contradiction matrix. The principles are based on patents and breakthrough inventions and aid the designer to achieve idealised solutions. The contradictions and inventive principles are generic enough to be applicable to various sectors, with each matrix cell pointing to inventive principles that have previously been used to resolve the contradictions. This means that the designers will evaluate how these principles apply to their specific system and the reason behind their choices.
Figure 3 represents an instance of using the contradiction matrix: the designer wants to increase the area of their device (improved feature), resulting in increasing the device’s weight (worsening feature). The 39 × 39 contradiction matrix guides the user to consider specific inventive principles for this particular contradiction—in this case, principles 2, 29, 17, or 4 are some of the suggested inventive principles to consider eliminating the contradictions.
Using the same tidal project example, if one of the functions to improve is reliability, but another is to lower manufacturing costs, these would have a strong negative relationship. The TRIZ 40 inventive principles recommend applying the following inventive principles, shown in Table 7. These principles are generic and vague. The designers will therefore develop specific solutions applicable to their designs. This requires a high level of expertise, creative thinking, and a multifunctional approach.
In the tidal project example in Table 7, inventive principles #13, #35, and #1 were recommended to solve the reliability and manufacturing costs conflicts. These principles are discussed below, with a simple example provided. In project scenarios, applying these principles requires a greater understanding of the problem and reasons behind the most application principle(s):
  • Inventive Principle #13—The other way round suggests inverting “the action(s) used to solve the problem; make movable parts (or external environment) fixed, or fixed parts movable; or the object (or process) upside down” [32]. This principle is already implemented in most floating substructures, for example, where moorings are either in tension or not, depending on the need for stability or repairs. If the project objective is to optimise the layout of devices and power cabling architecture for a tidal array, the designers could explore ways to apply these principles for the different operation cases (e.g., buoyant nacelles, tensegrity foundations, etc.).
  • Inventive Principle #1—Segmentation suggests “increasing the degree of an object’s segmentation by dividing an object into independent parts, making an object sectional, or increasing the degree of an object’s segmentation” [32,33]. The electrical architecture for tidal energy devices varies from device to device (e.g., different voltages, variable frequency output), encouraging segmentation or modular arrangement of device hubs. Applying this principle can enable modular manufacture and quick assembly and disconnection for servicing [54].
  • Inventive Principle #35Transformation of an object’s physical and chemical states entails “changing an object’s physical state to a gas, liquid, or solid; changing pressure or other physical parameters; changing the concentration or consistency; changing the degree of flexibility or changing temperature” [32,33]. For example, this principle has been investigated in the design of deformable blades, which are being investigated for tidal turbines to improve reliability [55].
In the wave energy example, the TRIZ library is used to determine alternative and innovative functional requirements to eliminate these conflicts. In this example, only the worst conflicting requirements were considered, summarised in Table 8, along with the TRIZ generic parameters and suggested inventive principles to consider. These inventive principles are challenging to apply to a high-level problem, as it is often easier to solve more defined problems with tighter boundaries; however, they could be of use if this process was applied to a certain wave energy device or subsystem.
Three inventive principles were suggested for the two contradicting functional requirements assessed in Table 8. These principles are suggested as innovative ideas to help designers consider possibilities to eliminate these contradictions. Thus, the following principles are assessed to identify the most appropriate for future development directions:
  • Inventive Principle #6 Multifunctionality or universality: For instance, when designing the physical structure of a wave energy device, one of the most important factors of the design is to maximise energy capture by considering interfaces that are intended to be joined (e.g., grouting a drilled anchor) and interfaces of those intended to be joined and unjointed as required (e.g., replacing components in maintenance). This principle suggests making parts of the design perform multiple functions or eliminating the need for other parts [56].
  • Inventive Principle #35 Parameter change: refers to the ability to change physical state, concentration or density, flexibility, temperature, volume, or pressure. For instance, design devices adaptable to various sea states (e.g., ability for turret moorings to adapt and adjust to different directions and alter natural frequency by changing wetted surfaces).
Where the two above suggestions demonstrate the method, it should be noted that the suggested inventive principles are generic and require thorough multifunctional analysis to determine innovative solutions during the solution conflict assessment.

2.1.4. Competitor Benchmarking and Ideality Assessment

The engineering benchmarking assesses the competitor current state-of-the-art achievements against the target values proposed for each functional requirement to determine how well the organisation meets the customer needs with respect to the functional requirements.
An ideality assessment is conducted to investigate if the proposed functions have already been implemented in state-of-the-art designs. The assessment also ascertains if the competition meets the engineering target values set: targets set too tight may eliminate the chances for innovation, but too broad might be unachievable due to the organisation’s impacts on implementing these concepts.
  • Defining Ideal Targets and the State-of-the-Art
At this stage, the team or the designer determines what ideal means for each functional requirement. For each potential area of innovation, target values are established. They can be obtained from state-of-the-art, commercial acceptance targets, ideal technology values, or benchmark data. These target values provide the quantitative specifications for each functional requirement to satisfy the customer requirements, supporting comparisons against the state-of-the-art and provoking innovation and invention processes.
The aspirational state-of-the-art values can drive innovation by identifying areas where innovation is required—and these areas can be considered the target values. In other words, an ideal state of a system is a system where all its functions are achieved with no harm caused.
The target values can also be obtained from the scenario creation tool, i.e., the upper/lower bound thresholds as curves of the SoTA based on what performance has been achieved in the past for various wave energy projects. This can inform the user as these can be either “target values” or SoTA values in the SI tool.
In the example presented in Table 9, the tidal reference model (RM1) data were extracted from the Reference Model Project sponsored by the US Department of Energy Wind and Waterpower Technologies Program [57]. Ultimately, these data can be extracted from various sources, including the expertise of multifunctional teams, the scenario creation tool, or other state-of-the-art datasets.
  • Assessing Ideality
The deviation from targets step compares competitor functional requirements to better understand the competition or where it is worth investing in. The competitor here refers to state-of-the-art leading-edge technology or design data, including the newest ideas or concepts. Have any of the functions been deployed elsewhere? Is it worth investing in one or more critical functional requirements? Are all functional requirements equally important? This step outputs the deviation of each competitor technology against the target values, highlighting in what SoTA technology the target has been met, exceeded, or not achieved (i.e., where improvement/innovation is needed). The team will investigate and prioritise the functional requirement(s) to assess further.
The percentage difference between the functional requirements and targets is one of the ways to assess how close current solutions are meeting one or more functional requirements. The example presented in Table 10 highlights the relative SoTA deviations from functional targets. In this example, a positive value (green) means that the SoTA exceeds the set target, and a value of zero (grey) means the target is met. A negative value (red) highlights where targets have not been achieved, emphasising areas of potential innovation. As always, there are trade-offs between meeting the various requirements.
For example, in this case, RM1 (DTOv2 star radial) surpasses the “manufacturing costs” target by nearly 8%, so there is no potential for innovation in that area. On the contrary, the target for the “reliability” is underachieved by 30%, so a large potential for innovation is identified.

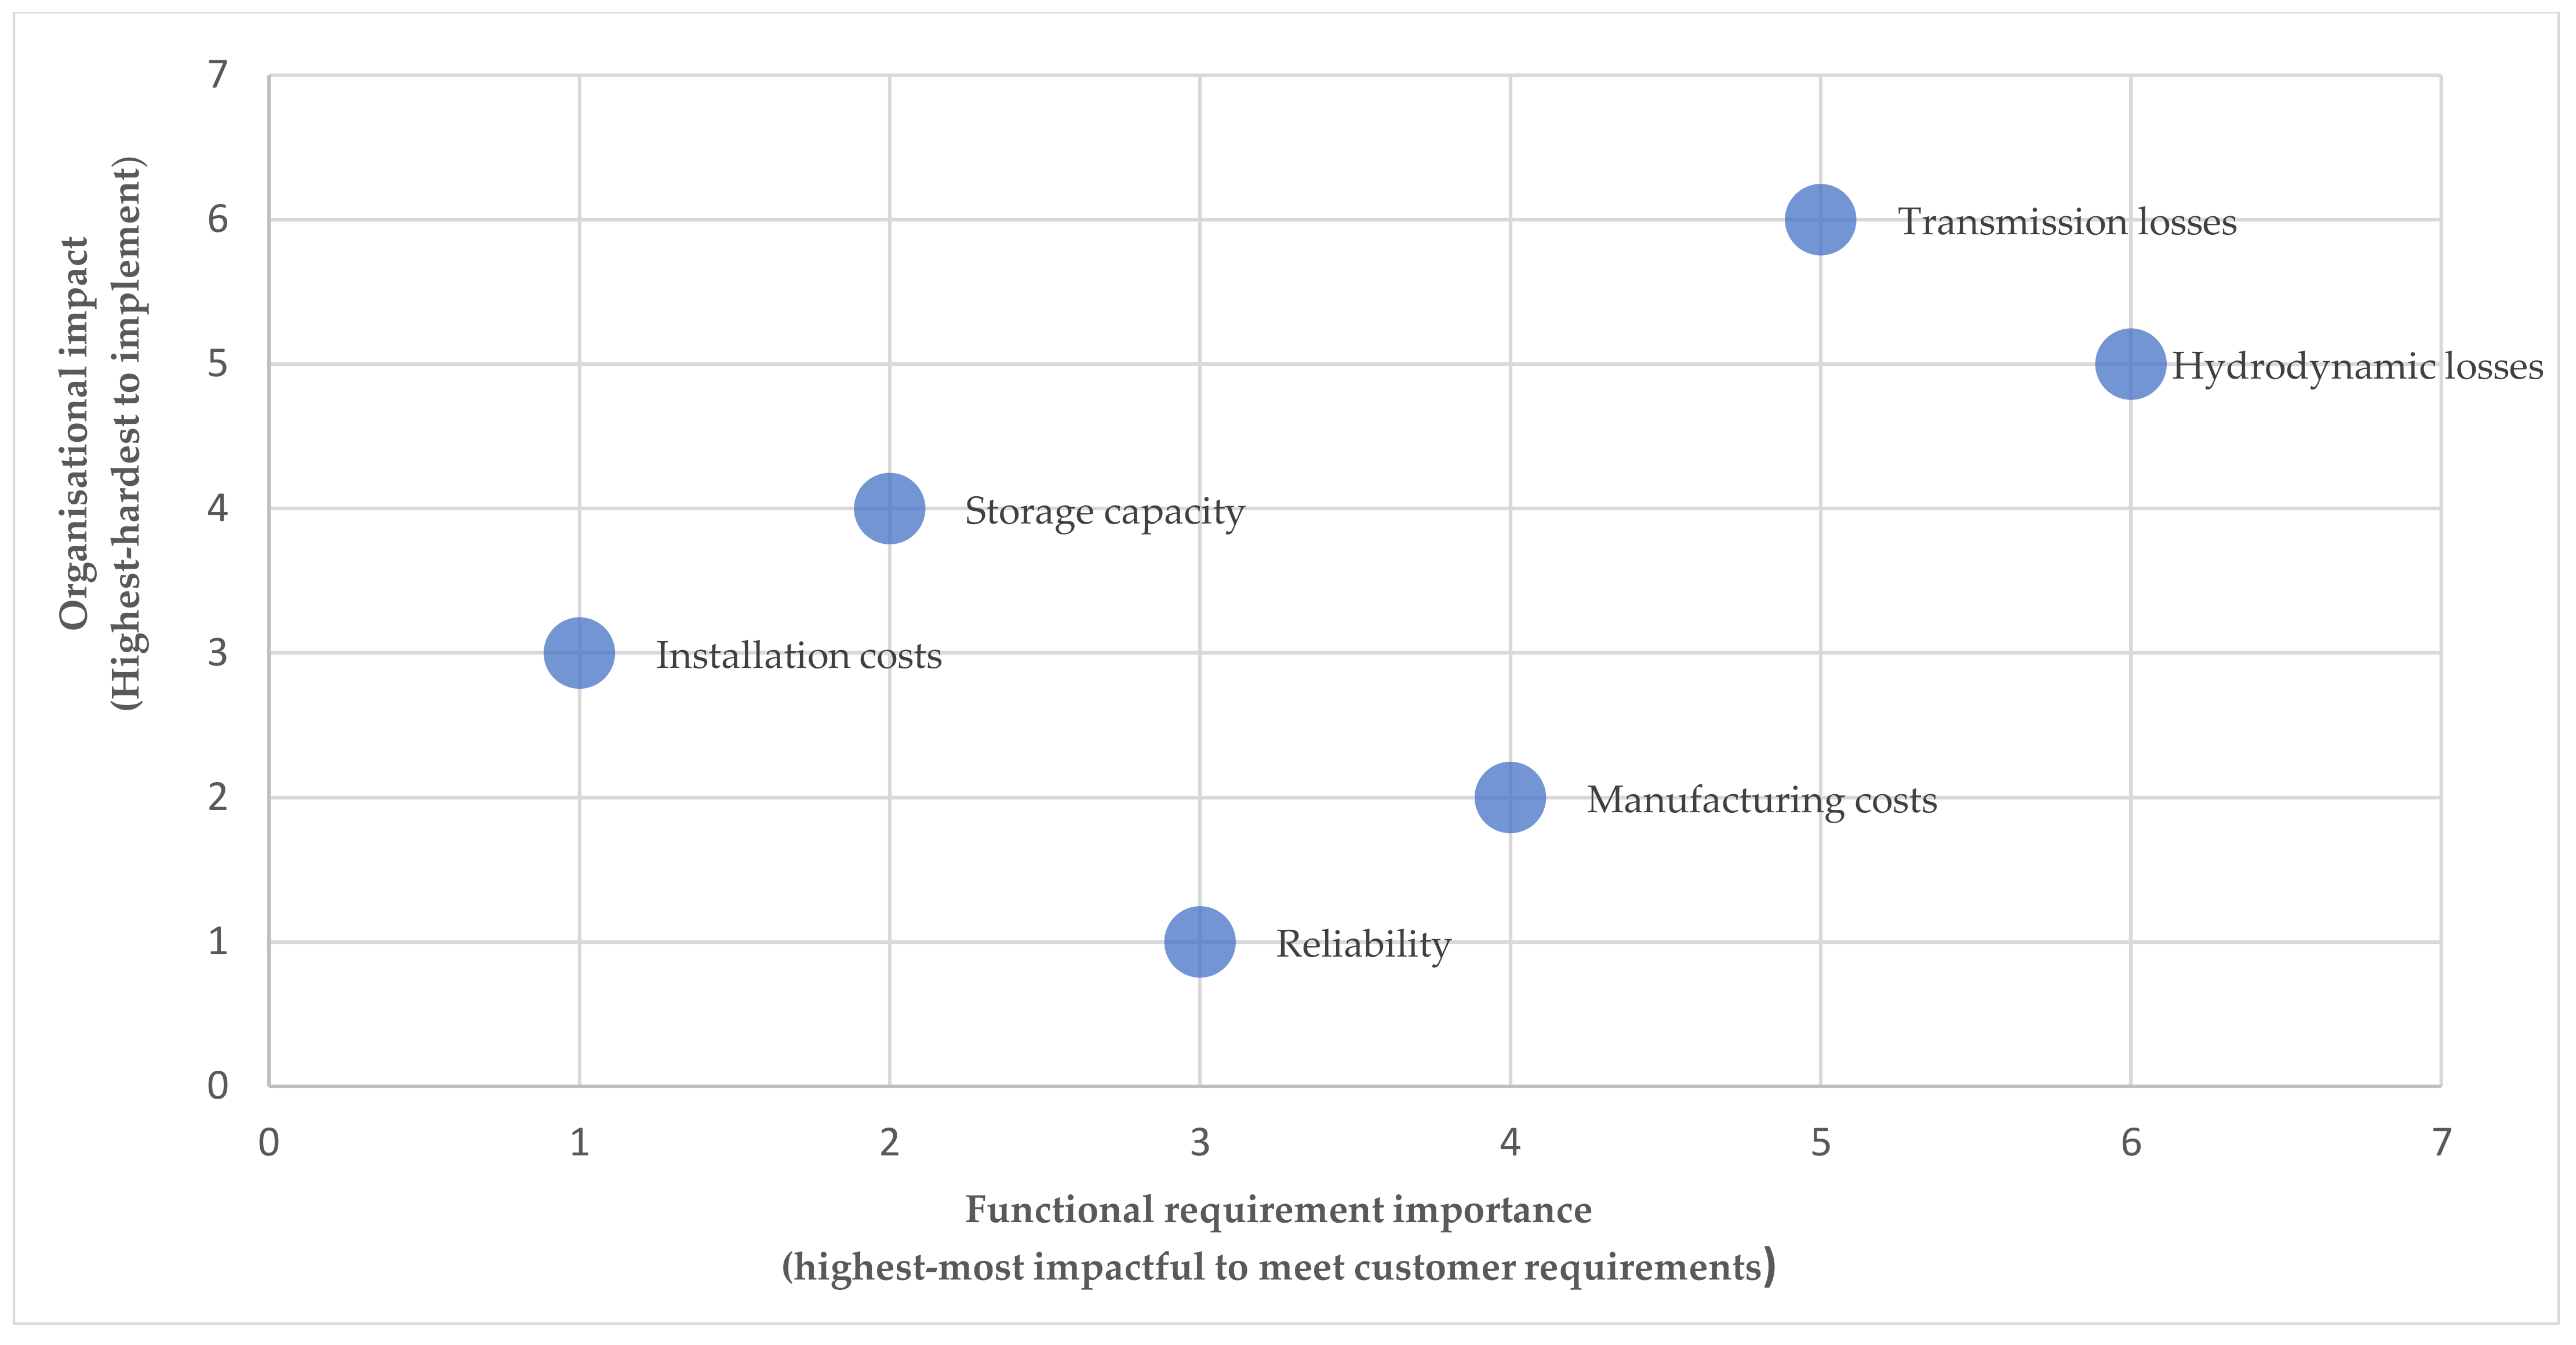
2.1.5. Organisational Impact Assessment

In this step, the team or the designer rates the organisation’s effort to engineer and deliver (i.e., secure skills, resource, supply, finance, etc.) such requirements at or beyond the target set. The designer is required to consider the efforts required for the organisation to implement the ideal functions. The tool provides a predefined scale (very high (5)–very low (1)). An example of the organisation impact assessment is shown in Table 11. In this instance, the organisation has the capability and capacity to implement the target set for reliability; however, achieving the set target for transmission losses will be the most difficult.

2.1.6. Proposed Critical Functional Requirements for Further Assessment

When the QFD/TRIZ process is completed, the following is captured:
  • Customer requirements (and importance) to define the innovation design space.
  • Functional requirements, with measurable target values, to meet or exceed the customer requirements.
  • Interactions between functional requirements.
  • The organisational effort to engineer and deliver such requirements at or beyond the target set.
  • Benchmarking of competing state-of-the-art designs (leading-edge technology or design data, including the newest ideas or concepts across the sector) to understand the extent to which each of the proposed functional requirement targets has been met elsewhere.
Concept designs can therefore be created with confidence that all key requirements have been fully considered. The team of designers can understand whether it is worth investing in developing novel solutions to meeting particular requirements and can prioritise important innovation areas based on:
  • The importance of the customer requirements.
  • The functional requirements that would be most likely to disrupt the market.
  • The organisational effort to engineer and deliver these requirements (i.e., to secure the skills, resources, supply, finance, etc., required to deliver).
The critical functional requirements are those with the highest overall impact and the least organisational effort to implement. Reviewing these rankings allows the designers to understand the relative importance and impact of the functional requirements.
In the tidal energy example shown in Figure 4, reducing “hydrodynamic losses” is seen as one of the most critical functional requirements to meet the customer requirements. However, based on the organisation’s capabilities, this is also one of the hardest functional requirements to implement due to the limitations of engineering and/or delivery capabilities. Therefore, the designers should consider other value-added areas beyond the state-of-the-art with the lower organisational impact contributing to the intended targets and customer needs.
Once the critical functional requirements are defined, the designer can choose to:
  • Repeat the TRIZ process to consider and compare two or more potential innovative approaches to meeting the defined requirements.
  • Assess the technical risks associated with the selected functional requirements using FMEA.
  • Refine the functional requirements into more detailed and specific requirements by diving deeper into QFD/TRIZ analysis to obtain concept designs that meet the customer requirements (more information can be found in [46,48]).
  • Use the Design and Assessment tools of the DTOceanPlus suite to develop detailed designs for the concepts created in this Structured Innovation tool and then assess their potential deployment to specific sites.

2.2. Additional Methodological Modules and Interactions

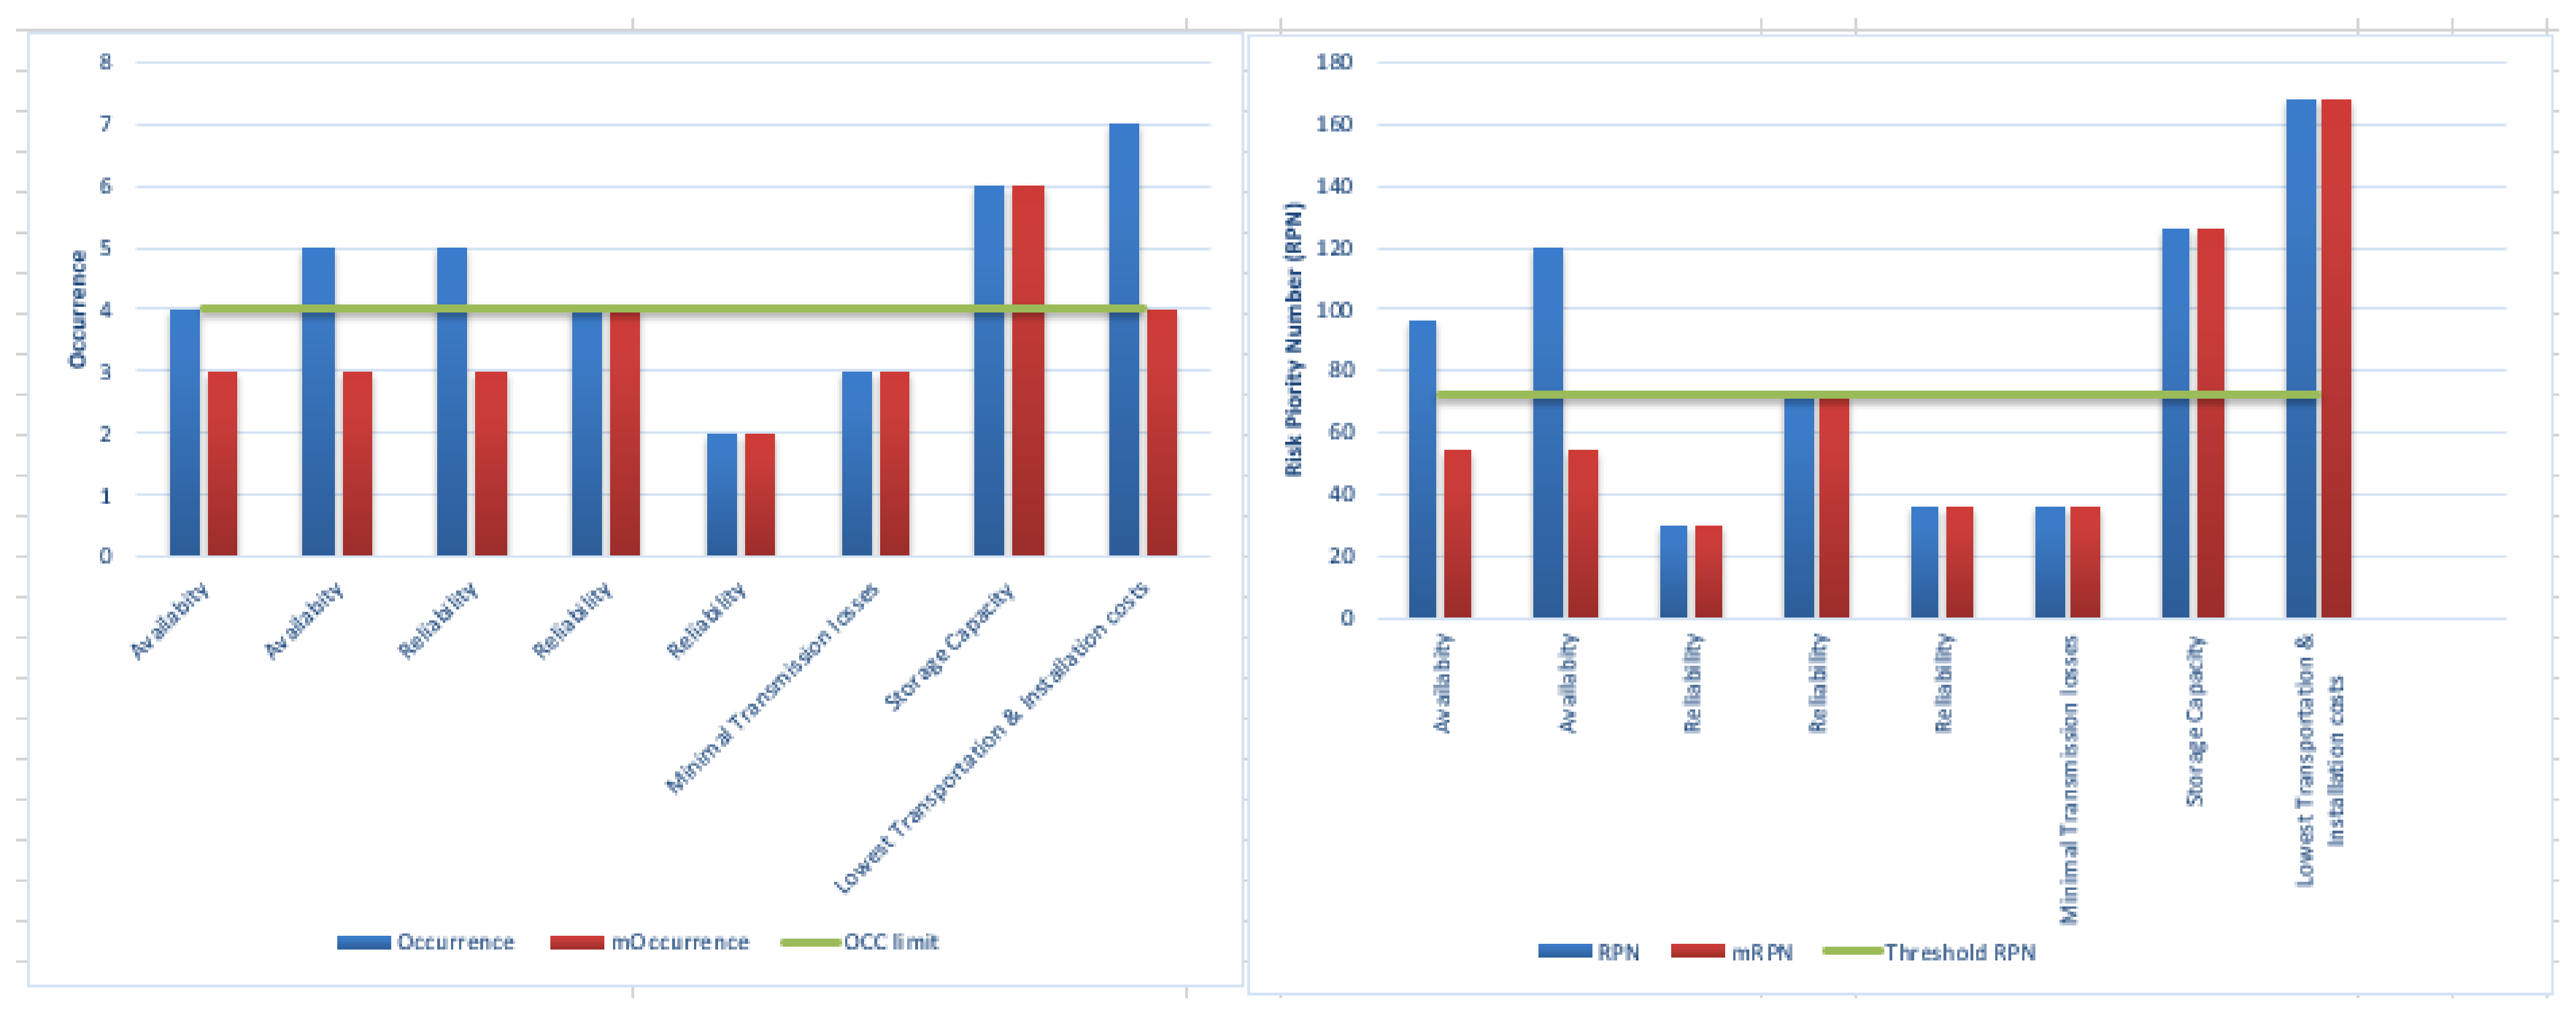
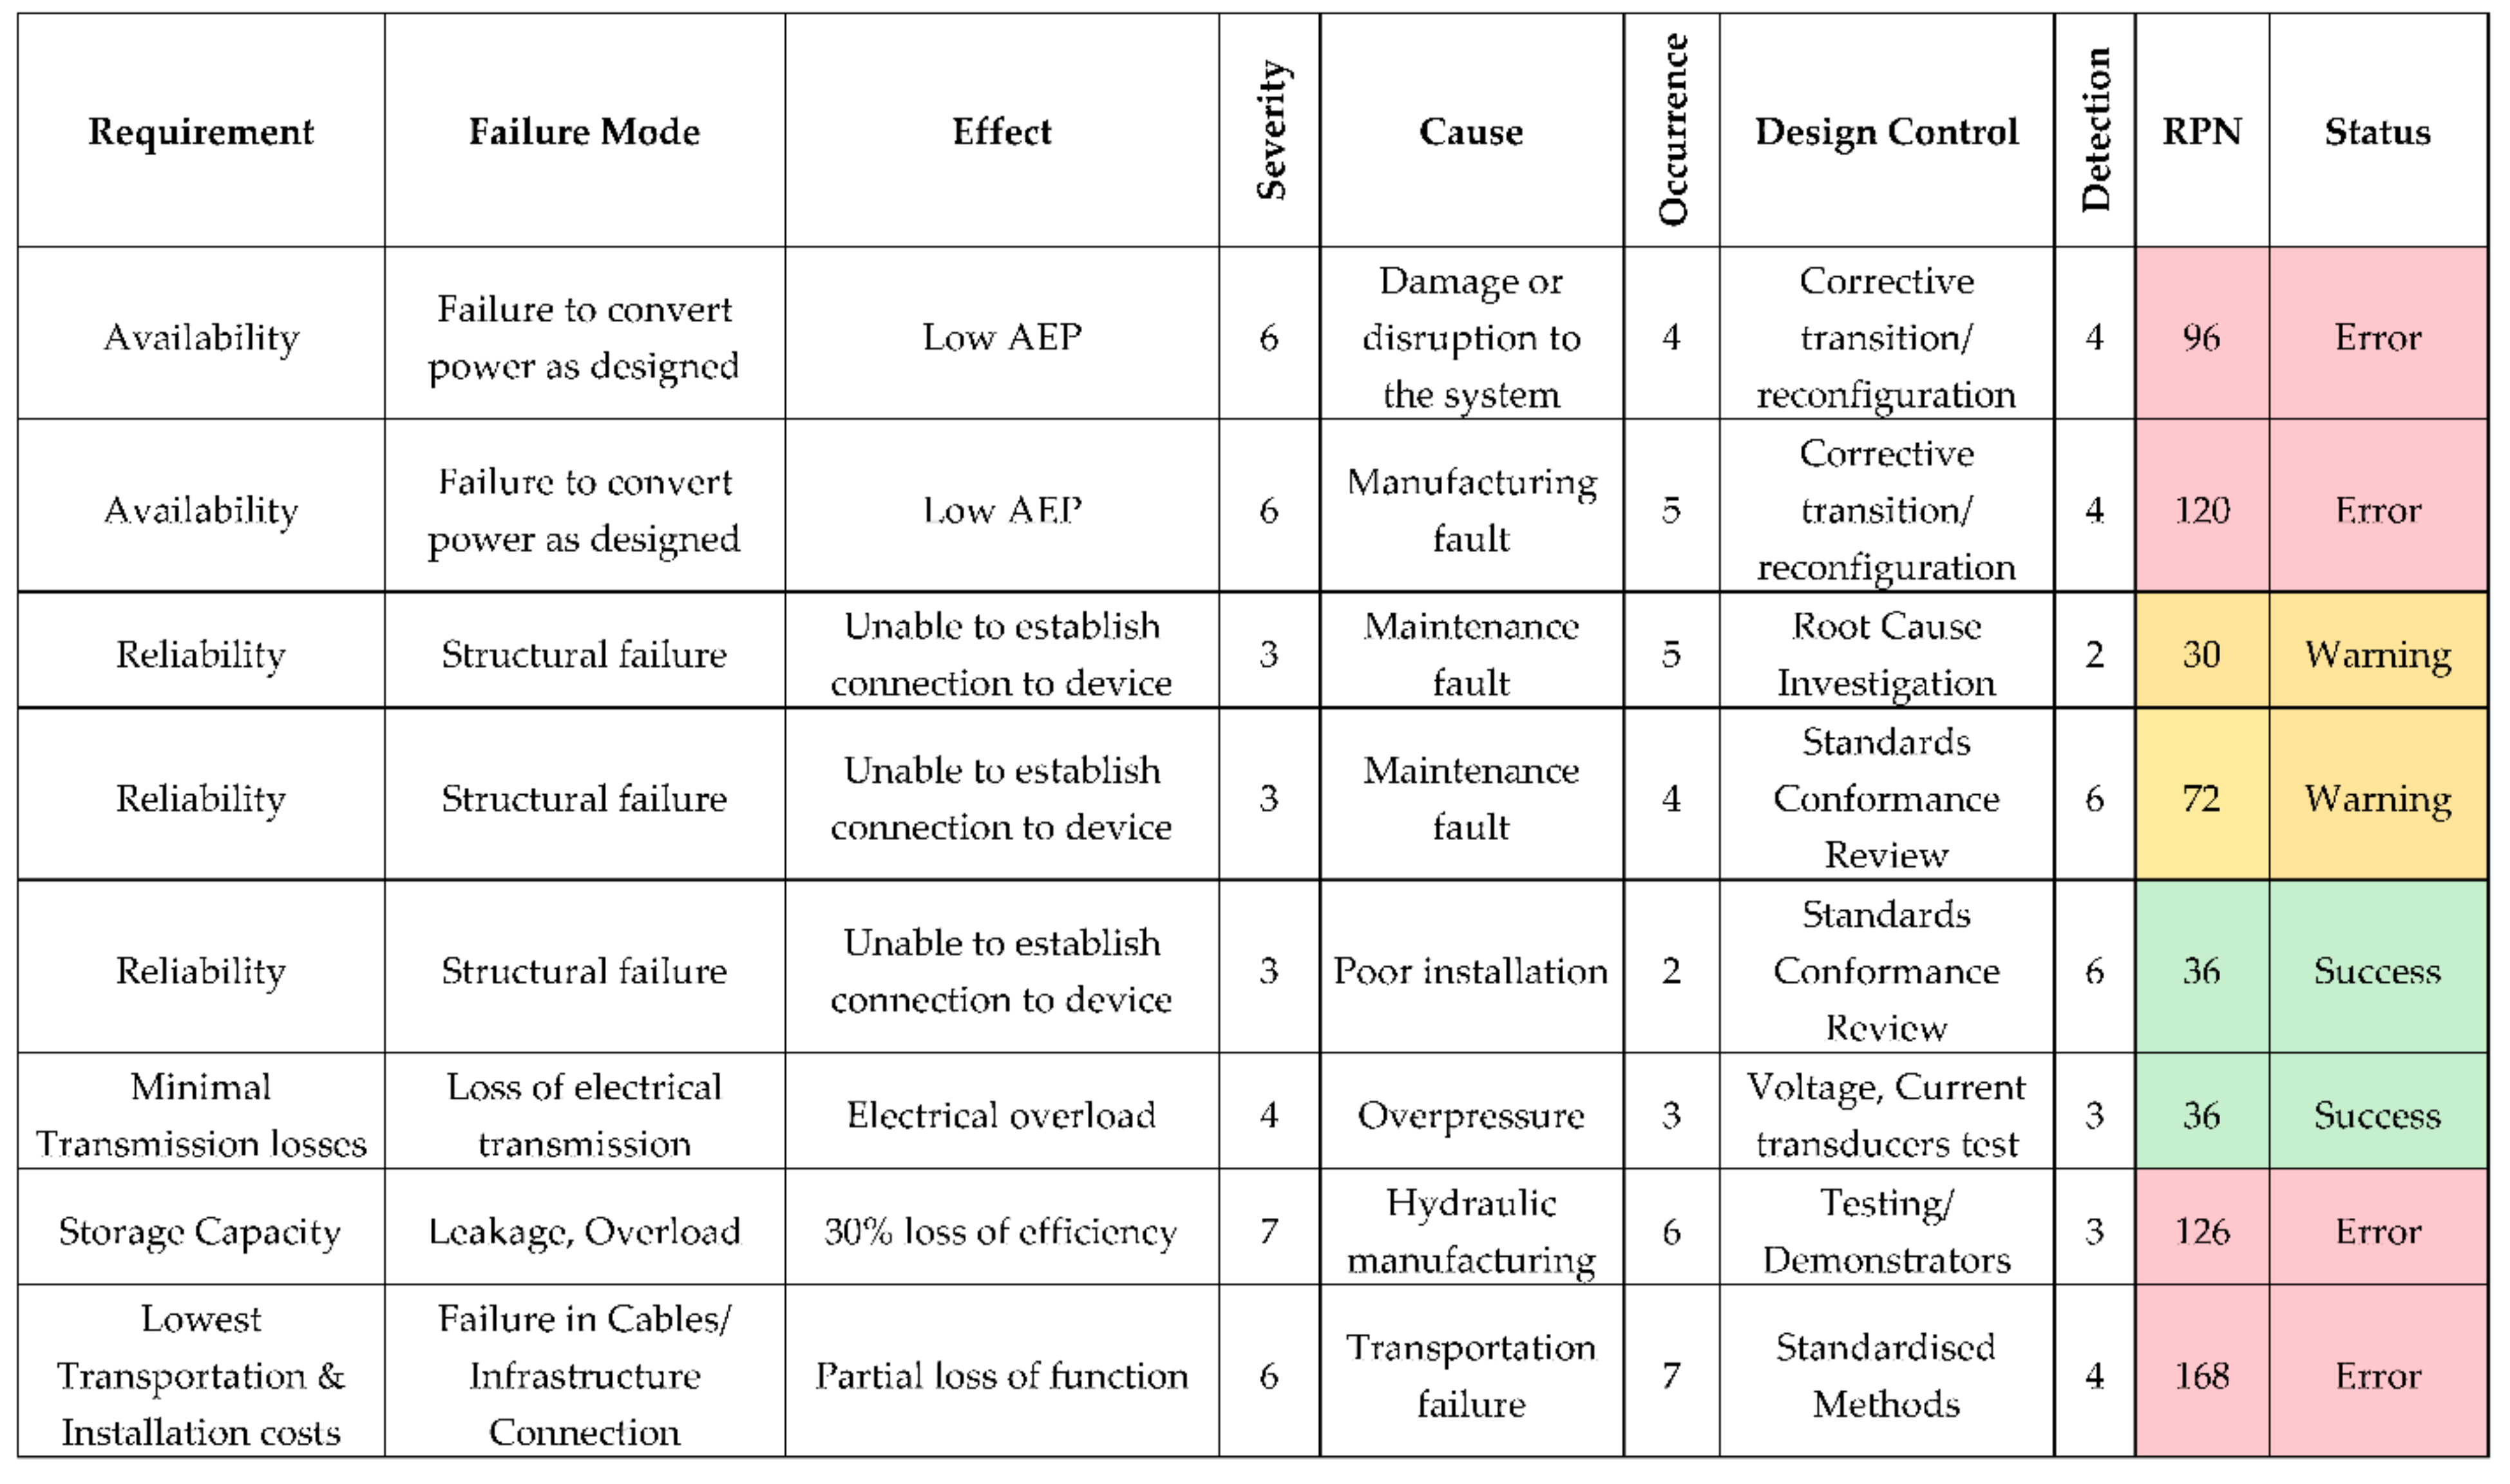
2.2.1. Risk Mitigation Using FMEA

Widely used in engineering design, the failure mode and effect analysis (FMEA) methodology identifies and eliminates potential system failures. It provides a means to compare various system configurations by identifying possible root causes of failure(s), failure modes, and estimation of relative risks, to drive higher reliability, quality, and enhanced safety [58]—the tool aids in developing robust design and control measures to prevent potential failures from occurring.
In the developed Structured Innovation tool, the designer can initiate the FMEA module to systematically assess and mitigate potential risks associated with the proposed new or improved functions(s). The criticalities of failures are determined using the Risk Priority Number (RPN), a product of the severity, occurrence, and detection rankings associated with each potential failure. A threshold RPN and occurrence limit are set beyond which an intervention/mitigation is needed. This enables prioritising risks and proposing suitable follow-up corrective actions to reduce the criticality of potential failures.
When corrective actions cannot be implemented to eliminate or reduce the RPN and/or occurrence below the defined threshold/action level, as shown in Figure 5, alternative innovative solutions are sought using the integrated QFD/TRIZ process to obtain specific actions for the system (e.g., proposed design review, enhanced material properties, measures implemented in other sectors). Detailed step-by-step procedures can be obtained from [16,46]. These corrective actions can implement further design controls for early risk identification (e.g., sensing) and protection (e.g., device settings). An example is presented in Figure 6.

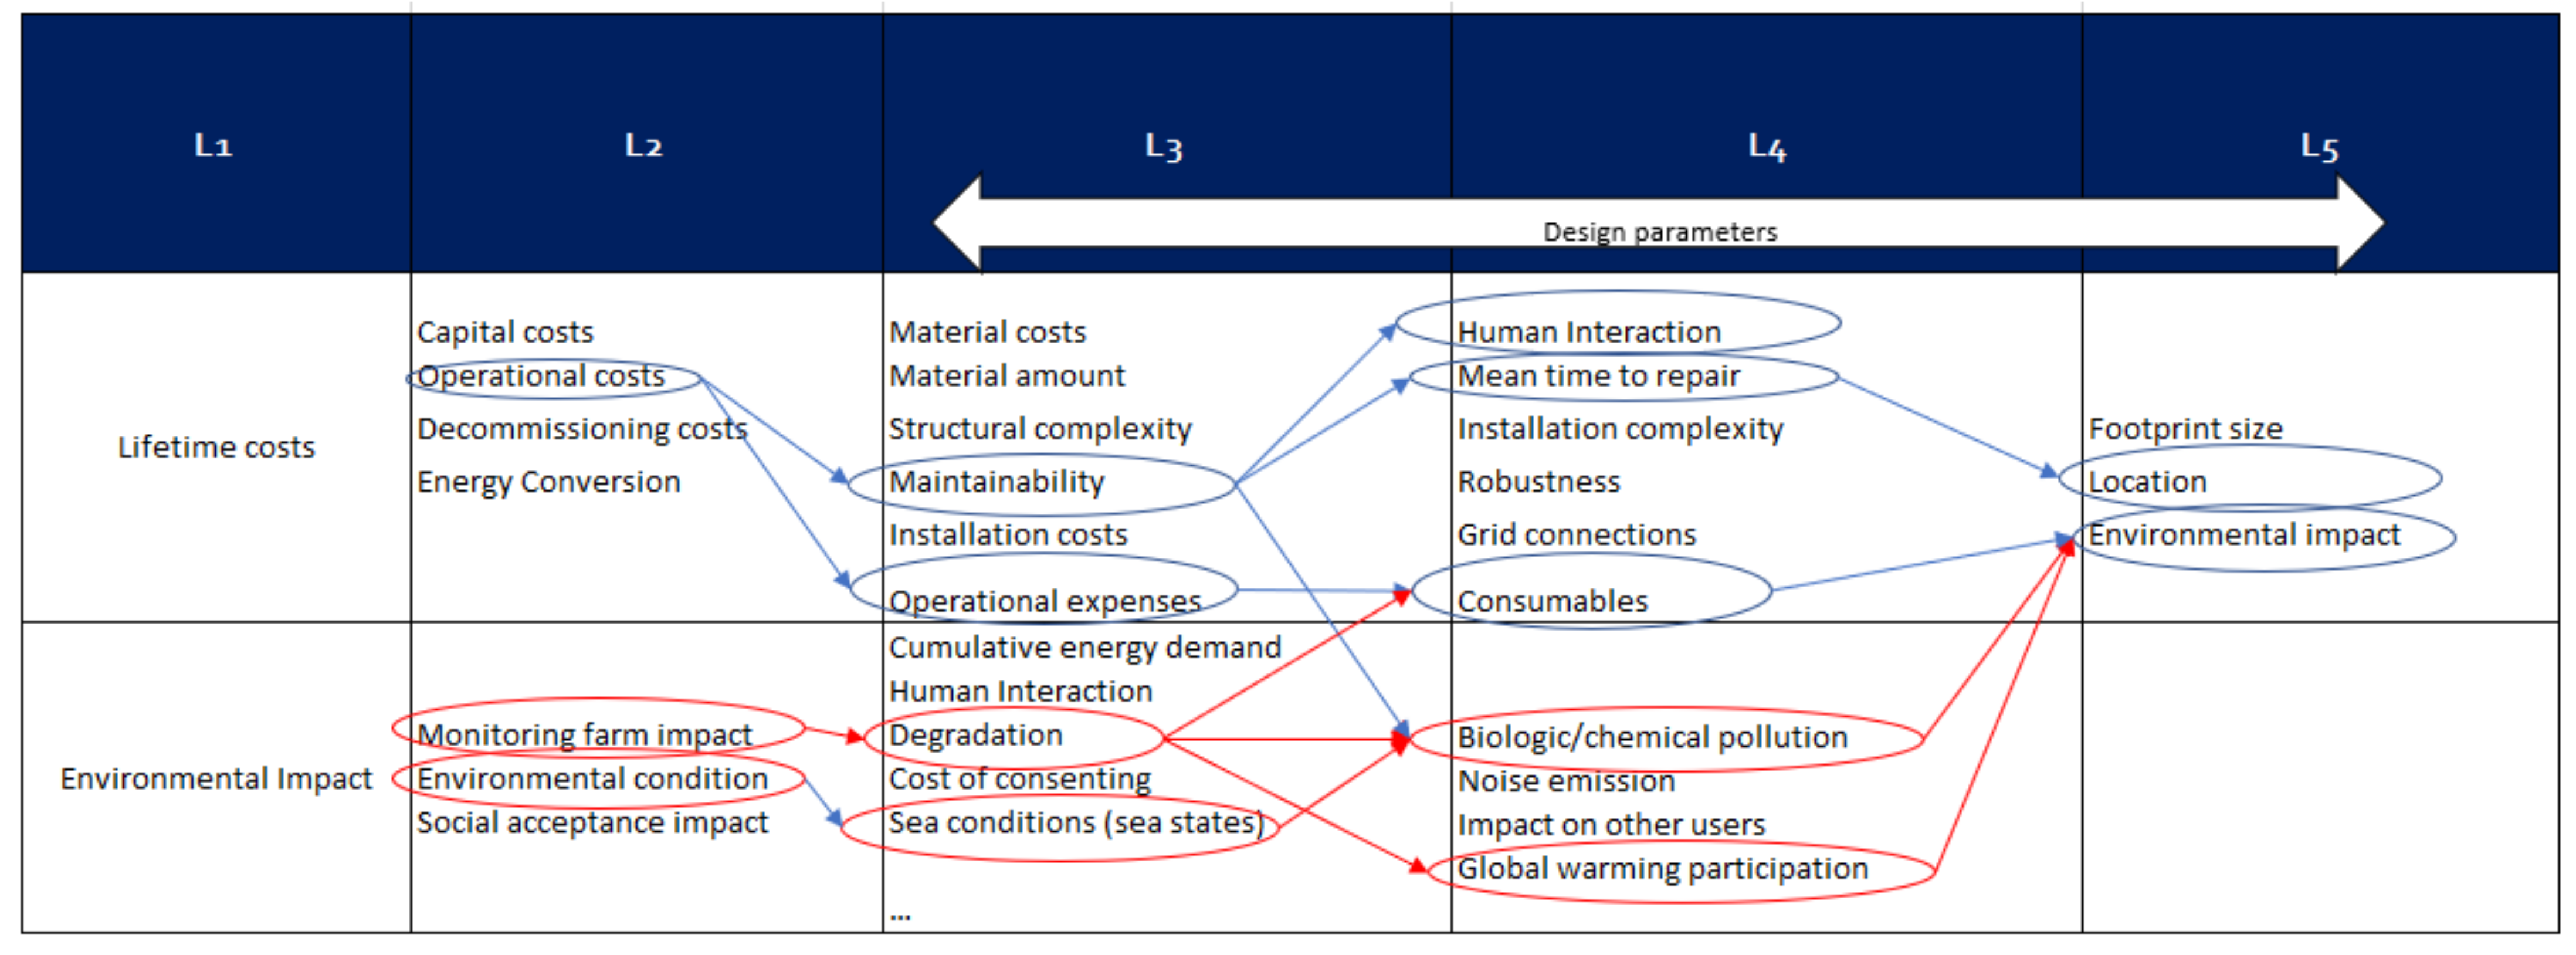
2.2.2. Solution Hierarchy

The solution hierarchy can aid the designers in “the definition of functional requirements”, “determining impact and interdependencies”, and “solving conflicts”. It has been developed in five levels for ocean energy projects, starting with the energy trilemma as requirements: delivering secure, affordable, and environmentally sustainable energy; and lists potential solutions for each requirement. The hierarchy was developed using various literature and multifunctional expert inputs.
The example in Figure 7 shows several design selection decisions for the first two level requirements, lifetime cost and environmental impact. The example is associated with (1) reducing the operational costs whilst (2) keeping the environmental impact minimal. Note that functional requirements are what the customers want to achieve or what functions a design need to satisfy. Levels 1 and 2 of the solution hierarchy describe these functional requirements—e.g., ability to monitor farm impact, low operational costs, etc. In levels 3, 4, and 5, the design parameters, which are determined by a team of experts, and will have a direct impact in achieving these functional requirements (e.g., CO2 emissions, material strength, and mean time to repair), are defined.
Following the example, at level 5, a link between the mean time to repair and location can be observed. The designers have flexibility over the design parameters in levels 3 to 5, with external stakeholders and legislation influencing the top two levels. The list of the solution hierarchy developed in the Structured Innovation also is presented in [48]. However, this hierarchy is not exhaustive and can be expanded to include further detailed design parameter levels, as it intends to help the team of designers consider multiple design parameters.

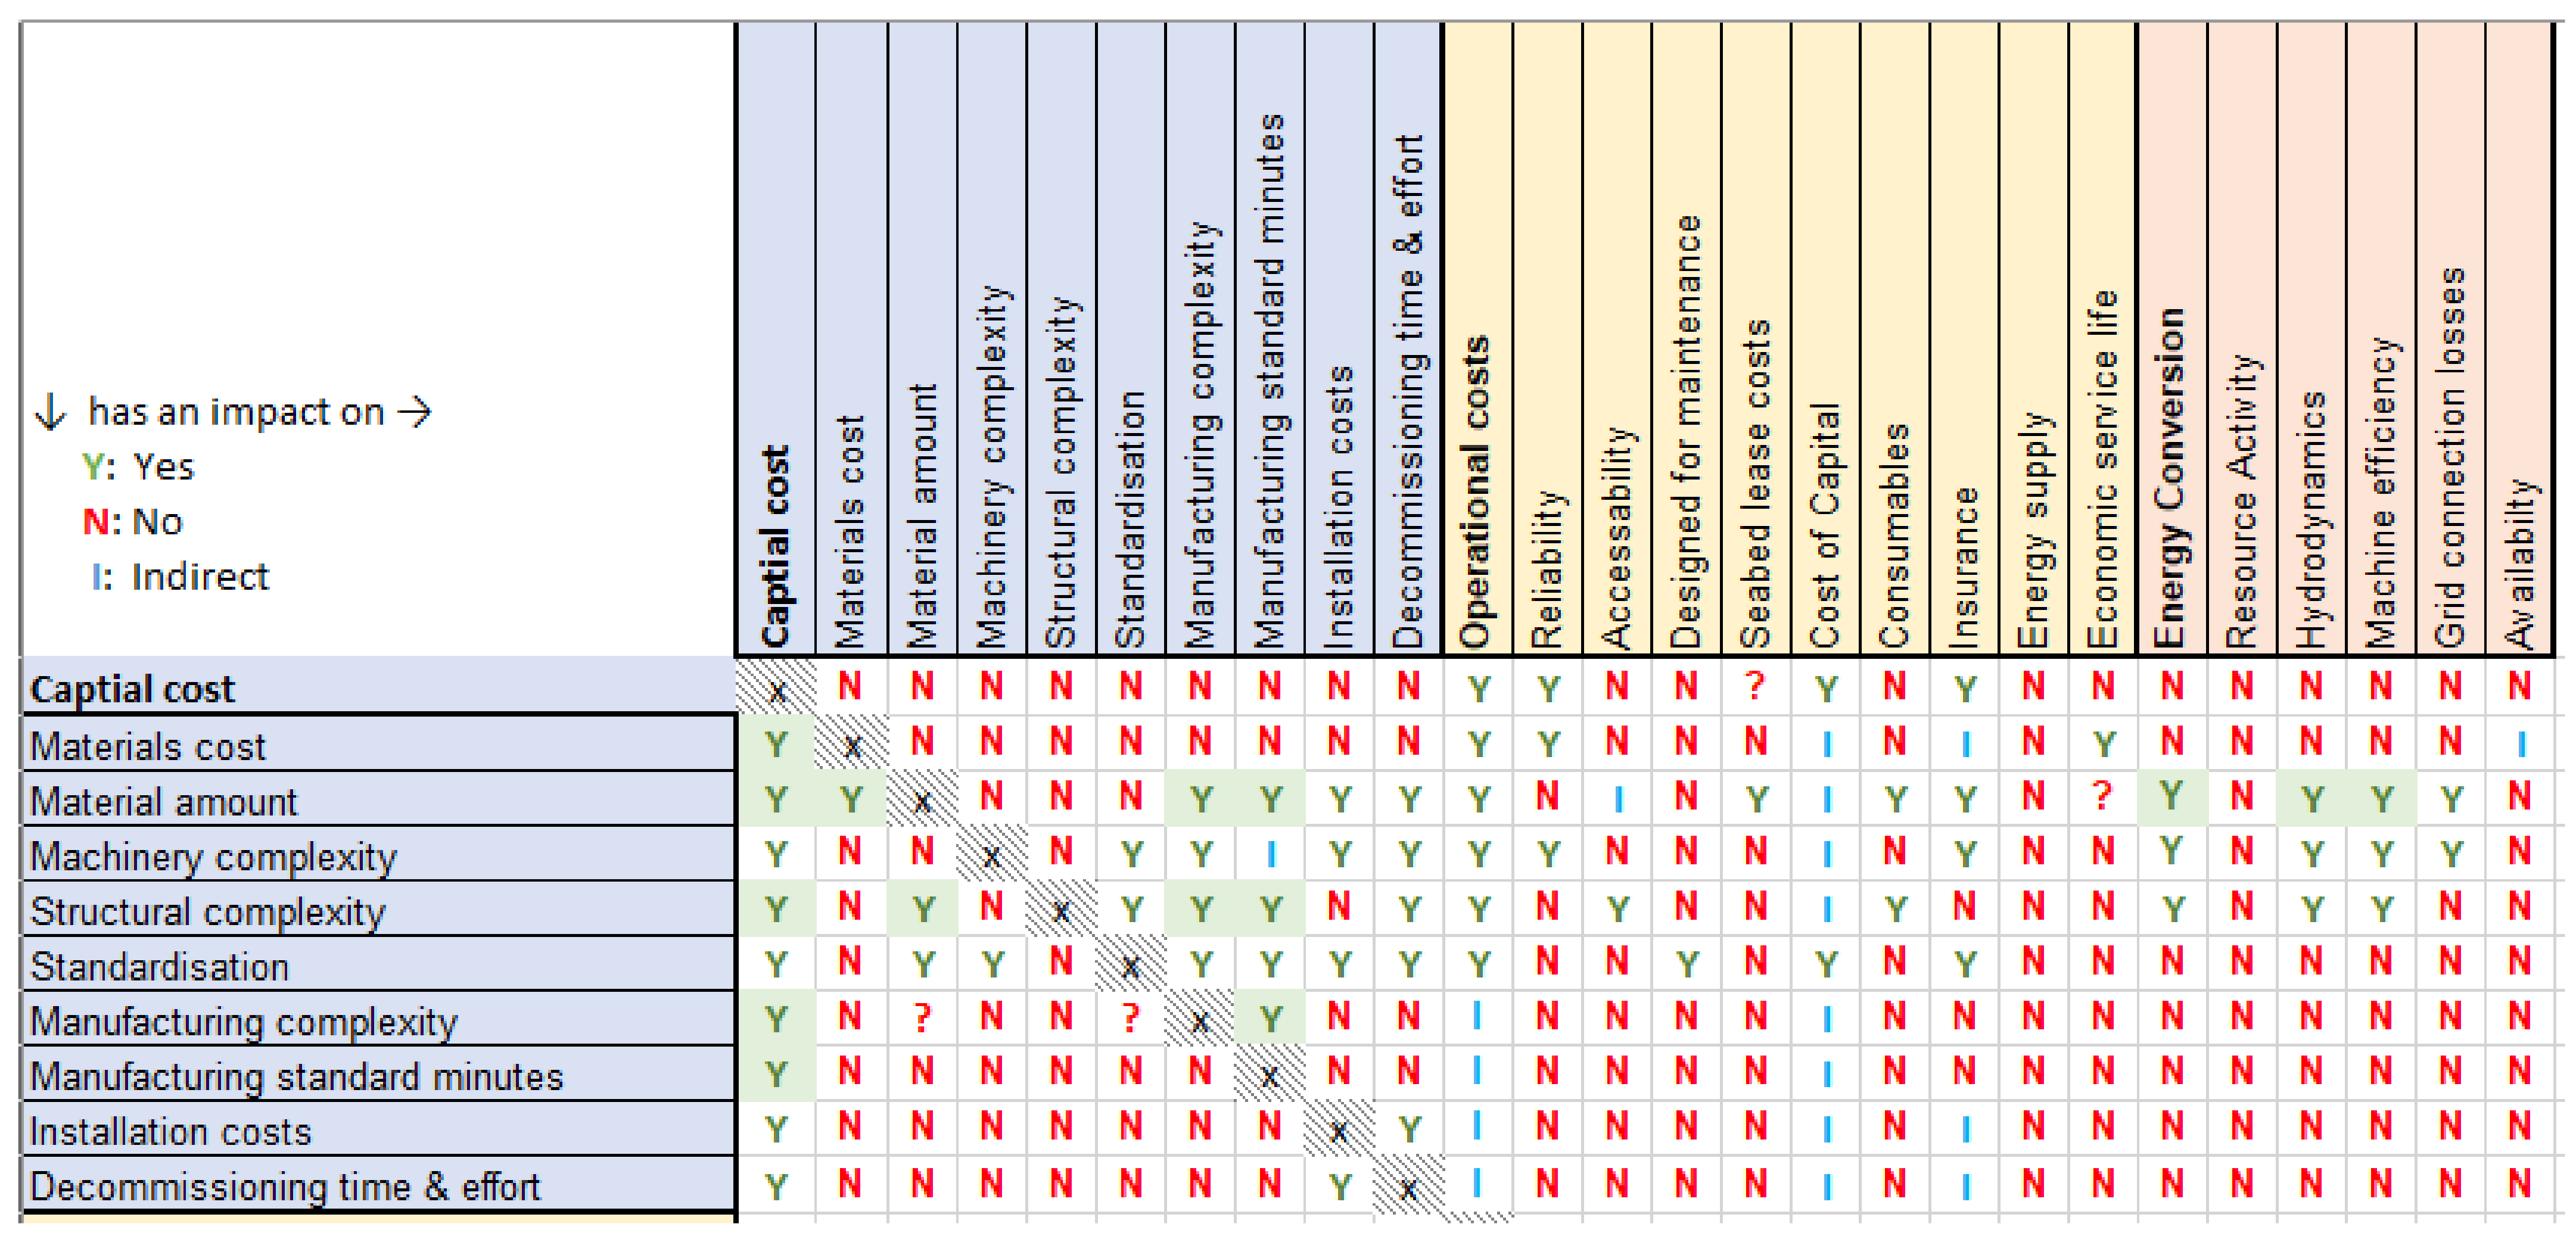
2.2.3. Fundamental Relationships

At the earliest stage of technology development, there is usually little-to-no data available. This makes it difficult for the user to calculate complex metrics such as LCOE or assess how some functional requirements and design parameters may relate under different conditions, such as power produced and device size. For this reason, the approach suggested here leverages fundamental relationships between key design parameters in ocean energy concepts. These provide context to the team performing the structured innovation exercise to recognise interdependencies and conflicting objectives, as shown in step 2 of Figure 1. Fundamental relationships are defined here as “the engineering, physics, and economic relationships which drive the earliest stages of assessing the attractiveness of concepts” [46,53].
To identify and define the fundamental relationships, two main steps were followed. Firstly, the interdependencies between functional requirements were identified by systematically recording a relationship existence or inexistence in a solution hierarchy matrix, based on levels 2 and 3 of the “lifetime costs” requirement. This matrix was independently filled through expert assessment, and a single combined matrix was then derived through discussion amongst those experts. A snapshot of the solution hierarchy matrix is shown in Figure 8.
Secondly, specific relationships were selected based on the available tools and data to define those fundamental relationships. The ones where it was considered that fundamental relationships could be defined were highlighted in green, as shown in Figure 8. For example, a relationship between device scale (i.e., material amount) and costs (i.e., material costs) had been derived in [50]. To generate fundamental relationships of power produced (i.e., energy conversion) to cost, relationships between power produced and scale needed to be generated. This was done with the help of a wave energy converter hull shape multi-objective optimisation approach developed in [59,60]. The optimal trade-off between power produced and scale was found through this optimisation approach depending on wave energy converter geometry, mode of motion for power extraction, and resource level. An example of a fundamental relationship generated with this method is shown in Figure 9. This figure shows how, given an optimal hull geometry definition and assuming an optimal PTO, the mean annual produced power will increase with device scale. Further detail on the method used to generate these relationships and example relationships can be found in [50,53].

3. Conclusions

Structured innovation approaches are needed to achieve the unprecedented innovation required to reduce the costs of novel renewable energy-generating technologies, such as ocean energy technologies, to achieve the net-zero targets. To address this need, existing approaches for structured innovation of products were leveraged to create a Structured Innovation design tool for ocean energy technologies. The quality function deployment (QFD), the theory of inventive thinking (TRIZ), and the failure modes and effects analysis (FMEA) were combined for the first time to provoke innovation and help represent the voice of the customer through the design process, manage risk, and produce new concepts. The proposed combined QFD/TRIZ process within the Structured Innovation tool helps users take a thorough approach while speeding up the process of finding new solutions to the customer needs.
The method was demonstrated with two case studies representing the analysis of solutions for functional requirements of two ocean energy technologies: wave energy and tidal stream technologies. The analysis in the case studies was based on a combination of internal and external qualitative and quantitative data to demonstrate the strengths of using the Structured Innovation tool. The combined QFD/TRIZ method was shown to support designers in assessing combinations of functional requirements that result in possible, attractive, and achievable scenarios.
Furthermore, it was shown how this Structured Innovation tool can be further exploited by combining it with additional tools and data such as the scenario creation tool and the fundamental relationships. In this case, it was demonstrated how these can guide the designers with technologies at earlier stages of development or in defining relationships between the functional requirements. For the wave energy case study, the cause-and-effect relationships between the customer and functional requirements were determined using expert knowledge and the developed fundamental relationships. In the wave energy case study, data from the scenario creation tool was used, including material, state-of-the-art, and target data.
Through the demonstration of the Structured Innovation tool with two case studies, the advantages of integrating TRIZ in the QFD process are highlighted. The tool demonstrates that integrating and adapting solutions from the TRIZ toolset provides a systematic and structured approach to support design optimisation and obtain innovative solutions at a system or subsystem level whilst exploring solutions that address conflicting objectives.
For future applications of this tool, it should be noted that the process of defining a preliminary focus of the study is critical to understanding customer needs and requires multilevel interactions with multidisciplinary teams to provide different experiences, perspectives, and insights. These multidisciplinary teams need to be capable of translating the customers’ needs into functional requirements that will meet or exceed customer expectations. To establish the functional requirements, the designers can use internal databases such as the solution hierarchy or external tools and datasets to support the analysis. The integrated QFD/TRIZ approach enables the designers to gain insight into the most critical functional requirements, conflicts and interactions, and impact on achieving potential innovative solutions. Therefore, technology and project developers can use the tool to find innovative and improved designs, funding bodies to assess the suitability of the proposed solutions and identify areas with potential for innovation, and academia and research institutes to create new or improved concepts.

Author Contributions

Conceptualisation, I.T.; methodology, I.T., A.G.-T. and J.H.; writing—original draft preparation, I.T.; writing—review and editing, I.T., A.G.-T., D.R.N., and J.H.; visualisation, I.T., A.G.-T. and D.R.N.; All authors have read and agreed to the published version of the manuscript.

Funding

This work was performed under the European Union’s Horizon 2020 research and innovation programme under grant agreement No 785921, project DTOceanPlus (Advanced Design Tools for Ocean Energy Systems Innovation, Development and Deployment).

Acknowledgments

The authors wish to thank Stuart Bradley for his exceptional support and advice in sharing his knowledge and insights of the sector and the methodologies. Thanks are also due to Jonathan Hodges and Pablo Ruiz-Minguela for various discussions and support throughout this project.

Conflicts of Interest

The authors declare no conflict of interest.

References

  1. Ocean Energy Europe. 2030 Ocean Energy Vision—Industry Analysis of Future Deployments, Costs and Supply Chains. 2020. Available online: https://www.oceanenergy-europe.eu/wp-content/uploads/2020/10/OEE_2030_Ocean_Energy_Vision.pdf (accessed on 7 April 2021).
  2. EMODnet. European Marine Observation and Data Network, European Commission. Available online: https://www.emodnet-humanactivities.eu/view-data.php (accessed on 31 August 2021).
  3. Corsatea, T.; Magagna, D. Overview of European Innovation Activities in Marine Energy Technology; Publications Office of the European Union: Luxembourg, 2014. [Google Scholar]
  4. Tunga, I.; Yates, M.; Vyas, A.; Briggs, S.; Eraut, N.; Ruiz-Minguela, P.; Salcedo, F.; Noble, R.; Hodges, J.; Marques, M.; et al. Developing Ocean Energy Standards for Business Management Models in Ocean Energy; DTOceanPlus: Bilbao, Spain, 2021. [Google Scholar]
  5. CorPower Ocean. Clean Energy from Our Oceans, CorPower Ocean. Available online: https://www.corpowerocean.com/about-us/ (accessed on 4 September 2021).
  6. Bombora. Learn More about Bombora, Bombora Wave. Available online: https://bomborawave.com/about-us/ (accessed on 4 September 2021).
  7. Wave Energy Scotland. Wave Energy Scotland-Driving the Development of Wave Energy Technology in Scotland. Available online: https://www.waveenergyscotland.co.uk/ (accessed on 4 September 2021).
  8. Orbital Marine Power. Turning the Tide on Climate Change, Orbital Marine Power. Available online: https://orbitalmarine.com/ (accessed on 4 September 2021).
  9. Nova Innovation. Tidal Energy—Transforming the Power of Our Seas into Clean, Predictable Energy, Nova Innovation. Available online: https://www.novainnovation.com/ (accessed on 4 September 2021).
  10. ITEG. Integrating Tidal Energy into the European Grid, Interreg North-West Europe. Available online: https://www.nweurope.eu/projects/project-search/iteg-integrating-tidal-energy-into-the-european-grid/ (accessed on 4 September 2021).
  11. EnFAIT. Enabling Future Arrays in Tidal. Available online: https://www.enfait.eu/partners/ (accessed on 4 September 2021).
  12. Junginger, M.; Louwen, A. Technological Learning in the Transition to a Low Carbon Energy System, Conceptual Issues, Empirical Findings, and Use in Energy Modelling; Elsevier: Amsterdam, The Netherlands, 2020. [Google Scholar]
  13. Noble, R.; Kerr, P.; Talukdar, S.; Cantarero, V.M.; Jeffrey, H.; Ruiz-Minguela, P.; Grispiani, L.; Tunga, I.; Hodges, J.; Henderson, J.; et al. Feasibility and Cost-Benefit Analysis- Deliverable D8.3; DTOceanPlus: Bilbao, Spain, 2021. [Google Scholar]
  14. Kerr, P.; Noble, D.; Hodges, J.; Jeffrey, H. Implementing Radical Innovation in Renewable Energy Experience Curves. Energies 2021, 14, 2364. [Google Scholar] [CrossRef]
  15. Chesbrough, H.W. Open Innovation: The New Imperative for Creating and Profiting from Technology; Harvard Business School Press: Boston, MA, USA, 2003. [Google Scholar]
  16. Tunga, I.; Bradley, S.; Eraut, N.; Bowick, L.; Noble, D.; Henderson, J. Technical Requirement for the Implementation of Structured Innovation in Ocean Energy Systems; DTOceanPlus: Bilbao, Spain, 2019. [Google Scholar]
  17. Tritle, G.; Scriven, E.; Fusfeld, A. Resolving uncertainty in R&D portfolios. Res. Technol. Manag. 2000, 43, 47–50. [Google Scholar]
  18. Rahnejat, H.; Zairi, M. The “QFD/FMEA interface”. Eur. J. Innov. Manag. 1998, 1, 18. [Google Scholar]
  19. Bergeon, S. Strategic CDI and Parent Process with Quick QFD. In Proceedings of the SSO (Strategic Standards Office), QFD/MRO (Market Research Office) Conference, Dearborn, MI, USA, 11 March 1996. [Google Scholar]
  20. Sullivan, L.P. "Quality Function Deployment," Quality Progress; American Society for Quality Control: Milwaukee, WI, USA, 1986; Volume 19, pp. 39–50. [Google Scholar]
  21. Mazur, G. Lifestyle QFD: Incorporating Emotional Appeal in Product Development. In Proceedings of the 17th Symposium on Quality Function Deployment, Portland, OR, USA, 17 September 2005. [Google Scholar]
  22. Hsu-Shih, S.; Chen, S.H. A conceptual design of a mobile healthcare device- an application of three-stage QFD with ANP and TRIZ. Int. J. Oper. Res. 2013, 10, 80–91. [Google Scholar]
  23. Osbon, A.F. How to "Think Up"; McGraw-Hill Company Inc.: New York, NY, USA; London, UK, 1942. [Google Scholar]
  24. Wikipedia, the Free Encyclopedia. Systematic Inventive Thinking. Available online: https://en.wikipedia.org/wiki/Systematic_inventive_thinking (accessed on 27 October 2020).
  25. Mumford, M.D. Where have we been, where are we going? Taking stock in creativity research. Creat. Res. J. 2003, 15, 107–120. [Google Scholar]
  26. Runco, M.A. Creativity. Annu. Rev. Psychol. 2004, 55, 657–687. [Google Scholar] [CrossRef] [PubMed]
  27. Kaufman, J.C.; Sternberg, R.J. The Cambridge Handbook of Creativity Second Edition; Cambridge University Press: Cambridge, UK, 2019. [Google Scholar]
  28. Sternberg, R.J. Handbook of Creativity; Cambridge University Press: Cambridge, UK, 1999. [Google Scholar]
  29. Runco, M. Creativity—Theories and Themes: Research, Development and Practice, 2nd ed.; Elsevier Academic Press: Cambridge, MA, USA, 2014. [Google Scholar]
  30. Tunga, I. Developing Market Strategies for the Next Generation of Offshore Wind Farms. Ph.D. Thesis, University of Edinburgh, Edinburgh, UK, 2019. [Google Scholar]
  31. Deliverable 3.1: State-of-the-Art Assessment and Specification of Data requizrements for Electrical System Architectures. Available online: https://www.dtoceanplus.eu/content/download/2522/file/DTO_WP3_ECD_D3.1v2.0.pdf (accessed on 11 August 2021).
  32. Gadd, K. TRIZ for Engineers: Enabling Inventive Problem Solving: Enabling Inventive Problem Solving; John Wiley & Sons, Ltd: Chichester, UK, 2011. [Google Scholar]
  33. Haines-Gadd, L. TRIZ for Dummies Chee; John Wiley &Sons, Ltd: Chichester, UK, 2016. [Google Scholar]
  34. Bloggs, K. The Selection and Application of Design Methodologies for the Design of Bone Tissue Scaffolds. Ph.D. Thesis, Cranfield University, Cranfield, UK, 2013. [Google Scholar]
  35. Kiran, D. Quality Function Deployment. In Multi Criteria Decision Analysis for Supporting the Selection of Engineering Materials in Product Design, 2nd ed.; Butterworth Heinemann: Oxford, UK, 2016. [Google Scholar]
  36. ODI. Management Techniques: Structured Innovation. 2009. Available online: https://www.odi.org/publications/5220-management-techniques-structured-innovation (accessed on 1 August 2019).
  37. Kiran, D.R. Chapter 30: Quality Function Deployment. In Total Quality Management: Key Concepts and Case Studies; Butterworth Heinemann: Oxford, UK, 2017; pp. 425–437. [Google Scholar]
  38. Weber, J.; Laird, D. Structured Innovation of High-Performance Wave Energy Converter Technology. In Proceedings of the 2015 European Wave and Tidal Energy Conference, Nantes, France, 6 September 2015. [Google Scholar]
  39. Weber, J.; Roberts, J. Structured Innovation. Available online: https://www.energy.gov/sites/prod/files/2017/07/f35/Structured-innovation-web.pdf (accessed on 11 August 2021).
  40. Fitzgerald, J.; Bolund, B. Technology Readiness for Wave Energy Projects: ESB and Vattenfall classification system. In ICOE; Ocean Energy Systems: Dublin, Ireland, 2012. [Google Scholar]
  41. Wave Energy Scotland. Project SEAWEED, WES. Available online: http://www.waveenergyscotland.co.uk/strategic-activity/strategic-activity-2/structured-innovation/project-seaweed-1/ (accessed on 21 May 2021).
  42. OREC. TiPTORS Design for Reliability Methodology: Phase 1 Summary Report; Offshore Renewable Energy Catapult: Glasgow, UK, 2015. [Google Scholar]
  43. ETI. Tidal Energy: Insights into Tidal Stream Energy; The Energy Technologies Institute: Loughborough, UK, 2015. [Google Scholar]
  44. ETI. An ETI Perspective: The Role of Tidal Energy in a Future UK Low Carbon Energy System; The Energy Technologies Institute: Loughborough, UK, 2017. [Google Scholar]
  45. DTOceanPlus. Providing Advanced Design Tools for Ocean Energy Systems Innovation, Development and Deployment, France Energies Marine. 2021. Available online: https://www.dtoceanplus.eu (accessed on 14 September 2021).
  46. Tunga, I.; Abrahams, M.; Khan, H.; Tatlock, B. D3.2—Structured Innovation Design Tool—Alpha Version; DTOceanPlus: Basque, Spain, 2020. [Google Scholar]
  47. DTOceanPlus Consortium. DTOceanPlus-GitLab. 31 August 2021. Available online: https://gitlab.com/dtoceanplus (accessed on 1 September 2021).
  48. DTOceanPlus. Overall DTOceanPlus Documentation; Tecnalia: Bilbao, Spain, 2021. [Google Scholar]
  49. Noble, D.; Nambiar, A.; Bloise-Thomaz, T.; Jeffrey, H.; Nava, V.; Fay, F.-X.; Ruiz-Minguela, P.; Touzon, I.; Mendia, J.L.; Tunga, I.; et al. Deliverable 2.2. Functional Requirements and Metrics of 2nd Generation Design Tools; DTOceanPlus: Bilbao, Spain, 2018. [Google Scholar]
  50. Roberts, O.; Henderson, J.; Garcia-Teruel, A.; Noble, D.; Jeffrey, H. Bringing structure to the wave energy innovation process with the development of a techno-economic tool. 2021, in press. [Google Scholar]
  51. BEIS. Electricity Generation Costs 2020; Department for Business, Energy & Industrial Strategy: London, UK, 2020. [Google Scholar]
  52. QFD Institute. The Official Source for QFD, Quality Function Deployment, QFDI. 2020. Available online: http://www.qfdi.org/ (accessed on 13 December 2020).
  53. Garcia-Teruel, A.; Roberts, O.; Noble, D.R.; Henderson, J.; Jeffrey, H. Design limits for wave energy converters based on the relationship on power and volume obtained through multi-objective optimisation. 2021, in press. [Google Scholar]
  54. OREC. Marine Energy Electrical Architecture; Offshore Renewables Energy Catapult: Glasgow, UK, 2015. [Google Scholar]
  55. The University of Edinburgh. Bio-Inspired Morphing Blades for Wind and Tidal Turbines, School of Engineering. 2021. Available online: https://www.eng.ed.ac.uk/studying/postgraduate/research/phd/bio-inspired-morphing-blades-wind-and-tidal-turbines (accessed on 11 August 2021).
  56. SANDIA. Systems Engineering Applied to the Development of a Wave Energy Farm; Sandia National Laboratories: Livermore, CA, USA, 2017. [Google Scholar]
  57. Hill, C.; Neary, V.S.; Gunawan, B.; Guala, M.; Sotiropoulos, F. "U.S. Department of Energy Reference Model Program RM1: Experimental Results," Wind and Water Power Technologies Program; Office of Energy Efficiency and Renewable Energy, US Department of Energy: Washington, DC, USA, 2014.
  58. Arabian-Hoseynabadi, H.; Oraee, H.; Tavner, P. Failure Modes and Effect Analysis (FMEA) for Wind Turbines. Int. J. Electr. Power Energy Syst. 2010, 32, 817–824. [Google Scholar] [CrossRef] [Green Version]
  59. Garcia-Teruel, A.; DuPont, B.; Forehand, D. Hull geometry optimisation of wave energy converters: On the choice of the objective functions and the optimisation formulation. Appl. Energy 2021, 298, 117153. [Google Scholar] [CrossRef]
  60. Garcia-Teruel, A. Geometry Optimisation of Wave Energy Converters; The University of Edinburgh: Edinburgh, UK, 2019. [Google Scholar]
Figure 1. Flowchart to describe approach developed. Numbered steps refer to the subsections in Section 2.1.
Energies 14 05988 g001
Figure 2. Grid for capturing customer requirements, see main text for description of fields.
Energies 14 05988 g002
Figure 3. Example of a subset of the TRIZ 39 × 39 contradiction matrix (top) linking to the 40 inventive principles (bottom) [30,32]. These are designed to be generic to multiple industries and applications, thus do not specify units.
Energies 14 05988 g003
Figure 4. Example highlighting functional requirements with respective overall impacts and organisational capabilities. Those further to the right are more impactful to meet customer requirements, and those closest to the bottom are easiest to implement.
Energies 14 05988 g004
Figure 5. Example showing: (left)—the functional requirement occurrences and mitigated occurrences against occurrence limit of 4; (right)—RPNs and mitigated RPNs against threshold RPN of 72.
Energies 14 05988 g005
Figure 6. Example of FMEA analysis output highlighting where RPN and occurrence limits have been exceeded (legend: red (error) for RPN > 72, amber (warning) for occurrence > 4 and/or RPN = 72, green (success) for RPN and occurrence < threshold).
Energies 14 05988 g006
Figure 7. Example of using the solution hierarchy to identify relevant functional requirements from the high-level energy trilemma to meet customer requirements through specific design parameters.
Energies 14 05988 g007
Figure 8. Example highlighting the first step of defining fundamental relationships by determining the impact of functional requirements on each other. Shaded green background indicates a fundamental relationship could be defined between requirements.
Energies 14 05988 g008
Figure 9. A fundamental relationship example for power extraction vs. scale depending on resource level being high, medium, or low for a cuboid absorbing power in surge.
Energies 14 05988 g009
Table 1. Example of objectives, customer requirements, and ranking of their importance for a tidal developer improving their array.
ObjectiveCustomer RequirementsImportance (10—Most, 1—Least)
Optimal layout of devices and power
cabling architecture for a tidal array
Annual Energy Production10
Capital Costs9
The flexibility of energy supply8
Availability7
Table 2. Overall objectives, customer requirements, and ranking of importance for the example of novel wave energy concepts. The number and wording of objective(s) and customer requirements are determined by those completing the methodology.
ObjectiveCustomer RequirementsImportance (10—Most, 1—Least)
Produces electrical energy from the energy in ocean waves by exploiting wave energy to result in an attractive and achievable business case
Maximise power capture and minimise cost in reasonable potential sites
Lowest lifetime cost10
Low risk of investment9
Safe to operate 8
Table 3. Example of defined functional requirements and relationships between the customer and functional requirements. The number and wording of functional and customer requirements are determined by those completing the methodology.
Functional RequirementsHydrodynamic LossesTransmission LossesStorage
Capacity
Manufacturing CostsInstallation
Costs
ReliabilityQA Check
Ranking (Total)
Customer Requirements
Annual energy productionHighHighLowNoneNoneLow2nd (20)
Capital costsHighMediumLowHighHighNone1st (32)
Flexibility of energy supplyNoneLowHighMediumNoneMedium3rd (18)
AvailabilityNoneNoneLowLowNoneHigh4th (11)
Functional requirement importance to
meet customer requirements
(Highest—most impactful solution)
1st (6)2nd (5)5th (2)3rd (4)7th (1)4th (3)
Table 4. Wave energy concept example of defined functional requirements and relationships.
Functional RequirementsCAPEXResource LevelScaleEfficiencyQA Check Ranking (Total)
Customer Requirements
Direction of improvementLowerHigherLowerHigher
Lowest lifetime costHighMediumHighHigh1st (31)
Minimal commercial risksHighMediumMediumHigh2nd (26)
Safe to operateHighMediumLowMedium3rd (18)
Functional requirement importance tomeet customer requirements(Highest—most impactful solution)1st (4)4th (1)3rd (2)2nd (3)
Table 5. Example of assessing interdependence of functional requirements for a tidal developer improving their array, showing the strength of the relationships (high, medium, low, none) and type of correlation (positive/negative). Grey shading used to highlight the symmetric nature of interdependence; Text in red to highlight conflicting requirements.
Functional RequirementsHydrodynamic LossesTransmission LossesStorage
Capacity
Manufacturing CostsInstallation CostsReliability
Functional Requirements
Hydrodynamic losses +LowNone−Low−Medium+High
Transmission losses+Low None+Low+Low+Medium
Storage capacityNoneNone +High+Low+High
Manufacturing costs−Low+Low+High +HighNone
Installation costs−Medium+Low+Low+High None
Reliability+High+Medium+HighNoneNone
Table 6. Use case showing the interdependencies between the functional requirements for the wave energy example, showing the strength of the relationships (high, medium, low, none) and type of correlation (positive/negative). Grey shading used to highlight the symmetric nature of interdependence; Text in red to highlight conflicting requirements.
Functional RequirementsCAPEXResource LevelScaleEfficiencySum of
Conflicts
Worst
Conflict
Functional Requirements
CAPEX +Medium−High−Medium−132nd
Resource level+Medium −High+Medium−93rd
Scale−High−High −Low−191st
Efficiency−Medium+Medium−Low −54th
Table 7. Example of suggested inventive principles for the conflicting requirements in the tidal energy array improvement case, showing both the function to be improved (highlighted in green) and the undesired conflicting result(highlighted in red) for the highest conflicting functional requirements, plus the TRIZ inventive principles that may help resolve this.
Functional
Requirements
TRIZ Contradiction
Parameter
TRIZ Inventive Principles
Suggested
Function to ImproveReliability27—Reliability13—The other way round
35—Physical or chemical properties
1—Segmentation
Undesired result
(conflicting function)
Manufacturing costs36—Complexity of device
Table 8. Example of suggested inventive principles for the conflicting requirements in the novel wave energy case, showing both the function to be improved (highlighted in green) and the undesired conflicting result (Highlighted in red) for the highest conflicting functional requirements, plus the TRIZ inventive principles that may help resolve this.
Functional
Requirements
TRIZ Contradiction
Parameter
TRIZ Inventive Principles
Suggested
Function to ImproveCapital cost to power ratio21—Power35—Parameter change
6—Multifunctionality
38—Accelerate oxidation
Undesired result
(conflicting function)
Scale7—Volume of moving object
Table 9. Example showing how the target (ideal) values compare to the state-of-the-art (SoTA) for each functional requirement for the tidal energy array improvement case.
Functional RequirementsHydrodynamic LossesTransmission LossesStorage
Capacity
Manufacturing CostsInstallation CostsReliability
Direction of ImprovementDownDownUpDownDownUp
  Target (ideal) values521500,000670,00020
  Target units%%MWhM EURM EURyears
SoTA Examples
  RM1 (pure star configuration)108.70500,0001,000,00018.0
  RM1 (DTOv2—star-radial)108.00462,000924,00014.0
  RM1 (Compact config + storage)124.00.5848,000924,00014.0
Table 10. Example showing relative deviation of each SoTA functional requirement from the set targets (ideal values) in Table 9. Red, green and grey shading used to highlight underachieved, exceeding or achieved SoTA functional requirements, respectively.
Functional RequirementsHydrodynamic LossesTransmission LossesStorage
Capacity
Manufacturing CostsInstallation CostsReliability
SoTA Examples
RM1 (pure star configuration)−100%−74%−100%0%−49%−10%
RM1 (DTOv2 star-radial)−100%−60%−100%8%−38%−30%
RM1 (Compact config + storage)−140%20%−50%−70%−38%−30%
Table 11. Example of the organisation difficulties to meet the target and deliver each of the functional requirements for the tidal energy array improvement case. Red to green shading is used to highlight the overall organisational impact from hardest to implement (red) to easiest to implement (Green).
Functional RequirementsHydrodynamic LossesTransmission LossesStorage
Capacity
Manufacturing CostsInstallation CostsReliability
State-of-the-Art
Engineering difficulty to meet target553121
Difficulty to deliver (make, obtain/procure)254342
Overall organisational impact ranking (high= hardest to implement)564231
Publisher’s Note: MDPI stays neutral with regard to jurisdictional claims in published maps and institutional affiliations.

