Article

Advanced Metering Infrastructure—Towards a Reliable Network

by
Mirosław Kornatka
* and
Tomasz Popławski
Department of Electrical Engineering, Czestochowa University of Technology, 42-200 Czestochowa, Poland
*
Author to whom correspondence should be addressed.
Energies 2021, 14(18), 5986; https://doi.org/10.3390/en14185986
Submission received: 20 August 2021 / Revised: 15 September 2021 / Accepted: 17 September 2021 / Published: 21 September 2021
(This article belongs to the Special Issue Improvements of the Electricity Power System)

Abstract

:
In order to ensure continuous energy supply, Distribution System Operators (DSOs) have to monitor and analyze the condition of the power grid, especially checking for random events, such as breakdowns or other disturbances. Still, relatively little information is available on the operation of the Low Voltage (LV) grid. This can be improved thanks to digital tools, offering online processing of data, which ultimately increases effectiveness of the power grid. Among those tools, the use of the Advanced Metering Infrastructure (AMI) is especially conducive for improving reliability. AMI is one of the elements of the system Supervisory Control and Data Acquisition (SCADA) for the LV grid. Exact knowledge of the reliability conditions of a power grid is also indispensable for optimizing investment. AMI is also key in providing operational capacity for carrying out energy balance in virtual power plants (VPPs). This paper deals with methodology of identification and location of faults in the AMI-supervised LV grid and with calculating the System Average Interruption Duration Index (SAIDI) and System Average Interruption Frequency Index (SAIFI) on the basis of the recorded events. The results presented in the paper are based on data obtained from seven MV/LV transformer stations that supply over 2000 customers.

1. Introduction

Electricity should be delivered to consumers without interruptions. The Act “Prawo Energetyczne” [1] obligates energy providers to maintain the capacity of devices, installations and grids ensuring continuous and reliable delivery. Nowadays, the power industry has to take into account a number of new challenges, such as distributed generation, the evolution of the power mix, and increase in demand accompanied by relatively low efficiency.
In recent years Electricity Power System (EPS) has shifted from a centralized model to a fully competitive market model, from fossil fuels to distributed generation, from the well-established EPS model to Smart Grid and Virtual Power Plants (VPPs) [2,3,4,5]. It should be noted, however, that even though distributed generation based on Renewable Energy Sources (RESs) is becoming increasingly attractive for investors, its wide implementation and smooth integration with EPS requires further analysis based on data obtained from real grid systems [6,7,8].
The power grid in Poland operates on partly outdated infrastructure and is not flexible enough to react to fast changes in the demand and supply of energy [9,10]. For instance, on 17 May 2021 due to a fault at the power station Rogowiec, the protection system switched off 10 units in the power plant Bełchatów, which resulted in the loss of 3640 MW in EPS. This was immediately compensated for by power obtained from pumped hydroelectric energy storage, spinning reserve and importation from the Czech Republic, Slovakia and Germany. In any case, the faultless operation of EPS requires strict coordination between power companies operating in the whole country and the balancing of energy flow by means of AMI. It is certainly advisable to develop and implement Smart Grid on a massive scale in the domestic power grid to ensure the desired flexibility and responsiveness to changes in the demand for power or to breakdowns. The massive implementation of AMI will contribute to better monitoring of the LV grid and to its integration with the system SCADA [11].
At present, DSOs have effective methods of localizing faults in the MV and HV grids. The system SCADA communicates with devices in the grid, informing the personnel about potential faults. However, the SCADA system has not yet been implemented in the LV grid, neither have the SG solutions been fully tested in the LV grid.
The aging infrastructure, the intensively growing use of renewable sources, as well as the development of electromobility, are challenges to the wider use of data from smart meters in order to increase the grid visibility and reliability.
The aim of the article is to show that transparent data from smart meters allows one to obtain information about an LV network, which allows them to obtain multifaceted knowledge about the network and improve its reliability. The first part of the article presents selected issues and implemented projects related to the Smart Grid (SG) and Smart Metering (SM) technology in terms of the reliability of a distribution network. The second part presents the methodology of determining SAIDI/SAIFI indicators based on the events recorded by smart meters in an actual LV network in Poland. The last part of the paper addresses selected AMI implementations in Poland.

2. Reliability and Smart Grid

The term “Smart Grid” was introduced in 2005 by Armin and Wollenberberg in their paper "Toward a Smart Grid - power delivery for the 21st century”, but naturally the idea itself emerged as a result of many years of research and analyses conducted by experts dealing with the modernization and development of EPS. The term SG denotes a technologically advanced EPS, in which communication takes place between all the parties in the market (producers, distributors and consumers), and which aims to deliver top quality power services at the lowest cost possible, with the use of Distributed Energy Sources (DESs), including Renewable Energy Sources. Smart Grid can also be defined as a power system characterized by a harmonious integration of all the parties’ actions in order to ensure faultless, reliable and environment-friendly delivery of electricity. One of the key elements of the SG system is consumers and prosumers.
Smart Grid includes the following elements:
  • Integrated actions of all the EPS users;
  • Monitoring of the EPS and a fast response to an unpredicted event;
  • Online diagnostics and reconfiguration;
  • Constant pressure towards lowering the cost of energy generated mainly at DES;
  • Promoting effective consumption.
Smart Grid solutions have been implemented in the MV grid for a few years, including reclosers, radio-controlled switches, or short-circuit detectors in overhead lines. The system SCADA provides visualization and video-signaling of these components, and also, crucially, their control. The remote control function for switching devices effectively shortens the time of re-connecting the network after a fault has been located.
SG also facilitates the automatic operation of MV/LV transformer stations, network switchboards, feed points or cable connectors. Using control and measuring devices, it is possible to identify and localize faults fully automatically, and then to isolate the faulty section and restore energy supply, which is known as self-healing network [12,13].
SG contributes to minimizing losses resulting from the necessity to optimize location and to dynamically change the dividing points of the MV grid, and to control the MV/LV transformer voltage on the basis of ongoing measurements.
For the sake of modernization, it is essential to know the real power flow in the grid and to verify the transformer and line load on the basis of the data obtained from AMI. This knowledge is indispensable for connecting new DES without deteriorating the conditions and quality of energy supply. This problem has been extensively dealt with in a number of publications, e.g., [14], in which the impact of DES on the reliability of the distribution network has been discussed.
Another important element of SG in MV networks is the detection of short circuits. Systems for detecting shorts in the grid, together with bidirectional communication between the devices and the dispatcher, as well as remote switches, detect such faults very quickly, which makes for a quick restoration of energy supply. This naturally contributes to the better quality of supply and lowers the value of indices SAIDI and SAIFI.
There are a number of such indices used for assessing the continuity of energy supply in a distribution network. The two used in Poland are SAIDI (System Average Interruption Duration Index) and SAIFI (System Average Interruption Frequency Index). SAIDI denotes an average duration of the system’s long or very long interruption, expressed in minutes per year. It is equal to the sum of the products of the interruption duration multiplied by a number of consumers deprived of energy due to a fault, which is then divided by a total number of consumers. By analogy, SAIFI refers to an average frequency of long and very long interruptions in energy supply, equal to the number of interruptions per year, divided by the total number of consumers. For many DSO the SAIDI/SAIFI indices are main criteria in terms of monitoring the power distribution quality. It has to be emphasized that SAIDI/SAIFI are obtained separately for scheduled and unscheduled interruptions. It should also be noted that catastrophic interruptions are defined as those lasting over 24 h, whereas short interruptions lasting less than 3 min are not taken into account.
Smart Grid and Smart Metering conceptions are related to the technology known as Demand Response (DR) and Demand-Side Management (DSM) for managing the supply and distribution of load in EPS. This technology serves to match the power demand with supply. With bidirectional communication, energy consumption can be reduced directly by DSO. Examples of the application of this technology include controlling heating, lighting, and managing the generation process. Methods of load control by alterations in the supply voltage or by managing the frequency of supply voltage in receivers are also part of the DR technology [15]. DSM on the other hand focuses on reducing the cost of energy by matching the profiles of consumers to the profiles of producers. DSM promotes a lifestyle based on energy saving, bringing about financial gains for energy consumers [16].
DSM and DR are an integral part of the VPP technology and energy storage. Virtual plants have become incorporated into the development strategies of international power companies, such as Enel, E.ON, EDF, Centrica, TEPCO, carrying out a number of projects, including Enel X, AutoGrid, Voltus, REstore, Sonnen, Stem, Enbala, Tesla, Itron [17].
The company Polskie Sieci Elektroenergetyczne (PSE) has introduced DSR services for industrial consumers, who benefit from their readiness to temporarily reduce power consumption at PSE’s request. Such a situation took place in Poland in the summer of 2015, a day before the threat of a blackout, when PSE imposed reductions on energy supply for industrial customers and large buildings. The readiness to reduce consumption can be complemented by the flexibility on the part of large commercial buildings, such as shopping malls, offices, sports facilities. Inspiration in this respect can be drawn from the Australian VPP project named Energy Response, subsequently followed by the American company EnerNOC (currently Enel X) in 2011 [18].

3. Advanced Metering Infrastructure (AMI) as a Factor Increasing the Reliability of the LV Grid

The issues related to the AMI are currently generating great interest all over the world. Many works, both theoretical and experimental, have been devoted to this subject. In the subject literature, very interesting papers [19,20] should be mentioned. Many of the current works focus on issues related to the integration of SM with building integrated photovoltaic in various climatic and environmental conditions [21,22] or to remote monitoring of the operation of a rural network [19]. Much importance is placed in the literature on research on the cooperation of the AMI with microgrids [23] but also on their operation in large rural/urban areas [24].
The claim advanced here is that Advanced Metering Infrastructure, enabling bidirectional communication with energy meters, is indispensable for the reliable operation of the LV grid. It consists of a number of components, such as modules, communication systems, energy meters, recorders and concetrators for bidirectional communication between the central system and the meters. AMI also includes software for managing measuring data known as Meter Data Management (MDM). The solutions offered by AMI are not only intended to satisfy the current needs of DSO and customers, but they can also be suitable for such recent challenges for the power industry as providing charging points for electric cars, the increasing number of RES, or increasing interest of providers and consumers in Demand Response programs. It is crucial to note that by providing information on breakdowns and faults, AMI can positively affect network reliability, by contributing to a smaller number of interruptions, faster repair and better communication [25,26,27].
AMI meters offered by a number of producers integrate SG with a Smart Home. Smart meters belonging to consumers are equipped with communication ports providing interfaces between various devices. It is possible to connect various external devices to them, such as communication modems, or to use them for controlling household appliances or to read data from other meters. The use of the Smart Home will largely depend on DSO. In a broader perspective, smart meters can also be seen as part of Industrial Internet of Things (IIoT), with a number of functionalities and methods for data analysis and processing, such as Deep Learning [19,28,29,30]. Some of them can operate on the traditional meter infrastructure, whereas others require a new generation of meters. Their advantage for DSO is the rational management of resources, which brings about real savings.
Smart meters are not only devices for remote reading of energy consumption. Modern meters are equipped with functions for recording events. In the reliability analysis, it is important to record such events as, for example: Primary Power Down, Primary Power Up as well as Voltage Sag. Additionally, the functionality known as last gasp can only prove very useful. It consists in sending the short message to the grid, informing DSO about supply interruption. For this functionality to work, all the communication devices between the meter and the operator have to function properly. The availability of precise information about the occurrence of an interruption is vital for the operator, who can respond fast to such situations. It is also useful that the exact time of the onset of the interruption is recorded, together with the time when energy supply is restored. Sometimes, however, the device can send excess information in the case of highly extensive breakdowns, or misleading information, if the interruption was only momentary.
Online diagnostics of the power network cannot exist without an effective teletechnical communication network. Using the range area of AMI communication as a criterion, it can be divided into: local network used by concentrators or other devices for direct reading of meters, Home Area Network (HAN) used to send control signals and other information to the home network using smart meters, and the essential wide-area network used to exchange data among selected servers intended for collecting information and concentrators [31,32]. Thanks to the connection of smart meters with HAN, the customer gains the ability to remotely control devices located in the home or office through authorized access via the Internet. Communication within HAN networks is provided by means of standard technological solutions. Utilities are deploying advanced distribution management systems (ADMSs) to operate and control the complex grid. Applications like energy management system, fault location, isolation, and self-restoration, outage management system (OMS) helps utilities to make complex decisions in case of high DER. The Utilities implementing or considering Advanced Distribution Management Systems (ADMS) need to look at the communication networks that support their smart meters (AMI). Utilities must also look at the ability of smart meters to be edge-of-grid sensors reporting power outage notifications as well as voltage and power quality data in some cases [33,34]. The looming challenge is the integration of increasing Distributed Energy Resources (DER), which includes grid-linked PV, electric vehicles, microgrids, and demand management.

4. Analysis of the Identification of Events by Means of AMI/SCADA/OMS Case Study

The methodology of calculating the SAIDI/SAIFI indicators on the basis of the AMI and SCADA/OMS systems is a multi-path process, dependent on many factors (e.g., on the systems owned by the DSO, parameterization of smart meters)—it is difficult to provide one universal algorithm. The main steps and issues that were carried out during the implementation of the above project are presented in the further part of the work.
The following part presents the reliability analysis of a network fragment based on data from AMI meters. The calculations were made for the actual supply network serving 2000 energy consumers supplied from seven MV/LV transformer stations. The whole network had a complete AMI infrastructure, both for the consumers and the metering of MV/LV transformer stations. The analysis covered a period of 1 year, including over 100,000 events registered by PoC as well as more than 400 events registered by BM. In this period, the OMS of the MV network in the area under scrutiny registered over 140 events.
Let us consider a fragment of a distribution grid covering the area marked as Area_id, including MV and LV lines, transformers Tr_MV/LV_id, suppling network tracks NS_id, to which consumers’ meters were connected at energy consumption points (PoC_id). Figure 1 presents a fragment of the network under analysis.
There were also balancing meters (BM_id), installed at transformer stations Tr_MV/LV_id and other points, as well as telecommunication infrastructure including concentrators (C_id), sending the data to the Central Database System and the MDM system.

4.1. Registration of Events in the Analyzed Network Based on Data from Smart Meters (Balancing/Customer)

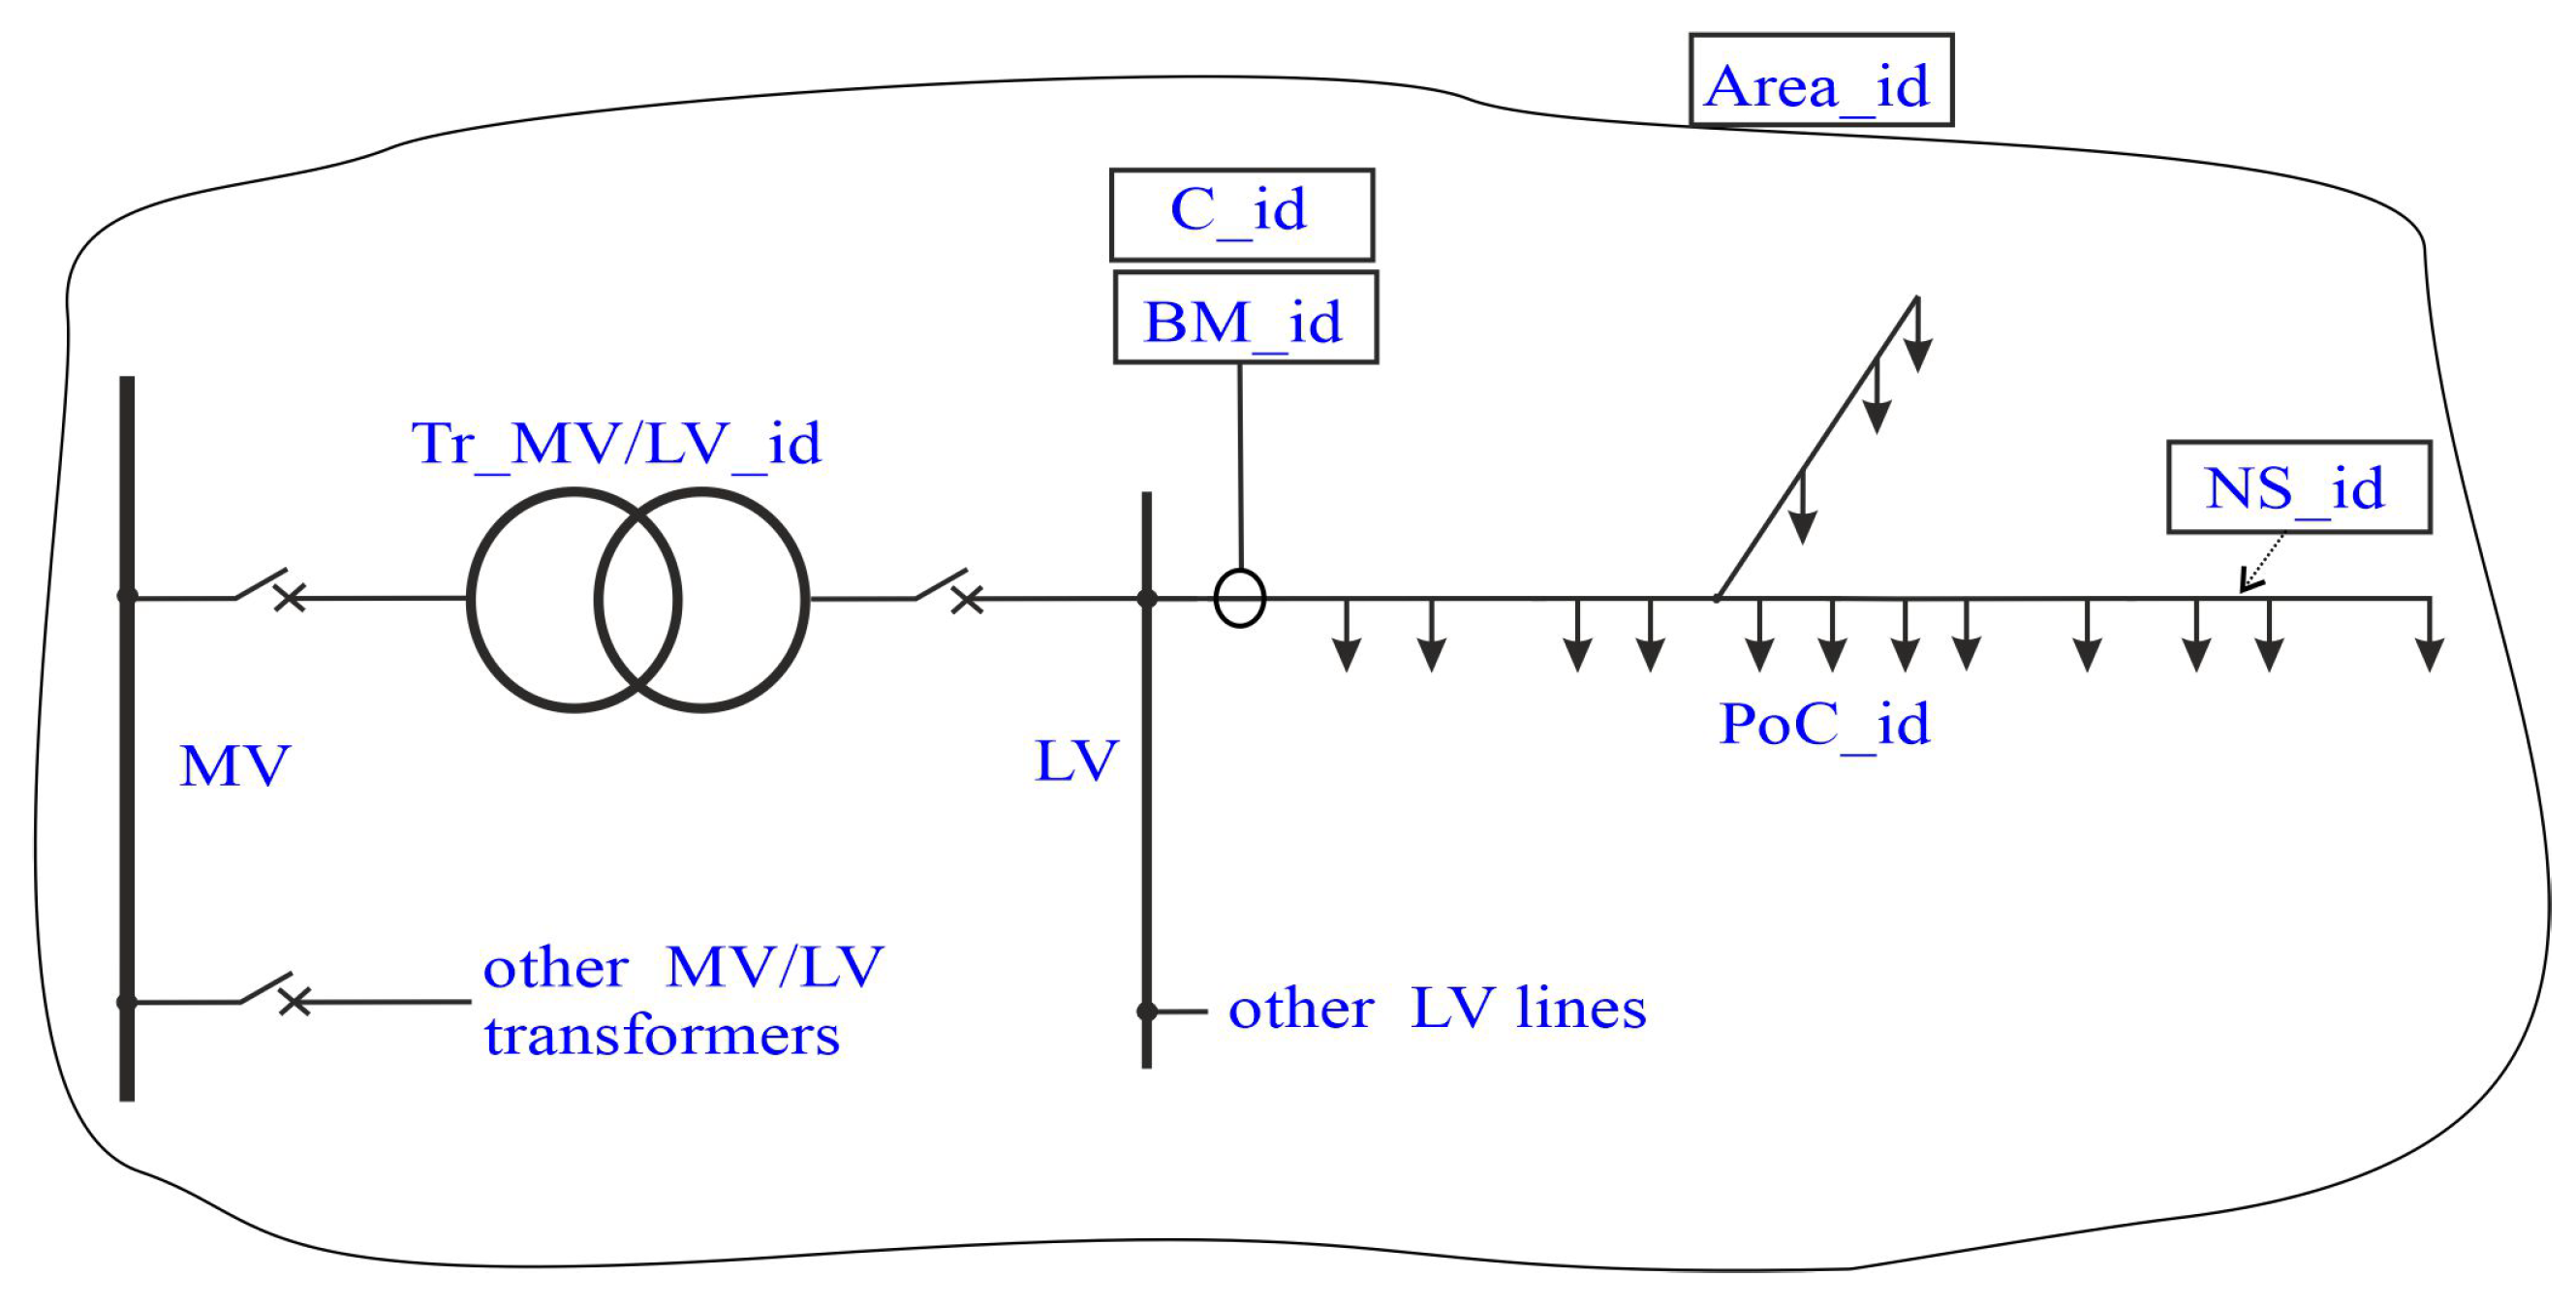
  • The balancing meters (BMs) installed in the MV/LV transformer station had wide capabilities of making measurements and recording events, such as voltage drops, voltage increases or power interruptions in individual phases. The algorithm of the procedure for determining the actual interruption times that occurred in the power grid located in the Area_id based on the events recorded by the PoC_id customer meters and the BM_id balancing meters required a consistent data structure and non-ambiguously defined relations;
  • An important issue was the connection of events recorded in the BM_id balancing meters with events from PoC_id meters. It was a necessary condition for the correct determination of SAIDI and SAIFI values for particular levels of their granulation, i.e., for the level of PoS consumer meters, BM balancing meters, NS network lines, Tr_MV/LV transformer stations or the entire area. It should be noted that the balancing meters (BM) installed in the MV/LV transformer station usually have different event registration options as compared to PoC customers’ meters.

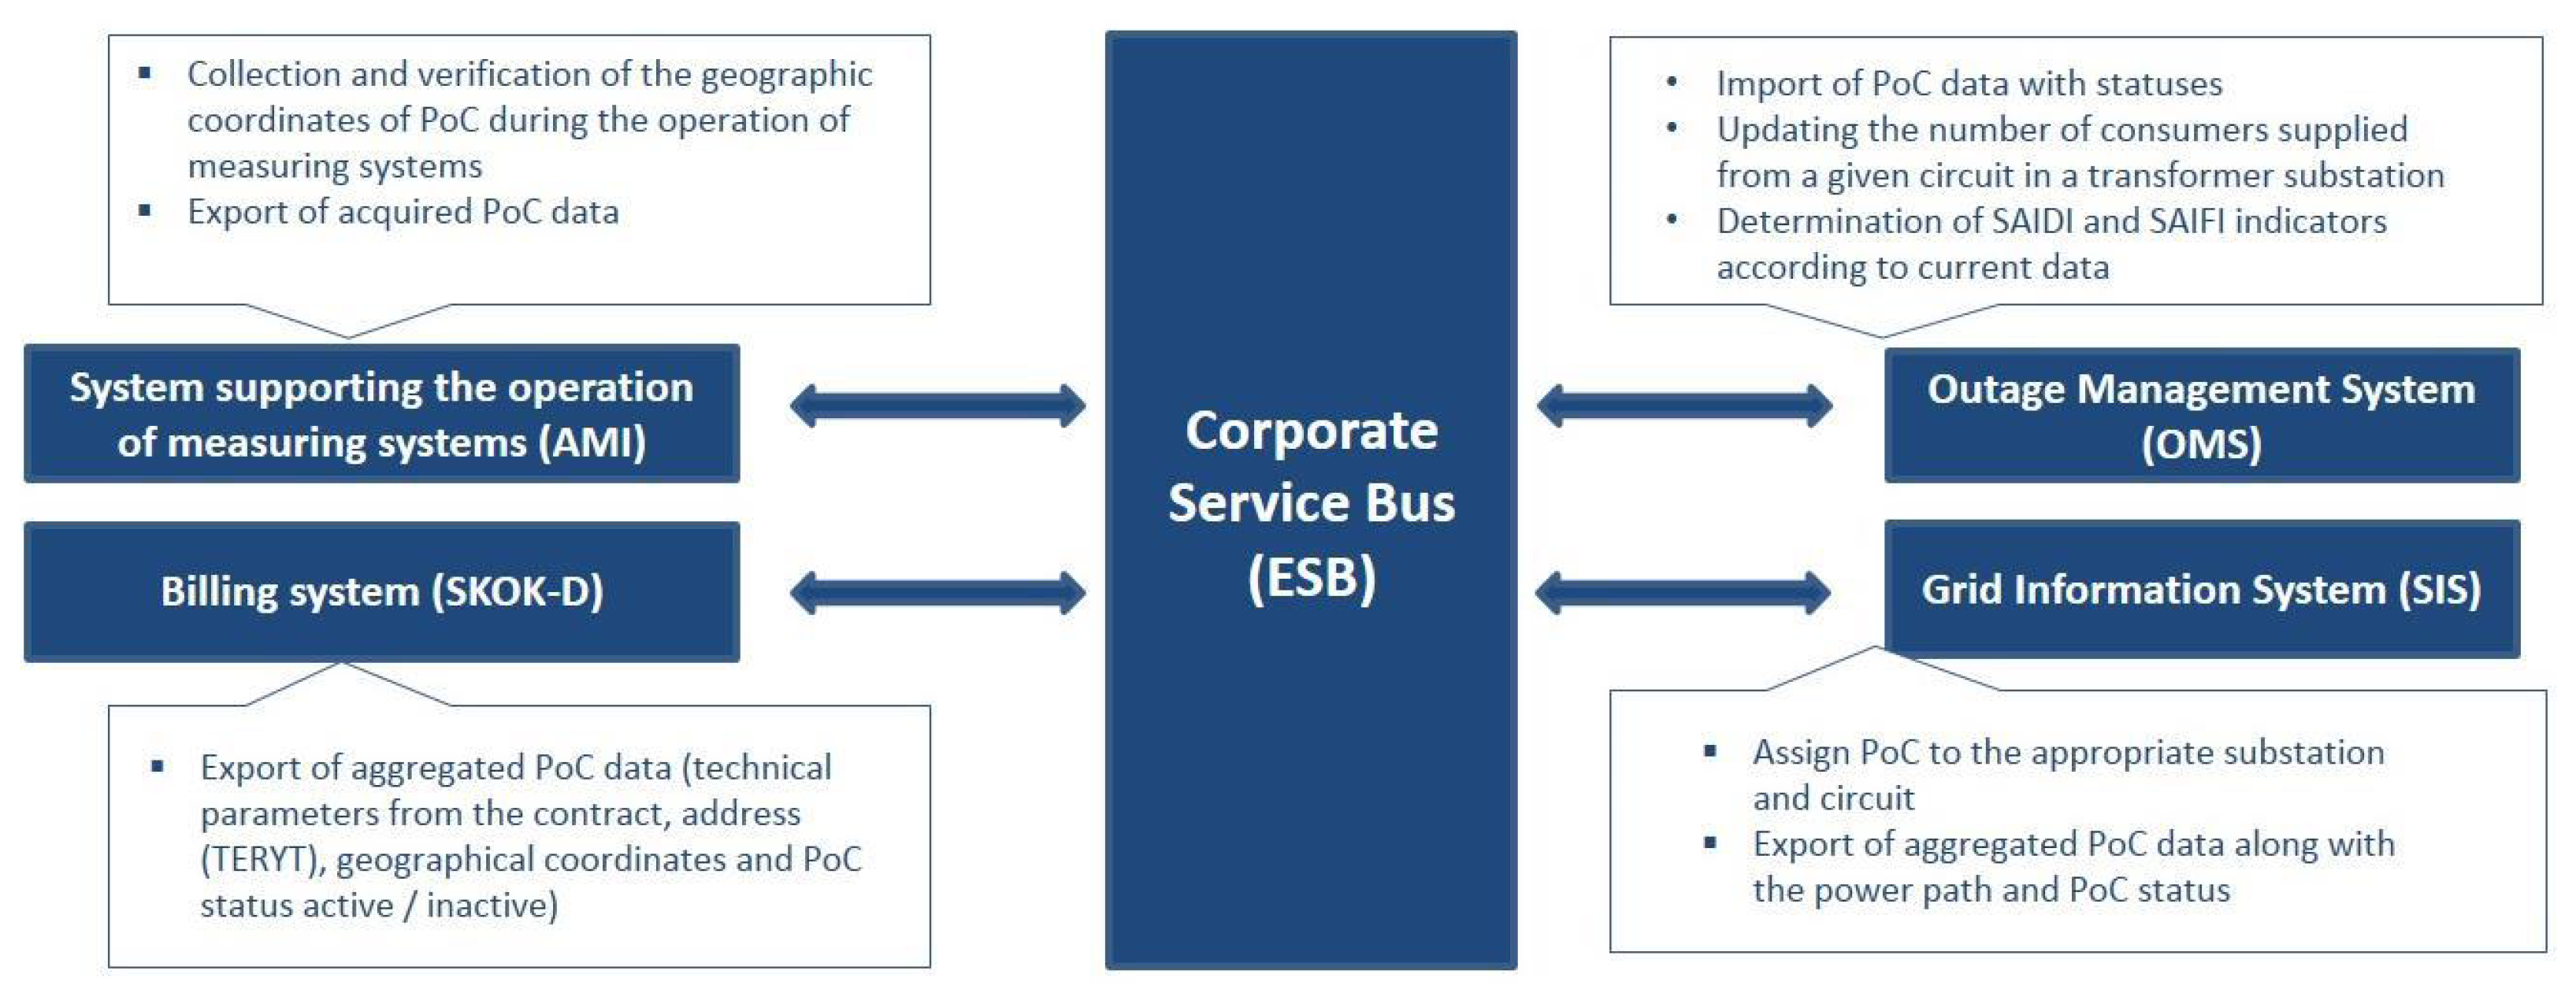
4.2. Correlation of Events from the AMI System with Events Recorded in the Systems of the Distribution Network Operator (e.g., SCADA/OMS)

  • Another important issue is the unification (standardization) of the database structures located in the Central Database System with the event logs of specific dispatch offices, carried out within the Outage Management System (OMS). Attention should be paid to the necessity to introduce a uniform event dictionary for the whole area or system;
  • It cannot be ignored that the OMS records events differently from the AMI system. The events recorded in AMI meters are consistent with the parameterization of the meters (which can be changed by the AMI system operator within the functionality of the meters themselves during their exploitation). On the other hand, OMS obtains information about events automatically through various teletechnical devices, from power protection automatics or circuit breakers. Some of the system events are the scheduled board manipulations of the operator. The events recorded in the OMS provide information whether the interruption that occurred was a scheduled interruption or an unscheduled one. OMS also provides information about the cause of the interruption;
  • Moreover, the AMI system may have a different resolution of event recording, e.g., it may not record micro-interruptions. Therefore, the number of events recorded respectively by customer meters in PoC and BM balancing meters installed in MV/LV transformer stations may be different from OMS. The largest amount of information about events is registered at the consumer meters;
  • The assignment of a given PoC to the network track and the MV/LV transformer provides information that cannot be obtained from the balancing meter;
  • It is suggested that each elementary event is a separate item in the event log and is uniquely identified by the “id” of the objects involved in the event. A fragment of the event register for one balancing meter is presented in Table 1;
Where: BM_id–uniquely identifies a balancing meter in the system MDM; SED and SET–onset of an event, EED and EET–end of an event, the attribute N_CUSTOMER determines the number PoC assigned to every BM, CAUSE_ID contains a code of the cause of an event based on a vocabulary of scheduled and unscheduled events, as in OMS.

4.3. Calculation of SAIDI / SAIFI Indicators Broken down into for Particular Consumers, Network Tracks, Transformer Stations

  • During the procedure of determining SAIDI / SAIFI, it is necessary to correlate the times of the events registered by balancing meters with the times of events registered by customers’ meters assigned to a given network track, since their coincidence in time is significant for the analysis;
  • In order to correctly calculate reliability indices, it is key to take into account the replacements of balancing and customer’s meters and changes in the network structure. Modern fault location, isolation, and self-restoration systems are usually linked to a Geographic Information System (GIS), which is capable of locating faults with high precision and identifying objects affected by them. In the AMI system, it is the customers’ meters and balancing meters that have specific physical attributes, such as geographical position, address, name, recorded events and, of course, measurement data. Thus, PoC and BM link the actual measurement system and its parameters with the measurement site. Thanks to this, each event registered by PoC and/or BM, which is saved in the database environment, enables quick correlation analysis of events, and, consequently, the identification and location of events;
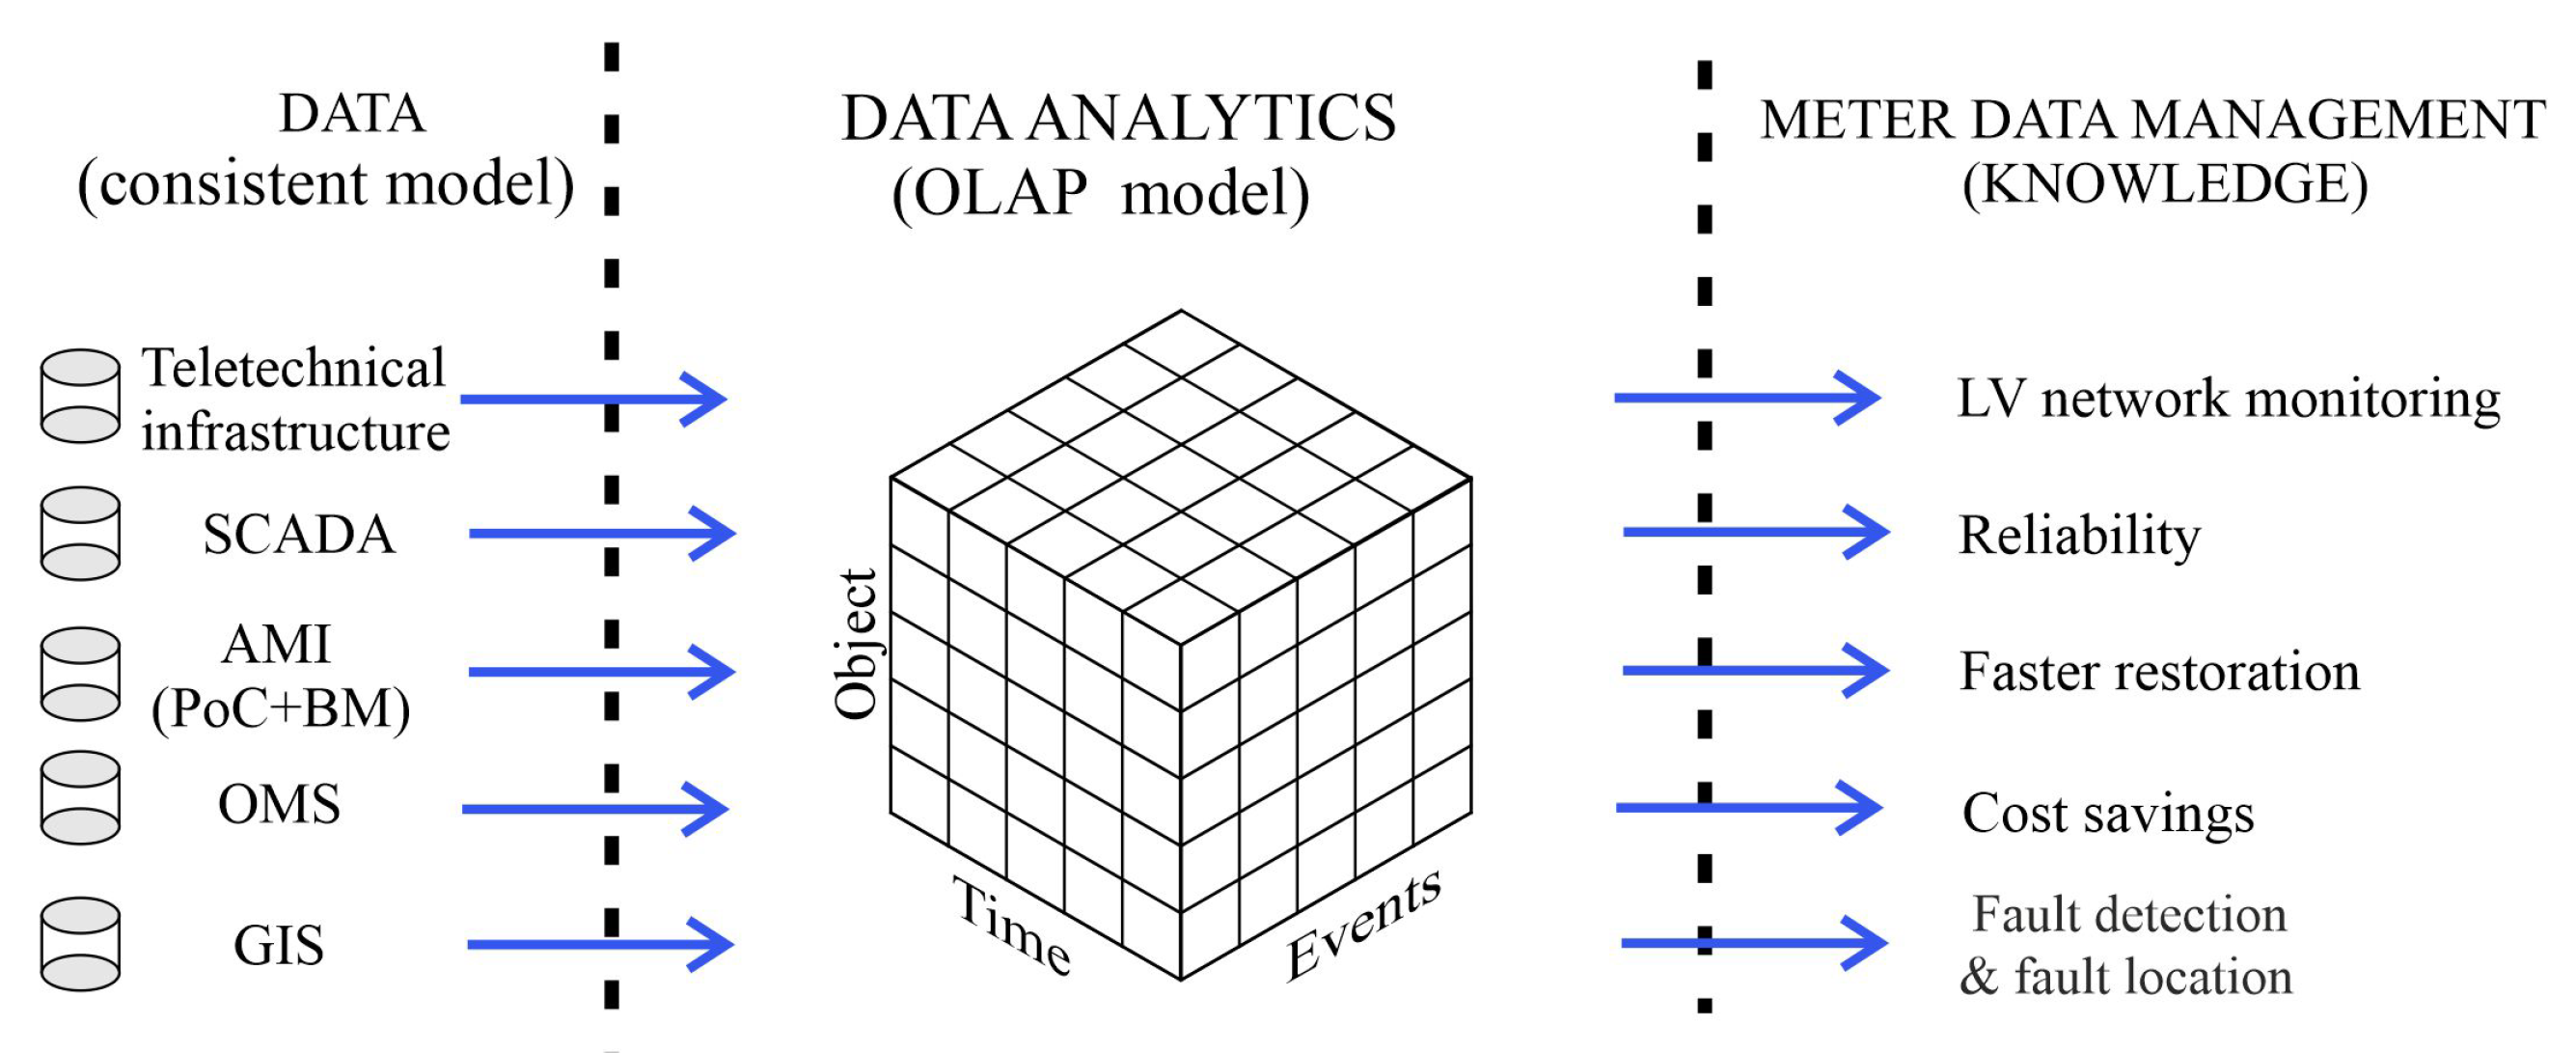
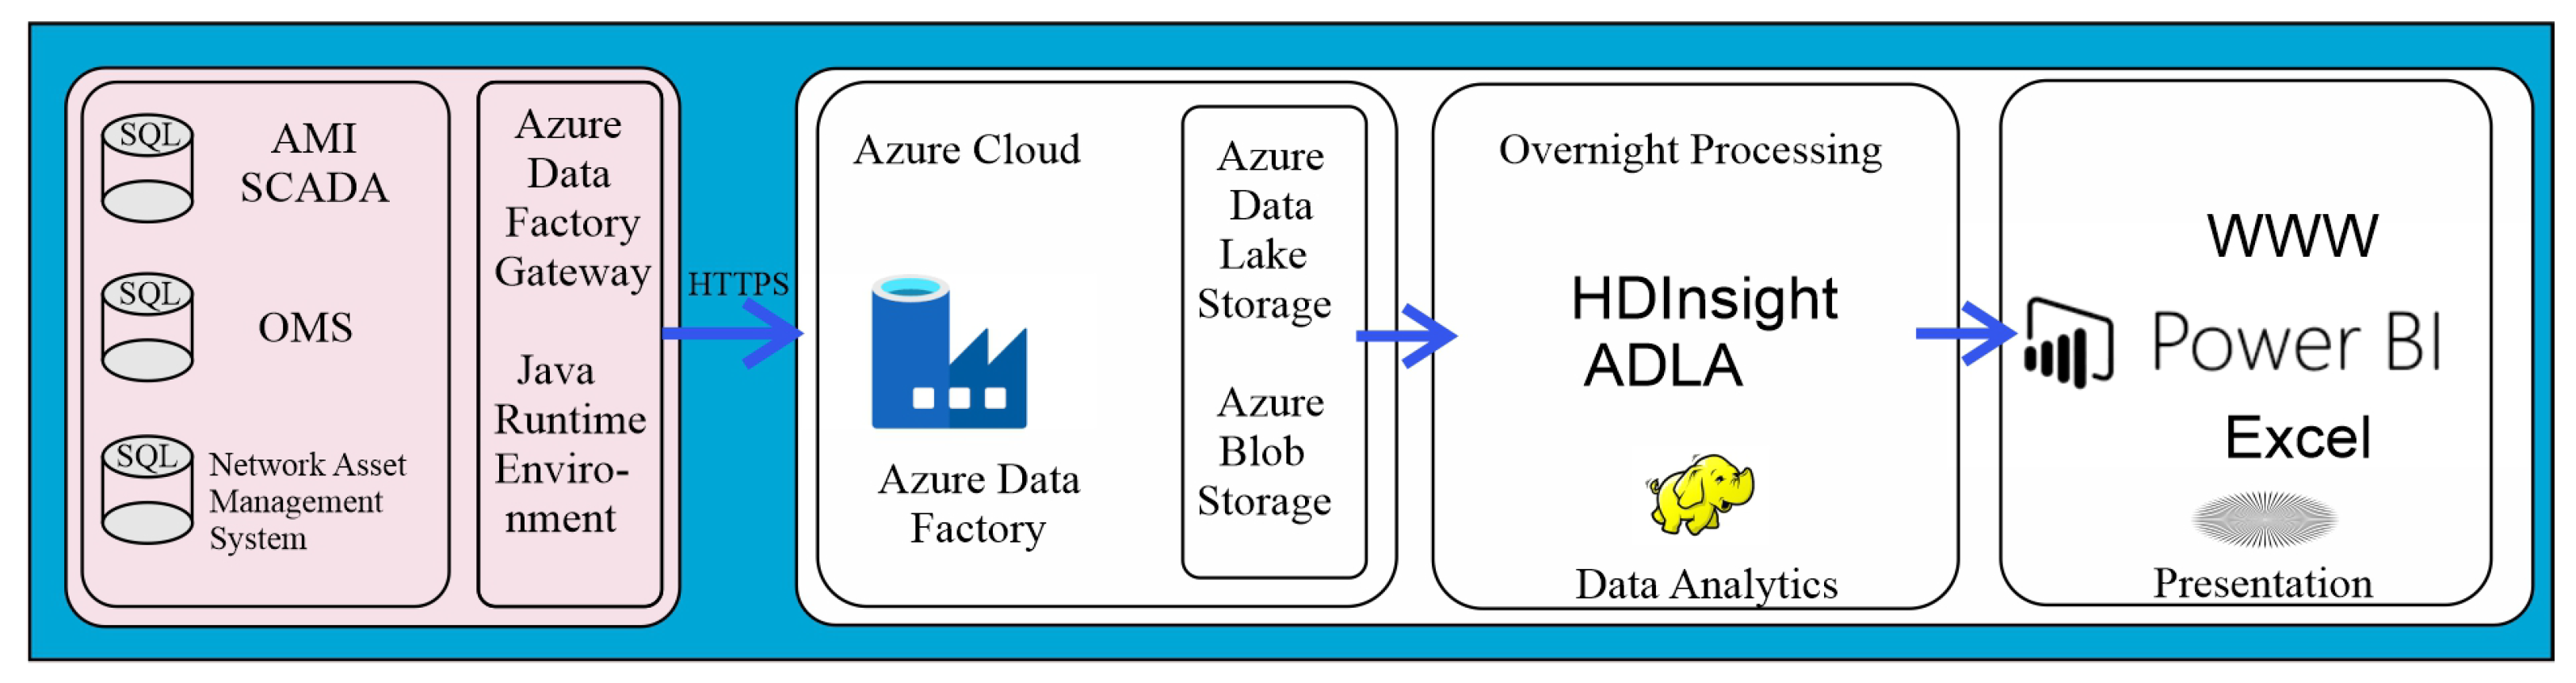
  • The use of modern database technologies that process data by means of a multidimensional database—Online Analytical Processing ensures a fast response to failures in the power grid. Figure 2 shows an example of using data from various systems: AMI, SCADA, OMS, GIS and others, for the ongoing monitoring and management of events as well as for ongoing data analysis with respect to the reliability and efficiency of the power grid.

5. Analysis and Presentation of Reliability of a Distribution Grid on the Basis of Data Obtained from the System AMI in a Friendly Way for DSO Employees

The obtained results of calculations of SAIDI/SAIFI indicators for individual groups of customers, LV network lines and MV/LV stations are saved to the database. The tabular presentation of the obtained results is illegible, does not provide information about the surveyed population and, moreover, their analysis is time-consuming. Graphical presentation on charts, e.g., of the vioplot type, enables the transfer of information in an efficient and fast manner, showing the distribution of the estimated statistical reliability measures. Examples of suggestions for graphic presentation of the calculated distributions of the SAIDI and SAIFI index values are presented in the further part of the work in Figure 3 and Figure 4.
According to the previously described procedure, the event times from the entire AMI infrastructure were correlated. All events registered in BM were linked with events from customer meters in PoC. In the next step of the procedure, events from AMI were correlated with events from the OMS system (including events recorded by the SCADA system). Determining the relations between events from different sources was necessary in order to determine the actual values of the SAIDI and SAIFI of particular MV/LV stations and individual consumers for scheduled and unscheduled interruptions. For the sake of further analyses, it was also necessary to assign an event cause code in accordance with the event dictionary, both for scheduled and unscheduled events, according to the OMS. The research also supported an important practical conclusion, namely, that it was necessary to synchronize the BM and PoC clocks with the SCADA system time (for practical purposes, it could be assumed that the accuracy of the clock synchronization should not be below 0.1 s).
On the basis of the research, a statistical analysis was made of the calculated reliability indices for scheduled interruptions (SAIDI_p, SAIFI_p) and for unscheduled interruptions (SAIDI_np, SAIFI_np) for the MV/LV stations under test. The results of the calculations were presented in the convenient form of a number of charts. This study used nonparametric estimation methods for the analysis of network reliability, so that the distribution of estimated statistical measures was presented in a lucid way. One of the basic methods of nonparametric estimation was the concept of kernel estimators, proposed at the turn of the 1950s and 1960s independently by Rosenblatt and Parzen, with their basic concept being derived from the problem of estimating the density function of probability distribution. Since then, many researchers have dealt with this subject, for example Silverman [35].
A typical problem to be dealt with by means of kernel density estimation (KDE) is the determination of the probability density function of a random variable on the basis of a sample. A practical application of KDE is illustrated in Figure 3, showing plots of the SAIDI and SAIFI density functions of scheduled (left) and unscheduled (right) interruptions obtained using the ks library kde function in the R environment [36].
It should be noted that the reliability indices were obtained from various data sources, i.e., PoC, BM and OMS. Figure 4 presents vioplot functions representing the results of calculations of SAIDI_np for unscheduled interruptions obtained from PoC, BM and OMS, performed in the R environment with the use of nonparametric methods.
The differences visible in Figure 4 both resulted from the fact that the data from the PoC meters contained all detailed information on individual outages of consumers. Some of these events were not registered in the balancing meters or in the OMS. An important issue was also the method of parameterization of consumers’ and balancing meters, as well as a different method of event registration by the SCADA system. On the basis of the research, it was recommended that the reliability level should be analyzed by taking into account jointly the information from the OMS system and the balancing meters. For the identification and localization of local events (individual consumers), it was necessary to correlate events from PoC that were not registered in the BM and/or OMS.

6. Selected AMI Projects Implemented by DSOs in Poland

In Poland, the first implementation of the AMI system began in 2010. First, extensive technical and economic analyses were carried out, which indicated the benefits of implementing such a system. In this section, two selected AMI projects implemented by distribution network operators in Poland—Enea Operator and Tauron Dystrybucja are presented.
Enea Operator implemented the AMI system in its area, the purpose of which was to dynamically determine the path of power supply to the Points of Consumption (PoC). This system constantly monitors the normal network operation and its SAIDI/SAIFI. The main goals of this project were to standardize the nomenclature for all data, implement a common service bus and develop a notification application [37].
The final outcome of the project is dynamic determination of the power path for the LV network. Ultimately, the project is to end with the full implementation of the SCADA system at LV. The block diagram of dynamic data exchange for the AMI system implemented at Enea Operator is shown in Figure 5.
The implementation of the project required Enea Operator to obtain and verify the geographic coordinates of each PoC, unify the nomenclature in system databases-GIS, SCADA, AMI, as well as to carry out physical verification in the field. Following the initial assumptions, the entire process of determining the power path for each new point of consumption is carried out automatically. The number of consumers in OMS is also updated dynamically. SAIDI/SAIFI are calculated on the basis of constantly updated data. In addition, the smartphone notification application for customer enables them to report power failures in their households along with information on the failure/scheduled shutdown status [37].
Tauron Dystrybucja has completed the AMIplus Smart City Wrocław project, the aim of which was to develop an innovative platform application for advanced analysis of large data sets from the AMI measurement infrastructure based on innovative models and mathematical tools. The scope of the project included the installation of the measurement infrastructure as part of the AMIplus Smart City Wrocław Project, currently with over 370,000 m. AMIplus provides to its customers current information on energy consumption. The system is supplemented with the MDM platform shown in Figure 6. The functional areas of the above-mentioned project include analytics of data from AMI electricity meters installed at customers, analytics of data from balancing meters installed at MV/LV stations, determination of SAIDI/SAIFI, determination of standard load profiles, and the identification of illegal electricity consumption. Due to the requirement of flexible processing of large amounts of data, this research uses the cloud computing technology, and specifically the Microsoft Azure solution in the Platform as a Service model.
AMIplus Smart City Wrocław is currently analyzing measurement data and events from over 405,000 remote-reading meters. These meters send information about electricity consumption in 15-min intervals, making about 1.1 million readings per month, which amount to the data growth at the level of nearly 1 TB per month [38].

7. Conclusions

The analyses carried out in this study allow for the following conclusions:
  • AMI is the basic element of Smart Grid, enabling the transmission of transparent information about events occurring inside the LV grid and a key component of the system SCADA_LV, which is a tool for the visualization of events on the LV grid schema;
  • AMI provides the most reliable data for the precise location of disturbances in the grid, and also for determining reliability indices for particular consumers, network tracks, transformer stations etc.;
  • AMI offers the following advantages for increasing reliability: identification and location of faults; automatic sending of a message about a breakdown; lower cost of restoring the energy supply; tracing transient states; knowledge on faults and better consumer satisfaction as well as obtaining information on all anomalous events in the grid, including theft, and effective control;
  • Using the presented methodology we can obtain the values of the SAIDI and SAIFI. Thanks to automated alerts from the AMI we get information on the occurrence of a failure sooner, which will allow the DSO more efficient reduction of power outages.
Recommendations for future research:
  • The current challenge for the AMI, apart from identifying and locating faults in the LV network during disturbances, is also to supervise the quality of energy supplied to a customer during its normal operation. It is the challenge of particular importance in the areas of networks with high saturation of distributed generation in electricity storage and charging stations for electric cars (e.g., voltage level regulation, network switching);
  • It is advisable to carry out further research so that the AMI would provide fuller and more reliable information that can be used it to obtain multifaceted knowledge about the network;
  • It is advisable to present the calculated values of the AIDI and SAIFI indicators in a user-friendly manner. It is suggested to visualize the results of the reliability calculation on the diagram of a LV distribution network together with the geographic map as the background;
  • IIoT solutions based on a combination of devices, including smart meters and clouds, appear to be especially promising for future projects conducted by the DSO;
  • The added value of the IIoT solutions lies in the possibility of exploiting available data for fulfilling the DSM and DR tasks.

Author Contributions

Conceptualization, M.K., T.P.; methodology, validation, investigation, M.K.; analysis, M.K., T.P.; data curation, M.K.; writing—original draft preparation, writing—review and editing, M.K., T.P.; theoretical modelling, M.K.; software, visualization, M.K., T.P.; supervision, project administration, T.P. All authors have read and agreed to the published version of the manuscript.

Funding

This research received no external funding.

Conflicts of Interest

Authors declare no conflict of interest.

Abbreviations

ADMSAdvanced Distribution Management System
AMIAdvanced Metering Infrastructure
BMbalancing meter
DESDistributed Energy Sources
DRDemand Response
DSMDemand-Side Management
DSODistribution System Operator
EPSElectricity Power System
GISGeographic Information System
HANHome Area Network
IIoTIndustrial Internet of Things
KDEKernel Density Estimation
LVLow Voltage
MDMMeter Data Management
MVMedium Voltage
OMSOutage Management System
PoCPoints of Consumption
SAIDISystem Average Interruption Duration Index
SAIDI_pSAIDI for scheduled interruptions
SAIDI_npSAIDI for for unscheduled interruptions
SAIFISystem Average Interruption Frequency Index
SAIFI_pSAIFI for scheduled interruptions
SAIFI_npSAIFI for unscheduled interruptions
SCADASupervisory Control and Data Acquisition
SGSmart Grid
SMSmart Metering
VPPVirtual Power Plants

References

  1. Minister of Economy Order the Matter of Detailed Operation of the Power System, 4th May 2007, § 40–§ 41. (In Polish).
  2. Short, T.A. Distribution Reliability and Power Quality; CRC Press: Boca Raton, FL, USA, 2018. [Google Scholar]
  3. Amin, S.M.; Wollenberg, B.F. Toward a smart grid: Power delivery for the 21st century. IEEE Power Energy Mag. 2005, 3, 34–41. [Google Scholar] [CrossRef]
  4. Jasiński, M.; Sikorski, T.; Kaczorowska, D.; Rezmer, J.; Suresh, V.; Leonowicz, Z.; Kostyla, P.; Szymańda, J.; Janik, P. A Case Study on Power Quality in a Virtual Power Plant: Long Term Assessment and Global Index Application. Energies 2020, 13, 6578. [Google Scholar] [CrossRef]
  5. Le, D.P.; Bui, D.M.; Ngo, C.C.; Le, A.M.T. FLISR Approach for Smart Distribution Networks Using E-Terra Software—A Case Study. Energies 2018, 11, 3333. [Google Scholar] [CrossRef] [Green Version]
  6. Prado, G.; Sidney, J. The Power of Big Data and Data Analytics for AMI Data: A Case Study. Sensors 2020, 20, 3289. [Google Scholar] [CrossRef]
  7. Moslehi, K.; Kumar, R. Smart Grid-a reliability perspective. IEEE Smart Grid 2010, 1, 57–64. [Google Scholar] [CrossRef]
  8. Kornatka, M. Analysis of the Exploitation Failure Rate in Polish MV Networks. Eksploat. Niezawodn. Maint. Reliab. 2018, 20, 413–419. [Google Scholar] [CrossRef]
  9. Tomczykowski, J. Power grids of the five largest operators. Electricity 2015, 5, 23–25. (In Polish) [Google Scholar]
  10. Polish Power Transmission and Distribution Association. Distribution and Transmission of Electricity Report. Poznań. 2021. Available online: http://www.raport.ptpiree.pl (accessed on 20 August 2021). (In Polish).
  11. Gupta, P.; Ramesh, A.; Satvik, D.; Nagasundari, S.; HoLVavalli, P.B. Simulation of SCADA System for Advanced Metering Infrastructure in Smart Grid. In Proceedings of the 2020 International Conference on Smart Electronics and Communication (ICOSEC), Tamilnadu, India, 10–12 September 2020; pp. 1071–1077. [Google Scholar] [CrossRef]
  12. Martínez, R.; Martínez, R.; Cubillos, C.; Vargas, H.; Baeza, J.M. Self-healing of electric distribution networks: A review. In Proceedings of the 7th International Conference on Computers Communication and Control (ICCCC), Beijing, China, 16–18 August 2018. [Google Scholar] [CrossRef]
  13. Yang, L.; Xiao, F.; Chen, H.; Lai, Y.; Chollot, Y. The Experiences of Decentralized Self-Healing Grid. In Proceedings of the 2019 IEEE 8th International Conference on Advanced Power System Automation and Protection (APAP), Xi’an China, 21–24 October 2019; pp. 1864–1867. [Google Scholar] [CrossRef]
  14. Ndawula, M.B.; Djokic, S.Z.; Hernando-Gil, I. Reliability Enhancement in Power Networks under Uncertainty from Distributed Energy Resources. Energies 2019, 12, 531. [Google Scholar] [CrossRef] [Green Version]
  15. Palensky, S.; Dietrich, D. Demand Side Management: Demand Response, Intelligent Energy Systems, Smart Loads. IEEE Ind. Inf. 2011, 3, 381–388. [Google Scholar] [CrossRef] [Green Version]
  16. DMS Jabir, H.J.; Teh, J.; Ishak, D.; Abunima, H. Impacts of Demand-Side Management on Electrical Power Systems: A Review. Energies 2018, 11, 1050. [Google Scholar] [CrossRef] [Green Version]
  17. Improving Reliability and Efficiency. Available online: https://www.itron.com/-/media/resources/case-studies/comedcasestudy.pdf (accessed on 20 August 2021).
  18. EnerNOC Awarded Demand Response Contract with ARENA Enel X. Available online: https://www.enelx.com/n-a/en/press-releases/enernoc-awarded-50-megawatt-demand-response-contract-in-australia (accessed on 20 August 2021).
  19. Gaggero, G.B.; Marchese, M.; Moheddine, A.; Patrone, F. A Possible Smart Metering System Evolution for Rural and Remote Areas Employing Unmanned Aerial Vehicles and Internet of Things in Smart Grids. Sensors 2021, 21, 1627. [Google Scholar] [CrossRef]
  20. Black, J.; Hoffman, A.; Hong, T.; Roberts, J.; Wang, P. Weather Data for Energy Analytics: From Modeling Outages and Reliability Indices to Simulating Distributed Photovoltaic Fleets. IEEE Power Energy Mag. 2018, 16, 43–53. [Google Scholar] [CrossRef]
  21. Khalifeeh, R.; Alrashidi, H.; Sellami, N.; Mallick, T.; Issa, W. State-of-the-Art Review on the Energy Performance of Semi-Transparent Building Integrated Photovoltaic across a Range of Different Climatic and Environmental Conditions. Energies 2021, 14, 3412. [Google Scholar] [CrossRef]
  22. Pelle, M.; Lucchi, E.; Maturi, L.; Astigarraga, A.; Causone, F. Coloured BIPV Technologies: Methodological and Experimental Assessment for Architecturally Sensitive Areas. Energies 2020, 13, 4506. [Google Scholar] [CrossRef]
  23. López-Prado, J.L.; Vélez, J.I.; Garcia-Llinás, G.A. Reliability Evaluation in Distribution Networks with Microgrids: Review and Classification of the Literature. Energies 2020, 13, 6189. [Google Scholar] [CrossRef]
  24. Reinders, A. Perceived and Reported Reliability of the Electricity Supply at Three Urban Locations in Indonesia. Energies 2018, 11, 140. [Google Scholar] [CrossRef] [Green Version]
  25. Kornatka, M.; Gawlak, A.; Dudek, G. Determination of Reliability Indicators of the Distribution Network Based on Data from AMI. In E3S Web of Conferences; EDP Sciences: Ulis, France, 2019; Volume 84, p. 02004. [Google Scholar] [CrossRef] [Green Version]
  26. AMI and Reliability: Fewer Outages, Faster Restorations, Improved Communications. Available online: https://www.landisgyr.com/webfoowp-content/uploads/2020/07/ami-reliability.pdf (accessed on 20 August 2021).
  27. Yan, H.; Nick, J.; Jianzhong, W. Smart Metering for Outage Management of Electric Power Distribution Networks. Enrgy Proced 2016, 103, 159–164. [Google Scholar] [CrossRef]
  28. Khalil, R.A.; Saeed, N.; Masood, M.; Fard, Y.M.; Alouini, M.S.; Al-Naffouri, T.Y. Deep Learning in the Industrial Internet of Things: Potentials. Challenges, and Emerging Applications. IEEE Internet Things 2021, 8, 11016–11040. [Google Scholar] [CrossRef]
  29. Talari, S.; Shafie-khah, M.; Siano, P.; Loia, V.; Tommasetti, A.; Catalão, J.P.S. A Review of Smart Cities Based on the Internet of Things Concept. Energies 2017, 10, 421. [Google Scholar] [CrossRef] [Green Version]
  30. Parvez, I.; Sarwat, A.I.; Wei, L.; Sundararajan, A. Securing Metering Infrastructure of Smart Grid: A Machine Learning and Localization Based Key Management Approach. Energies 2016, 9, 691. [Google Scholar] [CrossRef]
  31. Bonnefoi, R.; Moy, C.; Palicot, J. Advanced metering infrastructure backhaul reliability improvement with cognitive radio. In Proceedings of the 7th IEEE International Conference on Smart Grid Communications, Sydney, Australia, 6–9 November 2016; pp. 230–236. [Google Scholar] [CrossRef] [Green Version]
  32. Mahapatra, C.; Moharana, A.K.; Leung, V.C.M. Energy Management in Smart Cities Based on Internet of Things: Peak Demand Reduction and Energy Savings. Sensors 2017, 17, 2812. [Google Scholar] [CrossRef] [PubMed] [Green Version]
  33. Meliopoulos, A.; Polymeneas, E.; Tan, Z.; Huang, R.; Zhao, D. Advanced Distribution Management System. IEEE Trans. Smart Grid 2013, 4, 2109–2117. [Google Scholar] [CrossRef]
  34. Dubey, A.; Bose, A.; Liu, M.; Ochoa, L. Paving the Way for Advanced Distribution Management Systems Applications: Making the Most of Models and Data. IEEE Power Energy Mag. 2020, 18, 63–75. [Google Scholar] [CrossRef]
  35. Silverman, B.W. Density Estimation for Statistics, Data Analysis; Chapman and Hall: London, UK, 1986. [Google Scholar]
  36. R Evelopment Core Team© R: A Language and Environment for Statistical Computing. Available online: https://cran.r-project.org/ (accessed on 20 August 2021).
  37. Dynamic Power Supply Path Determination of the Point of Consumption (PoC) in the Enea Operator Grid. Available online: https://www.operator.enea.pl/operator/o-enei-operator/publikacje-merytoryczne/dynamic-power-supply-path-determination-of-the-point-of-consumption-eng.pdf (accessed on 20 August 2021).
  38. AMIplus for You. Available online: https://amiplus.tauron-dystrybucja.pl/amiplus-for-you (accessed on 20 August 2021).
Figure 1. The analyzed simplified network structure with installed balancing meters (BM) and customer meters (PoC) (the designations are described in the text).
Energies 14 05986 g001
Figure 2. Model of data processing concerning the events recorded in the meters of the AMI system integrated with other systems (e.g., OMS, SCADA, GIS) in order to obtain knowledge about the condition of the power system.
Energies 14 05986 g002
Figure 3. Graphical presentation of reliability indicators for planned (SAIDI_p, SAIFI_p) and unplanned (SAIDI_np, SAIFI_np) interruptions for MV/LV stations obtained using the kde function.
Energies 14 05986 g003
Figure 4. Vioplots of SAIDI_np for unscheduled events in the MV/LV transformer stations obtained on the basis of data from PoC, BM and OMS.
Energies 14 05986 g004
Figure 5. PoC data flow in the target solution—dynamic data update [37].
Energies 14 05986 g005
Figure 6. The general conception of the MDM Platform. Own study based on [38].
Energies 14 05986 g006
Table 1. Initial steps of the event record of a balancing meter.
BM_idSEDSETEEDEETN_CUSTOMERSCAUSE_id
12345672019-02-1012:15:502019-02-1012:28:0145n12
12345672019-02-1315:59:032019-02-1316:03:2745p30
12345672019-02-1316:19:062019-02-1317:06:2045p30
12345672019-02-1317:07:182019-02-1317:18:0745p10
12345672019-02-1920:16:072019-02-1920:18:0745n12
Publisher’s Note: MDPI stays neutral with regard to jurisdictional claims in published maps and institutional affiliations.

