Abstract
To meet climate change goals, the decarbonisation of the UK electricity supply is crucial. Increased geographic diversity and resource use could help provide grid and market stability and reduce CO2 intensive balancing actions. The main purpose of this research is to investigate the impact of geographic diversity and Scottish island renewable energy on the UK network. This has been done by using the energy market modelling software PLEXOS with results validated using data for 2017/18. The model considers spatial diversification and forecasting errors by modelling day-ahead and intra-day markets with nodes for each distribution network operator region and island group. It was concluded that Scottish island renewable capacity could have a stabilising effect on the variability of renewables in terms of electricity generated, prices and forecasting errors, from the timescale of the entire year down to hours. The ability of geographically diverse generators to receive a higher price for electricity generated was shown to decrease with increased island capacity. Instances of negative prices were reduced with supply diversity (wind and marine) but not geographic diversity. Day ahead errors showed most clearly the impact of diversity of supply, particularly given the predictability of tidal stream generation.
1. Introduction
The UK has recently upgraded climate change goals to net zero emissions by 2050, which in Scotland have been brought forward to 2045 [1]. This will require significant investment in renewable generation capacity to replace dependence on fossil fuels. The feasibility of a 100% renewable energy system has been demonstrated in a number of studies [2,3,4], but one of the key challenges remains maximizing the utilisation of intermittent renewable generation. The electricity sector will need to cope with a high penetration of variable renewable energy whilst maintaining demand–supply balance. Undesirable outcomes of this include reliance on dispatchable fossil fuel generation for balancing actions (increasing costs and emissions) and increased instability of electricity prices, indicating a need for additional investment in remedial actions such as storage, balancing services or demand side management [5]. Research has focused on solutions to this, identifying optimal deployment of sectoral coupling, storage, renewable energy technology mixes and interconnections as key [6]. Net zero emissions energy networks will need to be much more dispersed and technologically diverse to meet growing demand using renewable resources.
Wind energy has been a pillar of these outlooks as one of the most proliferative generation technologies in recent years, accounting for 68% of the 70.6 TWh growth in renewable generation in the UK from 2000 to 2018 [7]. In these feasibility studies, though, there is recognition that a wider range of technologies will be needed. Although the technology is immature, marine energy from waves and tidal currents could play an important role. Tidal generation is entirely predictable and wave is more so than wind, and therefore could be a valuable and complementary feature with other forms of energy in an increasingly non-dispatchable electricity network [8,9,10]. More detailed understanding of the interactions of technology and interconnections would help to inform where investment would be best placed to reduce the emissions of electricity generation.
1.1. Impacts of Diversity
To minimise the downsides of intermittency, geographic diversity of supply and diversity of the type of generation can play a vital role. Distance between generators decreases the correlation in intermittent supply, leading to a more consistent supply with reduced errors in forecasting [11]. For wind, the correlation tends to less than 0.1 at distances greater than 1000 km, equivalent to the length of the mainland UK. This has economic benefits, as more uniquely placed generators can sell electricity at higher prices when generation is low for more closely grouped ones. More geographically diverse generators contribute less to the “self-cannibalisation” effect, whereby electricity prices fall and/or fluctuate greatly during times of peak generation, such as during high winds [12]. This can even lead to periods of negative pricing, as generators will sell electricity at marginal cost minus the strike price in order to avoid costs for not generating [5]. This volatility was experienced in the UK for the first time in May 2019 and will likely only increase with greater renewable capacity. Similar benefits result from diversity of supply type, with the complementarity of renewable resources being highlighted as key to maximising the benefits from each resource [13]. Particularly for marine energy, the benefits of enhanced predictability may be currently undervalued [14].
Throughout the literature, transmission constraints have been identified as critical to maximising the potential benefits of renewable energy diversity of supply. Improved transmission capacity between countries allows for greater utilisation of renewable energy [15]. In the form of interconnection of islands, it has been recognised that to facilitate the benefits of renewable energy, interconnections are essential [16]. Overall, geographic and supply type diversity could have benefits for both the grid and increasingly volatile energy markets by improving the consistency of intermittent renewable generation and reducing the need for CO2 intensive balancing services. Predictable renewable energy from tidal currents could be particularly undervalued in this respect [14]. In the UK, the recent reinstating of contract for difference (CfD: the financial support mechanism for renewables in the UK) eligibility for onshore wind (revoked in 2015), with a separate category for “remote island wind” [17], shows that the importance of diversity has been reassessed.
1.2. The Scottish Islands’ Renewable Energy Potential
The Scottish Islands have long been recognised as possessing a significant renewable energy resource, with estimated technically extractable resources of 2.8 GW of wind, 5.6 GW for wave and 4.5 GW for tidal [18]. Given the improved diversity of supply, this could minimise the downsides to the system whilst maximising renewable deployment. Particularly for wind, the favourable geography of the islands can allow onshore wind generators to achieve capacity factors of more than 50% [18], which would usually be exceptional for an offshore generator. Analysis has also shown that Scottish island wind capacity could receive up to a 4% higher price than on- or off-shore Scottish wind [18]. Recognition of this significant resource has led to the deployment of wind capacity up to the limits of local infrastructure. Active network management systems are used in the main island groups to manage network constraints by curtailing excess electricity [1,19,20]. In spite of this, Orkney has been a net exporter of electricity every month since 2015 [19]. Wind and marine energy will be the focus of this research as they have the highest potential resource. The economically feasible hydropower capacity for all the islands has been estimated at just 25 MW [21]. The islands, at the northern extremes of the UK, have some of the lowest average irradiances in the country. Whilst solar PV might contribute at a local level, transmission-scale projects will never be as economically viable as elsewhere in the UK: therefore, it is not considered further in this assessment of impacts on the whole electricity network.
Interconnections scaled for electricity export for Shetland (600 MW) [1], Orkney (220 MW) [19] and the Western Isles (450–600 MW) [20] have been planned for several years, but the regulator Ofgem was caught in a cause-and-effect dilemma. It would not support island interconnections without CfDs being awarded to prospective generation, which, due to the distance from existing infrastructure, was hamstrung by high transmission network use of system costs. The process had largely stagnated until recently, with the Shetland connection being approved by Ofgem [1]. At the end of 2019, the 220 MW link with Orkney was also conditionally approved provided that 135 MW of CfD capacity is approved [19].
Development of transmission scale renewable energy capacity and transmission on the Scottish islands presents a case study of two of the main aspects identified as crucial in shifting towards a 100% renewable energy system: diversity of technology and geographic diversity of supply through interconnections [6]. Analysis of Scottish island renewable integration would facilitate improved understanding of the impacts of these two aspects on the UK network and whether increased transmission and generation costs could be offset by other benefits. To do so, a whole electricity network model has been developed to compare scenarios of Scottish island renewable capacity, whilst capturing the constraints of intermittency and transmission which were identified as crucial [15]. This will be used to assess the potential contribution of Scottish island renewables to decarbonisation of the UK electricity system and expand the literature on what role technology and geographic diversity have in meeting net zero targets.
2. Methodology
To assess the impacts of Scottish island renewable diversity on the UK electricity network, a power systems model has been developed. This requires a model with sufficient spatial and temporal resolution to capture the potential benefits relating to intermittency. A scenarios-based assessment will be carried out to isolate the benefits of additional renewable capacity, geographic diversity and diversity of supply.
2.1. Electricity Market Model Outline
PLEXOS (version 8.200, Energy Exemplar) is an energy market simulation software, widely used in industry and available under a free academic license [22]. It has been used to model electricity markets with high shares of renewables [23,24] and island interconnections [16]. It consists of a graphical user interface for inputting data and setting up the parameters to optimise. The main strength of PLEXOS is optimising electricity dispatch with consideration of transmission constraints, which was identified in literature as essential to understanding geographic diversity. For this research, the basic configuration of the software consists of nodes of demand and generators connected by transmission lines.
Given varying techno-economic parameters and constraints (such as generator availability, transmission capacities, stochastic variability, variable costs, start costs, maintenance rates, etc.), PLEXOS will minimise the objective function of the overall system cost. The academic license uses the open-source GNU Linear Programming Kit solver, with this work using mixed integer linear programming methods.
2.2. Setting Up the Baseline Model
To provide the spatial resolution required to capture impacts of geographic diversity, 23 nodes (Figure 1) were used to represent the UK and Scottish islands: one node for each distribution network operator (DNO) region, each main group of Scottish islands and 3 areas of grid constraints identified in North Scotland [25]. A variety of techno-economic demand, transmission and generation data were collected from government and industry sources, as discussed in the following sections. This was either in tabulated form or collected and processed using application programming interfaces (APIs) with Python (version 3.8) and the package Pandas (version 1.2.3). The baseline scenario has been modelled with an hourly timestep using data for the year April 2017 to April 2018 as this was the best resolution and most recent year demand data were available from all the DNOs.
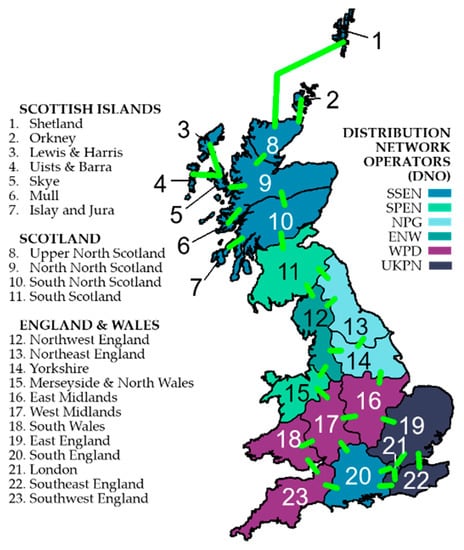
Figure 1.
Map of the nodes, colour coded by DNO and with modelled transmission lines between nodes shown in green.
2.2.1. Demand
DNOs were contacted privately to obtain historic demand data which were made available under a non-disclosure agreement. Northern Power Grid (NPG), Electricity Northwest (ENW), Scottish Power Energy Network (SPEN), UK Power Networks (UKPN) and Western Power Distribution (WPD) provided data for most of the UK. Data for Northern Scotland (including the islands) and Southern England were approximated by combining typical daily and yearly profiles with known maximum and minimum MW demand levels from Scottish & Southern Electricity Networks’ (SSEN) Long Term Development Schedule [26]. This local transformer demand does not account for transmission line losses. Using Department of Business, Energy and Industrial Strategy (BEIS) annual generation data [7], the nodal demand was then scaled to match the overall generation and include transmission losses.
2.2.2. Generator Characteristics
Number of generators and capacities were taken from BEIS [7] for traditional generators and the Renewable Energy Planning Database [27] for renewables and storage. Technology types, installed capacity and number units are given in Table 1 and Table 2. Using geographic data, the 2570 generators were sorted into nodal capacities for each technology type; 600 MW in 48 units of battery storage was included in addition to 4 units of pumped hydro, totalling 2830 MW [27].

Table 1.
Thermal generation techno-economic characteristics used in the model, with the source given in the first column unless otherwise noted in each cell. Heat rates and start costs are given in bands of cold/warm/hot.
Table 2.
Renewable generation techno-economic characteristics used in the model, with the source given in the first column unless otherwise noted in each cell.
To model the techno-economic characteristics of each generation type, parameters shown in Table 1 and Table 2 were included. For thermal generation, this was provided in three “bands” of cold, warm and hot to reflect variability given the start state of the generator. Inclusion of this was important to reflect higher start-up costs, which have significant implications for the merit order of dispatch [38]. Costs of CO2 emissions were taken from the BEIS [39]. Battery costs and operational characteristics were taken from the International Renewable Energy Agency [40]. A simplified rating factor was 60% for hydro in the winter (October to March) and 40% for hydro in the summer (April to September) [27].
Data collection was a challenging aspect of this study, apparent in the wide variety of sources required to develop the model (given in Table 1 and Table 2). It was attempted as far as reasonably possible to find data specific to the UK and as close to the modelled year of 2017. Whilst this still may lead to discrepancies between data sources (such as differing ages of studies, methodologies, geographic specificity or technological relevance), the validation of the model with actual generation and price data will support its applicability.
To get nodal power factors for wind and solar, Python and data from the Renewable Energy Planning Database were used to look up capacity factors using an API to extract data from the NASAs MERRA-2 wind model [41] and the EUMETSTAT SARAH solar model [42]. Co-ordinates, hub height and turbine size (sorted into bands of 1 MW, allowing more relevant power curves to be included) for each of the 690 wind and 1115 solar generators were inputted via the API, which returned an hourly capacity factor. Adjusting for the capacity of each generator, these were combined to give an hourly, power-averaged capacity factor for each node of the model. Results were scaled by a factor to match total generation volumes and maximum outputs published by BEIS [7], as for other analysis using the API [41]. This discrepancy could be due to the use of idealised power curves, which has been identified as a factor leading to discrepancies between predicted and actual power output [11]. Assuming the discrepancy applies uniformly, this model will still capture the temporal and spatial variability in the UKs renewable generation.
Tidal current data for a site off Orkney were provided by the European Marine Energy Centre (EMEC) through an academic non-disclosure agreement. Given the Scottish islands have a similarly semi-diurnal tidal pattern [43], these data were adapted for each location by adjusting the peak velocities and altering the timings of high/low tides (i.e., periods of zero tidal velocity). Tidal stream velocities were then converted into a capacity factor using a power curve [44]. Hourly wave profiles were similarly estimated using wave data from EMEC which were converted to a capacity factor using the power curves of three devices, given the lack of convergence yet on a type of single device [45].
The range of currently active renewable subsidies were included: CfDs, feed-in-tariffs and renewable obligation certificates [46]. To simplify the model, these were approximated as a capacity-averaged single payment band (£/MWh) for each technology type (biomass, wind, solar, wave and tidal). Short-term operating reserve requirements and applicable generators were included using data published by National Grid [47]. This gave capacity requirements of 2330–2530 MW depending on the season, with a minimum delivery of 25 MW for a minimum of 2 h, provided within a maximum time of 4 h.
2.2.3. Transmission Constraints
Limits of transmission capacity were included to connect nodes (Figure 1). Local DNO managed distribution networks are connected by the transmission network, capacity data for which was sourced from the National Grid [25]. As a major aspect of this study is to investigate the spatial impact of renewable energy, regional transmission network use of system charges were included following the National Grid methodology and applied to larger generation connected to the transmission network [48]. Distribution network charges were included for other generators following methodologies published by each DNO [49,50,51,52,53,54]. Locational pricing was also included in balancing system use of system charges. This is calculated using a transmission loss multiplier, which biases towards higher payments by generation in areas of low demand and vice versa [55]. This is particularly important as the North of Scotland is the most disadvantaged by this methodology- by up to 3% compared to other areas.
Interconnections with other European countries have not been included in this model. Literature on European interconnections shows that increased connection allows prices to converge and curtailment of renewables to decrease [15]: given the goal of comparing scenarios of similar renewable capacity, the impact of interconnections on prices is assumed to be similar across scenarios.
2.2.4. Day-Ahead Model
Capturing the stochastic variability in demand and renewable energy (largely caused by weather fluctuations) is vital to modelling the impacts of geographic diversity of supply. To do so, PLEXOS runs a day-ahead model interleaved with an intra-day model. Day-ahead generation is committed to meet forecasted demand, which is then passed onto the intra-day model, including stochastic variability in forecasts of wind, solar and demand. Thermal generation is committed to the day-ahead dispatch, whilst wind, solar and demand are altered according to the forecasted errors. Due to the discrepancy between day-ahead dispatch and the intra-day renewable generation, dispatchable (thermal) capacity is required to ramp up or down to match demand. The intra-day model then passes end conditions to be used as initial conditions for the next period of the day-ahead model.
To calibrate forecast errors, the difference between hourly day-ahead and actual recorded wind, solar and demand data was collected using the Balancing Mechanism Reporting Service API [56]. Using Python, the data were fitted to an auto-regressive integrated moving average (ARIMA) time series model, used in simulating wind speed variability [57]. Along with the standard deviation, the ARIMA parameters were used in PLEXOS to generate a stochastic series around the values for wind capacity factors, solar capacity factors and demand profiles. This was calibrated so that the total matched national average daily forecasting error data published by National Grid [58]. Wind [11], solar [59] and demand [60] modelled forecasts for each node were correlated according to the distance between nodes, to account for the effects of geographic diversity. This simplifies the weather-related correlations between demand, wind and solar forecasting errors, but research is limited on these relationships. Correlating the errors in proportion to the distance is the most important aspect in understanding the benefits of Scottish island wind, as forecasting errors will be less correlated than to generation in nearby areas.
2.3. Scenarios
To assess the impact of Scottish island renewable energy, scenarios of installed renewable capacity have been compared. The baseline scenario of the model was calibrated to the year of 2017/18 using historic generation volumes and electricity prices. Two further scenarios of capacity have been modelled:
- Planned Interconnections (PI): representative onshore wind capacity and interconnections currently in development between generation providers, network operators and Ofgem (planned to come online starting 2025). This scenario will consider the impacts of increased geographic diversity of supply.
- Improved Interconnections (II): representative of the maximum technically extractable resource for onshore wind, wave and tidal current. This scenario will consider the impacts of both geographic and supply diversity.
The capacities for each scenario are given in Table 3 and mapped in Figure 2. To compare these, less geographically diverse scenarios of identical offshore wind capacity has also been modelled (i.e., located in areas being developed closer to existing projects)—BAU_PI and BAU_II. This is representative of government support for offshore wind, which until a recent U-turn, excluded onshore wind from CfD auctions [17] and will allow the impacts of geographic diversity to be isolated from the impacts of additional renewable capacity. For the BAU_II and BAU_PI cases, offshore wind capacity was located approximately as for the 3600 MW Doggerbank farm, set to be completed by 2025 [46]—shown as light blue in Figure 2. Analysis of the difference from the baseline and between scenarios allows consideration of the impacts of geographic and supply diversity (i.e., marine in addition to wind) separately. Differences between the PI and BAU_PI scenarios will indicate the impacts of geographic diversity, differences between the II and BAU_II scenarios will indicate the impacts of supply diversity.
Table 3.
Capacity installed (MW) additional to the BAU scenario.
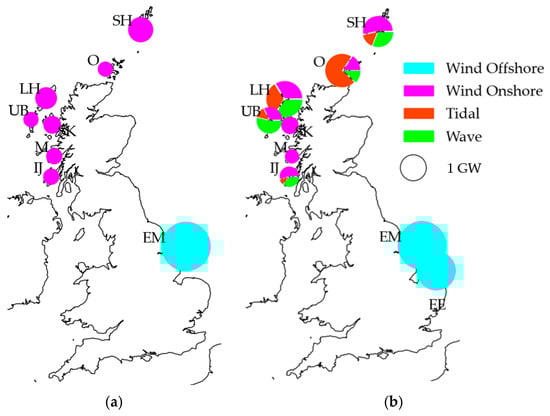
Figure 2.
Modelled capacity for each scenario group: (a) Planned Interconnections (PI) and (b) Improved Interconnections (II). Island capacity is shown for onshore wind (pink), tidal (orange) and wave (green), which will be compared with identical offshore wind (blue). Island/modelled node names abbreviated here are given in.
3. Results
3.1. Baseline Scenario Validation
The baseline scenario of the model was simulated in PLEXOS using data from 2017/18. This allows total annual generation for each generator type (Figure 3) to be compared with annual statistics published by BEIS [7]. This shows that the model captures the spread of electricity generated by source.
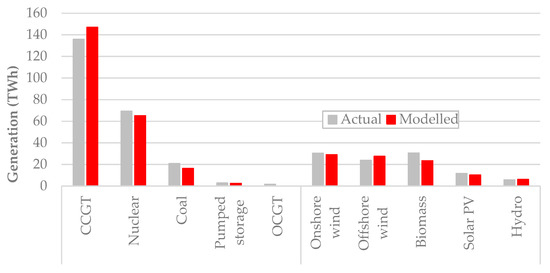
Figure 3.
Comparison of actual [7] and modelled annual generation.
3.1.1. Wind Capacity Factor Model
The wind capacity factor model can be validated against hourly generation data published by Elexon [56], who manage electricity market balancing in the UK (Figure 4). This shows that the model captures the general variability but overestimates the peaks of generation with a root mean square error of 0.85 GW. As for other analyses using the Renewables Ninja API service [41], the modelled total generation has been scaled to match annual generation volumes published by BEIS [7]. Differences in peak generation are likely due to differences in the reporting mechanisms between Elexon and BEIS.
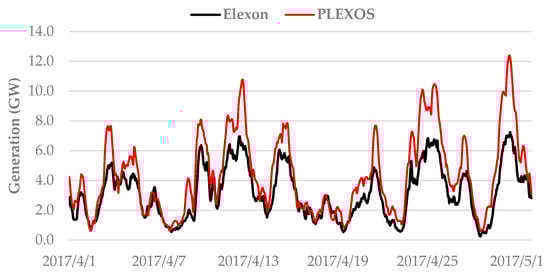
Figure 4.
Comparison of a representative month of Elexon [56] and modelled wind generation, showing that the model captures the temporal variability but not the actual amount due to differing data collection methodologies between Elexon and BEIS.
Correlation of wind generation by distance between each node (21 onshore and 10 offshore wind) can be compared to actual data (Figure 5): the plotted trendline shows the correlation from analysis of 2080 actual wind sites across the UK [11]. The correlation is shown for wind farms aggregated by node and not for individual sites—as for the trendline. This has the effect of smoothing over any variability in weather patterns at a lower resolution for individual sites, so correlation is exaggerated between closer nodes.
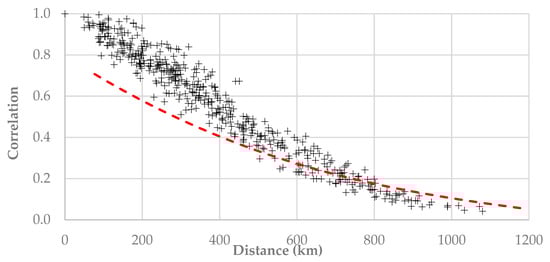
Figure 5.
Pearson’s correlation coefficient between nodes, with trend line adapted from [11] (p. 118). Correlation at closer distances is exaggerated due to nodes being the summation of multiple generators.
3.1.2. Electricity Price Validation
The modelled average daily electricity prices were compared to actual values (Figure 6). The model captures the daily variation of electricity prices: with increasing demand, generators will move further up the merit order and so the marginal cost will increase. The model does not capture the entire price—shown by the consistent difference. This is due to long-run marginal costs (e.g., generator fixed costs, insurance, financial costs, etc.) not being included via generator uplift, as it resulted in exponentially longer simulation times. When the average difference between the PLEXOS price generated from short run marginal costs and actual costs [56] is added to the PLEXOS results, it can be seen that the model follows actual prices with a mean absolute error (MAE) of 3.5%.
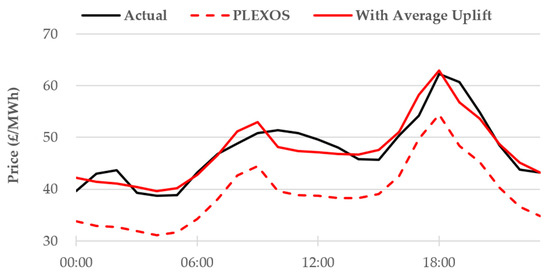
Figure 6.
Hourly average electricity prices. The costs of generation do not include an uplift for long run marginal costs, so this is shown as the solid green line.
Average monthly electricity prices are also better reflected with the uplift included (Figure 7). For the months September to February, the model has a MAE of 2.6%, but this increases in the summer months to 18.8%. Total demand between the spring/summer and autumn/winter months varies by 22%; therefore, similarly sized perturbations (e.g., unplanned outages, forecast errors, etc.) to the system would likely have a larger impact on the electricity prices in the spring and summer.
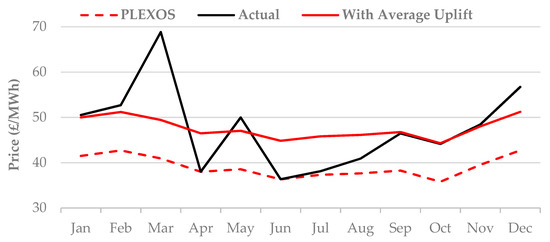
Figure 7.
Monthly average electricity prices. The costs of generation do not include an uplift for long run marginal costs, so this is shown as the solid green line.
3.2. Scenario Results
For each scenario, the main impact of interconnections and additional capacity is increased renewable generation which directly displaces CCGT (Figure 8). The change in coal generation is minimal- indicating that the improved geographic diversity and diversity of supply have lesser impact on times when the coal is the marginal generation (i.e., when renewable generation is low). The island onshore wind scenario (PI) can be seen to generate more energy than the equivalent offshore wind capacity (BAU_PI), demonstrating the improved capacity factors of island wind. The scenario including marine energy (II) does not demonstrate the same, as wave and tidal energy have lower capacity factors.
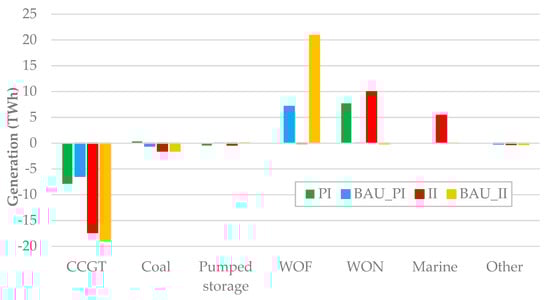
Figure 8.
Difference of generation from the baseline BAU scenario. Biomass, nuclear, solar PV and hydro have been grouped in “Other” as they did not vary significantly between scenarios; wave and tidal have been grouped as “Marine”.
Pumped hydro generation is an indicator of variability in day-ahead forecasting errors, as it can respond the fastest to fluctuations. The PI and II scenarios (Figure 8) have reduced pumped hydro generation by 18.9% and 15.3% from the BAU_PI and BAU_II, respectively—indicating that the geographic diversity of supply reduces variability and reduces the need for balancing actions.
The renewable energy generated from onshore wind, offshore wind, wave and tidal stream can be compared by scenario (Table 4). This shows that for both island capacity scenarios, the increased geographic diversity results in less variance in supply relative to equivalent offshore wind capacity. As a percentage of the installed scenario capacity, the standard deviation is 7.2% (2.3 GW total) and 12.2% (7 GW total) lower for the PI and II scenarios, respectively. At the scale of days, the mean daily standard deviation is also lower—by 9% for PI and 62% for the II scenarios. At the scale of hours, the mean absolute hourly change is also lower for the island scenarios. This shows that from the time scale of hours all the way up to across the year, consistency of supply can be improved with geographic diversity but to a greater extent through diversity of generation.
Table 4.
Description of the generation from onshore wind, offshore wind, wave and tidal by scenario, showing the reduction in variability in all cases for the island capacity scenarios PI and II relative to their offshore wind counterparts BAU_PI and BAU_II.
The total energy generated is greater for the PI island scenario—representative of the impressive capacity factors for island wind. For the II scenario, though, it is less due to the lower capacity factors of wave (23%) and tidal energy (28%) compared to offshore wind (35%). The minimum generation values are also greater for each island capacity scenario; the majority of this comes from the diversity of generator type (i.e., with wave and tidal in II)—590 MW—than diversity of supply at 160 MW in the PI case. This indicates that for 2017/18 renewable capacity factors (noting that wind capacity factors have been shown to vary by up to 40% interannually [62]), the island scenarios would allow for reduced dispatchable generation equivalent to 5–8% of the additional installed renewable capacity.
The load duration curve for additional renewable capacity for each scenario (Figure 9) shows the flatter the line, the more consistent the electricity generated is. The II scenario provides greater energy from 50–100% of the time—approximately 800 MW (11% of scenario capacity) more during the lowest 20% of generation periods on the right of the graph. However, both BAU_PI and BAU_II scenarios can be seen to generate more electricity for at least 50% of the time towards the left of the graph. This is likely due to the weather patterns causing high generation, making peak generation more concentrated than spread out over the entire UK.
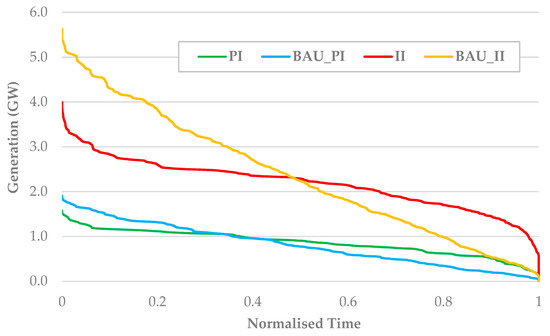
Figure 9.
Load duration curve for renewable energy generated by scenario island or offshore wind capacity. A flatter, horizontal curve indicates more consistent generation.
Fossil fuel generation also shows improved consistency from diversity of type and location (Table 5). The difference between the mean generation of the II and PI scenarios are 180 MW and 70 MW, respectively, in the II and PI scenarios. Compared to the baseline scenarios, the standard deviation changes much less compared to the renewable generation, indicating that renewable capacity could be increased without significantly increasing volatility of the required balancing fossil fuel dispatch. Overall, diversity does improve variance of supply by 5–12%. Mean daily standard deviation is reduced for the II scenario, even relative to the BAU case, but increased between the PI and BAU_PI scenarios, though the difference is slight, 0.3%. Lastly, the mean absolute hourly change actually decreases for each scenario, for II by 1.5% and for PI by 2.0%—significantly, given that the total fossil electricity generation is 3.4 times greater than the renewable total.
Table 5.
Description of generation (GW) from fossil fuel sources (CCGT, coal and OCGT), showing how reduced variability of renewable corresponds to an equivalent but less pronounced reduction in variability for dispatchable generation.
3.2.1. Electricity Prices
The BAU_II scenario (Table 6) produces the cheapest average electricity price, but the II scenario produces the least variance. This is due to the BAU_II scenario producing a larger volume of cheaper renewable energy given the higher capacity factors of offshore wind (averaging 34%) relative to marine energy (23% for wave and 28% for tidal). The variable costs of generation assumed for the model are also greater for wave and tidal— which represent a best-case scenario in the future, as the technology is still extremely immature. Given this immaturity and the still falling costs of offshore wind (which at the most recent CfD auctions won the same strike price of £39.65/MWh as onshore wind planned for the islands [46]), offshore wind would have a greater impact on bringing down electricity prices. However, the variance is lowest for the II, indicating the importance of supply diversity—particularly from predictable tidal stream.
Table 6.
Description of the electricity prices (£/MWh) of each scenario, showing that island renewable capacity would not reduce average prices as much as offshore wind, but would have a stabilizing effect on the volatility of prices.
Figure 10 shows how geographic diversity allows renewable generators to receive a higher price when there is less renewable capacity. It shows that island generation could receive a higher price—by up to 4.2% for the BAU_II scenario—which corroborates with another study of Scottish island generation [18]. This benefit is greatly reduced, though, as island capacity increases. For the II and PI scenarios, the average price is only 1.0% higher than the mainland. For marine energy, the diversity of supply allows these generators to receive 5.6–6.5% higher prices even with the increased capacity of the II and PI scenarios. Whilst this is a notable increase, it does not offset the much higher levelized costs of electricity, estimated to be 4–6 times greater for projects starting in 2025 [30].
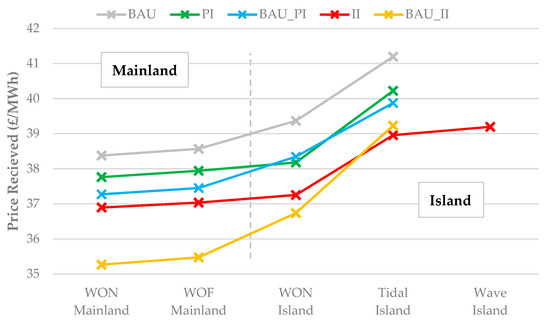
Figure 10.
Average price received by generator by island and mainland locations. Island wind can receive a higher price due lower correlation in supply, but this is reduced with increased capacity (PI & II). Marine energy can consistently receiver a higher price due to the difference in resource.
3.2.2. Day Ahead Errors
The day ahead errors are shown for onshore, offshore and wave in Table 7, with subsequent balancing actions shown for CCGT, OCGT and coal in Table 8. The geographic diversity of the islands clearly shows the impact of the distance reducing the correlation of forecasting errors. This also reduces the changes in day ahead generation for dispatchable fossil generators, both in terms of the MAE and the variance at a national level. The MAE and standard deviation are even improved for the II and PI scenarios relative to the baseline case. This effect carries over considering both national aggregate actions (mean) and considering the absolute values of all balancing actions (absolute mean): i.e., accounting for transmission constraints. Reduction in forecasting errors is indeed the clearest indicator of improvement due to geographic diversity: importantly, because increased cycling of dispatchable fossil generation increases operation and maintenance costs and periods of sub-optimal loading, resulting in higher emissions [31].
Table 7.
Aggregate (i.e., national) day ahead errors (MW) for onshore wind, offshore wind and wave, showing that geographic diversity reduces forecasting errors.
Table 8.
Day ahead balancing actions (MW) for CCGT, OGCT and coal, showing that geographic and supply diversity reduces the need for balancing despite increased renewable energy.
3.2.3. Negative Prices
Negative pricing indicates a lack of flexibility in a renewable-dominated electricity system as generators are unable to find buyers. Due to near zero marginal costs, penalties for curtailment and subsidies, renewable generators (as well as nuclear and biomass for which generation is contracted seasons ahead) can bid at negative prices during periods of high supply and low demand [5]. This indicates demand for investment in compensatory measures (such as electricity storage, balancing services, demand management, etc.); therefore, occurrences of it can be used as an indicator of renewable saturation in an electricity market. Day-ahead, generators can bid at negative prices to avoid shut-down costs, particularly for nuclear power and subsidised renewables (bidding at the negative strike price plus any short run marginal costs). On the intra-day market, non-subsidised renewable generators have also been shown to offer negative prices to avoid penalty costs [5]. This can be considered with respect to the generation dispatched by scenario.
The occurrences of negative prices, defined as periods where electricity demand is entirely met by intermittent renewables and generation scheduled seasons ahead (nuclear and biomass), is described in Table 9 and illustrated in Figure 11. In terms of the number of occurrences and their total length, Scottish island wind capacity (PI scenario) increases the total duration by 26% but decreases the average duration by 11%. Supply diversity (II scenario) has a much more marked impact, reducing the total duration by 46% and the average duration by 18%. This suggests that supply diversity can have a more significant impact in improving consistency of supply.
Table 9.
Instances of negative electricity prices, showing that, in all cases, negative hours increase, with geographic diversity increasing instances but supply diversity reducing them by almost half.
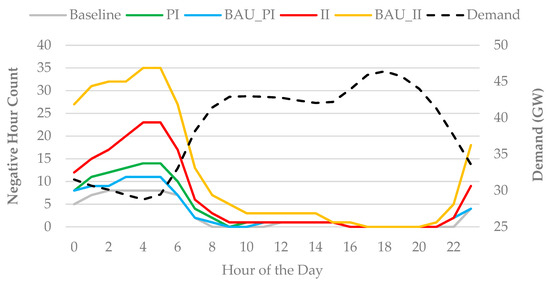
Figure 11.
Occurrences of negative price hours throughout the day compared with average UK demand.
Figure 11 shows the inverse relationship between periods of negative pricing and demand; they are most likely to occur early in the morning or late at night when demand is lowest. These results do not conclusively demonstrate that the geographic diversity would have a significant impact during periods of high renewable generation. With the BAU_II scenario having additional capacity only of wind in one geographic location, periods of high wind are more likely to result in negative prices, as the electricity generated is dependent on this single resource. The benefits of the II scenario in this case arise not from geographic diversity—again, it is possible that the weather patterns which dictate exceptionally high winds will affect the whole country—but from the diversity of generation through marine energy. Whilst it seems that offshore wind could reduce energy prices on average, it is important to consider the extreme cases of generation, such as would occur during negative prices, as this is what drives the requirements for expensive stand-by generation, currently provided by gas.
4. Discussion
Comparison of four scenarios (PI/BAU_PI with 2.3 GW of either island onshore wind or offshore wind and II/BAU_II with 7.0 GW of either island wind/marine or offshore wind) has allowed the impacts of geographic diversity and diversity of supply to be considered separately. Geographic diversity (PI scenario) reduced variance of renewable electricity generated across timescales, reducing the standard deviation of hourly renewable generation and mean hourly change by 4.8% and 10.0%, respectively. Geographic diversity and diversity of supply (II scenario) had an even more pronounced effect, reducing the standard deviation by 16.4% and the mean hourly change by 10.8%. This corroborates other studies which demonstrated reduced supply and price variance through supply diversity with marine energy [14,63]. With equivalent offshore wind capacity, the standard deviation of dispatchable fossil generation increases by 5.4%, but for the island scenario the value increases by 0.1%—which is important, as higher ramp rates lead to less efficient operation and higher emissions than normal operations [31]. The minimum renewable generation is greater for both geographic (PI- 160 MW) and supply diversity scenarios (II- 590 MW), indicating that island capacity could need up to 8% less balancing actions during the lowest periods of generation. This is, however, offset by the increased capacity factors of offshore wind relative to marine energy, meaning 1.6 TWh more renewable generation (7.6% more than the additional II generation) from offshore wind, albeit with increased variability. Examination of the load duration curves for additional capacity in each scenario (Figure 9) demonstrates that this is offset by less consistent supply, with longer periods of higher generation offset by longer periods of lower generation.
Given the lower variable costs, offshore wind had a greater reduction of average electricity prices, by 0.6% (BAU_PI) and 2.1% (BAU_II) compared to the islands scenarios. The ability of geographically diverse generators to receive a higher price for electricity generated was shown to decrease with increased island capacity. Day ahead errors showed most clearly the impact of diversity of supply, particularly given the complete predictability of tidal generation, with the II scenario MAE being 2.1% lower than the BAU_PI scenario despite providing 12.0 TWh more renewable energy (21% of BAU total). These benefits correlated with a reduction in subsequent fossil fuel balancing actions, even improving on the baseline scenario. Lastly, instances of negative prices were reduced with supply diversity but not geographic diversity, indicating that the scale of weather patterns which drive periods of high generation could exceed the geographic size of the UK.
Overall, the results show that for the modelled year of 2017/18, geographic diversity from the Scottish islands should have a positive impact on the variance of UK electricity markets. This supports the 2019 reinstatement of economic support for onshore wind and the separate island wind CfD category [17]. The impact of diversity of supply through marine energy would, however, be greater. Although the cost of generation is currently much higher for marine energy by a factor of at least several times, this analysis shows there are benefits in terms of generation consistency which should also be considered. This becomes more important as increased renewable capacity coupled with falling costs of generation leads to balancing actions becoming an increasingly large proportion of electricity prices. Policies to support the developing marine energy industry (or indeed other emerging renewable energy sources) could be instrumental in reducing generation costs and decreasing reliance on dispatchable generation, which for the immediate future will be reliant on CO2 emitting technologies. Both wind and solar have both demonstrated tremendous reductions in costs far exceeding historic predictions, with BEIS predicting in 2016 a lower bound of 93 £/MWh for round 3 offshore wind [30], which just 3 years later, in 2019, was allocated at 39.65 £/MWh [46].
It is important to qualify that this research represents a distinct snapshot of the UK electricity network which is currently changing rapidly. Increased dependency on renewable energy in the future will likely exacerbate current instabilities without further investment or increased expenditure in balancing actions. It is likely that this would increase the value of supply stability provided by the Scottish islands, but further analysis is required to understand the impacts of future supply mixes and locations. As renewable generation can also vary significantly from year to year, further analysis is needed to determine how inter-annual variation could affect this. Additionally, given that the Scottish islands are distant from areas of demand, interconnectors will have a significant price tag. Perhaps the similar benefits could be realised through storage alongside offshore wind. Optimisation of renewable and storage expansion could lead to a cheaper solution with comparable benefits to stability; this should be considered in assessing development pathways. Finally, demand is likely to alter significantly in the future with transport/heating electrification, storage and demand side management technologies. The dynamics between this and intermittency of renewable is much harder to predict and so would require demand side modelling.
5. Conclusions
The Scottish islands have a renewable energy potential which could benefit the entire UK network, with literature indicating that this could include benefits from both geographic and supply diversity. To assess this, a baseline model has been developed in the energy systems modelling software PLEXOS which characterises the generation, demand and transmission constraints of the UK electricity network with spatial and stochastic variability of renewable generation. The model has been validated with actual generation and price data, indicating that it captures the merit order and patterns at various timescales caused by fluctuations in demand. Four scenarios of additional capacity were modelled to isolate impacts of geographic and supply diversity separately: PI (2.3 GW of island wind compared with equivalent offshore wind) and II (7.0 GW of island wind, tidal and wave compared with equivalent offshore wind). These demonstrated that at scales of days up to years, variability of supply, prices and day-ahead generation predictions was reduced by geographic diversity of supply, but to a greater extent by geographic and supply diversity. This could help to offset the increased cost of island wind and marine relative to offshore wind by reducing investment in costly balancing actions. Instances of negative prices increased for the PI scenarios but reduced significantly for the II scenario, indicating that supply diversity could have a much more important role in reducing dependency on dispatchable generation during periods of low renewable generation. Further research is needed to understand the impacts of interannual variability, additional storage capacity, changes in demand patterns and changes in overall supply mix which will likely occur in the future.
Author Contributions
C.M.—conceptualization, methodology, data curation, formal analysis, validation, writing (original draft) and project administration. C.S.—conceptualization, methodology, writing, supervision, writing (review & editing) and funding acquisition. All authors have read and agreed to the published version of the manuscript.
Funding
This research was funded by the Engineering and Physical Science Research Council (EPRSC) reference number 2262945.
Institutional Review Board Statement
Not applicable.
Informed Consent Statement
Not applicable.
Data Availability Statement
Demand data for each DNO region is available under academic non-disclosure agreement from DNOs at the following addresses:
- UKPN—Connections.Gateway@ukpowernetworks.co.uk;
- SPEN—requestforplansscotland@spenergynetworks.co.uk;
- NPG—LTDS@northernpowergrid.com;
- WPD—wpdltds@westernpower.co.uk;
- ENW—LTDS@enwl.co.uk;
Historic gas prices from Energy Solutions and measured wave energy data from EMEC are also available under academic non-disclosure agreement.
All other data are publicly available where referenced in the text.
Acknowledgments
The authors would like to thank contacts at the NPG, ENW, SPEN, UKPN, WPD, Energy Solutions and EMEC for providing historic data.
Conflicts of Interest
The authors declare no conflict of interest.
Nomenclature
| API | Application programming interface |
| ARIMA | Auto-regressive integrated moving average model |
| BAU | Business-as-usual |
| BEIS | Department of Business, Environment and Strategy |
| CCGT | Combined cycle gas turbine |
| CfD | Contract for Difference |
| DNO | Distribution network operator |
| EMEC | European Marine Energy Research Centre |
| ENW | Electricity Northwest |
| II | Improved interconnections |
| NPG | Northern Powergrid |
| OCGT | Open cycle gas turbine |
| PI | Planned interconnections |
| SPEN | Scottish Power Energy Networks |
| SSEN | Scottish Southern Electricity Networks |
| UKPN | UK Power Network |
| VO&M | Variable operation and maintenance costs (£/MWh) |
| WOF | Offshore wind |
| WON | Onshore wind |
| WPD | Western Power Distribution |
References
- Ofgem Shetland Transmission Project: Consultation on Proposed Final Needs Case and Delivery Model. Available online: https://www.ofgem.gov.uk/publications-and-updates/shetland-transmission-project-consultation-proposed-final-needs-case-and-delivery-model (accessed on 13 May 2020).
- Alexander, M.J.; James, P.; Richardson, N. Energy Storage against Interconnection as a Balancing Mechanism for a 100% Renewable UK Electricity Grid. IET Renew. Power Gener. 2015, 9, 131–141. [Google Scholar] [CrossRef]
- Aghahosseini, A.; Bogdanov, D.; Barbosa, L.S.N.S.; Breyer, C. Analysing the Feasibility of Powering the Americas with Renewable Energy and Inter-Regional Grid Interconnections by 2030. Renew. Sustain. Energy Rev. 2019, 105, 187–205. [Google Scholar] [CrossRef]
- Hansen, K.; Mathiesen, B.V.; Skov, I.R. Full Energy System Transition towards 100% Renewable Energy in Germany in 2050. Renew. Sustain. Energy Rev. 2019, 102, 1–13. [Google Scholar] [CrossRef]
- Baringa Negative Pricing in the GB Wholesale Electricity Market. Available online: https://assets.publishing.service.gov.uk/government/uploads/system/uploads/attachment_data/file/441809/Baringa_DECC_CfD_Negative_Pricing_Report.pdf (accessed on 31 January 2020).
- Hansen, K.; Breyer, C.; Lund, H. Status and Perspectives on 100% Renewable Energy Systems. Energy 2019, 175, 471–480. [Google Scholar] [CrossRef]
- Department of Business Energy and Industrial Strategy Digest of UK Energy Statistics (DUKES): Electricity. Available online: https://www.gov.uk/government/statistics/electricity-chapter-5-digest-of-united-kingdom-energy-statistics-dukes (accessed on 22 November 2019).
- Lund, H. Large-Scale Integration of Optimal Combinations of PV, Wind and Wave Power into the Electricity Supply. Renew. Energy 2006, 31, 503–515. [Google Scholar] [CrossRef]
- Lund, H.; Mathiesen, B.V. Energy System Analysis of 100% Renewable Energy Systems-The Case of Denmark in Years 2030 and 2050. Energy 2009, 34, 524–531. [Google Scholar] [CrossRef]
- Jacobson, M.Z.; Delucchi, M.A.; Bauer, Z.A.F.; Goodman, S.C.; Chapman, W.E.; Cameron, M.A.; Bozonnat, C.; Chobadi, L.; Clonts, H.A.; Enevoldsen, P.; et al. 100% Clean and Renewable Wind, Water, and Sunlight All-Sector Energy Roadmaps for 139 Countries of the World. Joule 2017, 1, 108–121. [Google Scholar] [CrossRef]
- Sinden, G. Characteristics of the UK Wind Resource: Long-Term Patterns and Relationship to Electricity Demand. Energy Policy 2007, 35, 112–127. [Google Scholar] [CrossRef]
- Odeh, R.P.; Watts, D. Impacts of Wind and Solar Spatial Diversification on Its Market Value: A Case Study of the Chilean Electricity Market. Renew. Sustain. Energy Rev. 2019, 111, 442–461. [Google Scholar] [CrossRef]
- Li, J.; Chen, S.; Wu, Y.; Wang, Q.; Liu, X.; Qi, L.; Lu, X.; Gao, L. How to Make Better Use of Intermittent and Variable Energy? A Review of Wind and Photovoltaic Power Consumption in China. Renew. Sustain. Energy Rev. 2021, 137, 110626. [Google Scholar] [CrossRef]
- Lewis, M.; McNaughton, J.; Márquez-Dominguez, C.; Todeschini, G.; Togneri, M.; Masters, I.; Allmark, M.; Stallard, T.; Neill, S.; Goward-Brown, A.; et al. Power Variability of Tidal-Stream Energy and Implications for Electricity Supply. Energy 2019, 183, 1061–1074. [Google Scholar] [CrossRef]
- Pean, E.; Pirouti, M.; Qadrdan, M. Role of the GB-France Electricity Interconnectors in Integration of Variable Renewable Generation. Renew. Energy 2016, 99, 307–314. [Google Scholar] [CrossRef]
- Zafeiratou, E.; Spataru, C. Sustainable Island Power System—Scenario Analysis for Crete under the Energy Trilemma Index. Sustain. Cities Soc. 2018, 41, 378–391. [Google Scholar] [CrossRef]
- Department of Business Energy and Industrial Strategy Contracts for Difference for Low Carbon Electricity Generation Consultation on Proposed Amendments to the Scheme. Available online: https://assets.publishing.service.gov.uk/government/uploads/system/uploads/attachment_data/file/869778/cfd-ar4-proposed-amendments-consultation.pdf (accessed on 7 May 2020).
- Baringa Scottish Islands Renewable Project Final Report. Available online: https://assets.publishing.service.gov.uk/government/uploads/system/uploads/attachment_data/file/199038/Scottish_Islands_Renewable_Project_Baringa_TNEI_FINAL_Report_Publication_version_14May2013__2_.pdf (accessed on 11 October 2019).
- Ofgem Decision: Conditional Approval of the SWW Final Needs Case for the Orkney Electricity Transmission Project. Available online: https://www.ofgem.gov.uk/system/files/docs/2019/09/conditional_decision_on_orkney_final_needs_case_2.pdf (accessed on 3 October 2019).
- Ofgem Update on the Final Needs Case Western Isles. Available online: https://www.ofgem.gov.uk/system/files/docs/2019/10/update_on_the_final_needs_case_western_isles_0.pdf (accessed on 23 October 2019).
- Scottish Hydropower Resource Study; Final Report to the Scottish Government through the Hydro Sub Group (FHSG) Nick Forrest Associates Ltd.; Scottish Institute of Sustainable Technology (SISTech) and Black & Veatch Ltd.: Edinburgh, UK, 2008.
- Energy Exemplar PLEXOS Market Simulation Software. Available online: https://energyexemplar.com/solutions/plexos/ (accessed on 22 October 2019).
- Dominkovic, D.F.; Stark, G.; Hodge, B.M.; Pedersen, A.S. Integrated Energy Planning with a High Share of Variable Renewable Energy Sources for a Caribbean Island. Energies 2018, 11, 2193. [Google Scholar] [CrossRef]
- Tomšić, Ž.; Raos, S.; Rajšl, I.; Ilak, P. Role of Electric Vehicles in Transition to Low Carbon Power System—Case Study Croatia. Energies 2020, 13, 6516. [Google Scholar] [CrossRef]
- National Grid Electricity Ten Year Statement. Available online: https://www.nationalgrideso.com/document/133836/download (accessed on 14 November 2019).
- Scottish and Southern Electricity Networks Scottish Hydro Electric Power Distribution Long Term Development Statement—Parts 1 and 2. Available online: https://www.ssen.co.uk/LTDSs/detail/ (accessed on 12 December 2019).
- Department of Business Energy and Industrial Strategy Renewable Energy Planning Database Quarterly Extract. Available online: https://www.gov.uk/government/publications/renewable-energy-planning-database-monthly-extract (accessed on 22 November 2019).
- DIW Berlin Data Documentation Current and Prospective Costs of Electricity Generation until 2050. Available online: www.diw.de (accessed on 5 November 2019).
- Gonzalez-Salazar, M.A.; Kirsten, T.; Prchlik, L. Review of the Operational Flexibility and Emissions of Gas—and Coal-Fired Power Plants in a Future with Growing Renewables. Renew. Sustain. Energy Rev. 2018, 82, 1497–1513. [Google Scholar] [CrossRef]
- Department of Business Energy and Industrial Strategy Electricity Generation Costs. Available online: www.nationalarchives.gov.uk/doc/open-government-licence/ (accessed on 9 March 2020).
- National Renewable Energy Laboratory Power Plant Cycling Costs. Available online: http://www.osti.gov/bridge (accessed on 9 March 2020).
- International Atomic Energy Agency Country Nuclear Power Profiles United Kingdom 2019. Available online: https://cnpp.iaea.org/countryprofiles/UnitedKingdom/UnitedKingdom.htm (accessed on 9 March 2020).
- Energy Solutions Day Ahead Gas Prices 2017–18 (Unpublished Data Available under Academic Non-Disclosure Agreement) 2020.
- Department of Business Energy and Industrial Strategy Prices of Fuels Purchased by Major Power Producers. Available online: https://www.gov.uk/government/statistical-data-sets/prices-of-fuels-purchased-by-major-power-producers (accessed on 9 March 2020).
- E4tech Biomass Prices. Available online: http://www.e4tech.com/wp-content/uploads/2016/01/100201Biomass_prices.pdf (accessed on 10 January 2020).
- Diuana, F.A.; Viviescas, C.; Schaeffer, R. An Analysis of the Impacts of Wind Power Penetration in the Power System of Southern Brazil. Energy 2019, 186, 1–13. [Google Scholar] [CrossRef]
- Marine Energy Technology Roadmap; UK Energy Research Centre and Energy Technologies Institute: London, UK, 2014.
- Deane, J.P.; Chiodi, A.; Gargiulo, M.; Ó Gallachóir, B.P. Soft-Linking of a Power Systems Model to an Energy Systems Model. Energy 2012, 42, 303–312. [Google Scholar] [CrossRef]
- Hirst, D. Carbon Price Floor (CPF) and the Price Support Mechanism; House of Commons Library: London, UK, 2018. [Google Scholar]
- International Renewable Energy Agency Electricity Storage and Renewables: Costs and Markets to 2030. Available online: www.irena.org (accessed on 9 April 2020).
- Staffell, I.; Pfenninger, S. Using Bias-Corrected Reanalysis to Simulate Current and Future Wind Power Output. Energy 2016, 114, 1224–1239. [Google Scholar] [CrossRef]
- Pfenninger, S.; Staffell, I. Long-Term Patterns of European PV Output Using 30 Years of Validated Hourly Reanalysis and Satellite Data. Energy 2016, 114, 1251–1265. [Google Scholar] [CrossRef]
- Neill, S.P.; Vögler, A.; Goward-Brown, A.J.; Baston, S.; Lewis, M.J.; Gillibrand, P.A.; Waldman, S.; Woolf, D.K. The Wave and Tidal Resource of Scotland. Renew. Energy 2017, 114, 3–17. [Google Scholar] [CrossRef]
- Hardisty, J. The Tidal Stream Power Curve: A Case Study. Energy Power Eng. 2012, 4, 132–136. [Google Scholar] [CrossRef]
- Guillou, N.; Chapalain, G. Annual and Seasonal Variabilities in the Performances of Wave Energy Converters. Energy 2018, 165, 812–823. [Google Scholar] [CrossRef]
- Low Carbon Contracts Company CFD Register. Available online: https://www.lowcarboncontracts.uk/cfds (accessed on 9 March 2020).
- National Grid STOR TR33 Market Information Report. Available online: http://www2.nationalgrid.com/uk/services/balancing-services/reserve-services/short-term-operating-reserve/ (accessed on 10 March 2020).
- National Grid TNUoS Guidance for Generators. Available online: https://www.nationalgrideso.com/document/138046/download (accessed on 5 December 2019).
- Western Power Distribution Charging Statements. Available online: https://www.westernpower.co.uk/our-network/use-of-system-charges/charging-statements (accessed on 10 April 2020).
- Scottish and Southern Electricity Networks Library Home. Available online: https://www.ssen.co.uk/Library/ChargingStatements/SEPD/ (accessed on 10 April 2020).
- Scottish Power Energy Networks Connections, Use of System and Metering Services. Available online: https://www.scottishpower.com/pages/connections_use_of_system_and_metering_services.aspx (accessed on 10 April 2020).
- UK Power Networks—Regulatory Information. Available online: https://www.ukpowernetworks.co.uk/internet/en/about-us/regulatory-information/ (accessed on 10 April 2020).
- Electricity North West Use of System Charges. Available online: https://www.enwl.co.uk/about-us/regulatory-information/use-of-system-charges (accessed on 10 April 2020).
- Northern Powergrid Use of System Charging Methodology. Available online: https://www.northernpowergrid.com/asset/1/document/2922.pdf (accessed on 10 April 2020).
- National Grid Introduction to Balancing Services Use of System Charges (BSUoS). Available online: https://www.nationalgrideso.com/document/137681/download (accessed on 9 March 2020).
- Elexon BMRS API and Data Push User Guide. Available online: https://www.elexon.co.uk/documents/training-guidance/bsc-guidance-notes/bmrs-api-and-data-push-user-guide-2/ (accessed on 9 March 2020).
- Soder, L. Simulation of Wind Speed Forecast Errors for Operation Planning of Multi-Area Power Systems. In Proceedings of the 8th International Conference on Probabilistic Methods Applied to Power Systems, Ames, IA, USA, 13–16 September 2004; pp. 723–728. [Google Scholar]
- Ofgem Review of MET Office Weather Forecast Accuracy. Available online: http://www.metoffice.gov.uk/about-us/who/accuracy/forecasts (accessed on 29 January 2020).
- Widén, J. Correlations between Large-Scale Solar and Wind Power in a Future Scenario for Sweden. IEEE Trans. Sustain. Energy 2011, 2, 177–184. [Google Scholar] [CrossRef]
- Gel, Y.; Raftery, A.E.; Gneiting, T.; Tebaldi, C.; Nychka, D.; Briggs, W.; Roulston, M.S.; Berrocal, V.J. Calibrated Probabilistic Mesoscale Weather Field Forecasting: The Geostatistical Output Perturbation Method. Sour. J. Am. Stat. Assoc. 2004, 99, 575–590. [Google Scholar] [CrossRef]
- Scottish and Southern Electricity Networks North of Scotland Future Energy Scenarios. Available online: https://www.ssen-transmission.co.uk/media/2913/north-of-scotland-future-energy-scenarios-summary-report.pdf (accessed on 8 January 2020).
- National Renewable Energy Laboratory Long-Term Wind Power Variability. Available online: http://www.osti.gov/bridge (accessed on 4 November 2019).
- Allan, G.; Eromenko, I.; McGregor, P.; Swales, K. The Regional Electricity Generation Mix in Scotland: A Portfolio Selection Approach Incorporating Marine Technologies. Energy Policy 2011, 39, 6–22. [Google Scholar] [CrossRef]
Publisher’s Note: MDPI stays neutral with regard to jurisdictional claims in published maps and institutional affiliations. |
© 2021 by the authors. Licensee MDPI, Basel, Switzerland. This article is an open access article distributed under the terms and conditions of the Creative Commons Attribution (CC BY) license (https://creativecommons.org/licenses/by/4.0/).