1. Introduction
The problem of remote temperature measurement of small objects in electrical power engineering is very important from the point of view of the quality and reliability of electricity supply. Obtaining early warning information about the occurrence of overheating, e.g., on lashing clamps of bridge connections, is very important, as it eliminates costly interruptions in the supply of electricity associated with the breaking of power lines supplying high voltage switchgears or substations.
The only modern tool for such diagnostics is a thermal imaging camera, which allows remote temperature measurement of these objects. It must be emphasised that a lashing clamp on a high voltage line is a small object. Therefore, in order to correctly measure the temperature of such an object, it is necessary to possess adequate knowledge and experience regarding the metrological capabilities of a thermal imaging camera when remotely measuring the temperature of a small object.
This article describes the basic metrological parameters of a thermal imaging camera, important in the interpretation of the remote temperature measurement of small objects. Based on this knowledge, a practical example is provided as to how to correctly remotely measure the temperature of a lashing clamp of bridge connections of a power line. A case of incorrect and correct remote temperature measurement of this small object is described, showing, at the same time, the differences in the readings for both cases.
This is an important case concerning the practice of non-contact temperature measurement of power line elements of small size and the interpretation of the recorded thermograms [
1,
2,
3,
4,
5,
6,
7,
8,
9,
10].
For this purpose, at the beginning of the article, the basic metrological parameters of observational and measurement thermal cameras are described.
2. Basic Metrological Parameters of Observation and Measurement Thermal Imaging Cameras
Thermal cameras (observation and measurement) are characterised by a number of parameters defining their observational characteristics and metrological properties. A few of them are described below. The knowledge of these parameters is essential for the correct interpretation of thermograms obtained from thermovision measurements of small objects in electricity power systems.
The MDTD and MRTD characteristics are the basis for most models of evaluating the observational quality of thermal imaging devices. Sometimes, these characteristics are abbreviated as MDT and MRT.
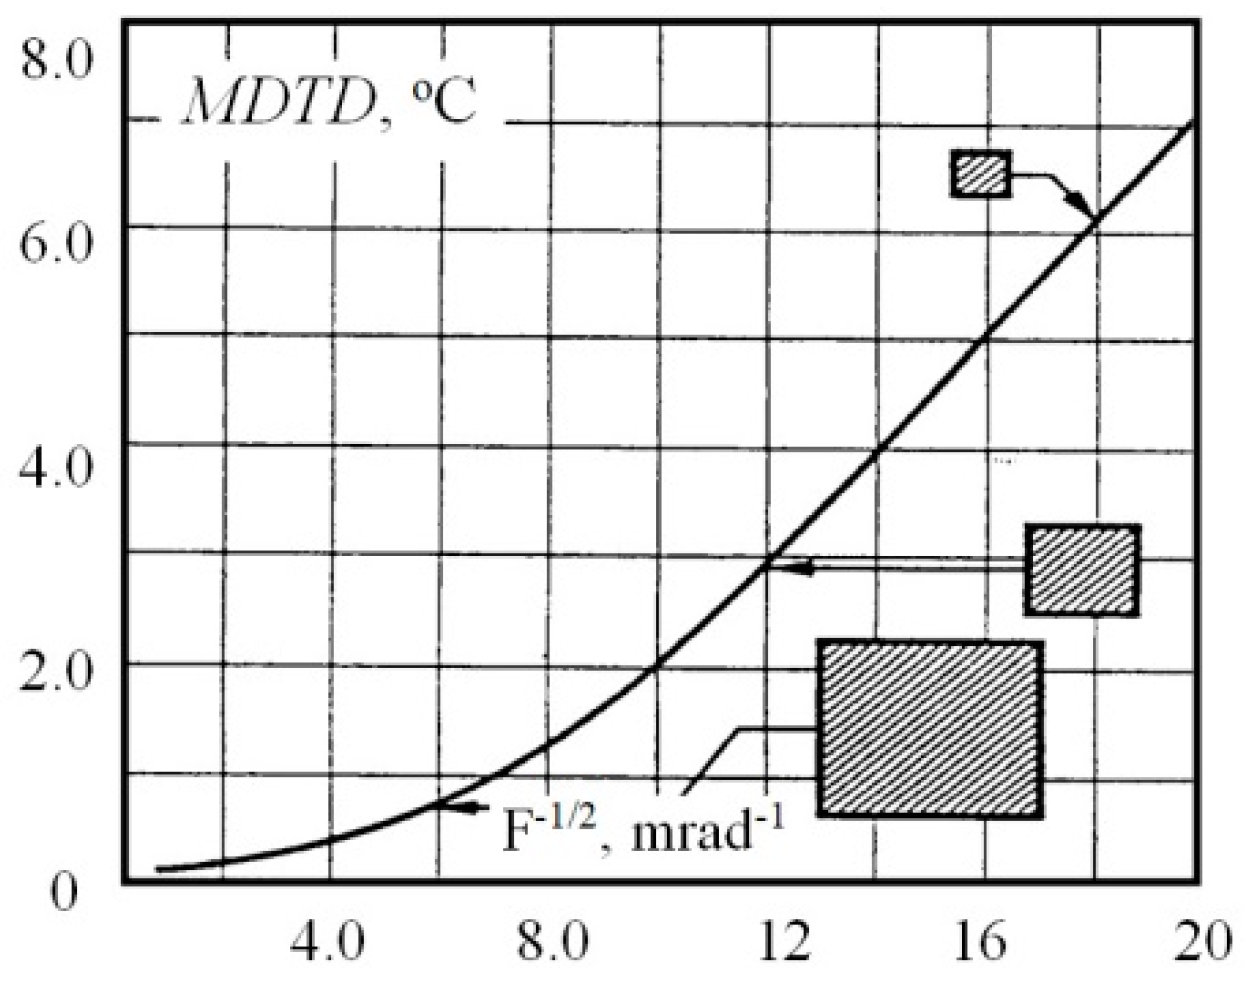
MDTD—(minimum detectable temperature difference) describes the ability of an observational thermal imaging camera to detect objects of small angular size against a homogeneous background. It is defined as the dependence of the minimum difference between the temperature of a square (or circular)
Tob test and the temperature of a homogeneous background
To, enabling detection of the test by an experienced observer on the camera monitor, on the inverse of the characteristic angular dimension of the test [
5,
6,
7]. In practice, a homogeneous background can be, for example, the sky or a body of water.
Figure 1 shows an example plot of the
MDTD characteristic with the relative dimensions of the test are, marked
F. It can be observed that this characteristic has no asymptote. This means that an object of any small angular size can be detected, provided that it has a sufficiently high temperature.
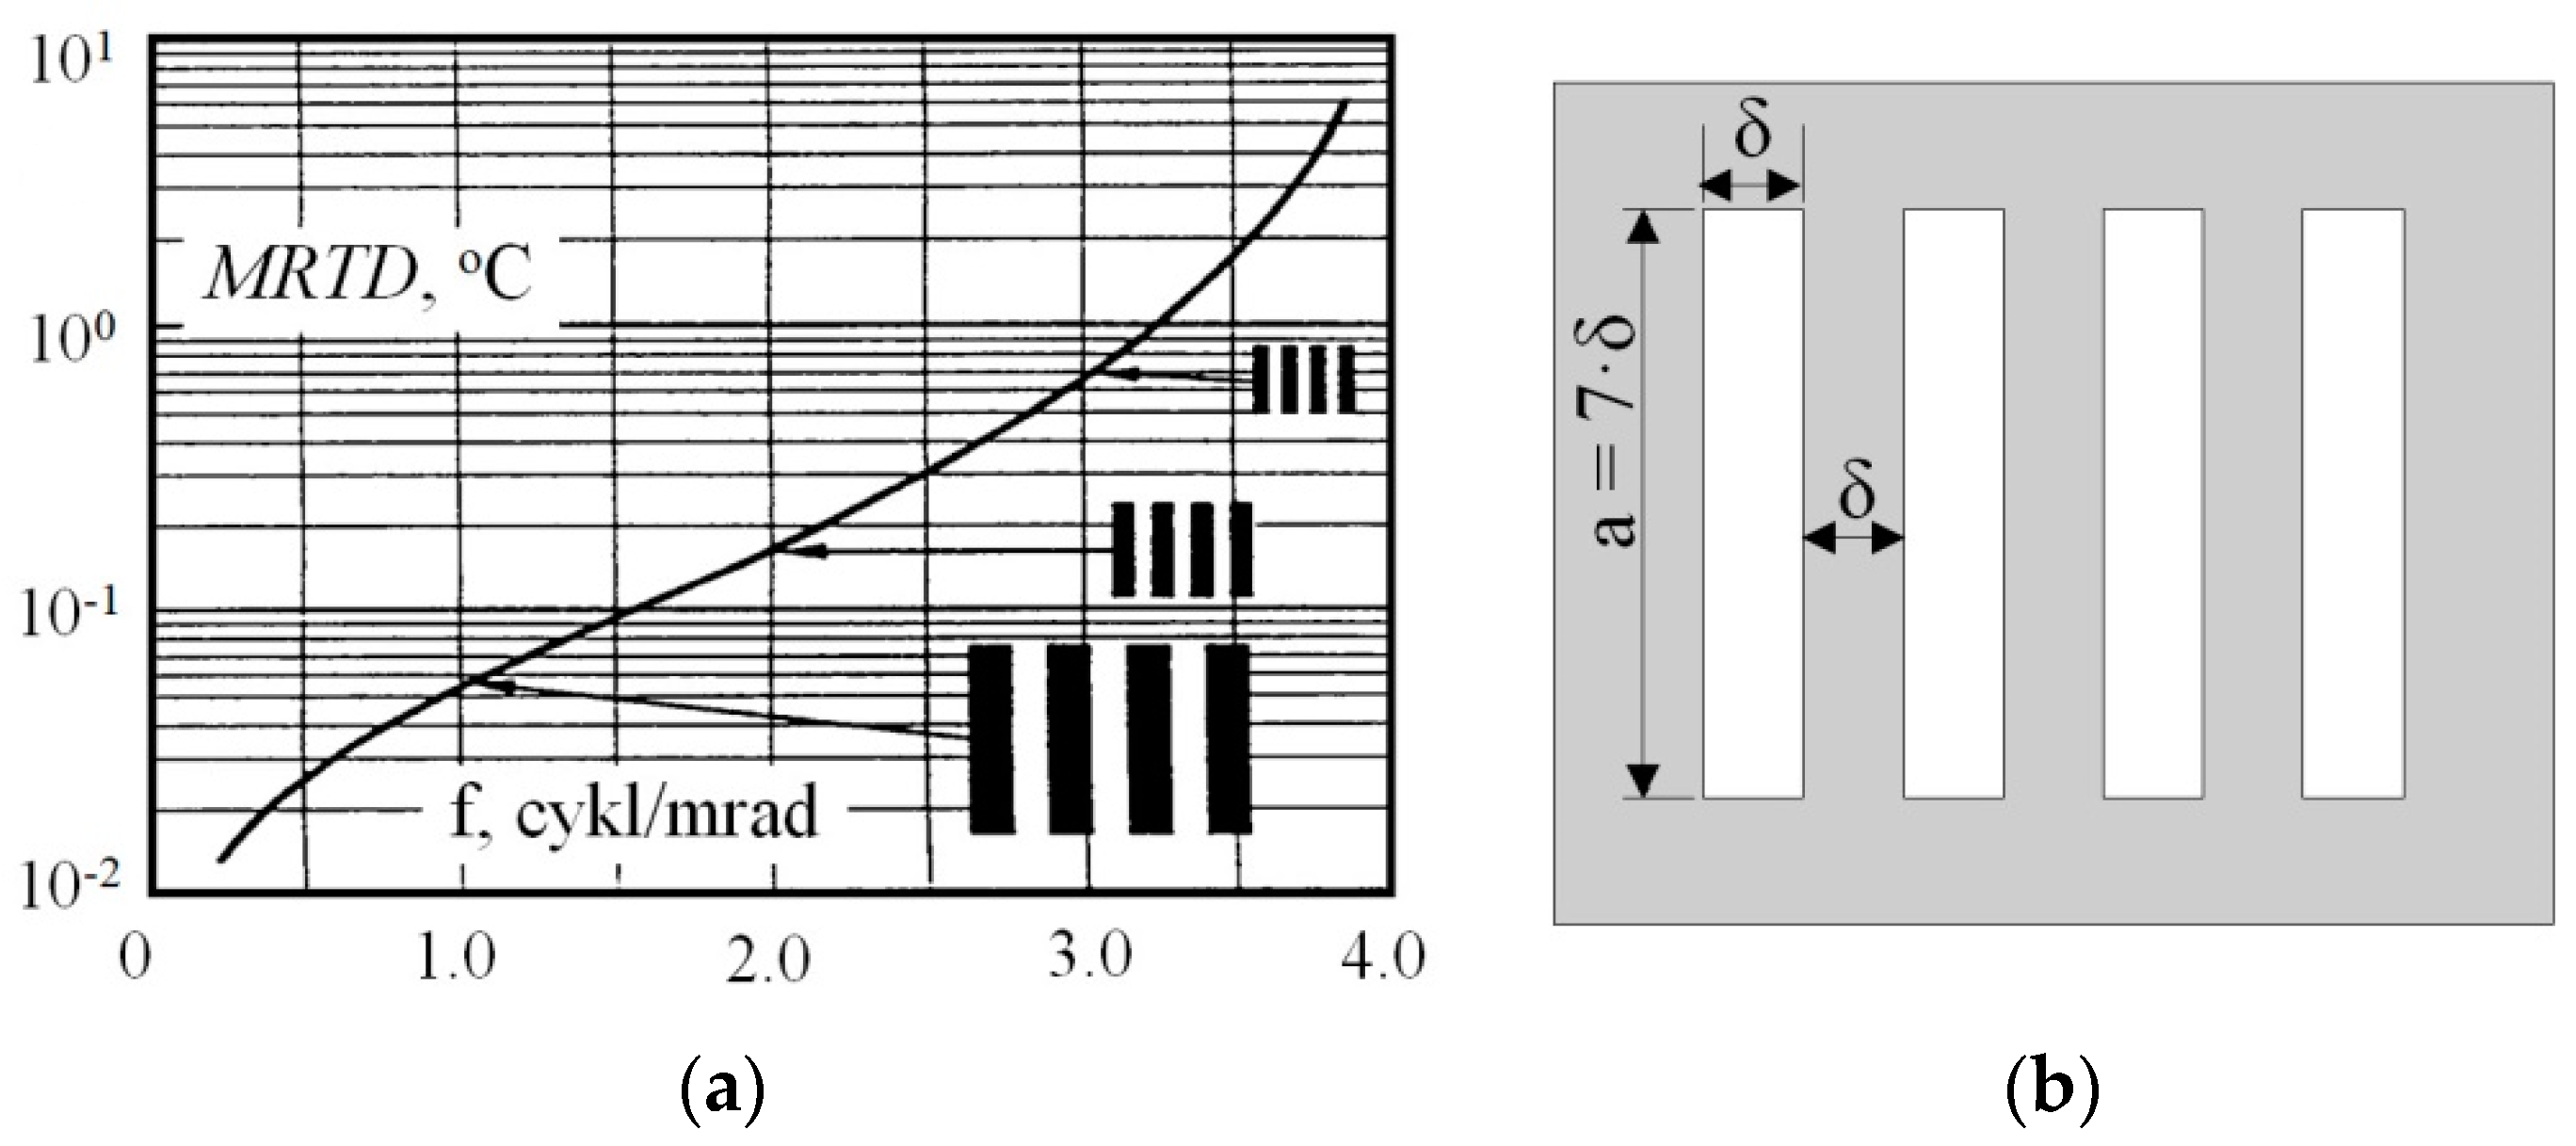
MRTD—(minimum resolvable temperature difference) is used to assess the performance of observation cameras. It is defined as the dependence of the minimum temperature difference between the temperature of a four-strip test
Tob and the background temperature
To, at which an experienced observer can distinguish all the test strips on the camera monitor, on the spatial frequency of the test
f.
MRTD relates temperature resolution to camera spatial resolution and describes the effect of noise on these parameters. Knowledge of this characteristic makes it possible to determine the probabilities of detection, recognition and identification of an object against a non-uniform background. In practice, heterogeneous backgrounds can be, e.g., ground objects.
Figure 2a shows an example plot of the
MRTD characteristics with the relative dimensions of the four-band test marked, and
Figure 2b shows an example of a test with normalised dimensions. It can be observed that, unlike the
MDTD characteristic, the
MRTD characteristic has a vertical asymptote for large values of the test spatial frequencies
f. This is due to the limited spatial resolving capacity of the camera, determined by the modulation transfer function (
MTF), described later in this article. The spatial frequency
f is, in this case, expressed in cycles of the test per milliradian. One cycle refers to the strip and the free space between the strips.
Typical measurement sets for the study of the discussed characteristics consist of three basic blocks: a blackbody, a rotating disc with four-band or circular tests and an infrared collimator. The method of determining
MDTD characteristics is similar to that of
MRTD. The difference concerns the shape of the test, as shown in
Figure 1 and
Figure 2b [
5,
6,
7].
The special feature of MDTD and MRTD characteristics is the fact that they depend on the subjective assessment of the observer. The detailed procedure of their determination can be found, among others, in the works [
5,
6,
7] and in the American standards [
8,
9,
10].
MTF—(modulation transfer function) is a function determined by theoretical models. It defines the spatial resolution of a thermal camera as a function of distance from the object. It is a basic function in models describing MRTD characteristics [
5,
6,
7].
The basic metrological parameters of measurement thermal cameras are described below. The knowledge of these parameters is necessary for the correct interpretation of thermograms obtained from thermovision measurements of small electrical power facilities.
3. Basic Metrological Parameters of Measuring Thermal Imaging Cameras
NETD—(noise equivalent temperature difference) defines the difference between the temperature of the test object and the environment causing the generation of a signal equal to the noise [
11,
12,
13,
14]. It is called the temperature resolving power, or briefly, the temperature resolution. It is defined as the quotient of the rms value of the noise voltage
Un and the ratio of the signal voltage increment Δ
Us to the small increment of the temperature difference between the technical blackbody (or test)
Tob measurement field and the background
To:
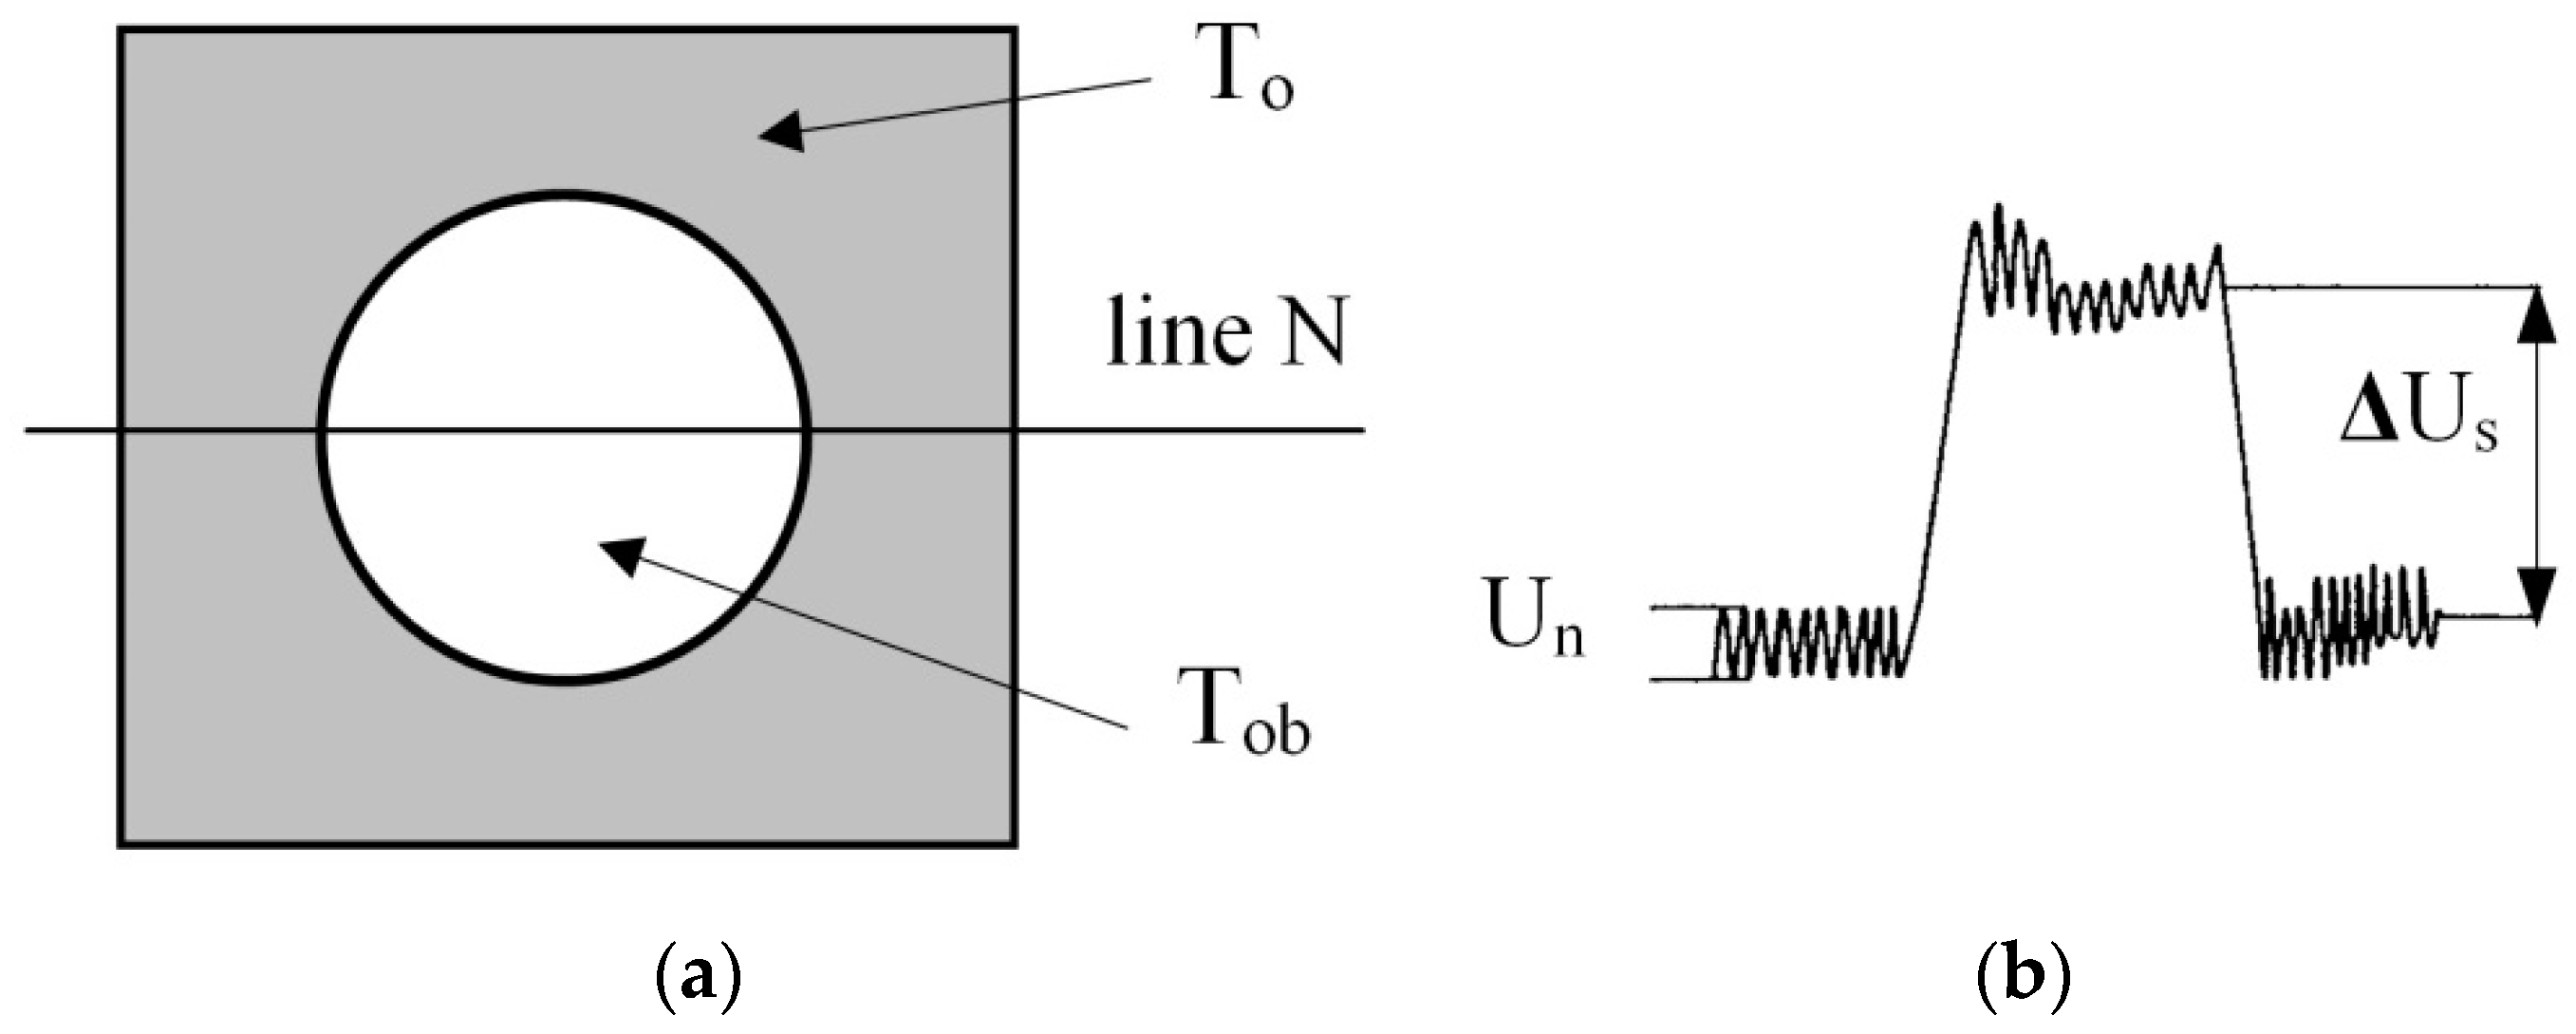
The temperature of the measuring field of a technical black body is usually
Tob = 30 °C of the background
To = 22 °C, while the difference
Tob − To should be within the limits of 5 ÷ 10 K, as shown in
Figure 3.
There is also a slightly different definition of this parameter.
NETD is defined as the difference in temperature between
Tob and
To, which the detector ‘looks at’, resulting in a signal change at its output equal to the detector noise. When determining this parameter, a technical blackbody measuring field with a temperature
Tob approximately equal to the background temperature
To is observed, as depicted in
Figure 3a. The observable
Us signal from the N-line detector is shown in
Figure 3b.
NETD is determined when the value of the signal
Us is equal to the value of the noise signal
Un.
In both cases,
NETD defines what minimum increment of temperature difference or what smallest temperature difference
Tob and
To can distinguish a single detector (ruler or detector array) for a given amplifier bandwidth. According to the theory given in [
11], narrowing the amplifier bandwidth reduces the noise voltage, i.e., allows the value of the
NETD parameter to reduce, but this carries with it a deterioration of the spatial resolution, e.g., at a constant scan rate. In measurements, instead of a technical blackbody measurement field, circular or rectangular tests with a stabilised
Tob temperature can be used. The
NETD definitions given do not take into account the size of the object, the physiology of human perception or the properties of the display system [
16,
17,
18].
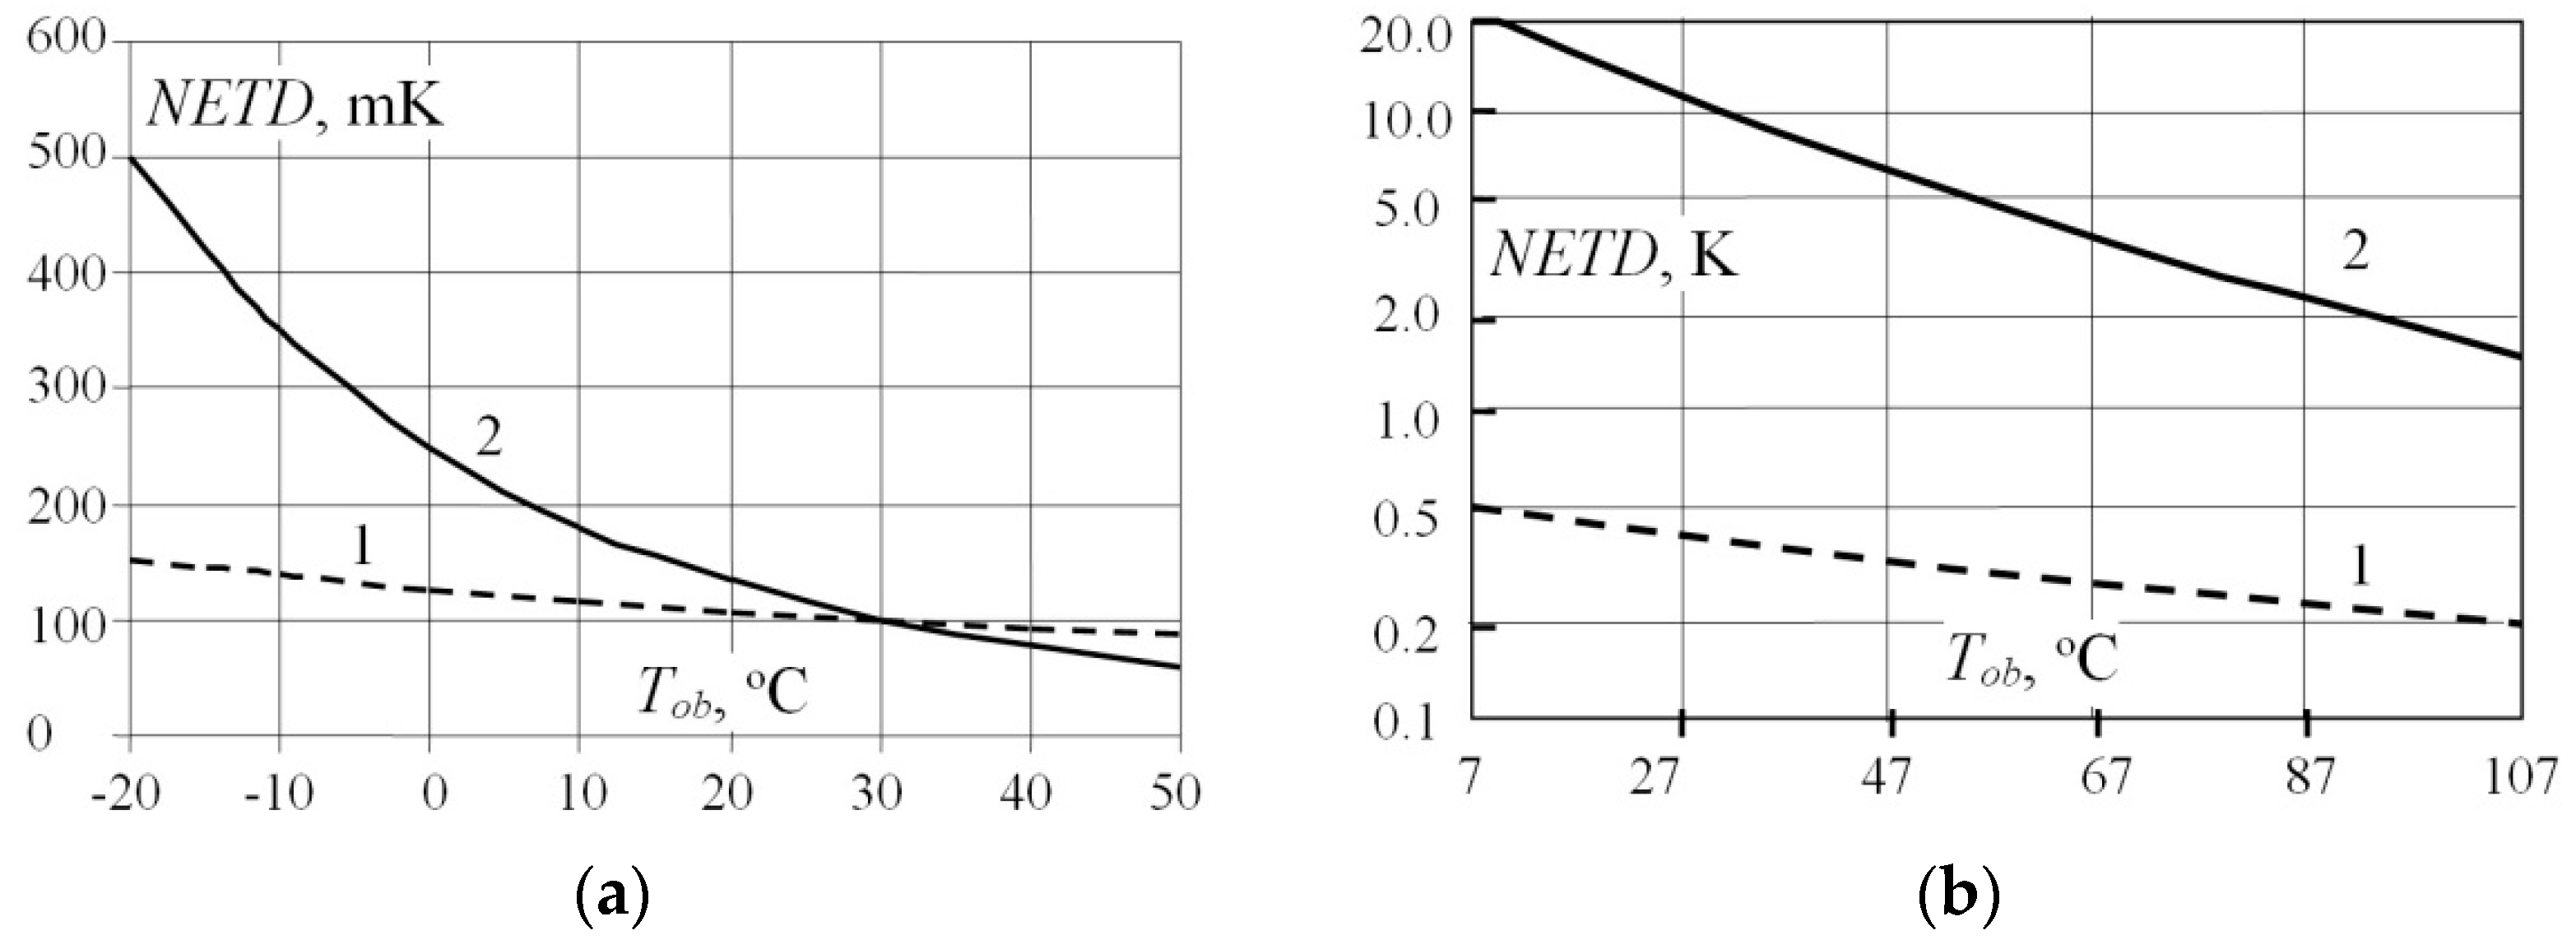
The catalogues provide the following NETD values of the two cameras:
- -
NETD1 = 0.1 K for Tob1 = 30 °C;
- -
NETD2 = 0.2 K for Tob2 = 50 °C.
How does one determine which system has the lower value of noise voltage Un? For both cameras, assume the same value of the voltage increment of the detector signal ΔUs. The value of To in both cases was 22 °C.
According to Formula (1), it is obtained:
i.e.,
From the above, it can be observed that the second camera has a lower noise voltage value despite the fact that NETD2 > NETD1.
A higher NETD value indicates a lower camera sensitivity. This is why the
NETD parameter is called thermal sensitivity or temperature resolution in thermal camera catalogues. When specifying the catalogue value of the temperature resolution of the camera, it is necessary to additionally specify the
Tob value at which this parameter was determined (
Figure 4).
A typical value of the NETD temperature resolution is:
10 ÷ 30 mK, for QWIP detector cameras for scientific research;
50 ÷ 100 mK, for measuring cameras;
>200 mK, for observation cameras.
The procedure of determining NETD is not yet standardised, and prospectuses provide different values of this parameter that are determined in different ways. This may lead to a situation when in the prospectus, an inferior camera is characterised by a better NETD parameter. This parameter is, in fact, one of the most frequently used parameters to assess the metrological properties of thermal imaging cameras.
4. Problems of Remote Temperature Measurement of Small Objects of Electricity Power Systems—On the Example of Lashing Clamps of Bridge Connections on High Voltage Poles
FOV—(field of view) determines the area that can be observed from a given distance d by the optics installed in the camera. This parameter defines the spatial (geometric) resolution of a thermal imaging camera.
FOV is specified in metres and refers to the horizontal (
H, horizontal) and vertical (
V, vertical) directions of observation.
Table 1 provides example values of the field of view for 24° × 18° optics, depending on the distance. For the optics given above, the field of view can be calculated from the formulas:
IFOV—(instantaneous field of view) is the inverse of the so-called distance coefficient (
d/D, distance to spot size ratio) and determines what area constitutes the field of view of a single detector (pixel) of the matrix. Therefore, from a practical point of view, it should be called the ‘required’ or ‘minimum’ field of view. This parameter defines the spatial (geometric) resolution of a measuring thermal camera. In short, in catalogues it is called spatial resolution. For example, for 24° × 18° optics, from a distance of 1 m, the
H ×
V field of view provided in
Table 1 is 0.41 × 0.31 m. Assuming that the camera has a matrix, for example, consisting of 320 × 240 detectors, the field of view of a single detector
Hmin ×
Vmin will be:
This means that with a camera with 24° × 18° optics equipped with a 320 × 240 sensor array, an ‘overheat’ of 1.3 mm × 1.3 mm can be detected from a distance of 1 m. Of course, overheating can also be detected over a smaller area, but the measured temperature will be significantly underestimated. The area increases and decreases in proportion to the distance d. For example, for d = 10 m, it is 13 mm × 13 mm.
Another way to calculate the
IFOV is to calculate in radians the angle
αrad of the optics opening for a single detector:
In other words, the IFOV is the area that, through the optics, a single pixel of the matrix ‘looks at’ and defines the absolute lower limit of the size of the measured object. The spatial resolution of the camera depends on the opening angle of the optics used and the number of detectors (pixels) in the matrix. The smaller the angle of the optics and the more detectors the matrix has, the better the spatial resolution of the camera; thus, smaller objects can be observed. However, there are obvious limitations associated with increasing the number of detectors in the matrix and building lenses with a smaller angle, i.e., smaller field of view.
Camera manufacturers usually specify the spatial resolution in milliradians [mrad]. For example, in brochures, you can read that for 24° × 18° optics, the spatial resolution is 1.3 mrad. This parameter means the value of the IFOV field of view for a single detector (pixel) of the matrix Hmin and Vmin, calculated according to Formula (4).
The described situation can be further explained by analysing
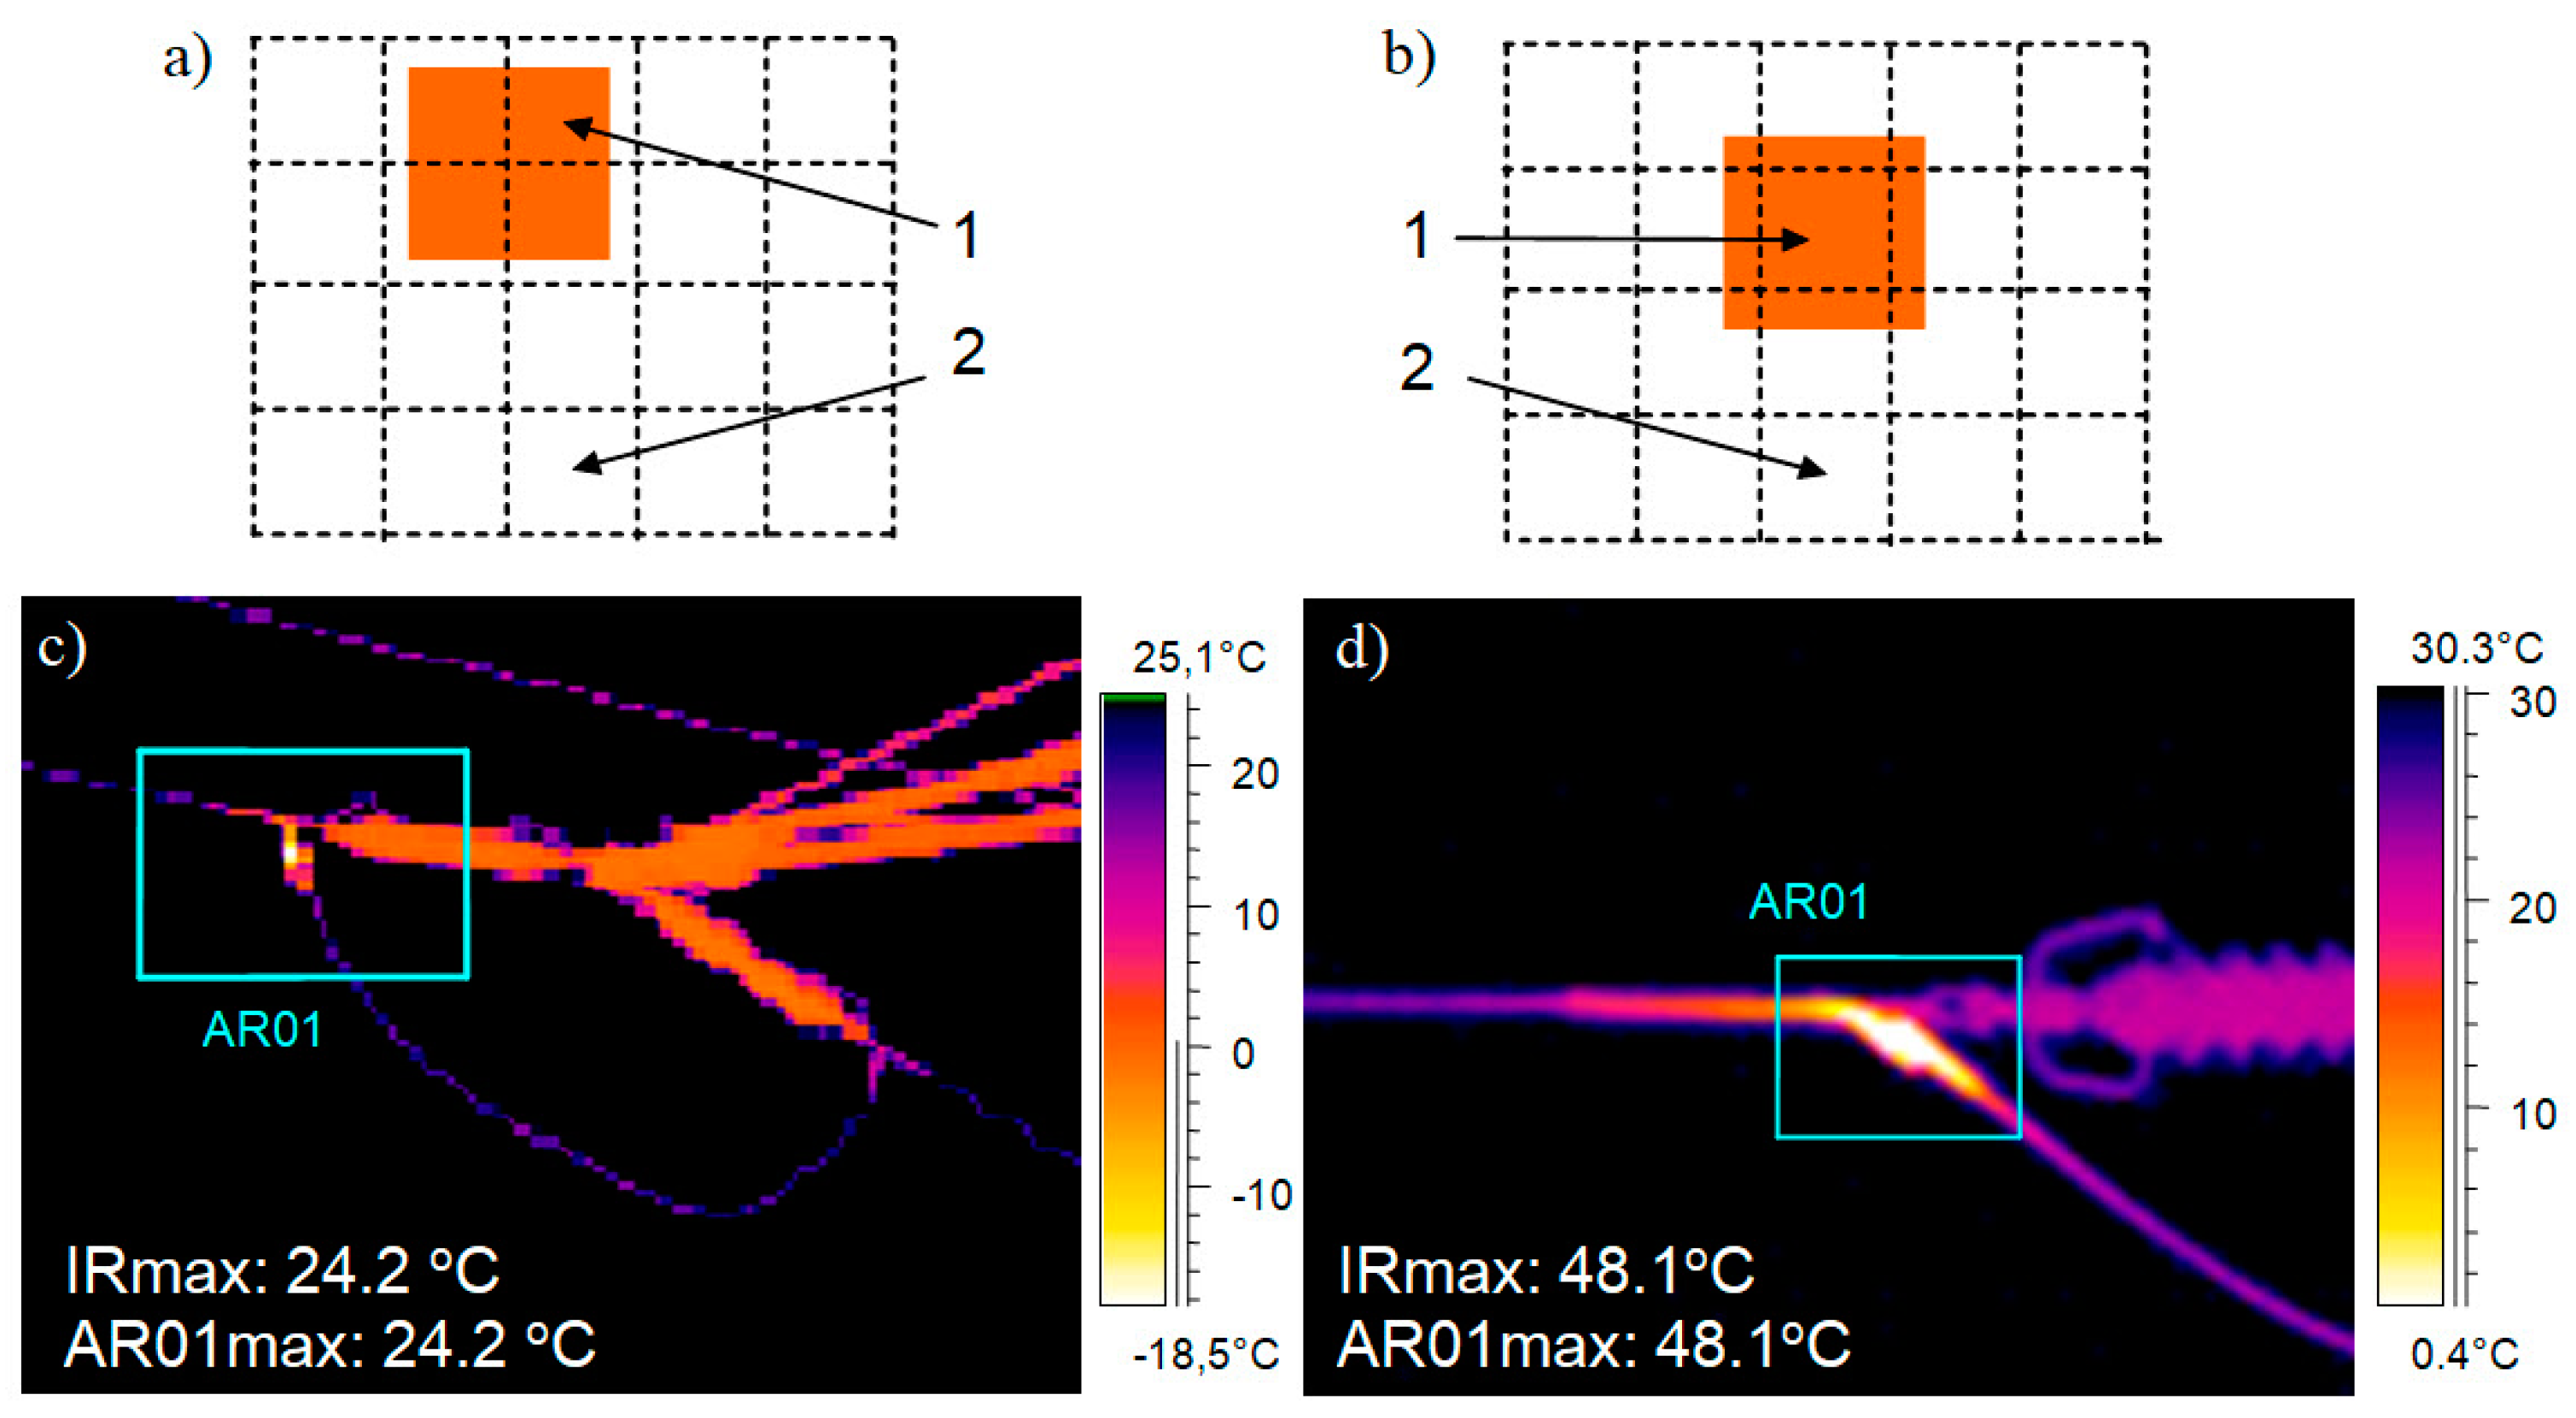
Figure 5. In
Figure 5a,b, two cases of detector exposure by a small object are presented. In
Figure 5b, the object is accidentally positioned so that it completely exposes at least one detector of the array, while in
Figure 5a, the same object is not able to completely expose any detector. From
Figure 5d, it can be observed that the temperature of the extraction holder measured from close-up is higher than the temperature of the same holder measured from far away (
Figure 5c). This is due to the fact that at close range, the camera optics guarantee full illumination of at least one detector of the camera array. If the object is warmer than the environment behind it, as in
Figure 5a, the indicated temperature will be underestimated when the detector is not fully illuminated; otherwise, it would be overestimated. The above description may explain the English term for this parameter as an instantaneous field of view. This means that, theoretically, only at a certain moment in time, for ideal electronics and optics, meeting the requirements of the
IFOV parameter may be sufficient for the correct illumination of the detector. In the time domain, the term instantaneous means the instantaneous value of the signal in time, while in the spatial domain, it means the response of the detector to the irradiance of a given point of the object.
IRmax—the maximum temperature across the entire surface of the thermogram, as determined by the maximum temperature selected from all the detectors in the array;
ARmax—the maximum temperature across the marked area, as determined by the maximum temperature selected from the detectors illuminated in the area.
It can also be observed in
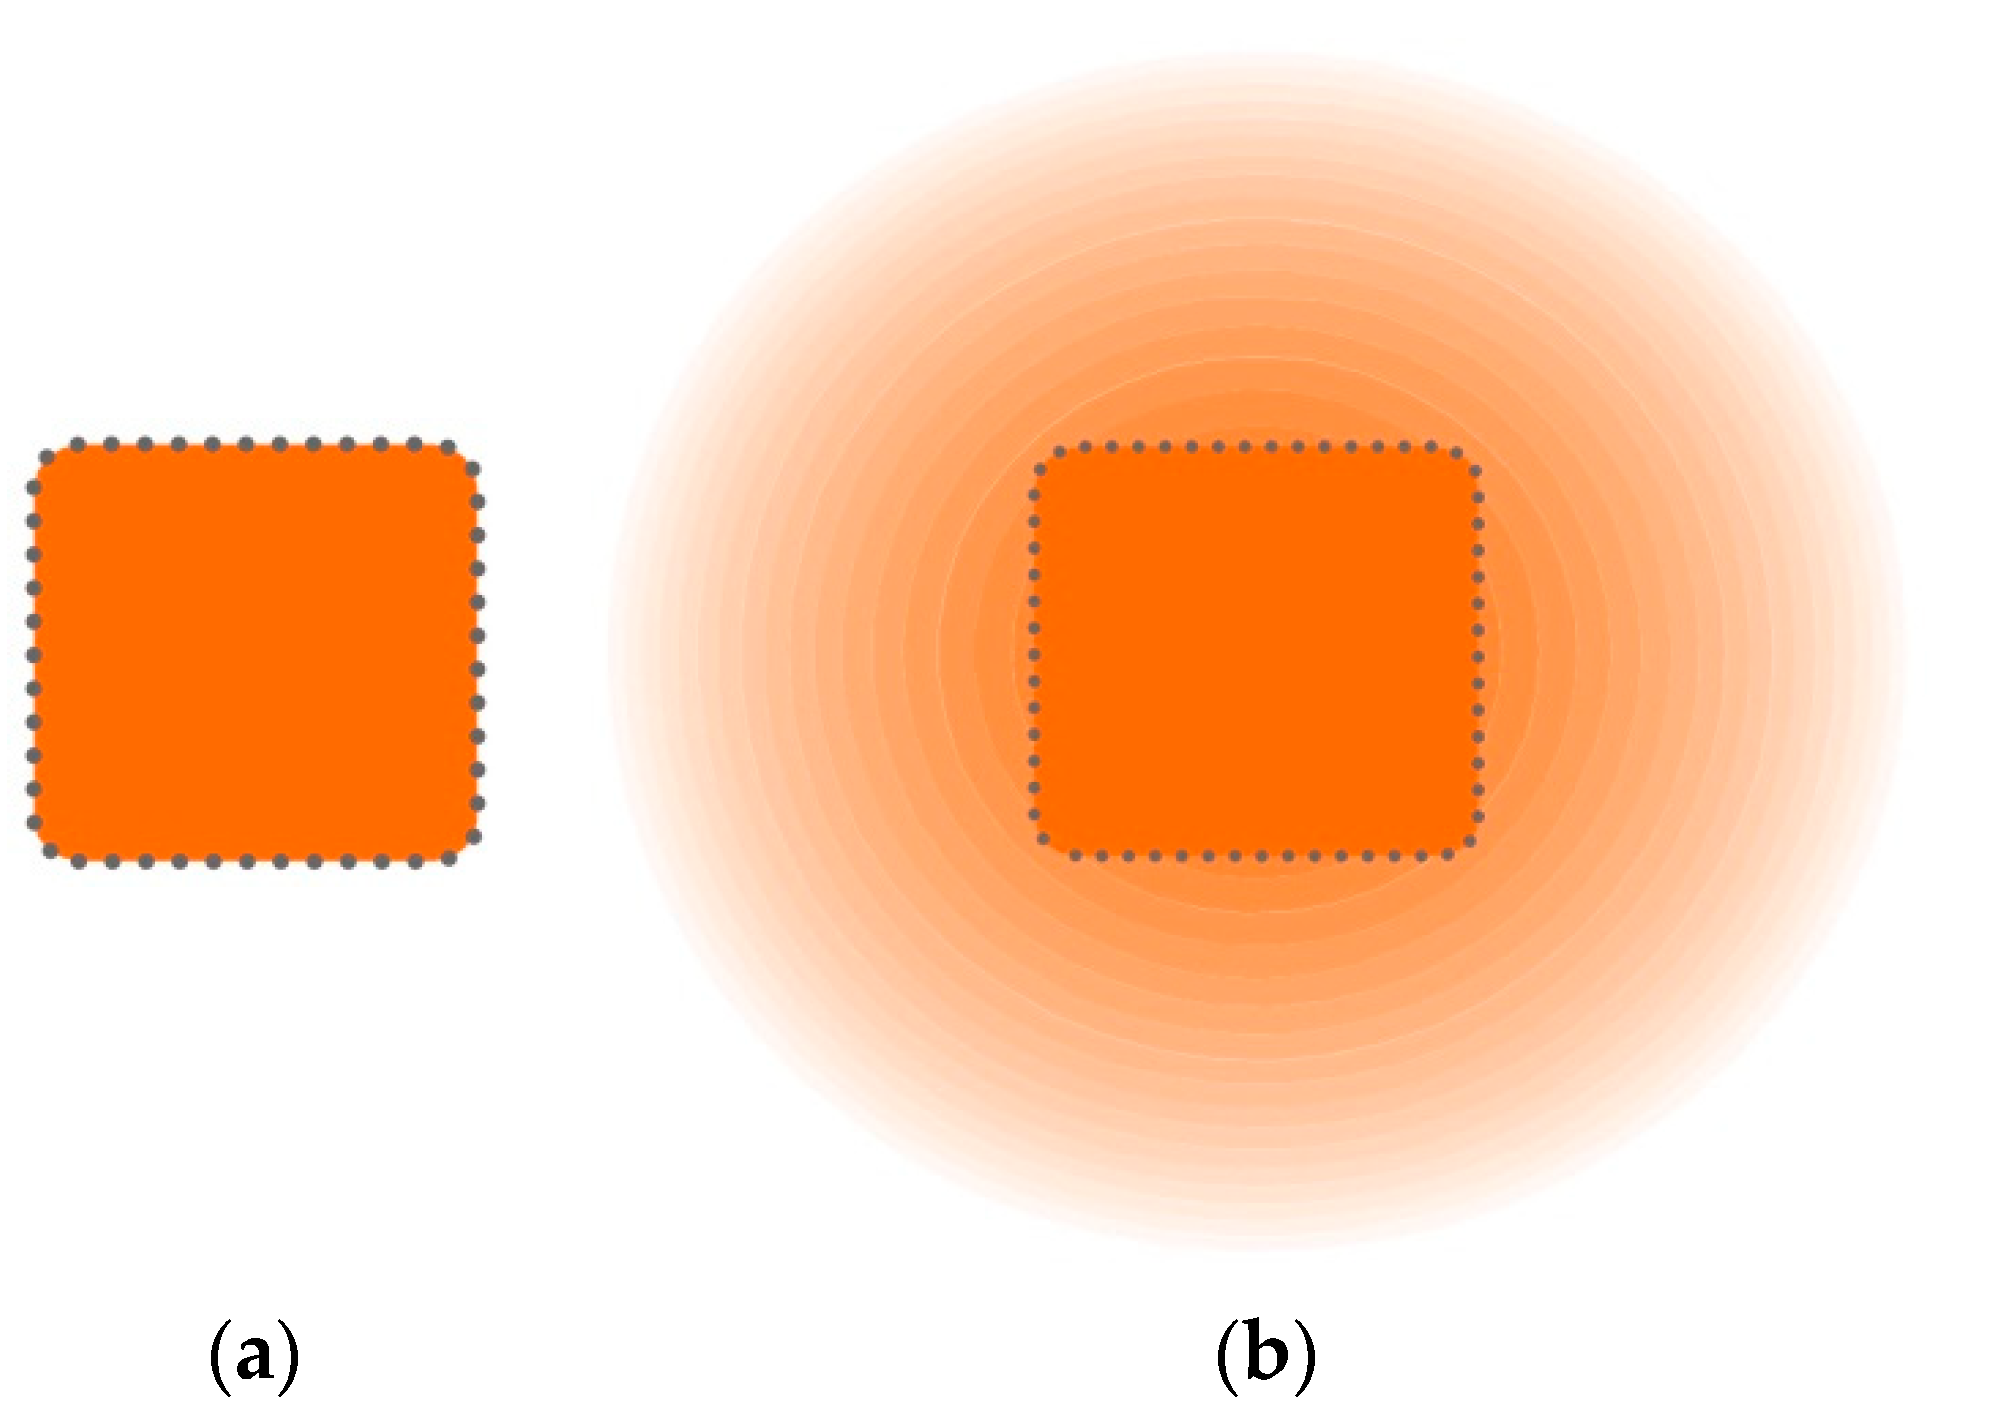
Figure 5c,d that IRmax is equal to ARmax, which further confirms that the location of the maximum temperatures is correct. Analysing
Figure 5b, one may come to the conclusion that in order to carry out a correct spot temperature measurement, it is sufficient for an object to expose 2 × 2 detectors of the matrix. In practice, however, this is not the case, if only because the object may not have a square or rectangular shape. In addition, all optics distort the image. This is characterised by the occurrence of chromatic aberration, spherical aberration or many other imperfections, as shown in
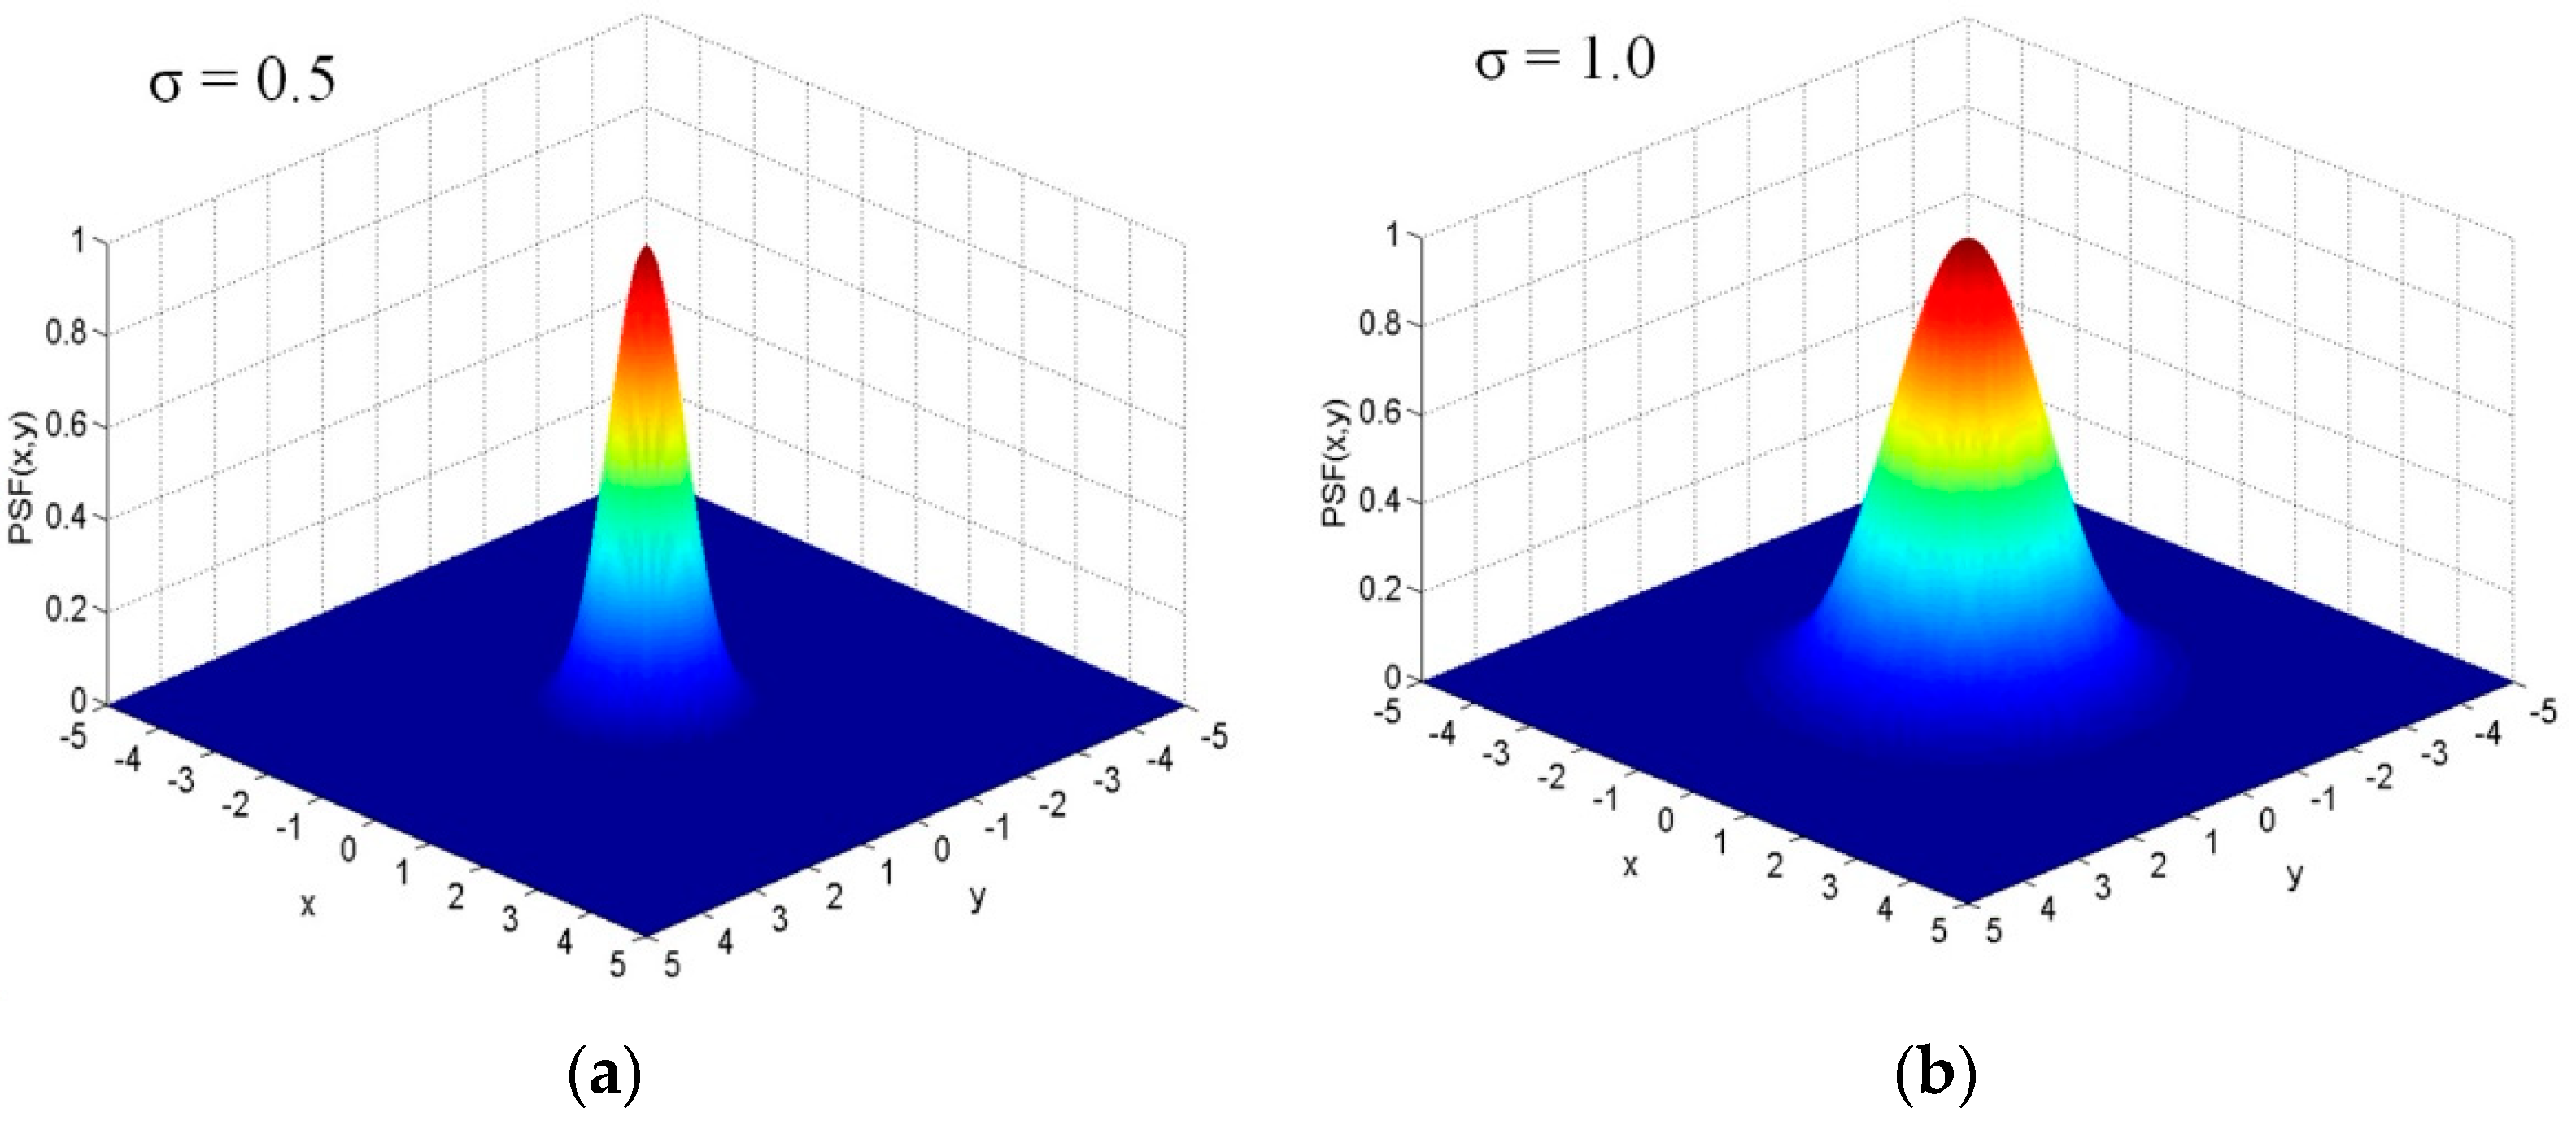
Figure 6b. This parameter is further described by the
PSF (Point Spread Function). One of its models is described by the formula:
where:
σ is the parameter defining point response of the optical system (spatial resolution) expressed in milliradians. Its exemplary values may be:
- -
σ = 0.5 mrad for measurement cameras, with better spatial resolution;
- -
σ = 1.0 mrad for observation (imaging) cameras, with poorer spatial resolution.
Figure 6.
Determination of measurement area size: (
a) ideal optics, 2 × 2 array detectors required; (
b) real optics, 3 × 3 or 4 × 4 (sometimes even 5 × 5) detectors required [
12,
19,
20,
21].
Figure 6.
Determination of measurement area size: (
a) ideal optics, 2 × 2 array detectors required; (
b) real optics, 3 × 3 or 4 × 4 (sometimes even 5 × 5) detectors required [
12,
19,
20,
21].
A graphical illustration of the
PSF function is shown in
Figure 7.
In order to avoid the problems described above, it is assumed that the minimum object size should guarantee full illumination of at least 3 × 3 or 4 × 4 and sometimes even 5 × 5 detectors of the array, i.e., it should be between 3 × 3 and 5 × 5 IFOV for correct temperature measurement.
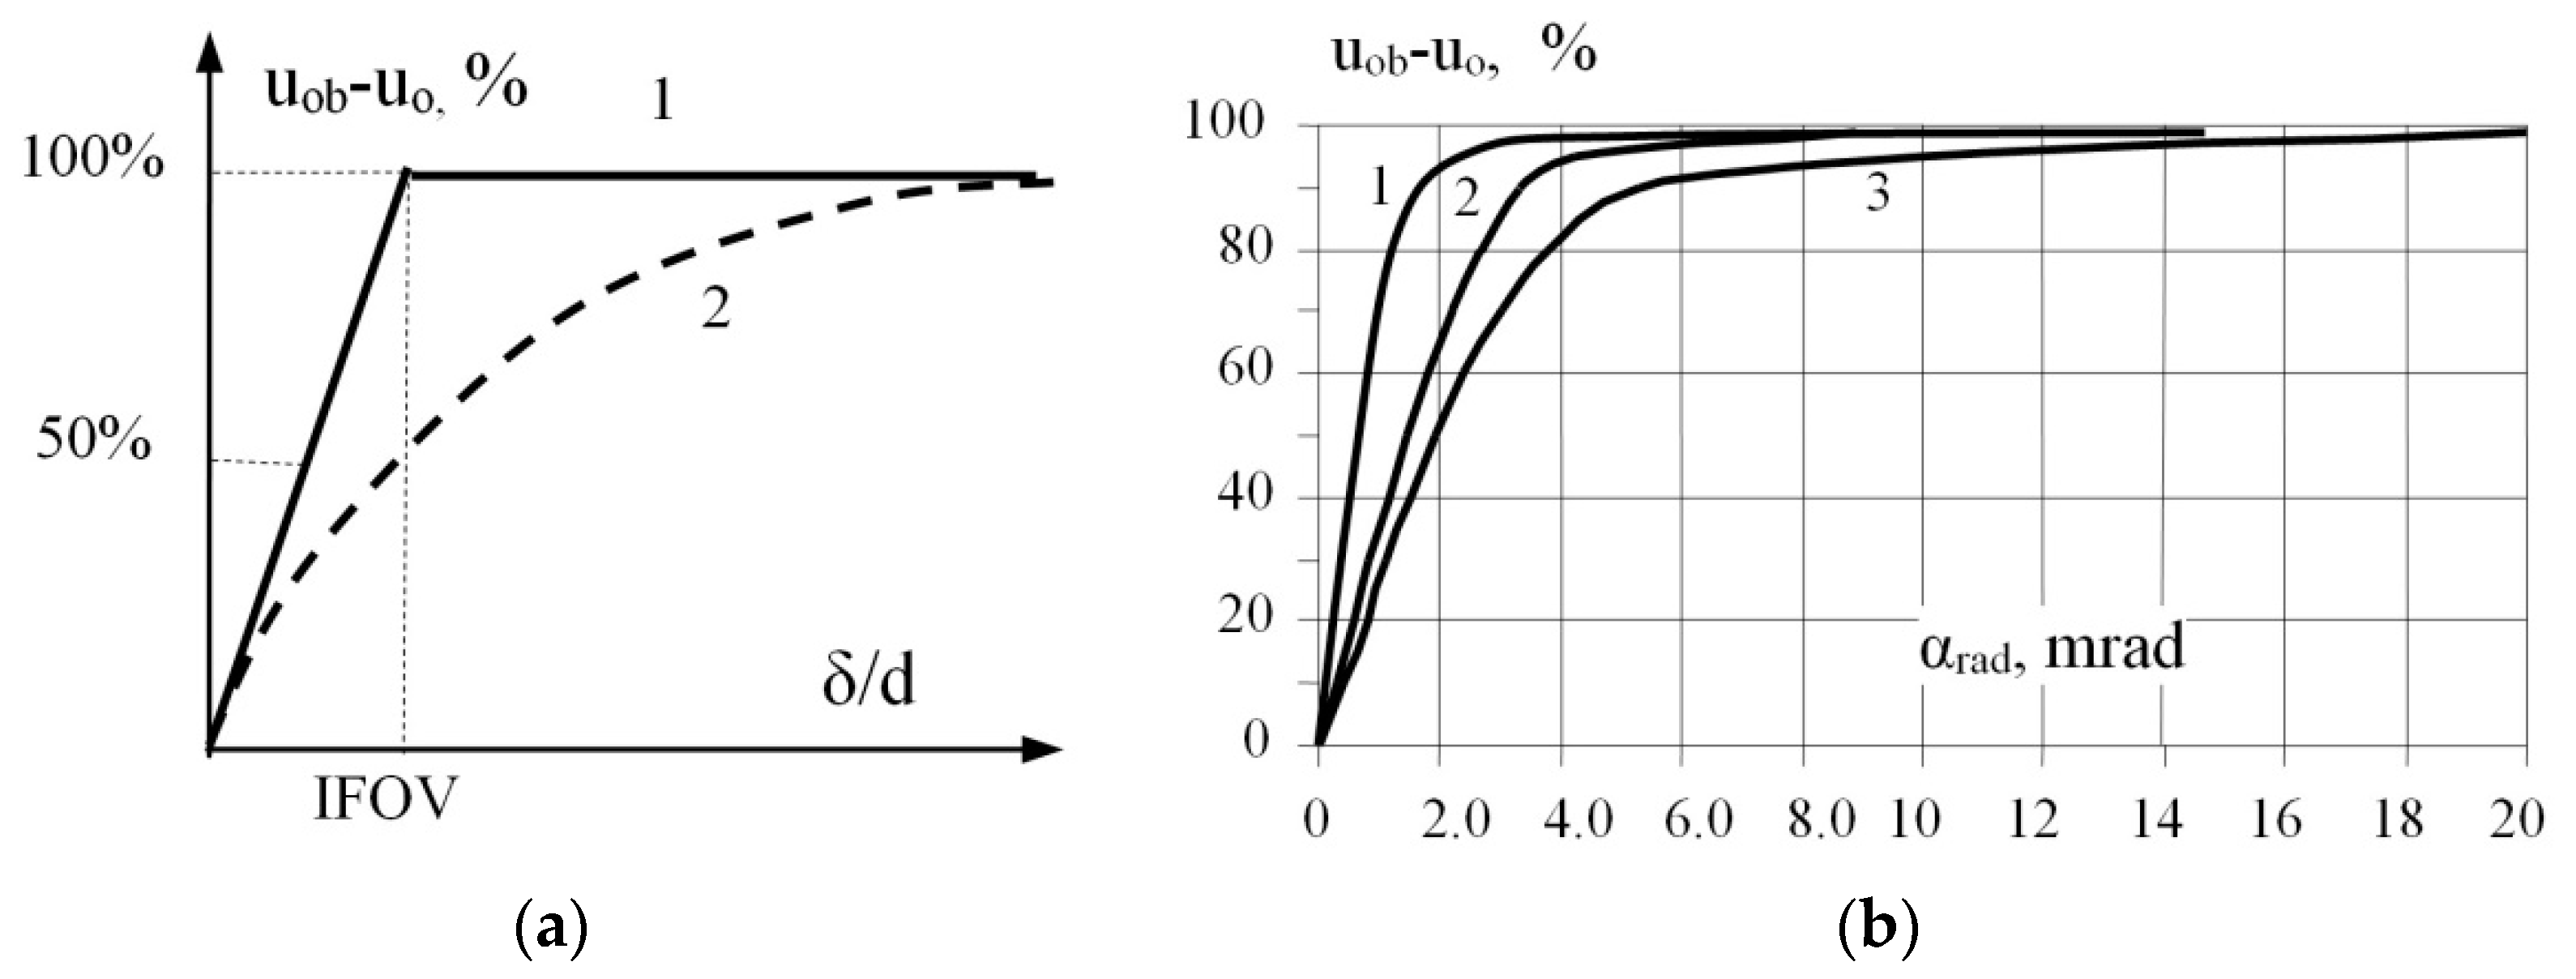
SRF—(Slit Response Function), similar to the
IFOV parameter, describes the ability of a thermal imaging camera with an array detector to measure the temperature of small objects.
Figure 8 shows three situations for measuring the temperature of a black body
Tob on whose surface the
IFOV symbol indicates the field ‘seen’ by a single array detector. The temperature of
Tob corresponds to the
uob signal from the detector. The measurement field of the blackbody is gradually covered by the aperture with temperature
To, which corresponds to the signal
uo from the detector. As the size
δ of the aperture decreases, the value of the
uob signal changes.
Figure 9 shows the left parts of the modulation characteristics from
Figure 8 as a function of the optics opening angle
αrad for a single detector, defined by Formulas (4). Approximately, the value of
αrad also corresponds to the quotient of the slit width
δ and the camera-object distance
d. Characteristic 1 of
Figure 9a concerns the theoretical (idealised) case, while curve 2 concerns the real case, related to the fact that the camera optics and electronics are not ideal. In
Figure 9b, we compare real characteristics of modulation of the measurement cameras (curves 1 and 2) and the observation camera (curve 3).
Analysing the characteristics from
Figure 9b, we can see that the value of the angle
αrad corresponding, e.g., to a 50% modulation for the measurement camera, is much smaller than for the observation camera. Taking into account the remarks provided during the discussion of the
IFOV parameter, it can be concluded that the most accurate measurements are obtained if the modulation value is as high as possible. For example, if the modulation value is 90%, the detectors may receive 10% too little illumination, i.e., the indicated temperature will be, for example, underestimated by 10%. This is a very large, unacceptable error value. Therefore, a modulation value greater than 98% should be sought. In
Figure 9b, the characteristics of the 1, 2 measurement cameras correspond to
αrad = 5 ÷ 8 mrad, while the characteristic of the 3 observation camera is
αrad = 15 ÷ 20 mrad.
Analysing the above, it can be seen that the modulation characteristics of the slit function SRF confirm the previously stated requirement that in order to guarantee correct measurement with a thermal imaging camera of a certain spatial resolution, characterised by the IFOV parameter, the required object size should be from 3 × 3 to 5 × 5 IFOV.
5. Conclusions
In conclusion, it should be stated that the problem of measuring the temperature of extraction handles of bridge connections (lashing clamps) on high voltage poles is very important from the point of view of the reliability of electricity supply. Obtaining early information about the occurrence of overheating on such a connection is very important, as it eliminates costly interruptions in the supply of electricity associated with the rupture of power lines supplying high voltage switching stations or substations.
The only modern tool for such diagnostics is a thermal imaging camera, which allows remote temperature measurement of these objects. It must be emphasised that a bridge lashing clamp on a high voltage line is a small object. Therefore, in order to correctly measure the temperature of such an object, it is necessary to possess adequate knowledge and experience regarding the metrological capabilities of a thermal imaging camera when remotely measuring this small object.
This article described the basic metrological parameters of a thermal imaging camera that are important in the interpretation of the remote temperature measurement of small objects. Based on this knowledge, a practical example was provided as to how to correctly remotely measure the temperature of a lashing clamp for bridge connections of a high voltage power line. A case of incorrect and correct remote temperature measurement of this small object was described, showing, at the same time, the differences in the readings for both cases.
This is an important case concerning the practice of non-contact temperature measurement of power line objects of small size and the interpretation of the recorded thermograms.
It should be emphasised that incorrect interpretation of thermograms obtained from remote thermovision measurements can lead to unnecessary disconnections of power lines and associated unnecessary costs or delayed disconnections of power lines and high costs associated with line breaking and power outages.
For example, if an inexperienced person interprets the thermogram provided in
Figure 5, they may make a significant error because the actual temperature of the lashing clamps of bridge connections is about 48
°C, not 24 °C.


