Article

Intensification of Gas Hydrate Formation Processes by Renewal of Interfacial Area between Phases

by
Anatoliy M. Pavlenko
* and
Hanna Koshlak
Department of Building Physics and Renewable Energy, Kielce University of Technology, al. Tysiąclecia Państwa Polskiego 7, 25-314 Kielce, Poland
*
Author to whom correspondence should be addressed.
Energies 2021, 14(18), 5912; https://doi.org/10.3390/en14185912
Submission received: 20 July 2021 / Revised: 13 September 2021 / Accepted: 15 September 2021 / Published: 17 September 2021

Abstract

:
This paper presents the analysis of the main reasons for a significant decrease in the intensity of diffusion processes during the formation of gas hydrates; solutions to this problem are proposed in a new process flow diagram for the continuous synthesis of gas hydrates. The physical processes, occurring at the corresponding stages of the process flow, have been described in detail. In the proposed device, gas hydrate is formed at the boundary of gas bubbles immersed in cooled water. The dynamic effects arising at the bubble boundary contribute to the destruction of a forming gas hydrate structure, making it possible to renew the contact surface and ensure efficient heat removal from the reaction zone. The article proposes an assessment technique for the main process parameters in the synthesis of hydrates based on the criterion of thermodynamic parameters optimization. The optimization criterion determines the relationship of intensity of heat and mass transfer processes at the phase contact interface of reacting phases, correlating with the maximum GH synthesis rate, and makes it possible to determine optimum thermodynamic parameters in the reactor zone.

1. Introduction

The factorial use of gas hydrates (GH) can be used as a substantial source of energy for people. In many countries, gas hydrates are considered the most likely alternative fuel [1,2,3]. Global estimates of the gas content in hydrate structures are within the range of ≈(1–5) × 1015 (m3) [4,5,6,7,8]. The works of many authors [9,10,11] provide information on the presence of GH natural sources in various geological structures. However, insufficient information on the properties of their formation and decomposition disturb development of gas hydrate technologies. At present, significant efforts of many researchers are aimed at solving these problems in order to improve the future efficiency of GH production, synthesis, storage, transportation and industrial use. This study analyses gas hydrate synthesis technology that will guarantee its transportation and long-term storage. According to many researchers [12,13,14,15], storage of natural gas in clathrate hydrates offers the best storage method, explained by the relative convenience of natural gas recovery at minimal cost compared to conventional storage methods [16,17,18,19,20,21]. The works [22,23] present comprehensive data on managing gases in a hydrated state.
GH synthesis is one of the most important stages of such technology. Clearly, this process will be quick, continuous, easy and cheap. The stochastic character of hydrate nucleation and slow kinetics of hydrate growth are the biggest problems to be solved during GH synthesis; they are analysed in the works of the abovementioned researchers. Strong and fast nucleation linked with fast crystallization kinetics would allow the use of this technology by the industry. These are the first two issues focused on in this paper. The nucleation process could be determined to some extent if ready-made hydrate formation centres were introduced into the reaction zone. We will demonstrate this process as it was performed in our GH synthesis technology. As for the second issue, the hydrate formation rate, in our opinion, it is the hydrate itself that causes a significant decrease in the intensity of diffusion flows in the reaction zone. Diffusion processes have also been studied by many authors [24,25,26,27], however, in their works the transfer process itself was considered with no consequent conclusions regarding the sufficiently high intensity of mass transfer. Currently, in the literature references, one may encounter descriptions of many devices for GH production [28,29,30,31,32,33,34,35], where the biggest attention is drawn to methods used to increase the gas and liquid contact area, either by dispersing water in a gas or by the formation of a bubble gas flow in water. For this purpose, it is possible to use, for example, bubble columns, bubblers or spray reactors [36,37,38,39,40,41]. In [42] during the study of GH synthesis in a bubble column, the authors observed a thin hydrate film formation on the gas bubble surface, where GH is gradually formed. However, the rate of gas hydrate formation was not high, and the process itself cannot be continuous since gas bubbles with a hydrate crust agglomerated into large complexes, where the synthesis practically stopped. Mixing, spraying and bubbling are obvious methods of GH synthesis intensification [43,44,45]. Mixing helps to mix the gas and liquid phases and enhances the phase interface surface, increasing GH synthesis rate. To increase the synthesis process intensity, various chemical activating agents are also used and described in these works. Efficient heat removal from the reaction zone is the third problem to be solved. The heat removal rate significantly affects the GH synthesis rate. In every cited study the hydrate synthesis rate goes down over time because of the changes in thermodynamic features in the reaction zone. In our study, we present the mechanical activation of GH synthesis, following another idea—the intensity of GH synthesis process is determined not only by the liquid volume or the size of the phase contact area but mainly by the intensity of phase interface renewal, which in turn increases the intensity of heat removal from the reaction zone. Therefore, GH synthesis technologies should also be marked in terms of the phase interface renewal feature. Hydrate films, formed on the bubbles’ surface, create resistance to heat removal during the exothermic hydrate formation reaction. On the other hand, these films at a described stage of their formation can be easily destroyed by hydrodynamic and thermodynamic instability in the reactor, referring to a constant intensive phase interface renewal and an increase of hydrate formation rate. Thus, the drop, bubble or combined modes of gas hydrate formation and relevant devices can be sufficiently effective for a fast hydrate formation. However, the problems of deterministic hydrate nucleation, low intensity of hydrate formation, hinderance of hydrate formation at the interface, ineffective heat removal from the reaction zone of hydrate formation and removal of excess water from the finished hydrate are still to be addressed.

2. Research Background

Mixing and bubbling are traditionally used as mechanical initiation of GH synthesis processes [46,47,48,49,50,51,52,53,54,55]. The use of mechanical mixing improves gas-liquid contact since mixing contributes to the renewal of the gas-liquid interface to improve hydrate formation. However, as soon as hydrates begin to form, the liquid phase transforms into a suspension, which becomes denser with a progressive increase in GH amount and the hydrate formation process slows down or stops. In the works [56,57,58], the authors presented the results of fundamental studies of GH formation processes and their stability and determined the relevant thermodynamic parameters. In our studies, we focus only on the mechanical initiation of GH formation processes to increase the synthesis rate. Clearly, based on the studies presented in the cited papers, it is also possible to determine the conditions of enhancing the performance of synthesizing devices. However, we set it as our goal to demonstrate that in bubble reactors, particularly in mixing devices, it is impossible to bring the energy to the level sufficient for a repeated deformation of gas bubbles. Starting from a certain number of revolutions of the mixing nozzle, the hydrate formation rate becomes unchanged, as shown in our study.
It is evident that it is not practical to use the configuration of a reactor with a mixer for large-scale GH production.
The use of bubble columns and bubbling devices also makes it possible to increase the liquid and gas contact surface.
In these works, the considerable effect of hydrodynamic factors (liquid flow and pressure rates) on GH synthesis rate was emphasized. However, with this synthesis process, the hydrate is formed as a film at the interface, and, furthermore, it also develops resistance to heat and mass transfer, resulting in a significant decrease in the gas absorption intensity. For instance, in [42] during the study of GH synthesis in a bubble column, the authors observed a thin hydrate film formation on the gas bubble surface, where GH is gradually formed. As the rate of the bubble rise decreases, the bubbles agglomerate and resist the growth of hydrates from further incoming gas bubbles.
The authors [59,60] point to the high efficiency of surfactants, since most surfactants reduce the induction time of hydrate nucleation, increase GH growth rate and contribute to the maximum conversion of water to hydrate. A thorough analysis of the existing literature on surfactants suggests that a decrease in surface tension in the presence of surfactants not only increases mass transfer but also changes hydrate formation morphology, thus improving the interaction of gas with water for a faster hydrate growth rate. The use of surfactants solves the problem of slow GH synthesis to a certain extent, but in most cases it harms the environment and complicates the technology of further hydrate use.
Mixing, spraying and gas bubbling are known methods of GH synthesis intensification but fail to reduce the hydrate synthesis rate. It can be achieved by a constant update of the phase contact interface by hydrate crust destruction, formed at the interface, and intensive heat removal from the reaction zone of hydrate formation. We propose to create thermodynamic and hydrodynamic conditions in the reactor when gas bubbles will be constantly deformed and, thus, the hydrate crust will be destroyed. Our preliminary experimental and theoretical studies [46] demonstrated high efficiency of this method to intensify the GH synthesis process in the laboratory. However, the issues of high productivity, synthesis continuity and optimal process parameters of the synthesizing device are still to be resolved. The long induction time of hydrate formation, low temperature and relatively high pressure require the innovative reactor design to improve gas-liquid contact and the resulting increased rate of GH formation, as well as high gas absorption combined with high water-to-hydrate conversion. These issues are addressed in this paper.

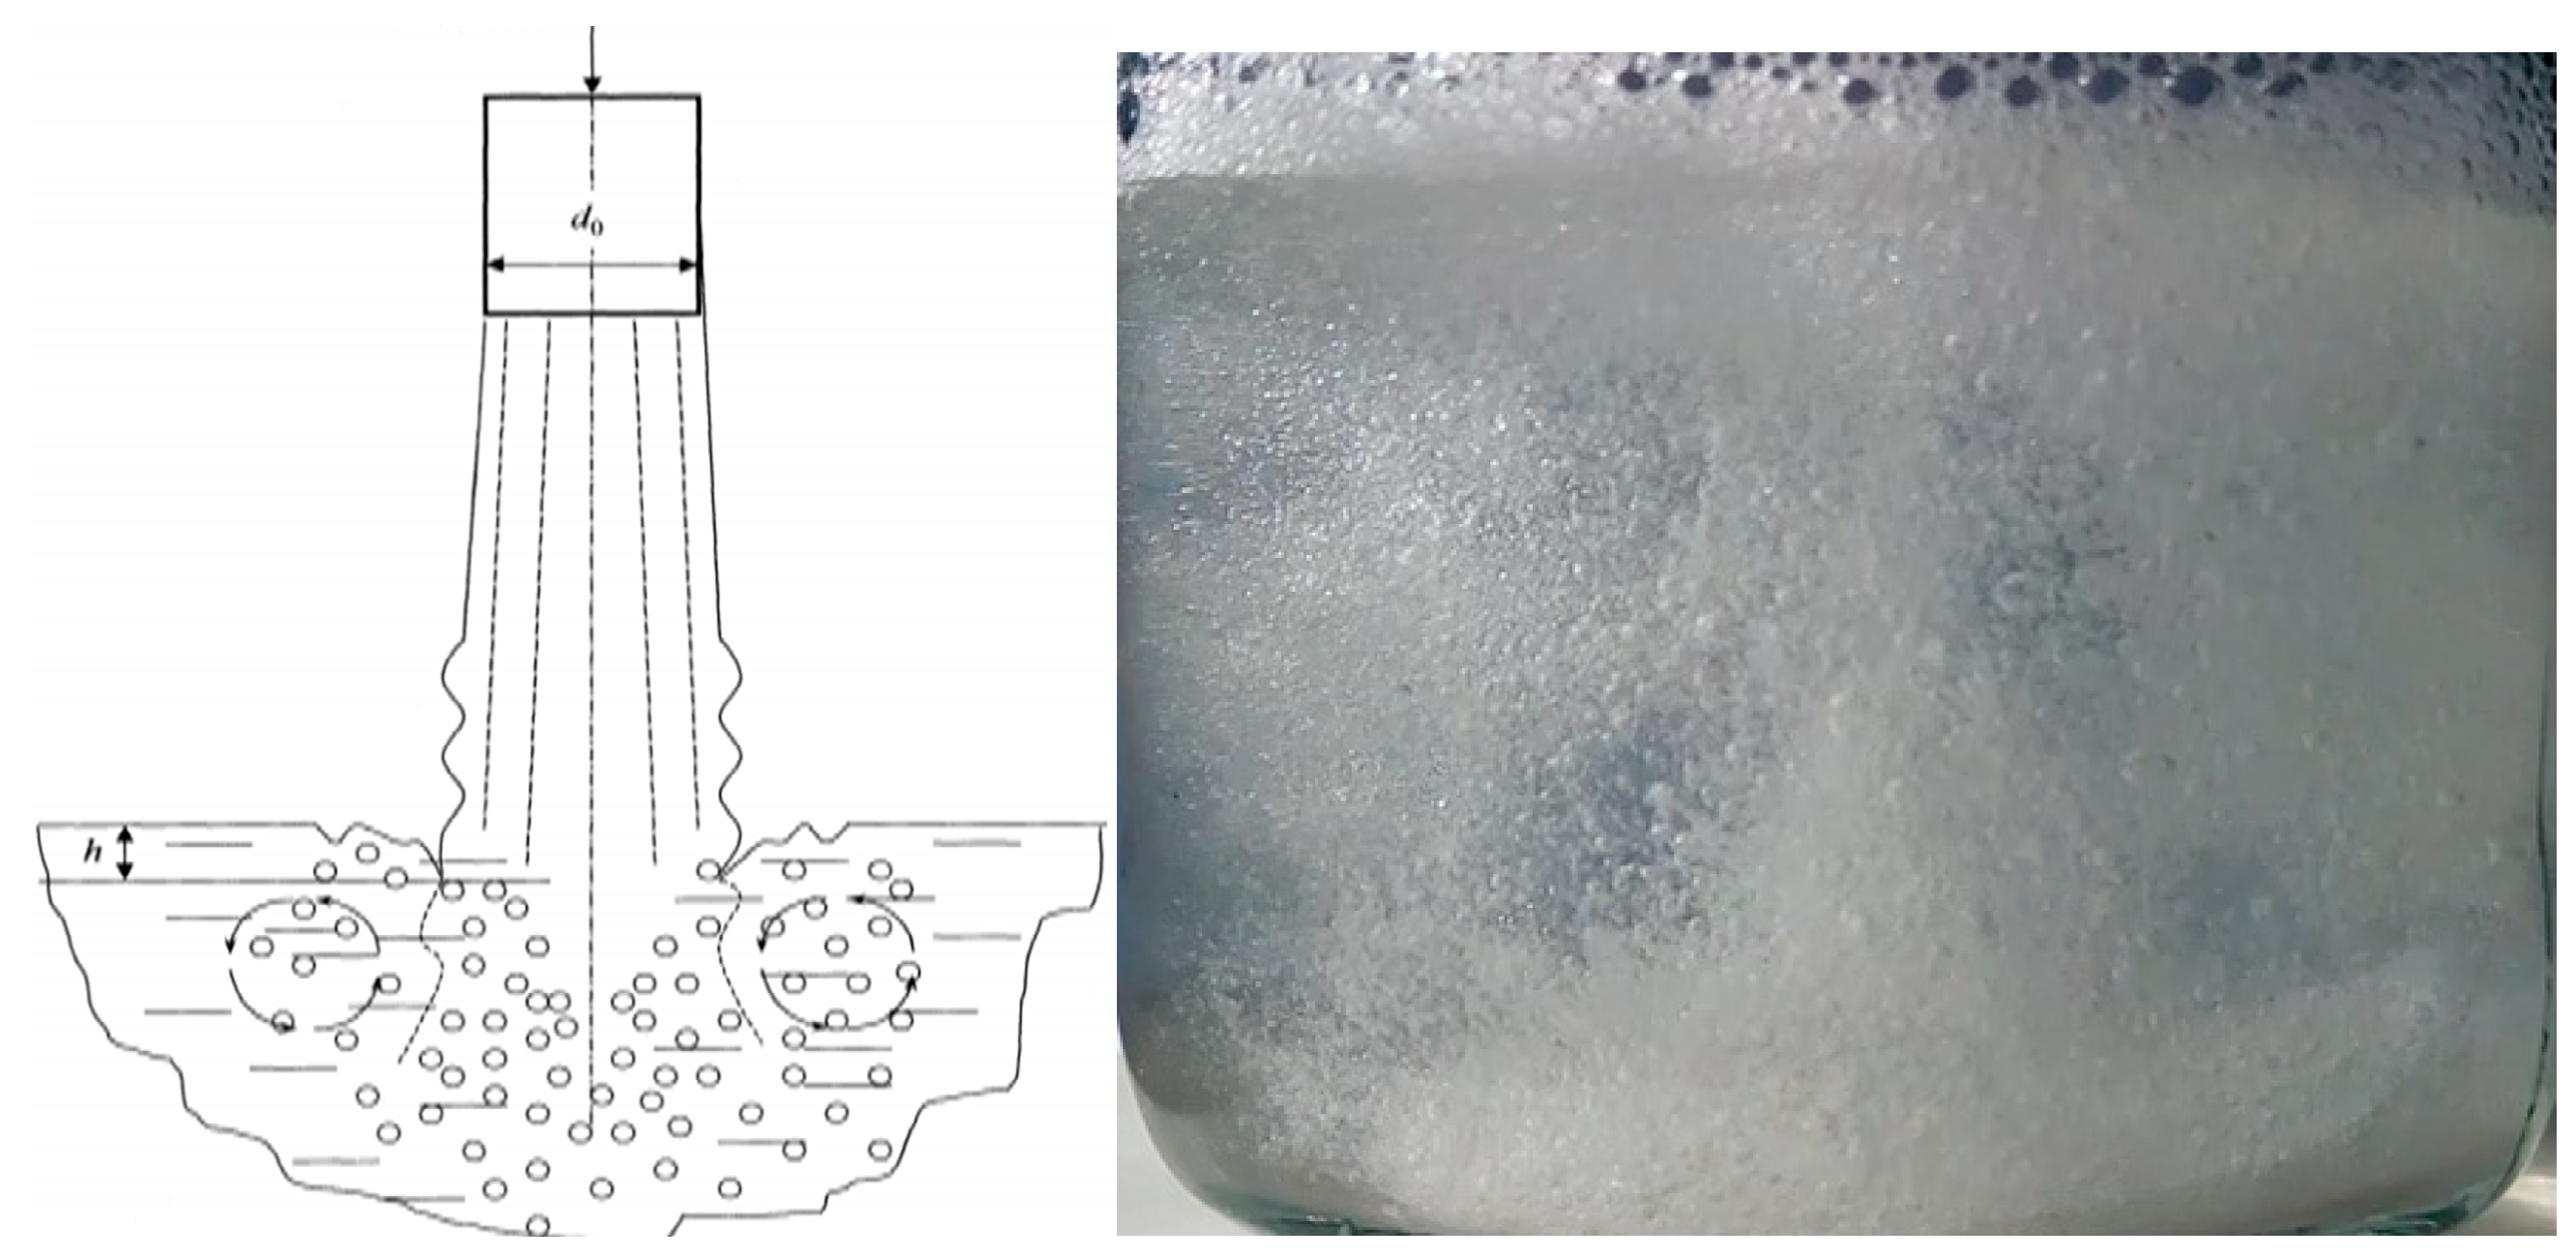
2.1. Intensification of GH Formation Processes by Renewing the Phase Boundary

Mixing of the contacting media also contributes to the renewal of phase contact interface. To determine how effective such initiation can be, we performed experimental studies of synthesis processes in a laboratory reactor with and without a high-speed rotating mixer (Figure 1). The specific amount of formed hydrate had to be determined (Ig, kg/(m2s)). To assess the level of synthesis intensification by mechanical initiation, the number of mixer revolutions, the degree of its immersion in the liquid and thermodynamic conditions changed. Then, the obtained data were compared with the intensity of diffusive hydrate formation (without mixing).
External thermostat 8 (Figure 1) was used to stabilize the temperature in the reactor. The variation of temperature readings was ±0.1 °C and thermodynamic parameters corresponded to the hydrate formation conditions. The following measurement methods were used. First, the reactor was filled with a gas mixture at 10–15 °C. After the temperature regime was stabilized, the initial pressure was recorded. Subsequently, the temperature in the reactor was decreased to hydrate formation temperature and the pressure was stabilized. Then, the temperature in the reactor was maintained for a specified time interval, whilst time and gas pressure readings were recorded. The hydrate formation occurred at the fixed interface. The experiment was completed with an increase of temperature in the reactor, hydrate dissociation and gas volume measurement.
For pure gases of the methane group, thermodynamic conditions of GH equilibrium state were approximated by means of the equations shown in Table 1.
As an example, let us present some typical mass transfer characteristics for experiments with a propane-butane mixture. After the temperature reaches +2.5 °C (supercooling 2.1 °C), propane hydrate formation begins and the formed hydrate crust sharply inhibits further hydrate formation. Similar results were obtained at other gas temperatures.
With further increase in subcooling, diffusion processes are initially more intense (about 1.5 times) (Figure 2) but with higher subcooling, the hydrate crust thickness on the phase interface grows faster and diffusion processes rapidly slow down. After about 50 min the hydrate formation intensity at different supercooling levels becomes almost the same.
Experimental data can be approximated by the following dependence:
I g = 17.8 τ 3.5
Figure 2 shows a dependency graph of the specific amount of formed GH; it can be used to assess the degree of decrease in hydrate formation intensity over time (in the growth of hydrate crust at a fixed phase interface) (Figure 2a) and a dependency graph of the specific amount of GH over time at different temperatures (Figure 2b).
The obtained data indicate a significant decrease in the intensity of mass transfer processes at the fixed phase interface.

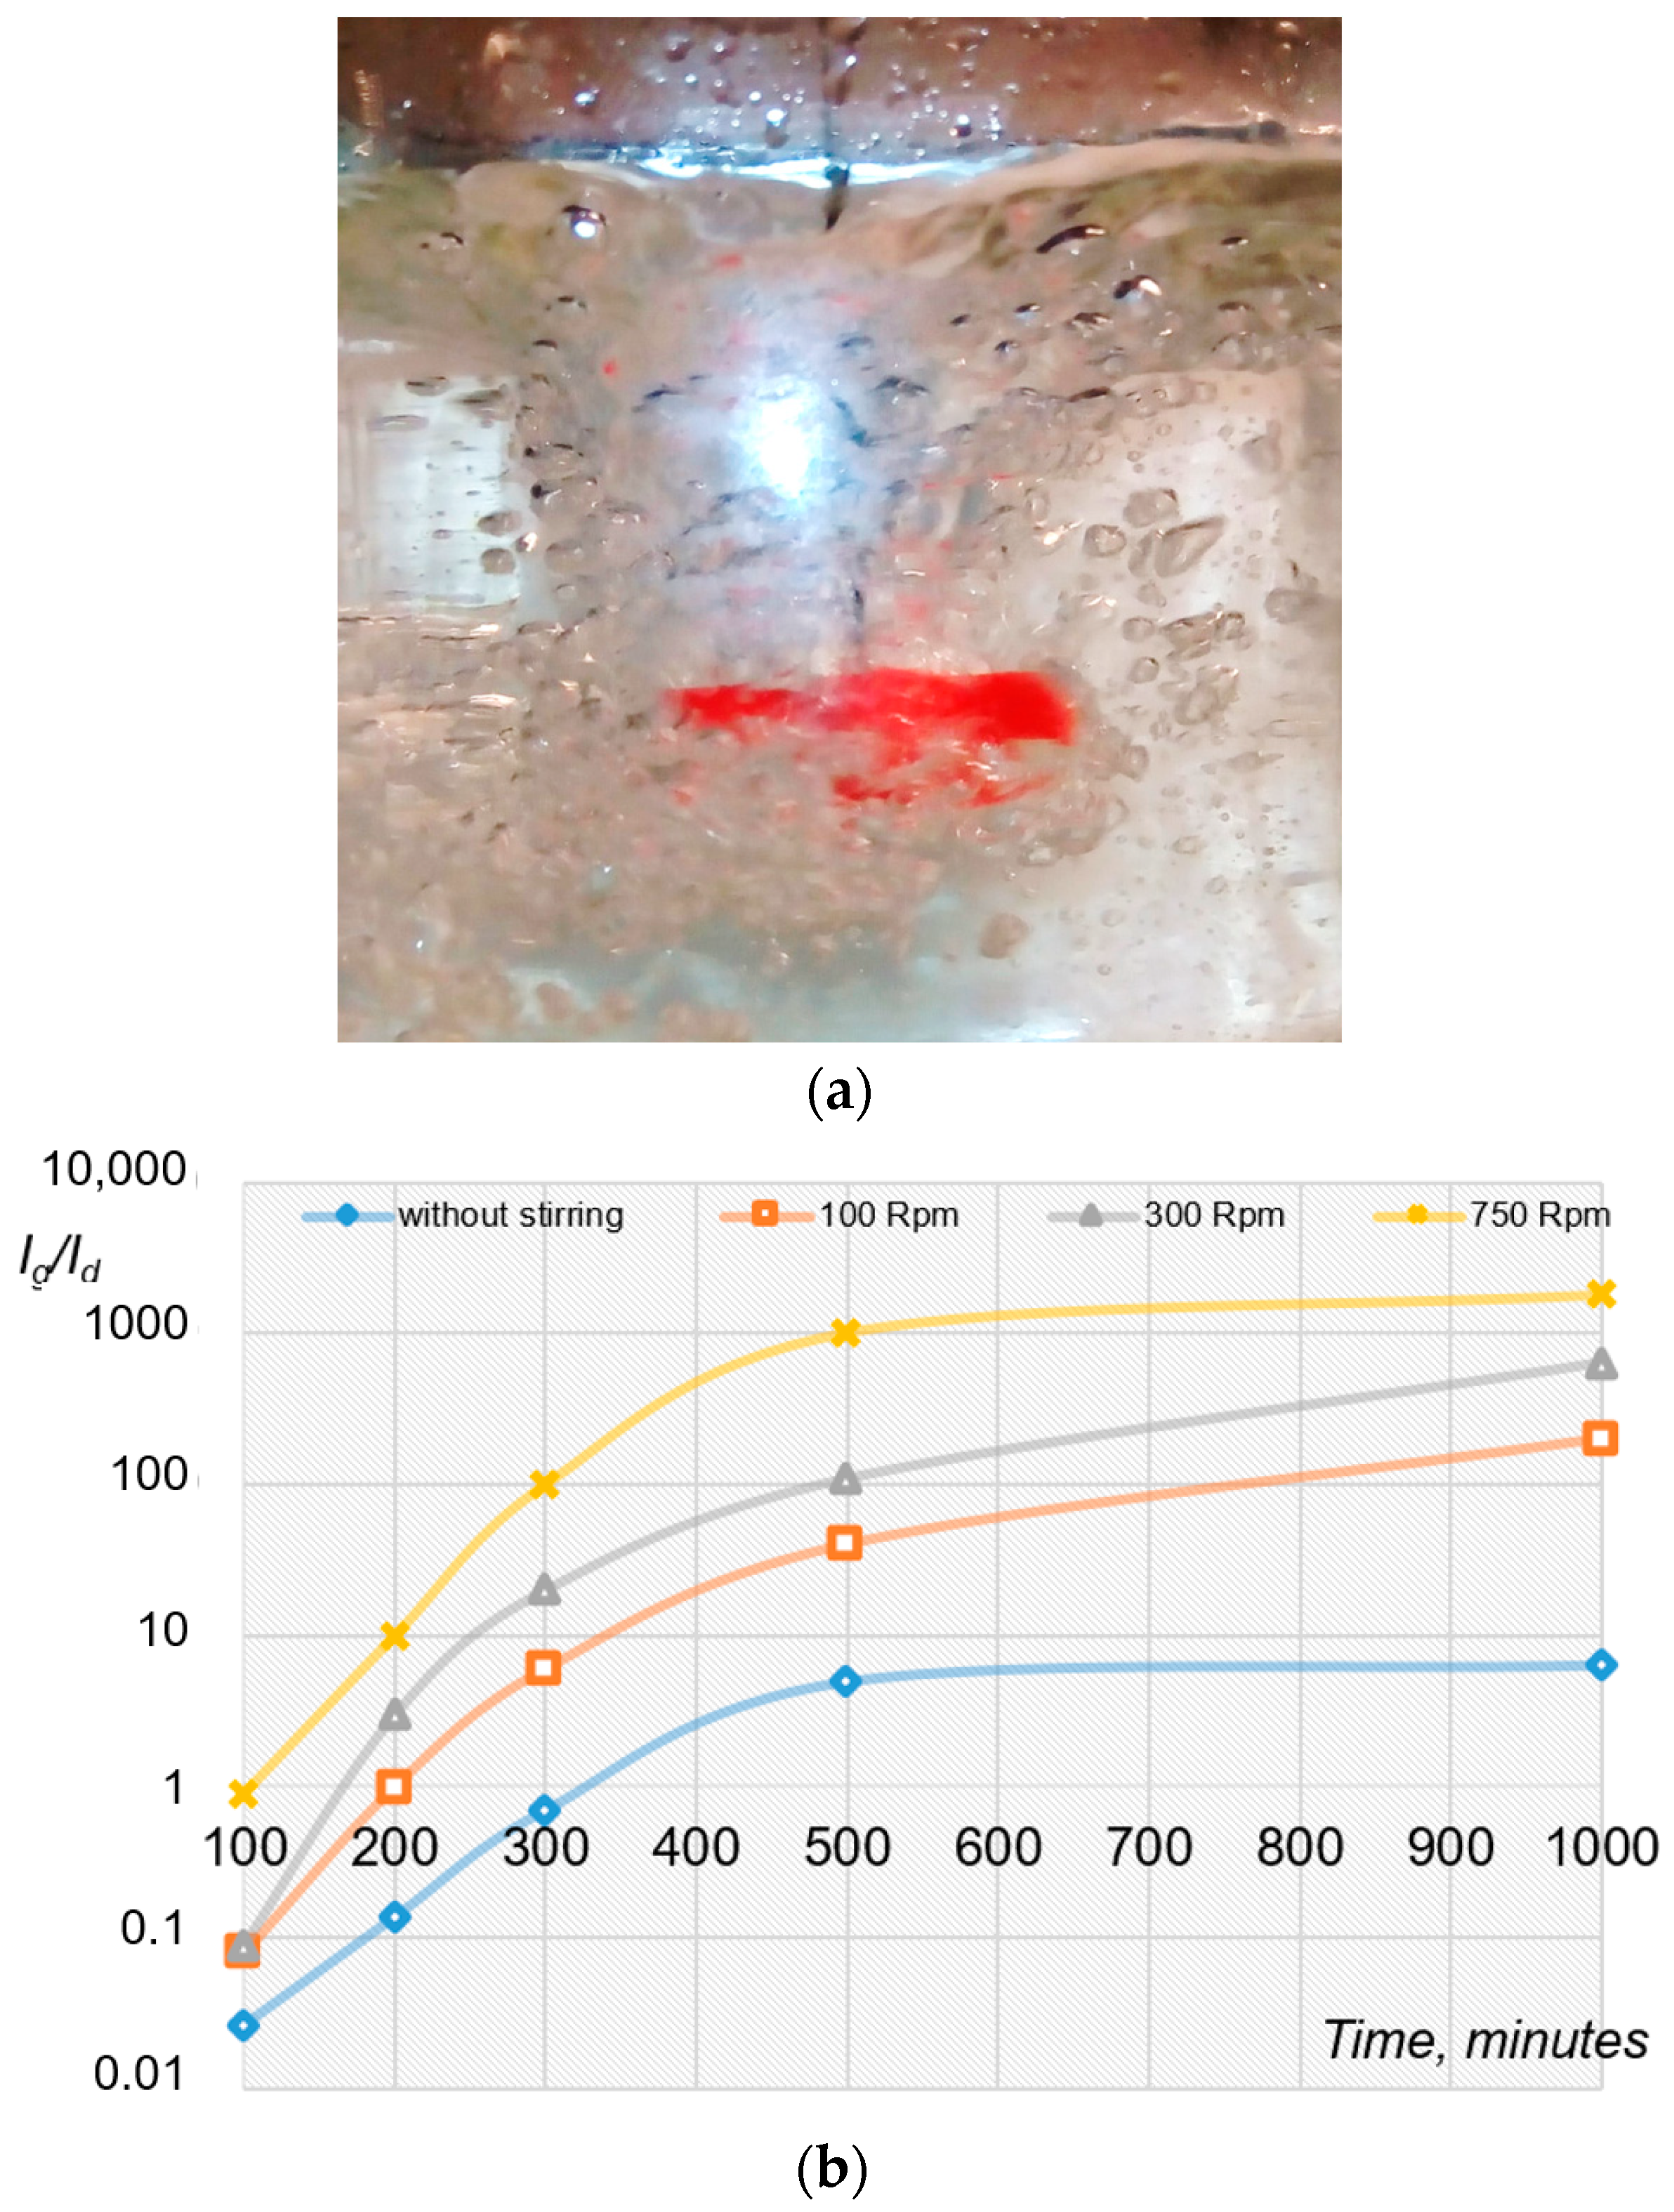
2.2. Mechanical Initiation of Hydrate Formation Processes Using Mixing Devices

Diffusion mechanisms of hydrate formation at the fixed phase interface are consid-ered the basic ones, and in the future we will use the data to assess the initiation efficiency.
The mechanical initiation of the hydrate formation process was performed using a mixer within the range of 10–1500 revolutions per minute.
At low speeds of the mixer blades (up to 100 revolutions per minute), GH formation rate increased by about 6.4 times. However, upon reaching such revolutions, when a por-tion of gas above the water surface was captured by the liquid flow (in our experiments, 700–800 revolutions per minute) and a bubble flow structure was formed (Figure 3a), the synthesis process intensity did not increase with further increase in the speed of the mixer blades. Clearly, this effect depends on the immersion depth of the blades, but its qualita-tive characteristic remains unchanged. Figure 3b shows the measurement results. In the graphs, we can distinguish plateau areas of the mass transfer stabilization. This mode corresponds to a new method of hydrate formation on the surface of gas bubbles but, in this case, hydrate films were destroyed and bubbles with the hydrate layer accumulated on the water surface. The synthesis process intensity increased as a result of a significant increase in the phase interface.
Figure 3 shows a depression in water (vortex) when the mixer is operating and a bubble formation zone. Gas bubbles are relatively large in size Ø1–3 mm. The experiment was performed in the presence of a refrigeration unit with a thermostat. Water and gas temperature was stabilized at the set level within 0–+ 2 °C. The studied mixture components were propane and distilled water.
As a result of measurements, significant activation of the mass transfer process was observed. Approximation formula for the calculation of the relative intensity of mass transfer, compared to free diffusion mode (R2 = 0.89):
I g I d = 1 + 14.7 e 1.53 · τ
where τ is time, s, Id is the amount of GH obtained at a fixed interface by diffusion (without initiating the process). Experimental data demonstrate mass transfer activation by 12–13 times, but after 40 min from the start of mass transfer the use of a high-speed mixer becomes ineffective.
Thus, the high-speed mixer operation can activate the mass transfer 7–8 times at the beginning of the hydrate formation process but the hydrate film formation, even in this case, prevents an intensive synthesis. To achieve high GH synthesis intensity, hydrate film must be constantly destroyed.

3. Materials and Methods

This study is represented by the development of the ideas specified in [46]. Based on the analysis of GH synthesis devices, cited in Section 1, we developed an injection reactor (Figure 4) to solve the problems of hydrate crust breaking at the interface, as well as massive heat removal from the reaction zone formation of the developed phase contact area.
The hydrate crust breaking contributes to the renewal of the phase contact surface, while the intensity of mass transfer processes remains quite high. The broken crusts are continuously removed from reactor 1 to separator 2—water after hydrate separation returns to the reactor. Hydrate crystals enter the reactor with the recirculation water, becoming the centres of hydrate structure formation. This technology requires a separator, but it makes it possible to solve these problems and organize a continuous synthesis process.
Figure 5 shows the scheme of gas-liquid mixture formation. In injection nozzle 4 (Figure 4), part of the gas from the reactor zone enters the water jet and mixes. When the jet enters liquid volume, gas is injected into the liquid and dispersed with the formation of the smallest bubbles. Gas pressure in the bubbles change cyclically, deforming the surface of bubbles.
The amount of injected gas depends on the nozzle geometric parameters and hydrodynamic mode of liquid flow.
Gas bubbles, in the process of hydrate crust formation around them, will be subjected to variable deformation resulting from pressure change in the middle of bubbles and mechanical action of the liquid jet. At the same time, constant crust breaking will take place as gas bubbles change their size and form. Gas bubbles are repeatedly deformed in the liquid flow, while hydrate crusts get destructed and removed from the reaction zone.
The proposed GH production procedure is a continuous process, which will occur at constant parameters. The reactor pressure is maintained automatically by compensating for the appropriate amount of gas that has entered the gas hydrate. For continuous GH synthesis, it is necessary to provide conditions for its constant removal from the reactor, supply of gas and water to the reactor, as well as heat removal during hydrate formation. Hydrate removal from the reactor is complicated due to a rapid agglomeration of hydrate structures (broken GH crusts). To prevent this process, the GH concentration in the mixture cannot exceed 15–17%.
Water, separated from the water-gas-hydrate mixture in the separator, returns to the reactor, containing many microstructures and hydrate formation 0.1–0.5 mm nuclei. The hydrate formation rate at this phase contact is quite high, depending on the reaction zone temperature, which in turn depends on the heat removal rate of GH synthesis reaction.

4. Results

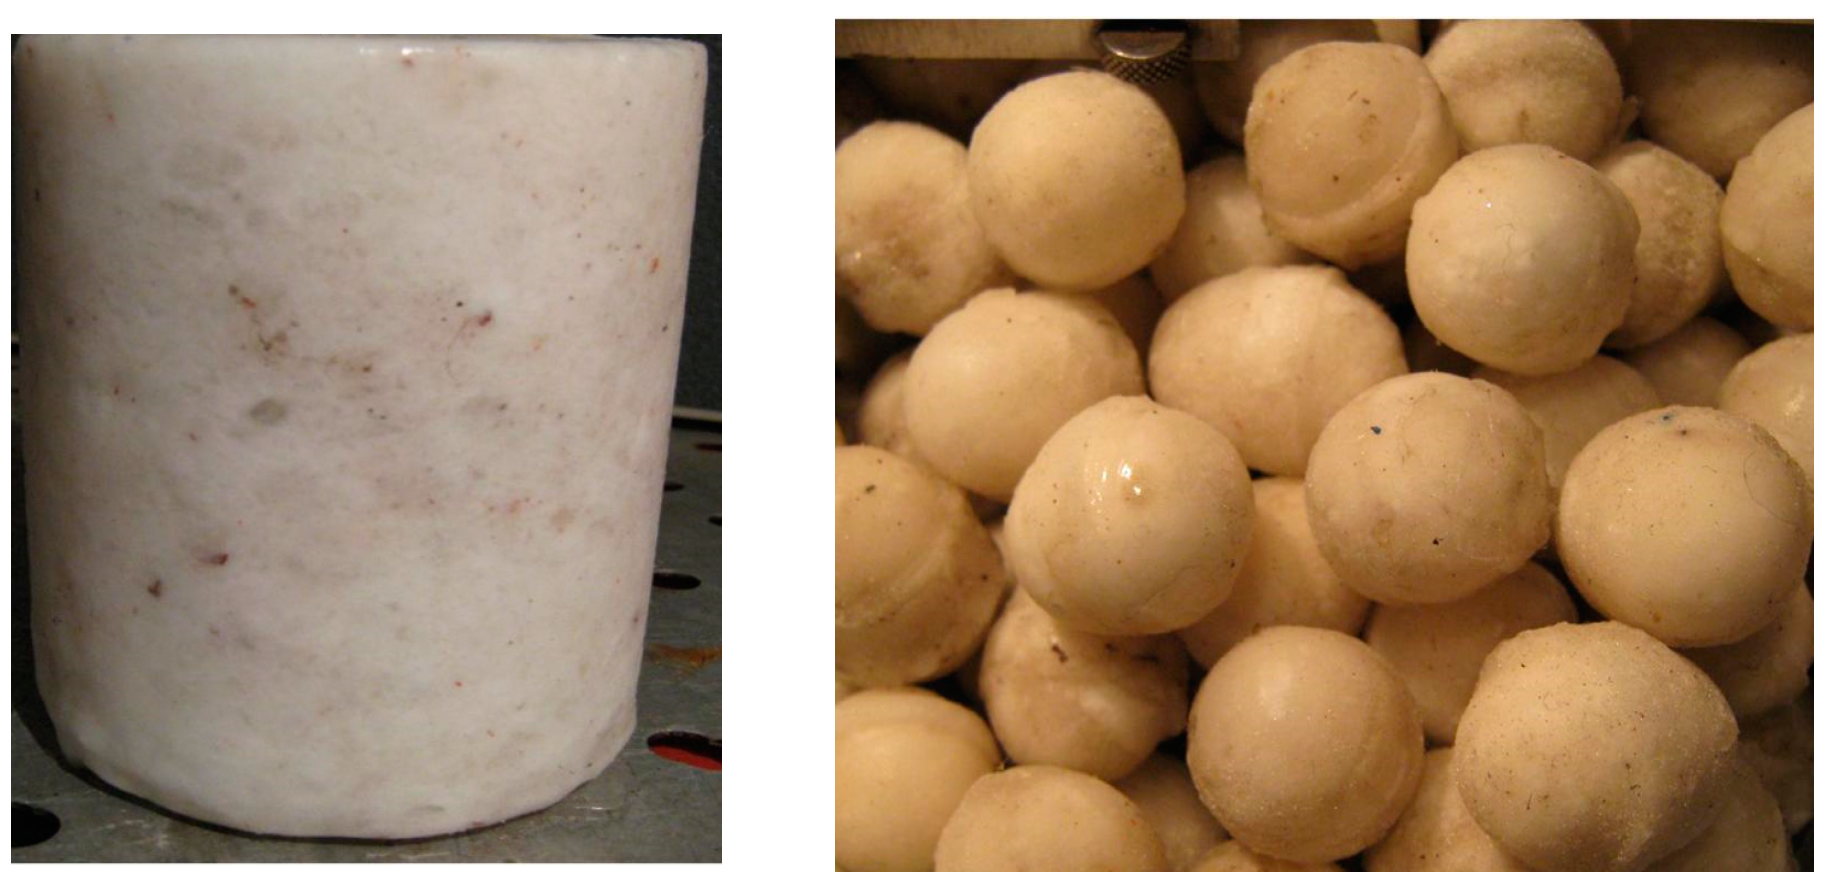
4.1. Water Removal from Gas Hydrate Mass

In separator 2 (Figure 4), most of the water is separated from the hydrate mixture. However, it is problematic to remove adsorbed water by separation. In our previous experiments on the presented installation, the separation coefficient was up to 0.83–0.85. To produce a dry gas hydrate, the cooled gas hydrate mixture obtained in the separator contacts with gas under certain thermodynamic conditions in a thermal chamber 11 (Figure 4). In this case, a considerable total surface pore area provides a sufficient contact phase area for intensive hydrate formation.
The following gas was used for the experiment: CH4—92.8%, C3H8—2.1%, C2H6—5.1%. The nozzle diameter was 2.12 (mm). Gas pressure in the reactor was maintained at 3.8 MPa. The temperature in a plant thermal chamber was maintained at 276.1 (K). The distance from nozzle 4 (Figure 4) of the jet apparatus to the liquid surface was 98 (mm). Water was supplied into the nozzle under 10 (MPa) with 1.3∙10−3 (m3/s) flow rate. As a result of pressure drop between pump 12, separator 2 and reactor 1 water-gas hydrate mixture circulated from the reactor to the separator. Wet gas-hydrate mixture was subjected to the final stage of processing in contact apparatus 11 where GH final properties were formed. Hydrate formation heat was removed in thermostat 9. The rate of gas hydrate formation was determined by the amount of gas consumed per unit time.

4.2. Hydrate Mass Drying

The hydrate mass is dried through its contact with hydrate-forming gas (in this case, a gas of similar composition) in thermal chamber 11 (Figure 4). When a hydrate mass layer is treated with gas under pressure, free water binds to the hydrate.
The crushed hydrate mass (with particle size not exceeding 1 mm) was placed in a 0.65-m long cylindrical container 0.1 m in diameter. Gas was supplied to the container, whilst pressure and temperature were recorded as appropriate. The gas pressure in the container was raised to 5 MPa at 273.5 K. This temperature was maintained throughout the drying process. The hydrate structure and its properties change during processing (Figure 6). Hydrate in Figure 6b is ready for formation into blocks or granules (Figure 7).
Figure 8 shows a thermogram of the hydrate formation process in a dehumidifier. Layer temperature sensors recorded the temperature change over time. Pressure in the dehumidifier was rising stepwise. The change in pressure was accompanied by a change in the hydrate structure. As shown in Figure 8, the pressure injection process was completed in about 10 min. The whole formation process lasted 40 min. Prior to processing, morphology of the hydrate containing the experimental medium was a significant inhomogeneity (Figure 6a). Adsorbed water formed GH during drying.
Figure 8 shows the temperature trajectories during the hydrate formation process. Temperatures in various experiments ranged from 273.5 to 265 K. The decrease in temperature indicated a more intense process. However, a decrease in temperature below the minimum specified value resulted in GH drying with a final morphology (Figure 6c) not suitable for pressing the hydrate into granules with a stable structure.

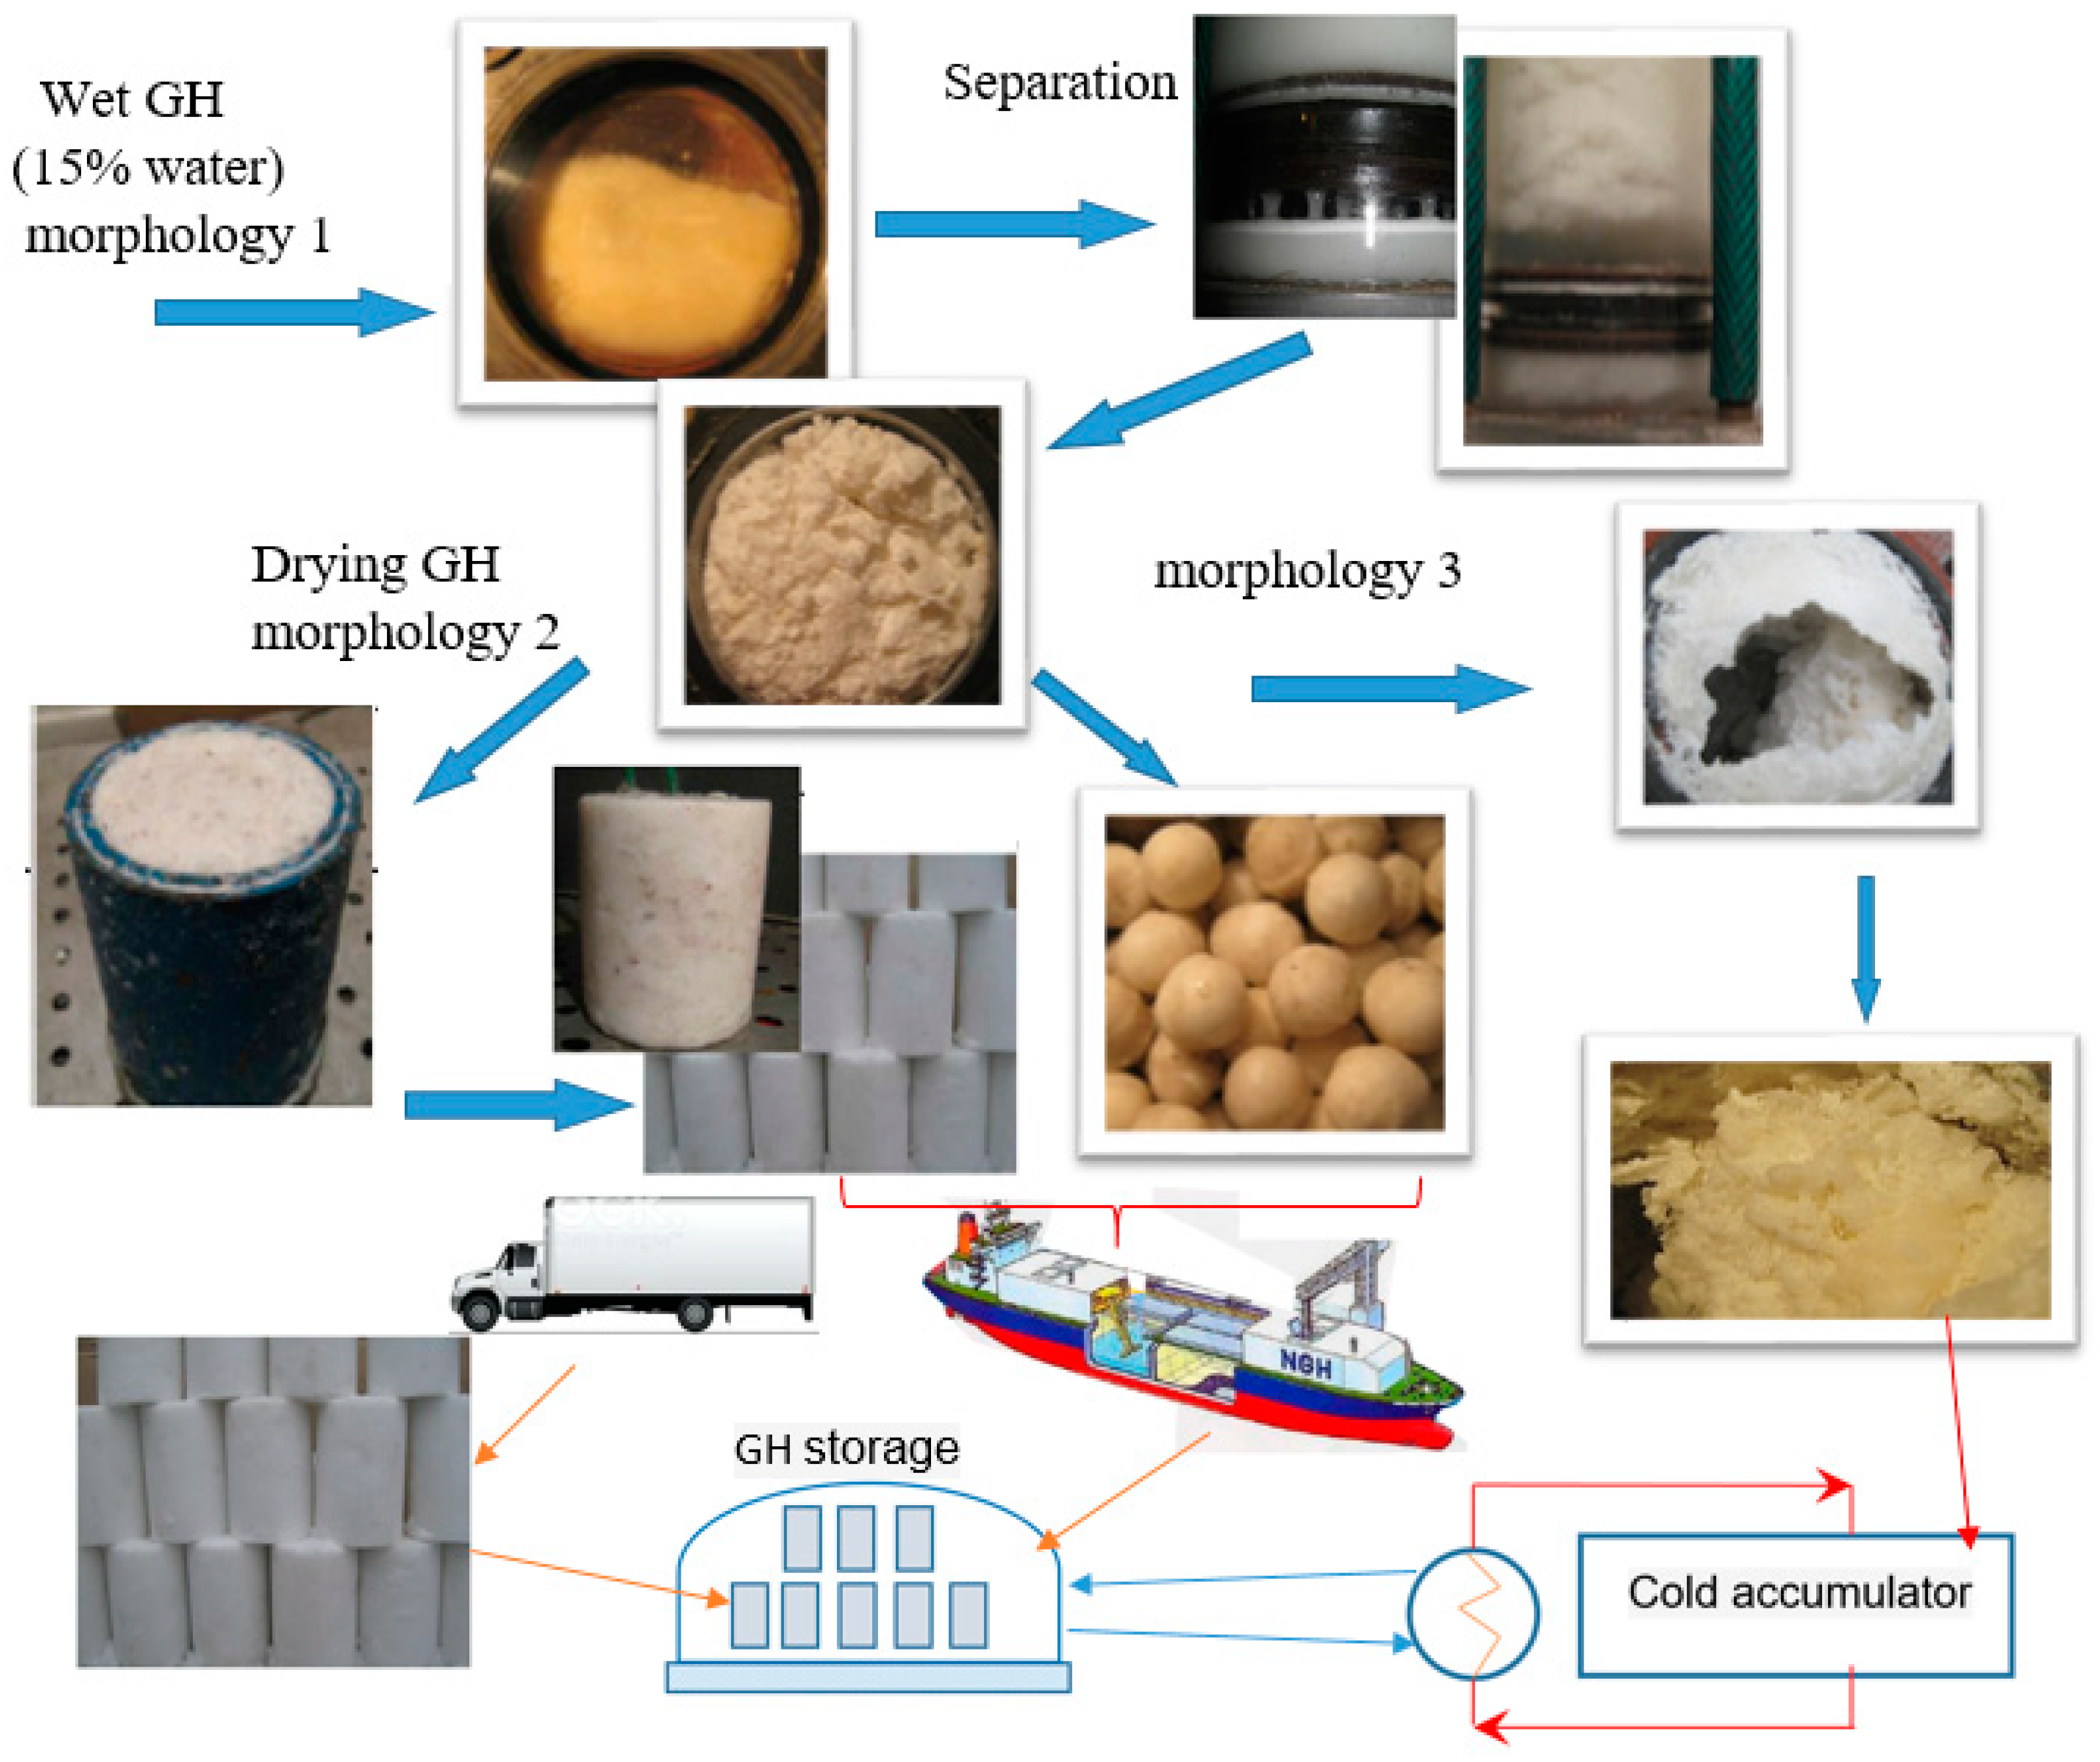
4.3. General Process Flow Diagram of GH Synthesis

Figure 9 shows a GH synthesis diagram, including the main processes: hydrate mass formation, separation, adsorbed water binding and formation of gas hydrate granules or blocks suitable for transportation and storage. If GH is used for heat accumulators, then the final stage of hydrate formation will be implemented at a low temperature (Figure 6c and Figure 8).
Optimal thermobaric conditions of the hydrate formation process in reactor 1 were determined experimentally and are presented in Figure 10 through the equilibrium hydrate formation curve.
After empirical data processing, the equation describing the process of gas hydrate formation in the reactor is as follows mol/s:
R = 0.117 · V ( k m 3.15 ) 1.15 ( c s o l c b ) ,
where csol is gas concentration at the gas-liquid interface at hydrate formation pressure and equilibrium temperature, (mol/m3); cb is the gas concentration in the liquid at hydrate formation pressure and equilibrium temperature, (mol/m3); v0 is the water velocity in 4 (Figure 4), (m/s), mass transfer coefficient km depends on nozzle diameter d0, liquid volume in reactor V and is determined by the following formula:
k m = 5.4 · 10 6 ( ρ · d 0 3 · v 0 3 ) σ · V 0 [ l n d 0 ] ,
where ρ, (kg/m3) is water density, surface tension of liquid σ—4.56·10−2—7.33·10−2 (N/m), ln—injector nozzle length, V0 is volumetric water flow, (m3/s).

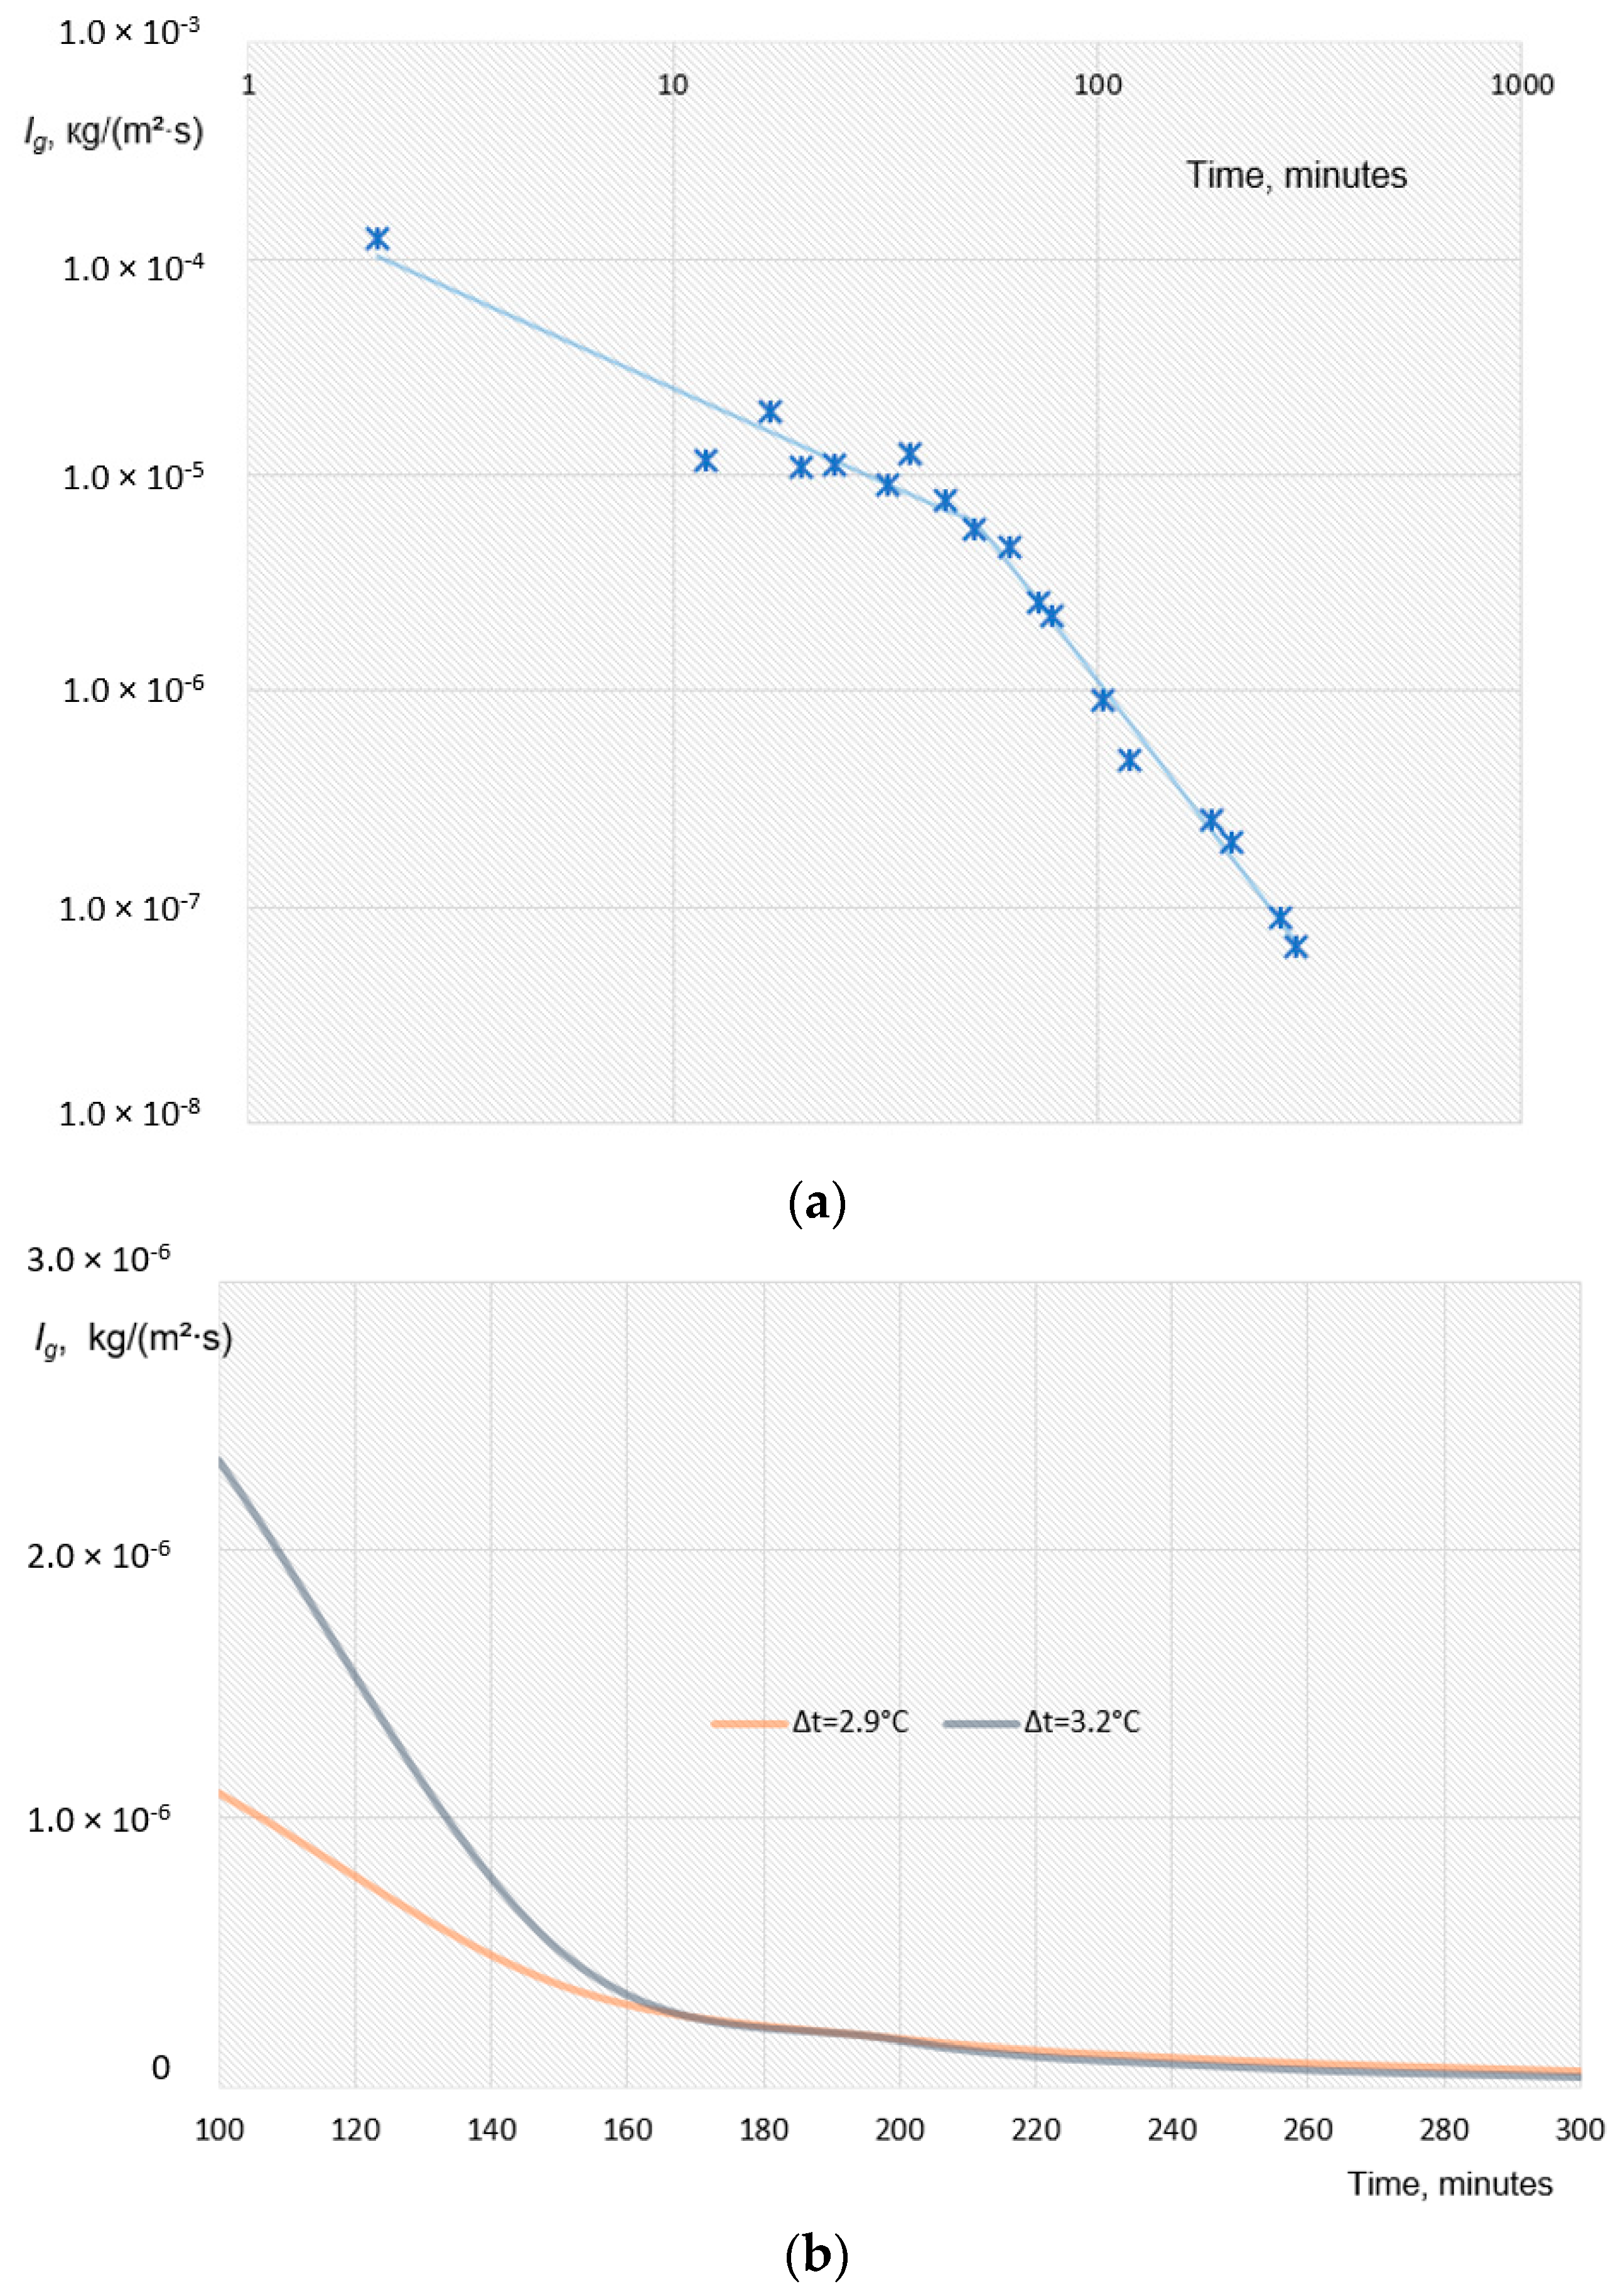
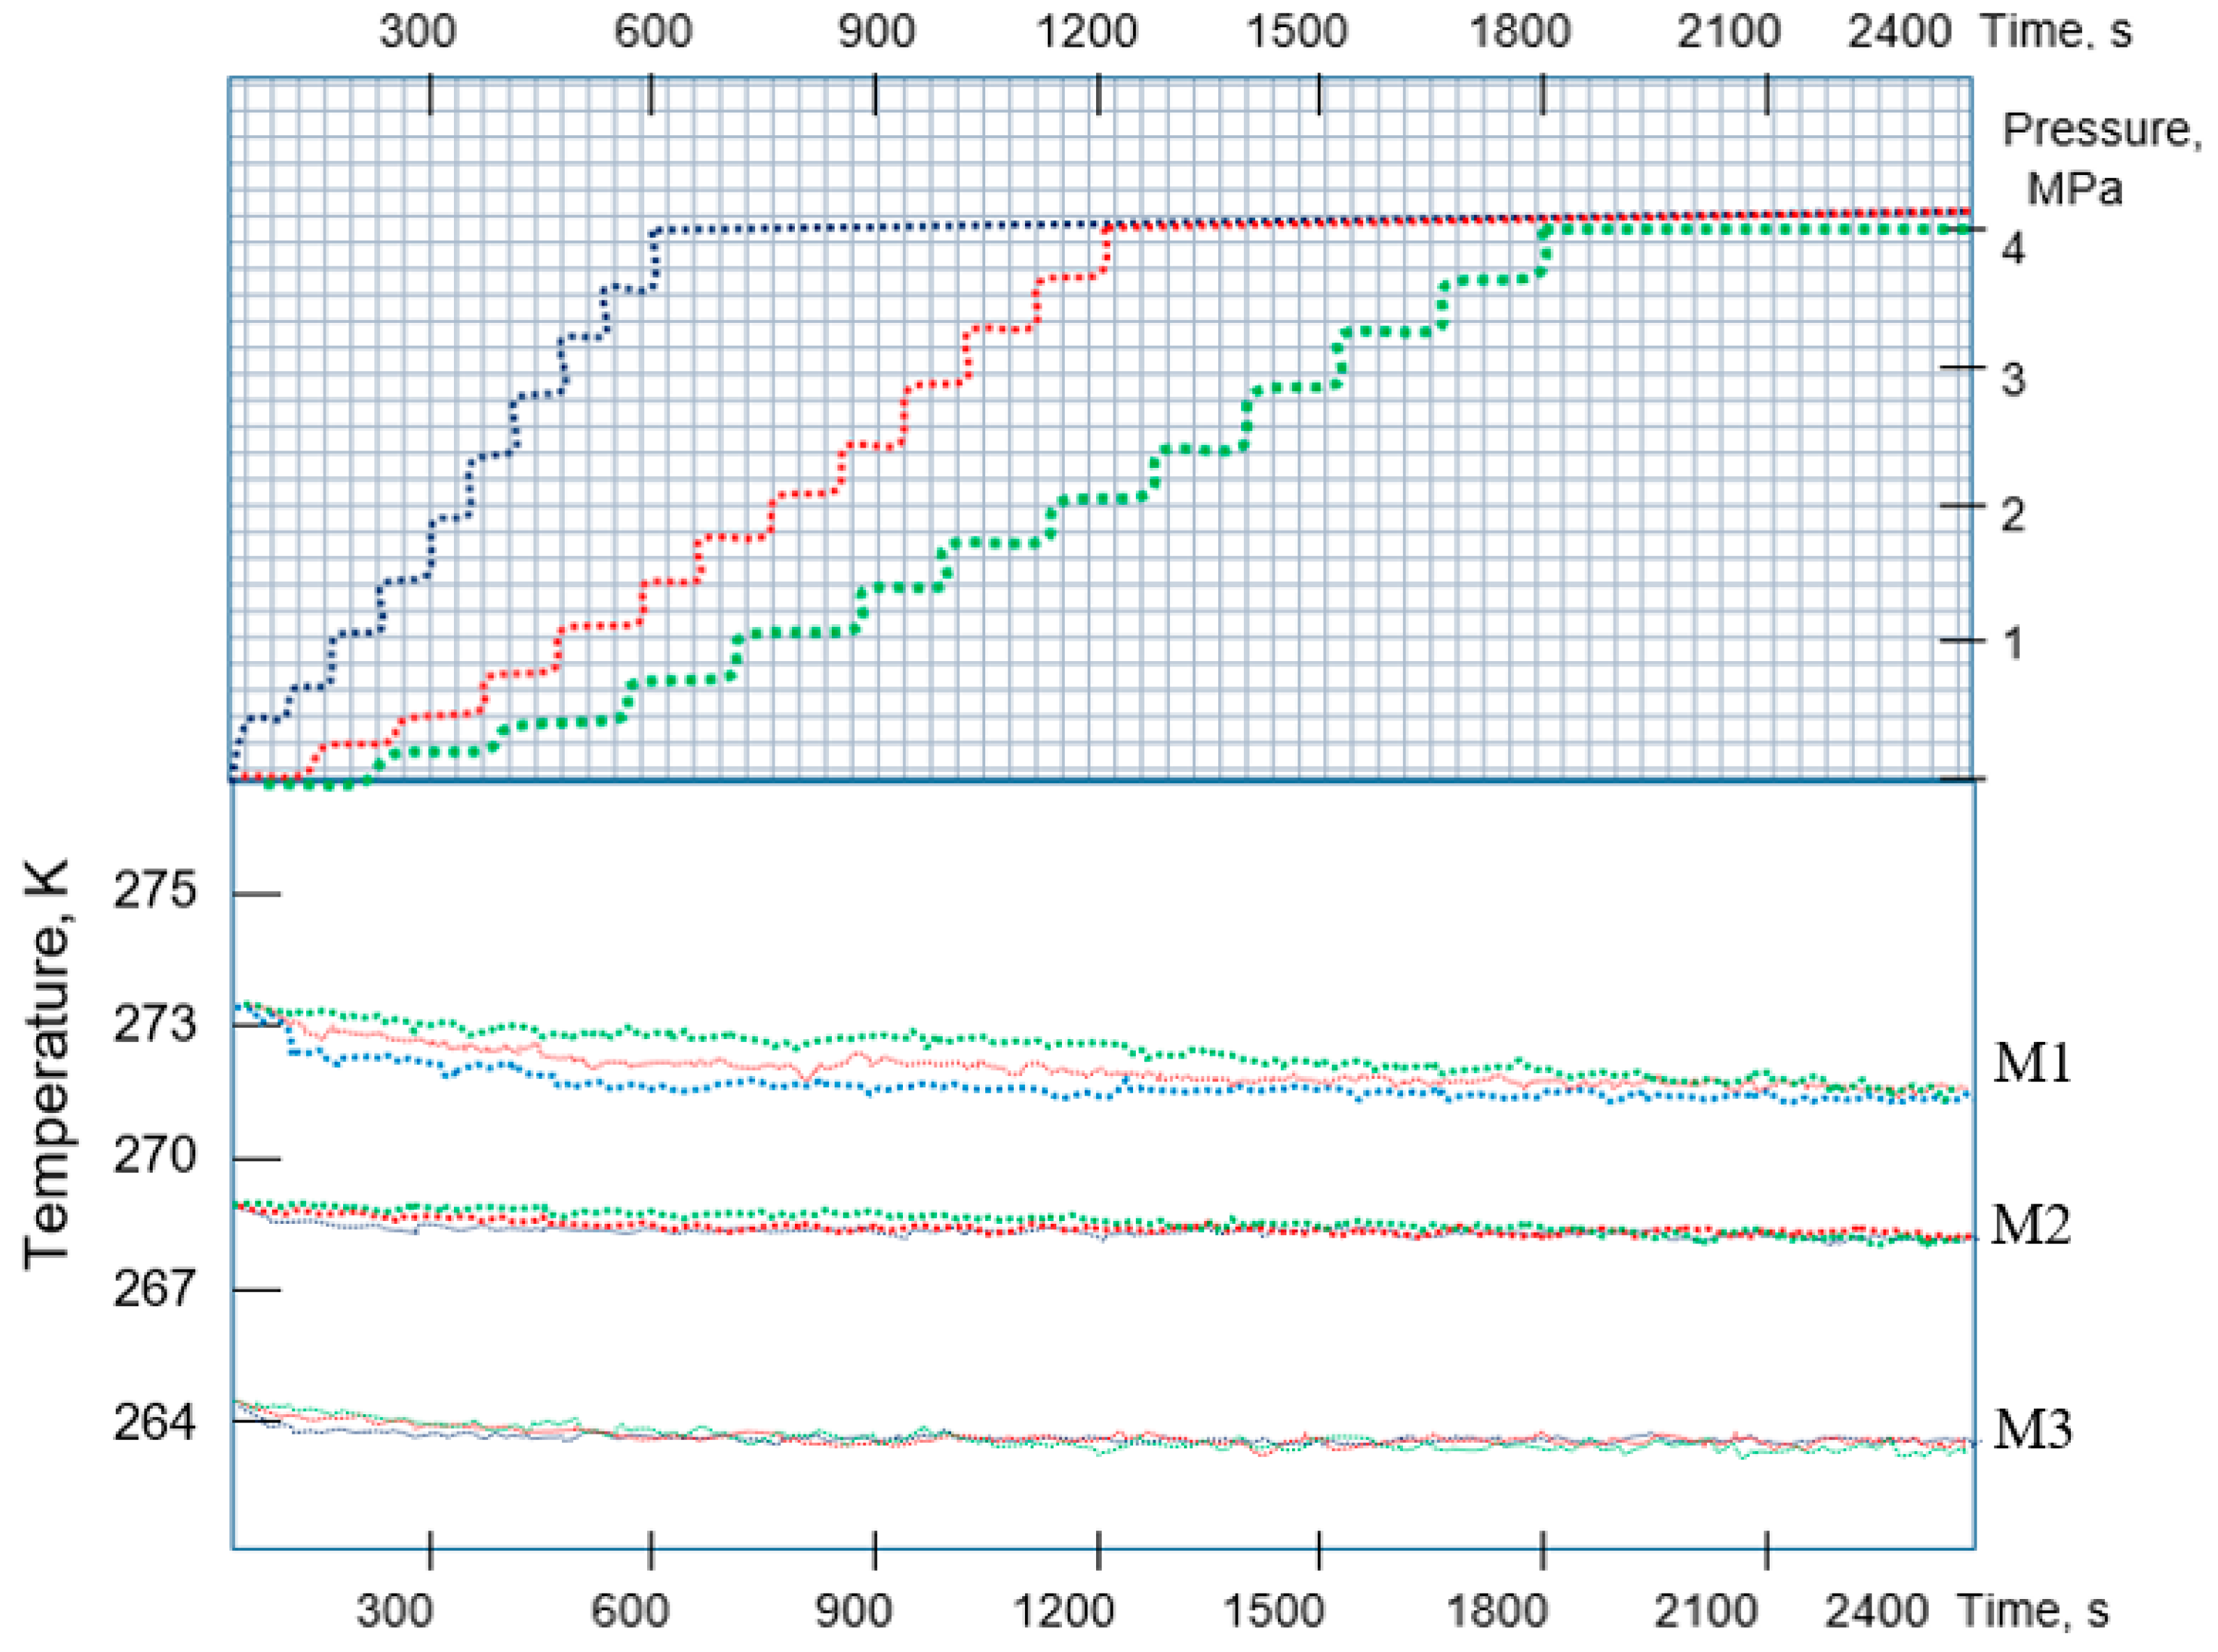
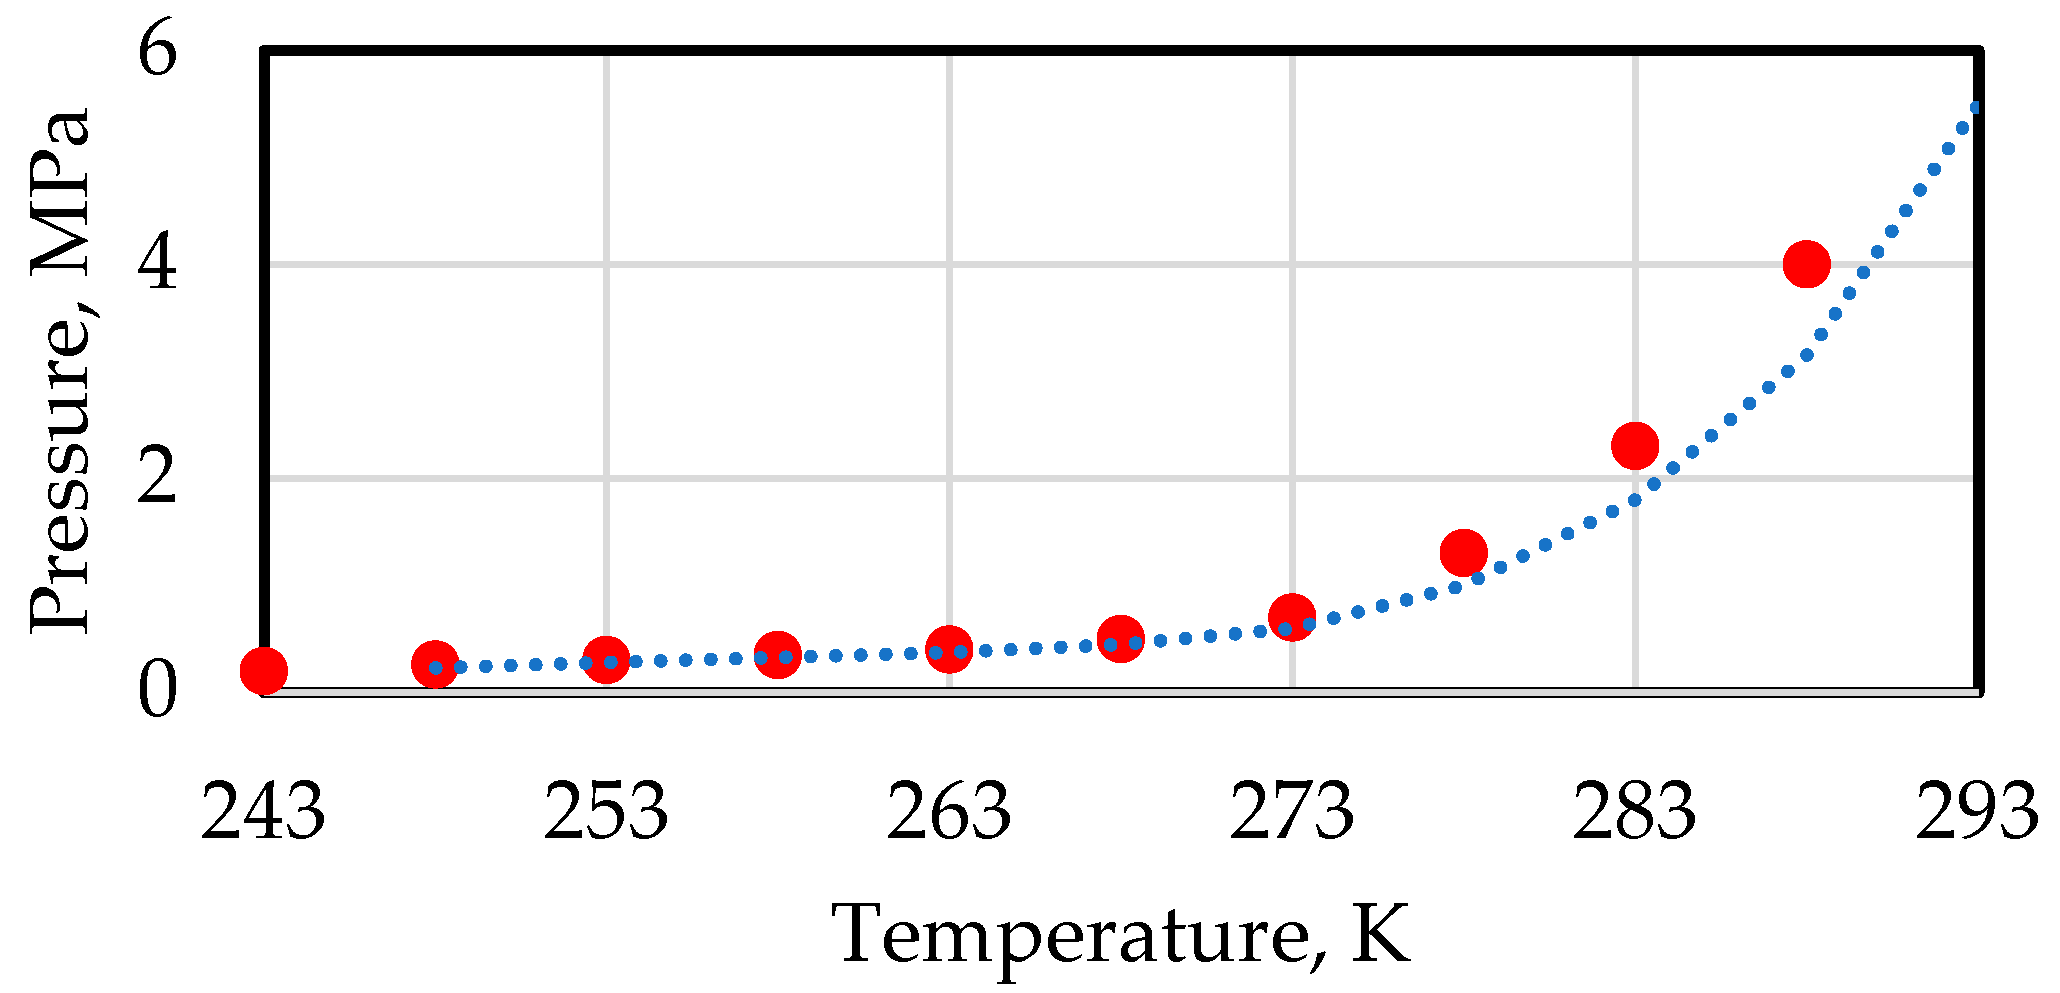
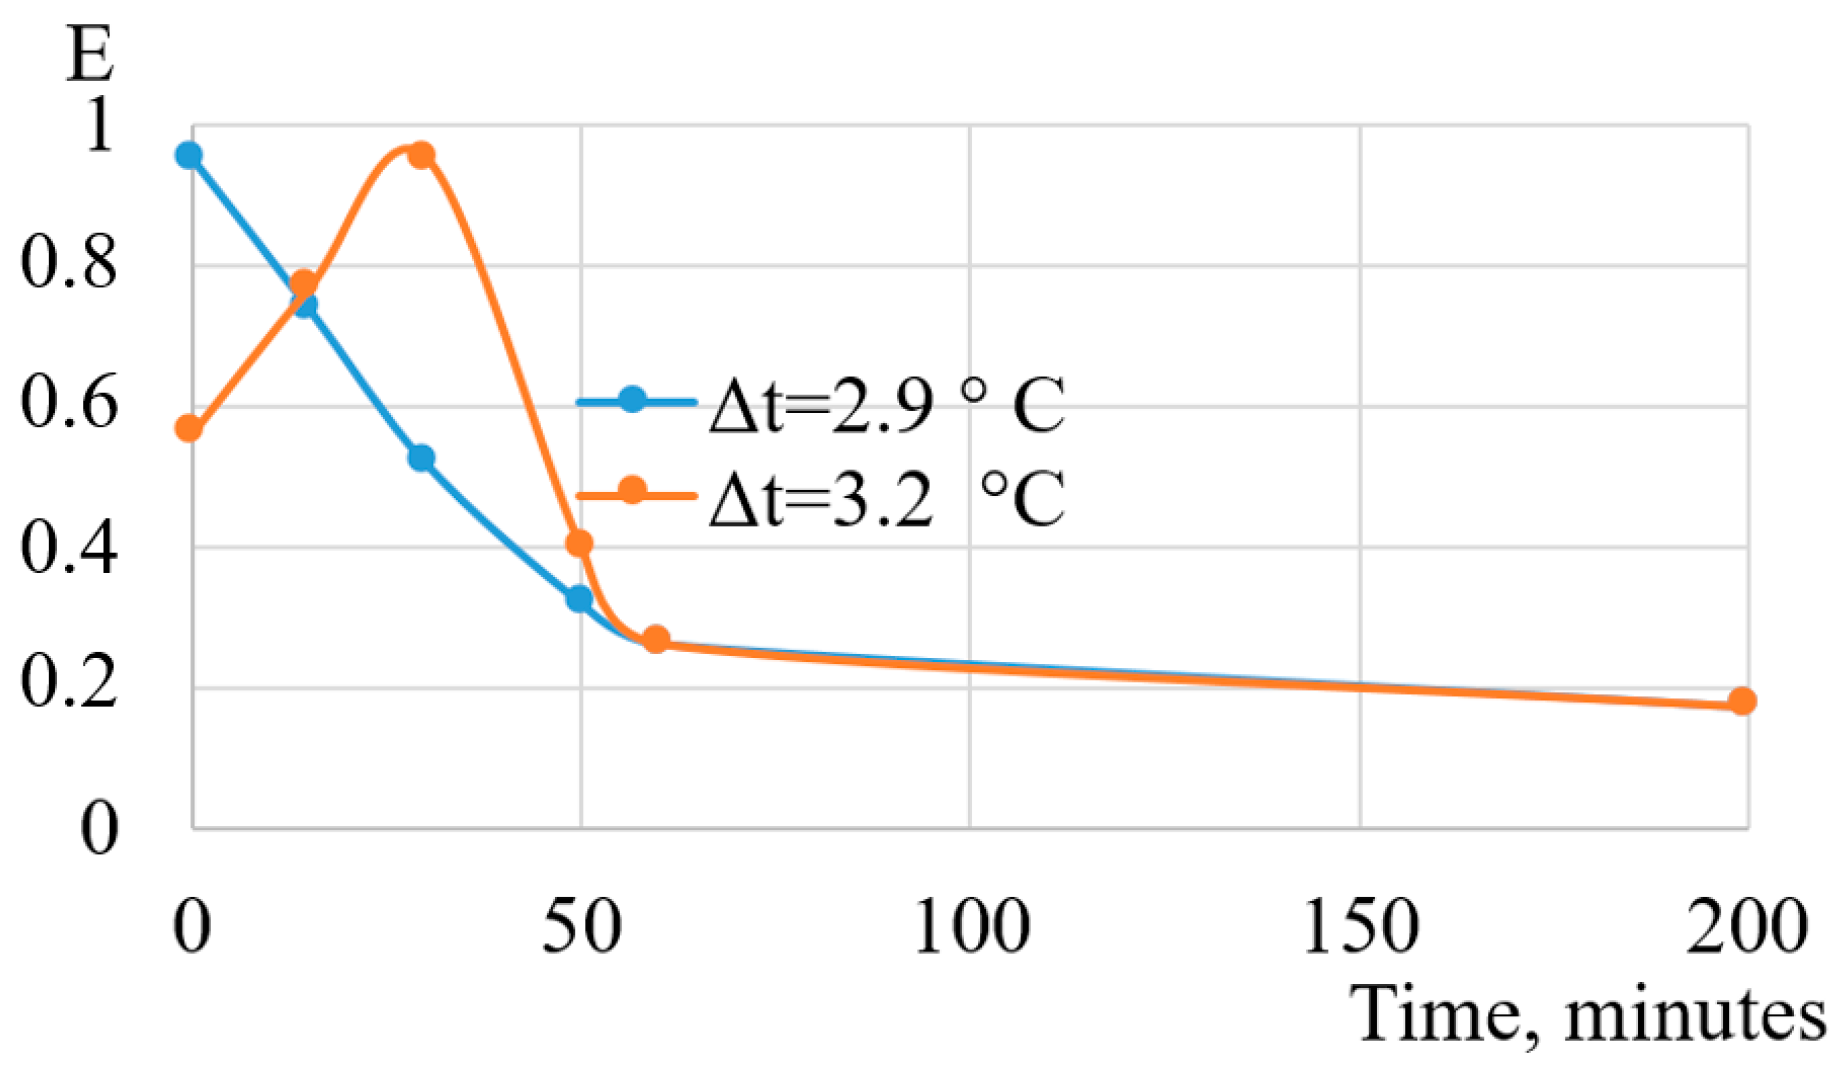
5. Heat Exchange Processes on the Interfacial Surface

The hydrate formation is based on heat and mass transfer processes. Each process can limit the reaction rate under certain conditions. However, with the optimal ratio of heat and mass transfer processes, GH can be produced rather quickly.
Our experimental data [46] are generalized by the following empirical equation:
β v l 2 D r = 0.042 · R e · S c 0.45 = 0.042 v g v r ( l v r D r ) 0.45 ,
where βv is the volume mass transfer coefficient from gas to liquid, s−1; βv = βF·SV; SV is specific surface area of the phase boundary, (1/m); Sc is the Schmidt number; l is a capillary constant, (m); Dr is the coefficient of molecular diffusion of gas into liquid, (m2/s); vr is the liquid volume; vg is the gas volume. Capillary constant:
l = σ ρ r g ,
where g is the acceleration of gravity, (m/s2); ρ r is the density of water.
Surface coefficient of mass transfer from gas to liquid with energy dissipation rate in liquid:
β F = 0.05 v g D r ν g ,   [ m s ]
According to the law of convective diffusion, the amount of gas transmitted to water surface,
M = β F · Δ C · F · τ ,   ( kg ) .
where ΔC is gas concentration difference, (kg/m3) F is phase contact surface area, (m2).
To optimize GH synthesis, it is necessary to correlate heat and mass transfer processes on the phase interfacial surface. We propose to apply the optimization criterion, which can be obtained by considering the system of equations of heat and mass transfer at the phase interfacial surface (W/m2) and (kg/(s∙m2))
{ q = α ( T g T 0 ) Δ M = β F ( ρ 0 ρ g ) q = Δ M · r m ¯ g ,
where m ¯ g is mass gas content of gas hydrate, (kg/kg); Δ M is GH mass gain, (kg); q is specific heat flux, (W/m2); α is heat transfer coefficient, (W/(m2K)); T0 is initial water temperature, (°C); ρ g is gas density, (kg/m3); ρ 0 is initial water density, (kg/m3).
Substitution from the system of Equation (9) gives the ratio ((°C∙m3)/kg)
( T g T 0 ) ( ρ 0 ρ g ) = β F · r α · m ¯ g
Using Nusselt’s criteria for heat transfer N u = α · l λ and diffusion N u = β F l D , the right-hand side of Equation (10) can be rewritten as:
β F · r α · m ¯ g = N u N u D · r λ · m ¯ g   ,
where the ratio of Nusselt’s criteria is a criterion for GH synthesis optimization
K s = N u N u ,
R is phase transition heat, (J/kg); λ is thermal conductivity, (W/(mK)).
To determine KS value, express the gas density through pressure and temperature from the thermodynamic state equation
ρ = P μ g R μ T Z ,
μ g is molar mass of gas, (kg/mol).
In a mass-transfer apparatus the processes occur under constant pressure conditions and compressibility coefficient Z slightly changes. In this case, the difference in densities from Equation (10) can be determined by the temperature difference (kg/m3)
ρ 0 ρ g = P · μ g R μ · T 0 Z P · μ g R μ · T g Z = P · μ g R μ · Z ( T g T 0 T g · T 0 )
Given the difference in gas densities, Equation (8) takes the form
T g T 0 ( T g T 0 T g · T 0 ) = K s D · P · μ g · r λ · R μ · Z · m ¯ g
From Equation (15) we obtain the optimization criterion value
K s = λ g R μ Z · m ¯ g g · T r · T g D g P μ g r g g ,
where m ¯ g g is the mass content of gas in GH, (kg/kg); Tr is liquid temperature, (K); Tg is gas temperature, (K); P is the pressure at which the synthesis process occurs, (Pa); rgg is heat of GH dissociation, (J/kg), Rµ is universal gas constant, µg, (Paxs).
The non-dimensional optimization coefficient of GH synthesis determines the optimal ratio between heat and mass transfer processes near the interfacial surface under hydrate formation, depending on the thermophysical characteristics of gas hydrate and its synthesis conditions. In other words, the coefficient determines the optimal ratio of diffusion processes and mass transfer at the phase interface.
For conditions of GH synthesis for different gases, we propose the optimal values of KS, presented in Table 2.
The physical content of the coefficient can be interpreted as follows: To maintain the maximum rate of GH formation, the intensity of heat transfer processes (heat removal from the reaction zone) near the interfacial surface will exceed the intensity of mass transfer processes by 36–40 times (e.g., for methane). In the case of lower actual KS values, the process of gas hydrate synthesis will be restricted to the low intensity of heat removal, whilst if the optimal value is exceeded the lower the intensity of mass transfer processes.
The comparison of the actual value (K’S) with the optimal value makes it possible to determine hydrate formation efficiency (E):
{ K s K s 1 E = K s K s K s K s > 1 E = K s K s
The use of calculated dependences for experimental data for GH synthesis in the diffusion mode (Figure 11) demonstrates that the optimal supercooling is a temperature difference of 2.9–3.0 °C. At higher supercooling values, the optimal ratio of heat removal and mass exchange is broken; with an increase in time, the gas flow into GH slows down as a result of GH crust formation.
Figure 12 shows graphs of the GH synthesis process intensity by the value of optimization coefficient K’S. As it is shown in the graph, the movement of values of graph functions to the right of the optimal zone I corresponds to a decrease in the rate of GH synthesis and gas content in the gas hydrate structure.
As is shown in Figure 12b, non-observance of optimal K’S values can also be at the initial moment of time, when the phase interface surface is “clean”; in this case, the hydrate crust grows slowly and has little effect on the synthesis process intensity.
Thus, compliance with optimal K’S values and renewal of the interface ensures the best intensity of hydrate formation. According to our technology (Figure 4), additional gas cooling (if necessary) is performed in thermostat 8, and thus K’S value can be adjusted. This criterion for optimization of heat and mass transfer processes in GH synthesis on the interfacial surface allows for determining the process parameters, complying with the above requirements to increase the intensity of the hydrate formation process. The proposed criterion can be applied to the GH bubbler design.

6. Conclusions

Diffusion phenomena underlying the processes of gas hydrate formation at the interface are slow, and practically all researchers use various tools to intensify these processes. In most cases, these techniques make it possible to implement a diffusion-convective mechanism for heat and mass transfer between gas and liquid. Clearly, the intensity of these processes is affected by the temperatures of contacting phases and pressure in the reaction zone. However, with the diffusion-convective mechanism of gas hydrate formation, as well as with the diffusion mechanism, the synthesis intensity decreases as a hydrate layer at the interface, generating resistance to mass gas flow and preventing intense heat removal from the reaction zone. Therefore, the formed hydrate layer will be destroyed and, thus, the phase interfacial contact will be renewed. According to our technology, this problem is solved using the hydrodynamic initiation of the synthesis process, resulting in a hydrodynamic and thermodynamic situation in the reactor; it contributes to the deformation of gas droplets and breaking of hydrate films. Hydrate removal from the phase interface also means a rather intensive heat removal from the reaction zone. The continuous destruction of the hydrate film provides a sufficiently high intensity of the GH synthesis process.
It was determined that at a certain optimal ratio of the intensity values of heat and mass transfer processes at the phase contact interface, the synthesis rate will be maximum, whilst continuous renewal of the contact interface allows for maintaining the maximum value of this parameter throughout the entire synthesis process. In this case, the optimal values of gas subcooling are recorded at 2.5–3.5 °C. To assess the conditions for intensive GH synthesis, an optimization criterion was proposed to characterize the ratio of mass and heat transfer processes at the interface. Thus, the surface renewal and compliance with optimal ratios of heat and mass transfer processes will make it possible to achieve the maximum rate of hydrate synthesis. These ratios can be adjusted using our proposed method.

Author Contributions

A.M.P.: Conceptualization, Investigation, Writing—original draft; H.K.: Conceptualization, Investigation, Writing—editing. Both authors have read and agreed to the published version of the manuscript.

Funding

Please add this research was funded by grant number 025/RID/2019/22 “Regional Initiative of Excellence” in 2019–2022.

Informed Consent Statement

Not applicable.

Data Availability Statement

Not applicable.

Conflicts of Interest

The author declares no conflict of interest.

References

  1. Koh, C.A.; Sum, A.K.; Sloan, E.D. State of the art: Natural gas hydrates as a natural resource. J. Nat. Gas Sci. Eng. 2012, 8, 132–138. [Google Scholar] [CrossRef]
  2. Boswell, R.; Hancock, S.; Yamamoto, K.; Collett, T.; Pratap, M.; Lee, S. Natural Gas Hydrates: Status of Potential as an Energy Resource. Future Energy, 3rd ed.; Improved Sustainable and Clean Options for our Planet; Elsevier: Amsterdam, The Netherlands, 2020; pp. 111–131. [Google Scholar] [CrossRef]
  3. Xu, H.; Kong, W.; Yang, F. Decomposition characteristics of natural gas hydrates in hydraulic lifting pipelines. Nat. Gas Ind. B 2019, 6, 159–167. [Google Scholar] [CrossRef]
  4. Alexei, V. Milkov Global estimates of hydrate-bound gas in marine sediments: How much is really out there? Earth-Sci. Rev. 2004, 66, 183–197. [Google Scholar]
  5. Boswell, R.; Collett, T.S. Collett Current perspectives on gas hydrate resources. Energy Environ. Sci. 2011, 4, 1045–1528. [Google Scholar] [CrossRef]
  6. Zhao, J.; Zhu, Z.; Song, Y.; Liu, W.; Zhang, Y.; Wang, D. Analysing the process of gas production for natural gas hydrate using depressurization. Appl. Energy 2015, 142, 125–134. [Google Scholar] [CrossRef]
  7. Taheri, Z.; Shabani, M.R.; Nazari, K.; Mehdizaheh, A. Natural gas transportation and storage by hydrate technology: Iran case study. J. Nat. Gas Sci. Eng. 2014, 21, 846–849. [Google Scholar] [CrossRef]
  8. Hassanpouryouzband, A.; Joonaki, E.; Farahani, M.V.; Takeya, S.; Ruppel, C.; Yang, J.; English, N.J.; Schicks, J.M.; Edlmann, K.; Mehrabian, H.; et al. Gas hydrates in sustainable chemistry. Chem. Soc. Rev. 2020, 49, 5225–5309. [Google Scholar] [CrossRef] [PubMed]
  9. Cheng, C.; Wang, F.; Tian, Y.; Wu, X.; Zheng, J.; Zhang, J.; Li, L.; Yang, P.; Zhao, J. Review and prospects of hydrate cold storage technology. Renew. Sustain. Energy Rev. 2020, 117, 109492. [Google Scholar] [CrossRef]
  10. Siažik, J.; Malcho, M. Accumulation of primary energy into natural gas hydrates. Procedia Eng. 2017, 192, 782–787. [Google Scholar] [CrossRef]
  11. Zhou, S.; Chen, W.; Li, Q.; Zhou, J.; Shi, H. Research on the solid fluidization well testing and production for shallow non-diagenetic natural gas hydrate in deep water area China Offshore. Oil Gas 2017, 29, 1–8. [Google Scholar]
  12. Bahadori, A. Chapter Liquefied Natural Gas (LNG). In Natural Gas Processing; Bahadori, A., Ed.; Gulf Professional Publishing: Boston, MA, USA, 2014; pp. 591–632. [Google Scholar]
  13. Kiran, B.S.; Sowjanya, K.; Prasad, P.S.; Yoon, J.-H. Experimental investigations on tetrahydrofuran-methanewater system: Rapid methane gas storage in hydrates. Oil Gas Sci. Technol.-Rev. D’IFP Energ. Nouv. 2019, 74, 12. [Google Scholar] [CrossRef] [Green Version]
  14. Chen, B.; Sun, H.; Li, K.; Wang, D.; Yang, M. Experimental Investigation of Natural Gas Hydrate Production Characteristics via Novel Combination Modes of Depressurization With Water Flow Erosion. Fuel 2019, 252, 295–303. [Google Scholar] [CrossRef]
  15. Zhao, J.; Lv, Q.; Li, Y.; Yang, M.; Liu, W.; Yao, L.; Wang, S.; Zhang, Y.; Song, Y. In-situ visual observation for the formation and dissociation of methane hydrates in porous media by magnetic resonance imaging. Magn. Reson. Imaging 2015, 33, 485–490. [Google Scholar] [CrossRef] [PubMed]
  16. ZareNezhad, B.; Mottahedin, M.; Varaminian, F. Experimental and Theoretical Investigations on the Enhancement of Methane Gas Hydrate Formation Rate by Using the Kinetic Additives. Pet. Sci. Technol. 2015, 33, 857–864. [Google Scholar] [CrossRef]
  17. Koh, D.Y.; Kang, H.; Lee, J.W.; Park, Y.; Kim, S.J.; Lee, J.; Lee, J.Y.; Lee, H. Energy–efficient natural gas hydrate production using gas exchange. Appl. Energy 2016, 162, 114–130. [Google Scholar] [CrossRef]
  18. Kumar, K.V.; Preuss, K.; Titirici, M.-M.; Rodríguez-Reinoso, F. Nanoporous materials for the onboard storage of natural gas. Chem. Rev. 2017, 117, 1796–1825. [Google Scholar] [CrossRef]
  19. Song, Y.M.; Wang, F.; Guo, G.; Luo, S.-J.; Guo, R.B. Energy-efficient storage of methane in the formed hydrates with metal nanoparticles-grafted carbon nan- otubes as promoter. Appl. Energy 2018, 224, 175–183. [Google Scholar] [CrossRef]
  20. Chong, Z.R.; Yang, S.H.B.; Babu, P.; Linga, P.; Li, X.S. Review of natural gas hydrates as an energy resource: Prospects and challenges. Appl. Energy 2016, 162, 1633–1652. [Google Scholar] [CrossRef]
  21. Baek, S.; Ahn, Y.H.; Zhang, J.S.; Min, J.; Lee, H.; Lee, J.W. Enhanced methane hydrate formation with cyclopentane hydrate seeds. Appl. Energy 2017, 202, 32–41. [Google Scholar] [CrossRef]
  22. Veluswamy, H.P.; Kumar, A.; Kumar, R.; Linga, P. An innovative approach to enhance methane hydrate formation kinetics with leucine for energy storage application. Appl. Energy 2017, 188, 190–199. [Google Scholar] [CrossRef]
  23. Veluswamy, H.P.; Kumar, A.; Seo, Y.; Lee, J.D.; Linga, P. A review of solidified natural gas (SNG) technology for gas storage via clathrate hydrates. Appl. Energy 2018, 216, 262–285. [Google Scholar] [CrossRef]
  24. Zhang, P.; Chen, X.; Li, S.; Wu, Q.; Xu, Z. Heat transfer and water migration rules during formation/dissociation of methane hydrate under temperature fields with gradient. Int. J. Heat Mass Transf. 2021, 169, 120929. [Google Scholar] [CrossRef]
  25. He, Y.; Sun, M.-T.; Chen, C.; Zhang, G.-D.; Chao, K.; Lin, Y.; Wang, F. Surfactan—T-based promotion to gas hydrate formation for energy storage. J. Mater. Chem. 2019, A7, 21634–21661. [Google Scholar] [CrossRef]
  26. Kumari, A.; Balomajumder, C.; Arora, A.; Dixit, G.; Gomari, S.R. Physio-Chemical and Mineralogical Characteristics of Gas Hydrate-Bearing Sediments of the Kerala-Konkan, Krishna-Godavari, and Mahanadi Basins. J. Mar. Sci. Eng. 2021, 9, 808. [Google Scholar] [CrossRef]
  27. Thoutam, P.; Gomari, S.R.; Chapoy, A.; Ahmad, F.; Islam, M. Study on CO2 Hydrate Formation Kinetics in Saline Water in the Presence of Low Concentrations of CH4. ACS Omega 2019, 4, 18210–18218. [Google Scholar] [CrossRef] [Green Version]
  28. Arora, A.; Cameotra, S.S.; Kumar, R.; Balomajumder, C.; Singh, A.K.; Santhakumari, B.; Kumar, P.; Laik, S. Biosurfactant as a promoter of methane hydrate formation: Thermodynamic and kinetic studies. Sci. Rep. 2016, 6, 20893. [Google Scholar] [CrossRef] [PubMed] [Green Version]
  29. Kumar, A.; Bhattacharjee, G.; Kulkarni, B.D.; Kumar, R. Role of surfactants in promoting gas hydrate formation. Ind. Eng. Chem. Res. 2015, 54, 12217–12232. [Google Scholar] [CrossRef]
  30. Veluswamy, H.P.; Hong, Q.W.; Linga, P. Morphology study of methane hydrate formation and dissociation in the presence of amino acid. Cryst. Growth Des. 2016, 16, 5932–5945. [Google Scholar] [CrossRef]
  31. Liu, Y.; Chen, B.; Chen, Y.; Zhang, S.; Guo, W.; Cai, Y.; Tan, B.; Wang, W. Methane storage in a hydrated form as promoted by leucines for possible application to natural gas transportation and storage. Energy Technol. 2015, 3, 815–819. [Google Scholar] [CrossRef]
  32. Veluswamy, H.P.; Lee, P.Y.; Premasinghe, K.; Linga, P. Effect of biofriendly amino acids on the kinetics of methane hydrate formation and dissociation. Ind. Eng. Chem. Res. 2017, 56, 6145–6154. [Google Scholar] [CrossRef]
  33. Mohammad-Taheri, M.; Moghaddam, A.Z.; Nazari, K.; Zanjani, N.G. Methane hydrate stability in the presence of water-soluble hydroxyalkyl cellulose. J. Nat. Gas. Chem. 2012, 21, 119–125. [Google Scholar] [CrossRef]
  34. Gnanendran, N.; Amin, R. Modelling hydrate formation kinetics of a hydrate promoter–water–natural gas system in a semi-batch spray reactor. Chem. Eng. Sci. 2004, 59, 3849–3863. [Google Scholar] [CrossRef]
  35. Sowjanya, Y.; Prasad, P.S.R. Formation kinetics & phase stability of double hydrates of C4H8O and CO2/CH4: A comparison with pure systems. J. Nat. Gas Sci. Eng. 2014, 18, 58–63. [Google Scholar]
  36. Veluswamy, H.P.; Kumar, S.; Kumar, R.; Rangsunvigit, P.; Linga, P. Enhanced clathrate hydrate formation kinetics at near ambient temperatures and moderate pressures: Application to natural gas storage. Fuel 2016, 182, 907–919. [Google Scholar] [CrossRef]
  37. Delahaye, A.; Fournaison, L.; Marinhas, S.; Chatti, I.; Petitet, J.P.; Dalmazzone, D.; Fürst, W. Effect of THF on equilibrium pressure and dissociation enthalpy of CO2 hydrates applied to secondary refrigeration. Ind. Eng. Chem. Res. 2006, 45, 391–397. [Google Scholar] [CrossRef]
  38. Sharma, D.; Sowjanya, Y.; Chari, V.D.; Prasad, P.S.R. Methane storage in mixed hydrates with tetrahydrofuran. Indian J. Chem. Technol. 2014, 21, 114–119. [Google Scholar]
  39. Chernov, A.A.; Pil’Nik, A.A.; Elistratov, D.S.; Mezentsev, I.V.; Meleshkin, A.V.; Bartashevich, M.V.; Vlasenko, M.G. New hydrate formation methods in a liquid-gas medium. Sci. Rep. 2017, 7, 40809. [Google Scholar] [CrossRef] [Green Version]
  40. Lucia, B.; Castellani, B.; Rossi, F.; Cotana, F.; Morini, E.; Nicolini, A.; Filipponi, M. Experimental investigations on scaled-up methane hydrate production with surfactant promotion: Energy considerations. J. Pet. Sci. Eng. 2014, 120, 187–193. [Google Scholar] [CrossRef]
  41. Rossi, F.; Filipponi, M.; Castellani, B. Investigation on a novel reactor for gas hydrate production. Appl. Energy 2012, 99, 167–172. [Google Scholar] [CrossRef]
  42. Thoutam, P.; Gomari, S.; Ahmad, F.; Islam, M. Comparative analysis of hydrate nucleation for methane and carbon dioxide. Molecules 2019, 24, 1055. [Google Scholar] [CrossRef] [PubMed] [Green Version]
  43. Filarsky, F.; Schmuck, C.; Schultz, H.J. Impact of Modified Silica Beads on Methane Hydrate Formation in a Fixed-Bed Reactor. Ind. Eng. Chem. Res. 2019, 58, 16687–16695. [Google Scholar] [CrossRef]
  44. Lang, X.; Fan, S.; Wang, Y. Intensification of methane and hydrogen storage in clathrate hydrate and future prospect. J. Nat. Gas Chem. 2010, 19, 203–209. [Google Scholar] [CrossRef]
  45. Murakami, T.; Kuritsuka, H.; Fujii, H.; Mori, Y.H. Forming a Structure-H Hydrate Using Water and Methylcyclohexane Jets Impinging on Each Other in a Methane Atmosphere. Energy Fuels 2009, 23, 1619–1625. [Google Scholar] [CrossRef]
  46. Anatoliy, M. Pavlenko Thermodynamic Features of the Intensive Formation of Hydrocarbon Hydrates. Energies 2020, 13, 3396. [Google Scholar] [CrossRef]
  47. Veluswamy, H.P.; Wong, A.J.H.; Babu, P.; Kumar, R.; Kulprathipanja, S.; Rangsunvigit, P.; Linga, P. Rapid methane hydrate formation to develop a cost effective large scale energy storage system. Chem. Eng. J. 2016, 290, 161–173. [Google Scholar] [CrossRef]
  48. Filarsky, F.; Wieser, J.; Schultz, H.J. Rapid Gas Hydrate Formation—Evaluation of Three Reactor Concepts and Feasibility Study. Molecules 2021, 26, 3615. [Google Scholar] [CrossRef] [PubMed]
  49. Linga, P.; Daraboina, N.; Ripmeester, J.A.; Englezos, P. Enhanced rate of gas hydrate formation in a fixed bed column filled with sand compared to a stirred vessel. Chem. Eng. Sci. 2012, 68, 617–623. [Google Scholar] [CrossRef]
  50. Qureshi, M.F.; Atilhan, M.; Altamash, T.; Aparicio, S.; Aminnaji, M.; Tohidi, B. High-pressure gas hydrate auto-clave hydraulic experiments and scale-up modeling on the effect of stirring RPM effect. J. Nat. Gas Sci. Eng. 2017, 38, 50–58. [Google Scholar] [CrossRef]
  51. Filarsky, F.; Schmuck, C.; Schultz, H.J. Development of a Surface-Active Coating for Promoted Gas Hydrate Formation. Chem. Ing. Tech. 2019, 91, 85–91. [Google Scholar] [CrossRef] [Green Version]
  52. Xu, H.; Khan, M.N.; Peters, C.J.; Sloan, E.D.; Koh, C.A. Hydrate-Based Desalination Using Cyclopentane Hy-drates at Atmospheric Pressure. J. Chem. Eng. Data 2018, 63, 1081–1087. [Google Scholar] [CrossRef]
  53. Brown, T.D.; Taylor, C.E.; Bernardo, M.P. Rapid Gas Hydrate Formation Processes: Will They Work? Energies 2010, 3, 1154–1175. Available online: https://doaj.org/article/de59e138d3bd48f392f152cd9a68b233 (accessed on 7 June 2010). [CrossRef] [Green Version]
  54. Mori, Y. On the Scale-up of Gas-Hydrate-Forming Reactors: The Case of Gas-Dispersion-Type Reactors. Energies 2015, 8, 1317–1335. [Google Scholar] [CrossRef] [Green Version]
  55. Kobayashi, T.; Imura, N.; Ohmura, R.; Mori, Y.H. Clathrate Hydrate Formation by Water Spraying in a Me-thane + Ethane + Propane Gas Mixture: Search for the Rate-Controlling Mechanism of Hydrate Formation in the Presence of Methylcyclohexane. Energy Fuels 2007, 21, 545–553. Available online: https://keio.pure.elsevier.com/en/publications (accessed on 7 March 2007). [CrossRef]
  56. Al-Otaibi, F.; Clarke, M.; Maini, B.; Bishnoi, P.R. Kinetics of structure II gas hydrate formation for propane and ethane using an in-situ particle size analyzer and a Raman spectrometer. Chem. Eng. Sci. 2011, 66, 2468–2474. [Google Scholar] [CrossRef]
  57. Al-Otaibi, F.; Clarke, M.; Maini, B.; Bishnoi, P.R. Formation Kinetics of Structure I Clathrates of Methane and Ethane Using an in Situ Particle Size Analyzer. Energy Fuels 2010, 24, 5012–5022. [Google Scholar] [CrossRef]
  58. Kumar, A.; Maini, B.; Bishnoi, P.R.; Clarke, M. Investigation of the Variation of the Surface Area of Gas Hydrates during Dissociation by Depressurization in Porous Media. Energy Fuels 2013, 27, 5757–5769. [Google Scholar] [CrossRef]
  59. Kalogerakis, N.; Jamaluddin, A.; Dholabhai, P.; Bishnoi, P. Effect of Surfactants on Hydrate Formation Kinetics. In Proceedings of the SPE International Symposium on Oilfield Chemistry, New Orleans, LA, USA, 2–5 March 1993. [Google Scholar] [CrossRef]
  60. Vlasov, V.A.; Nesterov, A.N.; Reshetnikov, A.M. Kinetics of Gas Hydrate Film Growth along the Water–Gas Interface. Russ. J. Phys. Chem. 2020, 94, 1949–1951. [Google Scholar] [CrossRef]
Figure 1. Experimental facility to study gas hydrates (GH) synthesis dynamics: (a) in stationary media (diffusion) (b) use of a mixing device: 1—working module; 2—reactor; 3—pressure control; 4—gas; 5, 6—temperature control: 7—high-speed mixer, 8—thermostat, 9—electronic parameter control unit.
Energies 14 05912 g001
Figure 2. The hydrate formation dynamics at the fixed phase interface (experimental data): (a) change in the synthesis intensity over time; (b) specific mass transfer at different temperatures (Δt).
Energies 14 05912 g002
Figure 3. Formation of a bubble flow structure using a high-speed mixer: (a) photograph of the process of formation of gas bubbles; (b) change in the intensity of GH formation during mechanical initiation relative to diffusion hydrate formation.
Energies 14 05912 g003
Figure 4. Scheme of a gas hydrate plant for continuous production of gas hydrate: 1—reactor; 2—separator; 3, 5—inspection windows; 4—jet apparatus; 6—bubbler; 7—filter; 8, 9—thermostats; 10—gas; 11—thermal chamber for hydrate drying; 12—recirculation pump; flows: I—water under pressure; II—gas; III—water-gas hydrate mixture; IV—wet hydrate for drying.
Energies 14 05912 g004
Figure 5. Scheme of gas-liquid mixture formation.
Energies 14 05912 g005
Figure 6. GH photos: (a) 15% water content, morphology 1 (M1); (b) 6% humidity, morphology 2 (M2); (c) dry hydrate, morphology 3 (M3).
Energies 14 05912 g006
Figure 7. Formed hydrate (morphology 2 (M2)).
Energies 14 05912 g007
Figure 8. Thermograms of hydrate formation at the final stage.
Energies 14 05912 g008
Figure 9. GH synthesis diagram.
Energies 14 05912 g009
Figure 10. Equilibrium curve of hydrate formation for the gas entering the reactor.
Energies 14 05912 g010
Figure 11. The efficiency of the hydrate formation process in diffusion mode (E) depending on gas supercooling (Δt) and time according to experimental study results.
Energies 14 05912 g011
Figure 12. Optimal characteristics of GH synthesis process at various levels of gas subcooling: (a) 2.9 °C; (b) 3.2 °C (Ig—mass of synthesized hydrate per unit surface).
Energies 14 05912 g012
Table 1. Thermodynamic parameters of the hydrate formation process (authors’ data).
Gas Temperature Range, °CEquilibrium Pressure, Pa (Absolute)
Methane0 < t < 22.0 P g h = 10 ( 6 + 0.006 ( 18 + t g h ) 1.5 ) , t g h = [ l o g ( P g h ) 6 0.006 ] 0.67 18
t < 0 P g h = 10 ( 6 + 0.016 ( 28.9 + t g h ) ) ,       t g h ( P ) = log ( P g h ) 6 0.016 28.9
Ethane0 < t < 14.5 P g h = 10 ( 5 + 0.056 ( 13 + t g h ) ) , t g h ( P ) = log ( P g h ) 5 0.056 13
t < 0 P g h = 10 ( 5 + 0.018 ( 40.1 + t g h ) ) , t g h ( P ) = log ( P g h ) 5 0.018 40.1
Propane0 < t < 5.5 P g h = 10 ( 5 + 0.093 ( 2.55 + t g h ) ) , t g h ( P ) = log ( P g h ) 5 0.093 2.55
Isobutane0 < t < 2.5 P g h = 10 ( 5 + 0.083 ( 0.35 + t g h ) ) , t g h ( P ) = log ( P g h ) 5 0.083 0.35
where tgh is synthesis temperature of gas hydrates, °C; Pgh is absolute equilibrium pressure on hydrate formation line, Pa.
Table 2. The optimization coefficient value for different gases.
GasKS
Methane36–40
Ethane55–57
Propane115–124
Isobutane173–186
Publisher’s Note: MDPI stays neutral with regard to jurisdictional claims in published maps and institutional affiliations.

