1. Introduction
With 60 percent of the world’s population expected to live in cities by 2030, and pressure on national and regional power grids expected to increase, a growing number of towns are starting the localized energy production for new developments such as micro-grids. Several regional and national power grids are now partially powered by renewable energy.
Renewable energy sources, especially wind and sun, are important ecological alternatives to fossil fuels and nuclear powers. They are inexhaustible, non-polluting and very suitable for decentralized production. Indeed, wind and photovoltaic systems have been considerably developed and their price has remarkably been reduced in recent years. For this reason, they have been intensively studied by the research community. In fact, the renewable energies produced, for instance, by wind turbine and photovoltaic panels, have been used to reduce the consumption of fuel, and the emissions of greenhouse gas have been decreased, as stated in [
1]. The intensive research and development in this field has led to a huge growth in renewable energy sources’ installations whose cost has been minimized [
2]. Despite their importance, these sources are intermittent and stochastic. A candidate solution to this problem is to use an energy storage system to store excess energy during generation hours and re-dispatch it later when necessary [
3,
4]. Although renewable energy sources (such as sun and wind) play important roles in micro-grids, their impact is unpredictable. Thus, it is important to introduce a planning that allows the appropriate operation of these sources and facilitates their optimal management while taking into account various practical objectives.
Economic Activity Zone (EAZ) has been frequently used, in the last decade in order to reduce the energy consumption and to minimize the impacts of toxic gas emission on our planet by taking into account the environmental constraints and economic aspects [
5,
6]. The EAZs are reception structures equipped with a complete infrastructure and adapted to the specific needs of the industrial production companies.
In this context, various studies have focused on energy optimization in micro-grids. In [
7,
8], researchers focus on two objective functions: energy cost and the deficiency of power supply probability. They have concentrated on the optimal configuration of an autonomous hybrid micro-grid. In order to optimize a micro-grid, in [
9,
10], the authors aim essentially at minimizing an objective function that considers the investment, operation, repair and maintenance, as well as the environmental costs of a micro-grid. An environmental-economic approach in micro-grids using multi-objective decision to minimize the costs and gas emissions is proposed by [
11].
In [
12], the authors have defined two objective functions in order to reduce the total operating cost and the gas emissions considering the reliability of the micro-grid as a constraint. Certain criteria have been applied in reference [
13] based on GHG emissions, embodied energy, loss of power probability and life cycle cost of a hybrid PV-wind energy source system with battery storage. Other studies have concentrated on the economic cost for micro-grid optimization [
14,
15]. They study the optimal sizing of a hybrid multi-source system based on renewable energy in order to minimize the embodied energy (environmental criterion), the GHG emissions (environmental criterion) and the life cycle cost (economic criterion) under different values of the loss of power supply probability (technical criterion) [
16,
17]. The objective of the optimization study is to size both the area of the photovoltaic panels (A
PV) and that of the wind turbines (A
WT) together with the capacity of the storage system (C
n) [
18].
The main contributions of this paper are organized as the following:
A genetic algorithm is established and programmed into MATLAB to solve the optimization problem.
The objective functions proposed in this article, in order to determine the best optimal size of the components of the micro-grid, are novel compared with the conventional objective functions, leading to optimizing four objective functions simultaneously.
A comparative analysis is made, showing the cons and pros of each LPSP value in order to allow the owner of the plant to choose the most suitable PV/WT/Bat configuration.
The case study has been applied on the Coala plant (economic activity zone), situated in Sidi Bouzid city, located in the middle of Tunisia (latitude 35°02′ N and longitude 9°30′ E) and on a built floor area of 2500 m2 and a total land area of 9500 m2.
The remainder of this paper is structured as follows:
Section 2 describes the case study’s architecture.
Section 3 presents the objective functions in terms of GHG emissions, EE, LPSP and LCC. The methodology of multi-objective optimization and optimal processing are also depicted. The detailed simulation results and analysis are shown in
Section 4.
Section 5 is a brief conclusion.
2. System Arrangement
The studied system is an economical solution for the Coala factory. Many research projects have been carried out on this subject, such as [
19,
20]. The configuration of the proposed PV/WT/battery micro-grid is as given in
Figure 1. The control of the studied configuration is not difficult because the load is only provided by two renewable energy sources (WT and PV) and has only one fallback power source (battery).
The micro-grid is composed of photovoltaic panels (PV),wind turbines (WT) and battery bank. The power between the multi-source system and the load is adapted through a DC/AC converter, while DC/DC converters are employed between the different parts of the system and the DC bus. These converters are unidirectional for the power sources and bidirectional for the battery storage.
The operating block diagram of PV/wind/battery system is given in
Figure 2. When the difference between the system’s output and the load are sufficient to supply the load, the excess is used to recharge the battery [
21]. When the output of power is unavailable or insufficient and when the net load is positive, the battery bank discharges charged energy to meet the load.
2.1. Wind Turbine Model
The power produced by wind turbine (P
WT) was obtained by applying the following Equation [
22,
23]
where
is the density of air (kg/m
3), V corresponds to the wind speed (m/s), A
WT is rotor area (m
2), Cp is the turbine efficiency and
represents the generator efficiency.
2.2. Photovoltaic Model
The produced PV power system (P
pv) was provided by multiplying the product of total efficiency, the panel’s area A
PV (m
2) and the solar irradiance I
r (W/m
2):
The efficiency
was determined under standard test conditions.
where
: the maximum point power efficiency under standard conditions test.
: the efficiency of generator coefficient temperature, balancing between 0.004 and 0.006 °C.
: the temperature of operating cell under standard operating conditions. The cell temperature Tc is expressed in function of the ambient temperature Ta (°C) and the irradiation I
r:
2.3. Battery Storage Energy Modeling
The SOC defining charging and discharging state of the battery is given in Equations (5) and (6). It depends on the earlier charging/discharging situation by sampling step Δt [
24,
25].
In charging state, the SOC of the battery is:
In discharging state, the SOC of the battery is
where
and
correspond,
respectively, to AC/DC, DC/AC and DC/DC converter efficiencies.
and
are the efficient of the battery during charging and discharging phases. U
bus represents is the voltage of DC bus, P
LOAD designates the consumed power and Δt denotes the step simulation time (Δt = half an hour).
3. Strategy for Energy Management
The micro-grid’s power management strategy has a direct effect on the system’s operational behaviour. Nevertheless, in the isolated mode, the power generated by renewable sources must meet the load demand in order to operate safely and reliably. Furthermore, excess power generation from renewable resources necessitates the charging of the battery. In this paper, the power strategy is summarized into the following scenarios:
Scenario 1: Renewable energy sources can provide enough energy to meet the load demand, and the excess energy is used to charge the battery.
Scenario 2: Renewable energy sources are unable to provide the system’s required load. The shortage in power will be covered from discharging the battery.
4. Problem Formulation
4.1. Objective Functions
The reduction of the operating costs and the hybrid micro-grid capital for a total life period of twenty years is the major goal of this optimization problem. Genetic algorithm (GA) was applied, in the performed experiments, to predict the optimal configuration of the proposed system [
26,
27].
4.1.1. Embodied Energy (EE)
The EE is the quantity of non-renewable energy consumed during the life cycle of different elements of the micro-grid: transport, manufacturing, extraction and production. EE is expressed in unit of weight or area. The embodied energy is expressed by the equations blow for the purpose of getting the model of the total embodied energy systems [
28].
Equation (7) represents the PV embodied energy (EE
PV):
Equation (8) represents the wind turbine embodied energy (EE
WT):
Equation (9) represents the batteries’ embodied energy (EE
Bat) which depends on nominal capacity:
Total EE of the hybrid micro-grid system is given by Equation (10):
The first objective function is defined by Equation (11):
4.1.2. GHG Emissions Gas
The principal elements of GHG emissions are fluorinated gases, nitrous oxide (N
2O), carbon dioxide (CO
2) and methane (CH
4). The unit of GHG emissions is generally carbon dioxide (CO
2), which is equivalent to (CO
2eq). Equation (12) expresses the total GHG emissions model of a hybrid micro-grid system:
where,
is the GHG emission model of PV expressed as a function of PV surface area (A
PV):
GHG
WT refers to the GHG emission model of wind turbine system expressed as a function of wind turbine swept area
:
represents the GHG emission model of batteries expressed as a function of the nominal capacity
:
The second objective function was used, in our experiments, to minimize the GHG emission:
5. Life Cycle Cost (LCC)
The hybrid micro-grid LCC is given in euro (€). LCC of the wind turbine system is obtained by summing the cost of tower and turbine, that of the converters (replaced every 10 years) and that of Balance of System (BOS) (installation cost, protections, cables and connectors). The LCC PV system includes the price of PV modules, BOS, converters and installation. The LCC model of the hybrid PV-wind system is obtained by Equation (17):
where,
LCCPVis the economic model of PV system expressed as a function of PV surface area
:
represents the economic model of wind turbine system expressed as a function of wind turbine swept area (AWT):
denotes the economic model of batteries expressed as a function of the nominal capacity (
):
The goal of the third objective function is to find the minimum of the LCC:
Loss of Power Supply Probability (LPSP)
The reliability of the micro-grid system is definite in terms of Loss of Power Supply Probability (LPSP) defined by Equation (22).
with
6. Constraints
The following constraints should be satisfied:
Reliability:
where LPSPset is fixed by the user.
SOC limits:
The SOC limits are determined by:
where
and
are the maximum and minimum tolerable states of battery.
Feasibility:
where C
n_max, C
n_min, A
PV_max, A
PV_min, A
WT_max, A
WT_min are upper and lower decision variables’ interval defined by the consumer.
7. Dynamic Simulator Description
Various methods can be used to resolve a multi-objective problem, such as sizing and optimization of multiple renewable energy sources. Nevertheless, the use of genetic algorithm is contemplated as a reasonable solution to directly reach some inequality constraints and classify the optimum solution [
29,
30]. As a consequence of sizing optimization research study using genetic algorithm (GA), a techno-economic analysis is considered, as seen in
Figure 3. The GA is a detailed optimization technique for solving optimization problems, which is inspired by natural selection.
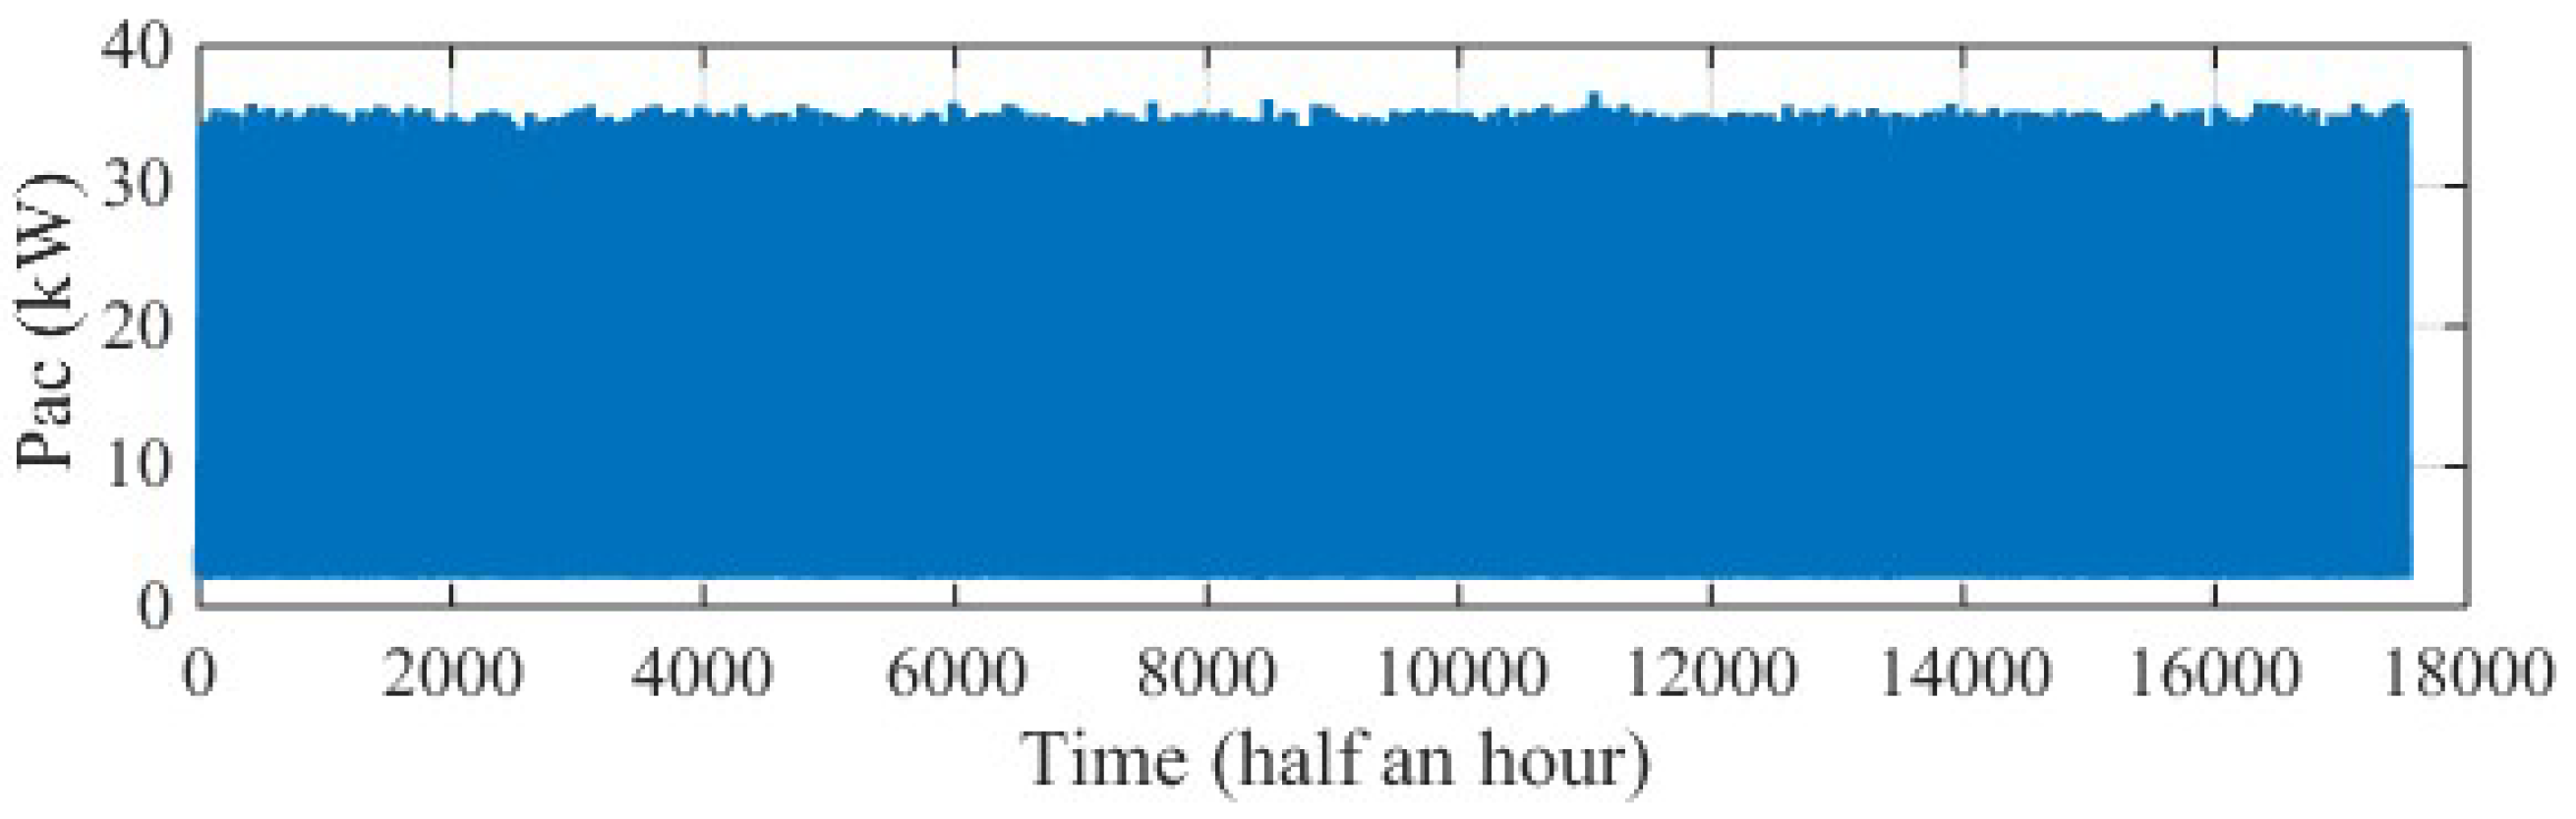
We developed a Matlab/Simulink dynamic simulator of the proposed micro-grid. This simulator is based on the energy aspect, wind speed, solar irradiance and ambient temperature, and AC and DC load. Because the proposed PV/wind/battery system is hard to implement and the optimal sizing is difficult as well, on 29 September 2018, the AC load was obtained from Coala plant for 24 h in half-hour increments. The amount of energy consumed by this company was around 378 kWh during this day. The AC power of alternative load (P
AC) is presented in
Figure 4, and its estimation for one year is shown in
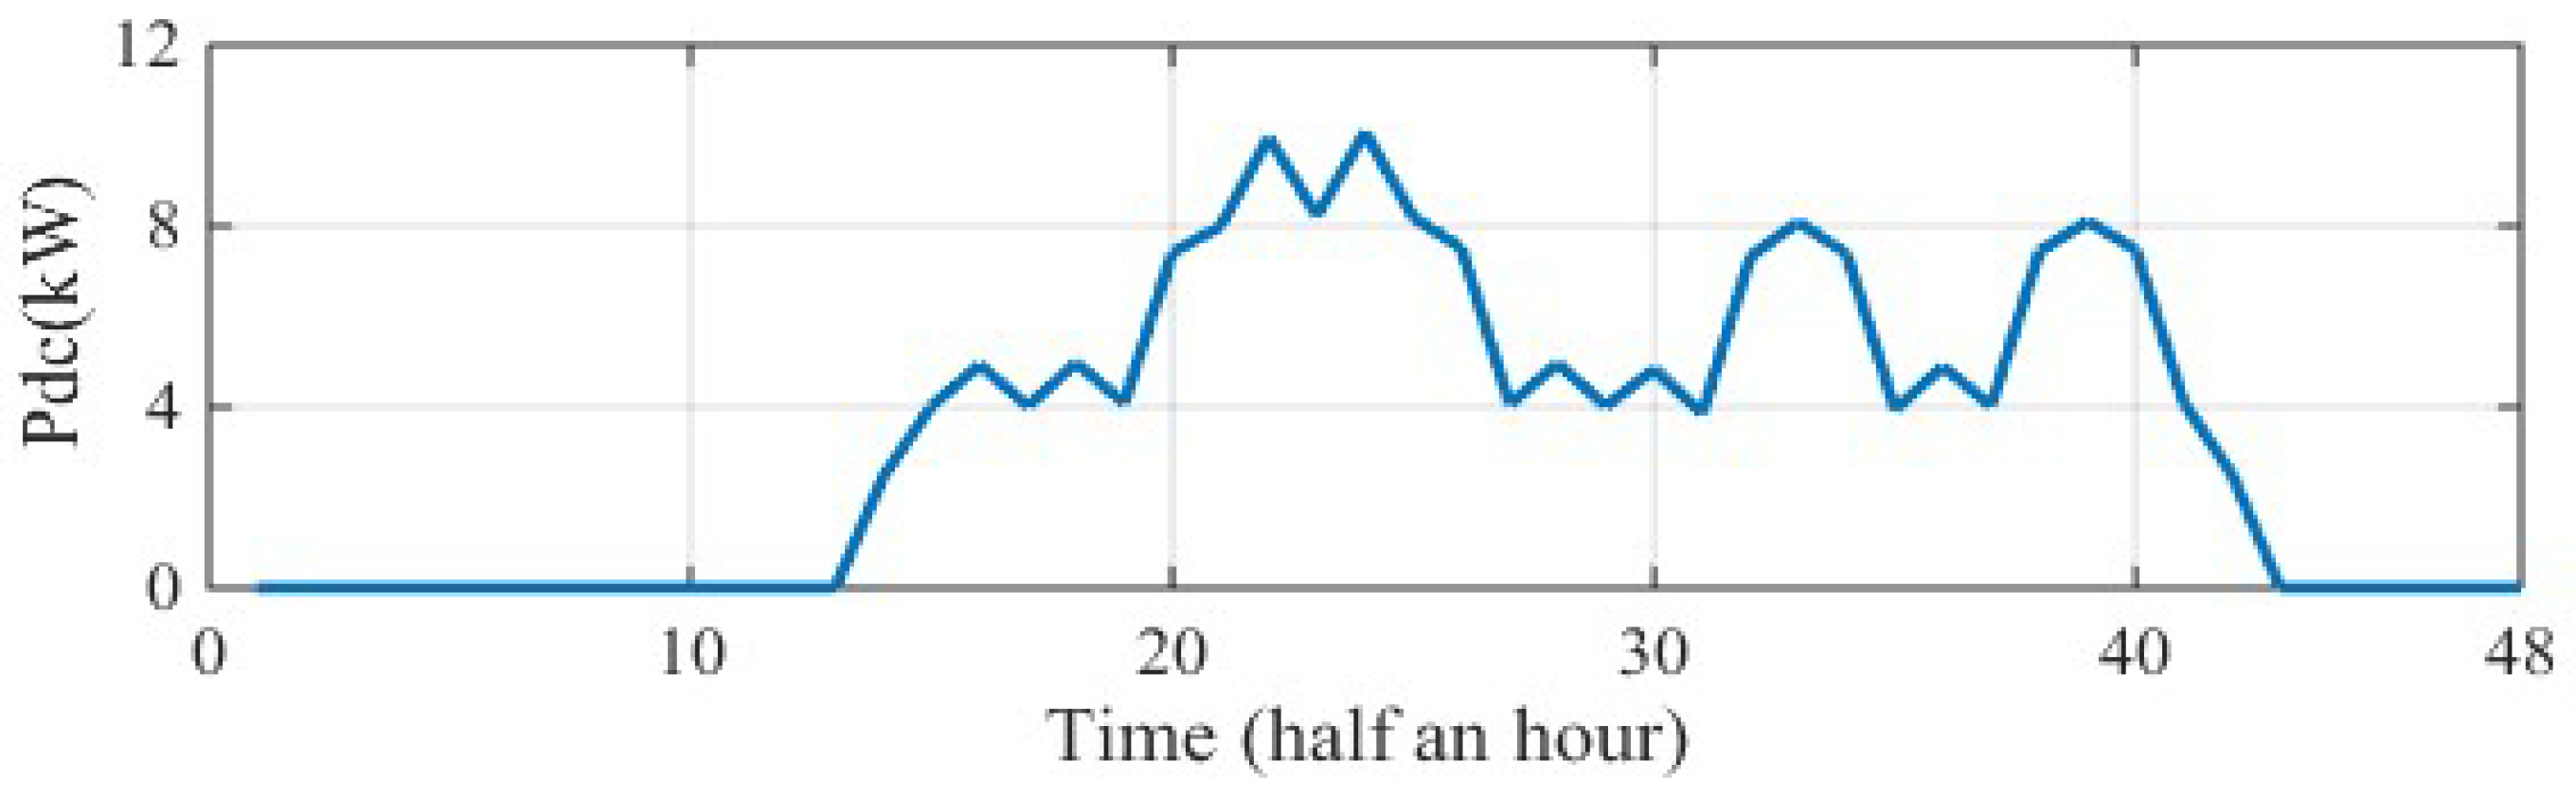
Figure 5. However, the DC load (P
DC) is the topic of a preliminary study, with the goal of deploying it in the plant, a charging station for electric vehicles of 4 kW to be used for one day (
Figure 6) and estimated for one year (
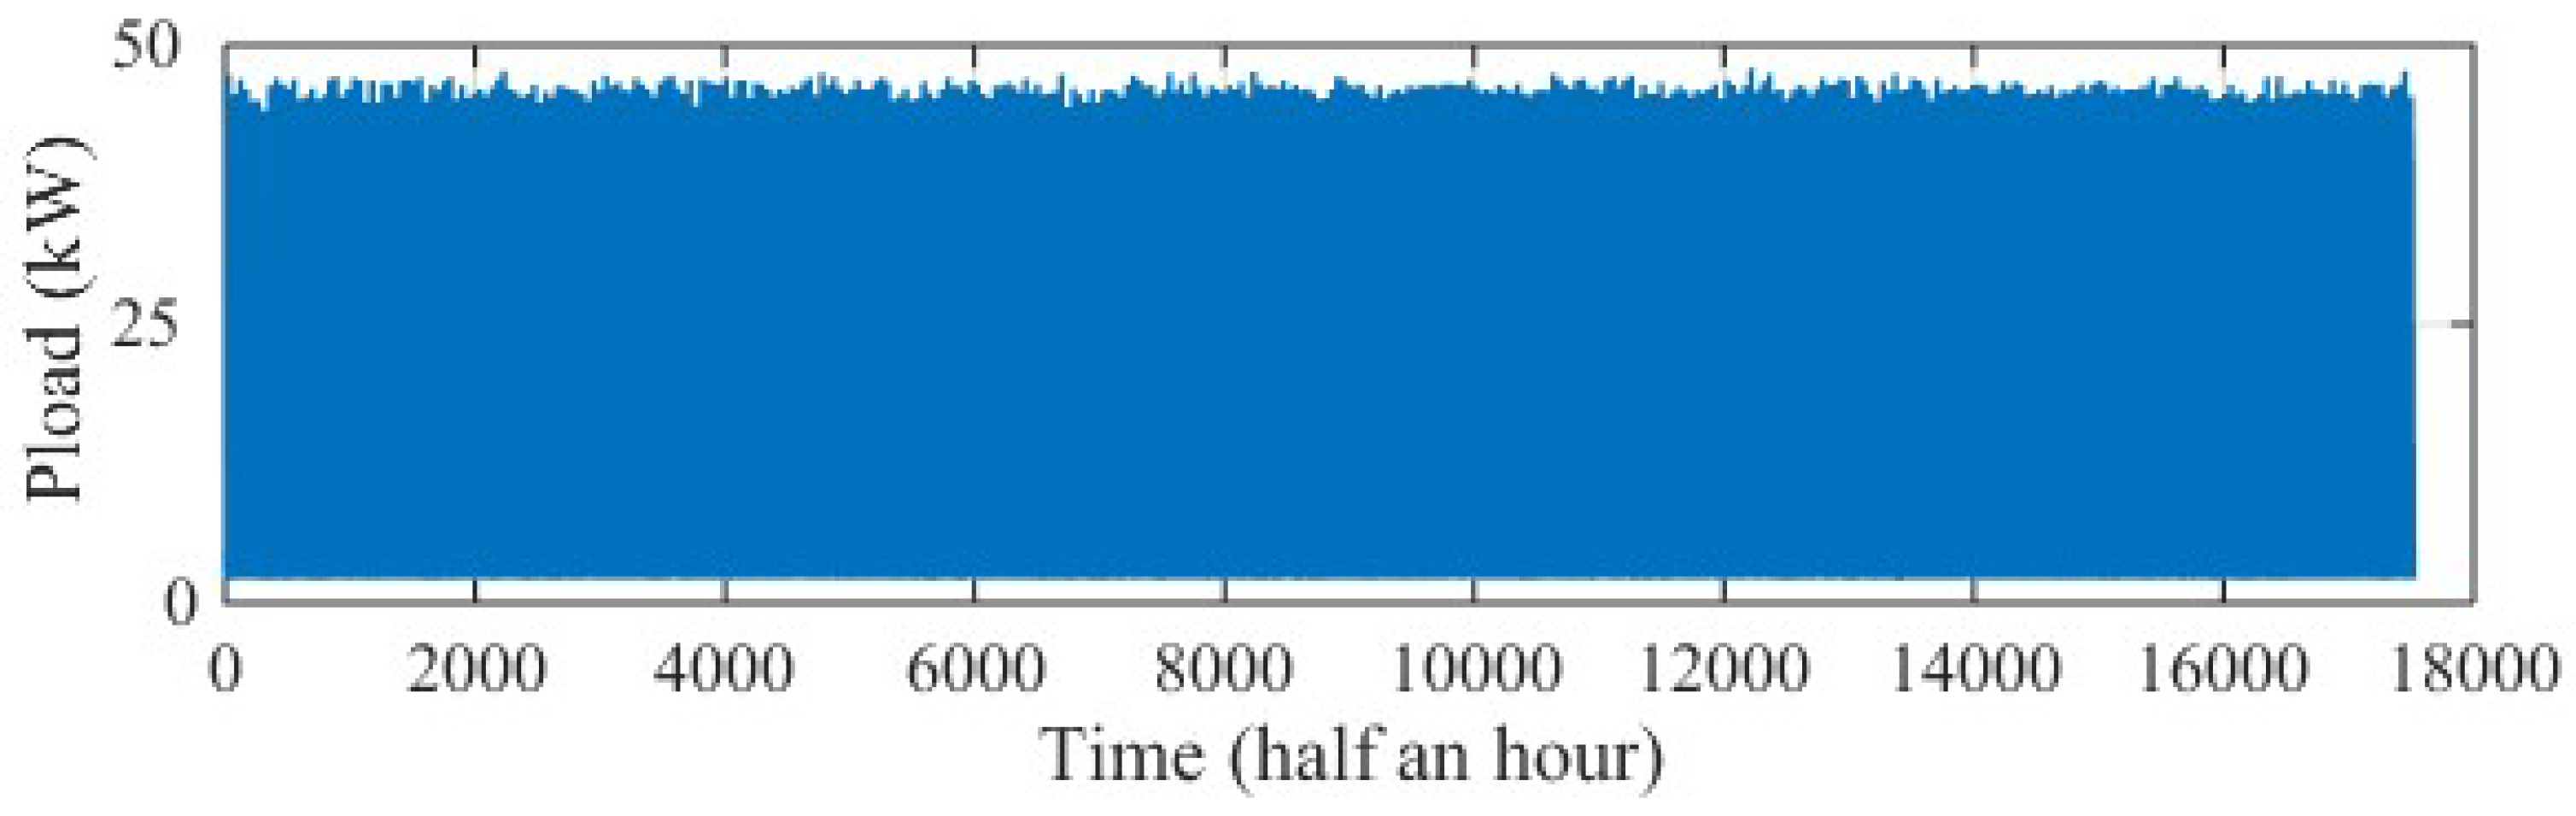
Figure 7). The power load (P
LOAD), which is the sum of P
DC and P
AC, is presented in
Figure 8.
For climatological information of the studied EAZ, the average half-hourly wind speed, irradiation and temperature profiles are illustrated in
Figure 9. In fact, the hybrid simulator, shown in
Figure 10, contains all components of hybrid micro-grid system: storage system, battery energy management, PV/wind renewable generators and objective functions (GHG, LCC, EE and LPSP). According to meteorological data (irradiation, wind speed and temperature), the dynamic simulator, represented in
Figure 10, was utilized to compute the state of the system and the system indicators during a year, with a sampling step.
8. Optimization Results and Discussion
For the optimization process, the genetic algorithm is used to investigate the optimal design of the multi-source renewable energy systems [
31]. Genetic algorithms (GA) are well applied to solve this type of problem. NSGA-II is generally adapted for optimization and multi-objective cases. Finally, the size of the elements constituting the micro-grid (surfaces of PV/wind turbine and capacity of battery) are determined. The intervals of the decision variables (three inputs) are summarized in the
Table 1. The range of decision variables is set by a parametric sensitivity algorithm applied to vary the design variables and to give the range where there are optimal points in order to avoid a huge database. The total sampling points of simulation are 1720 points for one year (one sample per thirty minutes).
The Pareto illustrated in
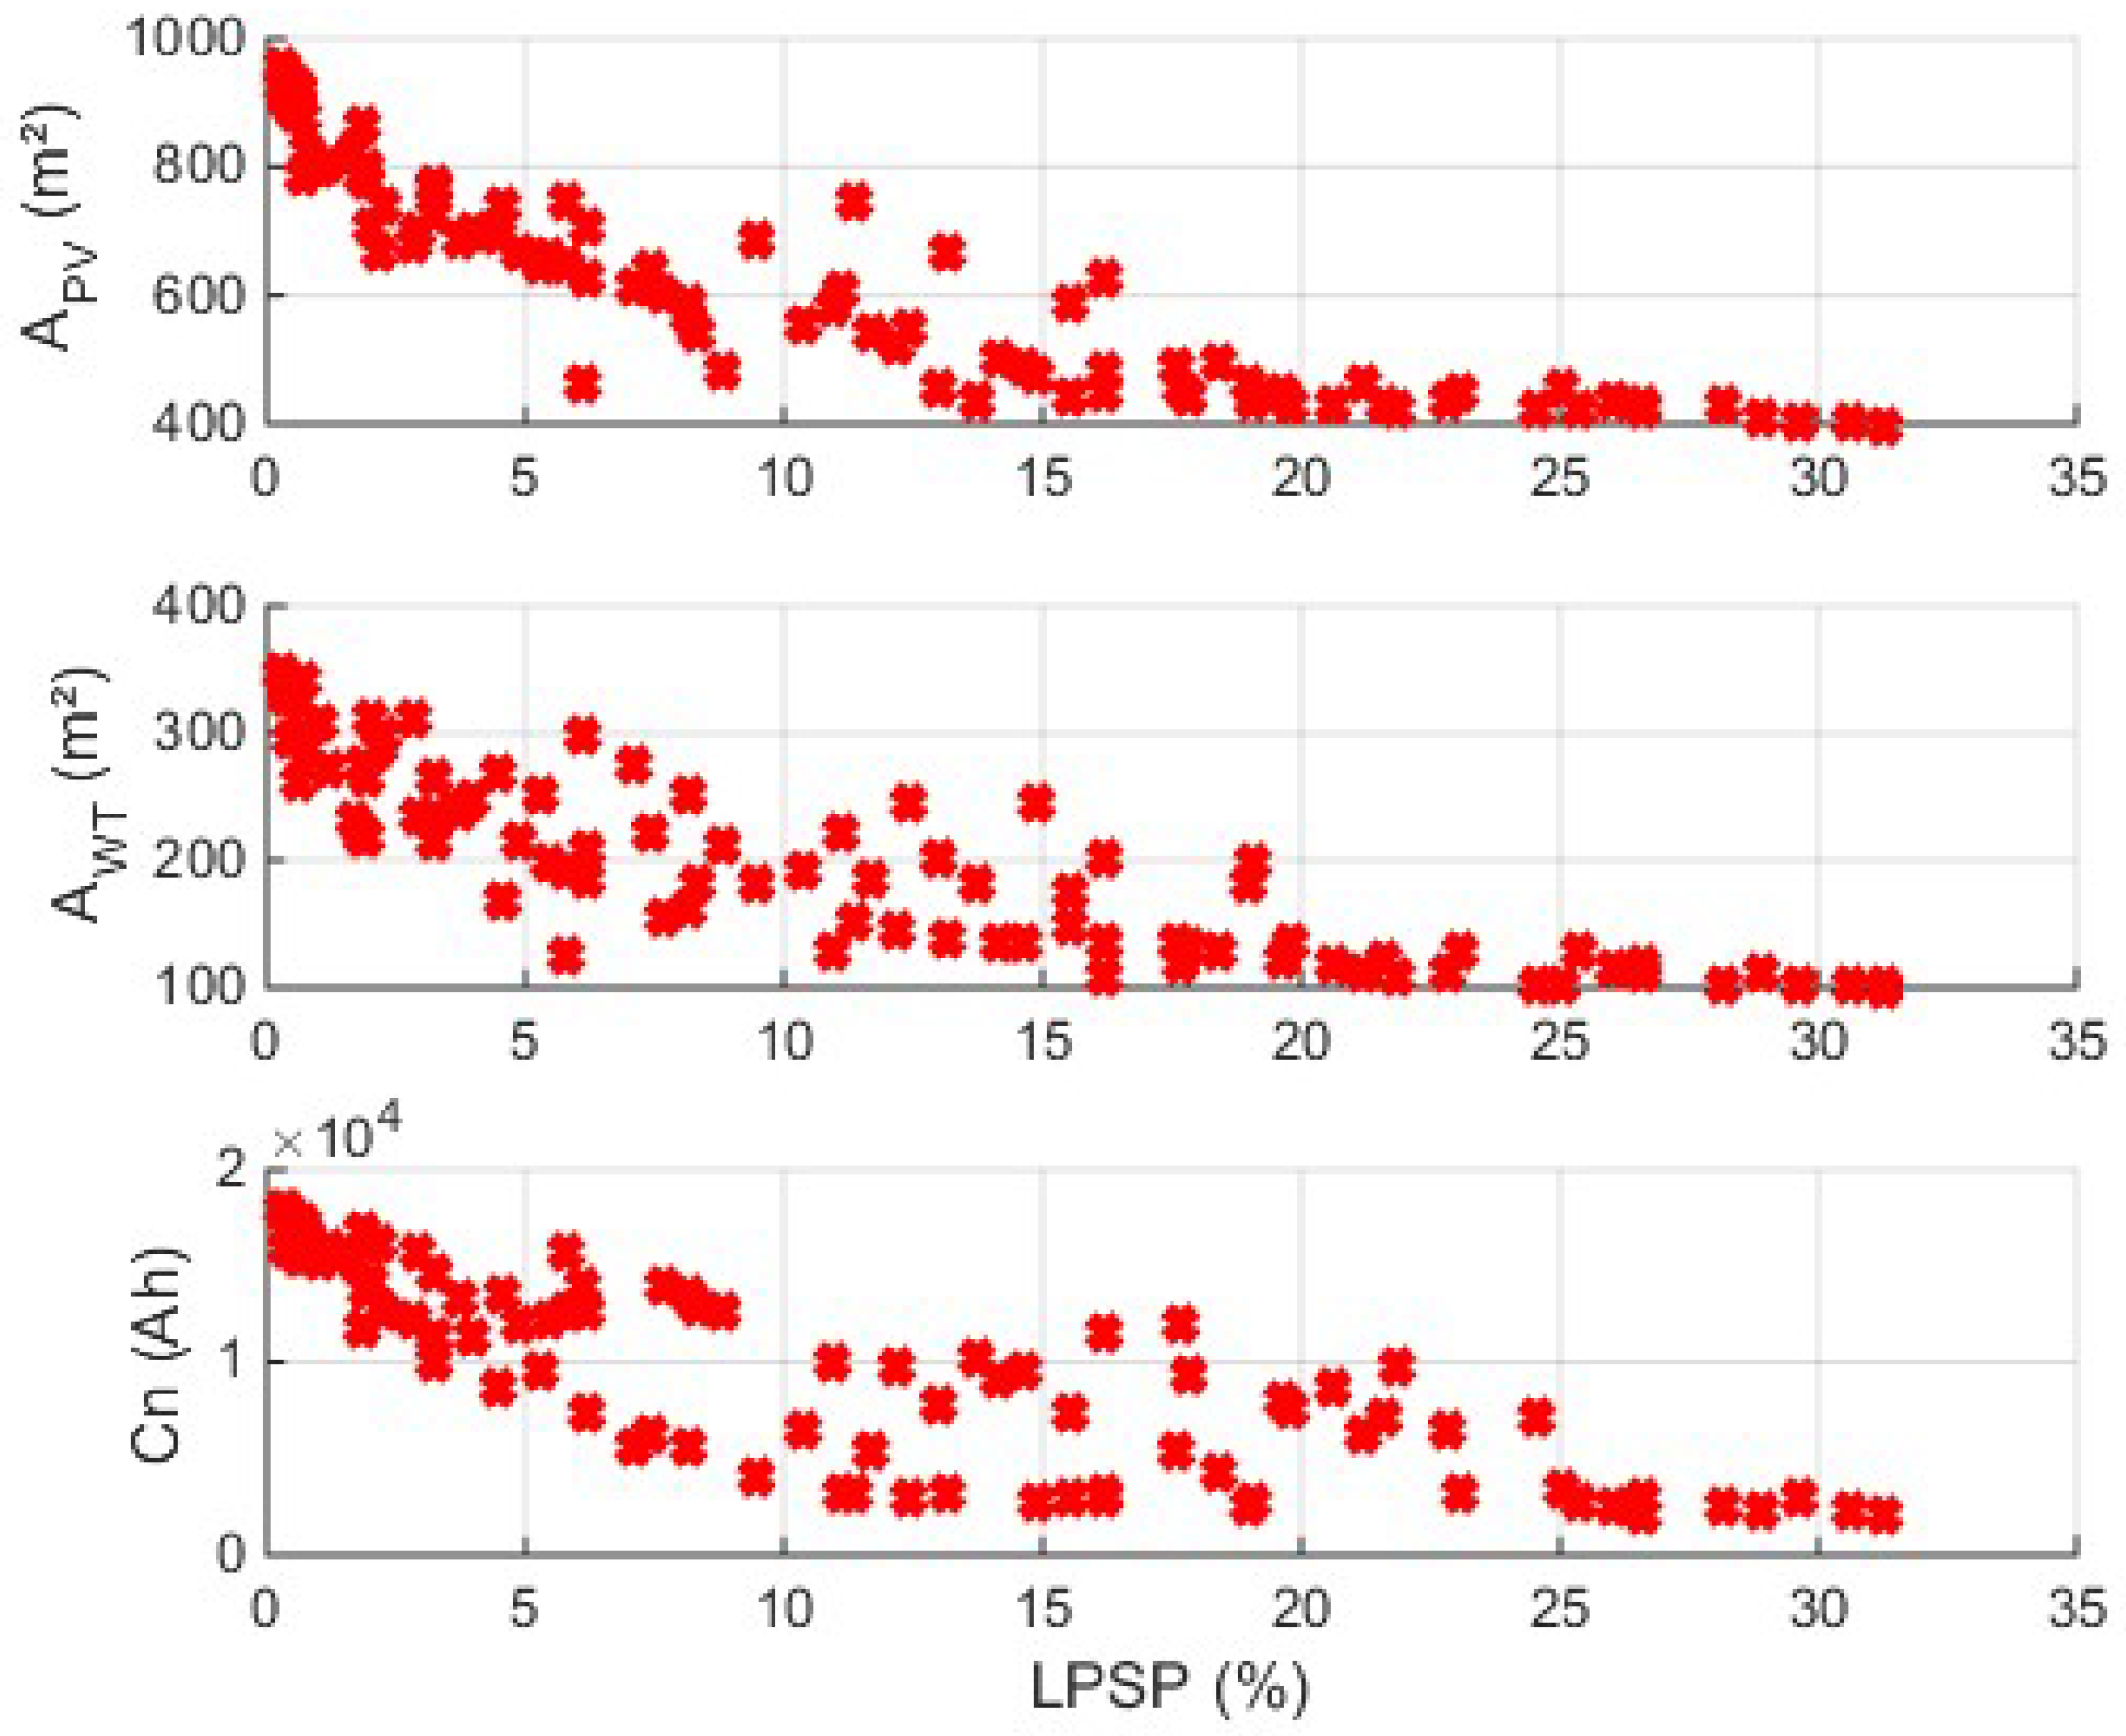
Figure 11 shows the evolution of three objective functions: EE (MJ), LCC (€) and LPSP (%). The decrease in LPSP function leads to an increase in both EE and LCC functions and vice versa. The numerical values, corresponding to the LPSP = 0%, 5% and 10%, represent the evolution of these three functions. The development of GHG emission is of the same order as EE (environmental impacts). The evolution of the decision variables according to the LPSP is presented in
Figure 12. The values provided in
Table 2 and taken from
Figure 11 represent the optimal parameters of each micro-grid component (A
WT, C
n and A
PV).
The evolution of the EE (Embodied Energy: the energy required for the manufacture of photovoltaic panels, wind turbines and batteries) as a function of the inputs A
PV, A
WT and C
n is, respectively, shown in
Figure 13. It can be observed that the increase in EE is accompanied by a rise in the A
PV and A
WT areas and C
n capacity. These variations are logical because if these areas increase, their price increase too. Moreover, the evolution of the decision variables according to the LCC is presented in
Figure 14. In this case, here, the micro-grid user or designer has to select the best system configuration, based on specific criteria (GHG, EE, LPSP and LCC), in order to minimize the annual costs of the employed systems or to reduce the impacts of choosing the decision variables on the environment.
In order to visualize a solution with multiple characteristics, the polar graphic is plotted for three values of LPSP, as shown in
Figure 15. Each objective function GHG, LCC, EE, as well as A
PV (m
2), A
WT (m
2) and C
n (Ah), corresponds to an axe. Note that the values of the two objective functions (EE and LCC) are divided by 10
4 while the GHG function was divided by 10
3.
The sizing of the proposed micro-grid was developed for three values of LPSP: 0%, 5% and 10%. The first value indicates that the PV/wind sources are able to provide the demand load during all days of the year. However, the other values of LPSP (5% and 10%) are, respectively, equivalent to 18.25 and 36.5 days per year of non-satisfaction of the load.
Table 2 shows, in detail, the EE, LCC and GHG emissions and presents the component optimal criterion (C
n, A
PV and A
WT). For 0% of LPSP, the optimal configuration of PV/wind/battery system is composed of average P
PV = 21 kW and P
WT = 28 kW. The total embodied energy EE is 4,928,000 MJ, GHG emissions are equal to 215,600 KgCO2eq and LCC cost is 1,231,000 Є. For the two other LPSP values (5% and 10%), the sensitivity criteria will decrease by 30% and 15% for PV area; by 38% and 12% for the wind area; and by 44% and 33% for the battery capacity. In addition, the three objective functions (EE, GHG and LCC) are also reduced with the increase in LPSP. Respectively, these decreases are 26% and 29% for the EE; 25% and 25% for the GHG emissions; and 16% and 18% for the LCC costs.
9. Implements Results
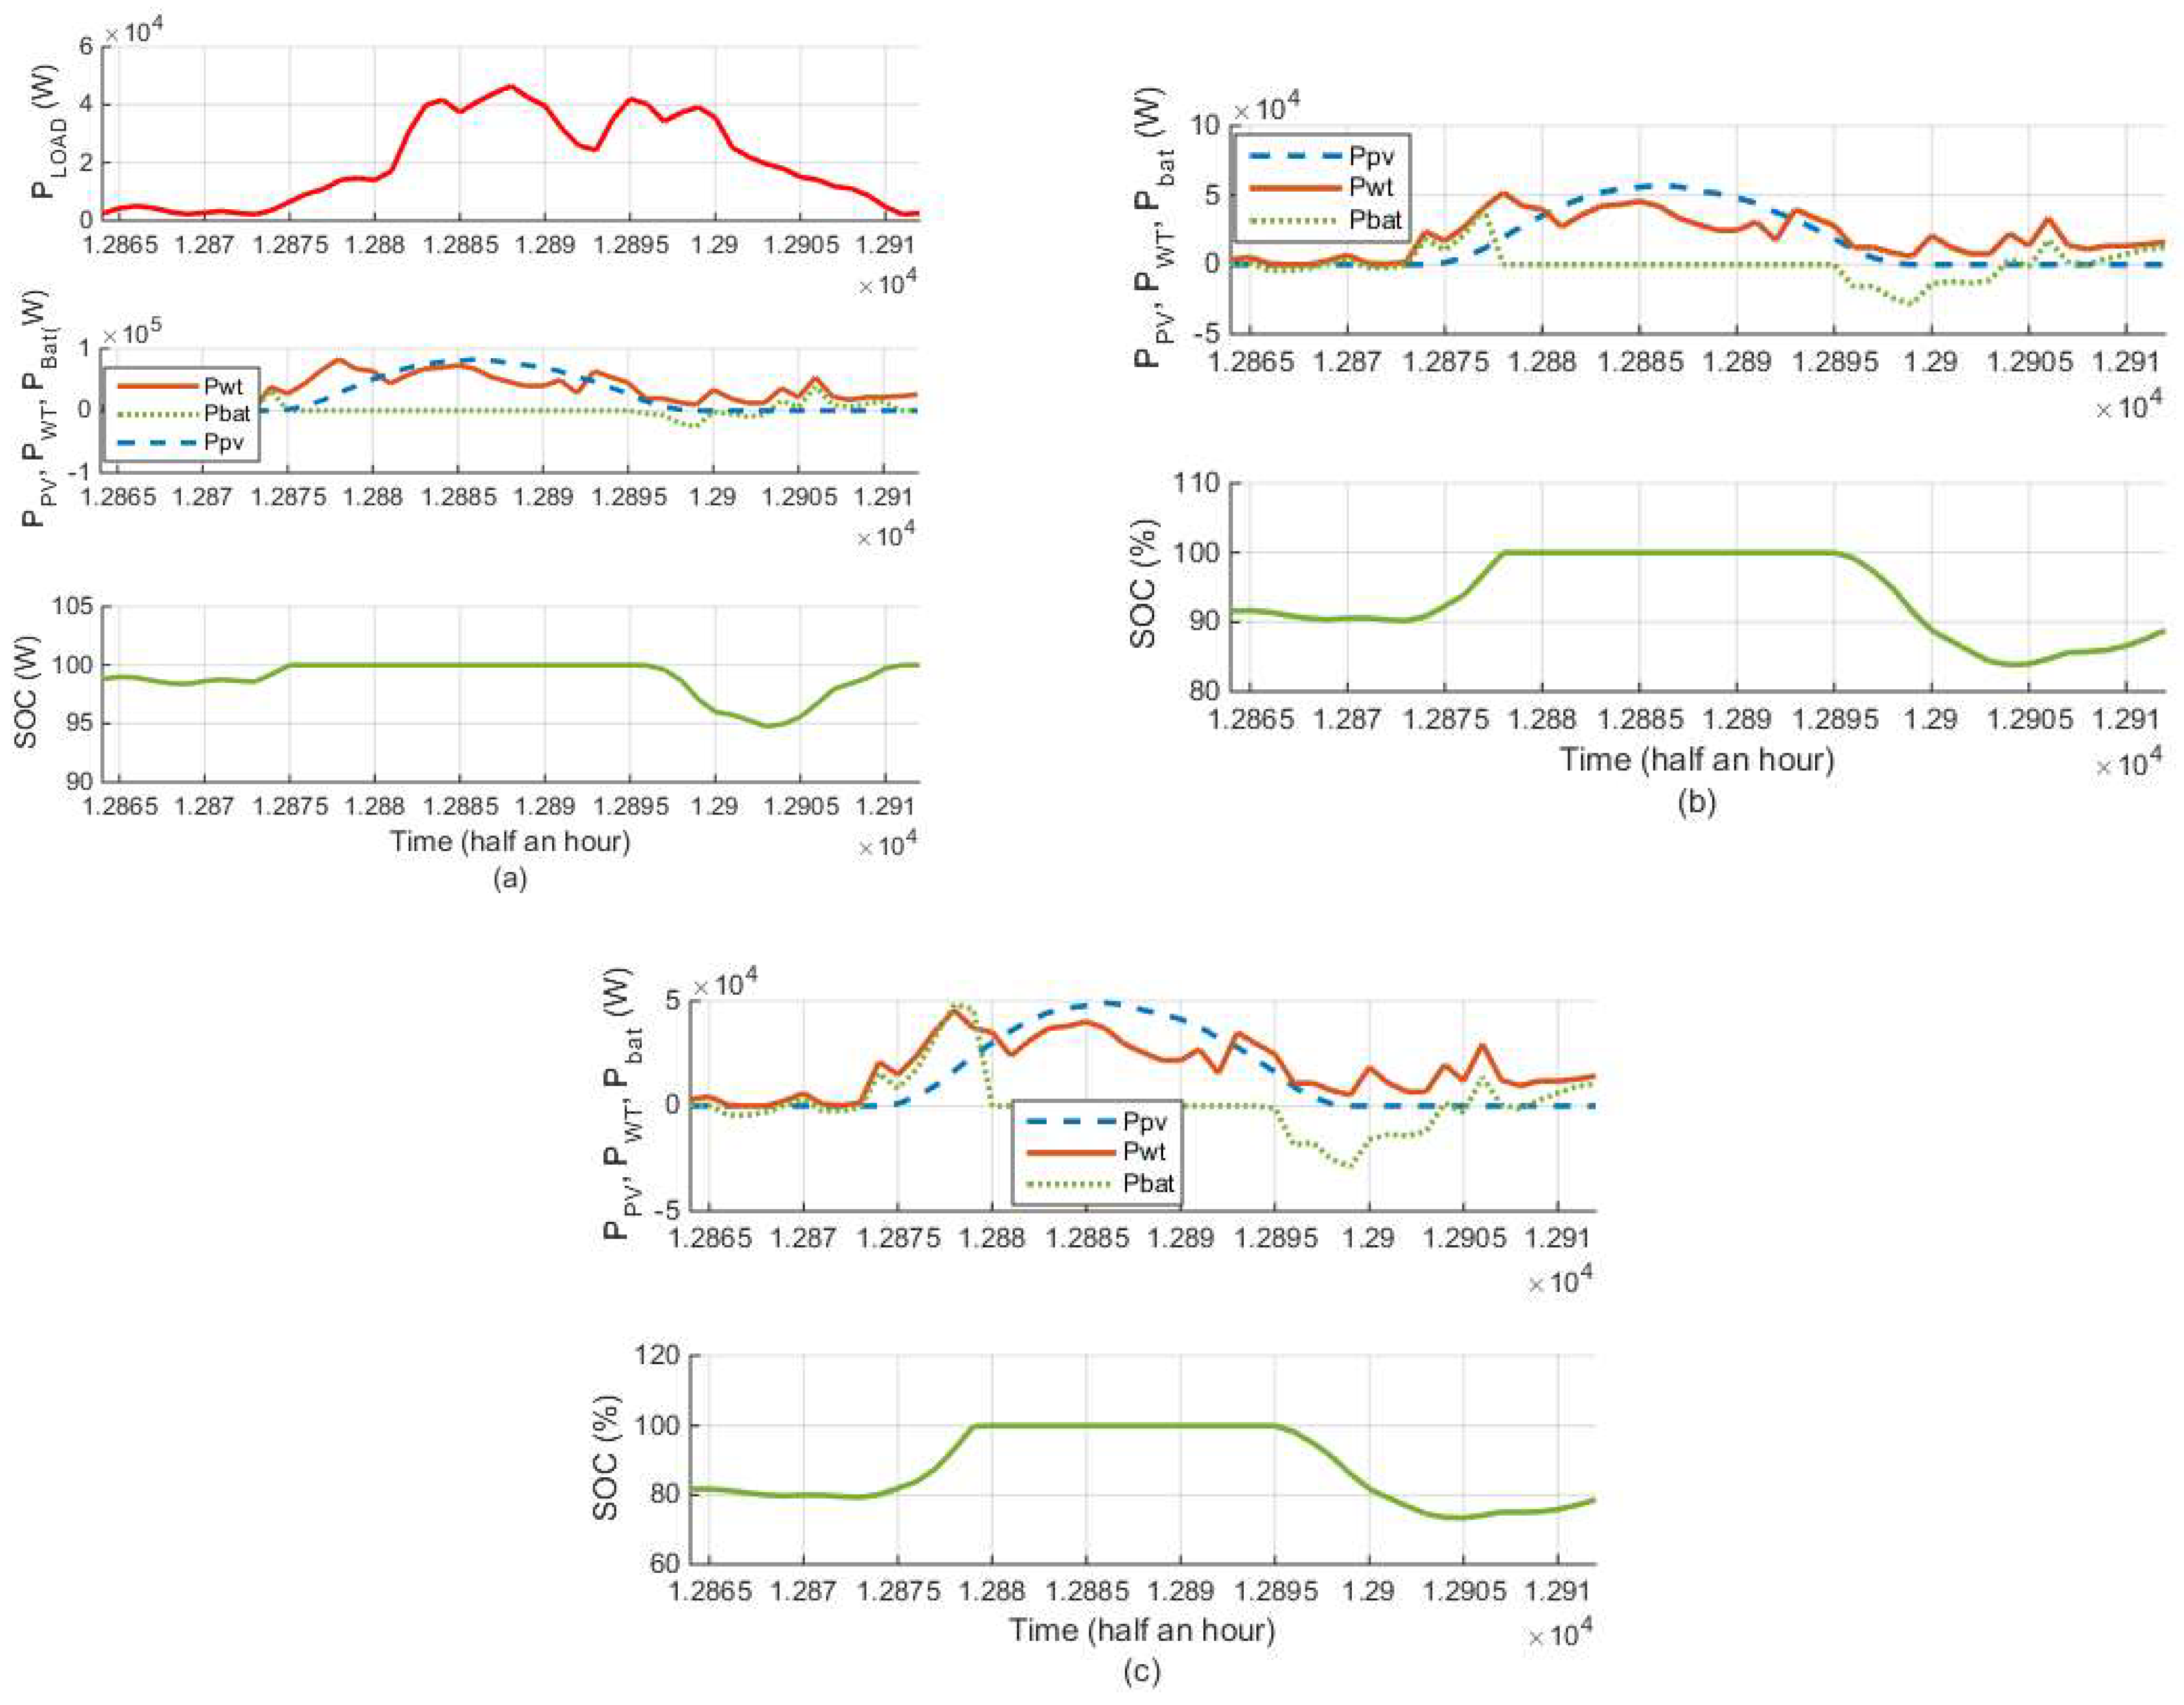
In this section, an investigation study is developed on the dynamic simulator performance with the optimal sizing parameters. The total number of sampling points of simulation is 1720 for a 30-min time interval. In fact,
Figure 16a–c reveals the half hourly variation of the generated power for the components of the proposed hybrid system at the optimum values based on the three following values of LPSP 0%, 5% and 10%, respectively. In these figures, the presented results are the power generated from the renewable sources of energy: wind turbine (P
WT) and PV source (Ppv) and the SOC of the battery. Due to the variability of the wind speed and the irradiation in the region of Sidi Bouzid, the maximum powers generated by renewable sources are higher, compared with the average power, as demonstrated in
Table 3; see
Figure 16a–c for different LPSP values. The storage system operates with different degrees of generation to satisfy the demand for energy of the load during the hours of insufficient energy produced by the PV and wind turbine sources and low SOC for the battery system. During sunshine hours, renewable sources produce enough energy to meet the load demand, and the battery is charged. However, during the night, and when the sun is hidden and the wind speed is low, the battery operates to satisfy the load demand.
Figure 17a represents the state of charge when the LPSP is fixed to 0%. This figure proves that the hybrid system is able to satisfy the Coala plant during all days of the year. However, the use of battery is necessary for the SOC 5% and LPSP 10% values when renewable sources cannot satisfy the consumer’s demand. During this simulation, the state of charge is managed between SOCmin = 30% and SOCmax = 100%. The satisfaction of consumer increased when SOC = SOCmin and (P
PV + P
WT) < P
LOAD, but an excess of production is evaluated when the SOC reaches SOCmax and (P
PV + P
WT) > P
LOAD.
To further analyze the influence of optimal parameters on micro-grids through the dynamic simulator proposed in this paper, the results of daily simulation, taking into account optimal operating conditions, are illustrated in
Figure 17a–c. These figures show the day simulation results obtained on 29 September 2018 (from 12,864 to 12,912). It is noticed, from
Figure 17a, that the daily load curve shows two peaks; the first is around noon and the second is in the evening. It is also clear that PV and wind generators can meet load demand without the storage element.
The second peak is observed around the evening when the load was supplied by wind and battery power. Indeed, during the night and the first hours, the power generated from the PV source is null, so that the battery operates with a high capacity. In addition, we can clearly see, from
Figure 17b,c, that the stress on the batteries increases with the increase in LPSP values (5% and 10%).
Consequently, the multi-objective optimization of the proposed multisource system based on renewable energy (PV and WT) is applied for the economic activity zone: Coala plant. The experimental results prove that the introduced micro-grid is an alternative solution that allows supplying the Coala plant with load in order to reduce the energy consumption cost and minimize the toxic gases’ emission to the environment.
10. Conclusions
This paper analyses the optimal sizing of a hybrid renewable energy system as an application for a specific economic activity zone in Tunisia (Coala plant, Sidi Bouzid) based on real meteorological and load data. A simulation model used to describe the operation of a hybrid micro-grid system, based on PV/wind/battery storage, was designed. In this paper, the authors focus on three sensitivity indicators (APV (m2), AWT (m2) and Cn (Ah)). In addition, a sensitivity analysis study was carried out to find the range values. The proposed multi-objective optimization based on genetic algorithm developed into MATLAB program was successfully used to solve this optimization problem. The main objective function is to minimize environmental and economic criteria under a given technical criterion:
The simulation was conducted in half-an-hour intervals for one year (17,520 interval) under different criteria. Optimum system was calculated under three LPSP values (0%, 5% and 10%). For each selected LPSP ratio, a simulation of the energy exchange between all system components is provided and discussed. The simulation results show that the lowest LPSP ratio corresponds to the higher GHG, EE, LCC, photovoltaic panels area (APV), wind turbines area (AWT), battery storage capacity (Cn) and vice versa. This means that demanding higher energy reliability incurs higher energy cost and pollution. A statistical and sensitivity analysis was carried out to evaluate the performance and calculate the different powers of renewable energy sources. For 0% of LPSP, the optimal configuration of PV/wind/battery system is composed of average PPV = 21 kW and PWT = 28 kW. The total embodied energy EE is 4,928,000 MJ, GHG emissions are equal to 215,600 KgCO2eq and LCC cost is 1,231,000 Є. For the other LPSP ratios, the sensitivity criteria will decrease by 30% and 15% for PV area, by 38% and 12% for the wind area and by 44% and 33% for the battery capacity. Furthermore, the three objective functions (EE, GHG and LCC) are also reduced with the increase in LPSP. These decreases are, respectively, by 26% and 29% for the EE, by 25% and 25% for the GHG emissions and by 16% and 18% for the LCC costs. This study is important for the Coala plant to reduce energy consumption cost and the dependency of the factory on the national grid.


